SPONSOR JAMES C. BENNEYAN DEVELOPMENT OF A PRESCRIPTION DRUG SURVEILLANCE SYSTEM TEAM MEMBERS...
28
SPONSOR JAMES C. BENNEYAN DEVELOPMENT OF A PRESCRIPTION DRUG SURVEILLANCE SYSTEM TEAM MEMBERS Jeffrey Mason Dan Mitus Jenna Eickhoff Benjamin Harris
-
Upload
hugo-young -
Category
Documents
-
view
215 -
download
2
Transcript of SPONSOR JAMES C. BENNEYAN DEVELOPMENT OF A PRESCRIPTION DRUG SURVEILLANCE SYSTEM TEAM MEMBERS...

S P O N S O R
J A M E S C . B E N N E YA N
DEVELOPMENT OF A PRESCRIPTION DRUG SURVEILLANCE SYSTEM
TEAM MEMBERS
Jeffrey MasonDan Mitus
Jenna EickhoffBenjamin Harris

Nonmedical use of
prescription drugs are the
third most abused illicit drugs in the
nationSedatives
Inhalants
Heroin
Hallucinogens
Stimulants
Tranquilizers
Pain Relievers
Cocaine
Marijuana
0 0.5 1 1.5 2 2.5 3 3.5 4 4.5
0.121
0.176
0.323000000000002
0.380000000000002
0.390000000000002
0.402
1.635
1.671
4.172
Abuse of Illicit Drugs
Source: National Survey on Drug Use and Health, 2006, Ages 12+
Numbers in millions
“Prescription drug abuse has become an epidemic in MA”-MA Commissioner, 2005
From 1999-2002, treatment admission
for opioid abuse increased 950%
in MA
From 1990-2003, opioid related deaths
increased 600% in MA
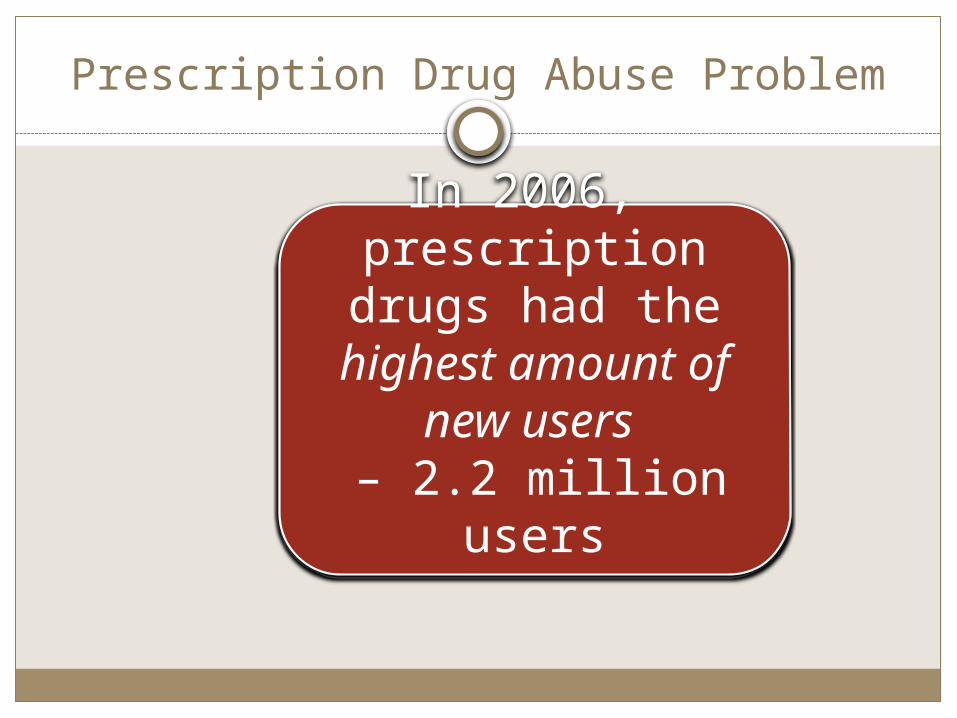
In 2006, prescription drugs
had the highest amount of new users – 2.2 million users
Prescription Drug Abuse Problem
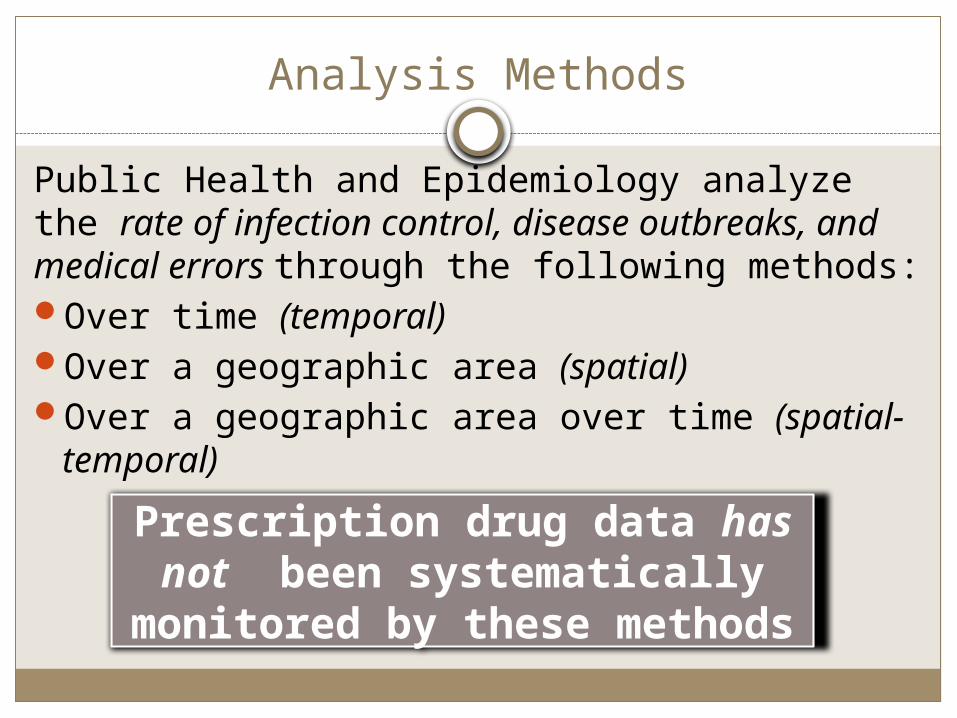
Analysis Methods
Public Health and Epidemiology analyze the rate of infection control, disease outbreaks, and medical errors through the following methods:Over time (temporal)Over a geographic area (spatial)Over a geographic area over time (spatial-temporal)
Prescription drug data has not been systematically monitored by
these methods
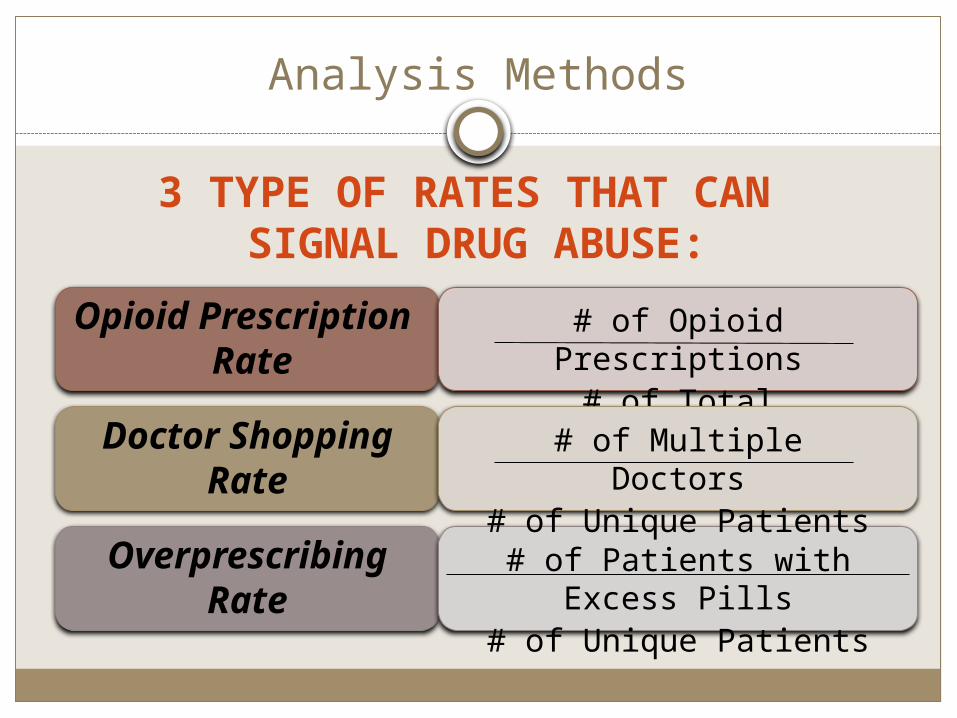
Analysis Methods
Opioid Prescription Rate
# of Opioid Prescriptions# of Total Prescriptions
Doctor Shopping Rate
# of Multiple Doctors# of Unique Patients
Overprescribing Rate
# of Patients with Excess Pills# of Unique Patients
3 TYPE OF RATES THAT CAN SIGNAL DRUG ABUSE:

Goal Statement
Design and develop a quantitative surveillance system that
will monitor and detect when and where the abuse of
prescription opioids is likely to be occurring that will enable
Massachusetts’ public health personnel to take corrective
action in a timely manner.
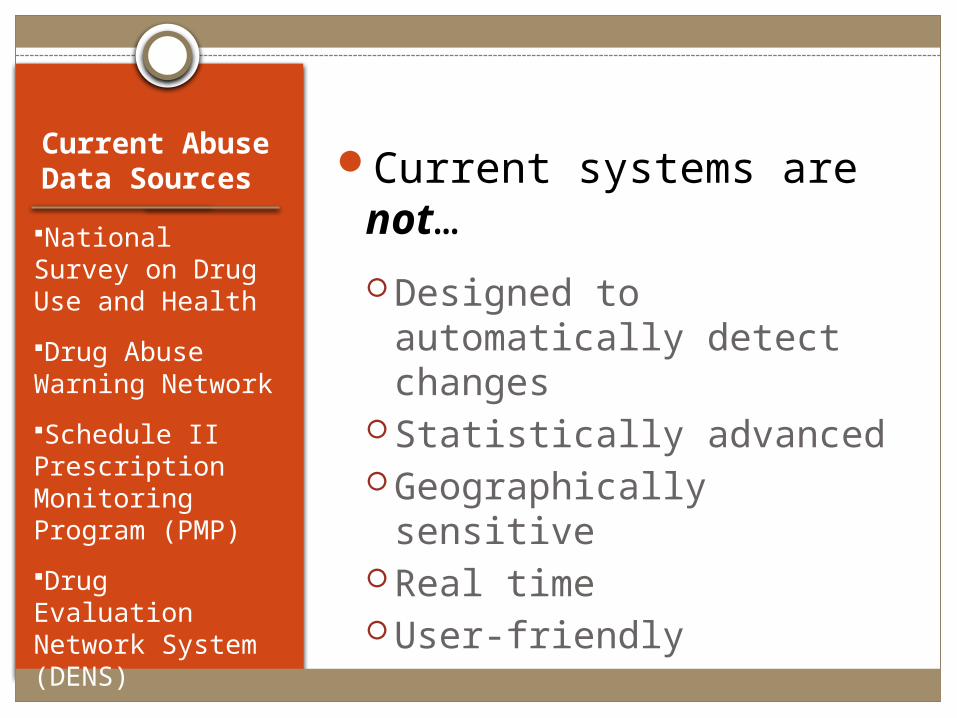
Current Abuse Data Sources
National Survey on Drug Use and Health
Drug Abuse Warning Network
Schedule II Prescription Monitoring Program (PMP)
Drug Evaluation Network System (DENS)
Current systems are not…
Designed to automatically detect changes
Statistically advanced Geographically sensitive Real time User-friendly

Database DesignBuilt in MS Access
Data imported from the MA PMP
Easy-to-use Graphical User Interface (GUI)
Built in statistical methods
Graphical User Interface Demonstration
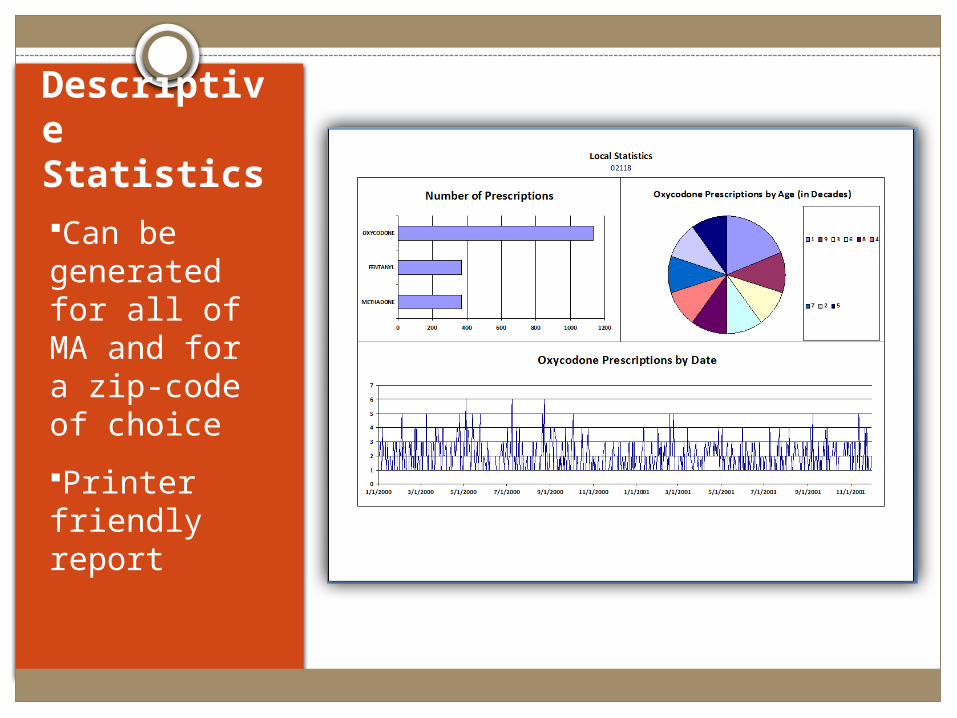
Descriptive StatisticsCan be generated for all of MA and for a zip-code of choice
Printer friendly report
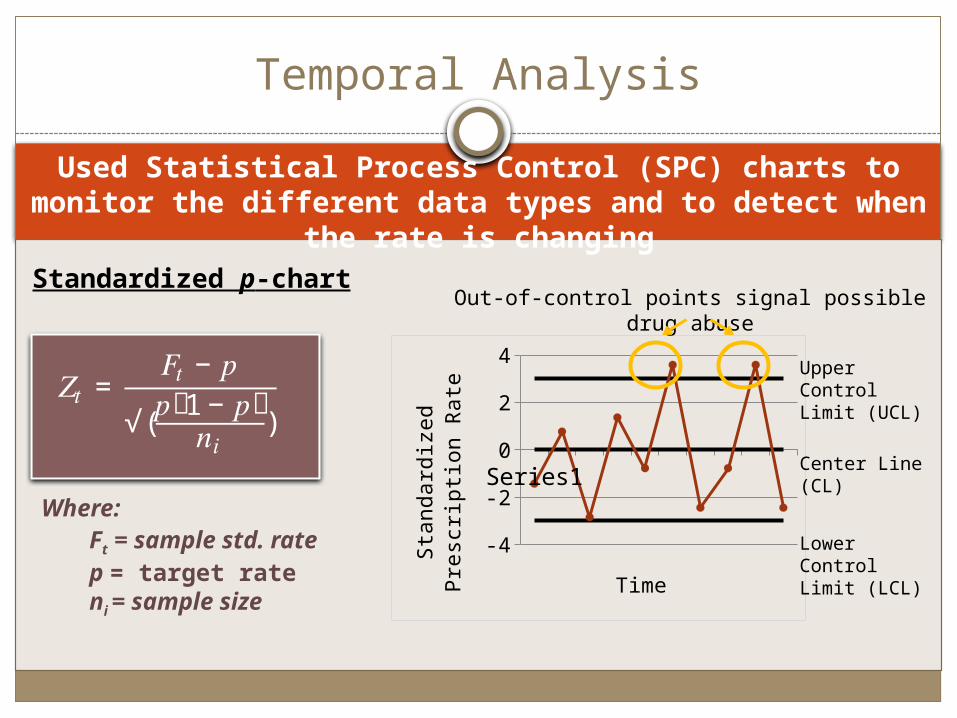
Used Statistical Process Control (SPC) charts to monitor the different data types and to detect when the rate is changing
Series1-4
-3-2-101234
Time
Stan
dard
ized
Pre
scrip
tion
Rate
Temporal Analysis
Upper Control Limit (UCL)
Lower Control Limit (LCL)
Center Line (CL)
Out-of-control points signal possible drug abuse
𝑍𝑡 = 𝐹𝑡 − 𝑝√(𝑝ሺ1− 𝑝ሻ𝑛𝑖 )
Standardized p-chart
Where:Ft = sample std. ratep = target rateni = sample size
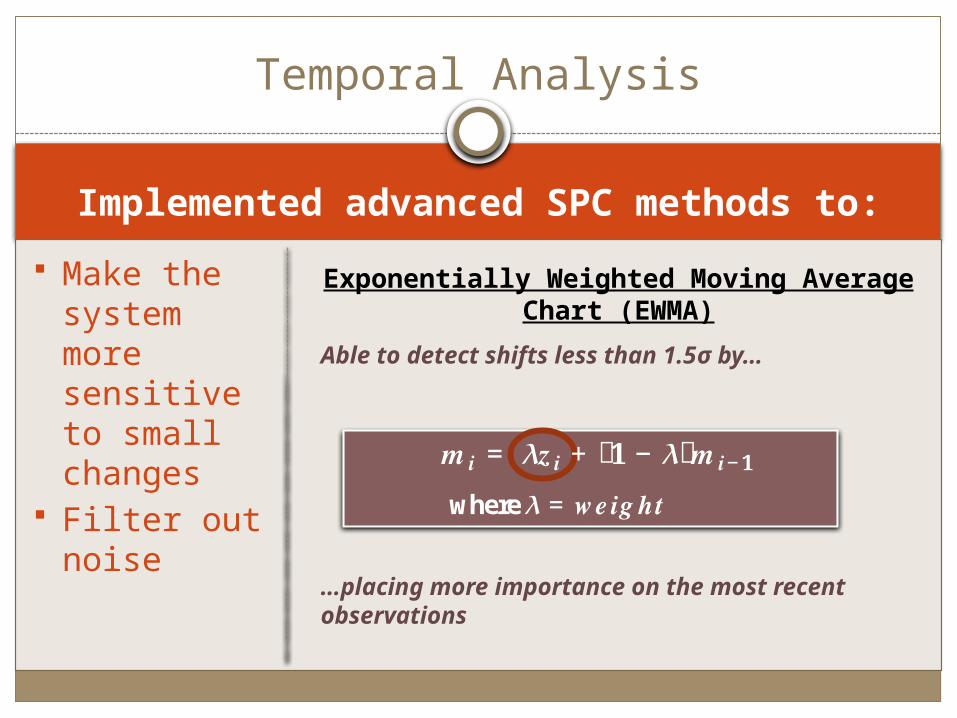
Implemented advanced SPC methods to:
Temporal Analysis
Make the system more sensitive to small changes
Filter out noise
Exponentially Weighted Moving Average Chart (EWMA)
Able to detect shifts less than 1.5σ by…
…placing more importance on the most recent observations
𝒎𝒊 = 𝝀𝒛𝒊 +ሺ𝟏 − 𝝀ሻ𝒎𝒊−𝟏
where 𝝀= 𝒘𝒆𝒊𝒈𝒉𝒕
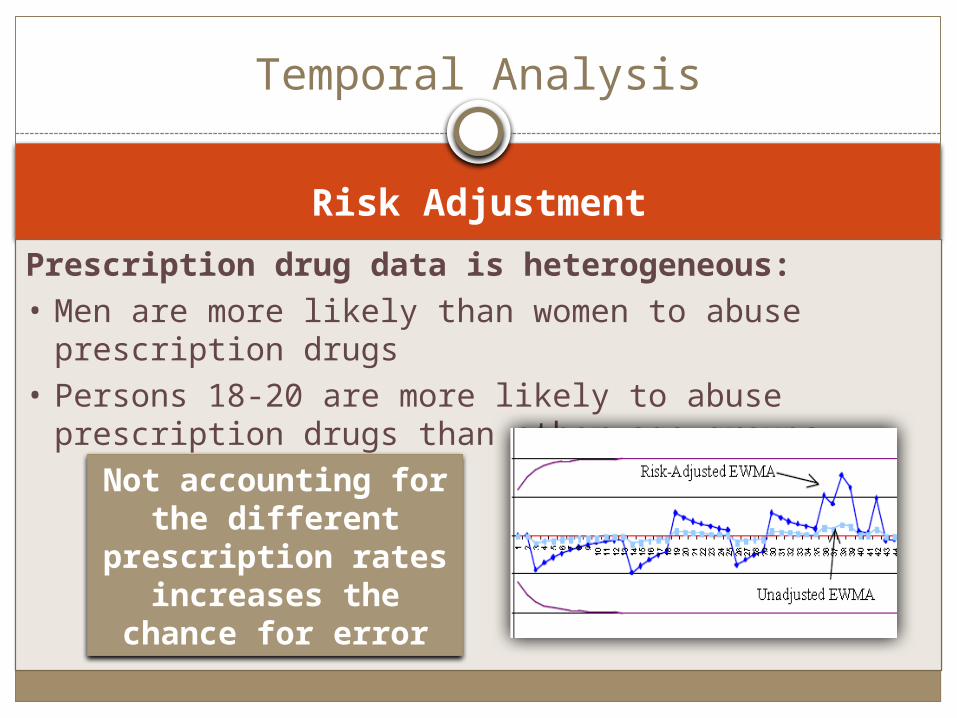
Risk Adjustment
Temporal Analysis
Prescription drug data is heterogeneous:• Men are more likely than women to abuse prescription drugs• Persons 18-20 are more likely to abuse prescription drugs
than other age groups
Not accounting for the different prescription rates increases the
chance for error

Implemented advanced SPC methods to:
Temporal Analysis
Account for seasonality
Account for differences in population and location
Risk Adjusted Chart
Accounts for multiple subgroups by…
…and accounting for each subgroup’s unique rate and variance
…taking the standardized statistic…
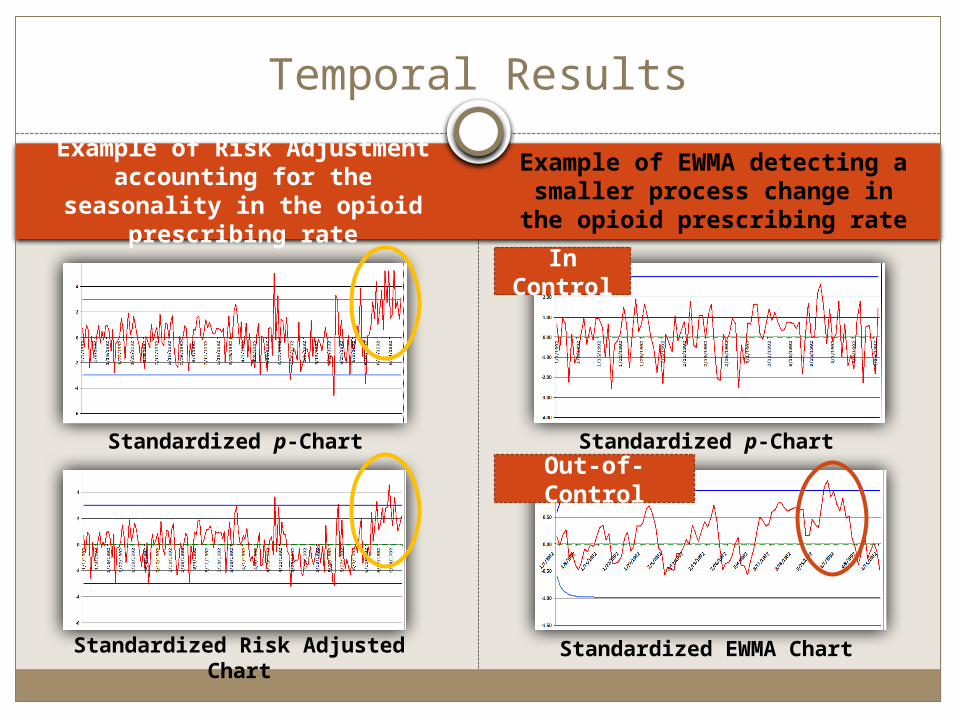
Example of Risk Adjustment accounting for the seasonality in
the opioid prescribing rate
Example of EWMA detecting a smaller process change in the
opioid prescribing rate
Temporal Results
Standardized p-Chart
Standardized Risk Adjusted Chart
Standardized p-Chart
Standardized EWMA Chart
In Control
Out-of-Control
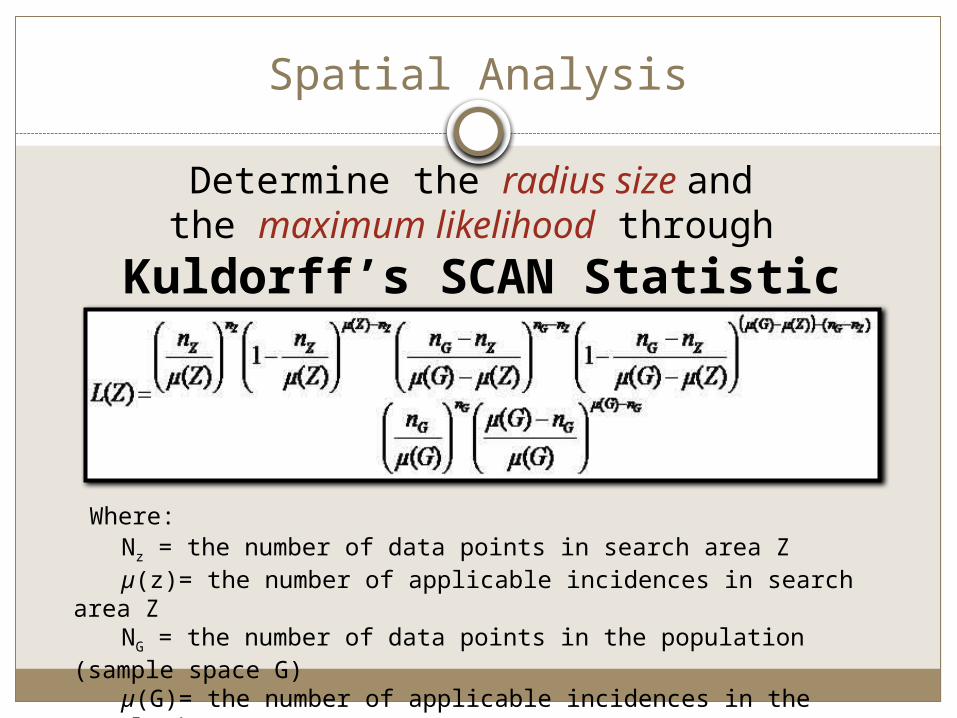
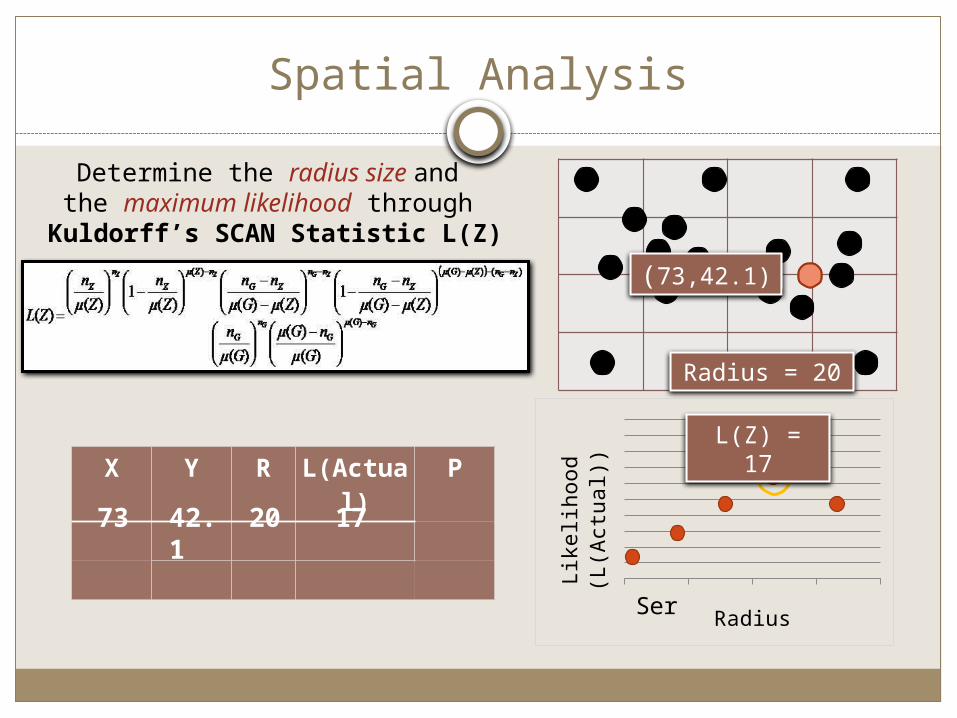
Spatial Analysis
Determine the radius size and the maximum likelihood through
Kuldorff’s SCAN Statistic L(Z)
Nz = the number of data points in search area Zµ(z)= the number of applicable incidences in search area ZNG = the number of data points in the population (sample space G)µ(G)= the number of applicable incidences in the population (G)
Where:
Se-ries1
Radius
Lik
elih
oo
d
(L(A
ctu
al)
)
Spatial Analysis
X Y R L(Actual) PL(Z) = 17
73 42.1 20 17
Determine the radius size and the maximum likelihood through Kuldorff’s SCAN Statistic L(Z)
(73,42.1)
Radius = 20
Se-ries1
Radius
Lik
elih
oo
d
(L(A
ctu
al)
)
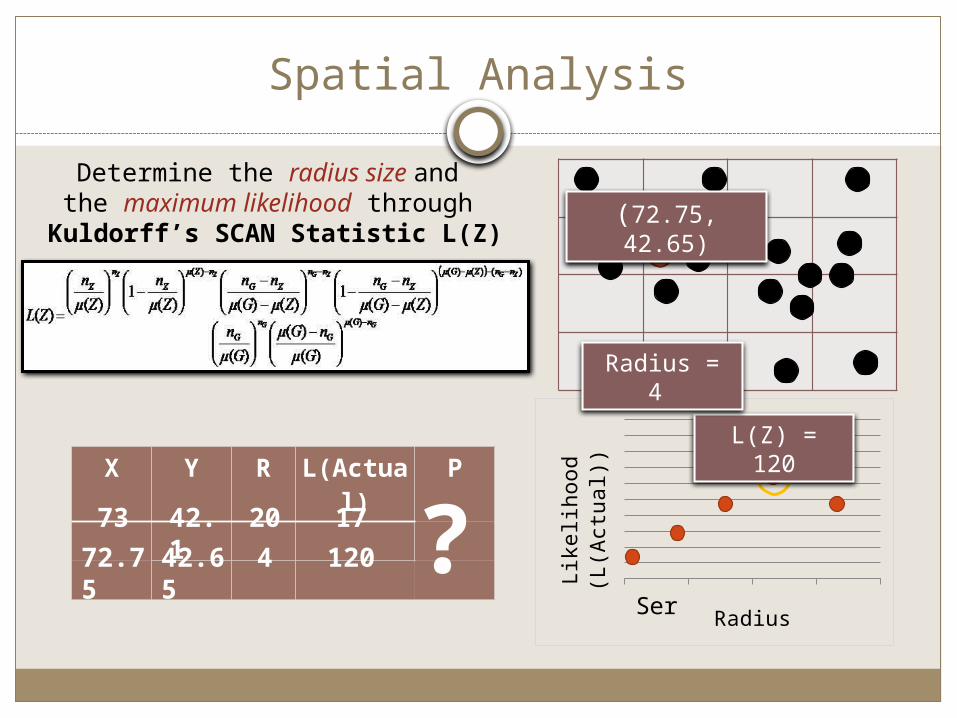
Spatial Analysis
X Y R L(Actual) PL(Z) = 120
42.1
42.6572.75 4
20
120
17
Determine the radius size and the maximum likelihood through Kuldorff’s SCAN Statistic L(Z)
73 ?
(72.75, 42.65)
Radius = 4
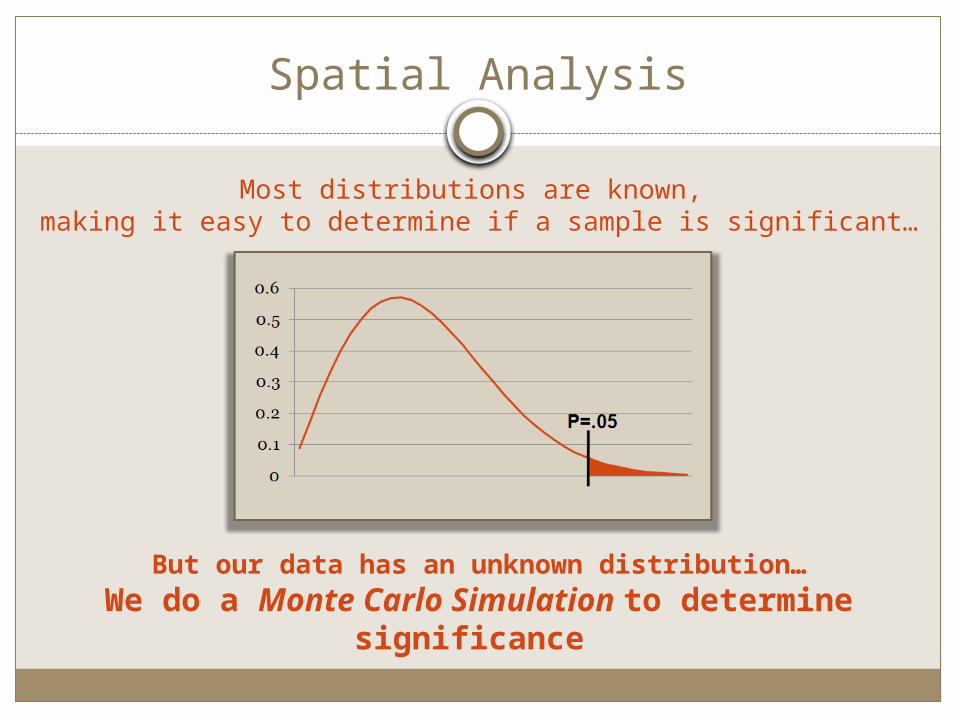
Spatial Analysis
Most distributions are known, making it easy to determine if a sample is significant…
But our data has an unknown distribution…
We do a Monte Carlo Simulation to determine significance
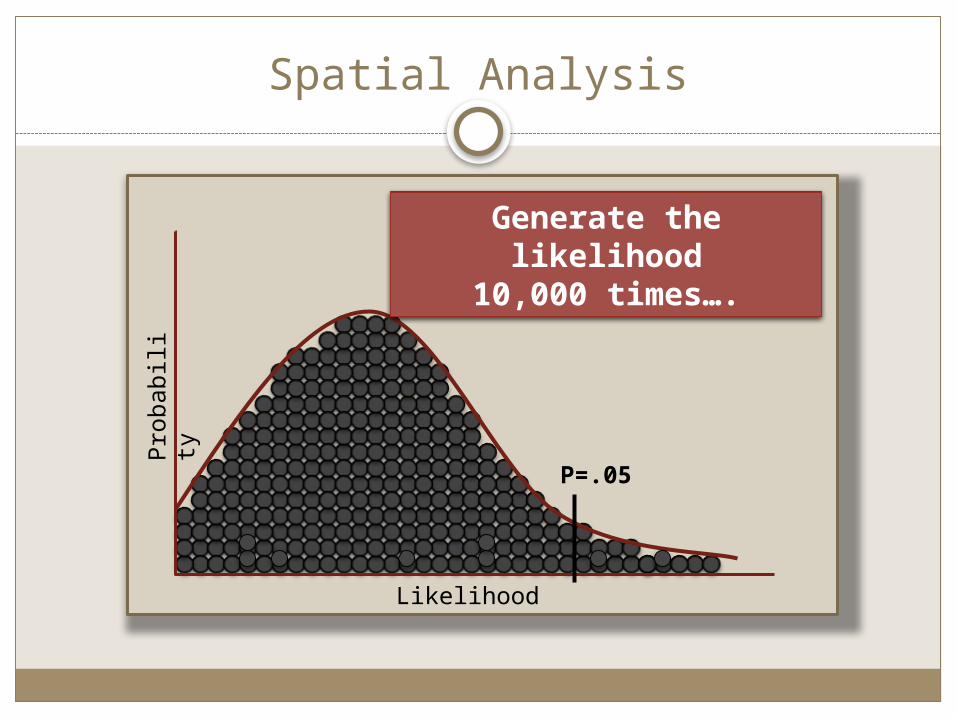
Spatial Analysis
P=.05
and find the significance threshold
Generate the likelihood
10,000 times….
Pro
babi
lity
Likelihood

P=.05
Pro
babi
lity
Likelihood
Spatial Analysis
X Y R L(Actual) P
72.75 42.65 4
73 42.1 20
120
17
.28
.002
P=.002P=.28
SIGNIFICANT CLUSTER!
NOT A SIGNIFICANT
CLUSTER!
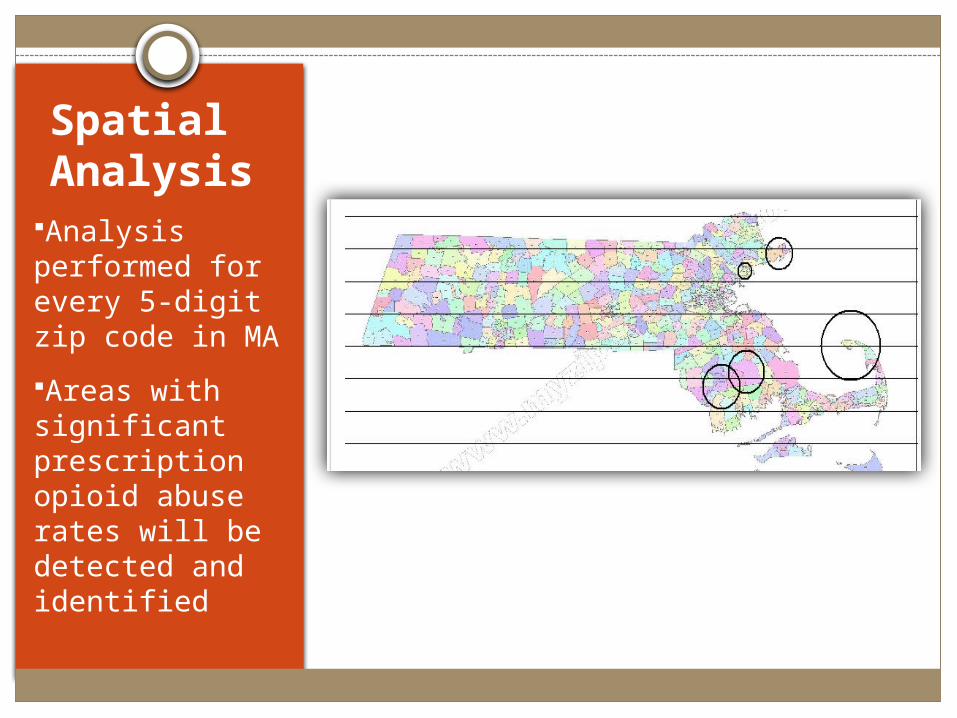
Spatial Analysis
Analysis performed for every 5-digit zip code in MA
Areas with significant prescription opioid abuse rates will be detected and identified
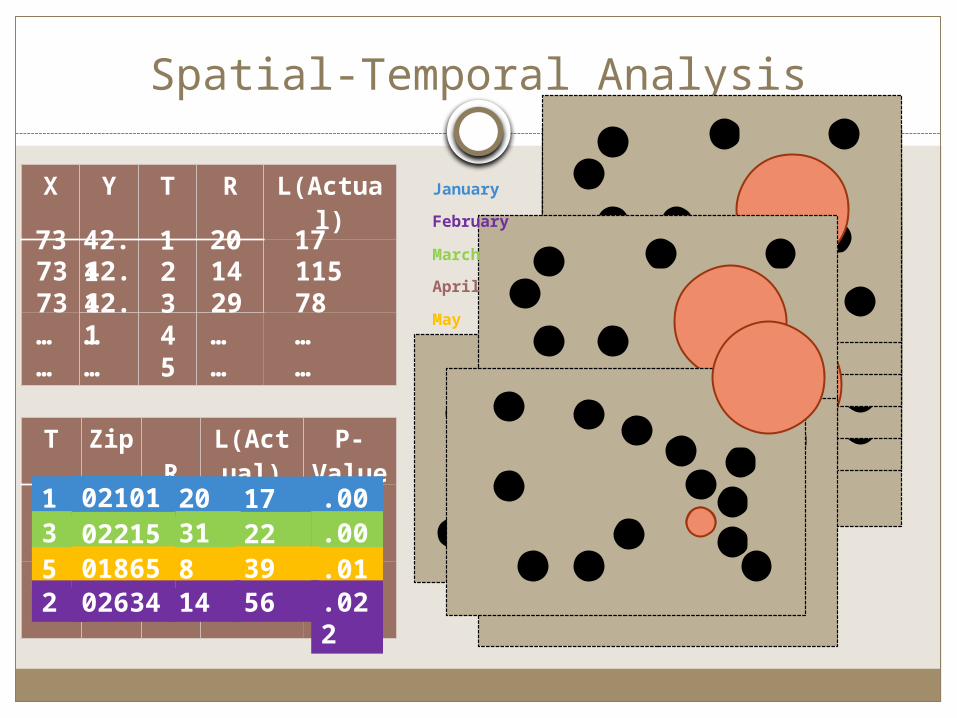
Spatial-Temporal Analysis
X Y T R L(Actual)
73 42.1 20 17173 42.1 14 115273 42.1 29 783… … … …4… … … …5
T Zip R L(Actual) P-Value
1 20 17 .0023 31 22 .0055 8 39 .0192 14 56 .022
02101022150186502634
January
February
March
April
May
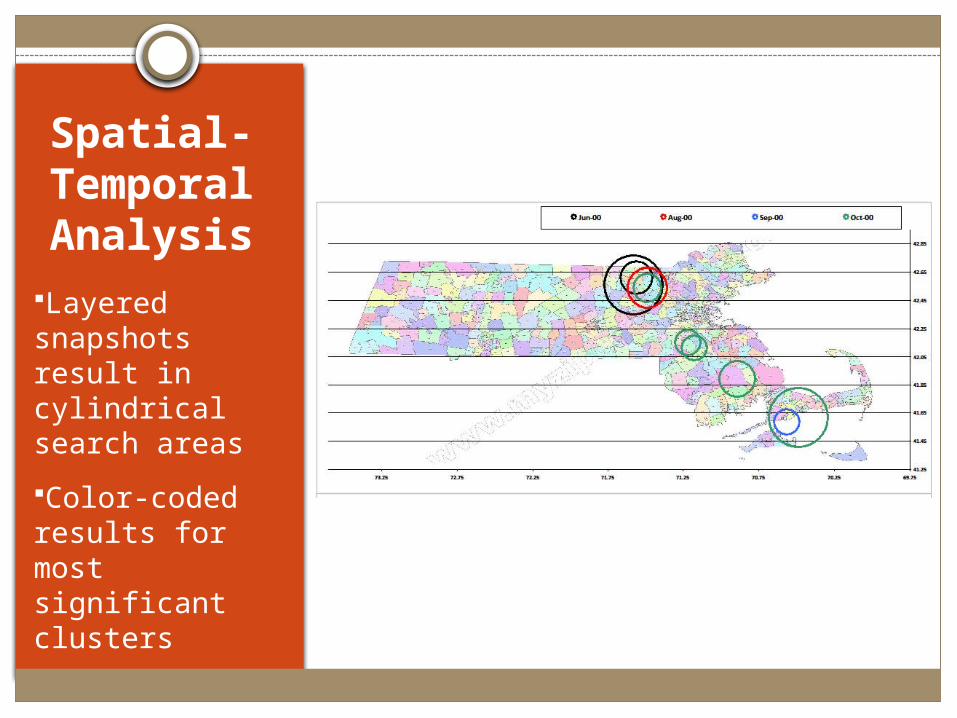
Spatial-Temporal Analysis
Layered snapshots result in cylindrical search areas
Color-coded results for most significant clusters
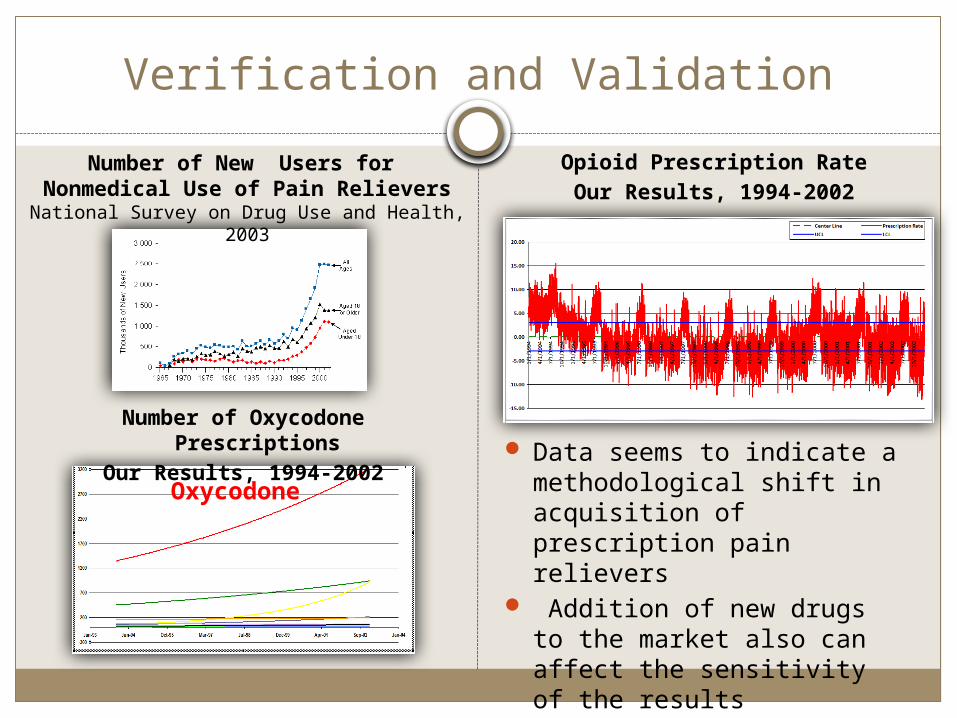
Verification and Validation
Data seems to indicate a methodological shift in acquisition of prescription pain relievers
Addition of new drugs to the market also can affect the sensitivity of the results
Number of Oxycodone Prescriptions
Our Results, 1994-2002
Opioid Prescription Rate
Our Results, 1994-2002
Oxycodone
Number of New Users for Nonmedical Use of Pain Relievers
National Survey on Drug Use and Health, 2003
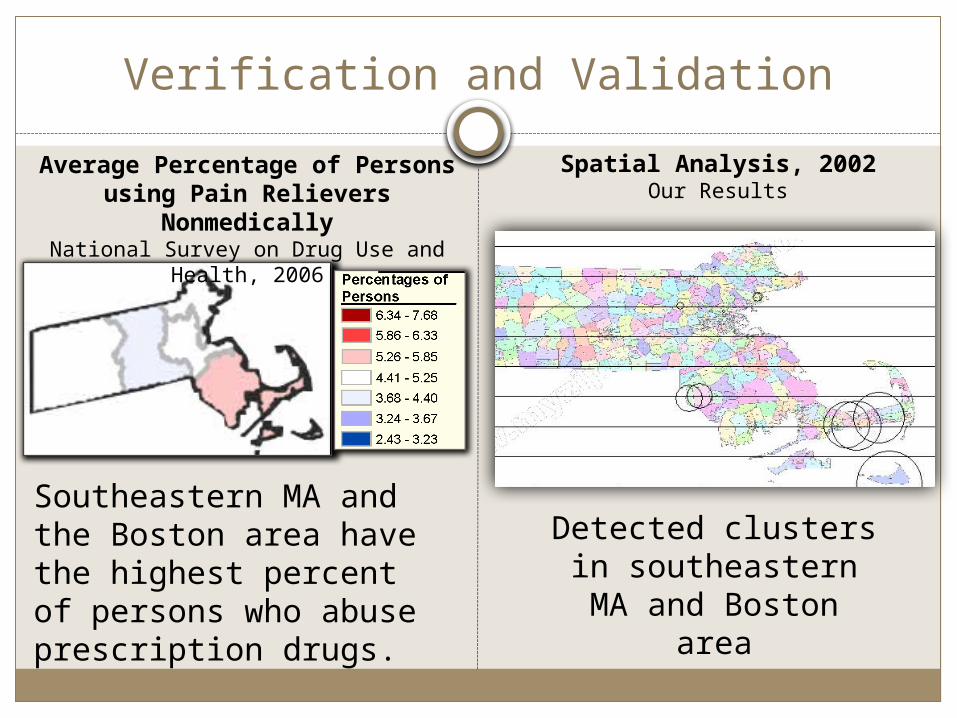
Verification and Validation
Southeastern MA and the Boston area have the highest percent of persons who abuse prescription drugs.
Detected clusters in southeastern MA and
Boston area
Average Percentage of Persons using Pain Relievers Nonmedically
National Survey on Drug Use and Health, 2006
Spatial Analysis, 2002Our Results
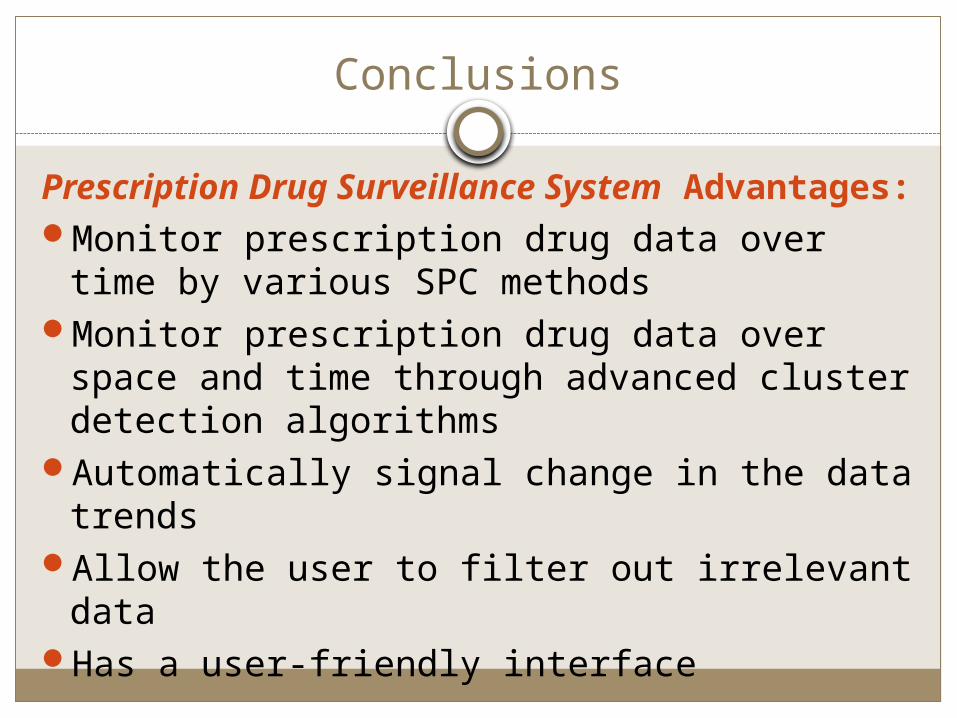
Conclusions
Prescription Drug Surveillance System Advantages:Monitor prescription drug data over time by various
SPC methodsMonitor prescription drug data over space and time
through advanced cluster detection algorithms Automatically signal change in the data trendsAllow the user to filter out irrelevant dataHas a user-friendly interface
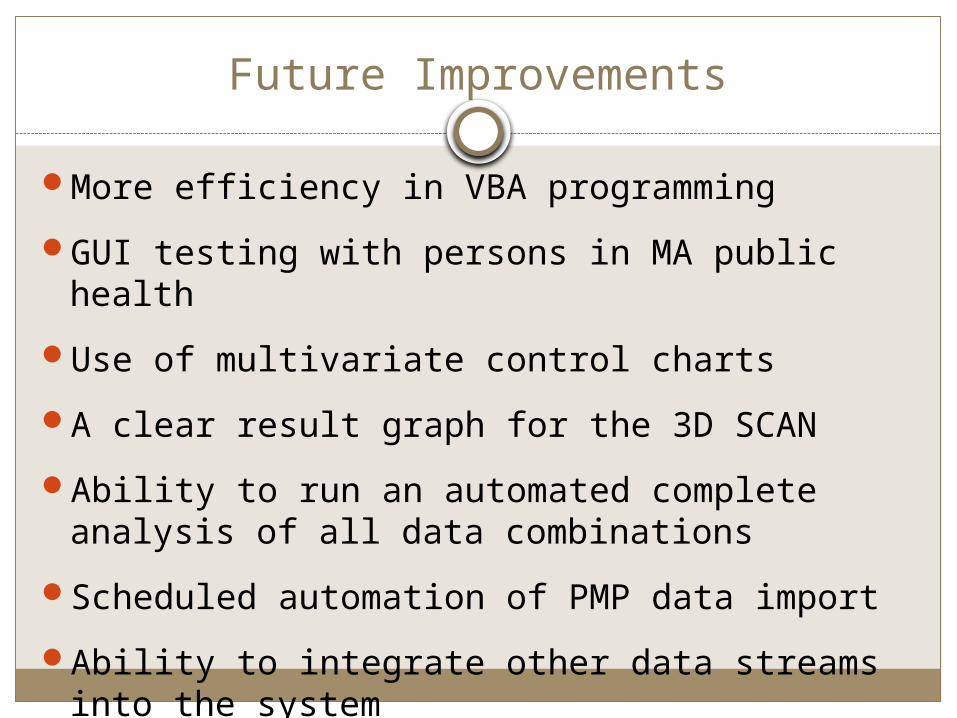
Future Improvements
More efficiency in VBA programming
GUI testing with persons in MA public health
Use of multivariate control charts
A clear result graph for the 3D SCAN
Ability to run an automated complete analysis of all data combinations
Scheduled automation of PMP data import
Ability to integrate other data streams into the system

THANK YOU!
Questions?