Spatial scaling of optical fluctuations during substorm ...B. V. Kozelov and K. Rypdal: Spatial...
13
Ann. Geophys., 25, 915–927, 2007 www.ann-geophys.net/25/915/2007/ © European Geosciences Union 2007 Annales Geophysicae Spatial scaling of optical fluctuations during substorm-time aurora B. V. Kozelov 1,2 and K. Rypdal 2 1 Polar Geophysical Institute, Apatity, Murmansk region, 184209 Russia 2 Department of Physics and Technology, University of Tromsø, 9037, Tromsø, Norway Received: 28 October 2006 – Revised: 15 March 2007 – Accepted: 20 March 2007 – Published: 8 May 2007 Abstract. A study of statistical features of auroras during substorm activity is presented, emphasizing characteristics which are commonly applied to turbulent flows. Data from all-sky television (TV) observations from the Barentsburg observatory (Svalbard) have been used. Features of the prob- ability density function (PDF) of auroral fluctuations have been examined at different spatial scales. We find that the observed PDFs generally have a non-Gaussian, heavy-tailed shape. The generalized structure function (GSF) for the au- roral luminosity fluctuations has been analyzed to determine the scaling properties of the higher (up to 6) order moments, and the evolution of the scaling indices during the actual sub- storm event has been determined. The scaling features ob- tained can be interpreted as signatures of turbulent motion of the magnetosphere-ionosphere plasma. Relations to pre- viously obtained results of avalanche analysis of the same event, as well as possible implications for the validity of self-organized criticality models and turbulence models of the substorm activity, are discussed. Keywords. Magnetospheric physics (Auroral phenomena) – Space plasma physics (Nonlinear phenomena; Turbulence) 1 Introduction During the last decade, it has become increasingly more accepted that a physical description of the magnetosphere- ionosphere system requires some kind of complex system ap- proach. One class of such approaches is based on the notion of self-organized criticality (SOC), which was first proposed in a general context by Bak et al. (1988). It was introduced as a universal feature of threshold systems with a large num- ber of degrees of freedom, in which the basic interactions are local, but where long-range interactions develop due to the Correspondence to: B. V. Kozelov ([email protected]) tendency for the formation of avalanches when the system approaches the critical state where it is everywhere a near in- stability threshold. In this state all scales interact with each other, and the dynamics of the system on different spatial scales is self-similar. This self-similarity is manifested as a power relationship between various characteristics and the temporal/spatial scale. There are many indications that the magnetospheric-ionospheric system (MIS) can exhibit char- acteristics typical for SOC systems (V¨ or¨ os, 1991; Takalo et al., 1993; Milovanov et al., 1996; Consolini, 1997; Sharma, 1997; Uritsky and Pudovkin, 1998; Uritsky et al., 2002; V¨ or¨ os et al., 2003; Kozelov et al., 2004). However, at least some of these indications have alternatively been interpreted in terms of intermittent turbulence (Borovsky and Funsten, 2003; Sorriso-Valvo et al., 2001). It should also be kept in mind that the SOC concept was also applied to describe the intermittency in the Earth’s plasma sheet (Angelopoulos et al., 1999). However, the turbulence in the magnetosphere- ionosphere plasma also exhibits some peculiarities, which are not explained by present theoretical models (Borovsky et al., 1997; Borovsky and Funsten, 2003). Chang (2004) pro- posed a scenario where intermittent turbulence is formed by a dynamical topological complexity resulting from the non- linear evolution of multi-scale coherent structures. The indi- vidual plasma processes are incorporated by this scenario in a uniform SOC-like state. In this paper we have used the same data set which was previously analyzed in Kozelov et al. (2004). In that pa- per spatio-temporal techniques were employed to identify and select avalanche-like transients. Here we present a de- scription of statistical features of aurora luminosity fluctua- tions during substorm activity, by focusing on characteristics which usually apply to turbulent flows: probability density function (PDF) and generalized structure function (GSF). The observations and the data set are described in Sect. 2. The shape of the PDFs of the auroral fluctuations is examined at different spatial scales in Sect. 3. Here we also illustrate Published by Copernicus GmbH on behalf of the European Geosciences Union.
Transcript of Spatial scaling of optical fluctuations during substorm ...B. V. Kozelov and K. Rypdal: Spatial...
Ann. Geophys., 25, 915–927, 2007www.ann-geophys.net/25/915/2007/© European Geosciences Union 2007
AnnalesGeophysicae
Spatial scaling of optical fluctuations during substorm-time aurora
B. V. Kozelov1,2 and K. Rypdal2
1Polar Geophysical Institute, Apatity, Murmansk region, 184209 Russia2Department of Physics and Technology, University of Tromsø, 9037, Tromsø, Norway
Received: 28 October 2006 – Revised: 15 March 2007 – Accepted: 20 March 2007 – Published: 8 May 2007
Abstract. A study of statistical features of auroras duringsubstorm activity is presented, emphasizing characteristicswhich are commonly applied to turbulent flows. Data fromall-sky television (TV) observations from the Barentsburgobservatory (Svalbard) have been used. Features of the prob-ability density function (PDF) of auroral fluctuations havebeen examined at different spatial scales. We find that theobserved PDFs generally have a non-Gaussian, heavy-tailedshape. The generalized structure function (GSF) for the au-roral luminosity fluctuations has been analyzed to determinethe scaling properties of the higher (up to 6) order moments,and the evolution of the scaling indices during the actual sub-storm event has been determined. The scaling features ob-tained can be interpreted as signatures of turbulent motionof the magnetosphere-ionosphere plasma. Relations to pre-viously obtained results of avalanche analysis of the sameevent, as well as possible implications for the validity ofself-organized criticality models and turbulence models ofthe substorm activity, are discussed.
Keywords. Magnetospheric physics (Auroral phenomena) –Space plasma physics (Nonlinear phenomena; Turbulence)
1 Introduction
During the last decade, it has become increasingly moreaccepted that a physical description of the magnetosphere-ionosphere system requires some kind of complex system ap-proach. One class of such approaches is based on the notionof self-organized criticality (SOC), which was first proposedin a general context by Bak et al. (1988). It was introducedas a universal feature of threshold systems with a large num-ber of degrees of freedom, in which the basic interactions arelocal, but where long-range interactions develop due to the
Correspondence to:B. V. Kozelov([email protected])
tendency for the formation of avalanches when the systemapproaches the critical state where it is everywhere a near in-stability threshold. In this state all scales interact with eachother, and the dynamics of the system on different spatialscales is self-similar. This self-similarity is manifested as apower relationship between various characteristics and thetemporal/spatial scale. There are many indications that themagnetospheric-ionospheric system (MIS) can exhibit char-acteristics typical for SOC systems (Voros, 1991; Takalo etal., 1993; Milovanov et al., 1996; Consolini, 1997; Sharma,1997; Uritsky and Pudovkin, 1998; Uritsky et al., 2002;Voros et al., 2003; Kozelov et al., 2004). However, at leastsome of these indications have alternatively been interpretedin terms of intermittent turbulence (Borovsky and Funsten,2003; Sorriso-Valvo et al., 2001). It should also be kept inmind that the SOC concept was also applied to describe theintermittency in the Earth’s plasma sheet (Angelopoulos etal., 1999). However, the turbulence in the magnetosphere-ionosphere plasma also exhibits some peculiarities, whichare not explained by present theoretical models (Borovsky etal., 1997; Borovsky and Funsten, 2003). Chang (2004) pro-posed a scenario where intermittent turbulence is formed bya dynamical topological complexity resulting from the non-linear evolution of multi-scale coherent structures. The indi-vidual plasma processes are incorporated by this scenario ina uniform SOC-like state.
In this paper we have used the same data set which waspreviously analyzed in Kozelov et al. (2004). In that pa-per spatio-temporal techniques were employed to identifyand select avalanche-like transients. Here we present a de-scription of statistical features of aurora luminosity fluctua-tions during substorm activity, by focusing on characteristicswhich usually apply to turbulent flows: probability densityfunction (PDF) and generalized structure function (GSF).The observations and the data set are described in Sect. 2.The shape of the PDFs of the auroral fluctuations is examinedat different spatial scales in Sect. 3. Here we also illustrate
Published by Copernicus GmbH on behalf of the European Geosciences Union.

916 B. V. Kozelov and K. Rypdal: Spatial scaling of optical fluctuations during substorm-time aurora
Fig. 1. Auroral structures during the event of 19–20 January 2001. Top panel: north-south keogram obtained from TV ASC images. Bottompanel: several examples of the TV ASC images. The considered part of the field of view is marked by ticks at the vertical axes of the keogramand by white frame in the images.
how the PDFs on different scales can collapse to a singlecurve under a simple scaling transformation. The GSFs ofhigher (up to 6) order moments is analyzed in Sect. 4. Theevolution of the scaling indices associated with the GSFs ofthe first three moments during the substorm event is also pre-sented. The main results are discussed and some conclusionsare drawn in Sect. 5.
2 TV observations of aurora
The Barentsburg observatory is located at Svalbard (78.1◦ N,14.24◦ E, 75.17◦ MLAT, 112.1◦ MLON), the quiet nighttimeauroral oval being observed near its southern horizon. Thislocation is very favorable for observations of poleward mo-tion of aurora during the expansion phase of a substorm. Wechoose for the analysis the same event during the evening 19–20 January 2001, which was previously analyzed in Kozelovet al. (2004), by application of spatio-temporal techniques toidentify avalanche-like transients.
The digitized video frames (5 frames per second) from atelevision all-sky camera (TV ASC) are superposed and av-eraged over 1 s to reduce the noise level. The central part ofthe frames,∼200×200 km2, where the projection distortionsare not significant, is used for the analysis. From the ge-ometry of observation, the spatial resolution of the TV ASCin the center of the field of view for the altitude of the au-rora (∼110 km) is∼1.2 km, increasing to∼1.7 km towardthe boundary of the area used for analysis. In the analysis weneglect these variations in spatial resolution and other distor-tions of the ASC image and assume that the average spatialresolution is∼1.5 km. An intensity calibration of TV ASC
for this event has been provided in Kozelov (2005) by em-ploying data of simultaneous observations by meridian scan-ning photometers. In the chosen central field of view the level∼50 corresponds to the black level and one step of the graylevel corresponds to∼60 R of auroral intensity in the line557.7 nm, or to∼5×10⁻⁵ Joule/m2 s of precipitated particleflux.
Figure 1 presents a keogram (temporal dependence of ob-served intensity in the north-south section of the TV ASCimages) for the substorm event and several TV images fromthe set. The central part of the frames used in this study ismarked by a white rectangle. The Universal Time (UT) andthe date of observation are shown in the top of each image.The images illustrate the various types of auroral structuresobserved during the event. The image “a” is an example withno aurora in the central field of view. The structure in theimage “b” is a weak rayed arc; the “c” is a bright arc whichtends to develop into a spiral; and the “d” and “e” are corona-like structures. Auroral intensity distributions in short 20-sintervals containing the images shown are chosen as samplesfor detailed analysis in this paper.
The analysis of the aurora structure from TV data is com-plicated because of the interference of noise in the registra-tion system, starlight and airglow. Figure 2 shows examplesof occurrence distribution of intensity in the central field ofview. The distributions have been averaged over 20 succes-sive seconds, therefore values less than level 1 (marked by adashed line) implies that pixels with such an intensity do notappear in all frames during the period of averaging.
The distribution plotted by a black curve has been obtainedfor a time interval with no aurora in the field of view (see im-age “a” in the bottom panel of Fig. 1). The Gaussian core
Ann. Geophys., 25, 915–927, 2007 www.ann-geophys.net/25/915/2007/

B. V. Kozelov and K. Rypdal: Spatial scaling of optical fluctuations during substorm-time aurora 917
of the distributions is concentrated near the valueI∼50, thewings of the core is somewhat wider due to starlight and air-glow. Only a few peaks (due to the brightest stars) with anoccurrence level less than 1 is observed at higher intensities.
Other distributions presented in Fig. 2 have been obtainedfor time intervals when auroral structures were located inthe central field of view. These distributions have a clearlyskewed shape. In the presence of aurora the peak value of thedistribution is shifted towards higher intensity. The right tailof the distribution is generally heavier than the left tail, butwith the exception of the distribution for the interval startingfrom 22:55:00 UT, they all fall below the occurrence levelsless than 1 pixel within the intensity range registered by TVASC. This means that the full range of auroral intensity forthese structures is well registered by TV ASC. The excep-tion is the interval starting from 22:55:00 UT, correspondingto image “c” in Fig. 1. Here the dynamical range of the TVASC did not cover the highest auroral intensities.
3 Probability density functions of auroral fluctuations
More detailed information may be obtained by analysis ofthe probability density functions (PDFs) of a two-pixel vari-ation δI of the intensity. We consider a two-pixel variationδI(s)=I (p1)−I (p2) of the intensityI , wherep1 andp2 arepixels inside the considered frame and a vertical or horizon-tal distance between them is equal tos. We useds valuesfrom 1.5 to 72 km. Each pair of pixels is used twice in thestatistics with a different sign ofδI ; therefore, the consideredPDFs are symmetric by definition. The pairs from 20 succes-sive images have been combined to improve statistics.
Examples of the PDFP (δI, s) as a function of intensityvariationδI for several spatial scaless are shown in Fig. 3.Figure 4 presents the positive tail of the same PDFs in log-log plots. To construct the PDFs of the intensity fluctuationswe have used the same time intervals as for the distributionsof intensity in Fig. 2. Figure 5 and the insets in Fig. 3 il-lustrate the scale dependence of the important characteristicsof the PDFs: the maximum valueP(0, s), the standard de-viation σ(s) and kurtosisK(s). P(0, s) is more correctlytermed “the probability of the return to the origin”, but forthese symmetric PDFs it always corresponds to the maxi-mum value of the PDF curve. These parameters have beencalculated by utilizing all the available data points withoutconditioning (see next section). The kurtosis parameterK(s)
considered here is defined as
K(s) =1
N
∑p=1...N
((δI (p, s) − 〈δI 〉)
σ
)4
− 3,
where〈δI〉 andσ are the mean value and the standard devi-ation of the intensity fluctuations on a given spatial scales,with the angle brackets imply an averaging over positionp
in the considered field of view.
Fig. 2. Occurence number of pixels vs. auroral intensity averaged in20-s intervals, beginning from the marked time. 1-pixel occurencelevel is shown by dashed line.
It is observed that for a time interval without aurora(Fig. 3a) the PDF is practically independent of the scales.There is only a small change in the shape of the central part(“core”) of the PDF at|δI |<8 with an increase in the scalefrom 3 to 72 km. This leads to some decrease in the PDFmaximumP(0, s). However, the standard deviation and kur-tosis values are constant because these quantities are mostlydetermined by the unchanged tails of the distribution. Bothtails are symmetrically repeating the shape of the right tailof the occurrence distribution of intensity (black curve inFig. 2). It is interesting to note that even though the distri-bution looks like a combination of several Gaussian distribu-tions, the kurtosis parameter has a high value (K∼120). ThePDF for the smallest scales=1.5 km noticeably differ fromthe PDFs for the other scales. A possible reason for this isa correlation between values of intensity in neighboring pix-els due to the finite bandwidth of TV signal detection, whichimplies that in the stationary night sky a bright star may oc-cupy more than one pixel. Another possible reason with thesame result is a motion of the aurora with a velocity morethan∼1.5 km/s, but this is not the case in the present data.
When the aurora appears in the TV ASC field of view, thePDFs of intensity fluctuations deviate from the simple formcharacterized by the night sky. These PDFs have a clearlynon-Gaussian leptokurtic shape (Figs. 3b–e), and there is astrong dependence on spatial scale. Typically, the PDFs arewider for larger spatial scale, which is seen from the increasein the standard deviation with increasing scale (Figs. 5b–e). Frequently the tails of the PDFs exhibit a power-lawregion, which is observed as nearly straight curves in por-tions of the log-log plots presented in Fig. 4. One can alsoobserve a decrease in the kurtosis parameter with increasing
www.ann-geophys.net/25/915/2007/ Ann. Geophys., 25, 915–927, 2007

918 B. V. Kozelov and K. Rypdal: Spatial scaling of optical fluctuations during substorm-time aurora
(a) (b)
(c) (d)
(e)
Fig. 3. Dependence of PDF of intensity fluctuations on spatial scale for several 20 s intervals starting from:(a) 22:10:00;(b) 22:26:20;(c)22:55:20;(d) 23:54:20;(e) 00:10:00. Insets: symbols – maximum values of the PDF, line – the least sqaures power-law approximation asP(0,s) ∝sα . Uncertainty in theα values is less than 0.01.
Ann. Geophys., 25, 915–927, 2007 www.ann-geophys.net/25/915/2007/

B. V. Kozelov and K. Rypdal: Spatial scaling of optical fluctuations during substorm-time aurora 919
(a) (b)
(c) (d)
(e)
Fig. 4. The same as Fig. 3, but in log-log plots.
www.ann-geophys.net/25/915/2007/ Ann. Geophys., 25, 915–927, 2007

920 B. V. Kozelov and K. Rypdal: Spatial scaling of optical fluctuations during substorm-time aurora
(a) (b)
(c) (d)
(e)
Fig. 5. Scale dependence of the standard deviationσ and kurtosisK for PDFs presented in Fig. 3. The region of the least-squares power-lawapproximation in theσ plot is shown by solid line,α is a power index of the approximation. Uncertainty of theα values is less than lastdecimal unit or they are presented in brackets.
scale (Figs. 5b–e). This is in agreement with the finding ofTam et al. (2005) for electric field fluctuations in the auroralzone. Increasing values of the kurtosis parameter for smallscales is normally taken as an indication that the fluctuationsare strongly intermittent. It is easily shown (Frisch, 1995)that the kurtosis of a random signal increases with increasedburstyness. Intermittency in this sense means that the signalis more bursty on small scales than large scales. However,as will be discussed below, part of this increase in kurtosismay, in some cases, be attributed to a bi-modal nature of thefluctuations, i.e. to the existence of two nearly scale-invariantdistributions with different scaling exponents.
The PDFs for the interval 22:55:20–22:56:40 UT (Fig. 3cand Fig. 4c) differ qualitatively from the auroras consideredin other time intervals in that they exhibit heavy tails whichdecay more slowly than∼δI−2. As a consequence, the PDFs
are wider than the dynamical range of TV observation, andthis means that the second moment of the distribution (thestandard deviation) for large scales cannot be reliably com-puted due to the instrumental truncation of the tail. Hence,the values of the standard deviationσ and kurtosisK forscaless>10 km (Fig. 5c) should be considered only as crudeestimates. (The standard deviation is probably underesti-mated, and the kurtosis overestimated.) For other time inter-vals, the PDFs are within the instrumental range of detection,thus this limitation poses no problem for estimates of highermoments in those cases.
When an aurora occurs, the scale dependence of the max-imum PDF valueP(0, s), as well as the standard deviationσ(s), exhibit a power-law range, at least for scales from 3to 20 km. For self-similar PDFs, the power exponents forthese two quantities should have the same absolute value,
Ann. Geophys., 25, 915–927, 2007 www.ann-geophys.net/25/915/2007/
B. V. Kozelov and K. Rypdal: Spatial scaling of optical fluctuations during substorm-time aurora 921
and differ in sign, but in these data the absolute value ofthe power exponent forP(0, s) is typically smaller than forσ(s). One exception is the case “d”, for which the exponentsare the same within the accuracy of the estimate. Thus, weconclude that in general the signal under consideration is notself-similar, i.e. it is not a simple fractal characterized by asingle scaling exponent.
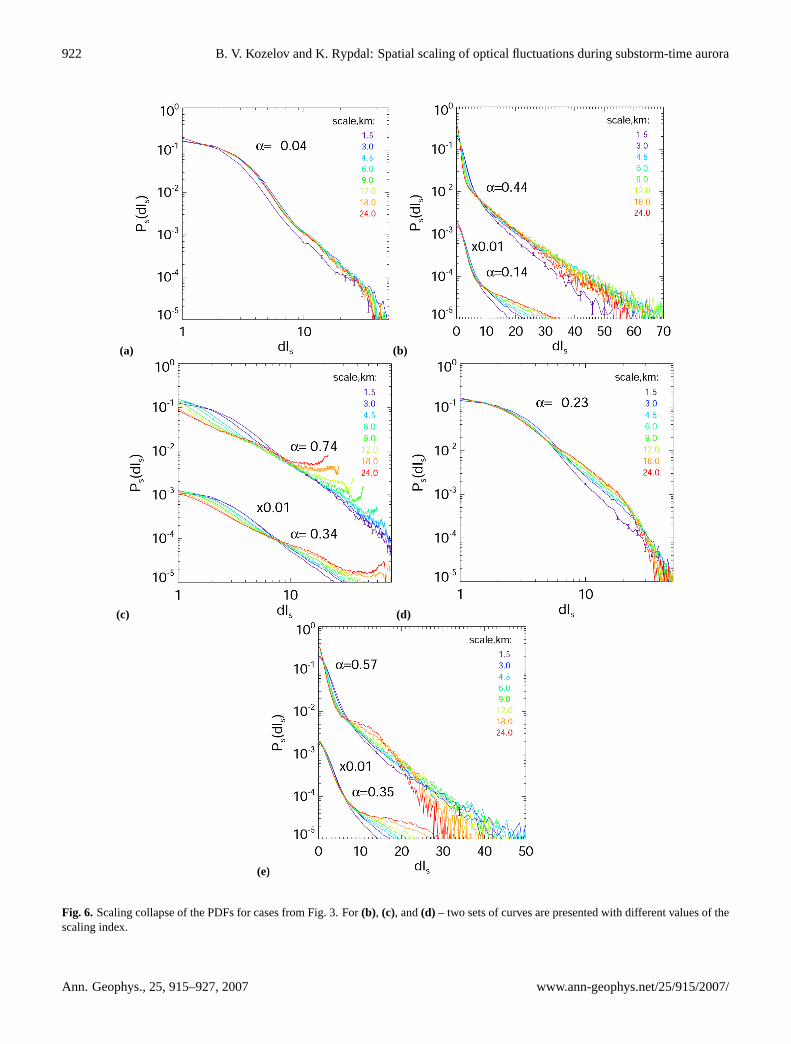
For a self-similar signal one can collapse the PDFs for adifferent scales onto a single curve by scaling the relationPs(dIs)=sαP (δI,s), wheredIs=δI/sα (Hnat et al., 2003). At-tempts of such PDF re-scaling is presented in Fig. 6. Forthose cases when we have two different values of the scalingexponentα obtained fromP (0,s) andσ(s), both values weretested.
The PDFs for the case without aurora are perfectly col-lapsed by the scaling exponent|α|=0.04 obtained from theP(0, s) dependence ons (Fig. 6a). Only the PDF for thesmallest scale,s=1.5 km, is somewhat narrower than the col-lapsed curve. The collapse phenomenon is mainly observedfor the core of the distribution, forδI<8. The tail of thePDFs forδI>8, for all scales, is practically the same in bothre-scaled and non-scaled distributions.
For the case “b” (see Fig. 6b) there are two ranges of thedistribution which collapse by different values ofα: the core(δI<8) – by the value fromP(0, s), and the tails – by thevalue fromσ(s). The PDFs for the smallest scale,s=1.5 km,is somewhat narrower than the collapsed curve; hence, weconclude that the collapse of the PDFs tails is observed forscaless=3–24 km.
There is no scaling collapse of PDFs for case “c” by thescaling exponent obtained fromP(0, s), see Fig. 6c. How-ever, for the smaller scales the tails of the PDFs tend to col-lapse by the scaling exponents forσ(s).
For the case “d” the scaling exponents forP (0, s) andσ(s)
are the same. One can see from Fig. 6d that the PDFs forscaless=3–24 km are reasonably well collapsed, both nearthe maximum and in the tail region. In the central part ofthe distribution (dIs=6–20) the discrepancy of the rescaledcurves is somewhat higher (∼ factor 2).
The scaling features of the case “e” are practically thesame as for case “b”. But the collapse of the PDFs tails isobserved for a shorter range of scales,s=3–12 km.
The dual nature of the scaling collapse (different expo-nents for core and tail) observed in case “b” and “e” sug-gests a bifractal structure of the analyzed signal. However,the absence of scaling collapse observed in case “c”, com-bined with the increased kurtosis for small scales, indicatesa strong multifractal intermittent structure for this case of abright auroral arc. The bifractal structure is absent in case“d”, and even though the renormalized PDFs collapse reason-ably well with one scaling exponent, the increased kurtosison smaller scales suggests weak multifractal intermittencyfor this case of a corona-like auroral structure. Multifractal-ity may be investigated by Generalized Structure Functions(GSF), which we discuss in the next section.
4 Scaling features of generalized structure functions
The spatial generalized structure function (GSF) at a giventime is defined for our problem as
Sm(s) =⟨|δI |
m⟩=
∞∫−∞
|δI |mP(δI, s) d(δI ),
whereδI (ps)=I (p+s)–I (p), and the angle brackets implyaveraging over positionp. For PDFs with heavy tails onefaces the problem that the theoretical higher order structurefunctions may be very large or even infinite, and hence thatthe GSFs computed from the PDFs obtained from the obser-vation data are determined by the size of the available dataset. A larger set of independent data points yields heaviertails of the observed distribution, and the computed GSF willbe larger. The number of relatively independent values ofthe fluctuation incrementδI (ps) will decrease with increas-ing scales. Hence, for larges the tails of the renormalizedobservational PDF will be more depleted due to a smallernumber of independent data points, and this results in a moresevere underestimation of the higher order GSFs. For a self-similar signal with a finitem′th moment, it is easy to showthat Sm(s)∝sζ(m), whereζ(m)=αm with α being constant.If the tails are depleted due to poor statistics at large scaless, the scaling exponentsζ(m) are underestimated, and moreso for higher orders ofm. This leads to a weaker than lineargrowth ofζ with m, which can be incorrectly interpreted asintermittency. To avoid this problem of poor statistical repre-sentation of the PDF tails for larger scales, Hnat et al. (2003)suggest a conditioning technique (Kovacs et al., 2001). Un-der conditioning, the GSF for our case can be expressed viathe PDF of the fluctuations as:
Sm(s) =
∫ A
−A
|δI |mP(δI, s) d(δI ).
Here the choice of the thresholdA is based on the stan-dard deviation of the intensity fluctuations at a given scales, A(s)=Cσ(s). In this work we have adoptedC=10. Wealso consider non-conditioned GSF, using all available data.
If the GSF (conditioned or non-conditioned) exhibit scal-ing with respect to spatial scales, thenSm(s)∝sζ(m). Thisappears to be the case for the auroral fluctuations being ex-amined in this paper in the range of 3–20 km. The examplesfor the cases “b”, “d” and “e” discussed in the previous sec-tion are presented in Fig. 7. The case “c” is not consideredhere because of the instrumental truncation of the power-lawtails of the fluctuation PDFs.
From the inset plots in the figure (non-conditioned casesare not shown) one observes that the structure functions ofthe moment order m=1,. . . ,6 exhibit a well-defined power-law form in the range from 3 km to 20 km, so it is possi-ble to estimate the scaling exponentsζ(m). However, thepower-law exponentsζ(m) for non-conditioned GSF, beingplotted as a function of the moment order as triangles in
www.ann-geophys.net/25/915/2007/ Ann. Geophys., 25, 915–927, 2007
922 B. V. Kozelov and K. Rypdal: Spatial scaling of optical fluctuations during substorm-time aurora
(a) (b)
(c) (d)
(e)
Fig. 6. Scaling collapse of the PDFs for cases from Fig. 3. For(b), (c), and(d) – two sets of curves are presented with different values of thescaling index.
Ann. Geophys., 25, 915–927, 2007 www.ann-geophys.net/25/915/2007/

B. V. Kozelov and K. Rypdal: Spatial scaling of optical fluctuations during substorm-time aurora 923
(a) (b)
(c)
Fig. 7. Exponents of conditioned (squares) and unconditioned (triangles) generalized structure function as a function of the order ofm forauroral intensity fluctuation in 20-s interval starting from:(a) 22:26:20;(b) 23:54:20;(c) 00:10:20. Insets: conditioned structure functionSm of ordersm=1-6; solid lines are the least-squares power-law approximation.
Fig. 7, exhibit a pronounced nonlinear dependence onm, afeature which is often interpreted as the presence of multi-fractal intermittency in the signal (Frisch, 1995). However,for the cases of bi-modal distributions the power-law expo-nentsζ(m) for conditioned GSF exhibit nearly linear rela-tionships onm, as seen in Figs. 7a, c. This suggests thatthe increased kurtosis for small scales is caused by this bi-modality and not by multifractal intermittency, and that theconditioned structure function method is relatively insensi-tive to this bi-modality. On the other hand, for the case “d”,which displays no clear bi-modal PDF, Fig. 7b shows thatζ(m) deviates from a linear relationship for higher orders(m>3). This deviation should be attributed to true multi-
fractal intermittency, although the deviation from monofrac-tal behaviour is not very large.
These nonlinear features of the structure function are ob-served only when active aurora appears in the consideredfield of view. Quiet time aurora and weak airglow luminos-ity does not demonstrate such bi-modal or multifractal fea-tures. These categories of events will be considered in detailin forthcoming papers.
Since we have a few hours of observation in the courseof the event it is possible to follow the temporal evolution ofthe scaling exponents. The temporal evolution of the normal-ized exponentsζ(m)/m for m=1, 2, 3 is presented in Fig. 8.The values have been computed by the least-squares power
www.ann-geophys.net/25/915/2007/ Ann. Geophys., 25, 915–927, 2007

924 B. V. Kozelov and K. Rypdal: Spatial scaling of optical fluctuations during substorm-time aurora
Fig. 8. Evolution of the normalized scaling exponent of conditionedGSF for orders m=1–3 during the substorm event.
law approximation of the conditioned GSF in the range ofthe scaless=3–20 km for each 20-s interval of the data. Weexclude from the consideration the intervals for which: i)TV ASC range of gray levels does not cover the intensityrange of aurora; ii) the standard deviation of the intensityfluctuationσ(s)>25 for scaless<20 km (because we use theconditioning parameterA=10σ and the total number of theintensity levels is 256). It appears that the normalized ex-ponentsζ(m)/m for m=1, 2, 3 significantly vary from val-ues<0.1 for time period when no aurora appears in the fieldof view, to ∼0.6 for the most disturbed periods. The valueH=ζ (2)/2 is the Hurst exponent, therefore, the small valuesmay be interpreted as a spatial anti-persistence of the fluctu-ations, which is characteristic for random noise. However,keeping in mind the results of our PDF analysis, the timeintervals whereH>0.5 may not represent a transition to per-sistent fluctuations with long-range spatial dependence, butmay rather be a symptom of heavy algebraic tails in the fluc-tuation PDFs during aurora. This question is important toclarify, since leading turbulence theories predict antipersis-tence (Kolmogorov:H=1/3, Kraichnan:H=1/4), while SOCmodels would predict long-range spatial dependence.
We point out that the scaling exponents of the GSFs are in-variant to linear transformation of the auroral intensity. Thus,the exponents do not depend (in reasonable limits) on the pa-rameters of TV tape digitizing, and the exponents do not de-pend on temporal variations of amplification and the blacklevel during TV signal recording, if we avoid the periodsof intensity saturation, when the PDFs are truncated. Con-sequently, no intensity calibration is needed to extract thesestatistical features. This is one of the important advantagesof the method, as the intensity calibration of the TV signalnever can become very precise.
5 Discussion and conclusions
We have considered the same data set of optical observationswhich was previously used in Kozelov et al. (2004). In thatpaper the data set was analyzed by application of a spatio-temporal technique of selection of avalanche-like transients,
and it was found that the statistical distributions of the char-acteristics of these transients is consistent with the existenceof SOC-like states in the magnetosphere-ionosphere plasma.In the present paper, using information about spatial distribu-tion of the auroral luminosity, we directly analyze the statis-tics of its spatial fluctuations: PDF at scales from∼1.5 to∼80 km and generalized structure functions up to the 6thorder. We have demonstrated that the same data set sharessome intermittency features which are known to be funda-mental characteristics of classical turbulence (Frisch, 1995).On the other hand, other features, like long-range spatial de-pendence, may be present in the data, although this is notfirmly established at this point. If such features are confirmedby future observations, they should be taken as support of theSOC hypothesis.
The strong noise of the TV data detection considerablycomplicates the interpretation of the results. The noise alsocontains contributions from the airglow and the stars. Thenoise has the strongest influence on small intensity fluctu-ations and, therefore, affects mainly the “core” of the PDF(δI<8) and the GSFs of the orders ofm<2. However, thenoise fluctuations are practically independent of the spatialscaless≥3 km, hence, the main source of the spatial scalingis the auroral structures.
For the same reason, the PDF tails contain the most es-sential information about the auroral structures. In the pres-ence of the aurora, the tails exhibit “a heavy”, non-Gaussianshape. The tails tend to collapse to a given curve with rescal-ing of the PDFs by an exponent obtained by using the scaledependence of the standard deviation of the intensity fluc-tuations at scaless=3–20 km. The obtained decrease in thePDFs kurtosis parameter with increasing scale is in agree-ment with the finding of Tam et al. (2005) for electric fieldfluctuations in the auroral zone. The growing values (>10)of the kurtosis for small scales indicate that the fluctuationsof the auroral intensity are intermittent.
We found that the GSFs of the orders ofm=1–6 vs. spa-tial scale have a power-law regime at scaless=3–20 km. Thepower exponentζ(m) for non-conditioned GSF has a non-linear dependence on the GSF order parameterm, which forturbulent flows often is interpreted as a manifestation of in-termittent turbulence. For GSF conditioned withA=10σ thedependence is mainly linear, but a nonlinear dependence ofζ onm is sometimes seen form>3. For the first three ordersof GSF the deviation from linearity forζ(m) is not large,indicating that the main (non-intermittent) part of the spa-tial structure is well described by one fractal dimension ob-tained asζ(m)/m for m=2 or 3. We found that this frac-tal dimension is varying in time during the substorm event.Time variations of the fractal structure have been observed insimulations of Rayleigh-Taylor instabilites (Hasegawa et al.,1996), and variations of fractal dimension of isoline of equalintensity have been found for aurora observations in Kozelov(2003). A general theoretical description of such a transientin turbulent flows is still an open problem.
Ann. Geophys., 25, 915–927, 2007 www.ann-geophys.net/25/915/2007/

B. V. Kozelov and K. Rypdal: Spatial scaling of optical fluctuations during substorm-time aurora 925
An open problem is also the relation between auroralstructures and plasma disturbances in the magnetosphere.In spite of the fact that the main energy of the substormtransient is located in the magnetosphere plasma sheet, thesource of the small-scale structures is not well understood.There is no doubt that the considered bright auroral struc-tures are located at closed magnetic field lines. However,before the expansion phase of the substorm studied here, aquiet aurora was located south of the field of view, and wecan assume that the observed poleward motion of the auro-ral structure corresponds to a plasma transient in the mag-netosphere plasma sheet (Yahnin et al., 2006). On the otherhand, the small scales of the structure are possibly affectedby the acceleration region at distances closer to the Earth.The spatio-temporal technique (Uritsky et al., 2002; Kozelovet al., 2004) gives the uniform scaling features of avalanche-like transients during the substorm expansion phase fromscales of a few square kilometers and a few seconds, upto 106 square kilometers and a few hours. The analysis ofthe PDFs and GSFs presented here shows that the features(power-law range of GSF vs. scale, evidence of the inter-mittence, leptokurtic shape of the PDFs, and collapse of therescaled PDFs) of spatial auroral fluctuations on scales of 3–20 km are the same as for the non-substorm event discussedin Kozelov and Golovchanskaya (2006). This indicates thatthe scaling relations may represent more universal signaturesof spatio-temporal complex dynamics than those pertainingto substorm-like transients in the magnetospheric plasma.Recent work on modeling of the magnetotail current sheet(Klimas et al., 2007) shows signatures of SOC type scalingin the Poynting flux, but evidence of intermittent turbulencein the velocity field. Similar conclusions about the coexis-tence of SOC scaling and intermittent turbulence are drawnfor solar flare activity by Uritsky et al. (2006) from a studyof extreme ultraviolet images provided by the SOHO space-craft. Some evidence for more universal validity of such fea-tures relating to complex dynamics in the geosciences werealso discussed in Nikora and Goring (2001).
Unfortunately, at present there is no general agreementabout how to distinguish SOC and turbulence dynamics froma given set of observation data, in particular for those caseswhen a velocity field is not directly observable, and we haveto base the analysis on a scalar intensity field. Mono-scalingin avalanche size distributions is a basic signature of SOC,and has previously been firmly established for the dataset an-alyzed in this paper. Intermittency is a signature of turbu-lence, and has also to some degree been found in the presentdataset. Intermittency signatures, as they are defined in tur-bulence theory are difficult to define for the classical sand-pile type of SOC models, due to the limited amplitude-rangeof the dynamical variables: the “occupation number” at agiven site is limited by a threshold. However, time-seriesfor various output characteristics from a SOC-model has re-cently been analyzed for intermittency by the Tromsø group,since intermittency is basically a property of a signal. Spa-
tial intermittency has also been studied in these models byspatio-temporal coarse graining of the dynamical variables.These studies, which will the subject of a forthcoming publi-cation, show that monofractality is not universal for all outputcharacteristics of SOC models, and hence it will be difficultto use intermittency as a signature to distinguish turbulenceand SOC.
Boffeta et al. (1999) suggested the use of waiting timestatistics between bursts as a distinguishing signature, claim-ing that SOC models yield exponential waiting-time distri-butions, while turbulence models produce power-law dis-tributed waiting times. They supported this claim by obtain-ing exponential waiting times from a simulation of the Bak-Tang-Wiesenfeld (BTW) sand pile, and algebraic waitingtimes from a shell model of turbulence. However, Paczuskiet al. (2005) have recently pointed out that in experimen-tal or observational data sets avalanches can be identifiedin a noisy background only by introducing a finite thresh-old of activity, which necessarily will lead to identificationof bursts within the same avalanche that will be interpretedas separate avalanches. By simulation of the BWT-modelthey demonstrate that this will lead to clustering of burstswhich results in a power-law waiting time distribution, evenif the avalanches themselves have exponentially distributedwaiting times. These bursts in the activity are due to the factthat avalanches consist of spatially separated active regions,which also give rise to correlated bursts of flux out of the sandpile. Analysis of waiting times between bursts in the flux willalso show a power-law distribution, as we will demonstratein a forthcoming paper. Thus, it seems that power-law wait-ing times obtained from observational data are not sufficientto exclude SOC dynamics.
In fact, there are striking structural similarities betweenthe shell model of turbulence, which is a high-dimensionaldynamical system model, coupling neighboring shells in k-space, and the sand-pile models, which couple neighboringsites in configuration space. The distinction becomes evenmore diffuse when one realizes that some sand-pile mod-els can be reformulated as high-dimensional, discrete-timedynamical systems which are chaotic, but with the largestLyapunov exponent that vanishes in the thermodynamic limit(Kruglikov and Rypdal, 2006).
So far it seems an open question as to whether it is possi-ble to discriminate SOC and turbulence from statistical sig-natures alone, and whether there are geospace systems whereboth phenomenologies coexist. A distinct difference betweenthe two classes of complex behavior is that SOC systems de-velop scale-invariance only when the system has been slowlydriven to a state where all sites are near a local instabilitythreshold. Strong driving generally drives the system awayfrom scale-invariant critical behavior. Turbulent systems de-velop (imperfect) scale-invariance, even if they are stronglydriven far above the threshold for the instability which givesrise to the onset of turbulence, and in contrast to SOC sys-tems, end up in a laminar state in the limit of a vanishing
www.ann-geophys.net/25/915/2007/ Ann. Geophys., 25, 915–927, 2007

926 B. V. Kozelov and K. Rypdal: Spatial scaling of optical fluctuations during substorm-time aurora
drive. Thus, one cannot exclude that it may be impossibleto discriminate SOC and turbulence without obtaining suffi-cient knowledge about the strength of the drive and physicalmechanisms producing the signals that are subject to statisti-cal analysis.
The present paper, as well as the works of Uritsky etal. (2006) and Klimas et al. (2007), add another dimensionto this problem by demonstrating that signatures of SOC andintermittent turbulence can be observed from the same physi-cal system. Further observational and theoretical work alongthese lines are needed to verify or falsify the hypothesis thatSOC dynamics and intermittent turbulence can be differentaspects of the same complex phenomenon.
Acknowledgements.The work was partly supported by the Norwe-gian Science Council (grant 171076) and by the Presidium of theRussian Academy of Sciences (RAS) through the basic researchprogram “Solar activity and physical processes in the Sun-Earthsystem” and by the Division Physical Sciences of RAS through theprogram “Plasma processes in the solar system”.
Topical Editor I. A. Daglis thanks A. Klimas and another refereefor their help in evaluating this paper.
References
Angelopoulos, V., Mukai, T., and Kokubun, S.: Evidence for in-termittency in Earth’s plasma sheet and implications for self-organized criticality, Phys. Plasmas, 6, 4161–4168, 1999.
Bak, P., Tang, C., and Wiesenfeld, K.: Self-organized criticality,Physical Review, A38 (1), 364–374, 1988.
Bak, P.: How nature works, The science of self-organized criticality,Oxford University Press, 1997.
Bofetta, G., Carbone, V., Giuliani, P., Veltri, P., and Vulpiani, A.:Power laws in solar flares: self-organized criticality or turbu-lence?, Phys. Rev. Lett., 83(22), 4662–4665, 1999.
Borovsky, J. E., Elphic, R. C., Funsten, H. O., and Thomsen, M. F.:The Earth’s plasma sheet as a laboratory for flow turbulence inhigh-b MHD, J. Plasma Physics, 57(1), 1–34, 1997.
Borovsky, J. E. and Funsten, H. O.: MHD turbulence in the Earth’splasma sheet: Dynamics, dissipation and driving, J. Geophys.Res., 108, 1284, doi:10.1029/ 2002JA009625, 2003.
Consolini, G.: Sandpile cellular automata and magnetospheric dy-namics, Proc. of Cosmic Physics in the Year 2000, 58, edited by:Aiello et al., SIF, Bologna, Italy, 123–126, 1997.
Chang, T., Tam, S. W. Y., and Wu, C. C.: Complexity inducedanisotropic bimodal intermittent turbulence in space plasmas,Phys. Plasma, 11, 1287–1299, 2004.
Frisch, U.: Turbulence: The Legacy of A. N. Kolmogorov, Cam-bridge University Press, New York, 1995.
Hasegawa, S., Nishihara, K., and Sakagami, H.: Numerical sim-ulation of mixing by Rayleigh-Taylor instability and its fractalstructures, Fractals, 4(3), 241–250, 1996.
Hnat, B., Chapman, S. C., Rowlands, G., Watkins, N. W., and Free-man, M. P.: Scaling in long term data sets of geomagnetic in-dices and solar windε as seen by WIND spacecraft, Geophys.Res. Lett., 30, 2174–2177, 2003.
Jensen, H. J.: Self-organized criticality. Emergent complex behav-ior in physical and biological systems, Cambridge UniversityPress, Cambridge, 1998.
Klimas, A., Uritsky, V. M., and Paczuski, M.: Self-Organized Criti-cality and Intermittent Turbulence in an MHD Current Sheet witha Threshold Instability, arXiv:astro-ph/0701486 v2, 20 January2007.
Kovacs, P., Carbone, V., and Voros, Z.: Wavelet-based filtering ofintermittent events from geomagnetic time series, Planet. SpaceSci., 49, 1219–1231, 2001.
Kozelov, B. V. and Golovchanskaya, I. V.: Scaling of electric fieldfluctuations associated with the aurora during northward IMF,Geophys. Res. Lett., 33, L20109, doi:10.1029/2006GL027798,2006.
Kozelov, B. V., Uritsky, V. M., and Klimas, A. J.: Power lawprobability distributions of multiscale auroral dynamics fromground-based TV observations, Geophys. Res. Lett., 31, L20804,doi:10.1029/2004GL020962, 2004.
Kozelov, B. V.: Calibration of TV all-sky data by simultaneous ob-servations of scanning photometer, Proceedings of 31st AnnualEuropean Meeting on Atmospheric Studies by Optical Methods,Ambleside, 22–28 August 2004, 37–41, 2005.
Kozelov, B. V.: Fractal approach to description of auroral structure,Ann. Geophys., 21, 2011–2023, 2003,http://www.ann-geophys.net/21/2011/2003/.
Kruglikov, B. and Rypdal, M.: Dynamics and entropy in the Zhangmodel of self-organized criticality, J. Statist. Phys., 122, 975–1039, 2006.
Milovanov, A. V., Zelenyi, L. M., and Zimbardo, G.: Fractal struc-tures and power law spectra in the distant Earth’s magnetotail, J.Geophys. Res., 101(A9), 19 903–19 910, 1996.
Nikora, V. I. and Goring, D. G.: Extended self-similarity in geo-physical and geological applications, Mathematical Geology,33(3), 251–271, 2001.
Paczuski, M., Boettcher, S., and Baesi, M.: Interocurrence Timesin the Bak-Tang-Wiesenfeld Sandpile Model: A Comparisonwith the Observed Statistics of solar Flares, Phys. Rev. Lett., 95,181 102, doi:10.1103/PhysRevLett.95.181102, 2005.
Sharma, A. S.: Nonlinear dynamical studies of global magneto-spheric dynamics, in: Nonlinear waves and chaos in space plas-mas, edited by: Hada, T. and Matsumoto, H., Tokyo, TERRA-PUB, 359–389, 1997.
Sorriso-Valvo, L., Carbone, V., Giuliani, P., Veltri, P., Bruno, R.,Antoni, V., and Martines, E.: Intermittency in plasma turbulence,Planet. Space Sci., 49, 1193–1200, 2001.
Takalo, J., Timonen, J., and Koskinen, H.: Correlation dimensionand affinity of AE data and bicolored noise, Geophys. Res. Lett.,20(15), 1527–1530, 1993.
Tam, S. W. Y., Chang, T., Kintner, P. M., and Klatt, E.: Intermit-tency analyses on the SIERRA measurements of the electric filedfluctuations in the auroral zone, Geophys. Res. Lett., 32, L05109,doi:10.1029/2004GL021445, 2005.
Uritsky, V. M. and Pudovkin M. I.: Low frequency 1/f-like fluc-tuations of the AE-index as a possible manifestation of self-organized criticality in the magnetosphere, Ann. Geophys., 16,1580–1588, 1998,http://www.ann-geophys.net/16/1580/1998/.
Uritsky, V. M., Klimas, A. J., Vassiliadis, D., Chua, D., andParks, G.: Scale-free statistics of spatiotemporal auroral emis-
Ann. Geophys., 25, 915–927, 2007 www.ann-geophys.net/25/915/2007/
B. V. Kozelov and K. Rypdal: Spatial scaling of optical fluctuations during substorm-time aurora 927
sions as depicted by POLAR UVI images: Dynamic magneto-sphere is an avalanching system, J. Geophys. Res., 107(A12),1426, doi:10.1029/2001JA000281, 2002.
Uritsky, V. M., Paczuski, M., Davila, J. M., and Jones, S. I.: Coex-istence of Self-Organized Criticality and Intermittent Turbulencein the Solar corona, arXiv:astro-ph/0610130 v1, 4 October 2006.
Voros, Z.: Synergetic approach to substorm phenomenon, in: Mag-netospheric substorms, edited by Kan, J. R., Geophys. Mono-graph, 64, 461–467, 1991.
Voros, Z., Baumjohann, W., Nakamura, R., Runov, A., Zhang, T.L., Volwerk, M., Eichelberger, H. U., Balogh, A., Horbury, T.S., Glaßmeier, K.-H., Klecker, B., and Reme, H.: Multi-scalemagnetic field intermittence in the plasma sheet, Ann. Geophys.,21, 1955–1964, 2003,http://www.ann-geophys.net/21/1955/2003/.
Yahnin, A. G., Despirak, I. V., Lubchich, A. A., Kozelov, B. V.,Dmitrieva, N. P., Shukhtina, M. A., and Biernat, H. K.: Relation-ship between substorm auroras and processes in the near-earthmagnetotail, Space Sci. Rev., 122, 97–106, doi:10.1007/s11214-006-5884-4, 2006.
www.ann-geophys.net/25/915/2007/ Ann. Geophys., 25, 915–927, 2007