
A multipoint study of a substorm occurring on 7 December ...
16
A multipoint study of a substorm occurring on 7 December, 1992, and its theoretical implications N. J. Fox 1 , S. W. H. Cowley 2 , V. N. Davda 3 , G. Enno 4 , E. Friis-Christensen 5 , R. A. Greenwald 6 , M. R. Hairston 7 , M. Lester 2 , M. Lockwood 3 , H. Lu¨hr 8 , D. K. Milling 9 , J. S. Murphree 4 , M. Pinnock 10 , G. D. Reeves 11 1 Laboratory for Extraterrestrial Physics, NASA/GSFC, Greenbelt, MD 20771, USA E-mail: [email protected] 2 Physics Department, University of Leicester, LE1 7RH, UK 3 Rutherford Appleton Laboratory, Chilton, Didcot, Oxfordshire OX11 0QX, UK 4 Department of Physics and Astronomy, University of Calgary, Alberta, Canada T2N 1N4 5 Danish Space Research Institute, Juliane Marie Verj 30, DK-2100 Copenhagen, Denmark 6 John Hopkins University, Applied Physics Laboratory, Laurel, MD 20723, USA 7 University of Texas at Dallas, Richardson, TX 75080, USA 8 GeoForschungsZentrum Potsdam, Telegrafenberg, D-14473 Potsdam, Germany 9 Department of Physics, University of York, York YO1 5DD, UK 10 British Antarctic Survey, Cambridge CB3 0ET, UK 11 Los Alamos National Laboratory, Los Alamos, NM 87545, USA Received: 2 April 1998 / Revised: 8 March 1999 / Accepted: 12 March 1999 Abstract. On 7 December 1992, a moderate substorm was observed by a variety of satellites and ground-based instruments. Ionospheric flows were monitored near dusk by the Goose Bay HF radar and near midnight by the EISCAT radar. The observed flows are compared here with magnetometer observations by the IMAGE array in Scandinavia and the two Greenland chains, the auroral distribution observed by Freja and the substorm cycle observations by the SABRE radar, the SAMNET mag- netometer array and LANL geosynchronous satellites. Data from Galileo Earth-encounter II are used to estimate the IMF B z component. The data presented show that the substorm onset electrojet at midnight was confined to closed field lines equatorward of the pre- existing convection reversal boundaries observed in the dusk and midnight regions. No evidence of substantial closure of open flux was detected following this substorm onset. Indeed the convection reversal boundary on the duskside continued to expand equatorward after onset due to the continued presence of strong southward IMF, such that growth and expansion phase features were simultaneously present. Clear indications of closure of open flux were not observed until a subsequent substorm intensification 25 min after the initial onset. After this time, the substorm auroral bulge in the nightside hours propagated well poleward of the pre-existing convection reversal boundary, and strong flow perturbations were observed by the Goose Bay radar, indicative of flows driven by reconnection in the tail. Key words. Ionosphere (auroral ionosphere; plasma convection) Æ Magnetospheric physics (storms and substorms) 1 Introduction The onset of a magnetospheric substorm, marking the transition from the growth to the expansion phase, is defined as the beginning of the explosive brightening and expansion of the aurora. As the Akasofu (1964) model had only two substorm phases, expansion and recovery, expansion, onset was the first event during a substorm. With the addition of the growth phase (McPherron, 1970) it was recognised that the substorm cycle began not at onset, but typically 30–60 min earlier when the rate of dayside flux production increased (usually due to a southward turning of the IMF). The term onset was retained for the commencement of the auroral and current features described by Akasofu (1964), and subsequently became associated with the commencement of the reconnection of open flux in the tail, which closes the open flux accumulated in the growth phase. The main assumptions of the near-Earth neutral line (NENL) substorm model were that the onset of near-Earth tail reconnection caused the onset of the expansion phase, and that this reconnection rate is suciently rapid that the plasmoid is pinched o within a few minutes such that open lobe flux then begins to be closed (Hones, 1979). More recent evi- dence, however, suggests that there may be a significant delay between the expansion phase onset and the closure of open flux. Although Nagai et al. (1998) have shown that reconnection generally commences between Correspondence to: N. J. Fox Ann. Geophysicae 17, 1369–1384 (1999) Ó EGS – Springer-Verlag 1999
Transcript of A multipoint study of a substorm occurring on 7 December ...

A multipoint study of a substorm occurring on 7 December, 1992,and its theoretical implications
N. J. Fox1, S. W. H. Cowley2, V. N. Davda3, G. Enno4, E. Friis-Christensen5, R. A. Greenwald6, M. R. Hairston7,M. Lester2, M. Lockwood3, H. LuÈ hr8, D. K. Milling9, J. S. Murphree4, M. Pinnock10, G. D. Reeves11
1 Laboratory for Extraterrestrial Physics, NASA/GSFC, Greenbelt, MD 20771, USAE-mail: [email protected] Physics Department, University of Leicester, LE1 7RH, UK3 Rutherford Appleton Laboratory, Chilton, Didcot, Oxfordshire OX11 0QX, UK4 Department of Physics and Astronomy, University of Calgary, Alberta, Canada T2N 1N45 Danish Space Research Institute, Juliane Marie Verj 30, DK-2100 Copenhagen, Denmark6 John Hopkins University, Applied Physics Laboratory, Laurel, MD 20723, USA7 University of Texas at Dallas, Richardson, TX 75080, USA8 GeoForschungsZentrum Potsdam, Telegrafenberg, D-14473 Potsdam, Germany9 Department of Physics, University of York, York YO1 5DD, UK10 British Antarctic Survey, Cambridge CB3 0ET, UK11 Los Alamos National Laboratory, Los Alamos, NM 87545, USA
Received: 2 April 1998 /Revised: 8 March 1999 /Accepted: 12 March 1999
Abstract. On 7 December 1992, a moderate substormwas observed by a variety of satellites and ground-basedinstruments. Ionospheric ¯ows weremonitored near duskby the Goose Bay HF radar and near midnight by theEISCAT radar. The observed ¯ows are compared herewith magnetometer observations by the IMAGE array inScandinavia and the two Greenland chains, the auroraldistribution observed by Freja and the substorm cycleobservations by the SABRE radar, the SAMNET mag-netometer array and LANL geosynchronous satellites.Data from Galileo Earth-encounter II are used toestimate the IMF Bz component. The data presentedshow that the substorm onset electrojet at midnight wascon®ned to closed ®eld lines equatorward of the pre-existing convection reversal boundaries observed in thedusk and midnight regions. No evidence of substantialclosure of open ¯ux was detected following this substormonset. Indeed the convection reversal boundary on theduskside continued to expand equatorward after onsetdue to the continued presence of strong southward IMF,such that growth and expansion phase features weresimultaneously present. Clear indications of closure ofopen ¯ux were not observed until a subsequent substormintensi®cation 25 min after the initial onset. After thistime, the substorm auroral bulge in the nightside hourspropagated well poleward of the pre-existing convectionreversal boundary, and strong ¯ow perturbations wereobserved by the Goose Bay radar, indicative of ¯owsdriven by reconnection in the tail.
Key words. Ionosphere (auroral ionosphere; plasmaconvection) á Magnetospheric physics (storms andsubstorms)
1 Introduction
The onset of a magnetospheric substorm, marking thetransition from the growth to the expansion phase, isde®ned as the beginning of the explosive brighteningand expansion of the aurora. As the Akasofu (1964)model had only two substorm phases, expansion andrecovery, expansion, onset was the ®rst event during asubstorm. With the addition of the growth phase(McPherron, 1970) it was recognised that the substormcycle began not at onset, but typically 30±60 min earlierwhen the rate of dayside ¯ux production increased(usually due to a southward turning of the IMF). Theterm onset was retained for the commencement of theauroral and current features described by Akasofu(1964), and subsequently became associated withthe commencement of the reconnection of open ¯ux inthe tail, which closes the open ¯ux accumulated in thegrowth phase. The main assumptions of the near-Earthneutral line (NENL) substorm model were that theonset of near-Earth tail reconnection caused the onsetof the expansion phase, and that this reconnection rateis su�ciently rapid that the plasmoid is pinched o�within a few minutes such that open lobe ¯ux thenbegins to be closed (Hones, 1979). More recent evi-dence, however, suggests that there may be a signi®cantdelay between the expansion phase onset and theclosure of open ¯ux. Although Nagai et al. (1998) haveshown that reconnection generally commences betweenCorrespondence to: N. J. Fox
Ann. Geophysicae 17, 1369±1384 (1999) Ó EGS ± Springer-Verlag 1999

20±30 RE downtail within a few minutes of substormonset, it appears nevertheless that a substantial intervalmay elapse before the resulting plasmoid is pinched o�and open lobe ¯ux starts to be reconnected. Forexample, Maynard et al. (1997) using an extensivedataset including Geotail data, have inferred that open¯ux closure did not begin until 15 min after onset in oneevent, and 40 min after onset in another. In a study ofionospheric ¯ows using the AMIE technique, Tayloret al. (1996) also inferred that open ¯ux typically didnot start to decrease until 20 min after substorm onset.Correspondingly, the expansion of the auroral bulge isobserved to originate on the most equatorward discretearc, which is usually located well equatorward of theopen/closed ®eld line boundary, as implied by Aka-sofu's (1964) original picture (see also Galperin andFeldstein, 1991), and subsequently con®rmed by Vikingimager data (Murphree and Cogger, 1992; Elphinstoneand Hearn, 1992; Cogger and Elphinstone, 1992).The latter show that the auroral bulge often reachesthe open/closed ®eld line boundary towards the end ofthe expansion phase (see also, for example, Lopez et al.,1992), at which time the poleward edge often brightensand becomes more active whilst the aurora in the middleof the bulge often fade, leading to a ``double oval''con®guration.
In this work we will analyse a substorm whichoccurred during the second Galileo Earth-encounter andwill show that in this case open ¯ux closure was delayedrelative to substorm onset by more than 25 min. Thiswill be inferred from a dataset combining groundmagnetic records, radar observations of ionospheric¯ow and satellite measurements.
2 Instrumentation
In this study we will combine together data from anetwork of ground-based instruments with satelliteobservations to study the evolution of a substorm on 7December, 1992. Data from the IMAGE, Greenlandand SAMNET magnetometer chains and Los AlamosNational Laboratory (LANL) spacecraft in geosynchro-nous orbit are used to detect the substorm onset andsubsequent intensi®cation. The location and motion ofthe convection reversal boundary were monitored by theEISCAT incoherent scatter radar, Goose Bay HF radar,SABRE VHF radar and the Defense MeteorologicalSatellite Program (DMSP) satellites. Unfortunately,there are no interplanetary magnetic ®eld (IMF) datafor the interval studied owing to a gap in the IMP-8 datarecord. However, Galileo was located in the magneto-sheath during its second Earth-encounter and the dataobtained can be used to deduce the orientation of theIMF. Figure 1 shows the positions of the groundstations used in this study together with the footprintsof the LANL satellites. This ®gure illustrates the broadcoverage of the observations, extending over 6 h ofmagnetic local time (MLT) and from sub-aurorallatitudes to within the polar cap. A brief description ofthe data sources is given.
1. Data from the EISCAT radar were obtained usingthe SP-UK-CONV experiment, in which the VHF radarwas used in a split-beam mode. One pair of panels of theantenna were phased such that the beam pointed alongan azimuth 344.8° to the east of geographic north (westbeam) and the beam of the remaining pair to 359.8°(east beam), both at an elevation of 30°. In this mode,therefore, the VHF system provides two independentradars operating with two di�erent ®xed beam direc-tions. The data are taken simultaneously at eachazimuth with 10 s resolution. Echoes are received fromrange gates 65.3 km in length along the beam passingthrough the F-region ionosphere, covering invariantlatitudes 71°±78°. The data are analysed using an ``L-shell ®tting'' technique to estimate the ionospheric ¯owmagnitude and direction from line-of-sight velocities,assuming that the ¯ow is the same along the L-shellsbetween the two azimuths and that the magnetic ®eldparallel ¯ow is negligible. The data have been analysedfor the 10 s preintegration periods with no postintegration. The MLT of the CONV ®eld-of-view isapproximately UT + 2.25 h for azimuth 344.8° andUT + 2.75 h for 359.8°.
2. The Goose Bay HF coherent backscatter radar hasbeen described by Greenwald et al. (1985) and nowforms part of the SuperDARN network (Greenwaldet al., 1996). The radar measures the power and line-of-sight Doppler spectral characteristics of signals back-scattered from irregularities in the polar F-region. TheGoose Bay radar ®eld-of-view covers the range ofinvariant latitudes 65°±85° and spans 4 h of local time.The centre of the ®eld-of-view is at a MLT givenapproximately by UT) 3 h. Data from the 16 beamdirections are recorded over successive 6 s integrationperiods, such that the ®eld-of-view is scanned every 96 s.Flow vectors are derived where su�cient backscatterintensity is received by the L-shell ®tting technique(Ruohoniemi et al., 1989; Freeman et al., 1991).
3. At the time of this study the SABRE radarcomprised a monostatic VHF radar located at Wick,with a ®eld-of-view centred on an MLT of � UT + 1 hand covering an invariant latitude range of 61°±65°. Thetemporal resolution was typically 20 s. The signalreceived by a VHF coherent radar has been scatteredby E-region irregularities which have a drift speedrelated to the convection ¯ow speed. A more completedescription of the SABRE auroral backscatter system isgiven by Nielsen et al. (1983).
4. SAMNET is an array comprising seven triaxial¯uxgate magnetometers which cover midlatitudes inwestern Europe (Yeoman et al., 1990). These data areused to identify the occurrence of Pi2 pulsations andthus the onset of substorms.
5. The Greenland magnetometer network consists oftwo latitudinal chains of magnetometers located alongthe east and west coasts of Greenland (Wilhjelm andFriis-Christensen, 1976). The east coast chain stretchesfrom 70° to 81° in geomagnetic latitude and 56° to 111°in geomagnetic longitude. The corresponding ranges forthe west coast chain are from 68° to 86° in latitude and36° to 47° in longitude. Each station has a three-
1370 N. J. Fox et al.: A multipoint study of a substorm occurring on 7 December, 1992, and its theoretical implications

component ¯uxgate magnetometer which operates at20 s resolution. The perturbations from the quiet-daydiurnal variations are given here in terms of the threecomponent directions, H, E and Z, where H is positivetowards the north along the local magnetic meridian, Eis positive towards the east perpendicular to the localmeridian, and Z is positive in the vertically downwardsdirection.
6. The IMAGE magnetometer network is located inScandinavia with stations from mid-latitudes up toSvalbard (LuÈ hr et al., 1998). The entire network extendslatitudinally from 56° to 75° and longitudinally from106° to 119° (geomagnetic coordinates). Each of theinstruments in the network is a triaxial ¯uxgate magne-tometer similar to those used in the Greenland chain,but the ®eld perturbation components given here are thethree orthogonal components, X, horizontal geographicnorthward, Y, horizontal geographic eastward, and Z,vertically downwards.
7. The Los Alamos particle analyser instrumentsCPA and SOPA obtained the geosynchronous orbitenergetic particle data presented here. The spacecraftused in this study are 1984-129 at a local time ofUT + 06:54 h and 1990-095 at UT + 00:31 h. TheCPA instruments on 1984-129 measure electrons in theenergy range 30±300 keV and ions with energies 72±573 keV. The SOPA instruments aboard 1990-095measure electrons in the energy range 50±315 keV andions with energies 113±670 keV. A more detaileddescription of the Los Alamos particle instruments is
given by Higbie et al. (1978) and Belian et al. (1992). Inthis study we use the data to observe particle injectionswhich identify onset (Baker et al., 1978).
8. During the interval reviewed here, magnetic ®elddata from the Galileo spacecraft, at the time of itssecond Earth encounter, were used to monitor themagnetic ®eld in the Earth's magnetosheath. Galileowas located at GSM coordinates (X, Y, Z) � ()70, 40,26 RE), su�ciently far from the centre of the tail that themagnetic ®eld data can be used as a reasonable proxyfor the IMF. The Galileo magnetometers are describedin Kivelson et al. (1992).
9. The DMSP spacecraft are a series of polar orbitingsatellites designed to observe the weather on Earth andto monitor the near-Earth space environment at840 km. We have used ionospheric velocity measure-ments obtained by the F10 and F11 spacecraft to derivethe potential along the spacecraft track and hence theconvection reversal boundaries. The orbital period ofthe satellites is �103 min and each of the polar passes(magnetic latitudes exceeding 50°) takes 18±20 min.
10. FREJA, a Swedish and German scienti®c satel-lite, was launched on 6 October, 1992. Freja orbits at analtitude ranging between about 600 and 1750 km withan orbital inclination of 63°. The payload includes anauroral imager comprising two cameras. The onepresented here monitors the molecular nitrogen Ly-man-Birge-Hop®eld (LBH) emissions and has a pass-band from 134 to 180 nm (Murphree et al., 1994). Theimage contained here is a composite of ®ve separate
Fig. 1. Geomagnetic latitude and longitude of the ground-basedstations used. The MLT is indicated in brackets correspondingto 2245 UT, which is one of the principal periods of study. The®eld-of-view of the Goose Bay radar is labelled GB, the two beamsfor the EISCAT CP-4-B experiment E and the SABRE beam at
Wick SW. The solid circles represent the positions of themagnetometers in the Greenland Chain (GLC), IMAGE (I) andSAMNET (SM) networks respectively. The black cross and theletters GS indicate the magnetic footprint of the geosynchronoussatellite 1990-095
N. J. Fox et al.: A multipoint study of a substorm occurring on 7 December, 1992, and its theoretical implications 1371

images taken at two minute intervals, where each of theseparate images has an overall ®eld-of-view of 29.4° by109.2°.
3 Observations
Data from the Galileo Earth-encounter II for 21 UT on7 December to 01 UT on 8 December, 1992, are plottedin Fig. 2. When these data were taken, the satellite waslocated in the magnetosheath �72 RE downtail. Bytaking a value of 450 km s)1 for the solar wind speed(from the Geotail record), a delay of �20 min can beestimated as the time taken for e�ects at the nose of themagnetosphere to be detected by Galileo. For the ®rsthour of this interval, the magnetic ®eld is mainlynorthward pointing with By negative and Bx positive.Shortly after 2200 UT, a southward turning occurred inthe Bz component (�2140 UT at the subsolar magne-
topause). Subsequently Bz decreased slowly until near2235 UT (�2215 UT at the subsolar magnetopause)when it suddenly dropped to )20 nT. Prior to this timethe By component was strongly negative (around)25 nT) while Bx was near zero. After 2235 UT By
declined sharply towards zero such that the ®eld wasdirected nearly due south in the GSM frame for about20 min. At 2255 UT (�2235 UT at the subsolarmagnetopause), Bz suddenly turned northward andremained so for the following 25 min, except when itbrie¯y returned to zero at �2257 UT. From 2315 to0015 UT the Bz ®eld was variable but typically weaklynegative. During the whole of the period af-ter �2255 UT, Bx was positive and By strongly negative.For the remainder of this study these times will bequoted in terms of the e�ect at the subsolar magneto-pause and not detection by Galileo.
Turning now to the corresponding ground-baseddata, we shall now examine the magnetometer and radar
Fig. 2. Magnetic data from Galileo Earth-en-counter II in GSM co-ordinates. The data shownare from 21 UT, 7 December, 1992, to 01 UT, 8December, 1992 and are averaged over 20 s.During the time period reviewed, Galileo waslocated in the magnetosheath at GSM coordinates(X, Y, Z � )70, 40, 26 RE), su�ciently far fromthe centre of the tail that the magnetic ®eld datacan be used to indicate the strength and orienta-tion of the IMF. The bottom panel indicates themerging index. A value of 1 denotes that theconditions are favourable for low-latitude daysidereconnection, i.e. the IMF Bz is southward or themagnetic shear angle between the subsolar mag-netospheric ®eld and the IMF was only �70°when the IMF Bz was northward
1372 N. J. Fox et al.: A multipoint study of a substorm occurring on 7 December, 1992, and its theoretical implications

observations. The backscatter intensity detected by theSABRE radar between 21 and 23 UT is plotted in Fig. 3as a function of range and UT. It shows an intensi®-cation of the backscatter at 2130 UT, which rapidlyexpanded equatorward starting at 2200 UT. We inferthat this expansion was a response to the southwardturning of the IMF with a delay of 20 min, and interpretthe equatorward motion as a growth phase signature. Asimilar phenomenon was reported by Lester et al. (1993)during the SUNDIAL campaign when the onset ofbackscatter was detected before any substorm onsetsignatures and was thus assumed to be associated withthe southward turning of the IMF. The apparentbifurcation of the backscatter band which appears ataround 2210 UT is probably due to an instrumentale�ect known as Lloyd's mirror (Mattin and Jones,1985). The remainder of this ®gure will be described
later, after we have introduced the adjacent magneticobservations at the IMAGE chain.
The X- and Z-components of the magnetic ®elddetected by the IMAGE magnetometers are plotted inFig. 4. These data show that there was very littlemagnetic activity during the initial period of modestsouthward IMF Bz, 2140±2215 UT (Fig. 2), includingthe nightside response to the growth phase (starting at2200 UT) described already. The onset of the ®rst bay inthe X-component can be seen at 2215 UT, indicated bythe ®rst dash-dot line in Fig. 4a. This occurred aroundthe time of the large increase in southward IMF Bz to)20 nT at the subsolar magnetopause (Fig. 2) and theonset of the Pi2 s detected by SAMNET, shown inFig. 5. Both the X- and Z-components (Fig. 4a, b) ofthe magnetic de¯ections seen by the IMAGE arrayprovide evidence that the electrojet was approximately
Fig. 3. Range time intensity plot produced using data from theSABRE radar for 21 UT, 7 December 1992±01 UT, 8 December1992. Only one of the central beams, beam 5, of the Wick radar is
used here. It is a summary plot used to indicate the existence ofbackscatter. The colour scale represents the intensity of thebackscatter
N. J. Fox et al.: A multipoint study of a substorm occurring on 7 December, 1992, and its theoretical implications 1373

centred at station PEL (62.4° latitude) at this time; aswell as the peak X component being detected at PEL,there was a positive Z de¯ection in the stations north ofthis station and a negative de¯ection to the south.Shortly after the expansion phase onset, the polewardedge of the backscatter band at SABRE (Fig. 3)contracted equatorward, starting at about 2220 UT.This may have been an e�ect of the substorm electrojetentering the radar ®eld of view to the west of IMAGE(Fig. 1) where a reduction in ¯ow speed inhibits thegeneration of E-region irregularities and hence radarbackscatter (Inhester et al., 1981). Since the SABRE®eld of view was located just prior to midnight at thistime, and the reduction of the backscatter encroachedfrom the east, the implication is that the onset began inthe post-midnight sector in the vicinity of the IMAGEchain and propagated westward to SABRE.
Returning now to the IMAGE data, it can be seenthat the initial disturbance intensi®ed over an interval of�15 min before starting to decay. This was followed byan intensi®cation at �2240 UT (second dash-dot line inFig. 4a) centred around MAS (64.9°), which coincidedapproximately with the northward turning of the IMF
at the nose, as detected by Galileo (Fig. 2). An associ-ated Pi2 enhancement was also seen in the D componentof the SAMNET data (Fig. 5). This intensi®cationresulted in a poleward expansion of the substormdisturbed region, which reached the Svalbard magneto-meters (BJO (70.1°), HOP (71.4°), HOR (72.8°) andNAL (74.9°)) after �2250 UT. At about this time, themagnetic disturbance at the latitude of the originalintensi®cation, centred at MAS, started to recover, whilethose poleward and equatorward were intensifying sothat a ``double oval'' con®guration in the magneticperturbations had formed by �2300 UT. Recovery ofthe poleward part of the magnetic disturbance was inprogress by 2340 UT and of the equatorward currentsby 2350 UT.
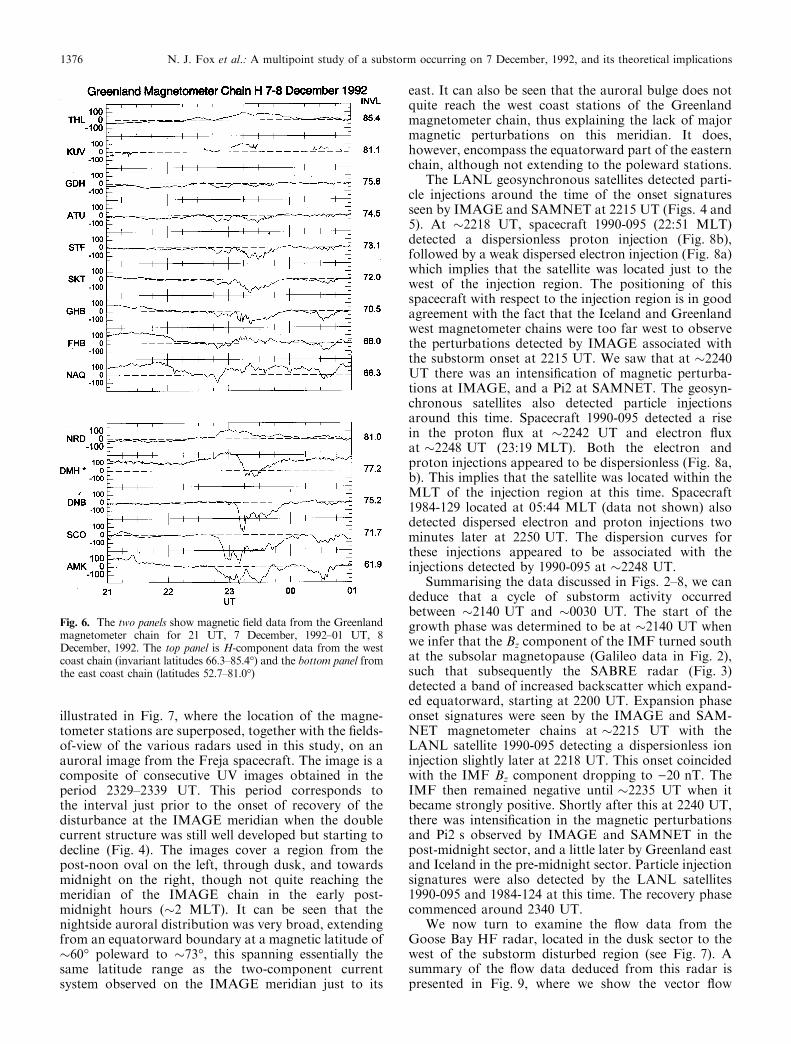
H-component data from the Greenland magnetom-eter chain are plotted in Fig. 6. No perturbations wereobserved at any of the Greenland chain stations inresponse to the substorm onset detected by IMAGE at2215 UT. This shows that the initial onset electrojet didnot extend westward to the 20 MLT sector, monitoredby the lower latitude Greenland stations (NAQ andFHB). The east coast stations are located at latitudes
Fig. 4a, b. IMAGE magnetometer chain data for 7 December±8December 1992. Four hours of data are shown as indicated by the UTat the bottom of each panel. a Shows theX-component of the magnetic®eld and b the Z-component. The station names and their magneticlatitudes are shown between the plots. The vertical dash-dot lines
indicate the key substorm timings in this study, 2215 UT wassubstorm onset; 2240 UT the intensi®cation; 2310 UT corresponds tothe time when the ``double oval'' was well established; and 2350 UTwas substorm recovery
1374 N. J. Fox et al.: A multipoint study of a substorm occurring on 7 December, 1992, and its theoretical implications

too high to observe the onset (since the perturbationsdid not reach BJO at 70° at IMAGE), but examinationof data from the Leirvogur station on Iceland (notshown) at 66° invariant latitude and MLT of UT-0:30,however, also did not observe any clear signaturesassociated with the initial onset, showing that theelectrojet was con®ned eastward of about 21:45 MLT.The onset of negative bays was seen after �2245 UT inthe lowest latitude stations of the east coast Greenlandchain (AMK �70°, and SCO �72°) in the pre-midnightsector, about 5 minutes after the intensi®cation detectedby IMAGE as discussed (Fig. 4). The disturbance
subsequently propagated poleward similarly to theIMAGE chain, reaching DNB (�75°) at 2305 UT andDMH (�77°) shortly thereafter. The westward electrojetdid not reach station NRD (81°), however. The magne-tometer stations on the west coast (�21±22 MLT)observed no signi®cant perturbations before �2300 UTwhen weak negative bays appeared at latitudes between70 and 75°. This shows that the substorm westwardelectrojet did not expand into this magnetic local timesector until late in the expansion phase development.
The relationship between the magnetic observationsdescribed already and the substorm disturbed region is
Fig. 5. Data from the SAM-NET magnetometers for 21 UT,7 December 1992±01 UT, 8December 1992. The data are the®ltered H (upper panel) and D(lower panel) components of themagnetic ®eld, using a band-pass®lter between 40 and 200 s
N. J. Fox et al.: A multipoint study of a substorm occurring on 7 December, 1992, and its theoretical implications 1375
illustrated in Fig. 7, where the location of the magne-tometer stations are superposed, together with the ®elds-of-view of the various radars used in this study, on anauroral image from the Freja spacecraft. The image is acomposite of consecutive UV images obtained in theperiod 2329±2339 UT. This period corresponds tothe interval just prior to the onset of recovery of thedisturbance at the IMAGE meridian when the doublecurrent structure was still well developed but starting todecline (Fig. 4). The images cover a region from thepost-noon oval on the left, through dusk, and towardsmidnight on the right, though not quite reaching themeridian of the IMAGE chain in the early post-midnight hours (�2 MLT). It can be seen that thenightside auroral distribution was very broad, extendingfrom an equatorward boundary at a magnetic latitude of�60° poleward to �73°, this spanning essentially thesame latitude range as the two-component currentsystem observed on the IMAGE meridian just to its
east. It can also be seen that the auroral bulge does notquite reach the west coast stations of the Greenlandmagnetometer chain, thus explaining the lack of majormagnetic perturbations on this meridian. It does,however, encompass the equatorward part of the easternchain, although not extending to the poleward stations.
The LANL geosynchronous satellites detected parti-cle injections around the time of the onset signaturesseen by IMAGE and SAMNET at 2215 UT (Figs. 4 and5). At �2218 UT, spacecraft 1990-095 (22:51 MLT)detected a dispersionless proton injection (Fig. 8b),followed by a weak dispersed electron injection (Fig. 8a)which implies that the satellite was located just to thewest of the injection region. The positioning of thisspacecraft with respect to the injection region is in goodagreement with the fact that the Iceland and Greenlandwest magnetometer chains were too far west to observethe perturbations detected by IMAGE associated withthe substorm onset at 2215 UT. We saw that at �2240UT there was an intensi®cation of magnetic perturba-tions at IMAGE, and a Pi2 at SAMNET. The geosyn-chronous satellites also detected particle injectionsaround this time. Spacecraft 1990-095 detected a risein the proton ¯ux at �2242 UT and electron ¯uxat �2248 UT (23:19 MLT). Both the electron andproton injections appeared to be dispersionless (Fig. 8a,b). This implies that the satellite was located within theMLT of the injection region at this time. Spacecraft1984-129 located at 05:44 MLT (data not shown) alsodetected dispersed electron and proton injections twominutes later at 2250 UT. The dispersion curves forthese injections appeared to be associated with theinjections detected by 1990-095 at �2248 UT.
Summarising the data discussed in Figs. 2±8, we candeduce that a cycle of substorm activity occurredbetween �2140 UT and �0030 UT. The start of thegrowth phase was determined to be at �2140 UT whenwe infer that the Bz component of the IMF turned southat the subsolar magnetopause (Galileo data in Fig. 2),such that subsequently the SABRE radar (Fig. 3)detected a band of increased backscatter which expand-ed equatorward, starting at 2200 UT. Expansion phaseonset signatures were seen by the IMAGE and SAM-NET magnetometer chains at �2215 UT with theLANL satellite 1990-095 detecting a dispersionless ioninjection slightly later at 2218 UT. This onset coincidedwith the IMF Bz component dropping to )20 nT. TheIMF then remained negative until �2235 UT when itbecame strongly positive. Shortly after this at 2240 UT,there was intensi®cation in the magnetic perturbationsand Pi2 s observed by IMAGE and SAMNET in thepost-midnight sector, and a little later by Greenland eastand Iceland in the pre-midnight sector. Particle injectionsignatures were also detected by the LANL satellites1990-095 and 1984-124 at this time. The recovery phasecommenced around 2340 UT.
We now turn to examine the ¯ow data from theGoose Bay HF radar, located in the dusk sector to thewest of the substorm disturbed region (see Fig. 7). Asummary of the ¯ow data deduced from this radar ispresented in Fig. 9, where we show the vector ¯ow
Fig. 6. The two panels show magnetic ®eld data from the Greenlandmagnetometer chain for 21 UT, 7 December, 1992±01 UT, 8December, 1992. The top panel is H-component data from the westcoast chain (invariant latitudes 66.3±85.4°) and the bottom panel fromthe east coast chain (latitudes 52.7±81.0°)
1376 N. J. Fox et al.: A multipoint study of a substorm occurring on 7 December, 1992, and its theoretical implications

versus invariant latitude and time between 22 and 23UT. The ¯ow data are shown for beam 5 of the radardirected towards magnetic north. These data showmainly eastward ¯ow in the poleward part of the ®eld-of-view and westward ¯ow in the equatorward region,such that the convection reversal boundary (CRB)remains within the ®eld-of-view for much of thisinterval. These data can thus be used to determine thelatitudinal motion of the CRB during the substormcycle. Under usual circumstances, this CRB will usuallybe located a little equatorward of the open/closed ®eldline boundary if viscous ¯ows are present, thus themotion of the CRB can be taken as a reasonable proxyfor the motion of the open/closed ®eld line boundary,allowing us to monitor the expansion and contraction ofthe polar cap in the dusk sector.
We have thus examined the vector velocities over theentire ®eld-of-view of the radar (15 beams) and usedthe method described to ®nd the invariant latitude of theCRB for the interval 2130±00 UT (1830±2100 MLT) asshown in Fig. 10. The lack of scatter, or of clear ¯owoften makes identi®cation of the CRB latitude di�cultand the vertical error bars indicate these uncertainties.Following an initial equatorward motion between 2130and 2135 UT, the CRB remained at �70° until �2200UT (Fig. 10). An equatorward motion was then evidentcontinuing across the onset of the substorm at 2215 UTand accelerating prior to the intensi®cation at 2240 UT.This behaviour closely mirrors the behaviour of thebackscatter band seen by the SABRE radar (Fig. 3)which showed a similar equatorward motion between2200 and at least 2235 UT. From this we infer that the
region of open magnetic ¯ux continued to expand for�25 min after substorm onset, presumably due to thefact that the IMF Bz was �)20 nT during this period,such that the rate of reconnection on the daysideconsiderably exceeded that on the nightside. During thisinterval, therefore, typical signatures of both growthand expansion phases were simultaneously present.Following the substorm intensi®cation at �2240 UT(and northward turning of the IMF) the CRB within theGoose Bay ®eld-of-view remained at a roughly constantlatitude of �68° until about 2305 UT when it appearedto jump poleward to 72°, where it remained located forthe remainder of this interval. Given that there was asubstorm intensi®cation at 2240 UT together with thepresence of northward IMF since 2235 UT, such thatdayside reconnection will have been substantially re-duced, it is perhaps surprising that the polewardcontraction of the CRB at Goose Bay did not occuruntil 2305 UT. This point will be discussed later.
Another important feature of the Goose Bay ¯owdata can also be seen in Fig. 9, in that there was a majorchange in the ¯ow pattern at 2245 UT, from an eastward¯ow in the polar cap to strong northeast ¯ows. Thesewere observed for three consecutive 96 s scans until thebackscatter from the poleward part of the ®eld-of-viewdisappeared. An example of the velocities deduced overthe whole radar ®eld-of-view during this interval isshown in Fig. 11. Comparing Fig. 11 with the Frejaimage in Fig. 7, shows that the ¯ows in the polewardregion of the Goose Bay radar are in fact directedtowards the poleward expanding substorm bulge nearmidnight. It seems reasonable to infer that these ¯ows
Fig. 7. A composite of ®ve consecutive UV imagestaken from the Freja satellite (orbit 828) between2329±2339 UT on 7 December, 1992. The imageshows the auroral oval in the late expansion phaseover Canada, Greenland and the north Atlantic. The®elds-of-view of the Goose Bay, EISCAT andSABRE radars and the position of the SAMNET,IMAGE and Greenland magnetometer chains areoverlaid. The 55° line is geomagnetic latitude, and 19is the magnetic local time, both calculated using theeccentric dipole model (IGRF 1992.937). Thenorthern end of the 19 MLT line is the magnetic pole
N. J. Fox et al.: A multipoint study of a substorm occurring on 7 December, 1992, and its theoretical implications 1377

were associated with the substorm intensi®cation at2240 UT, and were generated by the dipolarisation inthe tail and subsequent closure of open ¯ux (Cowleyet al., 1998).
Additional information about the ionospheric ¯owand the motion of the CRB was provided by data fromthree passes across the northern polar cap by the DMSPsatellites F10 and F11. These are shown in Fig. 12. TheUT quoted on the plots corresponds to the time thesatellites were closest to the pole during each pass. Thesewere 2133 UT (Fig. 12a), corresponding to the intervaljust prior to the start of the growth phase, 2249 UT(Fig. 12b), shortly after the substorm intensi®cation,and 2314 UT (Fig. 12c), corresponding to the lateexpansion phase, prior to the commencement of recov-ery. The position of the CRBs are listed in Table 1 asdetermined from the maximum and minimum values ofthe potential, together with the local time at which theboundary was detected and the UT when the observa-tion was made. There are two passes of satellite F10 inthe Northern Hemisphere (Fig. 12a, c) which ¯ythrough the 21 MLT meridian close to the ®eld-of-viewof the Goose Bay radar. The latitudes of the 21 MLTCRB for these orbits are plotted in Fig. 10. Early in thesequence in Fig. 10, at 2130 UT (�18:30 MLT), theCRB seen by Goose Bay is at a similar latitude to thatseen at 21:17 MLT by DMSP F10. At 2309 UT F10observed the CRB at 21:16 MLT at 70.38° in theNorthern Hemisphere. The centre of the Goose Bay®eld-of-view is at 20:09 MLT at this time, i.e. thesatellite was at a meridian one hour later in MLT. Thistherefore, is consistent with the minimum latitudeestimate from the Goose Bay radar.
Turning now to the ¯ow data shown in Fig. 12, it canbe seen that the ¯ow prior to the start of the growthphase contained surprisingly large ¯ows on the night-side, possibly driven by reconnection in the distant tail.There is also evidence of an anti-clockwise vortex in thepolar cap possibly driven by lobe reconnection in thepresence of IMF By negative and Bz positive (Fig. 2). At2249 UT, as shown in Fig. 12b, the IMF had returned toalmost similar values but now the dayside ¯ows show awell-developed twin-vortex pattern. The presence ofthese strong dayside ¯ows implies that they were beingdriven by nightside reconnection and consequent pole-ward contraction of the open/closed ®eld line boundaryassociated with the substorm intensi®cation at 2240 UT.Again strong dayside ¯ows are shown in Fig. 12c, withanti-Sunward ¯ow in the polar cap. Given that the IMFBz is inferred from Fig. 2 to have been weakly negativebut with a very strong negative By at this time, these¯ows were likely to be driven by dayside reconnection asindicated by the strong eastward ¯ows near noon,together with some possible continuing contributionfrom the nightside.
Flow vectors near midnight corresponding to theperiod just prior to the growth phase (2125±2155 UT = MLT �23:55±00:25) derived from the EI-SCAT radar observations are shown in Fig. 13. Thesevectors were derived using the ``beam-splitting'' tech-nique described in Sect. 2. Note that to avoid conges-
Fig. 8a, b. Geosynchronous energetic particle data for 21 UT, 7December, 1992±01 UT, 8 December, 1992, from spacecraft 1990-095(local time = UT + 0031). a Is energetic electron data and b isenergetic proton data. The ¯ux ranges are indicated to the left of thetwo panels
Fig. 9. Derived ¯ow vectors for beam 5 of the Goose Bay radarplotted as a function of UT and invariant latitude for 22±23 UT
1378 N. J. Fox et al.: A multipoint study of a substorm occurring on 7 December, 1992, and its theoretical implications

tion, the vectors have been rotated clockwise through90° so northward ¯ows appear as vectors pointing to theright of the ®gure. At the start of the interval, the duskcell CRB is apparent as a rotation of the ¯ow fromeastward and equatorward in the poleward part of the®eld-view, to westward and equatorward in the lowerlatitude region. This reversal took place at about 72.7°invariant latitude which is in good agreement with thelocation of the CRB observed in the dusk sector at thistime by both the Goose Bay radar (Fig. 10) and theDMSP satellite F10 (Fig. 12a). After 2140 UT, how-ever, the ¯ows become variable, but predominantlyeastward until 2327 UT over the entire ®eld-of-view.The relationship of these ¯ows to the position of theopen/closed ®eld line boundary is unclear during the®rst part of this interval, but at 2250 UT the e�ects of
the substorm bulge were observed expanding polewardacross the radar beams, clearly establishing the radar®eld-of-view as being on closed ®eld lines after that time.Data for this interval are not shown as they will be thesubject of a further paper together with the detailedobservations of this poleward expansion. Subsequentlythe dawn CRB propagated equatorward across the ®eld-of-view starting at the furthest range gate at 2327 UTand reaching the nearest range gate just before 2339 UT.This established westward ¯ow across the ®eld-of-view.We interpret this motion as the equatorward relaxationof the substorm bulge in the immediate post-midnightsector, corresponding to the onset of substorm recovery.
4 Discussion
We have discussed an interval of substorm activity usingmultipoint observations encompassing a broad range oflatitude and local time in the nightside sector. Thegrowth phase appears to have been initiated by asouthward turning of the IMF which reached the noseof the magnetosphere at 2140 UT as inferred frommagnetosheath data from the Galileo spacecraft. Theproduction of open ¯ux lead to an expansion of thepolar cap which was observed as an equatorwardmotion of the CRB in the Goose Bay radar ®eld-of-view and an equatorward expansion of the SABREbackscatter band starting at about 2200 UT. A sche-matic of the ¯ow con®guration expected at this time isshown in Fig. 14, based on the theoretical models ofCowley and Lockwood (1992). The lines with arrowsshow the plasma stream lines. Those without arrowsshow the open-closed ®eld line boundary, where thesolid portion indicates the adiaroic section and thedashed portion the merging gap. The large arrowsindicate the motion of the open-closed ®eld lineboundary. The ¯ows are shown as being driven bysteady unbalanced dayside reconnection with the open/closed ®eld line boundary expanding equatorward at alllocal times. We also show the possible co-existence ofviscously-driven ¯ow cells at latitudes lower than that ofthe open/closed ®eld line boundary.
Substorm expansion phase onset occurred at 2215UT, at which time the IMF became even more strongly
Fig. 10. Graph showing the latitudinal posi-tion of the CRB deduced from consecutive``fan'' plots of Goose Bay data plotted againsttime. The latitude of the poleward UV auroralboundary is marked for Freja orbit 828 as F1and the latitude of the CRB as determinedfrom the DMSP-F10 data are denoted by solidtriangles. The times of substorm onset and thestart of enhanced poleward ¯ows detected bythe Goose Bay radar are also indicated
Fig. 11. Vectors showing direction and magnitude of the ¯ow in theionosphere deduced from the SuperDARN radar data at Goose Bay,for the scan 22:44:51±22:46:32 UT ± the time corresponding to theonset of poleward ¯ows. The fan represents the ®eld-of-view as shownin Fig. 1
N. J. Fox et al.: A multipoint study of a substorm occurring on 7 December, 1992, and its theoretical implications 1379

southward at the subsolar magnetopause for an intervalof 20 min. This initial disturbance at the IMAGE chainwas observed to be centred at 62° latitude (station PEL)and reached poleward to station SOR at 66° but wasabsent at 70° (station BJO). Since the evidence we havepresented above from both the EISCAT radar in the
midnight sector and the Goose Bay and DMSP data inthe pre-midnight sector suggest that the open/closed®eld line boundary was located poleward of 70° at thistime, this implies that the onset substorm disturbancewas con®ned to closed ®eld lines and thus did notreach the pre-existing open-closed ®eld line boundary.
Table 1. The latitudinal position of the CRB, the local time location and the UT at which it was detected are indicated in this table, forconsecutive polar passes of satellites F10 and F11 in the Northern Hemisphere
Satellite Fig. 12 UT MLT Magnetic latitude UT MLT Magnetic latitude
F10 a 21:30 21:17 71.67° 21:37 9:14 82.01°F11 b 22:44 15:51 70.22° 22:52 9:21 78.70°F10 c 23:09 21:16 70.38° 23.17 10:11 81.64°
Fig. 12a±c. Ionospheric ¯ow data from polar passes of theDMSP satellites F10 and F11 for the period 2133±2314 UT, 7December, 1992. The plots are for Northern Hemispherepasses and are arranged in chronological order regardless ofwhich satellite they represent
1380 N. J. Fox et al.: A multipoint study of a substorm occurring on 7 December, 1992, and its theoretical implications

Fig. 13a±c. The three panels show the vectors deduced fromthe EISCAT CP-4-B experiment, which represent thevelocity and direction of ¯ow in the ionosphere. The vectorsare rotated clockwise through 90° in order to reduce thecongestion of the predominantly east/west ¯ows. The panelsare for time intervals a 2125±2155 UT, b 2240±2310, and c2310±2340 UT, 7 December, 1992
N. J. Fox et al.: A multipoint study of a substorm occurring on 7 December, 1992, and its theoretical implications 1381

Although this disturbance may have involved an inter-val of reconnection in the near-Earth tail, we infer that itdid not involve the closure of open ¯ux. Consistent withthis, the CRB at Goose Bay and the backscatter band atSABRE continued to expand equatorward after onset;indeed this motion was intensi®ed after onset, presum-ably associated with the strongly enhanced negativeIMF Bz that was present during this time. The ¯owpattern is, therefore, likely to be similar to that shown inFig. 14a, except that the ¯ow speeds may be enhanced,as seen by the Goose Bay radar shown in Fig. 9. Theremay also be nightside ¯ow perturbations mainly onclosed ®eld lines associated with the dipolarisation of thetail ®eld (Cowley et al., 1998), although we have nodirect data to support this.
Despite the absence of open ¯ux closure during theinitial expansion phase, the later substorm intensi®ca-tion at 2240 UT clearly did involve substantial closureof open ¯ux. We infer that open ¯ux was closed because®rstly the magnetic disturbance reached high magneticlatitudes up to 75±77° on the IMAGE and Greenlandeast chain, latitudes that considerably exceeded that ofthe CRB at both Goose Bay and EISCAT seen prior tosubstorm expansion. Second, we observed a region ofstrong poleward ¯ow directed towards the midnightsector in the polar cap in the Goose Bay radar ®eld-of-view. A composite of the radar ¯ow observations isshown in Fig. 15, comprising vectors from both theEISCAT and Goose Bay radars at �2245 UT. Aschematic of the ¯ows occurring at this time consistentwith these observations is shown in Fig. 14b. Theseshow the presence of enhanced nightside ¯ows driven bytail reconnection consistent with the poleward ¯owsseen in the higher latitude region of the Goose Bayradar in the dusk sector. These strong ¯ows continue
Fig. 15. EISCAT and SuperDARN ¯ow vectors at 22:44:51 UT ±the time of onset of the poleward ¯ows seen at Goose Bay
Fig. 14a±c. Schematics of convection patterns and boundary motionsduring the substorm cycle described based on theoretical models ofLockwood (1990) and Cowley and Lockwood (1992). In each of thethree plots, the merging gaps are indicated by dashed lines and thelarge arrows indicate the boundary movement. a Shows the scene after2215 UT, when substorm onset signatures were detected and the IMFBz ®eld has decreased to )20 nT. Although this disturbance may haveinvolved an interval of reconnection, we infer that no open ¯ux wasclosed, and hence the polar cap area continues to expand.b Represents the ¯ows after the IMF Bz has turned northward. Alobe cell is present ± the direction of circulation determined by thenegative By ®eld. Enhanced nightside ¯ows are shown driven by tailreconnection, consistent with the poleward ¯ows detected by theGoose Bay radar at high latitudes. The strong ¯ows are seen in thedayside sector driven by the contraction of the open/closed ®eld lineboundary. c Shows the scenario during the substorm recovery phasewith the equatorward relaxation of the boundary in the midnightsector, together with the weaker poleward motions elsewhere.Asymmetric ¯ow on the dayside is present as detected by the DMSPF10 satellite (Fig. 12c)
1382 N. J. Fox et al.: A multipoint study of a substorm occurring on 7 December, 1992, and its theoretical implications

into the dayside sector driven by the contraction of theopen/closed ®eld line boundary as observed by theDMSP F11 spacecraft. The schematic also shows apossible anti-clockwise lobe cell vortex which may bedriven by the IMF By negative and Bz positive whichwas present at this time. This pattern provides a possibleexplanation of the sudden poleward motion of the CRBobserved at Goose Bay at 2305 UT. Prior to this time,the observed CRB may have been located in the viscouscell on closed ®eld lines. At 2305 UT the radar couldthen have moved into the ¯ow cell region driven bynightside reconnection such that the observed CRBwould be located much closer to the open/closed ®eldline boundary, as shown in Fig. 14b. A schematic of therecovery phase is shown in Fig. 14c which is related toequatorward relaxation motion of the boundary in themidnight sector as observed by EISCAT and weakerpoleward motions elsewhere. In addition, asymmetric¯ow is also shown as being driven on the dayside duringthis interval by open ¯ux production associated with theweaker southward IMF with By negative which wasagain present during this interval, as indicated by theDMSP data in Fig. 12c.
5 Conclusions
We have examined observations over a substorm cyclefrom a variety of data sources located over 6 h of localtime in the nightside sector. The observations from theGoose Bay and SABRE radars have enabled us toinvestigate the behaviour of the dusk convection cellwhile the EISCAT radar and IMAGE magnetometerchain simultaneously detected activity in the immediatepost-midnight sector. The onset and development of thesubstorm were monitored by the IMAGE and Green-land magnetometer chains, Pi2 data at midlatitudes, andenergetic particle data from two geosynchronous satel-lites. The IMF conditions for this interval were deter-mined by the data from the Galileo satellite in thenightside magnetosheath. There was an initial growthphase of about 30 min during which the IMF Bz
component was �)5 to 10 nT. The Bz componentsubsequently dropped to )20 nT in concert with thesubstorm expansion phase onset signatures. IMF Bz
then remained at this large negative value for another20 min until it suddenly turned to a positive valueof �20 nT. This northward turning occurred shortlybefore a substorm intensi®cation, and commencementof the CRB contraction. The recovery phase commencedat around 2340 UT.
The most important results that we have found fromour study are as follows. Firstly, the substorm onsetelectrojet was con®ned to closed ®eld lines equatorwardof the pre-existing CRBs observed by the Goose Bayand EISCAT radars. No evidence of substantial closureof open ¯ux was observed following this substorm onset.Indeed the CRB in the duskside continued to expandequatorward following onset due to the continuedpresence of strong southward IMF, such that growthand expansion phase features were simultaneously
present. Clear indications of closure of open ¯ux werenot observed until after the subsequent intensi®cation at2240 UT, i.e. more than 25 min after the initial onset.After this time, the substorm auroral bulge in thenightside hours propagated well poleward of the pre-existing CRB, and strong ¯ow perturbations wereobserved by the Goose Bay radar, indicative of ¯owsdriven by reconnection in the tail. These data thusprovide strong evidence that the closure of open ¯ux inthe tail can be delayed signi®cantly relative to the onsetof the substorm expansion phase.
Acknowledgements. NJF wishes to acknowledge the support of aNational Research Council Award. This work was supported inpart by NASA/International Solar Terrestrial Physics Missiongrants ± NAG5-7260 and NAG5-8361. The authors wish to thankthe EISCAT Association and the teams supporting the SABREand SuperDARN Goose Bay radars. GDR was supported bythe US Department of Energy O�ce of Basic Energy Research.Galileo magnetic ®eld data was kindly provided by M. G. Kivelsonand D. J. Southwood. The authors would also like to thank T. K.Yeoman, R. J. Barnes and B. Shand for their help in the produc-tion of the ®gures.
Topical Editor D. Alcayde thanks J. M. Bosqued and A. G.Yahnin for their help in evaluating this paper.
References
Akasofu, S.-I., The development of the auroral substorm, Planet.Space Sci. 12, 273±282, 1964.
Baker, D. N., P. R. Higbie, E. W. Hones Jr., and R. D. Belian,High-resolution energetic particle measurements at 6.6 RE 3.Low-energy electron anisotropies and short-term substormpredictions, J. Geophys. Res., 83, 4863, 1978.
Belian, R. D, G. R. Gisler, T. Clayton, and R. Christensen, High Zenergetic particles at geosynchronous orbit during the great solarproton event of October 1989, J. Geophys. Res., 97, 16897, 1992.
Cogger, L. L., and R. D. Elphinstone, The Viking auroral substorm,in International Conference on Substorms-1, ESA SP-335,Noordwijk, The Netherlands, 77, 1992.
Cowley, S. W. H., and M. Lockwood, Excitation and decay of solarwind-driven ¯ows in the magnetosphere-ionosphere system,Ann. Geophysicae, 10, 103, 1992.
Cowley S. W. H., H. Khan, and A. Stockton-Chalk, Plasma ¯ow inthe coupled magnetosphere-ionosphere system and its relation-ship to the substorm cycle, in Substorms-4, Eds. S. Kokubun,and Y. Kamide, Terra Academic Publishing Company/KluwerAcademic Publishers, 623, 1998.
Elphinstone, R. D., and D. J. Hearn, Mapping of the auroraldistribution during quiet times and substorm recovery, inInternational Conference on Substorms-1, ESA SP-335, No-ordwijk, The Netherlands, 13, 1992.
Freeman, M. P., J. M. Ruohoniemi, and R. A. Greenwald, Thedetermination of time-stationary two-dimensional convectionpatterns with single-station radar, J. Geophys. Res., 96, 15 735,1991.
Friis-Christensen, E., Y. Kamide, A. D. Richmond, and S. Matsu-shita, Interplanetary magnetic ®eld control of high-latitudeionospheric ®elds and currents determined from Greenlandmagnetometer data, J. Geophys. Res., 90, 1325, 1985.
Galperin, Y. I., and Y. I. Feldstein, Auroral luminosity and itsrelationship to magnetospheric plasma domains, in AuroralPhysics, Eds. C.-I. Meng, M. J. Rycroft, and L. A. Frank,Cambridge University Press, Cambridge, UK, 207, 1991.
Greenwald, R. A., K. B. Baker, R. A. Hutchins, and C. Hanusie, AnHF phased-array radar for studying small-scale structure in thehigh-latitude ionosphere, Radio Sci., 20, 63, 1985.
N. J. Fox et al.: A multipoint study of a substorm occurring on 7 December, 1992, and its theoretical implications 1383

Greenwald, R.A., K. B. Baker, J. R. Dudeney, M. Pinnock, T. B.Jones, E. C. Thomas, J. -P. Villian, J. -C. Cerisier, C. Senior, C.Hanuise, R. D. Hunsucker, G. Sofko, J. Koehler, E. Nielsen, R.Pellinen, A. D. M. Walker, N. Sato, and H. Yamgishi, DARN/SUPERDARN; a global view of the dynamics of high-latitudeconvection, Space Sci. Rev., 71, 761, 1996.
Higbie, P. R., R. D. Belian, and D. N. Baker, High-resolutionenergetic particle measurements at 6.6 RE 1, Electron micro-pulsations, J. Geophys. Res., 83, 4851, 1978.
Hones, E. W. Jr., Transient phenomena in the magnetotail andtheir relation to substorms, Space Sci. Rev., 23, 393, 1979.
Inhester, B., W. Baumjohann, R. A. Greenwald, and E. Nielson,Joint two-dimensional observations of ground magnetic andionospheric electric ®elds associated with auroral zone currents,3. Auroral zone currents during the passage of a westwardtravelling surge, J. Geophys. Res., 86, 155, 1981.
Kivelson, M. G., K. K. Khurana, J. D. Means, C. T. Russell, and R.C. Snare, The Galileo magnetic ®eld investigation, Space Sci.Rev., 60, 357, 1992.
Lester, M., O. de la BeaujardieÁ re, J. C. Foster, M. P. Freeman, H.LuÈ hr, J. M. Ruohoniemi and W. Swider, The response of thelarge scale ionospheric convection pattern to changes in theIMF and substorms: results from the SUNDIAL 1987 cam-paign, Ann. Geophysicae, 11, 11 556, 1993.
Lockwood, M., On ¯ow reversal boundaries and transpolar voltagein average models of high latitude convection, Planet. SpaceSci., 39, 397±409, 1990.
Lopez, R. E., H. E. Spence, and C.-I. Meng, Substorm aurorae andtheir connection to the inner magnetosphere, J. Geomag.Geoelectr., 44, 1251, 1992.
LuÈ hr, H., A. Aylward, S. C. Buchert, A. Pajunpaa, K. Pajunpaa, T.Holmboe, and S. M. Zalewski, Westward moving dynamicsubstorm features observed with the IMAGE magnetometernetwork and other ground-based instruments, Ann. Geophys-icae, 16, 425, 1998.
Mattin, N., and T. B. Jones, SABRE observations of F-regionvertical velocity structures, J. Atmos. Terr. Phys., 48, 625, 1986.
Maynard, N. C., W. J. Burke, G. M. Erickson, M. Nakamura, T.Mukai, S. Kokubun, T. Yamamoto, B. Jacobsen, A. Egeland, J.C. Samson, D. R. Weimer, G. D. Reeves, and H. LuÈ hr, Geotailmeasurements compared with the motions of high-latitudeauroral boundaries during two substorms, J. Geophys. Res.,102, 9553, 1997.
McPherron, R. L., Growth phase of magnetic substorms, J. Geo-phys. Res., 75, 5592, 1970.
Murphree, J. S., and L. L. Cogger, Observations of substorm onset,in International Conference on Substorms-1, ESA SP-335,Noordwijk, The Netherlands, 207, 1992.
Murphree, J. S., R. A. King, T. Payne, K. Smith, D. Reid, J. Adema,B. Gordon, and R. Wlochowicz, The Freja ultraviolet imager,Space Sci. Rev., 70, 421, 1994.
Nagai, T., M. Fujimoto, Y. Saito, S. Michida, T. Terasawa, R.Makamura, T. Yamamoto, T. Mukai, A. Nishida, and S.Kokubun, Structures and dynamics of magnetic reconnectionfor substorm onsets with Geotail observations, J. Geophys. Res.,103, 4419, 1998.
Nielsen, E., W. GuÈ ttler, E. C. Thomas, C. P. Stewart, T. B. Jones,and A. Hedberg, A new radar auroral backscatter experiment,Nature, 304, 712, 1983.
Ruohoniemi, J. M., R. A. Greenwald, K. B. Baker, J-P. Villian, andJ. Kelly, Mapping high-latitude plasma convection with coher-ent HF radars, J. Geophys. Res., 94, 13 463, 1989.
Taylor, J. R., T. K. Yeoman, M. Lester, B. A. Emery, and D. J.Knipp, Variations n the polar cap area during intervals ofsubstorm activity on March 20±21 1990 deduced from AMIEconvection patterns, Ann. Geophysicae, 14, 879, 1996.
Wilhjelm, J., and E. Friis-Christensen, Electric ®elds and high-latitude zonal currents induced by merging of ®eld lines,Geophys. Pap. R-31, Dan. Meteorol. Inst., Charlottenlund,Denmark, 1976.
Yeoman, T. K., M. Lester, D. Orr, and H. LuÈ hr, Ionosphericboundary conditions of hydromagnetic waves: The dependenceon azimuthal wave number and a case study, Planet. Space Sci.,38, 1315, 1990.
1384 N. J. Fox et al.: A multipoint study of a substorm occurring on 7 December, 1992, and its theoretical implications


