Synthesis and Properties of Partially Saturated Fluorenyl ...

University of KentuckyUKnowledge
KWRRI Research Reports Kentucky Water Resources Research Institute
1998
Solute and Bacterial Transport through Partially-Saturated Intact Soil BlocksDigital Object Identifier: https://doi.org/10.13023/kwrri.rr.204
Edmund PerfectUniversity of Kentucky
Mark S. CoyneUniversity of Kentucky, [email protected]
Michael C. SukopUniversity of Kentucky, [email protected]
Gerald R. HaszlerUniversity of Kentucky
Virgil L. QuisenberryUniversity of Kentucky
See next page for additional authors
Right click to open a feedback form in a new tab to let us know how this document benefits you.Follow this and additional works at: https://uknowledge.uky.edu/kwrri_reports
Part of the Soil Science Commons
This Report is brought to you for free and open access by the Kentucky Water Resources Research Institute at UKnowledge. It has been accepted forinclusion in KWRRI Research Reports by an authorized administrator of UKnowledge. For more information, please [email protected].
Repository CitationPerfect, Edmund; Coyne, Mark S.; Sukop, Michael C.; Haszler, Gerald R.; Quisenberry, Virgil L.; and Bejat, Ligia, "Solute andBacterial Transport through Partially-Saturated Intact Soil Blocks" (1998). KWRRI Research Reports. 5.https://uknowledge.uky.edu/kwrri_reports/5

AuthorsEdmund Perfect, Mark S. Coyne, Michael C. Sukop, Gerald R. Haszler, Virgil L. Quisenberry, and Ligia Bejat
This report is available at UKnowledge: https://uknowledge.uky.edu/kwrri_reports/5

Research Report No. 204
Solute and Bacterial Transport Through Partially-Saturated Intact Soil Blocks
by
Edmund Perfect Principal Investigator
Mark S. Coyne Co-Principal Investigator
Michael C. Sukop Graduate Assistant
Gerald R. Haszler Technician
Virgil L. Quisenberry Co-Principal Investigator
Ligia Bejat Graduate Assistant
Project Number:C-02 Agreement No.: 1434-HQ-96-GR-026T2
Period of Project:
University of Kentucky Kentucky Water Resources Research Institute
Lexington, KY 40506-0107
The work on which this report is based was supported in part by the Department of the Interior, Washington, D.C. as authorized by the Water Resources Research Act as amended in 1996 by P.L. 104-147
1998
SOLUTE AND BACTERIAL TRANSPORT THROUGH
PARTIALLY-SATURATED INTACT SOIL BLOCKS
Project Number:
Agreement Number:
Period of Project:
by
Edmund Perfect Principal Investigator
Mark S. Coyne Co-Principal Investigator
Michael C. Sukop Graduate Student
Gerald R. Haszler Technician
Virgil L. Quisenberry Co-Principal Investigator
Ligia Bejat Graduate Student
Water Resources Research Institute University of Kentucky
Lexington, KY
The work upon which this report is based was supported in part by funds provided by the United States Department
of the Interior, Washington, D. C. as authorized by the Water Resources Research Act of P.L. 101-3 97
DRAFT May 1998

Abstract
Steady-state transport of water, chloride and bacteria was measured through intact blocks of
Maury and Cecil soils, under partially saturated conditions. Major objectives were to determine
if transport occurs uniformly or via preferential flow paths, and if soil physical properties could
be used to predict breakthrough. The blocks were instrumented with TDR probes and mounted
on a vacuum chamber containing 100 cells that collected eflluent. After each experiment the
blocks were sampled for soil physical properties. The fluxes showed no spatial autocorrelation
and the eflluent variance was not statistically different between soils. Less than 3% of the
influent bacteria appeared in the effluent. Maximum bacterial breakthrough occurred after 0.25
water-filled pore volumes had been leached, and was greater for Cecil soil than for Maury soil.
The chloride breakthrough curves were fitted to the convection dispersion equation. The best
predictor of dispersivity was volumetric water content (R2 = 0.28, P<0.01 ), with dispersivity
increasing with decreasing water content. Lower water contents lead to more tortuous flow paths
and thus, a broadening of the velocity distribution. Soil structural controls on solute dispersion
under partially saturated conditions are likely to be indirect, and related to differences in water
content at given flux produced by differences in pore-size distribution.
Focus Categories: ST, NPP, AG
Keywords: Solute Transport, Contaminant Transport, Agriculture, Bacteria, Groundwater
Quality, Leaching, Unsaturated Flow, Water Quality
111

Acknowledgements
Professor R.L. Blevins allowed us to sample his tillage plots at the 'Maury soil' field site. Steve
McMurry supervised the block sampling and managed data collection during the early phase of
this project. The following undergraduate students assisted with data collection: Dan Patterson,
Danny Saylor, Scott VanSickle, and Rick Xedos.
IV

Table of Contents
I - Introduction ········································································································ 1
Objectives .......................................................................................................... 1
Previous Studies ............................................................................................... 2
II - Research Procedures .......................................................................... 5
Field Sites and Soil Block Extraction .............................................................. 5
Laboratory Apparatus ...................................................................................... 6
Effluent Collection Chamber ...................................................................... 6
Rainfall Simulator ..................................................................................... 7
Time-domain Reflectometry ..................................................................... 8
Soil Block Operation .......................................................................................... 9
Parameterization of Chloride Breakthrough Curves .................................... . 12
Soil Water Retention Measurements .............................................................. 14
Saturated Hydraulic Conductivity Measurements ....................................... . 14
Ill - Results and Discussion .............................................................................. 14
Soil Physical Properties ................................................................................. 14
Bulk Density ............................................................................................ 14
Soil Water Retention ............................................................................... 15
Saturated Hydraulic Conductivity ............................................................ 17
Volumetric Water Contents ............................................................................. 18
Water Fluxes .................................................................................................... 20
Effluent Breakthrough Curves ........................................................................ 23
V
TDR Breakthrough Curves .............................................................................. 26
Fecal Coliforms ................................................................................................ 31
Potential Sources of Error ............................................................................... 34
Rainfall Simulator Variability .................................................................... 34
Phase-barrier Contact ............................................................................ 36
IV - Summary and Conclusions ....................................................................... 37
V- References ....................................................................................................... .42
VI
List of Tables
Table 1. Selected Soil Properties for the Untilled Soils
Table 2. Water Fluxes for the Different Soil Blocks
Table 3. Influent Concentrations of Fecal Coliforms for the Different Soil Blocks
Table 4. Soil Bulk Densities for the Different Soil Blocks as a Function of Depth
Table 5. Water Retention Parameters for the Different Blocks as a Function of Depth
Table 6. Saturated Hydraulic Conductivities for the Different Soil Blocks
Table 7. Volumetric Water Contents for the Different Blocks as a Function of Depth
Table 8. Descriptive Statistics for the Individual Cell Fluxes
Table 9. Dispersivities and Column Peclet Numbers from Effluent Breakthrough Curves
Table 10. Dispersivities and Column Peclet Numbers from TDR Probe Data
Vil

List of Illustrations
Figure 1. Typical TOR Waveforms for a Step Increase in Solute Concentration
Figure 2. Volumetric Water Content as a Function of Time for Cecil Sod Block #1
Figure 3. Mean Volumetric Water Contents for the Different Treatments: Maury Soil
Figure 4. A Typical Indicator Variogram for the Spatial Distribution of Effluent Fluxes
Figure 5. Temporal Changes in the Spatial Distribution of Fluxes (Maury Till Block #3)
Figure 6. Effluent Chloride Breakthrough Curves for the Maury Soil
Figure 7. Effluent Breakthrough Curves for the Cecil Soil
Figure 8. Typical TOR Breakthrough Curves for Maury soil (Sod Block #1)
Figure 9. Effect of Volumetric Water Content on Dispersivity for TOR Data
Figure 10. Bacterial Breakthrough Curves for the Maury Soil
Figure 11. Bacterial Breakthrough Curves for the Cecil Soil
vm

INTRODUCTION
Objectives
Agriculture is often perceived as a major non-point source of surface and groundwater pollution.
Predicting transport processes within the unsaturated (vadose) zone underlying agricultural fields
is essential to investigating agriculture's role in non-point source pollution. Agricultural
chemicals, fertilizers, and manure applied to the land that are not taken up by plants, broken
down, volatilized, or lost in runoff must pass through this zone to reach groundwater. However,
current models to predict solute and bacterial transport processes within the vadose zone are
unsatisfactory because they were developed without regard for soil structure.
Determination of transport properties generally requires empirical measurement of the transport
process itself This study combined measurements of both soil structural properties and transport
processes in order to investigate methods of predicting transport properties independently.
Solute and bacterial transport was measured through relatively large (approximately lcubic foot)
undisturbed soil blocks under unsaturated conditions. The main objectives of the study were to
examme:
• if water, chloride (a non-interacting chemical), and bacteria would elute through partially
saturated, intact soil blocks uniformly or via preferential flow paths;
• if preferential paths were stable with time; and
• if tillage management practices affected either the speed or pattern of water flow through
intact, unsaturated soil.
1

Additional objectives included the quantification of bacterial transport through the soil blocks
and description of the displacement of adsorbed and/or entrapped bacteria by successive
infiltration events. A secondary objective was to relate soil structural properties within the soil
blocks to transport processes using fractal, statistical (pedotransfer functions) and geostatistical
analyses. The fractal analyses were not performed because it proved impossible to collect water
retention data over a sufficiently wide range of tensions to justify the use of fractal models to
parameterize these data.
Previous Studies
Mass transfer of an input solution will be influenced by dispersion and adsorption phenomena.
The dispersion of a non-reactive solute can be related to soil structural form and water content
(Seyfried and Rao, 1987). The initial conditions are also an important determinant of the degree
of dispersion that takes place (Kluitenberg and Horton, 1990). Poletika and Jury (1994) suggest
two processes by which solutes and water move through structured soil:
(i) lateral movement and redistribution of the input solution on the soil surface so that some
areas of the soil have higher than average solution flow moving through them;
(ii) movement through macropores.
Macroporosity, the fraction of soil volume occupied by large pores, is an important structural
property in relation to solute and fecal pathogen transport. Macropores exist because of natural
structure, old root channels, and insect and animal burrows. They can be defined as pores with
equivalent cylindrical diameters (ECD's) 2 0.075-1.0 mm (Luxmore el al., 1990). Macropores
promote rapid, preferential water, solute and microorganism flow through the vadose zone.
2
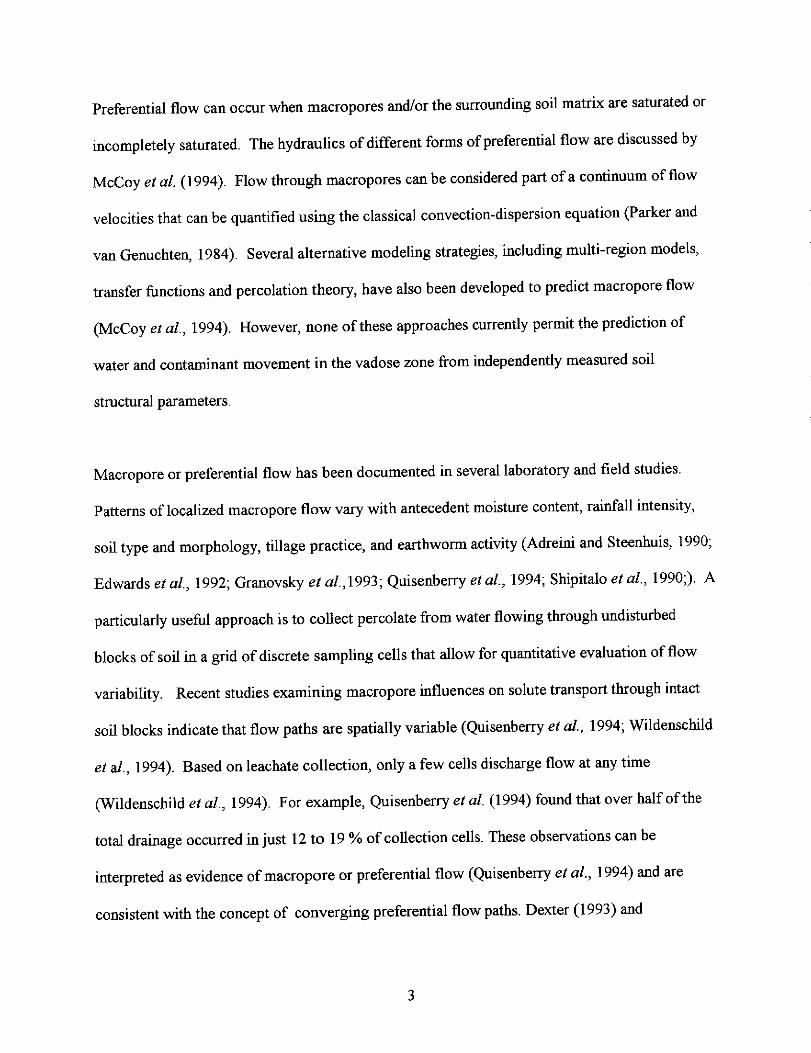
Preferential flow can occur when macropores and/or the surrounding soil matrix are saturated or
incompletely saturated. The hydraulics of different forms of preferential flow are discussed by
McCoy et al. (1994). Flow through macropores can be considered part of a continuum of flow
velocities that can be quantified using the classical convection-dispersion equation (Parker and
van Genuchten, 1984). Several alternative modeling strategies, including multi-region models,
transfer functions and percolation theory, have also been developed to predict macropore flow
(McCoy et al., 1994). However, none of these approaches currently permit the prediction of
water and contaminant movement in the vadose zone from independently measured soil
structural parameters.
Macropore or preferential flow has been documented in several laboratory and field studies.
Patterns of localized macropore flow vary with antecedent moisture content, rainfall intensity,
soil type and morphology, tillage practice, and earthworm activity (Adreini and Steenhuis, 1990;
Edwards et al., 1992; Granovsky et al., 1993; Quisenberry et al., 1994; Shipitalo et al., 1990;). A
particularly useful approach is to collect percolate from water flowing through undisturbed
blocks of soil in a grid of discrete sampling cells that allow for quantitative evaluation of flow
variability. Recent studies examining macropore influences on solute transport through intact
soil blocks indicate that flow paths are spatially variable (Quisenberry et al., 1994; Wildenschild
et al., 1994). Based on leachate collection, only a few cells discharge flow at any time
(Wildenschild et al., 1994). For example, Quisenberry et al. (1994) found that over half of the
total drainage occurred in just 12 to 19 % of collection cells. These observations can be
interpreted as evidence of macropore or preferential flow (Quisenberry et al., 1994) and are
consistent with the concept of converging preferential flow paths. Dexter (1993) and
3

Wildenschild et al. (1994) have postulated that random, independent flow paths eventually
converge with increasing depth into a few preferential flow channels.
There is little documentation to suggest whether preferential flow paths are static or dynamic.
For any given leaching event, surface contaminants could elute from constantly changing sites in
the soil profile. Flow path stability may be related to soil structural stability. The stability of a
soil's structure is the ability of the soil to retain its arrangement of solid and void spaces when
exposed to different stresses (Kay, 1990). Flowing water represents an applied stress. Swelling,
slaking, and clay dispersion are hydraulically mediated physical processes that are associated
with structural breakdown. Changes in structural form due to these processes can cause changes
in hydraulic conductivity and the spatial distribution of flow paths over time (Reeve, 1953).
Tillage practices also influence soil structure and transport processes. Drees et al. (1994) studied
the micro-morphological characteristics of conventional- and no-till soils, and observed
differences in the size, shape, and arrangement of both pores and aggregates. Tillage destroys
the natural pore structure of surface soils, disrupting macropore continuity, and reducing the
extent of bypass flow. Increased infiltration rates in no-till fields have been attributed to the
greater number and continuity of macropores in the surface layer compared to moldboard plowed
soils (Edwards et al., 1988; Dick et al., 1989). Andreini and Steenhuis (1990) showed that the
entire profile of undisturbed soil blocks can be short-circuited by preferential flow in no-till,
while solutes must pass through a mixed, unstructured plow layer before bypass flow can occur
in conventional-till. Crop residues associated with various conservation tillage practices can also
effect the leaching of surface applied chemicals (Green et al., 1995). Reduced macropore flow
4
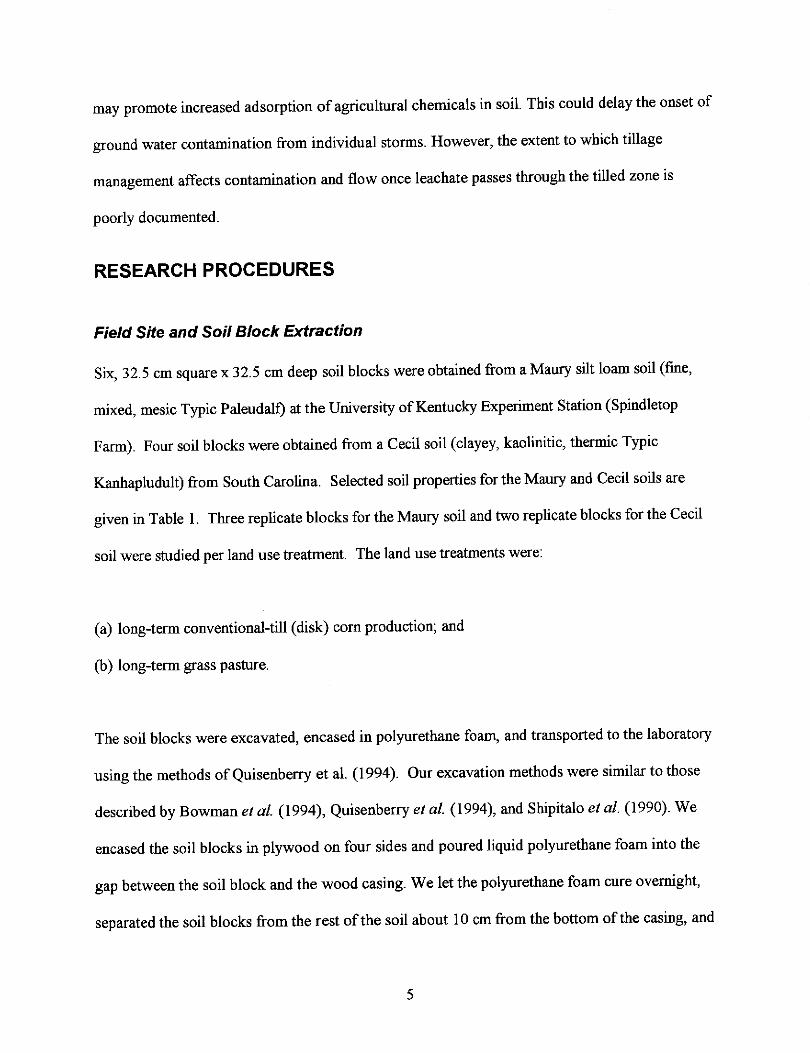
may promote increased adsorption of agricultural chemicals in soil. This could delay the onset of
ground water contamination from individual storms. However, the extent to which tillage
management affects contamination and flow once leachate passes through the tilled zone is
poorly documented.
RESEARCH PROCEDURES
Field Site and Soil Block Extraction
Six, 32.5 cm square x 32.5 cm deep soil blocks were obtained from a Maury silt loam soil (fine,
mixed, mesic Typic Paleudalf) at the University of Kentucky Experiment Station (Spindletop
Farm). Four soil blocks were obtained from a Cecil soil ( clayey, kaolinitic, thermic Typic
Kanhapludult) from South Carolina. Selected soil properties for the Maury and Cecil soils are
given in Table I. Three replicate blocks for the Maury soil and two replicate blocks for the Cecil
soil were studied per land use treatment. The land use treatments were:
(a) long-term conventional-till (disk) corn production; and
(b) long-term grass pasture.
The soil blocks were excavated, encased in polyurethane foam, and transported to the laboratory
using the methods of Quisenberry et al. (I 994). Our excavation methods were similar to those
described by Bowman el al. (1994), Quisenberry et al. (1994), and Shipitalo el al. (1990). We
encased the soil blocks in plywood on four sides and poured liquid polyurethane foam into the
gap between the soil block and the wood casing. We let the polyurethane foam cure overnight,
separated the soil blocks from the rest of the soil about 10 cm from the bottom of the casing, and
5
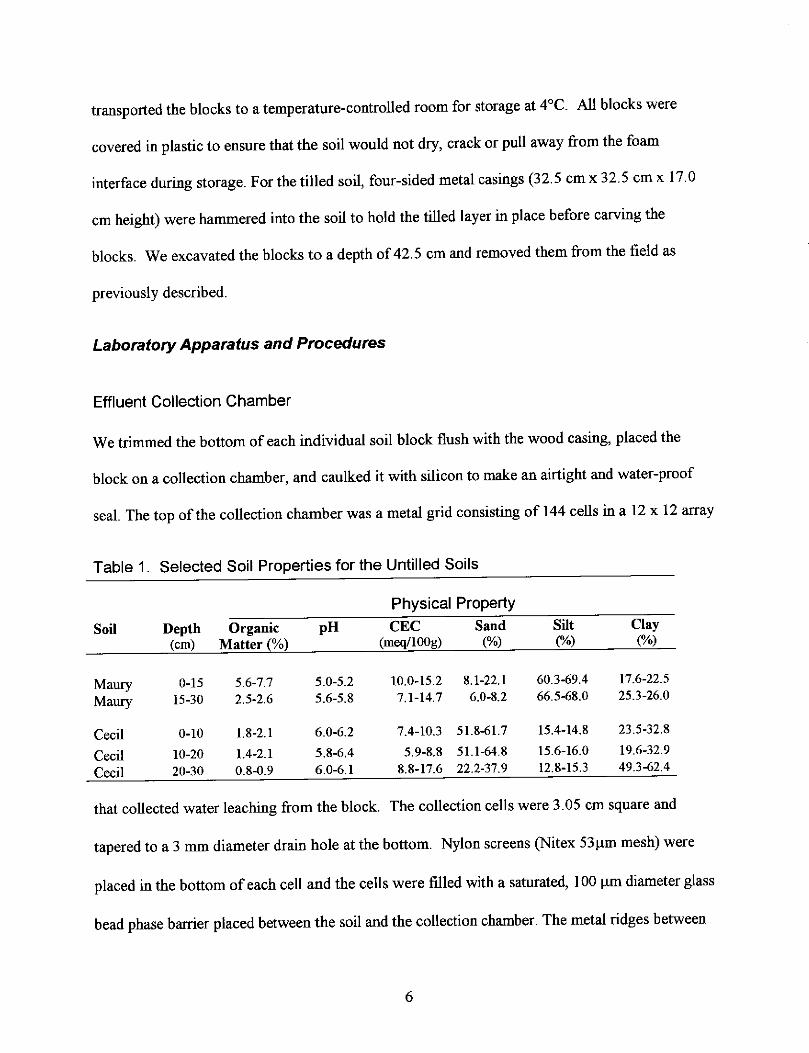
transported the blocks to a temperature-controlled room for storage at 4°C. All blocks were
covered in plastic to ensure that the soil would not dry, crack or pull away from the foam
interface during storage. For the tilled soil, four-sided metal casings (32.5 cm x 32.5 cm x 17.0
cm height) were hammered into the soil to hold the tilled layer in place before carving the
blocks. We excavated the blocks to a depth of 42.5 cm and removed them from the field as
previously described.
Laboratory Apparatus and Procedures
Effluent Collection Chamber
We trimmed the bottom of each individual soil block flush with the wood casing, placed the
block on a collection chamber, and caulked it with silicon to make an airtight and water-proof
seal. The top of the collection chamber was a metal grid consisting of 144 cells in a 12 x 12 array
Table 1. Selected Soil Properties for the Untilled Soils
Physical Property
Soil Depth Organic pH CEC Sand Silt Clay (cm) Matter(%) (meq/lO0g) (%) (%) (%)
Maury 0-15 5.6-7.7 5.0-5.2 10.0-15.2 8.1-22.1 60.3-69.4 17.6-22.5
Maury 15-30 2.5-2.6 5.6-5.8 7.1-14.7 6.0-8.2 66.5-68.0 25.3-26.0
Cecil 0-10 1.8-2.1 6.0-6.2 7.4-10.3 51.8-61.7 15.4-14.8 23.5-32.8
Cecil 10-20 1.4-2.1 5.8-6.4 5.9-8.8 51.1-64.8 15.6-16.0 19.6-32.9
Cecil 20-30 0.8-0.9 6.0-6.1 8.8-17.6 22.2-37.9 12.8-15.3 49.3-62.4
that collected water leaching from the block. The collection cells were 3.05 cm square and
tapered to a 3 mm diameter drain hole at the bottom. Nylon screens (Nitex 53µm mesh) were
placed in the bottom of each cell and the cells were filled with a saturated, 100 µm diameter glass
bead phase barrier placed between the soil and the collection chamber. The metal ridges between
6
each cell are intended to cut slightly into the bottom of the soil block and it was assumed that this
prevents lateral flow between cells at the bottom of the soil block.
The outermost row of cells collected the outflow from the soil-foam interface. All results here
are based on eflluent collected from only the 100 innermost collection cells. Therefore, any
possible effects of edge flow were minimized.
Plastic trays held 100 plastic centrifuge tubes (50 mL volume) beneath the drain holes of the
collection cells to collect soil block drainage and the drainage from the outermost row of cells.
The procedures for installing a soil block on this collection chamber are described in greater
detail by Quisenberry et al. ( 1994).
A -2. 0 kPa vacuum was applied to the lower boundary of each soil block via the collection
chamber (Phillips et al., 1995). This vacuum should have drained all pores greater than 0.15
mm in diameter based on the capillary equation (Danielson and Sutherland, 1986).
Rainfall Simulator
Simulated rainfall was applied to the top of each block at a target rate of 1 cm hr"1 (1056 mL h· 1l.
The simulator was a square reservoir, 32 x 32 x 5 cm, constructed of acrylic plastic 0.32 cm
thick. It was positioned 20 cm above the soil block. One hundred hypodermic needles, 0.25 mm
in diameter (25 gauge), were connected to the bottom of the applicator at positions
corresponding with the centers of the 100 inner most collection cells of the bottom collection
chamber (Quisenberry et al., 1994). Rainfall was simulated by pumping leachate solution (0.003
7
M CaSO4) into the sealed reservoir and through the tip of each hypodermic needle with a
peristaltic pump.
Time-Domain Reflectometry
Time-domain reflectometry (TOR) has recently been applied to monitor soil water contents and
solute transport in structured soils. Using TOR, a step voltage change is propagated along a
transmission line in a dielectric medium. The waveform of the step pulse, reproduced by means of
a high-frequency oscilloscope, is then analyzed to estimate the dielectrical properties of the
material along the transmission line.
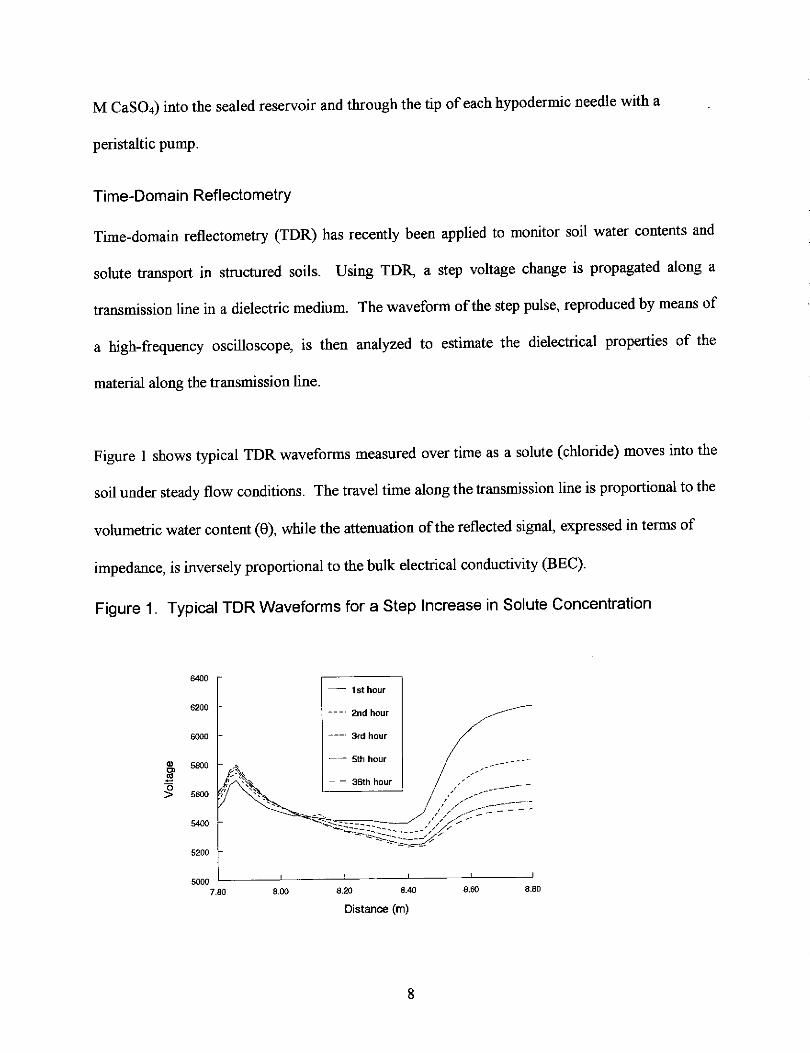
Figure I shows typical TOR waveforms measured over time as a solute (chloride) moves into the
soil under steady flow conditions. The travel time along the transmission line is proportional to the
volumetric water content (0), while the attenuation of the reflected signal, expressed in terms of
impedance, is inversely proportional to the bulk electrical conductivity (BEC).
Figure 1. Typical TOR Waveforms for a Step Increase in Solute Concentration
6400
6200
6000
., 5000
l" N' ~·~
a '~ > 5600 /I '~ , '
6400
5200
5000 7.80 8.00
~ 1st hour
---· 2nd hour
---· 3rd hour
--- 5th hour
- - 36th hour
8.20 8.40
Distance (m)
8
8.60 8.80

By measuring the changes in BEC that occur over time in response to a step change in solute
concentration, it is possible to obtain the solute BTC (Bowman et al., 1994; Kachanoski et al.,
1992). The TDR method is rapid and non-destructive; it has the advantage that water content is
measured simultaneously at the same location where the BTC is determined. Furthermore,
hardware and software are readily available for automated TDR sampling over time at multiple
locations and/or depths.
Each soil block was instrumented with 20-cm long TDR wave guides installed horizontally at the
5, 15 and 25 cm depths. The wave guides were connected to a Tektronix 1502C cable tester via a
multiplexer. The cable tester was connected to a laptop computer using an RS-232 serial port.
Data were collected automatically and the waveforms were analyzed for volumetric water content
and bulk electrical conductivity using software developed by Wraith et al. (1993).
Soil Block Operations
The rainfall simulator was regulated to give a target water flux of 1 cm/hr. However, the
measured fluxes varied from block to block. The measured fluxes for each block are given in
Table 2. When a steady flow was achieved, the water supply was changed to 0.03 M KC! to
produce a step increase in solute concentration. Each experiment lasted 36 hours. Fifteen trays
of effiuent were collected: 11 trays of 50 mL-tubes collecting effiuent from individual drain
holes alternated with 4 'bulk' trays (all leachate collected en mass). The bulk trays collected the
drainage water at the end of hour's: 12, 20, 24, and 32; two subsamples were taken to determine
the chloride concentration. The tube trays were changed at the end of each hour, except trays 5, 7,
and 15, which were run for a four-hour period. The trays with tubes were checked regularly for
cells with high flow and tubes were replaced once full.
9

Table 2. Water Fluxes for the Different Soil Blocks
Soil Treatment Rep Flux (cm hr1) t
Maury Tillage 1 0.907
Maury Tillage 2 0.917
Maury Tillage 3 0.940
Maury Sod 1 0.715
Maury Sod 2 0.650
Maury Sod 3 0.913
Cecil Tillage 1 0.79
Cecil Tillage 2 0.76
Cecil Sod 1 0.91
Cecil Sod 2 0.76
t Averaged over 36 hours
The 50-mL tubes were weighed to determine leachate volume in each cell. Tubes that contained
more than 5 mL of leachate were stored at 4 °C and the er and fecal coliform concentrations
were measured within 48 h. Subsamples were also taken from the input solution reservoir every
time a tray was changed and were included with the er and bacterial analyses. The chloride
concentration (mg/I) was measured using a Bio-Tech EL-311 microplate autoreader by the
automated ferricyanide method (APHA, 1989). The relative chloride concentration (C/Co) in
each tube was determined by dividing the concentration of the effiuent chloride (C) by the
concentration of the influent chloride (Co).
Two Escherichia coli strains (ATCC 27662 and 25254) were used as model pathogen species.
The strains were labeled with antibiotic resistant markers to permit separate quantification. Each
strain was added to the reservoir feeding the rain simulator at rates exceeding 106 CFU m1,- l _
ATCC 27662 (nalidixic acid resistant) was added at the initiation of the experiment and ATCC
25254 (streptomycin resistant) was added 24 hours later to determine whether the newly
introduced strain would displace bacteria adsorbed to the soil.
10
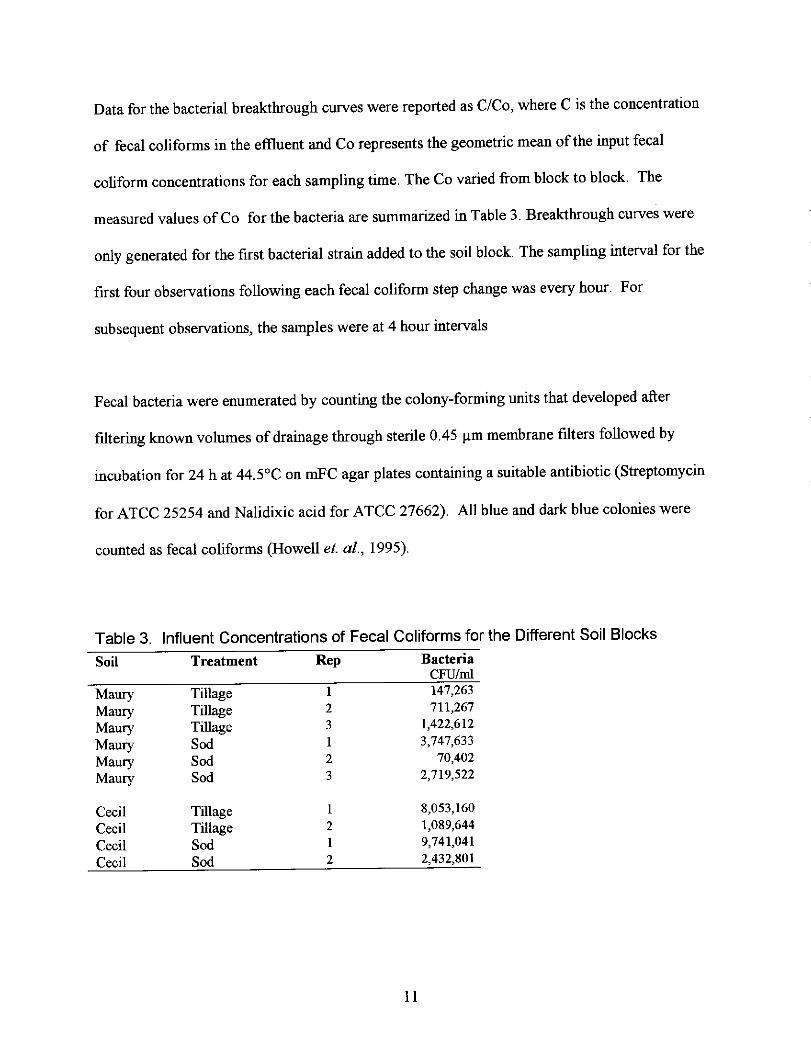
Data for the bacterial breakthrough curves were reported as C/Co, where C is the concentration
of fecal coli forms in the effluent and Co represents the geometric mean of the input fecal
coliform concentrations for each sampling time. The Co varied from block to block. The
measured values of Co for the bacteria are summarized in Table 3. Breakthrough curves were
only generated for the first bacterial strain added to the soil block. The sampling interval for the
first four observations following each fecal coliform step change was every hour. For
subsequent observations, the samples were at 4 hour intervals
Fecal bacteria were enumerated by counting the colony-forming units that developed after
filtering known volumes of drainage through sterile 0.45 µm membrane filters followed by
incubation for 24 hat 44.5°C on mFC agar plates containing a suitable antibiotic (Streptomycin
for ATCC 25254 and Nalidix:ic acid for ATCC 27662). All blue and dark blue colonies were
counted as fecal coliforms (Howell et. al., 1995).
Table 3. Influent Concentrations of Fecal Coliforms for the Different Soil Blocks
Soil Treatment Rep Bacteria CFU/ml
Maury Tillage I 147,263
Maury Tillage 2 711,267
Maury Tillage 3 1,422,612
Maury Sod I 3,747,633
Maury Sod 2 70,402
Maury Sod 3 2,719,522
Cecil Tillage I 8,053,160
Cecil Tillage 2 1,089,644
Cecil Sod I 9,741,041
Cecil Sod 2 2,432,801
11

Parameterization of Chloride Breakthrough Curves
The objectives of this procedure were to measure BTC's for a non-reactive solute (chloride) in
large undisturbed soil blocks using TOR, to parameterize these BTC's using the convection
dispersion equation (CDE), and to investigate the effects ofland use, soil properties, and depth on
the resulting parameters.
Once the BTC data were obtained, they were parameterized using the CDE. For the transport of
chloride, the principal parameters of the CDE are the dispersion coefficient (D) and the average
pore water velocity (v). The D characterizes the spread of solute velocities. These parameters are
often combined to give the dispersivity (a), defined as a=D/v. The dispersivity is a property of the
porous medium and its state - especially its water content for unsaturated systems.
In our case, the flux ( q) of water through the soil blocks was known from effluent volume
measurements and the volumetric water content (0) was known from the TDR measurements. The
average pore water velocity is the flux divided by the water content (v = q/0). Thus, the dispersion
coefficient is the only unknown parameter in the CDE.
The CXTFIT solute transport model (Parker and van Genuchten, 1984; Toride et. al., 1995) was
used to estimate the solute dispersion characteristics of the soil blocks. CXTFIT has an inverse
capability that can estimate the dispersion coefficient ( and other transport parameters when
necessary) from the observed results of a solute transport experiment. The program uses a non
linear least squares fitting procedure to optimize the fit between the observed data and the
convection dispersion equation.
12
A principal limitation to the use of CXTFIT for the analysis of the soil block data is that the soils
are known to be layered (Table I). CXTFIT does not consider multi-layered soils. Other models
can simulate solute transport in multi-layered systems, and could be used inversely. However, it
is likely that non-unique parameter estimates would be obtained from such a procedure. Because
of this layering, the estimates of dispersivity for the 15 and 25 cm depths in soil blocks may be
biased by the transport properties of the overlying horizons.
For the analysis of the data collected during this project, concentrations as a function of time and
depth determined from TDR measurements were used as input to the CXTFIT model. Additional
analyses were carried out on the soil block eflluent. The solute dispersion coefficient was the only
transport parameter estimated. Coefficients of determination (R2) for the fits were generally
greater than 0.9.
For the Maury soil blocks, soil BEC as measured by the TDR probes was normalized with respect
to the maximum BEC. This is appropriate when the infiltrating solution completely displaces all
solution previously held in the porous medium, at least to the depth of the TDR probe.
For the Cecil soil, breakthrough was incomplete and raw BEC values were used in the model. The
maximum BEC and the dispersion coefficient were both estimated in this case. Numerous CXTFIT
runs with different estimated maximum BEC values were made. The best estimate of the
maximum BEC was selected from the run yielding the largest R 2 value for the fit.
13

Soil Water Retention Measurements
After each experiment, the soil blocks were drained overnight, removed from the collection
chamber and triplicate soil cores were taken at the 5, 15, and 25-cm depth. These cores were
used to determine the bulk density and the soil water retention (drying) curve (Klute, 1986).
Tempe cells were used to collect the retention data between tensions of 0 and 3 kPa, and a
pressure plate apparatus was used to collect the corresponding data between 3 and 1500 kPa
(Klute, 1986). Total porosity was calculated from the bulk density data assuming a particle
density of2.65 g/cm3. The soil water retention curves were parameterized using the empirical
model developed by Campbell (1974). The estimated parameters in this model are \Jfa, the air
entry value, and b, the pore-size distribution index. Coefficients of determination (R2) for the fits
ranged from 0.77 to 0.99.
Saturated Hydraulic Conductivity Measurements
The cores were also used to determine saturated hydraulic conductivity (K..,). These
measurements were carried out using the constant head method, as described in Klute and
Dirksen (1986).
RESULTS AND DISCUSSION
Soil Physical Properties
Bulk Density
The soil bulk density data are summarized in Table 4. Analysis of variance of these data
revealed significant land use, depth and land use by depth interaction effects for the Maury soil.
14

Table 4. Soil Bulk Densities for the Different Soil Blocks as a Function of Depth
Soil Treatment Re)! Bulk Density (ll!:cm' ) I (depth, cm)
5 15 25
Maury Tillage 1 1.04 1.30 1.27
Maury Tillage 2 1.00 1.35 1.44
Maury Tillage 3 1.01 1.27 1.34
Maury Sod 1 1.17 1.38 1.28
Maury Sod 2 1.20 1.34 1.41
Maury Sod 3 1.15 1.32 1.32
Cecil Tillage 1 1.34 1.58 1.33
Cecil Tillage 2 1.43 1.68 1.67
Cecil Sod 1 1.19 1.63 1.20
Cecil Sod 2 1.57 1.60 1.47
t Means of3 subsamples
The ANOVA R2 value was 0.75 and the coefficient of variation was 6.0%. This analysis showed
that the surface bulk density in the tilled soil was significantly (P<0.05) lower than that for the
sod-covered treatment, with little or no differences between the treatments at the other depths.
This result is probably attributable to soil loosening caused by the tillage operations that were
performed before sampling.
In contrast, a similar analysis of variance for the Cecil soil revealed no effect of land use
treatment, only an effect of depth, with the bulk density at 15 cm significantly (P<0.05) higher
than at either 5 or 25 cm. The R2 value for this analysis was 0.39, and the coefficient of
variation was 10.8%.
Soil Water Retention
The parameters from fitting the Campbell (1974) equation to the soil water retention data, \Ila and
b, are summarized in Table 5. The estimates of\j/. were highly variable, and analysis of variance
15

Table 5. Water Retention Parameters for the Different Blocks as a Function of Depth
Soil Treatment Rep IJ' (kPa)t bt
(depth, cm)
5 15 25 5 15 25
Maury Tillage 1 0.06 0.21 0.19 8.66 12.44 11.46
Maury Tillage 2 0.06 0.54 1.66 8.92 11.86 14.02
Maury Tillage 3 0.11 0.32 1.60 8.79 12.40 12.70
Maury Sod 1 0.16 0.71 0.26 14.52 13.74 10.23
Maury Sod 2 0.72 0.53 0.88 12.04 12.59 15.5
Maury Sod 3 0.12 0.39 0.37 14.22 13.69 12.31
Cecil Tillage 1 0.47 0.39 0.41 5.45 10.01 15.75
Cecil Tillage 2 0.37 0.17 2.13 5.13 8.25 18.08
Cecil Sod 1 0.08 0.77 0.28 7.01 13.10 12.36
Cecil Sod 2 0.09 0.08 0.29 9.42 7.76 17.47
t Means of 3 subsamples
was only able to explain 27% of the total variation. The only significant effects were depth and
the land use by depth interaction; both effects were independent of soil type. These effects
indicate that the air entry value greatly increased with increasing depth for the tilled blocks, but
increased only slightly with increasing depth for the sod covered blocks (Table 5). This trend
may be due to loosening of the surface soil and/or subsurface compaction (i.e. a plow pan) in the
tilled blocks as compared to the sod covered blocks.
In contrast to 'I/a , the b parameter was much more predictable. The b parameter is an indicator
of pore size distribution; for large values ofb, small pores dominate the total porosity, and vice
versa. Soil, land use, depth, soil by depth interaction and the land use by depth interaction were
all significant factors influencing b at P<0.05. The R2 for this analysis of variance was 0.60 and
the coefficient of variation was 21%. For the Maury soil, the b value increased with increasing
depth for the tilled soil, but was relatively constant with depth for the sod treatment (Table 5).
For the Cecil soil, b increased with increasing depth in both treatments. However, this increase
was more pronounced in the tilled blocks as compared to the sod blocks (Table 5).
16

Saturated Hydraulic Conductivity
Saturated hydraulic conductivity (Ksa1) data were collected at each depth for sod block# 3 and
tilled block #3 of the Maury soil and for the four Cecil soil blocks (Table 6). Because of the
large number of missing values it was not possible to conduct an analysis of variance on these
data. However, the data for the Maury soil indicate that the tilled block had higher surface Ks.,
values than the sod covered soil. The land use effect was much less pronounced for the Cecil
soil, which generally appeared to have decreasing K,.1 values with increasing depth regardless of
management history. This can probably be attributed to the marked increase in clay content with
depth for this soil (Table I).
Table 6. Saturated Hydraulic Conductivities for the Different Soil Blocks
Maury Soil Ksat (m s·1) Cecil Soil Ks., (ms1
)
Sod #1 Sod #1 5cm X 5 cm 0.2lx10·2
15 cm X 15cm 0.50x!0-3
25 cm X 25cm 0.13x10·2
Sod #2 Sod#2 5cm X 5cm 0.34xl0-2
15 cm X 15 cm 0.24x10·2
25cm X 25cm X
Sod#3 Till #1 5cm 0.27x!0-3 5cm 0.13xl0-2
15 cm 0.88xl0·3 15 cm 0.25x10·2
25 cm 0.80xl0-4 25cm 0.l6xl0·2
Till# 1 Till #2 5cm X 5cm 0.48xl0·2
15 cm X 15 cm 0.29x10·2
25 cm X 25cm 0.36x!0-3
Till #2 5cm X
15 cm X
25 cm X
Till #3 5cm 0.76xl0·2
15 cm 0.28x10·2
25 cm 0.80x!O·'
X=not measured
17
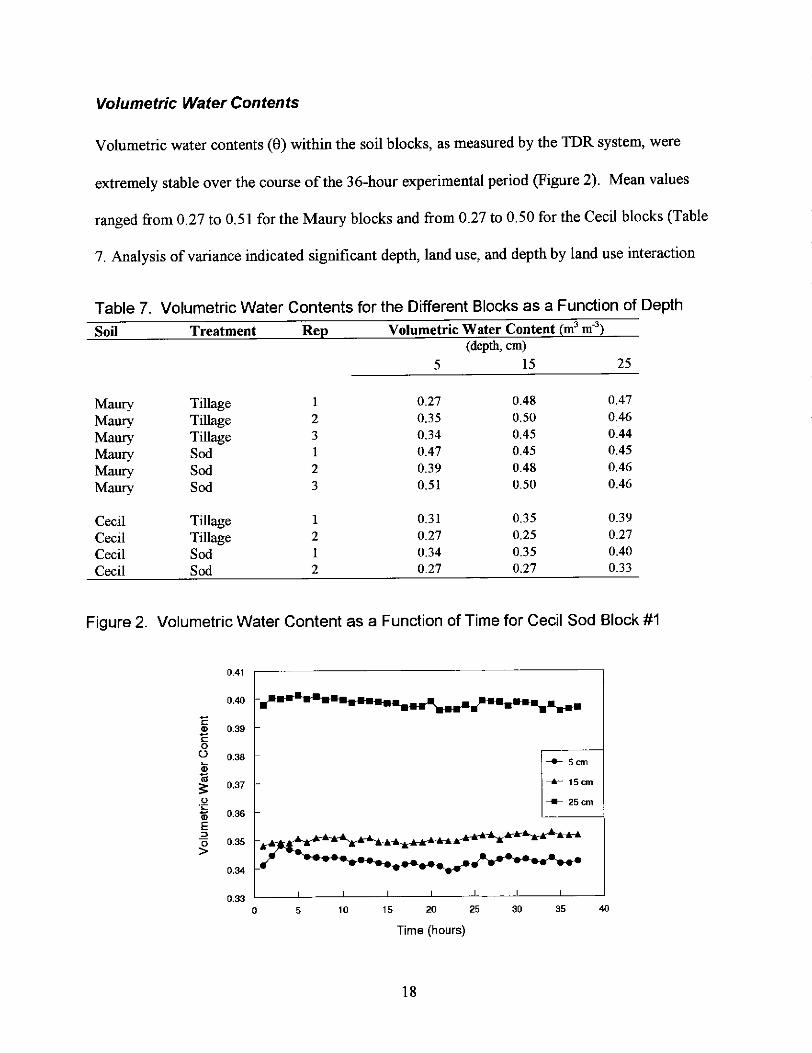
Volumetric Water Contents
Volumetric water contents (0) within the soil blocks, as measured by the TDR system, were
extremely stable over the course of the 36-hour experimental period (Figure 2). Mean values
ranged from 0.27 to 0.51 for the Maury blocks and from 0.27 to 0.50 for the Cecil blocks (Table
7. Analysis of variance indicated significant depth, land use, and depth by land use interaction
Table 7. Volumetric Water Contents for the Different Blocks as a Function of Depth
Soil Treatment Re~ Volumetric Water Content (m' m·') (depth, cm)
5 15 25
Maury Tillage 1 0.27 0.48 0.47
Maury Tillage 2 0.35 0.50 0.46
Maury Tillage 3 0.34 0.45 0.44
Maury Sod 1 0.47 0.45 0.45
Maury Sod 2 0.39 0.48 0.46
Maury Sod 3 0.51 0.50 0.46
Cecil Tillage 1 0.31 0.35 0.39
Cecil Tillage 2 0.27 0.25 0.27
Cecil Sod 1 0.34 0.35 0.40
Cecil Sod 2 0.27 0.27 0.33
Figure 2. Volumetric Water Content as a Function of Time for Cecil Sod Block #1
0.41
0.40
E ., 0.39 E 0 0 0.38 :;; -+- San
1ii 0.37 _..... 15cm
~ 0 ----- 25 cm ·;::
1D 0.36
E ::, 0 0.35 >
0.34
0.33 0 5 10 15 20 25 30 35 40
Time (hours)
18

effects for the Maury soil, with the mean 0 of the conventionally-tilled soil 1/4 less than the
mean of the sod-covered soil at the 5 cm depth. There were no differences in the mean 0 at the
other depths. These results are illustrated in Figure 3, and indicate a difference in the water
Figure 3. Mean Volumetric Water Contents for the Different Treatments: Maury Soil
0.60
0.50
e 0.40
0.30
0.20
- Grass Pasture B Conventional Till
5cm 15 cm
Depth
25cm
retention properties of the two land use treatments close to the soil surface.
Overall, the Cecil soil blocks had lower volumetric water contents than the Maury soil blocks
(Table 7). Generally lower water fluxes in these blocks (Table 2) and differences in water
retention characteristics (Table 5) are likely to be responsible for this observation. Differences in
0 between the sod and tilled treatments were less pronounced for the Cecil soil (Table 7). For
this soil, the main effect was the higher mean value of 0 for the 25 cm depth as compared to the
5 and 15 cm depths (Figure 2). This corresponds with the increase in clay content with depth
observed for this soil (Table 1 ).
19

Water Fluxes
The 'whole block' water fluxes ( cm/hr) were determined by adding the total drainage for the 11
'tube' trays and 4 'bulk' trays (cm3/hr) and dividing by the total area of the block (1056.25 cm2).
The 36-hour average fluxes for the different blocks are given in Table 2.
The collected leachate in each cell was also converted into a flux by dividing the flow rate for
each cell by the area of that cell (9. 61 cm2) for each of the 11 tube trays. Since the target flux
was the same for each block, it was hypothesized that any differences in flow due to differences
in pore-size distribution and continuity would be manifested in the variance of the individual
fluxes. However, the actual fluxes deviated from the target fluxes, and these differences may
have also influenced the magnitude of the variance.
A geostatistical analysis was performed by computing indicator variograms (1 =flowing, 0=non
flowing) for the individual fluxes for each block. However, the results indicated little or no
spatial structure in the data (Figure 4). Therefore, the individual flux data wece analyzed using
conventional statistical procedures.
An analysis of variance was completed on the mean and variance of the individual fluxes
between the treatments on only those cells that were involved in the collection of drainage water.
The results indicated that there were no significant differences (P < 0.05) between the two
treatments with respect to the percent of cells collecting leachate, the mean flux, or the variance
of the fluxes. Descriptive statistics resulting from this analysis are given in Table 8. For the
three Maury sod blocks, an average of 33% of cells collected leachate with a mean flux of
20

Figure 4. A Typical Indicator Variogram for the Spatial Distribution of Effluent Flux
2.00
1.50
1.00
,..,o--. O o / 0 ----•---- --0-0
0.50 r-
0.00 ~--~·-~--~·--~--~·-~-~
0 2 4 6 8 10 12 14
Average Lag Distance (cm)
2.67cm hr-1 and a variance of 2.77 cm2 hr"2. The Maury tilled blocks averaged 38% of cells
collecting leachate, with a mean flux of3.48 cm hr-1 and a variance ofS.52 cm2/hr2. These
results indicate that the sod blocks had a slightly more concentrated flow pattern than the tilled
blocks. However, the Maury tilled blocks exhibited much greater spatial variability in the
magnitudes of the fluxes for those cells that were flowing.
For the Cecil tilled blocks, the mean percentage of cells collecting drainage water was 40% and
the mean flux was 2.23 cm hr-1 (Table 8). For the sod blocks, the mean percentage of cells was
50% with a slightly lower mean flux of 1.96 cm hr -i_ The means of the variances for the two
treatments were identical at 3.55 cm2 hr ·2 .
Correlations were performed for each block between the spatial distribution of fluxes in tray 1
(hour 1) and the distribution in tray 15 (hour 36). The comparison of these two trays provides
evidence of structural (flow pattern) stability from the start of the experiment to completion.
21
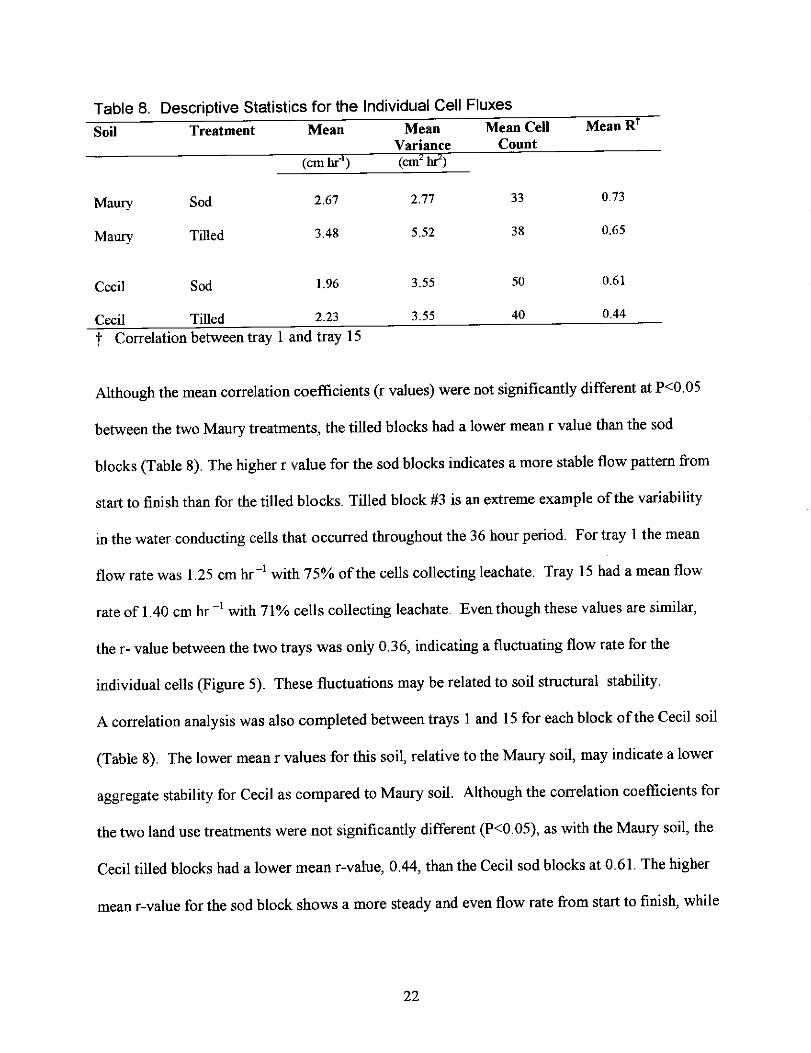
Table 8. Descriptive Statistics for the Individual Cell Fluxes
Soil Treatment Mean Mean Mean Cell MeanR1
Variance Count (cmhr-1) (cm~ hr)
Maury Sod 2.67 2.77 33 0.73
Maury Tilled 3.48 5.52 38 0.65
Cecil Sod 1.96 3.55 50 0.61
Cecil Tilled 2.23 3.55 40 0.44
t Correlation between tray 1 and tray 15
Although the mean correlation coefficients (r values) were not significantly different at P<0.05
between the two Maury treatments, the tilled blocks had a lower mean r value than the sod
blocks (Table 8). The higher r value for the sod blocks indicates a more stable flow pattern from
start to finish than for the tilled blocks. Tilled block #3 is an extreme example of the variability
in the water conducting cells that occurred throughout the 36 hour period. For tray 1 the mean
flow rate was 1.25 cm hr-1 with 75% of the cells collecting leachate. Tray 15 had a mean flow
rate of 1.40 cm hr-1 with 71% cells collecting leachate. Even though these values are similar,
the r- value between the two trays was only 0.36, indicating a fluctuating flow rate for the
individual cells (Figure 5). These fluctuations may be related to soil structural stability.
A correlation analysis was also completed between trays 1 and 15 for each block of the Cecil soil
(Table 8). The lower mean r values for this soil, relative to the Maury soil, may indicate a lower
aggregate stability for Cecil as compared to Maury soil. Although the correlation coefficients for
the two land use treatments were not significantly different (P<0. 05), as with the Maury soil, the
Cecil tilled blocks had a lower mean r-value, 0.44, than the Cecil sod blocks at 0.61. The higher
mean r-value for the sod block shows a more steady and even flow rate from start to finish, while
22
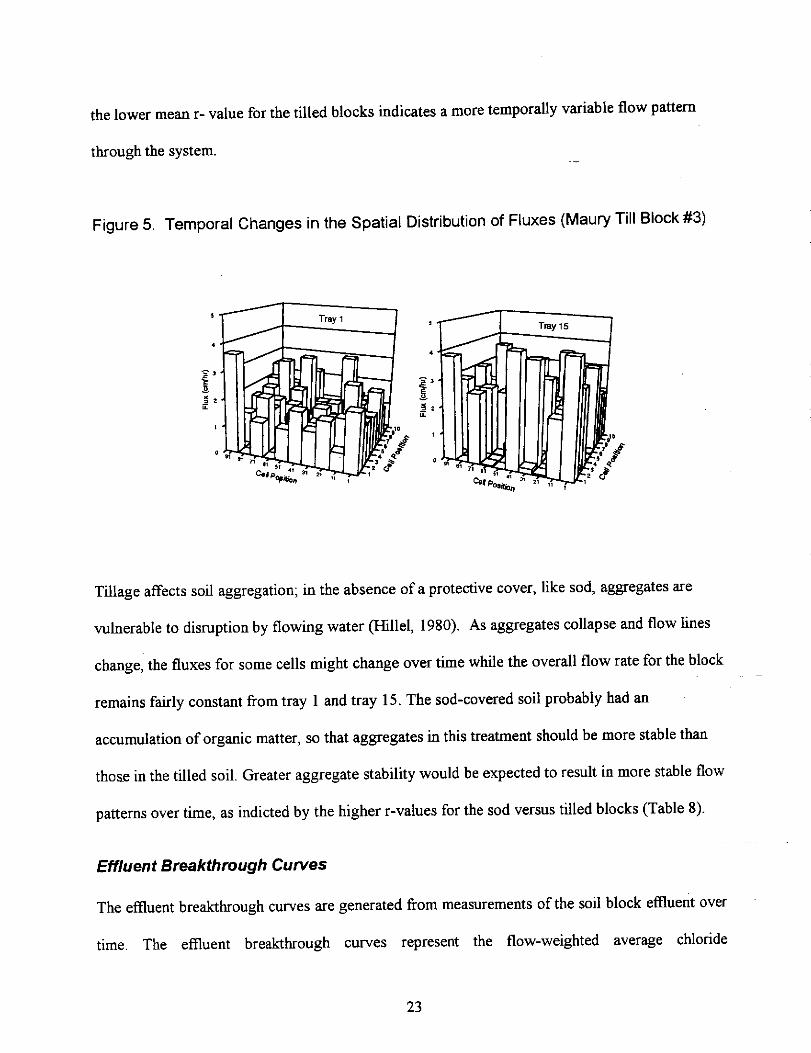
the lower mean r- value for the tilled blocks indicates a more temporally variable flow pattern
through the system.
Figure 5. Temporal Changes in the Spatial Distribution of Fluxes (Maury Till Block #3)
Tray1
Tillage affects soil aggregation; in the absence of a protective cover, like sod, aggregates are
vulnerable to disruption by flowing water (Hillel, 1980). As aggregates collapse and flow lines
change, the fluxes for some cells might change over time while the overall flow rate for the block
remains fairly constant from tray I and tray 15. The sod-covered soil probably had an
accumulation of organic matter, so that aggregates in this treatment should be more stable than
tho5_e in the tilled soil. Greater aggregate stability would be expected to result in more stable flow
patterns over time, as indicted by the higher r-values for the sod versus tilled blocks (Table 8).
Effluent Breakthrough Curves
The eflluent breakthrough curves are generated from measurements of the soil block eflluent over
time. The eflluent breakthrough curves represent the flow-weighted average chloride
23

concentrations. These curves have some advantages and limitations relative to the breakthrough
curves obtained using TDR methods.
One principal advantage is that the effluent concentrations are normalized with respect to a well
known input solution concentration. In contrast, the TDR bulk electrical conductivity data are
typically normalized with respect to their own late-time values. This means that complete
breakthrough is important to the success of the standard TDR method but not as critical to the
effluent method. However, TDR data can generally be collected more frequently than effluent
concentration data and by automated methods.
Figure 6 shows the mean Cl- breakthrough curves for the Maury soil blocks. Both axes represent
dimensionless numbers. Vo is the water-filled pore volume and VNo is the number of water-filled
pore volumes flushed through the soil. All of the Maury soil block breakthrough curves were
sigmoidally shaped.
In contrast to the Maury breakthrough curves, the Cecil breakthrough curves are not sigmoidally
shaped (Figure 7). All four Cecil soil blocks showed detectable er after the first hour . The data
represented in Figures 6 and 7 were fitted to the convection-dispersion equation with CXTFIT
(Table 9). The dimensionless column Peclet number, defined as P = L/a, where L is the length of
the block from surface to base, is also listed. Clearly, the dispersivities are significantly larger
(and the Peclet number correspondingly smaller) for the Cecil soil blocks as compared to the
Maury blocks. An analysis of variance suggested that soil management was not a significant
source of variability among the block results.
24

Figure 6. Effluent Chloride Breakthrough Curves for the Maury Soil
1.00 ...... _ Sod #1
-a- Sod#2
0.80 -•- Sod-#3
-o- Till #1
0.60 -t.i.- Till#2 0
§ -o- Till #3
0.40
0.20
0.00 0
0.00 0.50 1.00 1.50 2.00 2.50 3.00 3.50
V/Vo
Figure 7. Effluent Breakthrough Curves for the Cecil Soil
1.00 D. ~ I)/ ..
,., ' ~-- ..... f:::.',- I -1.--i.: --- Q
---- Sod #1 ' ---·O
o,,,r· t,
0.75 -&- Sod #2
,,' ,/ -o- lill #1 , ,
0
11! -6.- Till #2
0 0.50 0
0.25 .?/./ 9.1• .&. ,_. {
0.00 0.00 0.50 1.00 1.50 2.00 2.50 3.00 3.50
V/Vo
25

As the dispersivity increases (and the Peclet number decreases), the step input breakthrough
curves undergo a transition away from the typical sigmoidal shape (van Genuchten and
Wierenga, 1986). High dispersivity corresponds to a broad range of flow velocities and can be
indicative of preferential flow. The soil block results presented in Table 9 suggest that the Cecil
soil was much more susceptible to preferential flow than the Maury soil under the conditions of
these experiments.
TDR Breakthrough Curves
Calculation of the TDR breakthrough curves for the Maury soil blocks was done by normalizing
the bulk electrical conductivity (BEC) values from the TDR probes relative to the smallest and
largest values, i.e.
where C is the BEC measured at any time, Cinitial is the BEC prior to application of the KCl
solution, and Cmax is the maximum BEC value, which is typically attained when the KCl solution
breakthrough is complete.
The Cecil blocks did not reach complete breakthrough in some instances and, as discussed in
Chapter 2, a different procedure, in which the maximum BEC was estimated, was used. This
procedure was applied to all Cecil TDR data.
Because the TDR probes simultaneously give the BEC and the volumetric water content, it is
possible to estimate the average pore water velocity v in the vicinity of a probe when the water
flux through the column is known. Since there is a breakthrough curve and a velocity for each
26

Table 9. Dispersivities and Column Peele! Numbers from Effluent Breakthrough Curves
Soil Treatment Rep Dispersivity Column (cm) Peclet
Number
Maury Tillage l 1.74 19
Maury Tillage 2 0.90 36
Maury Tillage 3 1.11 29
Maury Sod 1 1.93 17
Maury Sod 2 2.26 14
Maury Sod 3 1.11 29
Cecil Tillage 1 9.53 3
Cecil Tillage 2 5.73 6
Cecil Sod 1 7.95 4
Cecil Sod 2 3.07 11
layer represented by a TDR probe, separate estimates of dispersivity in each layer are possible.
However, as discussed in Chapter 2, CXTFIT assumes a uniform vertical soil profile. The known
layering of the soils violates this assumption. This violation is likely to be more problematic for
the analysis of these layer-specific TDR data than it is for the preceding effluent data evaluation.
A multi-layer model could have been used inversely to evaluate these data, but it is possible that
non-unique parameter estimates would have be obtained from such a procedure.
Figure 8 shows typical normalized breakthrough curves measured with the TDR probes as a
function of depth for the Maury and Cecil soils. Near the source of the high-conductivity
solution, the BEC measured at the 5-cm TDR probe is the first to increase after the step increase
in applied water conductivity. Subsequent increases are observed at the 15- and 25-cm deep
probes. The curves for both soils take on a more sigmoid shape as the solute moves farther from
the source and deeper into the soil block.
27

Figure 8. Typical Normalized TOR Breakthrough Curves for Maury Soil (Sod Block #1)
C: 0 -~ E 1l C: 0 u c3 a,
.2: 1ij
&l
1.00
0.75
0.50
0.25
... •··~~ .. •·••·••······ .. :..--,. .......... ,- , .-· ,,. / ..... - " / I , , . ,
I I I . , , I _., . ... ,
I i I, -•- 5 cm
· &· 15 cm . ' , I /~ /,,,. • /... I
-•-· 25 cm
I ,,. o.oo ,udliai• c~L--_L _ _j_ __ .J_ _ _L _ ___JL___j
0 10 15 20
Time (hours)
25 30 35 40
Table 10 presents the results of the CXTFIT parameter estimation procedure for the TDR data.
Dispersivities ranged from just above 1 to nearly 90 cm. The highest value was more than four
times larger than the next highest value and was excluded from all subsequent analyses as an
outlier. Confidence in this estimate (Cecil tilled block #1, 15 cm depth) was low because of the
high dispersivity in the uppermost 5 cm. (Table 10) This condition may have violated
CXTFIT's non-layered assumption to such an extent that the resulting estimate of dispersivity
for the 15 cm depth was unreasonable.
The mean dispersivity was higher for the Cecil blocks (Table 10). The Maury soil blocks
generally showed a decrease in dispersivity with increasing depth. No consistent trend with depth
was apparent from the Cecil block results. The Peclet numbers should increase with depth in a
28

Table 10. Dispersivities and Column Peele! Numbers from TOR Probe Data
Soil Treatment Block Depth Dispersivity Column (cm) (cm) Peclet
Number
Maury Sod 1 5 3.50 1.43
15 3.36 4.47
25 2.77 9.04
Sod 2 5 6.23 0.80
15 1.66 9.04
25 1.43 17.50
Sod 3 5 7.56 0.66
15 1.66 9.05
25 1.43 17.44
Maury Tilled 1 5 9.63 0.52
15 4.54 3.31
25 1.80 13.91
Tilled 2 5 7.31 0.68
15 1.39 10.76
25 1.93 12.97
Tilled 3 5 5.10 0.98
15 3.74 4.01
25 1.37 18.23
Cecil Sod 1 5 1.65 3.03
15 6.30 2.38
25 7.14 3.50
Sod 2 5 14.49 0.35
15 5.09 2.95
25 5.18 4.83
Cecil Tilled 1 5 21.80 0.23
15 86.40 0.17
25 7.50 3.33
Tilled 2 5 3.32 1.50
15 12.35 1.21
25 12.71 1.97
uniform soil. That was consistently the case for the Maury blocks, suggesting that they were
relatively uniform with depth. In contrast, there was no Peclet number trend with depth for the
Cecil blocks. This result suggests that the effects of layering on solute transport in this soil were
appreciable.
Regression analysis revealed a significant (R2 = 0.28, P<0.01) effect of volumetric water content
on dispersivity, with dispersivity decreasing with increasing water content (Figure 9). Lower
29

Figure 9. Effect of Volumetric Water Content on Dispersivity for TDR Data
25
• 20
E I R2•0.2814 I E.
f 15 •
• • I!! Ql 10 a. .!!l • •• •
• 5 • • • •
• • • • Y• • 0
0.20 0.25 0.30 0.35 0.40 0.45 0.50 0.55
Volumetric Water Content
water contents lead to more tortuous flow paths and thus, a broadening of the velocity
distribution.
Dispersivity was also significantly (R2 = 0.26, P<0.01) correlated with the soil water retention
parameter b (Table 5). Dispersivity increases as the b parameter decreases (i.e. as the pore size
distribution shifts to a predominance oflarger pores). This change in pore size distribution
implies the possibility of a broader range of solute velocities and therefore a larger dispersivity.
However, the correlation between water content and the b parameter may be largely responsible
for the relationship between b and dispersivity.
We conclude that any structural effects on solute dispersion in unsaturated soils subjected to
initial and boundary conditions similar to those in our experiments will be indirect, and can be
related to the differences in water content at given flow rate produced by differences in pore-size
30
distribution. It is also possible that lower water fluxes in the Cecil soil contributed to lower
water contents and higher dispersivities.
The effects of management on solute dispersion (and hence on preferential flow) were not
appreciable under the conditions of these experiments. At a steady rainfall rate of 1 cm/hr,
unsaturated conditions were maintained throughout the blocks and no runoff was generated.
Under saturated conditions, flow in macropores would be expected to significantly increase
solute dispersion. Under field conditions, flow of surface runoff water into rnacropores could
also greatly enhance solute dispersion even when the soil remains unsaturated.
Fecal Coliforms
The added fecal coliforms behaved similarly in the Cecil and Maury soils. Within four hours the
maximum C/Co was obtained in both soils (Figures 10and11). Thereafter, the value for C/Co
remained constant or declined slightly for the duration of the experiment. This pattern is
consistent with the results of Smith et al. (1985) for the transport of E. coli via preferential flow
through macropores. In terms of pore volumes, the maximum C/Co was reached in both soils
after approximately 0.25 pore volumes had leached (Figures 10 and 11 ).
In the Cecil soil, tilled soil blocks had slightly higher C/Co values than sod-covered soil blocks.
The opposite was true in two of the three Maury soil blocks; sod-covered soils had a higher C/Co
than the tilled soils. The higher the C/Co, the greater the fecal coliform movement through soil.
Previous research by McMurry et al. (1998) in surface applied poultry litter suggested that sod
covered Maury soil promoted greater fecal coliform movement due to greater continuity of soil
pores. The Cecil soil clearly did not follow such a pattern in these experiments.
31

Figure 10. Bacterial Breakthrough Curves for the Maury Soil
0 0 u ci 0 =
0
-•- Sod #1 - •- Sod #2 - •- Sod #3 -0- Till #1 -6- Till #2 - •- Till #3
-1 r
End of Pulse
-2 f-7 :Q
••-•---- I \
I ... •-~- ..... ' •--3 ~ p---~t;,--=.::: ~ I ------
•~£,-/ 0 -----·-..::l\-·----- -- ~/ r -----·• I. . ' - -•----------" ·---:-;:",. --·r' :Jl.o=:-_:=: __ .• ....:::,-------=D~-..:- ___ \.'~ 0-0Q - 0
I, ',, - .... ;;,-:::.., , t,,. -----1;,
-4 :,,/J --- .... ,0 ..... ____ ,.. .. '\t,. __ ------•
;,;.,
-5 0.00
0
0.50 1.00 1.50 2.00
V/Vo
2.50
Figure 11. Bacterial Breakthrough Curves for the Cecil Soil
0 0 u ci 0 = ., -~ u ., m
0
-•- Sod #1 - •- Sod #2 -0- Till #1 -t::,- Till #2
-1 End of Pulse
cf'---C6----~o--,,-- - - <0:" 6 ·, --2 Otl, e ----o OQ-1~- _:.=--.()- - -
// / ---------• " I::,_ / 11• _1,..--------\ ,._ _______ I::,. ___ ,._
r• •---- • -----.4 •·•·i11..--------3 f.6/ ,' ,· ••
~ --------------. ' . :
-4 r- l .. -5 '
-6 0.00
' ' 0.50 1.00
' ' 1.50 2.00
V/Vo
32
' ' 2.50 3.00 3.50

The magnitude of the C/Co in Cecil soil was greater than in Maury soil. In tilled treatments
effiuent fecal coliform concentrations in Cecil soil ranged from 0.6 to 3.4% of influent
concentrations. In Maury soil the corresponding range was 0.03 to 0.12%. In sod-covered soils,
the influent fecal coliform concentrations in Cecil soil ranged from 0.2 to 0.6%. In Maury soil,
effluent concentrations in two blocks averaged 0.25% of influent concentrations (a third was at
2.4%). It appears that the capacity of fecal coliforms to move through Cecil soil is greater than in
Maury soil based on these data, which is consisted with the higher dispersivity increase for the
Cecil soil. It should be noted, however, that the concentration of fecal coliforms applied to Cecil
soil blocks routinely exceeded that applied to Maury soil blocks, so these observations may be an
artifact of slightly different experimental conditions (Table 3).
No more than 3% of the influent fecal coliform concentration was recovered in the effluent.
Passage through the soil blocks filtered out, or retarded, the majority of fecal coliforms despite
the apparent continuity of pores from surface to discharge point. Nevertheless, the breakthrough
curves demonstrate that within 2 hours of initiating the bacterial application in the Maury soil
and one to two hours in the Cecil soil, fecal coliforms were eluted. Concentrations ranged from
200 to 842,800. In all but two cases the effluent concentration of fecal bacteria exceeded
minimum standards for recreational water contact of2000 CFU/100 mL and greatly exceeded
drinking water standards. Fecal coliform concentrations eluting from both soils could exceed
millions of CFU per 100 mL.
We could not detect a consistent effect of adding ATCC 25254 (the second fecal coliform strain)
on the displacement of ATCC 27662 (the first fecal coliform strain added to the soil blocks). If
adsorption processes were responsible for bacterial retention, such a displacement might have
33

resulted in an increase in the C/Co value of ATCC 27662 after switching to ATCC 25254 as the
sole fecal coliform strain in the input reservoir. A small increase in C/Co occurred in the Maury
soil for two out of the three tilled soil blocks. However, none of the Cecil soil blocks
demonstrated this phenomenon.
It is worth noting that in Cecil soil, the appearance of ATCC 25254 in leachate occurred within
one hour of its addition. This was a more rapid rate of appearance than we observed when ATCC
27662 was added to initiate the experiments. The same was true of ATCC 25254 added to the
tilled Maury soil. However, there was no effect on the speed with which ATCC 25254 appeared
in the sod-covered Maury soil. Because there was a different effect with the sod-covered and
tilled Maury soils, there may yet be an unidentified dynamic between the retention of multiple
strains passing through some soils depending on their tillage management.
As expected, the distribution of fecal coliforms eluting through the soil blocks was not uniform,
rather, it occurred at spatially discrete locations at the bottom of the soil blocks. These locations
were frequently, but not always exactly, the locations through which the second fecal coliform
added to the soil blocks flowed. There were numerous cells through which no leachate flowed,
and consequently, through which no fecal coliforms eluted.
Sources of Error
Rainfall Simulator Variability
Several experiments were run to determine the spatial variability associated with the water
droplets coming from the rainfall simulator. These experiments were performed by putting 100
34

collection tubes directly underneath the simulator, and measuring the flow rate in each tube at a
target flow rate of 1 cm hr"1. The average coefficient of variation for the individual flow rates
was 38.2%.
Because of the spatial variation in water droplets from the simulator, there was some concern
that the variability in effluent fluxes measured at the base of the soil blocks was the result of the
imposed rainfall pattern as opposed to the distribution and connectivity of flow paths within the
block. To test this idea, a block of Cecil soil was run, first with the rainfall simulator kept static
and then with it rotated 90° every 15 min.
The mean flow rates were similar, with the rotation at 0.78 cm hr"1 and the non-rotate at 0.76 cm
hr"1. The coefficient of variation for the non-rotate (177%) was slightly lower than that (197%)
for the rotate. However, both of these values were much greater than the coefficient of variation
for the simulator itself. Furthermore, the correlation coefficient between the effluent fluxes for
the rotation of the rainfall simulator and the non-rotation was 0.75. This relatively high r-value
indicates that the spatial pattern of effluent was relatively independent of the spatial pattern of
the rainfall. This was confirmed by correlating the spatial distribution of flow from the simulator
with the spatial distribution of effluent fluxes from the static phase of the experiment; the
resulting r-value (0.02) was not significant at P<0.05. From the above experiments, we conclude
that the spatial distribution of effluent was mainly the result of flow processes occurring within
the block and/or at the block/phase barrier interface.
35

Phase-barrier Contact
It is possible, because of the unevenness of the bases of the trimmed soil blocks and because
cells in the base plate were filled flush with glass beads, that interfacial contact was incomplete
for some of the runs. The cells in the base plate have sharp edges designed to penetrate the soil
matrix. However, when they are filled flush with glass beads penetration is impeded and contact
reduced. This could cause water to move laterally at the base of the soil block before draining
into adjacent cells.
To test this possibility, a block of Cecil soil was prepared as usual, flow was initiated, and the
spatial distribution of effluent fluxes was measured over time. After 6 hr of steady flow the
block was removed from the base and cleaned of all existing beads. The cells were then
repacked with the same size beads as before. However, an additional 2-3 cm layer of beads was
applied to the bottom of the block. The block was placed on the top of the collection chamber
and was run in the same way as before, with measurements of the spatial distribution of fluxes
taken for another 6 hr.
The additional beads appeared to improve the contact between the soil block and the base plate.
Whereas 57 cells registered zero flow in the first run, only 14 cells had no flow in the second
run. Moreover, the correlation between the spatial distributions of fluxes for the two runs was
only r=0.15 (NS). Thus, poor contact may have been a factor contributing to the spatial variation
in effluent fluxes observed in some of the experiments described in this report. Additional
research is needed on methods to improve soil phase barrier contact in future block studies of
this nature. Although poor contact may have confused our spatial variability results to some
36

extent, it is unlikely that this factor had any significant impact on the mean effluent breakthrough
curves or the TDR results. This hypothesis is supported by the observation that volumetric water
contents measured at the 5, 15 and 25 cm depths during both the 'normal' and improved contact
block runs were with ±1 % of each other.
SUMMARY AND CONCLUSIONS
Agricultural chemicals, fertilizers, and manure that are not taken up by plants, broken down,
volatilized, or lost in runoff must pass through the unsaturated (vadose) zone to reach ground
water. Macropores can promote rapid, preferential flow of water, solutes and microorganisms
through this zone. Flow through macropores can be considered part of a continuum of flow
velocities that can be quantified using the classical convection-dispersion equation. Several
alternative modeling strategies, including multi-region, transfer function and percolation models,
have also been developed to improve predictions ofmacropore flow. However, none of these
approaches currently permit prediction of water and contaminant movement in the vadose zone
from independently measured soil structural parameters.
This study measured steady state solute and bacterial transport through relatively large intact soil
blocks under partially saturated conditions. The main objectives were to examine:
• if water, chloride (a non-interacting chemical), and bacteria would elute through partially
saturated, intact soil blocks uniformly or via preferential flow paths;
• if these preferential paths were stable with time;
37
• if tillage management practices affected either the speed or pattern of water flow through the
soil blocks;
• if statistical and/or geostatistical analyses could be used to predict transport processes from
soil structural properties; and
• if displacement of adsorbed and/or entrapped bacteria occurs in response to the introduction
of a second competing strain.
Six, 32.5 cm square x 32.5 cm deep soil blocks were obtained from a Maury silt loam soil (fine,
mixed, mesic Typic Paleudal±) at the University of Kentucky Experiment Station (Spindletop
Farm). Four soil blocks were obtained from a Cecil soil ( clayey, kaolinitic, thermic Typic
Kanhapludult) from South Carolina. Two land use treatments were sampled for each soil type:
conventional-till (disk) corn production and grass pasture. Three replicate blocks per land use
treatment were studied for the Maury soil and two replicate blocks for the Cecil soil
The soil blocks were excavated, encased in polyurethane foam, and transported to the laboratory.
We trimmed the bottom of each individual soil block flush with its wood casing, placed the
block on a collection chamber, and instrumented it with TDR probes at the 5, 15 and 25 cm
depths. The collection chamber contained 100 cells arranged in a 12 x 12 array that collected
effluent leaching from the block. The cells were filled with saturated glass beads, which acted as
an interfacial phase barrier. A-2.0 kPa vacuum was applied to the lower boundary of each soil
block via the collection chamber. Simulated rainfall was applied to the top of each block at a
target rate of 1 cm hr-1 via 100 hundred hypodermic needles, 0.25 mm in diameter, arranged in a
grid pattern corresponding with the centers of the cells in the bottom collection chamber.
38
Volumetric water contents and bulk electrical conductivities within the soil blocks were
measured automatically using TDR. When steady flow was achieved, the concentrations of
chloride and bacteria in the water supply were increased in a stepwise fashion, and the resulting
breakthrough curves measured over time. Two Escherichia coli strains (ATCC 27662 and
25254) were applied sequentially. The effluent (chloride) and TDR breakthrough curves were
fitted to the convection dispersion equation (CDE) using CXTFIT. The parameters of the CDE
are the dispersion coefficient (D) and the average pore water velocity (v). These parameters were
combined to give the dispersivity ( a), defined as u=D/v. The goodness of fit for these analyses
(R2 generally> 0.9) indicates the CDE is applicable to the flow conditions in these experiments.
At the end of each experiment the soil blocks were sampled destructively and the following soil
structural properties were determined: bulk density, air entry value, pore-size distribution index (b ),
and saturated hydraulic conductivity.
A geostatistical analysis was performed by computing indicator variograms for the individual
fluxes measured on each block. However, the results indicated little or no spatial structure in the
data. Therefore, the individual flux data were analyzed using conventional statistical procedures.
Since the target flux was the same for each block it was hypothesized that any differences in
flow due to differences in pore-size distribution and continuity would be manifested in the
variance of the fluxes. However, the actual fluxes deviated from the target fluxes, and these
differences may have also influenced the magnitude of the variances. Analysis of variance
indicated no significant effect of soil type, land use, or their interaction on the variance of the
fluxes. The absence of any significant trends for the variance of the fluxes may be related to
39

imperfect contact between the soil blocks and the collection chamber. For Maury soil, an
average of33 cells flowed for the sod blocks and 38 for the tilled blocks, while for Cecil soil, 50
and 40 cells flowed for the sod and tilled blocks, respectively. It is likely that more cells would
have flowed if contact between the soil block and collection chamber had been completely
uniform.
Correlations were performed for each block between the spatial distribution of fluxes in tray 1
(hour 1) and the distribution in tray 15 (hour 3 6). The comparison of these two trays provides
evidence of structural (flow pattern) stability from the start of the experiment to completion.
The higher mean r-values obtained for the sod blocks (0.73 and 0.61 for Maury and Cecil,
respectively) as compared to the tilled blocks (0.65 and 0.44, respectively) indicates a more
stable flow pattern for this land use. The sod-covered soil probably had an accumulation of
organic matter, so that aggregates and pores in this treatment were more stable than those in the
tilled soil. Greater structural stability would be expected to result in more stable flow patterns
over time, as indicted by the higher r-values for the sod versus tilled blocks.
We could not detect a consistent effect of adding ATCC 25254 (the second fecal coliform strain)
on the displacement of ATCC 27662 (the first fecal coliform strain). Therefore, our analyses
focussed on the first strain only. The breakthrough curves for this strain were similar in shape
for both soils. A maximum normalized concentration (C/Co) was observed in the effluent after
approximately O .25 water filled pore volumes had been leached, and this concentration remained
constant over the course of each experiment. The magnitude of C/Co for the Cecil soil was
greater than for the Maury soil. The higher the value of C/Co, the greater the fecal coliform
40

transport through soil. Thus, it appears that the capacity of fecal coliforms to move through
Cecil soil is greater than in Maury soil. It should be noted, however, that the concentration of
fecal coliforms applied to Cecil soil blocks routinely exceeded that applied to Maury soil blocks,
so this observation may be an artifact of slightly different experimental conditions.
No more than 3% of the influent fecal coliform concentration was recovered in the effluent.
Passage through the soil blocks filtered out, or retained, the majority of fecal coliforms despite
the apparent continuity of pores from surface to discharge point. Nevertheless, the breakthrough
curves demonstrate that within 2 hours of initiating rainfall in the Maury soil and within one to
two hours in the Cecil soil, fecal coliforms were eluted. In all but two cases the effluent
concentrations of fecal bacteria exceeded minimum standards for recreational water contact of
2000 CFU/100 mL and always greatly exceeded drinking water standards.
Dispersivities computed from the effiuent chloride breakthrough curves were much larger for the
Cecil soil (3 .07-9.53 cm) than for the Maury soil (0.90-2.26 cm). Large values of dispersivity
correspond to a broad range of flow velocities, and a non-symmetric step input breakthrough
curve that can be indicative of preferential flow. Thus, under the conditions of these
experiments, the Cecil soil appeared to be more susceptible to preferential flow than the Maury
soil. Analysis of variance suggested that soil management was not a significant source of
variability among the soil blocks in terms of effluent dispersivity.
Dispersivities computed from the TOR data ranged from just above 1 to nearly 90 cm. The
highest value was more than four times larger than the next highest value and was excluded from
41

all subsequent statistical analyses as an outlier. The Maury soil blocks generally showed a
decrease in dispersivity with increasing depth, while no consistent trend with depth was apparent
for the Cecil soil blocks. There was no evidence of any interaction between depth and land use.
Regression analysis revealed a significant (R2 = 0.28, P<0.01) effect of volumetric water content
on dispersivity, with dispersivity decreasing with increasing water content. Lower water contents
lead to more tortuous flow paths and thus, a broadening of the velocity distribution. Dispersivity
was also significantly (R2 = 0.26, P<0.01) correlated with the b parameter, with dispersivity
increasing as the pore size distribution shifted to a predominance of larger pores. Such a change
in pore size distribution implies the possibility of a broader range of solute velocities and
therefore a larger dispersivity. However, the existence of a highly significant correlation between
water content and the b parameter may be indirectly responsible for the relationship between b
and dispersivity.
We conclude that any structural effects on solute dispersion in unsaturated soils subjected to
initial and boundary conditions similar to those in our experiments are likely to be indirect, and
can be related to differences in water content at a given flow rate produced by differences in
pore-size distribution. Future studies concerned with establishing a direct relationship between
solute dispersion and soil structural properties should be conducted under saturated conditions.
REFERENCES
Andreini, M.S., and T.S. Steenhuis. 1990. Preferential flow paths under conventional and
conservation tillage. Geoderma. 46:85-102.
42

American Public Health Association (APHA). 1989. Standard methods for the examination of
water and wastewater. 17th ed. APHA. Baltimore.
Bowman, B.T., R.R. Brunke, W.D. Reynolds, and G.J. Wall. 1994. Rainfall simulator-grid
lysimeter system for solute transport studies using large, intact soil blocks. J.
Environ. Qua!. 23:815-822.
Campbell, G.S. 1974. A simple method for determining unsaturated hydraulic conductivity from
moisture retention data. Soil Sci. 117:311-314.
Danielson, R.E. and P.L.Sutherland. 1986 Porosity. in A Klute (ed.) Methods of Soil Analysis
Part 1, Agronomy Monograph No. 9, ASA/CSSA/SSSA, Madison WI, p. 443-461.
Dexter, AR., 1993. Heterogeneity of unsaturated, gravitational flow of water through beds of
large particles. Water Resources Research. 29: 1859-1862.
Dick, W.A., R.J. Roseberg, E.L. McCoy, W.M. Edwards, andF. Haghiri. 1989. Surface
hydro logic response of soils to no-tillage. Soil Sci. Soc. Am. J. 53: 1520-1526.
Drees, L.R., AD. Karathanasis, L.P. Wilding, and R.L. Blevins. 1994. Micromorphological
characteristics oflong-term no-till and conventionally tilled soils. Soil Sci. Soc. Am. J.
58:508-517.
Edwards, W.M., L.D. Norton, and C.E. Redmond. 1988. Characterizing macropores that affect
infiltration into non-tilled soil. Soil Sci. Soc. Am. J. 52:483-487.
Edwards, W.M., M.J. Shipitalo, W.A. Dick, and L.B. Owens. 1992. Rainfall intensity affects
transport of water and chemicals through macropores in no-till soil. Soil Sci. Soc. Am. J
56:52-58.
43
Granovsky, AV., E.L. McCoy, W.A. Dick, M.J. Shipitalo, and W.M. Edwards. 1993. Water and
chemical transport through long-term no-till and plowed soils. Soil Sci. Soc. Am. J. 57:
1560-1567.
Green, J.D., R. Horton, and J.L. Baker. 1995. Crop residue effects on the leaching ofsurface
applied chemicals. J. Environ. Qua!. 24:343-351.
Hillel, D. 1980. Fundamentals of soil physics. Academic Press, Inc. San Diego.
Kachanoski, R.G., E.Pringle, and A. Ward. 1992. Field measurement of solute travel times using
time domain reflectometry. Soil Sci. Soc. Am. J. 56:47-52.
Kay, B.D.1990. Rates of change in soil structure under different cropping systems. Advances in
Soil Science. 12:1-52.
Kluitenberg, G.J., and R. Horton. 1990. Effect of solute application method on preferential
transport of solutes in soil. Geoderma. 46:283-297.
Klute, A 1986. Water Retention: Laboratory Methods. in A. Klute (ed.) Methods of Soil
Analysis - Part 1, Agronomy Monograph No. 9, ASNCSSA/SSSA, Madison WI, p. 635
-662.
Klute, A. and C. Dirksen. 1986. Hydraulic Conductivity and Diffusivity: Laboratory Methods. In
Klute (ed.) Methods of Soil Analysis- Part 1, Agronomy Monograph No. 9,
ASNCSSNSSSA, Madison WI, p. 687-734.
Luxmore, R.J., P.M. Jardine, G.V. Wilson, J.R. Jones, and L.W. Zelazny. 1990. Physical and
chemical controls of preferred path flow through a forested hillslope. Geoderma. 46: 139-
154.
44

McCoy, E.L., C.W. Boast, R.C. Stehouwer, and E.J. Kladivko. 1994. Macropore hydraulics:
Taking a sledgehammer to classical theory. p. 303-348. In R. Lal and B.A. Stewart (eds.),
Soil processes and water quality, Lewis Pub!., Boca Raton, Fl.
McMurry, S.W., M.S. Coyne, and E. Perfect. 1998. Fecal coliform transport through intact soil
blocks amended with poultry manure. J. Environ. Qua!. 27:86-92.
Parker, J.C., and M. Th. van Genuchten. 1984. Determining transport parameters from laboratory
and field tracer experiments. Virginia Agric. Exp. Stn. Bull. 84-3, Virgina Polytechnic
Inst. and State Univ., Blacksburg, VA.
Phillips, R.E., V.L. Quisenberry, and J.M. Zeleznik. 1995. Water and solute movement in an
undisturbed, macroporous column: Extraction pressure effects. Soil Sci Soc. Am. J.
59:707-712.
Poletika, N.N., and W.A. Jury. 1994. Effects of soil management on water flow distribution and
solute dispersion. Soil Sci Soc. Am. J. 58:999-1006.
Quisenberry, V.L., RE. Phillips, and J.M. Zeleznik. 1994. Spatial distribution of water and
chloride macropore flow in a well-structured soil. Soil Sci. Soc. Am. J. 58: 1294-1300.
Reeve, R.C. 1953. A method for determining the stability of soil structure based upon air and
water permeability measurements. Soil Sci. Soc. Am. Proc. 17:324-329.
Seyfried, M. S., and P.S.C. Rao. 1987. Solute transport in undisturbed columns of an aggregated
tropical soil: Preferential flow effects. Soil Sci. Soc. Am. J. 51:1434-1444.
Shipitalo, M.J., W.M. Edwards, W.A. Dick, and L.B. Owens. 1990. Initial storm effects on
macropore transport of surface-applied chemicals in no-till soil. Soil Sci. Soc. Am J.
54: 1530-1536.
45

Smith, M.S., G.W. Thomas, R.E. White, and D. Ritonga. 1985. Transport of Escherichia coli
through intact and disturbed soil columns. J. Environ. Qua!. 14:87-91.
Toride, N., F.J. Leij, and M.Th. van Genuchten. 1995. The CXTFIT code for estimating transport
parameters from laboratory or field tracer experiments. Version 2. Research Report
No.137. U.S. Salinity Laboratory. Agricultural Research Service. U.S. Department of
Agriculture. Riverside, California
van Genuchten, M. Th., and P.J. Wierenga. 1986. Solute Dispersion Coefficients and Retardation
Factors. in A Klute (ed.) Methods of Soil Analysis -Part 1, Agronomy Monograph No.
9, ASA/CSSA/SSSA, Madison Wl, p. 1025-1054.
Wildenschild, D., K.H. Jensen, K. Villholth, and T.H. Illangasekare. I 994. A laboratory
analysis of the effect ofmacropores on solute transport. Ground Water. 32: 381-389
Wraith, J.M. S.D. Comfort, B.L. Woodbury, and W.P. Inskeep. 1993. A simplified waveform
analysis approach for monitoring solute transport using time domain reflectometry. Soil
Sci. Soc. Am. J. 57:637-642.
46