Snapshot Audience Report -...
21
Snapshot Audience Report Sharing and Comparing Audience Intelligence Key Indicators for Performing Arts Venues in London
Transcript of Snapshot Audience Report -...

Snapshot Audience Report
Sharing and Comparing Audience Intelligence Key Indicators for Performing Arts Venues in London
Snapshot Audience Report
Contents
Cover image: Barbican Theatre auditorium © Steff Langley
1 Introduction
5 Participating organisations
7 Artforms
8 Are audiences growing?
11 Where do audiences live?
12 How far do audiences travel?
13 What are audiences like?
19 How frequently do audiences book?
22 When do audiences book tickets?
24 Artform analysis 2009/10
25 Do audiences move between venues and artforms?
27 Looking forward
29 Glossary
30 Appendices
33 Audiences London Services
34 Joining Snapshot: Performing Arts
1
Introduction
Snapshot London: Performing Arts has gone from strength to strength since we began sharing audience information from London box offices in 2005. It now involves 36 key London cultural organisations, pooling data about bookers for performing arts from over 10 million households. Since 2005, we estimate that Snapshot analysis has been used by over 300 organisations in their engagement strategies, by around 20 different consortia to shape collaborative projects, and is used regularly by Arts Council England and other funders to inform their work. As well as producing benchmarks, Snapshot provides robust market intelligence to the participants involved. Many of the organisations sharing their box office information through Snapshot use the insight it brings as an integral part of their ongoing planning and monitoring.
Back in 2005, we were relieved to discover that the subsidised performing arts sector had a much wider audience than anticipated, with around a third of all London households represented. We were also surprised to discover that audiences booked much less often than we generally believed, and visited far fewer venues. Snapshot revealed these and many other significant factors about the market-place for the first time, bringing it into sharper focus and enabling a more informed approach to audience development. Over time, we have explored many of the trends and
characteristics, helping us to understand not just the “what” but the “why” – and what to do about it.
While Snapshot’s vital statistics are well-known and well-used by many cultural sector practitioners, they are still far from common-place. This report is designed to share some of the essential facts about London audiences more widely. It is particularly timely as 2012 sees some major Snapshot developments.
Snapshot London: Visual Arts We will soon be publishing similar headlines for the visual arts sector, based on audience information drawn from 21 major London galleries.
The National Picture The initiative is now open to groups of cultural organisations across England and information about audiences in other areas will become available during 2012 and beyond.
Year-on-Year Snapshot Update Look out for an update on the latest annual benchmarks and trends over time; the update puts trends into context, for example looking at how recession is affecting the sector, interpreting change and how this might affect planning.
We do hope you find this a useful overview of the must-know characteristics of audiences for performing arts in London.
Snapshot Audience Report2
What is Snapshot?
Snapshot London: Performing Arts is a collaborative audience analysis and intelligence-sharing programme run by Audiences London on behalf of the major performing arts venues in the capital, from the funded sector and some non-subsidised venues. Originally established with an Arts Council England R&D grant, it enables organisations to understand their audiences in the context of the wider market place. It combines data on ticketing, transactions, lifestyles, demographics and maps. Together, this describes who comes, how often, to which venues, to which artforms, where they live, what they’re like and what else they do; it also identifies and locates people with a high (and low) propensity to engage. In short, it creates an in-depth picture of each venue’s audience, and of the total performing arts audience for London.
Benchmarking and KPIs
A benchmark is a standard that serves as a point of reference for measurement and comparison, be that among a given set of peers or across a whole sector. Benchmarking offers a structured approach for setting realistic targets or Key Performance Indicators (KPIs) and judging how an organisation is faring. Snapshot provides reliable benchmarks for audiences, engagement and related income – for those organisations contributing data, but also for other cultural organisations – for whom the information in this report is particularly useful.
Analysis
This report looks at the overall ‘Snapshot’ of performing arts bookers in a typical year running from September to August. It is based on the last full year which we have a complete data set for 1st September 2009 to 31st August 2010. This includes box office data from 36 cultural organisations in London. Data is streamed automatically from the box office of each participating organisation, collected and analysed by the Audiences London technical team using unique data extraction and analysis technology supplied by Purple Seven. The analyses in this report are based on households rather than the total number of individual bookers. See Appendix 1 for more information on how this is calculated.
We will be updating this report with the latest figures as they become available. However, the overall profiles and trends explored in this report remain true for current performing arts audiences.
Snapshot Audience Report4 5
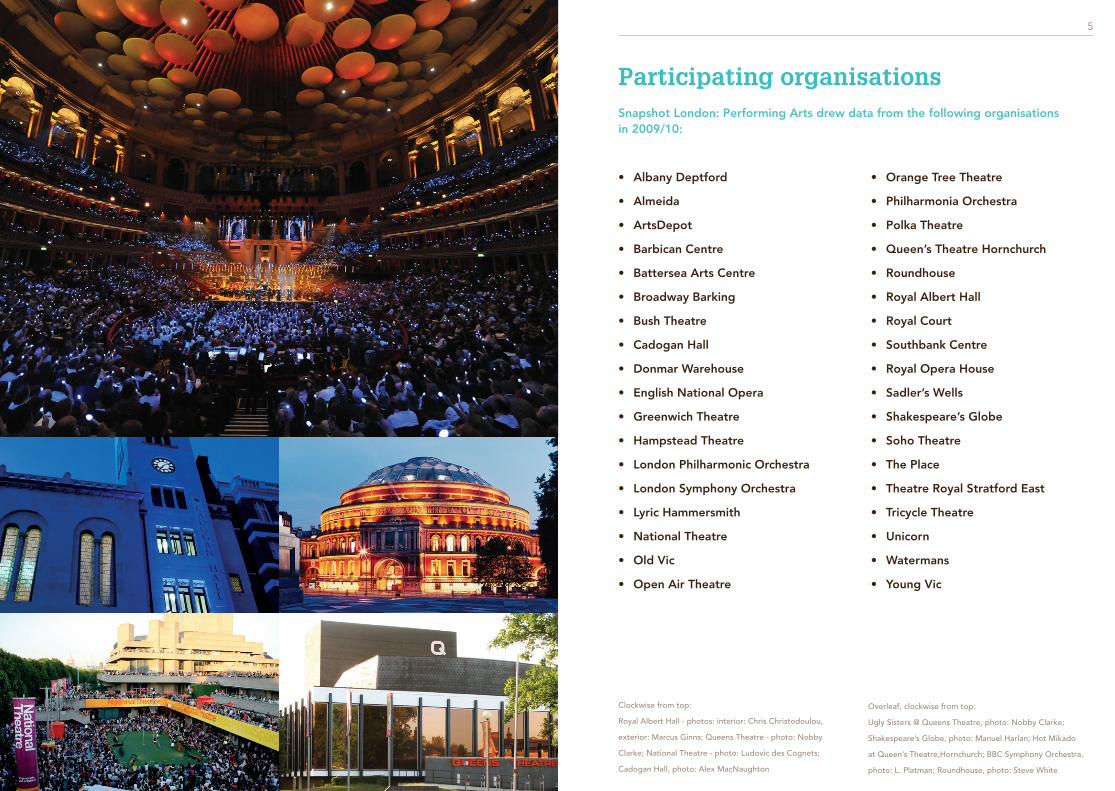
Participating organisations Snapshot London: Performing Arts drew data from the following organisations in 2009/10:
• Albany Deptford
• Almeida
• ArtsDepot
• Barbican Centre
• Battersea Arts Centre
• Broadway Barking
• Bush Theatre
• Cadogan Hall
• Donmar Warehouse
• English National Opera
• Greenwich Theatre
• Hampstead Theatre
• London Philharmonic Orchestra
• London Symphony Orchestra
• Lyric Hammersmith
• National Theatre
• Old Vic
• Open Air Theatre
• Orange Tree Theatre
• Philharmonia Orchestra
• Polka Theatre
• Queen’s Theatre Hornchurch
• Roundhouse
• Royal Albert Hall
• Royal Court
• Southbank Centre
• Royal Opera House
• Sadler’s Wells
• Shakespeare’s Globe
• Soho Theatre
• The Place
• Theatre Royal Stratford East
• Tricycle Theatre
• Unicorn
• Watermans
• Young Vic
Clockwise from top:
Royal Albert Hall - photos: interior: Chris Christodoulou,
exterior: Marcus Ginns; Queens Theatre - photo: Nobby
Clarke; National Theatre - photo: Ludovic des Cognets;
Cadogan Hall, photo: Alex MacNaughton
Overleaf, clockwise from top:
Ugly Sisters @ Queens Theatre, photo: Nobby Clarke;
Shakespeare’s Globe, photo: Manuel Harlan; Hot Mikado
at Queen’s Theatre,Hornchurch; BBC Symphony Orchestra,
photo: L. Platman; Roundhouse, photo: Steve White
Snapshot Audience Report6 7
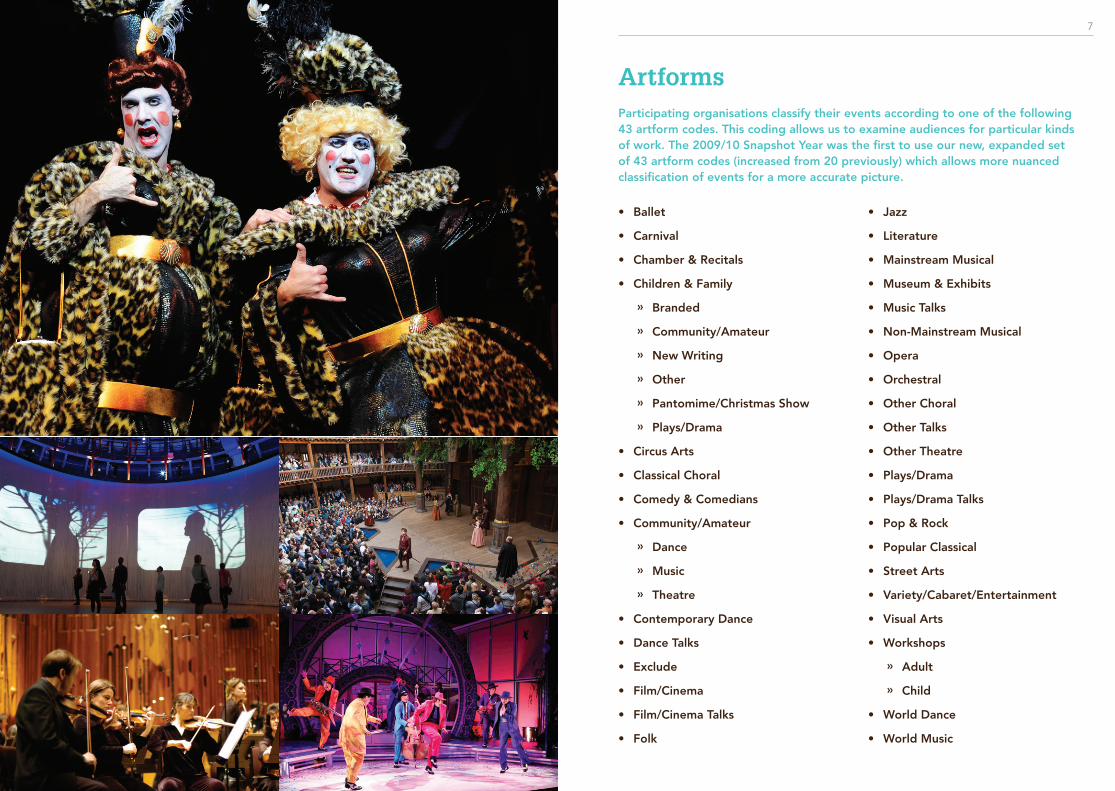
Artforms Participating organisations classify their events according to one of the following 43 artform codes. This coding allows us to examine audiences for particular kinds of work. The 2009/10 Snapshot Year was the first to use our new, expanded set of 43 artform codes (increased from 20 previously) which allows more nuanced classification of events for a more accurate picture.
• Ballet
• Carnival
• Chamber & Recitals
• Children & Family
» Branded
» Community/Amateur
» New Writing
» Other
» Pantomime/Christmas Show
» Plays/Drama
• Circus Arts
• Classical Choral
• Comedy & Comedians
• Community/Amateur
» Dance
» Music
» Theatre
• Contemporary Dance
• Dance Talks
• Exclude
• Film/Cinema
• Film/Cinema Talks
• Folk
• Jazz
• Literature
• Mainstream Musical
• Museum & Exhibits
• Music Talks
• Non-Mainstream Musical
• Opera
• Orchestral
• Other Choral
• Other Talks
• Other Theatre
• Plays/Drama
• Plays/Drama Talks
• Pop & Rock
• Popular Classical
• Street Arts
• Variety/Cabaret/Entertainment
• Visual Arts
• Workshops
» Adult
» Child
• World Dance
• World Music
Snapshot Audience Report8 9
Are audiences growing?
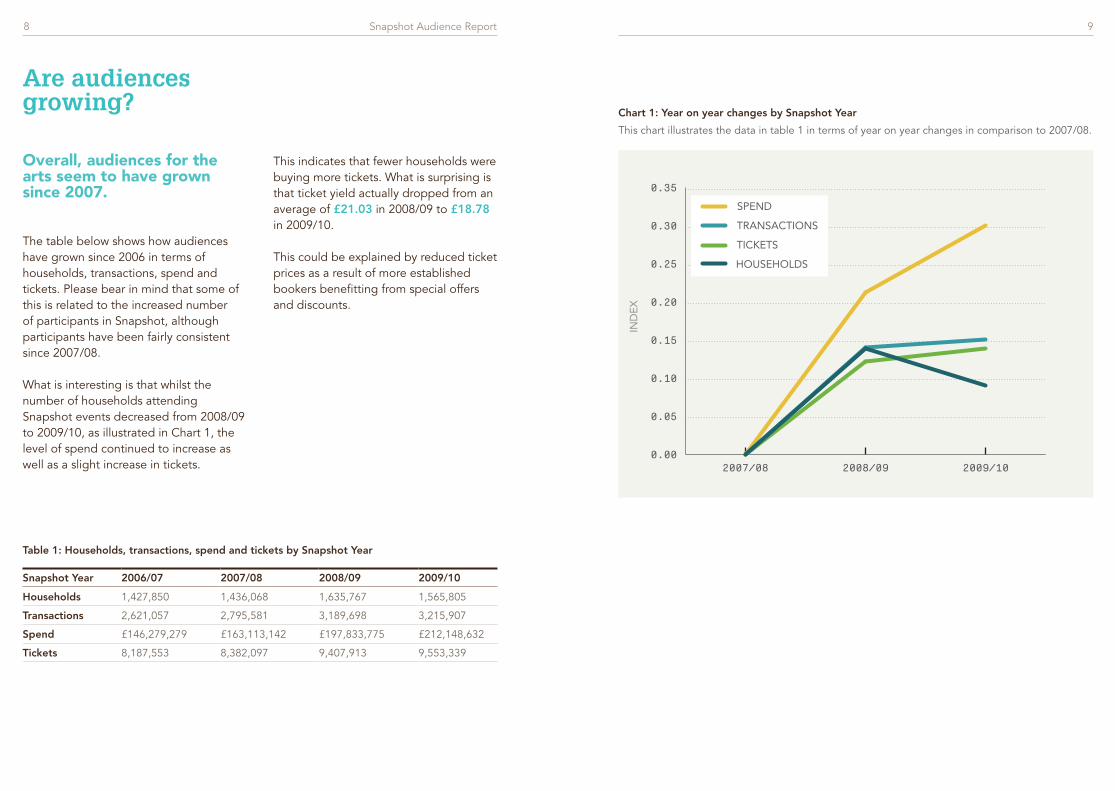
Table 1: Households, transactions, spend and tickets by Snapshot Year
Snapshot Year 2006/07 2007/08 2008/09 2009/10
Households 1,427,850 1,436,068 1,635,767 1,565,805
Transactions 2,621,057 2,795,581 3,189,698 3,215,907
Spend £146,279,279 £163,113,142 £197,833,775 £212,148,632
Tickets 8,187,553 8,382,097 9,407,913 9,553,339
Overall, audiences for the arts seem to have grown since 2007.
The table below shows how audiences have grown since 2006 in terms of households, transactions, spend and tickets. Please bear in mind that some of this is related to the increased number of participants in Snapshot, although participants have been fairly consistent since 2007/08.
What is interesting is that whilst the number of households attending Snapshot events decreased from 2008/09 to 2009/10, as illustrated in Chart 1, the level of spend continued to increase as well as a slight increase in tickets.
This indicates that fewer households were buying more tickets. What is surprising is that ticket yield actually dropped from an average of £21.03 in 2008/09 to £18.78 in 2009/10.
This could be explained by reduced ticket prices as a result of more established bookers benefitting from special offers and discounts.
This chart illustrates the data in table 1 in terms of year on year changes in comparison to 2007/08.
Chart 1: Year on year changes by Snapshot Year
0.00
0.05
0.10
0.15
0.20
0.25
0.30
0.35
Tickets
Spend
TransactionsHouseholds
2009/102008/092007/08
TICKETS
SPEND
TRANSACTIONS
HOUSEHOLDS
IND
EX
UP TO 1%
2% TO 4%
5% TO 9%
10% PLUS
% of households attending in each postal-sector in Snapshot data set 2009/10
Snapshot Audience Report10 11
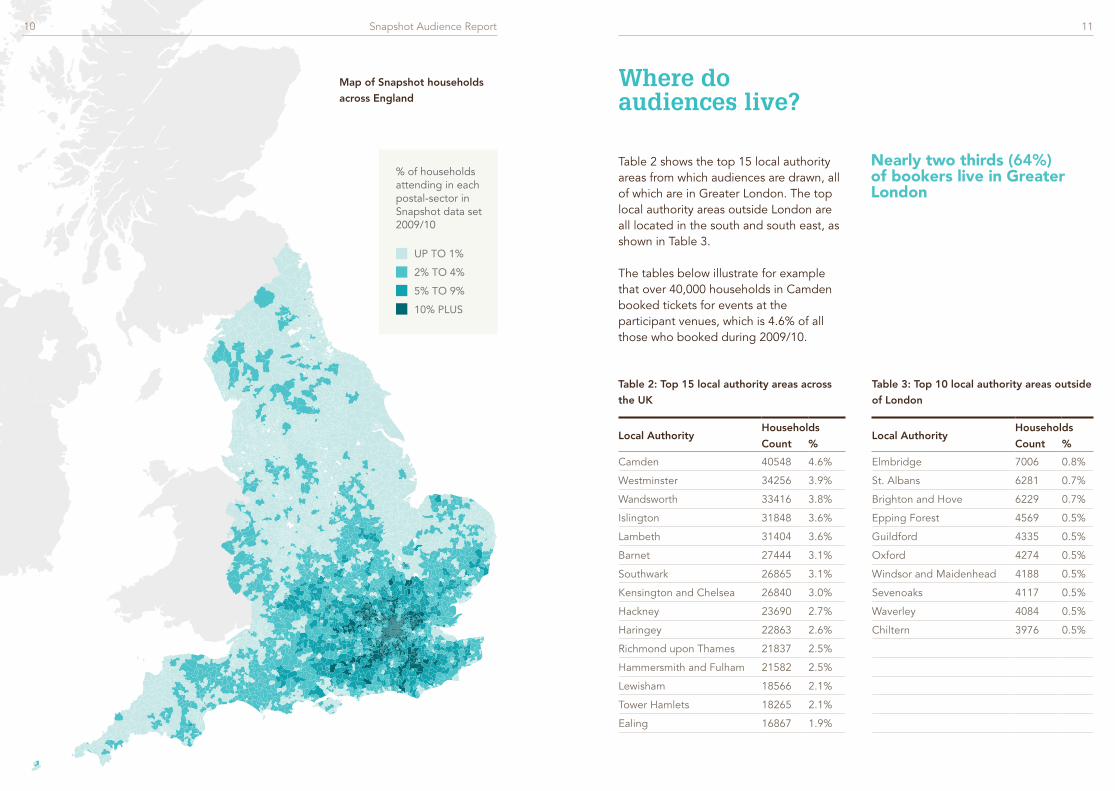
Table 2: Top 15 local authority areas across
the UK
Local AuthorityHouseholds
Count %
Camden 40548 4.6%
Westminster 34256 3.9%
Wandsworth 33416 3.8%
Islington 31848 3.6%
Lambeth 31404 3.6%
Barnet 27444 3.1%
Southwark 26865 3.1%
Kensington and Chelsea 26840 3.0%
Hackney 23690 2.7%
Haringey 22863 2.6%
Richmond upon Thames 21837 2.5%
Hammersmith and Fulham 21582 2.5%
Lewisham 18566 2.1%
Tower Hamlets 18265 2.1%
Ealing 16867 1.9%
Table 2 shows the top 15 local authority areas from which audiences are drawn, all of which are in Greater London. The top local authority areas outside London are all located in the south and south east, as shown in Table 3.
The tables below illustrate for example that over 40,000 households in Camden booked tickets for events at the participant venues, which is 4.6% of all those who booked during 2009/10.
Table 3: Top 10 local authority areas outside
of London
Local AuthorityHouseholds
Count %
Elmbridge 7006 0.8%
St. Albans 6281 0.7%
Brighton and Hove 6229 0.7%
Epping Forest 4569 0.5%
Guildford 4335 0.5%
Oxford 4274 0.5%
Windsor and Maidenhead 4188 0.5%
Sevenoaks 4117 0.5%
Waverley 4084 0.5%
Chiltern 3976 0.5%
Where do audiences live?
Map of Snapshot households
across England
Nearly two thirds (64%) of bookers live in Greater London

Snapshot Audience Report12 13
Using the postcode of a venue and bookers’ postcodes we can work out how far audiences live from the venues they have booked for. This is worked out using estimations of the distance by road rather than as the crow flies and is known as ‘drive distance’.
We can find out about demographics by using Experian’s Mosaic profiling system to infer bookers’ characteristics from their postcodes. Mosaic classifies all UK postcodes into 15 Groups which are broken down into 67 Types. It provides rich information about what people in these segments are likely to think and do.
Overleaf is the Mosaic profile for all households who attended Snapshot venues in 2009/10 with the equivalent breakdown for the London population for comparison.
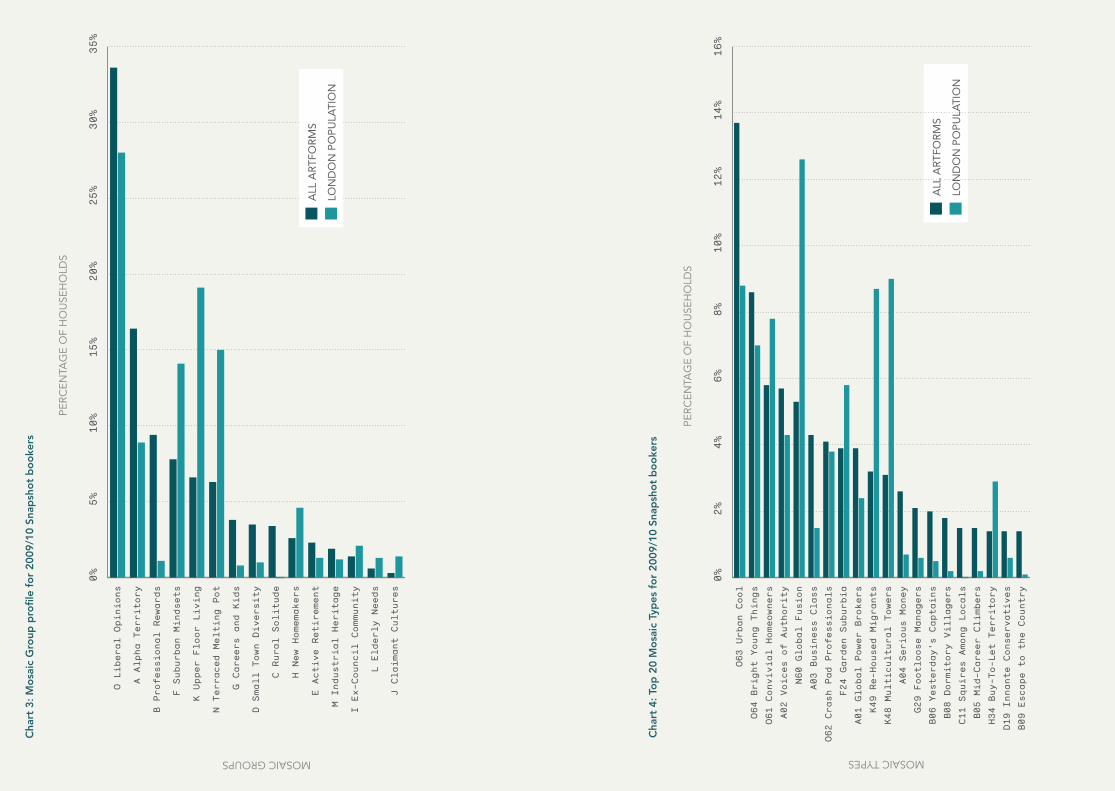
This 2009/10 profile tells us that audiences represented in Snapshot tend to come from areas dominated by well-educated professionals with a high propensity to attend arts events. However, most of the key Mosaic Types represented, especially those in the Liberal Opinions Group, describe very diverse neighbourhoods with a rich mix of cultural backgrounds. We should also bear in mind the proportion of households from each type in the population: although the wealthy Global Power Brokers Type is over-represented compared to the London population, and the more deprived Multicultural Towers Type is under-represented, households in these types make up a similar proportion of the Snapshot data set.
The chart below shows profiles for a number of artforms as well as the overall benchmark for 2009/10.
Drive distance varies considerably between different artforms. Children & Family Branded events draw particularly local audiences whereas, for Plays/Drama bookers come from further afield. Outer London venues draw a much higher proportion of their audience from the local area than inner London venues.
One third of audiences live within 5 miles of the venue they visit
The Liberal Opinions Mosaic Group makes up over a third of audiences.
Several of the key Mosaic Types come from the Group Liberal Opinions. This group generally includes urban neighbourhoods with young(ish), educated professionals, often working in the creative industries. Liberal Opinions households make up 33.6% of the 2009/10 data set.
The Types Crash Pad Professionals and Bright Young Things, part of the Liberal Opinions Group, are more likely to include households of recent graduates, renting a flat with friends or a partner, with Bright Young Things more centrally based (e.g. Hammersmith) and Crash Pad Professionals further out (e.g. Wimbledon or Bromley). Convivial Homeowners and Urban Cool are types with a slightly older age profile, more likely to be families living in Victorian terraces, with Urban Cool based centrally (e.g. Camden or Islington) and Convivial Homeowners further out (e.g. Ealing). Urban Cool is particularly over-represented compared to the London population.
Chart 2: Drive distance for all artforms, Plays/Drama, Workshops - Child and Children &
Family Branded
0%
10%
20%
30%
40%
50%
60%
70%
150+100-14950-9940-4930-3920-2910-196-90-5
PE
RC
EN
TAG
E O
F H
OU
SEH
OLD
S
DRIVE DISTANCE FROM PERFORMANCE VENUE (MILES)
WORKSHOPS - CHILD
PLAYS/DRAMA
CHILDREN & FAMILY BRANDED
ALL ARTFORMS
How far do audiences travel?
What are audiences like?
MOSAIC GROUPS
PE
RC
EN
TAG
E O
F H
OU
SEH
OLD
S
0%5%
10%
15%
20%
25%
30%
35%
J Claimant Cultures
L Elderly Needs
I Ex-Council Community
M Industrial Heritage
E Active Retirement
H New Homemakers
C Rural Solitude
D Small Town Diversity
G Careers and Kids
N Terraced Melting Pot
K Upper Floor Living
F Suburban Mindsets
B Professional Rewards
A Alpha Territory
O Liberal Opinions
ALL
AR
TFO
RM
S
LON
DO
N P
OP
ULA
TIO
N
PE
RC
EN
TAG
E O
F H
OU
SEH
OLD
S
MOSAIC TYPES
ALL
AR
TFO
RM
S
LON
DO
N P
OP
ULA
TIO
N
0%2%
4%6%
8%10%
12%
14%
16%
B09 Es
cape to the Country
D19 In
nante Conservatives
H34 Buy-To-Let Territory
B05
Mid-Career Climbers
C11 Squires Among Locals
B08
Dormitory Villagers
B06 Yesterday's Captains
G29 Footloose Managers
A04 Serious Money
K48 Multicultural Towers
K49 Re-Housed Migrants
A01 Global Power Brokers
F24 Garden Suburbia
O62 Crash Pad Professionals
A03 Business Class
N60 Global Fusion
A02 Voices of Authority
O61 Convivial Homeowners
O64 Bright Young Things
O63 Urban Cool
Cha
rt 4
: To
p 2
0 M
osa
ic T
ypes
fo
r 20
09/1
0 Sn
apsh
ot
bo
oke
rs
Cha
rt 3
: Mo
saic
Gro
up p
rofil
e fo
r 20
09/1
0 Sn
apsh
ot
bo
oke
rs
Snapshot Audience Report16 17
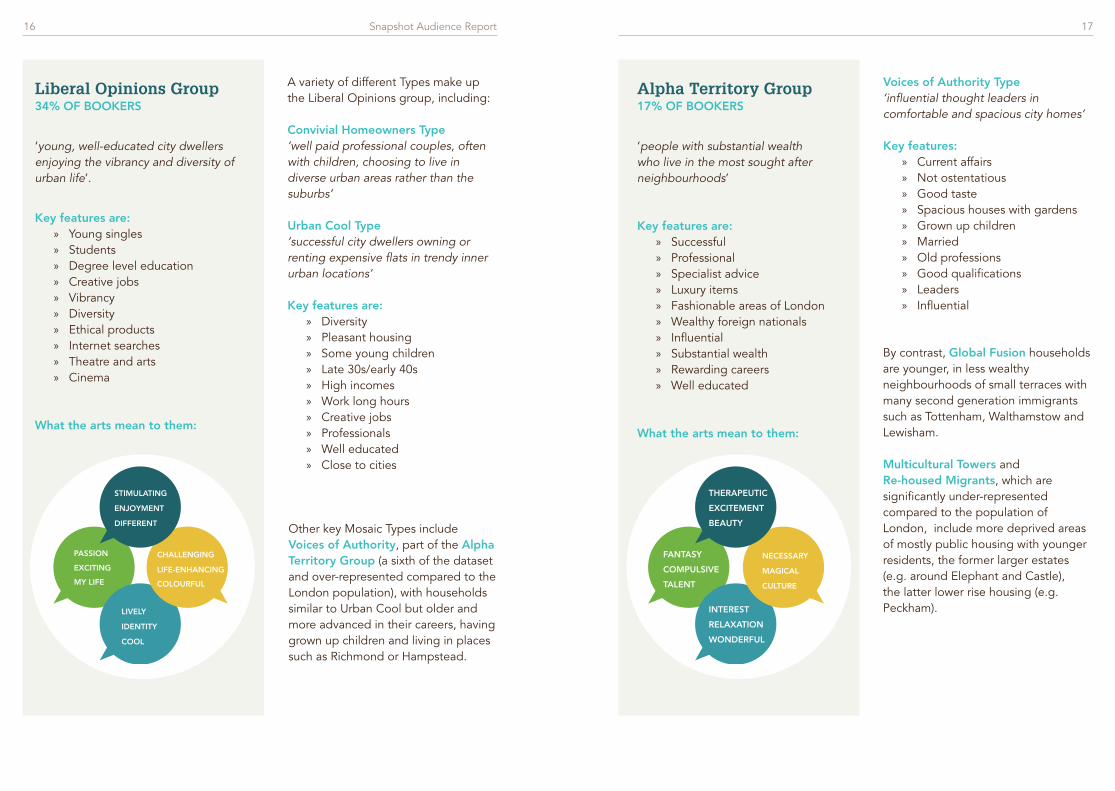
Liberal Opinions Group34% OF BOOKERS
‘young, well-educated city dwellers enjoying the vibrancy and diversity of urban life’.
Key features are: » Young singles » Students » Degree level education » Creative jobs » Vibrancy » Diversity » Ethical products » Internet searches » Theatre and arts » Cinema
What the arts mean to them:
A variety of different Types make up the Liberal Opinions group, including:
Convivial Homeowners Type ‘well paid professional couples, often with children, choosing to live in diverse urban areas rather than the suburbs’
Urban Cool Type ‘successful city dwellers owning or renting expensive flats in trendy inner urban locations’
Key features are: » Diversity » Pleasant housing » Some young children » Late 30s/early 40s » High incomes » Work long hours » Creative jobs » Professionals » Well educated » Close to cities
Alpha Territory Group17% OF BOOKERS
‘people with substantial wealth who live in the most sought after neighbourhoods’
Key features are: » Successful » Professional » Specialist advice » Luxury items » Fashionable areas of London » Wealthy foreign nationals » Influential » Substantial wealth » Rewarding careers » Well educated
What the arts mean to them:
Voices of Authority Type ‘influential thought leaders in comfortable and spacious city homes’
Key features: » Current affairs » Not ostentatious » Good taste » Spacious houses with gardens » Grown up children » Married » Old professions » Good qualifications » Leaders » Influential
Other key Mosaic Types include Voices of Authority, part of the Alpha Territory Group (a sixth of the dataset and over-represented compared to the London population), with households similar to Urban Cool but older and more advanced in their careers, having grown up children and living in places such as Richmond or Hampstead.
By contrast, Global Fusion households are younger, in less wealthy neighbourhoods of small terraces with many second generation immigrants such as Tottenham, Walthamstow and Lewisham.
Multicultural Towers and Re-housed Migrants, which are significantly under-represented compared to the population of London, include more deprived areas of mostly public housing with younger residents, the former larger estates (e.g. around Elephant and Castle), the latter lower rise housing (e.g. Peckham).LIVELY
IDENTITY
COOL
STIMULATING
DIFFERENT
ENJOYMENT
MY LIFE
PASSION
EXCITING
CHALLENGING
COLOURFUL
LIFE-ENHANCING COMPULSIVE
TALENT
FANTASY
THERAPEUTIC
BEAUTY
EXCITEMENT
RELAXATION
WONDERFUL
INTEREST
CULTURE
MAGICAL
NECESSARY
Snapshot Audience Report18 19
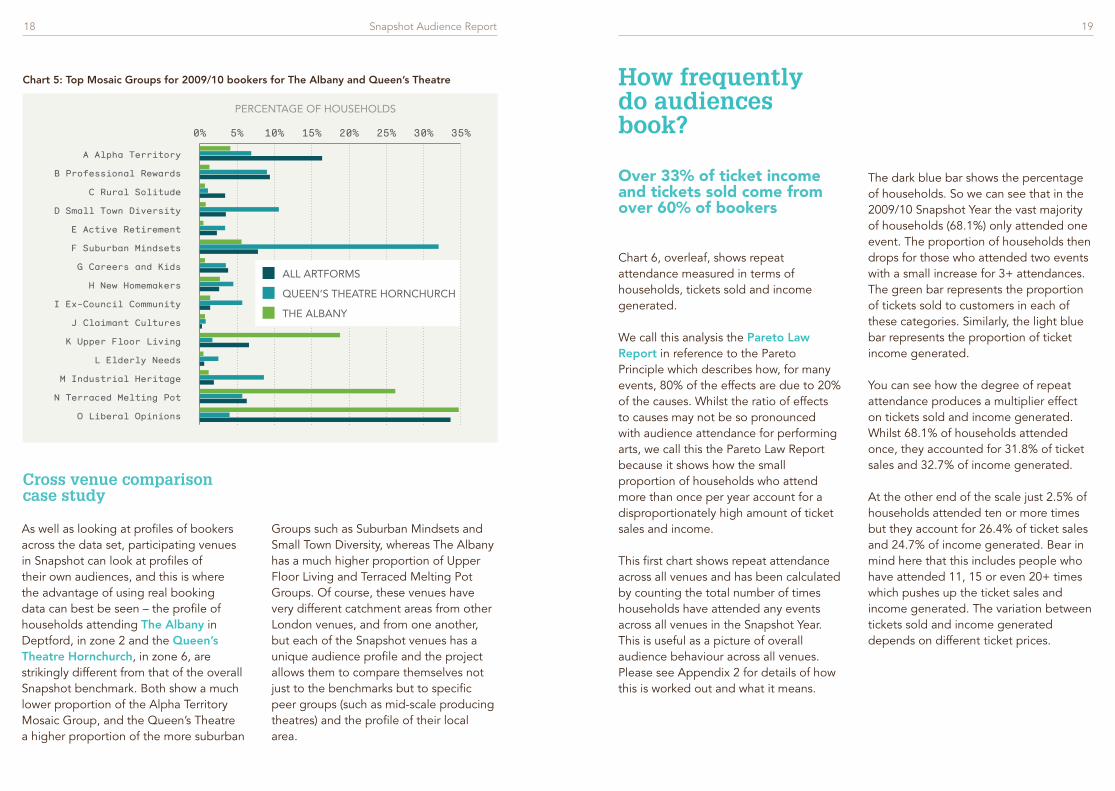
As well as looking at profiles of bookers across the data set, participating venues in Snapshot can look at profiles of their own audiences, and this is where the advantage of using real booking data can best be seen – the profile of households attending The Albany in Deptford, in zone 2 and the Queen’s Theatre Hornchurch, in zone 6, are strikingly different from that of the overall Snapshot benchmark. Both show a much lower proportion of the Alpha Territory Mosaic Group, and the Queen’s Theatre a higher proportion of the more suburban
Groups such as Suburban Mindsets and Small Town Diversity, whereas The Albany has a much higher proportion of Upper Floor Living and Terraced Melting Pot Groups. Of course, these venues have very different catchment areas from other London venues, and from one another, but each of the Snapshot venues has a unique audience profile and the project allows them to compare themselves not just to the benchmarks but to specific peer groups (such as mid-scale producing theatres) and the profile of their local area.
Chart 5: Top Mosaic Groups for 2009/10 bookers for The Albany and Queen’s Theatre
Cross venue comparison case study
How frequently do audiences book?
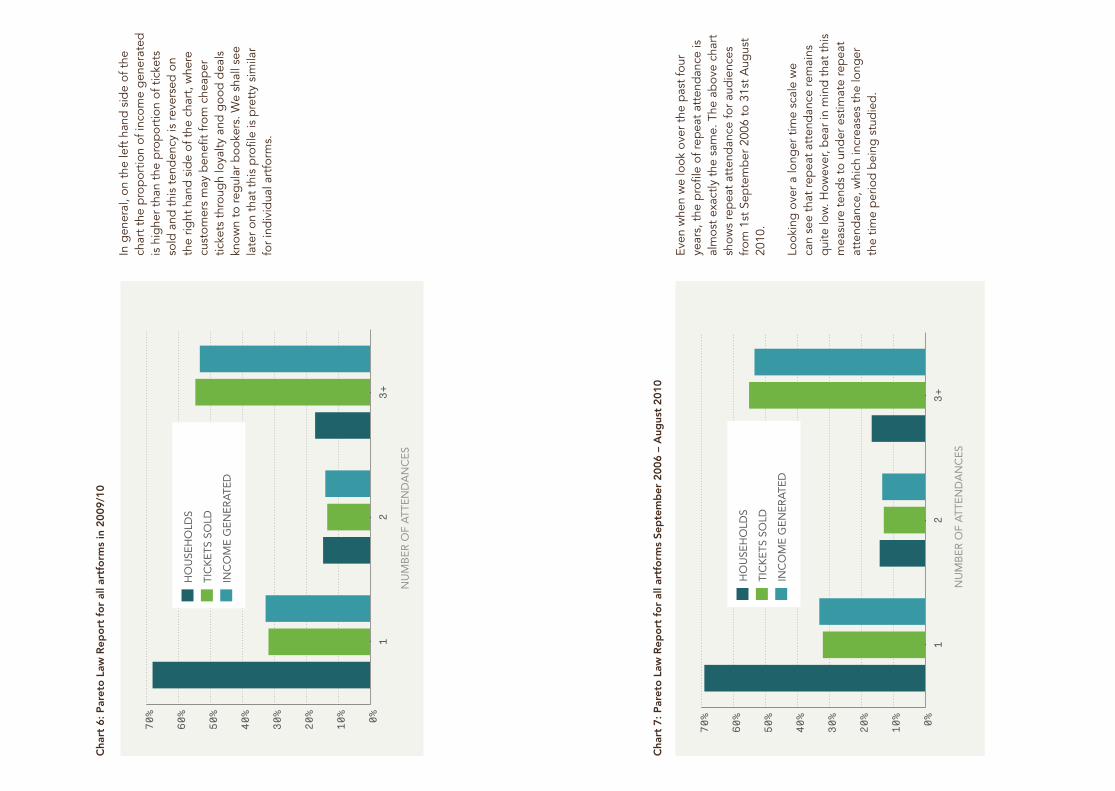
Chart 6, overleaf, shows repeat attendance measured in terms of households, tickets sold and income generated.
We call this analysis the Pareto Law Report in reference to the Pareto Principle which describes how, for many events, 80% of the effects are due to 20% of the causes. Whilst the ratio of effects to causes may not be so pronounced with audience attendance for performing arts, we call this the Pareto Law Report because it shows how the small proportion of households who attend more than once per year account for a disproportionately high amount of ticket sales and income.
This first chart shows repeat attendance across all venues and has been calculated by counting the total number of times households have attended any events across all venues in the Snapshot Year. This is useful as a picture of overall audience behaviour across all venues. Please see Appendix 2 for details of how this is worked out and what it means.
The dark blue bar shows the percentage of households. So we can see that in the 2009/10 Snapshot Year the vast majority of households (68.1%) only attended one event. The proportion of households then drops for those who attended two events with a small increase for 3+ attendances. The green bar represents the proportion of tickets sold to customers in each of these categories. Similarly, the light blue bar represents the proportion of ticket income generated.
You can see how the degree of repeat attendance produces a multiplier effect on tickets sold and income generated. Whilst 68.1% of households attended once, they accounted for 31.8% of ticket sales and 32.7% of income generated.
At the other end of the scale just 2.5% of households attended ten or more times but they account for 26.4% of ticket sales and 24.7% of income generated. Bear in mind here that this includes people who have attended 11, 15 or even 20+ times which pushes up the ticket sales and income generated. The variation between tickets sold and income generated depends on different ticket prices.
Over 33% of ticket income and tickets sold come from over 60% of bookers
0% 5% 10% 15% 20% 25% 30% 35%
O Liberal Opinions
N Terraced Melting Pot
M Industrial Heritage
L Elderly Needs
K Upper Floor Living
J Claimant Cultures
I Ex-Council Community
H New Homemakers
G Careers and Kids
F Suburban Mindsets
E Active Retirement
D Small Town Diversity
C Rural Solitude
B Professional Rewards
A Alpha Territory
ALL ARTFORMS
QUEEN’S THEATRE HORNCHURCH
THE ALBANY
PERCENTAGE OF HOUSEHOLDS
Cha
rt 6
: Par
eto
Law
Rep
ort
fo
r al
l art
form
s in
200
9/10
0%10%
20%
30%
40%
50%
60%
70%
3+2
1
TIC
KE
TS S
OLD
INC
OM
E G
EN
ER
ATE
D
HO
USE
HO
LDS
NU
MB
ER
OF
ATT
EN
DA
NC
ES
Cha
rt 7
: Par
eto
Law
Rep
ort
fo
r al
l art
form
s Se
pte
mb
er 2
006
– A
ugus
t 20
10
In g
ener
al, o
n th
e le
ft h
and
sid
e of
the
ch
art
the
pro
por
tion
of in
com
e g
ener
ated
is
hig
her
than
the
pro
por
tion
of t
icke
ts
sold
and
thi
s te
nden
cy is
reve
rsed
on
the
right
han
d s
ide
of t
he c
hart
, whe
re
cust
omer
s m
ay b
enefi
t fr
om c
heap
er
ticke
ts t
hrou
gh
loya
lty a
nd g
ood
dea
ls
know
n to
reg
ular
boo
kers
. We
shal
l see
la
ter
on t
hat
this
pro
file
is p
rett
y si
mila
r fo
r in
div
idua
l art
form
s.
Even
whe
n w
e lo
ok o
ver
the
pas
t fo
ur
year
s, t
he p
rofil
e of
rep
eat
atte
ndan
ce is
al
mos
t ex
actly
the
sam
e. T
he a
bov
e ch
art
show
s re
pea
t at
tend
ance
for
aud
ienc
es
from
1st
Sep
tem
ber
200
6 to
31s
t A
ugus
t 20
10.
Look
ing
ove
r a
long
er t
ime
scal
e w
e ca
n se
e th
at re
pea
t at
tend
ance
rem
ains
q
uite
low
. How
ever
, bea
r in
min
d t
hat
this
m
easu
re t
end
s to
und
er e
stim
ate
rep
eat
atte
ndan
ce, w
hich
incr
ease
s th
e lo
nger
th
e tim
e p
erio
d b
eing
stu
die
d.
0%10%
20%
30%
40%
50%
60%
70%
3+2
1
TIC
KE
TS S
OLD
INC
OM
E G
EN
ER
ATE
D
HO
USE
HO
LDS
NU
MB
ER
OF
ATT
EN
DA
NC
ES
Snapshot Audience Report22 23
0%
5%
10%
15%
20%
25%
30%
>1 year274-365Days
183-273Days
91-182Days
61-90Days
29-60Days
15-28Days
8-14Days
2-7Days
Daybefore
On the day
2009/102008/092007/082006/07
DAYS BEFORE PERFORMANCE
PE
RC
EN
TAG
E O
F H
OU
SEH
OLD
S
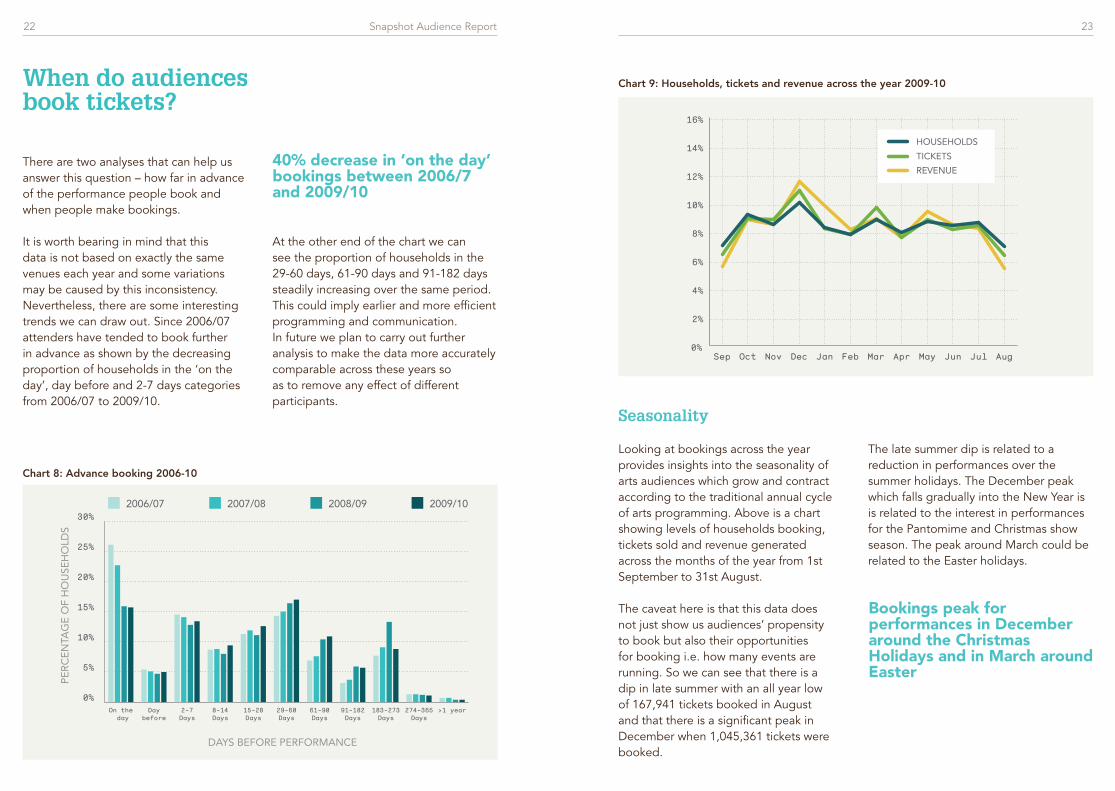
When do audiences book tickets?
There are two analyses that can help us answer this question – how far in advance of the performance people book and when people make bookings.
It is worth bearing in mind that this data is not based on exactly the same venues each year and some variations may be caused by this inconsistency. Nevertheless, there are some interesting trends we can draw out. Since 2006/07 attenders have tended to book further in advance as shown by the decreasing proportion of households in the ‘on the day’, day before and 2-7 days categories from 2006/07 to 2009/10.
At the other end of the chart we can see the proportion of households in the 29-60 days, 61-90 days and 91-182 days steadily increasing over the same period. This could imply earlier and more efficient programming and communication. In future we plan to carry out further analysis to make the data more accurately comparable across these years so as to remove any effect of different participants.
40% decrease in ‘on the day’ bookings between 2006/7 and 2009/10
Seasonality
Looking at bookings across the year provides insights into the seasonality of arts audiences which grow and contract according to the traditional annual cycle of arts programming. Above is a chart showing levels of households booking, tickets sold and revenue generated across the months of the year from 1st September to 31st August.
The caveat here is that this data does not just show us audiences’ propensity to book but also their opportunities for booking i.e. how many events are running. So we can see that there is a dip in late summer with an all year low of 167,941 tickets booked in August and that there is a significant peak in December when 1,045,361 tickets were booked.
The late summer dip is related to a reduction in performances over the summer holidays. The December peak which falls gradually into the New Year is is related to the interest in performances for the Pantomime and Christmas show season. The peak around March could be related to the Easter holidays.
Chart 9: Households, tickets and revenue across the year 2009-10
Chart 8: Advance booking 2006-10
0%
2%
4%
6%
8%
10%
12%
14%
16%
AugJulJunMayAprMarFebJanDecNovOctSep
REVENUE
TICKETS
HOUSEHOLDS
Bookings peak for performances in December around the Christmas Holidays and in March around Easter

Snapshot Audience Report24 25
Table 4: Households, spend, tickets and ticket yield for top 10 artforms in 2009/10
Artform Households Spend TicketsAverage
Ticket Yield
Plays/Drama 447,870 £42,800,974 2,142,717 £19.98
Ballet 163,619 £23,302,246 634,280 £36.74
Opera 134,260 £30,971,403 598,601 £51.74
Orchestral 106,876 £11,758,359 685,817 £17.15
Pop & Rock 93,375 £14,871,663 509,666 £29.18
Popular Classical 65,787 £7,415,959 278,304 £26.65
Contemporary Dance 55,178 £3,938,196 196,040 £20.09
Variety/Cabaret/Entertainment 50,273 £12,584,156 262,398 £47.96
World Dance 47,330 £5,287,210 146,977 £35.97
Children & Family Pantomime/ Christmas Show
34,766 £2,921,181 221,730 £13.17
Artform analysis 2009/10
Do audiences move between venues and artforms?
Let’s now look at some artforms in more detail. The following table is a summary of sales information for the top ten artforms. We have excluded Films/Cinema as the data for this artform is not complete, only covering a small number of cinemas.
The majority of audiences tend to favour one venue and one artform Chart 10 below shows the proportions of households in terms of whether they attend one, two, three, four or five or more times in the 2009/10 Snapshot Year. It also indicates the equivalent proportions for tickets sold and revenue generated.
As you can see this pattern mirrors the profile of repeat attendance with a high proportion of less engaged audiences who only attended a single venue and a relatively small core audience who attend two or more venues. As with repeat attendance, those attending two or more venues account for proportionally more tickets sold and income generated than those who only go to one. The effect is more pronounced with 85.5% of
Chart 10: Households, tickets and revenue by number of venues attended in 2009/10
0%
20%
40%
60%
80%
100%
5+4321
TICKETS SOLD
INCOME GENERATED
HOUSEHOLDS
NUMBER OF VENUES ATTENDED
Plays/Drama accounts for 29% of households, 20% of spend and 22% of tickets, Orchestral for 7% of households, 6% spend, 7% of tickets and Contemporary Dance for 4% of households, 2% of spend and 2% of tickets.
Snapshot Audience Report26 27
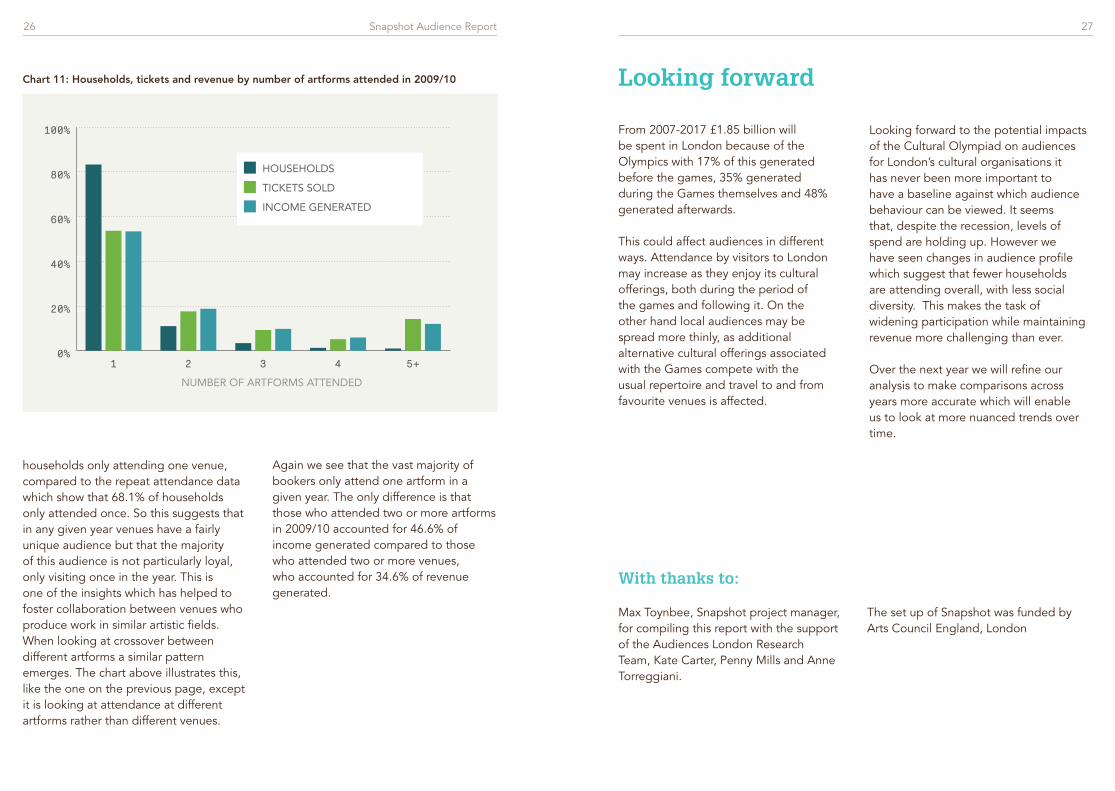
households only attending one venue, compared to the repeat attendance data which show that 68.1% of households only attended once. So this suggests that in any given year venues have a fairly unique audience but that the majority of this audience is not particularly loyal, only visiting once in the year. This is one of the insights which has helped to foster collaboration between venues who produce work in similar artistic fields. When looking at crossover between different artforms a similar pattern emerges. The chart above illustrates this, like the one on the previous page, except it is looking at attendance at different artforms rather than different venues.
Again we see that the vast majority of bookers only attend one artform in a given year. The only difference is that those who attended two or more artforms in 2009/10 accounted for 46.6% of income generated compared to those who attended two or more venues, who accounted for 34.6% of revenue generated.
Looking forward
From 2007-2017 £1.85 billion will be spent in London because of the Olympics with 17% of this generated before the games, 35% generated during the Games themselves and 48% generated afterwards.
This could affect audiences in different ways. Attendance by visitors to London may increase as they enjoy its cultural offerings, both during the period of the games and following it. On the other hand local audiences may be spread more thinly, as additional alternative cultural offerings associated with the Games compete with the usual repertoire and travel to and from favourite venues is affected.
Chart 11: Households, tickets and revenue by number of artforms attended in 2009/10
0%
20%
40%
60%
80%
100%
5+4321
TICKETS SOLD
INCOME GENERATED
HOUSEHOLDS
NUMBER OF ARTFORMS ATTENDED
Looking forward to the potential impacts of the Cultural Olympiad on audiences for London’s cultural organisations it has never been more important to have a baseline against which audience behaviour can be viewed. It seems that, despite the recession, levels of spend are holding up. However we have seen changes in audience profile which suggest that fewer households are attending overall, with less social diversity. This makes the task of widening participation while maintaining revenue more challenging than ever.
Over the next year we will refine our analysis to make comparisons across years more accurate which will enable us to look at more nuanced trends over time.
With thanks to:
Max Toynbee, Snapshot project manager, for compiling this report with the support of the Audiences London Research Team, Kate Carter, Penny Mills and Anne Torreggiani.
The set up of Snapshot was funded by Arts Council England, London
Snapshot Audience Report28 29
Mosaic Groups and Types: Mosaic is a geo-demographic classification tool, provided by Experian, that paints a picture of UK consumers in terms of demographics, lifestyles and behaviour. It provides a detailed understanding of UK society by classifying all UK postcodes into 15 Groups which are broken down into 67 Types. If you would like to request further Mosaic Group and Type information then please contact Audiences London or visit www.audienceslondon.org/mosaic
Penetration: Refers to the proportion of households in a dataset in relation to the total number of households in each postcode sector (approx. 2,600). On a penetration map different postal sectors are shaded darker or lighter according to the degree of penetration. Darker areas indicate where there is a higher density of households in the dataset.
Snapshot Year: Runs from 1st September to 31st August each year roughly in line with most organisations’ programming seasons.
Glossary
Artform: A descriptive classification for events based largely on genre.
Event: A particular work/piece which may be repeated in a number of performances. A set run of performances is known as an event.
Frequency of attendance: The number of visits made to arts events covered by Snapshot London: Performing Arts in a given period of time.
Household: A unique address, which might contain a number of bookers, and could be made up of a family or housemates who book tickets together or individually.
Individual customer: Refers to the patron name and full postal address recorded against the transaction analysed.
Snapshot Audience Report30 31
Appendices
Appendix 1: Measuring audience behaviour across venues
Individual customers are identified by using the postcode of the booker (derived from their transaction details i.e. credit or debit card address). These individual customers are worked out separately for each individual venue, for example Mr Bloggs who lives at SE1 3ER is identified as an individual customer in the Barbican’s data as he bought three tickets for a play there in July 2010 as well as two tickets for a film there in November 2008. Mr Bloggs attended the play in July 2010 with his wife and daughter and attended the film in November with his son so the tickets he bought actually represent attendances by other members of the household as well as him. Additionally, his daughter Ms Bloggs bought two tickets for a show at the Almeida in October 2009 which she attended with her father, Mr Bloggs.
Within Snapshot we analyse data at household level by grouping these individual customers into households. One issue with this is that over time it is difficult to track individual customers as they move house, or change their bank details. Working out households can also be less accurate for people who do not live as a traditional family unit such as students living in flat-shares or people who move homes frequently.
Plays/Drama event at venue A, a Plays/Drama event at venue B and a Plays/Drama event at venue C. In that year Max will show up in the ‘one time attenders’ column on the individual Pareto Law reports for Venue A, Venue B and Venue C. However, he will show up in the ‘three time attenders’ column in the Snapshot database Pareto benchmark report.
The total benchmark is useful for showing a picture of arts attenders’ behaviour in general. It gives you an overall view of how many times people attend events for particular artforms across a number of venues in London to help you see the overall level of engagement and repeat attendance for the artform as a whole.
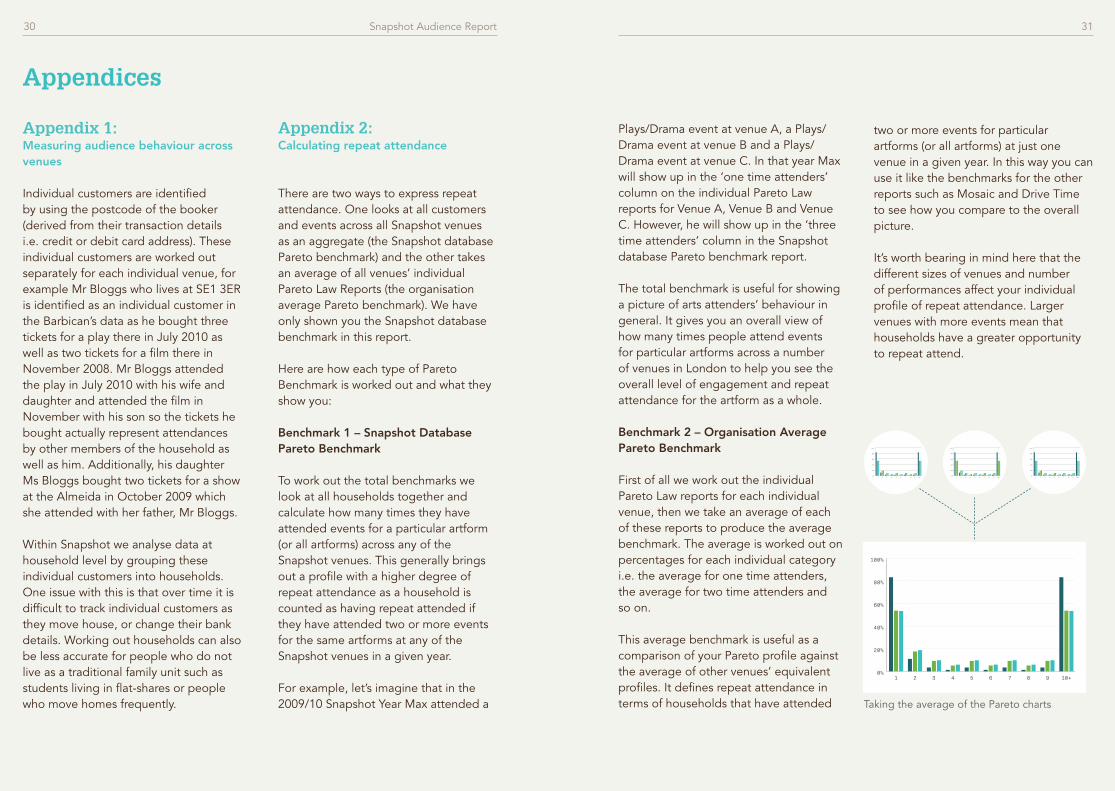
Benchmark 2 – Organisation Average Pareto Benchmark
First of all we work out the individual Pareto Law reports for each individual venue, then we take an average of each of these reports to produce the average benchmark. The average is worked out on percentages for each individual category i.e. the average for one time attenders, the average for two time attenders and so on.
This average benchmark is useful as a comparison of your Pareto profile against the average of other venues’ equivalent profiles. It defines repeat attendance in terms of households that have attended
Appendix 2: Calculating repeat attendance
There are two ways to express repeat attendance. One looks at all customers and events across all Snapshot venues as an aggregate (the Snapshot database Pareto benchmark) and the other takes an average of all venues’ individual Pareto Law Reports (the organisation average Pareto benchmark). We have only shown you the Snapshot database benchmark in this report.
Here are how each type of Pareto Benchmark is worked out and what they show you:
Benchmark 1 – Snapshot Database Pareto Benchmark
To work out the total benchmarks we look at all households together and calculate how many times they have attended events for a particular artform (or all artforms) across any of the Snapshot venues. This generally brings out a profile with a higher degree of repeat attendance as a household is counted as having repeat attended if they have attended two or more events for the same artforms at any of the Snapshot venues in a given year.
For example, let’s imagine that in the 2009/10 Snapshot Year Max attended a
two or more events for particular artforms (or all artforms) at just one venue in a given year. In this way you can use it like the benchmarks for the other reports such as Mosaic and Drive Time to see how you compare to the overall picture.
It’s worth bearing in mind here that the different sizes of venues and number of performances affect your individual profile of repeat attendance. Larger venues with more events mean that households have a greater opportunity to repeat attend.
Taking the average of the Pareto charts
0%
20%
40%
60%
80%
100%
10+9876543210%
20%
40%
60%
80%
100%
10+9876543210%
20%
40%
60%
80%
100%
10+987654321
0%
20%
40%
60%
80%
100%
10+987654321
Snapshot Audience Report32 33
Whether you need to understand your audiences, identify potential, devise targeted marketing campaigns, increase income, engagement and reach or set and measure KPIs, we offer every client a tailored package of resources, consultancy and support at the level that best suits their needs. Talk to us about how our team’s in-depth knowledge of the sector can best serve your organisation and region.
Our services offer practical advice and intelligence to help you achieve your audience development objectives. Our services are available nationally throughout England.
For general enquiries contact: [email protected] 020 7407 4625
For more information on Audiences London services visit: www.audienceslondon.org/services
Data analysis and profiling – a range of tools which give you insights into the socio-demograhpics and levels of arts engagement of your audiences or catchment area. Our profiling tools include Mosaic UK 2009, Acorn and ACE Arts Audiences: Insight, we also provide tailored Area Profile Reports and a full post-code mapping service.
Audience research services and consultancy – a tailored approach to identifying your audience information needs and devising research programmes to suit, delivered by a team experienced in using qualitative and quantitative methodologies effectively.
Strategic Advice – audience development, marketing and community engagement consultancy shaped to meet your organisational needs, providing you with practical tools, insight, ideas and support whether you’re involved with organisational development, devising objectives, reaching new audiences or programme development.
Audiences London Services
Snapshot Audience Report34
Joining Snapshot: Performing Arts
Join Snapshot from £700 per year
• Daily audience data extraction from box office systems
• Box office data is automatically extracted and collated to map and profile audiences, attendance patterns and booking behaviours.
• Online access to view your data and compare with others, including venue crossover
• Annual overall benchmark report and custom reports for your organisation
• Great basis for bespoke audience research and additional analysis
• Networking with peers and discussion events
To find out how you can benefit from Snapshot, please contact us at [email protected] 020 7407 4625
Find out more at www.audienceslondon.org/snapshot
Sharing and comparing audience intelligence
• Keep track of your audiences: who comes, how often and why?
• Understand trends in the context of the wider cultural marketplace
• Compare and connect with similar organisations
• Key maps, facts and figures for confident marketing planning
• Identify areas for growth e.g. donor cultivation
• Advocate successes to colleagues, funders and the board
• Develop collaborative research projects and new strategic partnerships
“Snapshot helped us better understand our penetration within the immediate local area, and tailor our audience development strategy accordingly.”Stephanie Potter, Marketing and Press at Orange
Tree Theatre
Desig
n: ww
w.tim
jukesdesig
n.com

Snapshot Audience Report36
This resource is available to download from www.audienceslondon.org
© 2012 Audiences London