Skilled Labor Shortage in the Construction Industry? It's ...
35
Skilled Labor Shortage in the Construction Industry? It's Not Demonstrated in the Numbers Dale L. Belman School of Human Resources and Labor Relations Michigan State University Professor Belman can be reached at the School of Human Resources and Labor Relations, South Kedzie Hall, Rm 408 368 Farm Lane, Michigan State University East Lansing, Ml 48824 and at [email protected] Page 1of27
Transcript of Skilled Labor Shortage in the Construction Industry? It's ...
Skilled Labor Shortage in the Construction Industry?
It's Not Demonstrated in the Numbers
Dale L. Belman
School of Human Resources and Labor Relations
Michigan State University
Professor Belman can be reached at the School of Human Resources and Labor Relations, South Kedzie Hall, Rm 408 368 Farm Lane, Michigan State University East Lansing, Ml 48824 and at
Page 1of27

Page 2 of 27
Summarv1
Despite the construction industry's slow recovery from the Great Recession, some
construction stakeholders have expressed concern that the industry is facing an imminent
shortage of skilled workers. These concerns reflect the industry's long experience with wide
fluctuations in construction activity and the demand for construction workers. Even if
construction labor markets are not currently tight, stakeholders can be concerned with whether
in the near term future, one to two years, increased demand for construction will cause the
need for construction workers to rapidly outstrip the availability of qualified employees.
This report examines the current state of construction labor markets with respect to the
balance between the supply and demand for labor. Building on the work of Veneri {1999) and
Barnow, Trutko and Piatak (2013) we examine data on employment, job openings,
unemployment and wages since 2000. Although there are some indications that the
construction industry is coming out of the Great Recession, its recovery lags the recovery of the
overall economy. Specifically,
• Employment remains well below the levels of 2001-2006 and employment growth is
only slightly stronger than in the economy as a whole. As a result, there is a pool of
more than one million experienced construction workers who are either not currently
working or have found work in other industries. Such pools of experienced workers are
present not only for construction as a whole, but also for trades such as iron workers,
electricians and plumbers/pipefitters.
• Data on job openings and help wanted advertisements indicate that, although the
demand for construction workers has improved relative to its level during the Great
Recession, it is only returning to its historic relationship to the private economy in 2013.
Further, while the ratio of unemployment to help wanted advertising suggests that
there are 2.3 individuals actively seeking employment for each job advertised in the
private economy, the ratio in construction is 10 individuals actively seeking employment
for each job advertised.
• Unemployment among construction workers remains high both in its level and in
comparison to the entire the labor force. Although down from the high levels during
the Great Recession, unemployment among construction workers was 13.9% in 2012. In
addition, construction workers remain twice as likely to be unemployed than workers in
the entire labor force. Prior to the great recession, construction workers were only 70%
more likely to be unemployed.
1 The author of this report would like to thank Amy Tracy Wells and Ralph Gentile for valuable comments on earlier
versions of the report. Particular thanks to Carey Peters of the Construction Labor Research Council for providing OES data and comments. Any errors are the responsibility of the author.
Page 3 of 27

• An important indicator of tightening labor markets is rapidly rising wages. Data from
the Occupational Employment Survey and the Current Employment Survey indicate that
wage growth is no faster in construction, and somewhat slower in some trades, than in
the entire labor force. There is also no evidence that employers are required to pay
more for better skilled trades workers.
In sum, although there is evidence that the construction industry is slowly recovering from the
Great Recession, it remains far below the level of employment achieved between 2000 and
2006. The employment, job openings and unemployment data support the view that there is a
large pool of experienced workers available to the construction industry when the industry has
the jobs for those workers. The similarity of the pace of increase in construction wages and all
wages also suggests that the demand for construction labor is not outstripping its supply.
Page 4 of 27
Skilled Labor Shortage in the Construction Industry? It's Not Demonstrated in the Numbers
Introduction:
Construction industry stakeholders: employers, workers and owners (those who pay to
have buildings and infrastructure constructed), face wide fluctuations in demand. A boom in
construction today can quickly turn into a slump; and slumps can, in a relatively short period,
turn back into a boom. The industry is recovering from the Great Recession of 2007 - 2009 and
there is a steadily increasing volume of work in some construction sectors, notably energy and
energy related work. Evidence of a boom in construction spending is less evident in other
sectors of construction, but construction activity may be moving back toward a more normal
level of activity from the low levels during the Great Recession.
The prospective increase in construction spending has raised concerns among
stakeholders about whether there is an emergent shortage of skilled construction labor. This
concern derives both from past experience in obtaining labor during peaks in construction
spending and the national discussion of whether there is a shortage of skilled blue collar and
technical labor. Steven Sand her, chief executive officer of the Associated General Contractors
reflected this concern in stating,
"Between the challenges of attracting new recruits and retaining out-of-work ones, there aren't that many skilled workers waiting for a call-back in many parts of the country. If the industry continues to add
jobs, it won't be long before contractors in some parts of the country are scrambling to find enough skilled workers to meet demand." 2
2 From The Construction Index, Wednesday, July 3, 2013
Page 5 of 27
Similar concerns are expressed by the associate director of the Associated Builders and
Contractors, Geoffrey Burrs, in which he indicates that, given the prospective 32%
growth in demand for construction workers from 5.6 in 2013 to 7.4 million in 2020, a
guest worker program was needed to address future construction labor shortages. 3 4
Such concerns are finding regular expression in industry and national publications and,
in their regular appearance, creating an accepted view which, to date, has not been
based on a close analysis of construction labor markets.
This report examines national data on construction labor to determine whether
there is likely to be shortages of construction labor both in the near term, the next one
to two years, and the longer term, three to five years. Using national data on
employment, job openings unemployment, and compensation since 2000, we find that
the construction industry has yet to recover from the Great Recession and that there is a
pool of experienced construction workers who are either unemployed, underemployed
or have moved to other industries. Employment in construction remains almost 2.2
million workers lower than its peak in the middle of the last decade; unemployment
remains around 10% of the labor force even at the height of the construction season;
there are 10 construction workers for every job opening in the industry while the
economy wide ratio is 2 workers per opening.
3 Letter from Geoffrey Burr to Patrick Leahy, chair of the Senate Judiciary committee sent on May 14, 2013, see
http://www.abc.org/Porta ls/1/Documents/Newsl ine/2013/Senate Judiciary Immigration Letter ABC.pdf 4 As will be developed in section on employment, if the BLS projection is accurate, it will take almost seven years to
return close to the 2007 level of employment in the construction industry.
Page 6 of 27
The data suggest that the normal operation of construction labor markets and
actions by construction stakeholders and government to improve construction training
systems will be able to meet the foreseeable needs of construction labor. There is a
sufficient pool of immediately available workers to meet the needs of the industry over
the next one to two years. Current projections of labor force demand out to 2020 also
do not suggest that demand for construction workers will overwhelm the capacity of
construction labor markets to provide for that demand. BLS projections of demand for
construction workers through 2020 indicate that peak demand for labor will be less than
the number of workers in the construction labor force in 2005-2007. Even the highest
projections of non-residential labor force requirements suggest that peak demands for
construction labor will be no more than 13% above the level of 2005-2007.
As national demand for construction trade labor will not require exceptional
growth in the construction labor force, market processes should operate to reallocate
labor to meet the needs of the construction industry. Increased demand for trades
workers in localities and trades will, by raising wages and benefits, induce both an
increase in hours among incumbent workers and movement of those workers to
locations with better employment opportunities. In combination with increased
employment opportunities, improvements in compensation will also induce trades
workers who left the industry during the Great Recession to re-enter construction.
Higher compensation will attract individuals with skills that are compatible with
construction trades work to move into the construction industry and obtain the training
required to become fully skilled in their trade.
Page 7 of 27
While the normal operation of construction labor markets will address much of
the rising demand for construction labor, actions by construction stakeholders can do
much to speed the process of adjustment. Over the last five years, and possibly over
the last several decades, employers have become accustomed to obtaining workers with
needed skills when they were needed at a favorable price. These conditions will not
continue over the next four to five years. Successful operation in the developing
markets will require employers and owners to pay higher wages. These price signals are
central to bringing former construction employees back to the industry and in attracting
partially skilled employees from outside the industry. Employers will need to be willing
to hire lesser skilled employees and provide both formal and on-the-job training to bring
the employees up to desired levels of efficiency. Owners will no longer be able to count
on bids coming in below engineering estimates and will need to allow for increasing
labor and materials costs in their planning process.
Rather than view the improvements in construction labor markets as an
impending crises, construction stakeholders can use the strengthening of the market as
an opportunity to create a sustainable and highly skilled construction labor force which
is attractive to the quality of worker needed into the future . Emerging conditions can be
used to revitalize proven construction training programs. The industry has long
complained about not being able to attract better educated young workers. In
combination with strong employment opportunities and training, rising wages could
make construction a career of choice for capable, well educated but under-employed
Page 8 of 27

younger workers. Emerging improvements in the construction industry and labor
markets provide an opportunity to be grasped if the industry has the vision to do this.
What is a Labor Shortage?
There is no universal definition of a labor shortage. Barnow, Trutko and Piatak (2013) suggest
that the term "labor shortage" sometimes refers to an absolute shortfall in the number of
workers in a labor force while at other times it refers to a mismatch between worker
qualifications and the jobs which are available. Building on earlier analytic work on labor supply,
they define a labor shortage as
"A sustained market disequilibrium between supply and demand in which the quantity of workers demanded exceeds the supply available and willing to work at a particular wage and working conditions at a particular place and point in time." (pg. 3)
A critical element of this definition is that markets return to equilibrium slowly, resulting in an
ongoing excess of demand for workers over the supply of workers. The delays in a return to
equilibrium may be related to slowness in employer and employee recognition and response to
the shortage, or ongoing increases in the demand for workers.
What is the evidence for an occupational labor shortage? Analysts suggest that rapid
growth in employment and wages, large numbers of vacancies and low unemployment rates
are evidence of disequilibrium in the labor market. Veneri (1999) provides benchmarks for
employment, wages and unemployment
"For this analysis, occupations were evaluated to determine whether, for the 1992-97 period (for which data were available when the analysis was conducted), the occupation's employment growth rate was at least 50
percent faster than average employment growth, the wage increase was
Page 9 of 27
at least 30 percent faster than average, and the occupation's unemployment rate was at least 30 percent below average (in each case, "average" was defined by the total for all workers)." (pg. 18)
The benchmarks are established relative to economy wide developments. Rapid growth
in occupation wages is not in itself sufficient to indicate an occupational labor shortage; it is
rapid growth relative to the economy wide growth of wages.5 As Veneri indicates, the levels
she has established are arbitrary and open to discussion. This turns out to make little
difference in our analysis as construction's performance tends to be close to or below national
economic performance.
Employment
Employment and employment growth are central to assessing whether there is an
emerging labor shortage. Absent some absolute limit on the number of employees in an
occupation, labor shortages are marked by rapidly increasing employment. We consider
employment trends for the construction industry as a whole, as well as for trade occupations,
and compare these to national trends. If there is a shortage of construction employees, we
would expect to see rapid growth in construction employment relative to the balance of the
economy.
Table 1 compares employment levels and the annual rate of growth of employment for
the total non-farm labor force, the private labor force and the construction industry for 2000 to
2013 . We use the most current month available, May, rather than annualized employment, to
5 For example, during a period of rapid inflation, occupational wages are likely to grow rapidly without there being a shortage or surplus of labor. As wages through the economy will also be adjusting to inflation, benchmarking the occupations wages to national wages helps adjust for factors such as inflation.
Page 10 of 27

capture any recent trends in construction. The data is taken from the Current Employment
Statistics series and is limited to employees. For each labor force category, the left hand
column is total employment in millions, and the right hand column is the annual growth (or
decline) in employment in percent.
The construction industry was, and remains, deeply affected by the Great Recession.
Employment rose fairly steadily from 2000 to 2006, when it peaked at 7.7 million employees.
By 2010, the Great Recession had caused construction employment to decline 28%, to 5.5
million employees. By May 2013 modest improvements in the construction economy increased
construction employment to 5.8 million . Employment grew rapidly in the last year, by 3.4%,
but May 2013 employment remained 1.9 million, 24.8%, below the 2006 peak.
How does employment and employment growth in construction compare with the
balance of the economy? The Great Recession reduced employment in other sectors
substantially; employment in the private economy fell by from 115.5 to 109.5 million, or by
5.1%, between 2008 and 2009. The decline was not, however, as severe, and the recovery has
been more complete, than in construction. While construction employment remains almost
25% below its 2006 peak, employment in the private economy is 1.7% below its peak.
Construction has shown strong job growth over the last year. Jobs grew at a 3.4% rate
over the last year as construction added almost 200,000 employees. This compares favorably
with job growth in the private sector, 1.9%, or in the private and public sectors, 1.6%. However,
in the context of a sector which also suffers from very fast job decline, construction lost jobs at
more than three times the rate of the private economy in 2009, and remains almost two million
Page 11of27
employees below its peak employment in the decade of the 2000s. This means that, even if the
increased pace of job growth of the last year continues into the foreseeable future, the supply
of experienced construction workers is unlikely to be exhausted in the next two years. 6
Employment by Trade
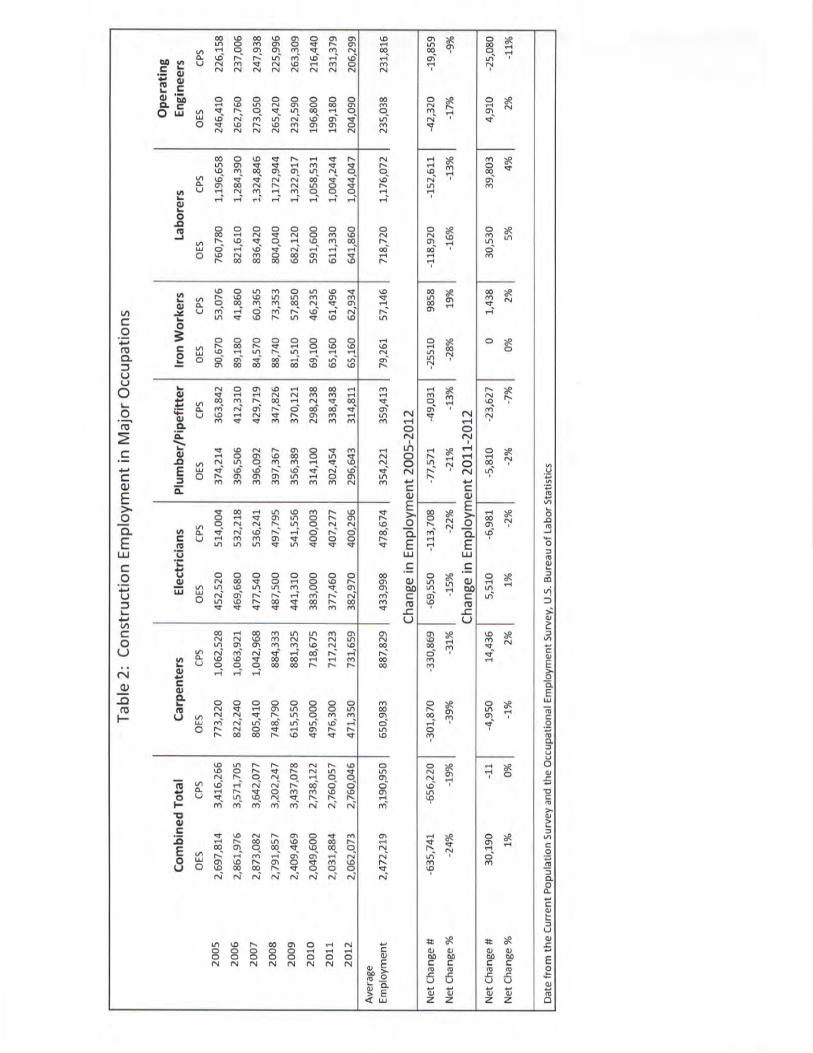
Issues with labor shortages in construction tend to be focused on specific highly skilled
trades such as pipefitters, electricians and welders. We consider the employment of
carpenters, electricians, plumbers/pipefitters, iron workers, laborers and operating engineers
from 2005 to 2012 in Table 2. Data from both the Occupational Employment Statistics (OES), a
survey of employers, and the Current Population Survey (CPS), a survey of individuals, are in the
left and right hand columns for each trade respectively. 7 The first set of columns combines the
data from the six trades to provide a consolidated portrait of employment from 2005. Turning
to the combined totals, both series show a large decline in employment between 2005 and
2012.8 These trades lost 635, 741 jobs (OES) and 656,220 employees (CPS), between 19% and
24% of all employment, over this period. Employment growth between 2011 and 2012 was
6 Construction employment has substantially greater variance than employment in the broader economy. While private sector employment grew between 1.3% and 2.4% between 2004 and 2007, construction grew between 3.6% and 5.7%. Similarly, the declines in construction are far more severe than the balance of the economy. While the largest annual decline in employment in the private sector during the great recession was 5.1%, construction employment fell by 16.1% in that year. The higher rate of growth of construction employment in 2012-2013 is then consistent with the greater variance of construction employment and may not be indicative of unusually fast growth relative to the broad economy. 7 The OES surveys employers about the number of positions in a particular occupation at that employer. The CPS
surveys households and collects, in addition to a variety of labor market measures, the occupation in which the
respondent is employed. Differences in concepts and surveys result in differences between the levels of
employment reported by the OES and CPS. These differences have been a subject of study and debate for some
years. In this instance, the trends in the two series are similar and provide a parallel understanding of changes in
construction employment and jobs.
8 Because employer was substantially greater in 2006 and 2007 than 2005 for most of the trades in Table 2, the
absolute and relative decline would have been greater had we measured against either of these years.
Page 12 of 27
weak, between 0% and 1% depending on the series used. Although large employment declines
occurred in all of the trades reported in Table 2, not all trades suffered equally. Between 31%
and 39% of carpentry employment was lost, operating engineers lost between 9% and 17% of
employment. Despite these differences, each of the trades' employment levels are currently
well below those of the mid-2000s. The pool of experienced workers has certainly been
reduced by retirements and some workers have found permanent employment in other
industries. Still, there appears to be a substantial pool of experienced construction workers
who are available to the industry if employment were available.
Job Openings
Job openings are a direct measure of labor shortages, indicating the degree to which
jobs are going unfilled . The two main sources of job openings data are the Job Openings and
Labor Turnover (JOLTS) survey of the U.S. Bureau of Labor Statistics and the Help Wanted On
Line (HWOL) data collected by the Conference Board. The former is derived from an employer
survey, the latter on the collection and analysis of on-line help wanted advertisements.
Neither, in its publicly available form, provides detailed information on trades occupations, but
both provide information on the construction industry as a whole.
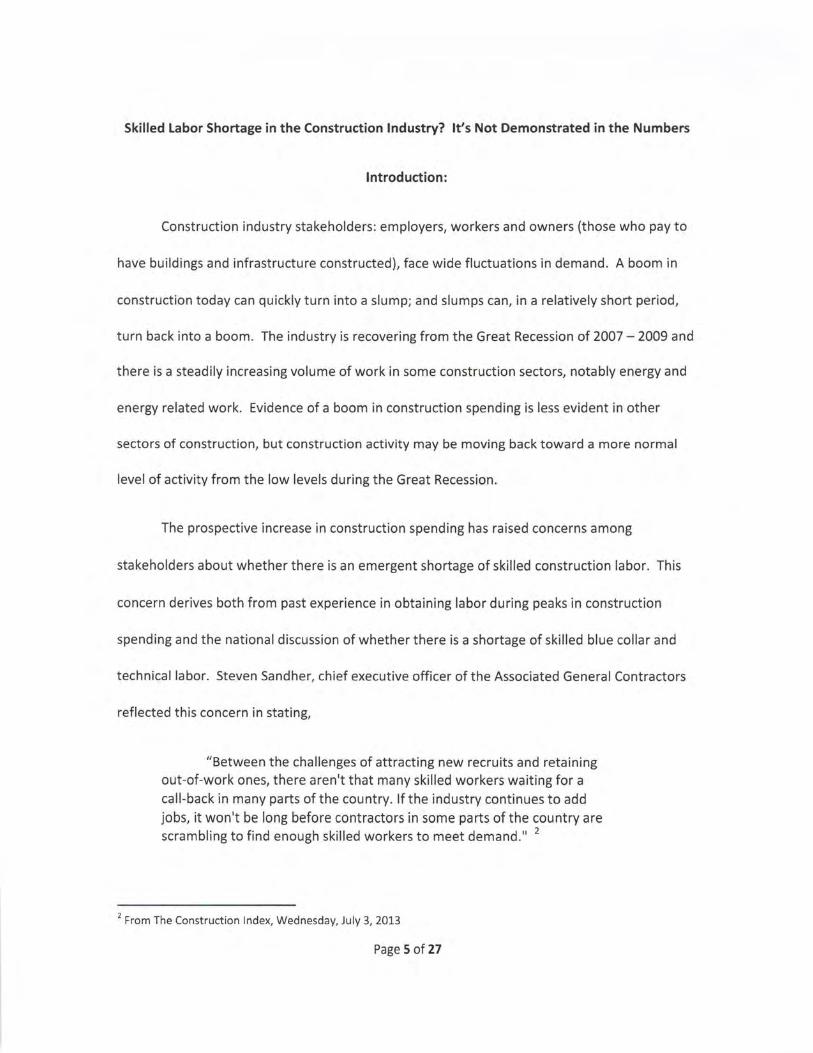
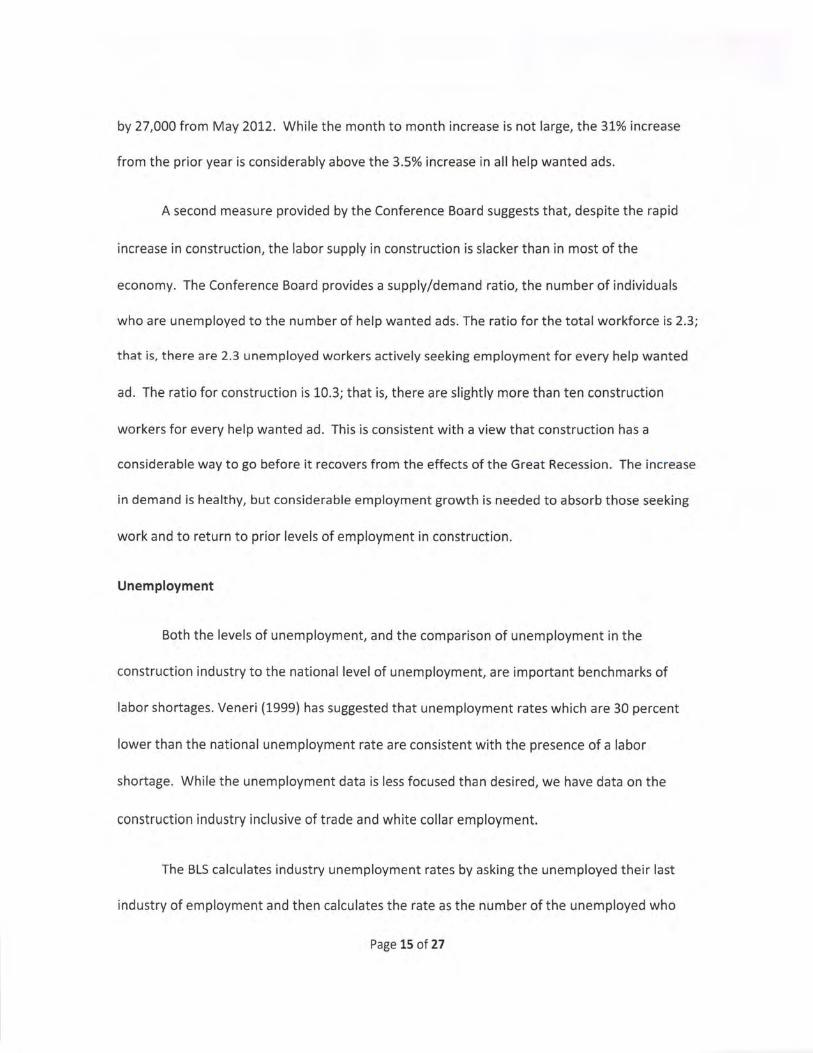
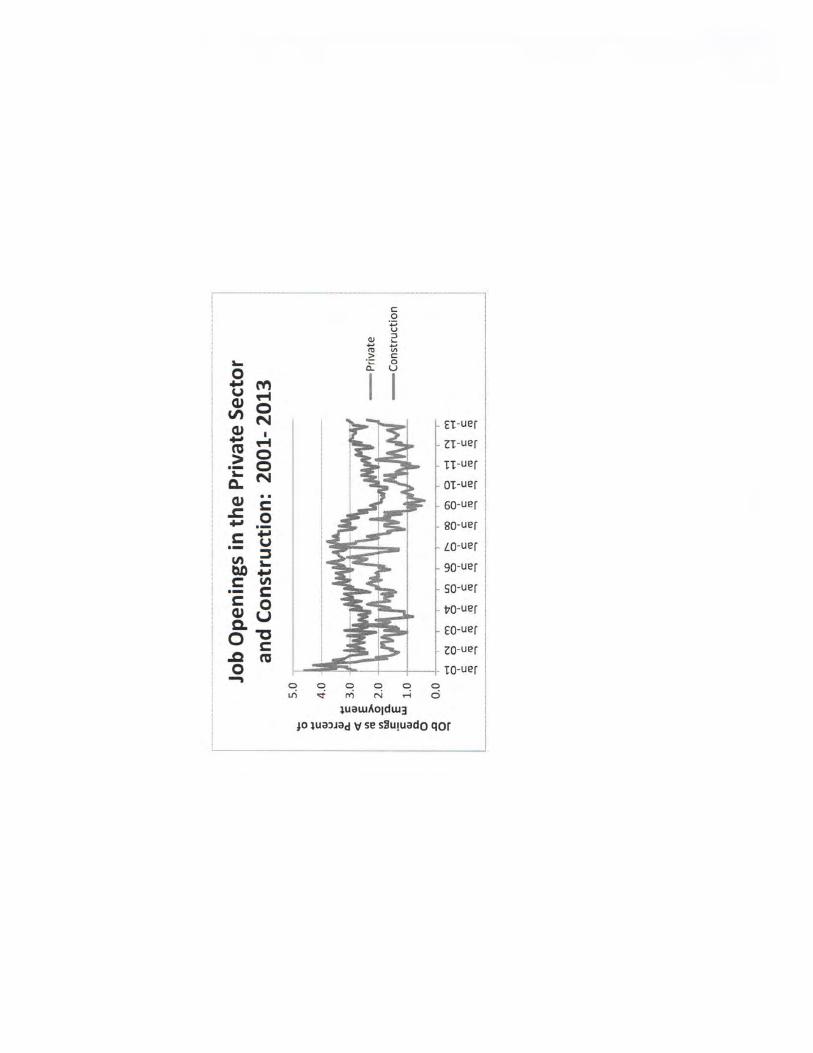
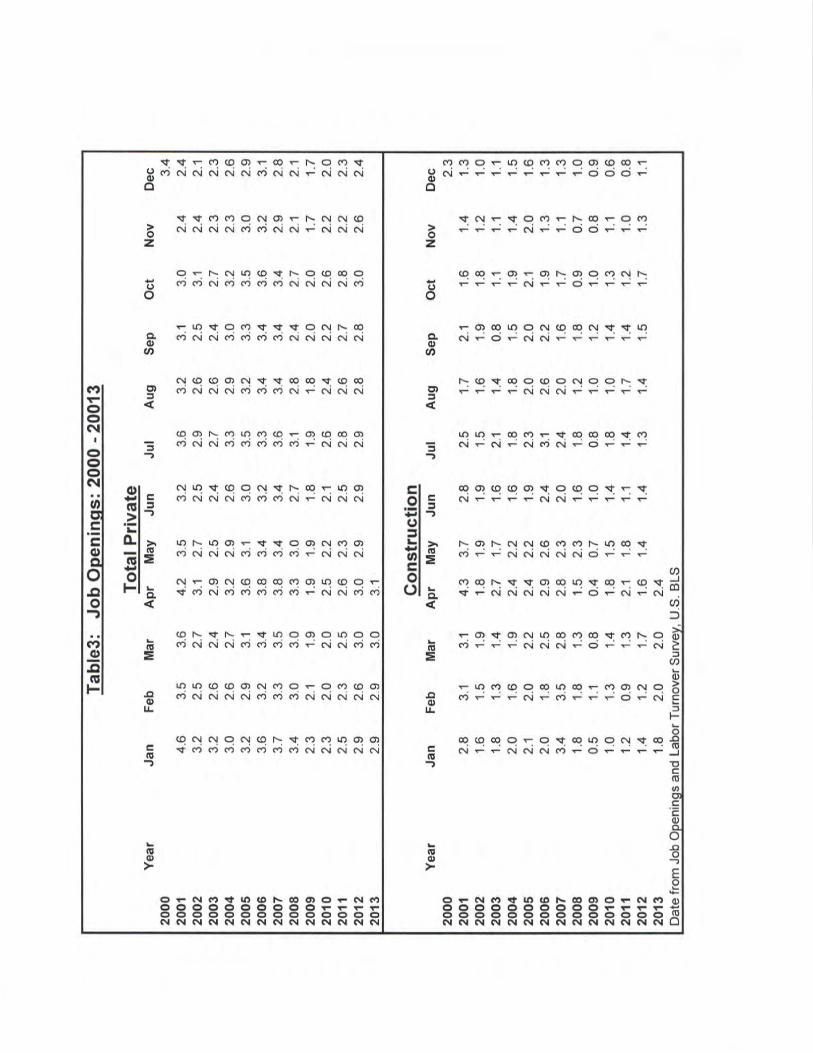
Table 3 and the accompanying chart summarize JOLTS data on job openings in the
private sector and construction from January, 2001 to April 2013. The JOLTS rate is a ratio of
the number of job openings to the sum of current employment plus job openings expressed as
a percent.9
Higher rates indicate more jobs are going unfilled. The severity of current unmet
9 The job openings rate is the number of job openings on the last business day of the month divided by the sum of the number of
Page 13 of 27
labor demand can be measured by comparing current job opening rates in construction to past
rates and by comparing the growth of job opening rates in construction with their growth in the
private economy.
The red line in Chart 1 shows the job openings rate as a percent of employment in
construction between 2001 and 2013. Current job openings in construction, at the far right of
the chart, are considerably below job openings in early 2001 and job openings in 2006 and
2007. Although greatly improved over the level of job openings during the Great Recession,
job openings remain well below their levels when construction activity was expanding rapidly.
Comparison of construction job openings to those in the private sector requires
benchmarking. The JOLTS ratio in construction is typically lower than the JOLTS ratio in the
private economy as a whole. Between 2001 and 2006, there were .64 openings in construction
for each job opening in the private sector. The ratio to date for 2013 is similar, .69, while the
average for 2012 and 2013, .54, is below the historic ratio. While construction had fewer than
normal job openings since 2012, there is evidence that demand for construction workers has
improved in 2013. However, this has only moved construction back toward its historic ratio
prior to the Great Recession. Construction labor markets are not tight relative to the private
economy.
The Conference Board' s Help Wanted On Line {HWOL) provides an alternative measure
of job openings. The June 5 press release (#5673) reported that 112,500 new help wanted ads
appeared for construction in May 2013 . This was up by 1,300 from the 111,200 ads in April and
employees who worked during or received pay for the pay period that includes the 12th of the month and the number of job openings on the last business day of the month.
Page 14 of 27
by 27,000 from May 2012. While the month to month increase is not large, the 31% increase
from the prior year is considerably above the 3.5% increase in all help wanted ads.
A second measure provided by the Conference Board suggests that, despite the rapid
increase in construction, the labor supply in construction is slacker than in most of the
economy. The Conference Board provides a supply/demand ratio, the number of individuals
who are unemployed to the number of help wanted ads. The ratio for the total workforce is 2.3;
that is, there are 2.3 unemployed workers actively seeking employment for every help wanted
ad. The ratio for construction is 10.3; that is, there are slightly more than ten construction
workers for every help wanted ad. This is consistent with a view that construction has a
considerable way to go before it recovers from the effects of the Great Recession. The increase
in demand is healthy, but considerable employment growth is needed to absorb those seeking
work and to return to prior levels of employment in construction.
Unemployment
Both the levels of unemployment, and the comparison of unemployment in the
construction industry to the national level of unemployment, are important benchmarks of
labor shortages. Veneri (1999) has suggested that unemployment rates which are 30 percent
lower than the national unemployment rate are consistent with the presence of a labor
shortage. While the unemployment data is less focused than desired, we have data on the
construction industry inclusive of trade and white collar employment.
The BLS calculates industry unemployment rates by asking the unemployed their last
industry of employment and then calculates the rate as the number of the unemployed who
Page 15 of 27
report an industry as their last industry of employment divided by the sum of employment and
unemployment in that industry. We compare the unemployment rate in construction with the
national unemployment rates of persons in the labor force 20 and older. We use age 20 and
older because the calculation of unemployment is limited to the experienced labor force, those
who have or have previously had a job. The experienced labor force in construct ion includes
very few individuals under the age of 20; therefore limiting the measures of national
unemployment to those age 20 and older improves the comparability of the unemployment
rates.
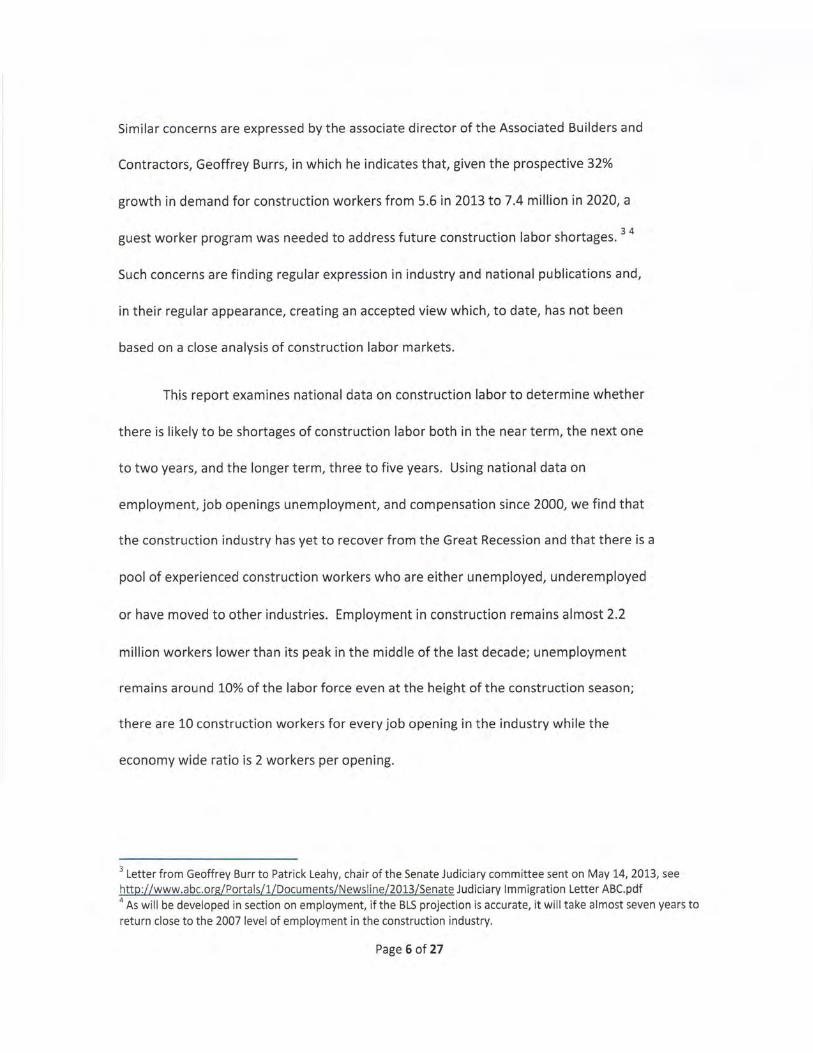
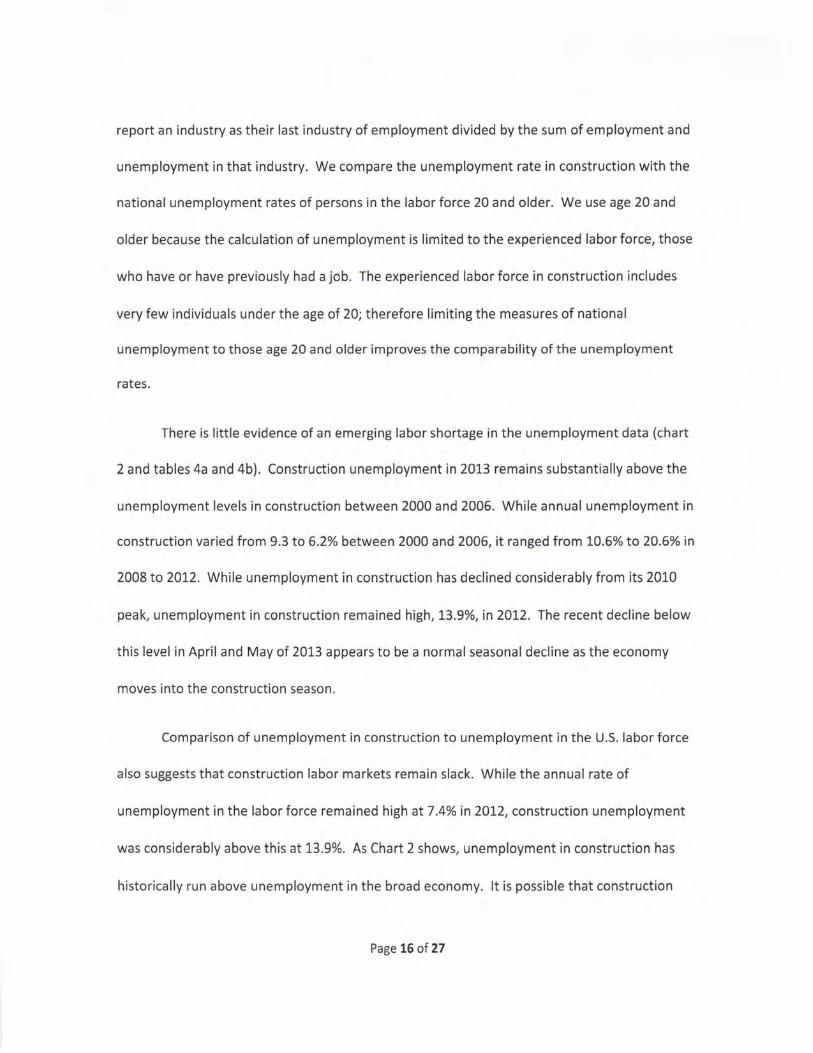
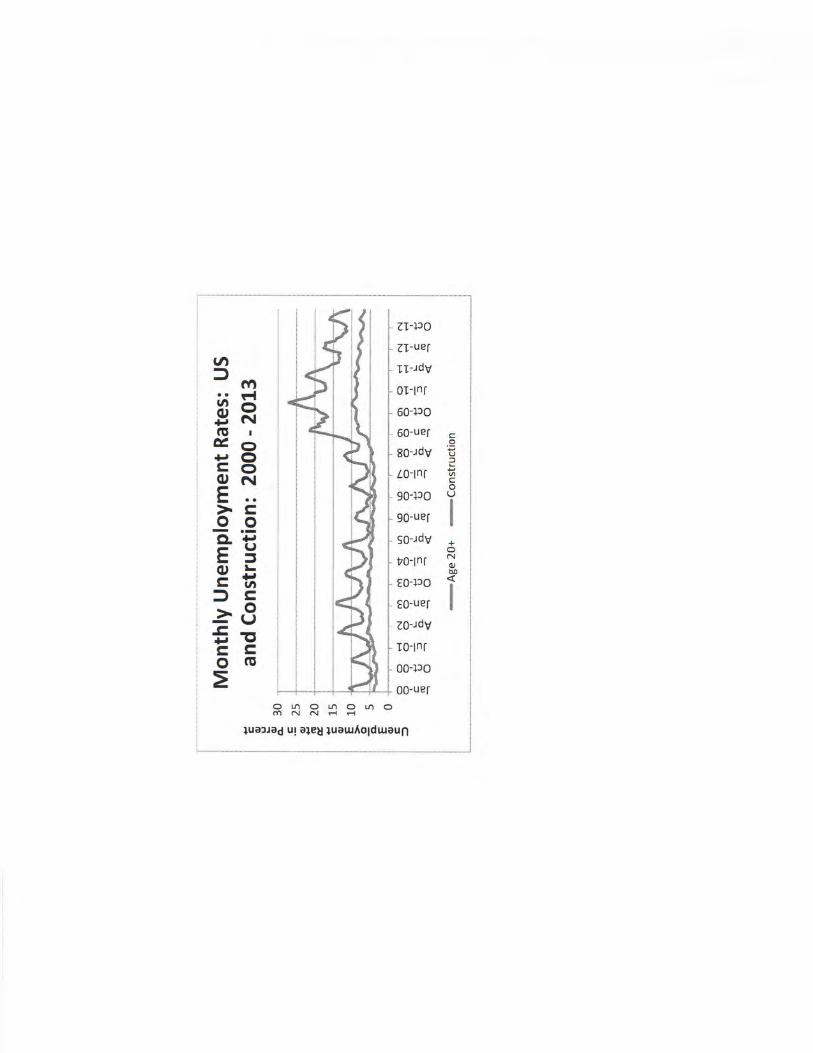
There is little evidence of an emerging labor shortage in the unemployment data (chart
2 and tables 4a and 4b). Construction unemployment in 2013 remains substantially above the
unemployment levels in construction between 2000 and 2006. While annual unemployment in
construction varied from 9.3 to 6.2% between 2000 and 2006, it ranged from 10.6% to 20.6% in
2008 to 2012. While unemployment in construction has declined considerably from its 2010
peak, unemployment in construction remained high, 13.9%, in 2012. The recent decline below
this level in April and May of 2013 appears to be a normal seasonal decline as the economy
moves into the construction season.
Comparison of unemployment in construction to unemployment in the U.S. labor force
also suggests that construction labor markets remain slack. While the annual rate of
unemployment in the labor force remained high at 7.4% in 2012, construction unemployment
was considerably above this at 13.9%. As Chart 2 shows, unemployment in construction has
historically run above unemployment in the broad economy. It is possible that construction
Page 16 of 27
labor markets might be very tight even if the construction unemployment rate is above the rate
for the labor force. We can adjust for this by considering the ratio of construction to national
unemployment. If this ratio is well below its "historical" level, there could be some concern
that construction labor markets are tightening. The ratio of construction unemployment to
national unemployment from 2000 to 2006 was 1.7, that is construction workers were 70%
more likely to report being unemployed than those in the private labor force. During the Great
Recession, this ratio rose to 2.3 and, in 2012, returned to 1.9. Between January and May 2013,
the ratio has averaged 2.0, that is construction workers are twice as likely to report being
unemployed as a typical worker. Construction unemployment remains above its historic
relationship with national unemployment and construction labor markets are lagging the broad
economy in recovering from the Great Recession.
Nothing in our results is consistent with an emergent near term shortage of
construction labor. The construction unemployment rate remains considerably above the
national unemployment rate. The ratio of the rates remains above the ratio prior to the Great
Recession. Further, the high unemployment rate suggests there are considerable numbers of
construction workers who are actively seeking employment at current wages but unable to find
employment.
Wages and Earnings
When demand and supply are out of equilibrium in competitive markets, they are
moved toward equilibrium by price adjustments. In instances when demand outstrips the
supply of employees in an occupation, the increase in the wage brings forth both an additional
Page 17 of 27
supply of labor and tamps down demand. Higher wages pull in employees who have left an
industry either for other work or are not working in the industry. It also encourages the current
labor force to work additional hours and those without requ isite skills to train so as to take
advantage of the higher wages. Given this market dynamic, wages in industries experiencing
labor shortages would be expected to rise considerably faster than wages through the economy
or among private sector employees.
We consider this with wage data from the Occupational Employment Survey (OES) and
the Current Employment Survey (CES) . The former is an annual survey which collects
information by occupation in May of each year. The latter is a monthly survey which collects
information by industry, but not by occupation. The OES data fits our purposes better than the
CES, but it is only available through May 2012, while the CES data is available through May of
2013 . Looking at both will provide information on wage trends in construction up to the very
recent past.
Information on mean and median hourly earnings as well as mean annual earnings for
all occupations and for several important construction occupations is found in Table 5. In
addition, the hourly wage at the 75th percentile of the wage distribution is included to
determine whether demand for the better skilled, and therefore better paid, employees is
causing wages at the 75th percentile to rise more rapidly than the typical wage. At the bottom
of each occupation's wage, there is a measure of the percent change in the wage since 2011
(the one year change) and since 2007.
Page 18 of 27
Initially considering all occupations, there is little difference in the measures of wage
change since 2011 or since 2006. Between 2011 and 2012 mean wages rose by 1.2% while
median wages rose by 0.8%. Mean annual earnings rose by 1.2% while earnings at the 75th
percentile rose by 1.3%. There is similarly little difference in the measures of wage change since
2006. Mean and annual wages rose by 12.5% while median wages rose somewhat more slowly,
at 10. 7%. Wages at the 75th percentile rose by 13.2%, suggesting that better skilled workers
received larger wage increases than typical employees.
With the exception of reinforcing iron and rebar workers, construction workers have not
done quite as well as the full labor force over either of these periods. 10 The one year and six
year rise in hourly and annual earnings of carpenters, electricians and construction laborers
have lagged behind the increases enjoyed by all occupations. While all occupations mean
hourly earnings rose by 1.2% between 2011 and 2012 and by 12.5% between 2007 and 2012,
carpenters mean hourly earnings rose by 0.4% and 7.9% since 2011 and 2007 respectively.
Similarly, electricians mean hourly earnings rose by 0.2% and 10.2% over the one and five year
period. Plumbers, pipefitters and steam fitters, construction laborers and structural steel
workers hourly earnings rose at rates very similar to those of all occupations. Individuals at the
75th percentile of the wage distribution did not do consistently better than the typical employee
in the trade.
10 The glaring exception to these conclusions is reinforcing iron and rebar workers whose earnings rose
dramatically in 2012. Although it is possible that this occurred, it is more likely to be a sampling issue. Further
evidence for issues with this data is that data from Current Employment Statistics for Poured Concrete Structures,
an industry which employs large numbers of rebar workers, does not show the same dramatic rise in 2012 or 2013 (see Table 6).
Page 19 of 27
As there is considerable discussion about shortages of welders, the OES data on
welder's earnings may be of particular interest. The evidence on hourly earnings suggests that
the increases in hourly earnings of welders have been very similar to that of all occupations in
the past year, and slightly better than all occupations since 2007. The gains relative to all
occupations falls far short of the 30% faster wage growth suggested by Veneri (1999) as
evidence of a labor shortage. Employment of welders, the first column in the table, has, similar
to other trades, declined substantially since 2007.
We turn to the Current Employment Survey (CES) to obtain more recent information on
wage change in construction. The CES is structured around detailed industries making it
possible to obtain data on hourly wages in sub-industries such as electrical and
plumbing/HVAC. The industries, and the wage measures, include non-trade workers such as
managers and administrators but the proportion of trade workers in the construction labor
force is very high. Because of this, if trade workers were receiving substantial wage increases,
we would expect to see average hourly wages rising even if other workers in the industry did
not receive wage increases.
Table 6 provides wage data on hourly wages for total private industries, for
construction, for the electrical, plumbing/HVAC, finish carpentry industries and poured
concrete structures (which employs many reinforcing iron workers) . Hourly wages in total
private industries rose by 2.0% between May 2012 and May 2013 and by 14.4% between May
2007 and May 2013. The increases for total construction were somewhat lower; 1.4% for the
last year and 13.4% since May 2007. Wage growth among the industries which comprise
Page 20 of 27
construction are scattered around but not greatly different than the wage growth in total
private industries. The one year increase for electrical, plumbing and steel and poured
concrete is lower than for total private industries while finish carpentry is somewhat above
total private industries. If the period since 2007 is considered, wage increases in electrical and
plumbing/HVAC tend to be at or slightly above total private industry, while finish carpentry and
poured concrete is considerably below total private industry.
Earnings in construction are not growing faster, and may be growing more slowly in
some trades, than earnings in the economy as a whole. This is consistent with construction
employment not having as fully recovered from the Great Recession as employment in the
broader economy. The large contraction in employment in construction during the Great
Recession allows employers to obtain workers with prior construction experience without
having to greatly increase their offers of compensation.
Conclusion
The evidence on national construction employment, job openings, unemployment and
wages does not support the concern that construction faces an imminent national labor
shortage in the next two years. Although the data shows that construction labor markets are
improving, employment remains well below its peak levels in the 2000s; unemployment
remains above historic levels, job openings remain low relative to the available labor force, and
wages are increasing no more rapidly than wages for the national labor force. None of this data
supports concerns about labor shortages now or in the near future.
Page 21of27
It is possible that there could be geographically local shortages in specific skills. In the
past, such shortages have been met through market processes. Construction has long
experience with attracting labor to meet local shortages with increased compensation and
there is every reason to believe that this will be an effective strategy in the near term future.
Given the low level of employment relative to historic levels, and the high rate of
unemployment, sufficient labor should be available without excessive increases in
compensation.
Could there be a shortage of skilled workers three or more years out? This is less
certain than a one to two year scenario as it requires projecting levels of demand for
construction labor and a more developed understanding of the flow of workers into and out of
the construction labor force. While a study of the long term sustainability of the construction
labor force should be undertaken to determine whether there is likely to be a shortage of
construction labor in the mid-term future and how any such shortages could best be addressed,
past experience and current conditions suggest that the increase in construction demand can
be successfully addressed. We provide several observations which point toward the industry's
ability to meet current and future demand if reasonable steps are taken to adjust to the
recovery of construction spending.
First, current projections of construction employment suggest that it will not rise
substantially above the levels of the mid-2000s. The BLS projections utilized by the Associated
Builders and Contractors suggest that construction employment will be 4% lower in 2020 than
in 2006. The projections of the Construction Labor Market Analyzer (CLMA) are less sanguine;
Page 22 of 27

they suggest that in 2017, non-residential employment will peak at 6.8 million employees, up
from 6 million prior to the Great Recession and from current non-residential employment of 4.5
to 5 million. Even with several years of retirements and some workers having permanently left
the labor force, it can be expected that, as employment once again becomes available, trades
workers will flow back into the industry. The 10% unemployment rate in construction and the
high unemployment to openings rate in the HWOL data both suggest that large numbers of
employees are immediately available to the industry.11 Given that those who left for other jobs
took jobs at the bottom of the Great Recession, there is every reason to believe that
construction employment will be attractive to many former construction employees.
Second, market adjustments both in wages and prices will reallocate resources toward
construction so long as the industry is willing to pay for that reallocation. Increases in wages
and benefits play a central role in attracting former and new employees to the industry. The
industrial welder working at $12 per hour may well be attracted away from that job to a
construction job which pays substantially more when these jobs become available. Higher
wages and benefits provide lesser skilled employees the resources needed to upgrade their
skills and provide those outside the industry with incentives to train for trades jobs. Likewise,
as labor costs and other costs rise, marginal projects will be dropped, dampening demand for
construction labor, or delayed, moving demand away from the peak. Between improved
wages increasing the flow of workers into construction labor markets, and reductions of
11 With unemployment at somewhat over 10%, and 5.8 million employees in the construction labor force, there
are 644,000 former construction employees actively seeking employment. Not all may be seeking employment in the construction industry.
Page 23 of 27

demand because of higher labor and materials prices, the peak demand for trades labor, and
any excess over supply, is likely to be more moderate that current discussion allows.
Third, it would not be good public policy to have a construction labor force which was so
large it could readily handle peak demand. As the data on construction employment show,
construction goes through very large swings in spending and employment. This is not surprising
as construction is investment activity. Given the large investment in time and money required
to train a skilled tradesperson, and the investment in equipment needed to support their work,
a labor force which was large enough to meet peak demand would find itself unemployed and
underemployed much of the time. Such over-investment would be wasteful of human and
physical capital and would result in economic hardship for the construction labor force.
All of this is not to argue that there is not a need for additional efforts to develop and
sustain the construction labor force. This is about training, but also about the quality of the
jobs in the industry. Too often discussions of attracting new employees into construction, and
complaints that younger workers just are not choosing construction, are deeply unrealistic
about the quality of construction employment. While construction can pay well, employment
can be, as is apparent in the data, very unstable and trades workers can face extended periods
of unemployment and underemployment. Construction work can be appealing to younger
workers, but too many construction workers lack benefits or have minimal benefits, are
exposed to dangerous conditions which threaten short and long term physical harm, and have
careers which are substantially shorter than their white collar counterparts. Addressing
construction labor shortages is fundamentally about the industry stakeholders discussing and
Page 24 of 27

taking the steps required to create a sustainable labor force that chooses construction over
other careers both because of the challenges and the knowledge that it is indeed a good career.
Page 25 of 27
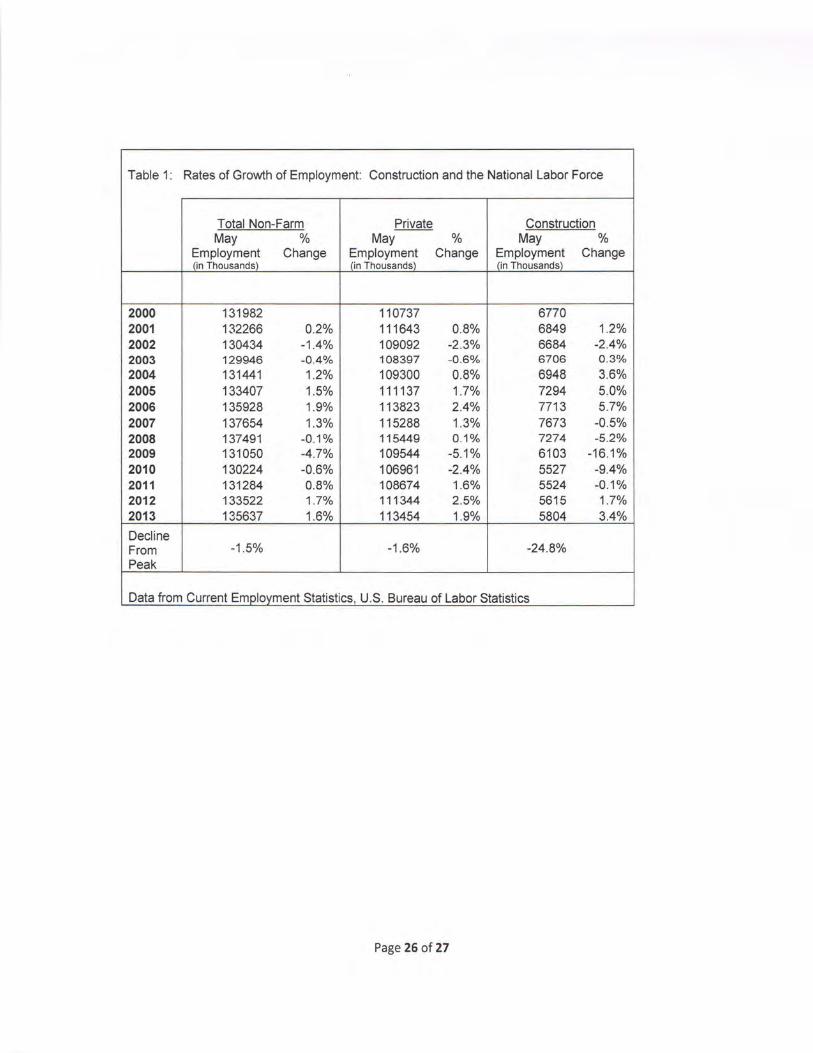
Table 1: Rates of Growth of Employment: Construction and the National Labor Force
Total Non-Farm Private Construction May % May % May %
Employment Change Employment Change Employment Change (in Thousands) (in Thousands) (in Thousands)
2000 131982 110737 6770 2001 132266 0.2% 111643 0.8% 6849 1.2% 2002 130434 -1.4% 109092 -2.3% 6684 -2.4% 2003 129946 -0.4% 108397 -0.6% 6706 0.3% 2004 131441 1.2% 109300 0.8% 6948 3.6% 2005 133407 1.5% 111137 1.7% 7294 5.0% 2006 135928 1.9% 113823 2.4% 7713 5.7% 2007 137654 1.3% 115288 1.3% 7673 -0 .5% 2008 137491 -0.1% 115449 0.1% 7274 -5.2% 2009 131050 -4.7% 109544 -5.1% 6103 -16.1% 2010 130224 -0.6% 106961 -2.4% 5527 -9.4% 2011 131284 0.8% 108674 1.6% 5524 -0.1% 2012 133522 1.7% 111344 2.5% 5615 1.7% 2013 135637 1.6% 113454 1.9% 5804 3.4%
Decline From -1 .5% -1.6% -24.8% Peak
Data from Current Employment Statistics, U.S. Bureau of Labor Statistics
Page 26 of 27
Tab
le 2
: C
on
stru
ctio
n E
mp
loym
ent
in M
ajo
r O
ccu
pat
ion
s
Op
erat
ing
C
om
bin
ed T
ota
l C
arp
ente
rs
Ele
ctri
cian
s P
lum
ber
/Pip
efit
ter
Iron
Wo
rker
s L
abo
rers
E
ng
inee
rs
OES
C
PS
OES
C
PS
OES
C
PS
OES
C
PS
OES
C
PS
OES
C
PS
OES
C
PS
20
05
2,
697,
814
3,41
6,26
6 77
3,22
0 1,
062,
528
452,
520
514,
00
4
374,
214
363,
842
90,6
70
53,0
76
760,
780
1,19
6,65
8 24
6,41
0 22
6,15
8
20
06
2,
861,
976
3,57
1,70
5 82
2,24
0 1,
063,
921
46
9,6
80
53
2,21
8 39
6,50
6 41
2,31
0 89
,180
41
,860
82
1,61
0 1,
284,
390
262,
760
237,
006
20
07
2,
873,
082
3,64
2,07
7 80
5,41
0 1,
042,
968
477,
540
536,
241
396,
092
429,
719
84,5
70
60,3
65
836,
420
1,32
4,84
6 27
3,05
0 24
7,93
8
20
08
2,
791,
857
3,20
2,24
7 74
8,79
0 88
4,33
3 48
7,50
0 49
7,79
5 39
7,36
7 34
7,82
6 88
,740
73
,353
80
4,04
0 1,
172,
944
265,
420
225,
996
20
09
2,
409,
469
3,43
7,07
8 61
5,55
0 88
1,32
5 44
1,31
0 54
1,55
6 35
6,38
9 37
0,12
1 81
,510
57
,850
68
2,12
0 1,
322
,91
7
232,
590
263,
309
20
10
2,
049,
600
2,73
8,12
2 49
5,00
0 71
8,67
5 38
3,00
0 40
0,00
3 31
4,10
0 29
8,23
8 69
,100
46
,235
59
1,60
0 1,
058,
531
196,
800
216,
440
20
11
2,
031
,884
2,
760
,057
47
6,30
0 71
7,22
3 37
7,46
0 40
7,2
77
302,
454
338,
438
65,1
60
61,4
96
611,
330
1,00
4,24
4 19
9,18
0 23
1,37
9
20
12
2,
062,
073
2,76
0,04
6 47
1,35
0 73
1,65
9 38
2,97
0 40
0,29
6 29
6,64
3 31
4,81
1 65
,160
62
,934
64
1,8
60
1,
044,
047
204,
090
206,
299
Ave
rage
E
mp
loy
men
t 2,
472,
219
3,
190,
950
650,
983
887,
829
433,
998
478,
674
354,
221
359,
413
79,2
61
57,1
46
718
,720
1,
176,
072
235,
038
231,
816
Cha
nge
in E
mp
loym
ent
2005
-201
2
Net
Ch
ang
e#
-635
,741
-6
56,2
20
-301
,870
-3
30
,86
91
-6
9,55
0 -1
13
,70
81
-7
7,57
1 -4
9,03
1 I -
2551
0 9
85
81
-1
18,9
20
-152
.611
I -4
2,32
0 -1
9,85
9
Net
Ch
ang
e%
-24%
-1
9%
-39%
-3
1%
-15%
-2
2%
-21%
-1
3%
-28%
19
%
-16%
-1
3%
-17%
-9
%
Cha
nge
in E
mp
loym
ent
2011
-201
2
Net
Cha
ng
e#
3
0,1
90
-1
1 -4
,950
14
,436
1 5,
510
-6.9
81 I
-5,8
10
-23
,62
71
0
1,43
81
30,5
30
39
,80
31
4,
910
-25,
080
Net
Ch
ang
e%
1%
0%
-1%
2%
1%
-2
%
-2%
-7
%
0%
2%
5%
4%
2%
-11%
Dat
e fr
om
th
e C
urre
nt P
opul
atio
n S
urve
y an
d th
e O
ccup
atio
nal
Em
ploy
men
t S
urve
y, U
.S.
Bur
eau
of
Lab
or S
tati
stic
s
c 0
·.;:; u
ClJ 2 ..... ..... ro Ill
.::: c ... c:: 0
0 u ...., m I I u ~ QJ 0 V) N n-uer QJ I ... ~ - n-uer ca 0 > ·- 0 n -uer .... N c.. ot-uer
QJ c 60-uer .c 0 ...., - 80-uer c ....,
u Lo-uer ::::s V) .... 90-uer llO ....,
c V) so-uer c c 0 .. 170-uer
QJ u c. "'C rn-uer 0 c rn-uer ..c ca 0 .. w -uer - 0 0 C? 0 0 0
LJ"i '<f M N M 0 lUawA01dw3
10 iuaJJad 'd se s~u1uado qor
2000
20
01
2002
20
03
2004
20
05
2006
20
07
2008
20
09
2010
20
11
2012
20
13
2000
20
01
2002
20
03
2004
20
05
2006
20
07
2008
20
09
2010
20
11
2012
20
13
Ye
ar
Ye
ar
Jan
4.6
3.
2 3.
2 3.
0 3.
2 3.
6 3
.7
3.4
2.3
2.3
2.5
2.9
2.9
Jan
2.8
1.6
1.8
2.0
2.1
2.0
3.4
1.8
0.5
1.0
1.2
1.
4 1.
8
Tab
le3:
Jo
b O
pen
ing
s: 2
000
-200
13
Fe
b
3.5
2.5
2.6
2.6
2.9
3.2
3.3
3.
0 2.
1 2.
0 2.
3 2.
6 2.
9
Fe
b
3.1
1.
5 1.
3 1.
6 2.
0 1.
8 3.
5 1.
8 1.
1 1.
3 0.
9 1.
2 2.
0
Mar
3.6
2.7
2.4
2.7
3.1
3.4
3.
5 3.
0 1.
9 2.
0 2.
5 3.
0 3.
0
Mar
3.1
1.9
1.4
1.9
2.2
2.5
2.8
1.3
0.8
1.4
1.3
1.7
2.0
To
tal
Pri
vate
A
pr
May
Ju
n
4.2
3.5
3.1
2.7
2.9
2.5
3.2
2.9
3.6
3.1
3.8
3.4
3.8
3.4
3.3
3.0
1.9
1.9
2.5
2.2
2.6
2.3
3.0
2.9
3.1
3.2
2.5
2.4
2.6
3.0
3.2
3.4
2.7
1.8
2.1
2.5
2.9
Co
nst
ruct
ion
A
pr
May
Ju
n
4.3
3.
7 1.
8 1.
9 2
.7
1.7
2.4
2.2
2.4
2.2
2.9
2.6
2.8
2.3
1.5
2.3
0.4
0.7
1.
8 1.
5 2.
1 1.
8 1.
6 1.
4 2.
4
2.8
1.9
1.6
1.6
1.9
2.4
2.0
1.6
1.0
1.4
1.1
1.4
Jul 3.6
2.9
2.7
3.3
3.5
3.3
3.6
3.1
1.9
2.6
2.8
2.9
Jul 2.5
1.5
2.1
1.
8 2.
3 3
.1
2.4
1.8
0.8
1.8
1.4
1.3
Au
g
3.2
2.6
2.6
2.9
3.2
3.4
3.4
2.8
1.8
2.4
2.6
2.8
Au
g
1.7
1.6
1.4
1.8
2.0
2.6
2.0
1.2
1.0
1.0
1.7
1.4
Da
te fr
om
Job
Ope
nin
gs
an
d L
ab
or
Tu
rno
ver
Su
Ne
y, U
.S.
BL
S
Sep
3.1
2.5
2.4
3.0
3.3
3.4
3.4
2.4
2.0
2.2
2.7
2.8
Sep
2.1
1.9
0.8
1.5
2.0
2.2
1.6
1.8
1.2
1.4
1.4
1.5
Oct
3.0
3.1
2.7
3.2
3.5
3.6
3.4
2.7
2.0
2.6
2.8
3.0
Oct
1.6
1.8
1.1
1.9
2.1
1.
9 1.
7 0.
9 1.
0 1.
3 1.
2 1.
7
No
v 2.4
2.4
2.3
2.3
3.0
3.2
2.9
2.1
1.7
2.
2 2.
2 2.
6
No
v 1.4
1.2
1.1
1.4
2.0
1.3
1.
1 0
.7
0.8
1.1
1.0
1.3
De
c 3.4
2.4
2.1
2.3
2.6
2.9
3.1
2.8
2.1
1.7
2.
0 2.
3 2.
4
De
c 2.3
1.3
1.0
1.1
1.
5 1.
6 1.
3 1
.3
1.0
0.9
0.6
0.8
1.1

Ta
ble
4a
: C
on
stru
ctio
n U
ne
mp
loym
en
t: J
anua
ry 2
000
to M
ay,
2013
: In
div
idu
als
in t
he
exp
eri
en
ced
pri
vate
labo
r fo
rce
re
po
rtin
g c
urr
en
tly
em
plo
yed
or
tha
t th
eir
last
job
was
in t
he
co
nst
ruct
ion
in
du
stry
: Y
ear
2000
20
01
2002
20
03
2004
20
05
2006
20
07
2008
20
09
2010
20
11
2012
20
13
Jan 9
.7
9.8
13
.6
14
.0
11
.3
11.8
9.
0 8
.9
11.0
18
.2
24
.7
22.5
1
7.7
1
6.1
S
erie
s L
NU
0403
2231
Feb 10
.6
9.9
12.2
14
.0
11.6
12
.3
8.6
10
.5
11.4
21
.4
27.1
21
.8
17.1
15
.7
Mar
8.7
8.4
11
.8
11.8
11
.3
10.
3 8
.5
9.0
12
.0
21.1
24
.9
20.0
17
.2
14.7
Apr
M
ay
5.8
5.
0 7.
1 5
.6
10.1
7.
4 9.
3 8.
4 9
.5
7.4
7.4
6.1
6.9
6.6
8.6
6
.9
11.1
8.
6 18
.7
19
.2
21.8
20
.1
17.8
16
.3
14.
5 1
4.2
13.2
10
.8
Jun 4.
6 5
.1
6.9
7.9
7.0
5.7
5.6
5.9
8.2
17.4
20
.1
15.6
12
.8
Jul
Aug
4
.4
5.1
4.9
5
.8
6.9
7.4
7.
5 7.
1 6.
4 6.
0 5
.2
5.7
6.
1 5.
9 5.
9 5.
3 8
.0
8.2
18
.2
16
.5
17.3
17
.0
13.6
13
.5
12.3
11
.3
Sep
4.6
5
.5
7.0
7.
6 6.
8 5
.7
5.6
5.8
9.9
17
.1
17.2
13
.3
11.9
Oct
4.9
6.
1 7
.7
7.4
6.9
5.
3 4.
5 6
.1
10.
8 18
.7
17.3
13
.7
11.4
Tab
le 4
b:
Un
em
plo
yme
nt o
f in
div
idu
als
20
and
old
er:
Janu
ary
2000
to
May
, 20
13:
Yea
r 20
00
2001
20
02
2003
20
04
2005
20
06
2007
20
08
2009
20
10
2011
20
12
2013
S
erie
s L
NU
0400
0024
Jan
4
.0
4.1
5.8
5
.9
5.7
5.
2 4.
6 4
.6
4.8
7.9
9.
9 9
.2
8.3
7
.9
Fe
b
3.8
4.0
5.
6 5.
8 5.
5 5
.2
4.6
4
.4
4.7
8.
3 9
.9
9.0
8
.2
7.5
Mar
3.
7 4.
0 5.
5 5.
6 5.
5 4
.8
4.3
4
.1
4.8
8.
5 9
.6
8.7
7.8
7.
1
Ap
r 3.2
3.
7 5.
2 5.
3 4.
8 4
.4
4.1
3.
8 4
.3
8.1
8
.9
8.1
7.
2 6.
6
May
3.
3 3.
6 4
.9
5.2
4.
7 4.
2 3.
9 3.
7 4.
6 8.
4 8
.6
8.2
7.
3 6.
6
Jun
3.
4 3.
9 5.
1 5.
6 5
.0
4.4
4.0
3.
9 4.
8 8
.7
8.7
8.
5 7
.6
Jul
Au
g
3.5
3.5
4
.0
4.3
5.2
5.1
5.
5 5
.5
4.9
4
.8
4.5
4.
3 4
.3
4.1
4
.3
4.1
5.
2 5
.5
8.9
8.9
8.
9 8
.9
8.6
8.
4 7.
8 7.
5
Sep
3
.2
4.2
4.
8 5
.2
4.6
4.4
3.8
4.0
5.
4 8.
8 8
.6
8.2
7
.0
Oct
3
.1
4.4
4.9
5
.0
4.5
4
.1
3.6
3.
9 5.
5 8.
8 8.
4 7.
9 6
.9
No
v 3.2
4.
7 5
.0
5.1
4.6
4.3
3.
8 4.
0 5
.9
8.7
8.
7 7
.6
6.8
No
v 5.7
7.6
8.5
7.8
7.4
5.
7 6
.0
6.2
12.7
19
.4
18
.8
13.1
12
.2
Dec
A
nn
ua
l 6
.8
6.2
9
.0
7.1
10.9
9.
2 9.
3 9
.3
9.5
8
.4
8.2
7.4
6.
9 6
.7
9.4
7.
4 15
.3
10.
6 22
.7
19.0
20
.7
20
.6
16.0
16
.4
13.5
13
.9
De
c A
nn
ua
l 3
.2
3.4
4.9
4
.2
5.2
5
.2
5.0
5.4
4.6
4
.9
4.2
4.5
3.
8 4
.1
4.3
4
.1
6.6
5.2
9
.1
8.6
8
.6
9.0
7
.8
8.3
7.1
7.4
V)
:::> M .. ~ Cl) 0 !N t'O
0:: 0 +"" 0 co CIJ N E > c 0 0 c. +""
E ~ QJ I..
c t; :::> c >o -U
..c "'C 1: c 0 t'O
~
n -Jd'v'
01-1nr
60-l:JQ
60-uer
80-Jd'v'
Lo-1nr
90-PO
90-uer
SO-Jd'v'
vo-1nr
EQ-PO
rn-uer
ZO-Jd'v'
10-1nr
oo-i:io oo-uer
c 0 ~ u 2 ti c 0 u
I + 0 N Q) tlO
1

Table 5: Hourly and Annual Earnings: 2007 - 2012 Hourly Earnings Annual
Earnings
75th Year Mean Median Percentile
All Occupations
2007 19.56 15.10 23 .87 40690
2008 20.32 15.57 24.78 42270
2009 20.90 15.95 25.44 43460
2010 21.35 16.27 26.08 44,410
2011 21.74 16.57 26.67 45,230
2012 22.01 16.71 27.02 45,790
Change From 2011 1.2% 0.8% 1.3% 1.2%
Change from 2007 12.5% 10.7% 13.2% 12.5%
Carpenters
2007 19.84 18.11 24.40 41260
2008 20.64 18.72 25.37 42940
2009 20.98 18.98 25.76 43640
2010 21.10 19.00 25.90 43,890
2011 21.31 19.24 26.23 44,330
2012 21.41 19.20 26.35 44,520
Change From 2011 0.5% -0.2% 0.5% 0.4%
Change from 2007 7.9% 6.0% 8.0% 7.9%
Electricians
2007 23.12 21.53 28.77 48100
2008 23 .98 22.32 29.88 49890
2009 24.45 22.68 30.35 50850
2010 24.91 23.20 30.71 51,810
2011 25.44 23.71 31.38 52,910
2012 25 .50 23.96 31.48 53,030
Change From 2011 0.2% 1.1 % 0.3% 0.2%
Change from 2007 10.3% 11.3% 9.4% 10.2%
Plumbers, Pipefitters, and Steamfitters
2007 22.76 21.20 28.51 47350
2008 23 .65 21.94 29.66 49200
2009 23.97 22.27 30.01 49870
2010 24.21 22.43 30.22 50,360
2011 24.92 22.96 31.15 51,830
2012 25.46 23 .62 31.75 52,950
Change From 2011 2.2% 2.9% 1.9% 2.2%
Change from 2007 11.9% 11.4% 11.4% 11.8%
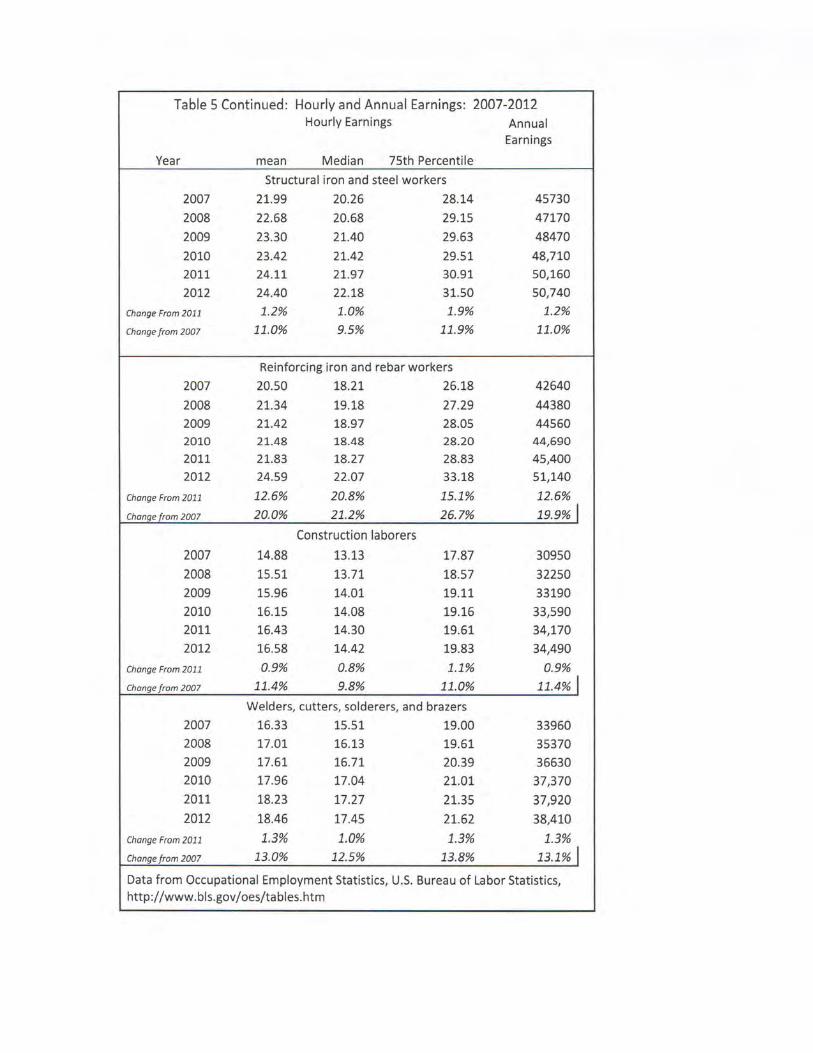
Table 5 Continued: Hourly and Annual Earnings: 2007-2012 Hourly Earnings Annual
Earnings
Year mean Median 75th Percentile
Structural iron and steel workers
2007 21.99 20.26 28.14 45730
2008 22.68 20.68 29.15 47170
2009 23.30 21.40 29.63 48470
2010 23.42 21.42 29.51 48,710
2011 24.11 21.97 30.91 50,160
2012 24.40 22.18 31.50 50,740
Change Fram 2011 1.2% 1.0% 1.9% 1.2%
Change fram 2007 11.0% 9.5% 11 .9% 11.0%
Reinforcing iron and rebar workers
2007 20.50 18.21 26.18 42640
2008 21.34 19.18 27.29 44380
2009 21.42 18.97 28.05 44560 2010 21.48 18.48 28.20 44,690 2011 21.83 18.27 28.83 45,400 2012 24.59 22.07 33.18 51,140
Change Fram 2011 12.6% 20.8% 15.1% 12.6%
Change / ram 2007 20.0% 21.2% 26.7% 19.9% I Construction laborers
2007 14.88 13.13 17.87 30950
2008 15.51 13.71 18.57 32250
2009 15.96 14.01 19.11 33190
2010 16.15 14.08 19.16 33,590 2011 16.43 14.30 19.61 34,170
2012 16.58 14.42 19.83 34,490
Change From 2011 0.9% 0.8% 1.1% 0.9%
Change from 2007 11.4% 9.8% 11.0% 11.4% I Welders, cutters, solderers, and brazers
2007 16.33 15.51 19.00 33960 2008 17.01 16.13 19.61 35370 2009 17.61 16.71 20.39 36630 2010 17.96 17.04 21.01 37,370
2011 18.23 17.27 21.35 37,920
2012 18.46 17.45 21.62 38,410
Change Fram 2011 1.3% 1.0% 1.3% 1.3% Change f rom 2007 13.0% 12.5% 13.8% 13.1% I Data from Occupational Employment Statistics, U.S. Bureau of Labor Statistics, http://www.bis.gov/oes/tables.htm
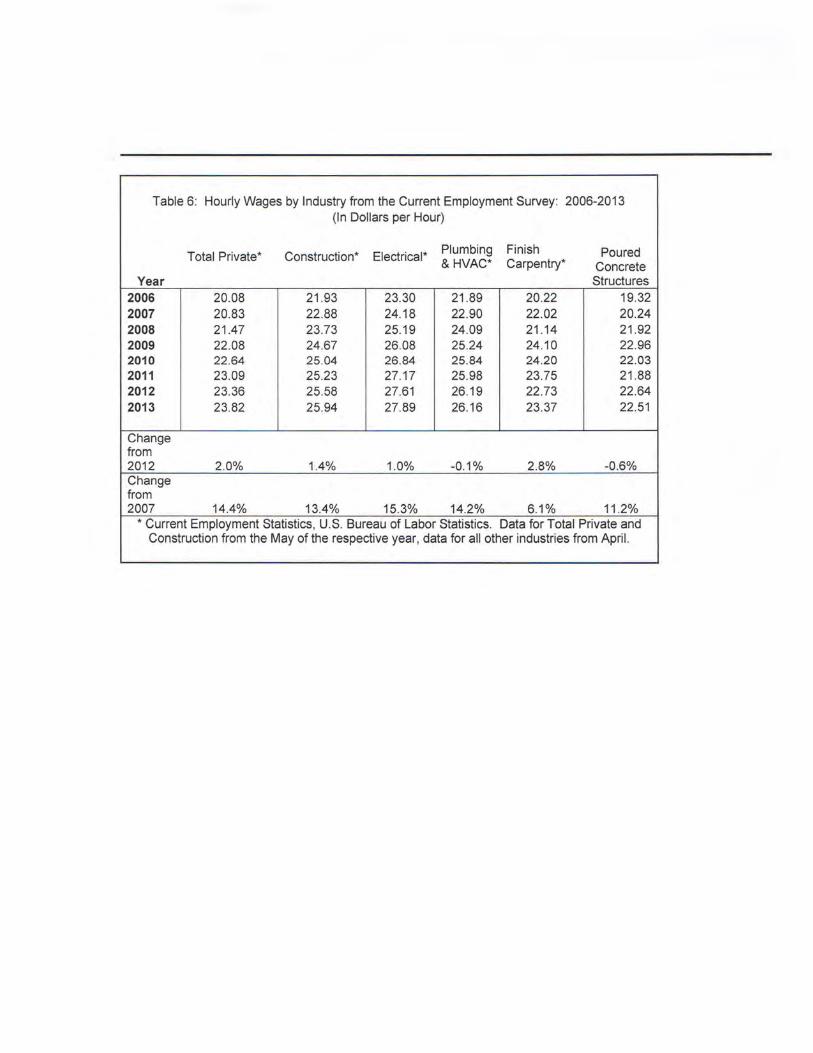
Table 6: Hourly Wages by Industry from the Current Employment Survey: 2006-2013 (In Dollars per Hour)
Total Private* Construction* Electrical* Plumbing Finish Poured & HVAC* Carpentry* Concrete
Year Structures
2006 20.08 21 .93 23.30 21 .89 20.22 19.32 2007 20.83 22.88 24.18 22.90 22 .02 20.24 2008 21.47 23 .73 25.19 24.09 21 .14 21 .92 2009 22.08 24.67 26.08 25.24 24.10 22.96 2010 22.64 25.04 26.84 25.84 24.20 22.03 2011 23.09 25.23 27.17 25.98 23.75 21 .88 2012 23.36 25.58 27.61 26.19 22 .73 22.64 2013 23.82 25.94 27.89 26.16 23.37 22.51
Change from 2012 2.0% 1.4% 1.0% -0.1% 2.8% -0 .6% Change from 2007 14.4% 13.4% 15.3% 14.2% 6.1% 11 .2%
* Current Employment Statistics, U.S. Bureau of Labor Statistics. Data for Total Private and Construction from the May of the respective year, data for all other industries from Apri l.

Bibliography
Barnow, B. S., J. Trutko and J. S. Piatak, Occupational Labor Shortages: Concepts, Causes
Consequences and Cures, Kalamazoo: W. E. Upjohn Institute, 2013
Podgornik, G. "Job openings and hires continue to show modest changes in 2011" Monthly
Labor Review, September, 2012, pages 28 - 34
Veneri, C. M., "Can occupational labor shortages be identified using available data?", Monthly
Labor Review, March, 1999, pages 15 - 21.
Page 27 of 27