Size-dependence of the dielectric breakdown … and permittivity-dependence of the dielectric...
28
This is an author-created version for self-archiving The final version, published in Journal of the Mechanics and Physics of Solids, Vol. 63, February 2014, Pages 201–213, is available at: http://www.sciencedirect.com http://dx.doi.org/10.1016/j.jmps.2013.09.009. doi:10.1016/j.jmps.2013.09.009 Size-dependence of the dielectric breakdown strength from nano- to millimeter scale By Claudia Neusel and Gerold A. Schneider* Institute of Advanced Ceramics, Hamburg University of Technology, Denickestraße 15, 21073 Hamburg, Germany [*] Corresponding-Author: Prof. Gerold A. Schneider Tel: +49-(0)40 42878 -3037 Fax: +49-(0)40 42878 -2647 E-mail: [email protected]; [email protected] Keywords: dielectric breakdown strength, size-dependence, dielectric breakdown toughness, ceramics, polymers Abstract Dielectric breakdown decisively determines the reliability of nano- to centimeter sized electronic devices and components. Nevertheless, a systematic investigation of this phenomenon over the relevant lengths scales and materials classes is still missing. Here, the thickness and permittivity-dependence of the dielectric breakdown strength of insulating crystalline and polymer materials from the millimeter down to the nanometer scale is investigated. While the dependence of breakdown strength on permittivity was found to be thickness-independent for materials in the nm-mm range, the magnitude of the breakdown strength was found to change from a thickness-independent, intrinsic regime, to a thickness- dependent, extrinsic regime. The transition-thickness is interpreted as the characteristic length of a breakdown-initiating conducting filament. The results are in agreement with a model, where the dielectric breakdown strength is defined in terms of breakdown toughness and length of a conducting filament.
Transcript of Size-dependence of the dielectric breakdown … and permittivity-dependence of the dielectric...
This is an author-created version for self-archiving The final version, published in Journal of the Mechanics and Physics of Solids, Vol. 63, February 2014,
Pages 201–213, is available at: http://www.sciencedirect.com
http://dx.doi.org/10.1016/j.jmps.2013.09.009. doi:10.1016/j.jmps.2013.09.009
Size-dependence of the dielectric breakdown strength from nano- to millimeter scale By Claudia Neusel and Gerold A. Schneider*
Institute of Advanced Ceramics, Hamburg University of Technology, Denickestraße 15,
21073 Hamburg, Germany
[*] Corresponding-Author: Prof. Gerold A. Schneider
Tel: +49-(0)40 42878 -3037
Fax: +49-(0)40 42878 -2647
E-mail: [email protected]; [email protected]
Keywords: dielectric breakdown strength, size-dependence, dielectric breakdown toughness,
ceramics, polymers
Abstract
Dielectric breakdown decisively determines the reliability of nano- to centimeter sized
electronic devices and components. Nevertheless, a systematic investigation of this
phenomenon over the relevant lengths scales and materials classes is still missing. Here, the
thickness and permittivity-dependence of the dielectric breakdown strength of insulating
crystalline and polymer materials from the millimeter down to the nanometer scale is
investigated. While the dependence of breakdown strength on permittivity was found to be
thickness-independent for materials in the nm-mm range, the magnitude of the breakdown
strength was found to change from a thickness-independent, intrinsic regime, to a thickness-
dependent, extrinsic regime. The transition-thickness is interpreted as the characteristic length
of a breakdown-initiating conducting filament. The results are in agreement with a model,
where the dielectric breakdown strength is defined in terms of breakdown toughness and
length of a conducting filament.
2
1. Introduction
Since about 90 years the phenomenon of dielectric breakdown is investigated theoretically
and experimentally. Dielectric breakdown is a limiting factor for the reliability of nano- to
millimeter or centimeter-sized electronic devices and components (O’Dwyer 1958, Nafría et
al. 1996, Dissado and Fothergill 1992). First theories to describe the mechanism of dielectric
breakdown as an electron avalanche were developed by von Hippel (1931a, b, 1932), Fröhlich
(1939) and O’Dwyer (1967). Within the same time the idea of a thermal breakdown
mechanism came up (e.g. Fock 1927, Moon 1931 and Wagner 1948). These two basic
breakdown models were later on refined for specific applications like thin films by e.g. Klein
and Gafni (1966) and enhanced by e.g. O’Dwyer (1982) or Budenstein (1980). Stark and
Garton (1955) developed an electromechanical breakdown model for thermoplastic polymers
which later on was modified by Fothergill (1991) to a filamentary electromechanical
breakdown model. The filamentary electromechanical breakdown model as well as the
electro-fracture mechanics model of Zeller and Schneider (1984) based on concepts of
fracture mechanics. The analogy between fracture mechanics and dielectric breakdown was
also taken into account for models developed by e.g. McMeeking (1986), Suo (1993), Vojta
and Clarke (1998), Fu et al. (2000), Wang and Zhang (2001), Zhang and Gao (2004), Beom
and Kim (2008), Lin et al. (2009) and Schneider (2013). Whereas electron avalanche
breakdown models are appropriate for thin films, gate oxides and other submicron-sized
electronic devices, continuum theoretical models are necessary for macroscopic high voltage
components like for example X-ray tubes, spark plugs, high-voltage cables or switches.
Recently Sun et al. (2012, 2013) showed convincingly that density function perturbation
theory calculations (DFPT) based on von Hippels avalanche model are able to predict the
intrinsic breakdown for covalently bonded and ionic materials.
Given the fact that the phenomenon of dielectric breakdown covers the lengths scale range
from centimeter to nanometers, astonishingly there is no comprehensive study investigating
its size-dependence over these lengths scales. Typically size-dependent measurements cover
thicknesses over one or two orders of magnitude (e.g. Owate and Freer 1988, 1898, 1990,
1991, Malec et al. 2010). But there is no systematic study published, where the dielectric
breakdown strength of different ceramic and polymer materials with relative permittivities
from approximately 2 - 2000 over a thickness range from 2 nm - 2 mm are investigated.
The objective of this study is, to determine the size and permittivity-dependence of the
breakdown strength of different insulating materials from the millimeter to the nanometer
scale, and to identify the transition between a thickness-dependent to a thickness-independent
3
regime. Such a transition region had been shown by Joffé (1927) for glass and mica, but was
not systematically investigated for other materials. To achieve this goal, existing data from the
literature were collected and added to own measurements in size or permittivity regimes,
which were not covered. It will be shown that there exists a transition-thickness from a
thickness-independent, termed intrinsic, to a thickness-dependent, termed extrinsic,
breakdown regime for the investigated materials. For an application in an electrical
component, the knowledge of the transition-thickness enables to decide whether an intrinsic
avalanche-type model has to be applied for the theoretical description of the breakdown or
whether a macroscopic continuum model is necessary.
Focusing on bulk samples (> 1 µm), the experimental data basis is used to check the validity
of a recently developed Griffith-type dielectric breakdown model (Schneider 2013). Existing
models, like the avalanche breakdown model, thermal breakdown model or electromechanical
breakdown model do not describe the measured thickness-dependence respectively
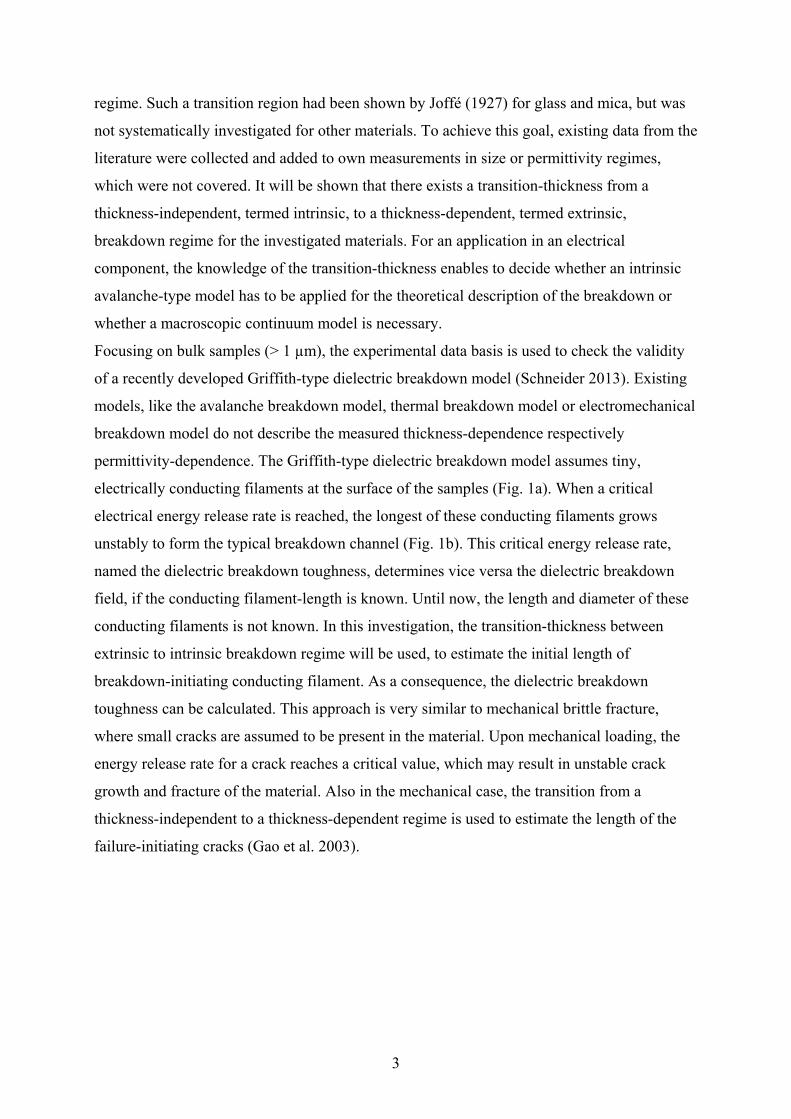
permittivity-dependence. The Griffith-type dielectric breakdown model assumes tiny,
electrically conducting filaments at the surface of the samples (Fig. 1a). When a critical
electrical energy release rate is reached, the longest of these conducting filaments grows
unstably to form the typical breakdown channel (Fig. 1b). This critical energy release rate,
named the dielectric breakdown toughness, determines vice versa the dielectric breakdown
field, if the conducting filament-length is known. Until now, the length and diameter of these
conducting filaments is not known. In this investigation, the transition-thickness between
extrinsic to intrinsic breakdown regime will be used, to estimate the initial length of
breakdown-initiating conducting filament. As a consequence, the dielectric breakdown
toughness can be calculated. This approach is very similar to mechanical brittle fracture,
where small cracks are assumed to be present in the material. Upon mechanical loading, the
energy release rate for a crack reaches a critical value, which may result in unstable crack
growth and fracture of the material. Also in the mechanical case, the transition from a
thickness-independent to a thickness-dependent regime is used to estimate the length of the
failure-initiating cracks (Gao et al. 2003).
4
a) b)
Fig. 1: a) Schematic picture of the dielectric breakdown initiated by conducting filaments.
b) Light-microscopy image of a cross-section through an Al2O3 sample with a breakdown
channel.
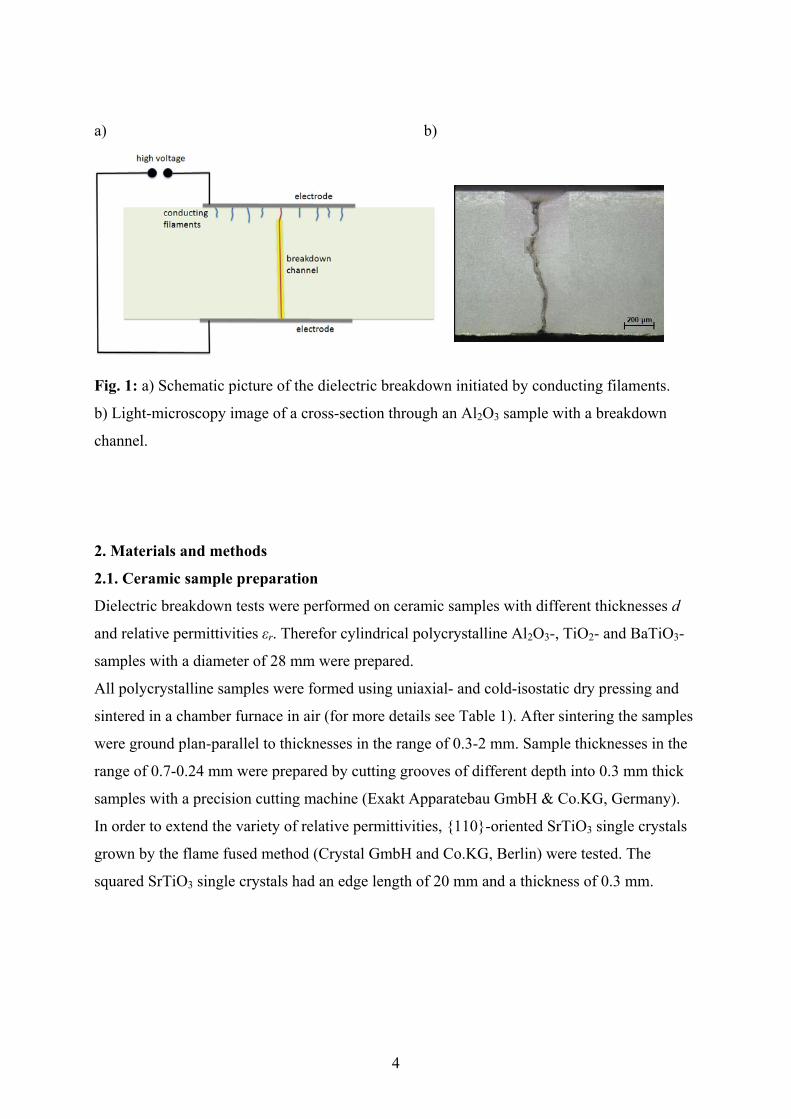
2. Materials and methods
2.1. Ceramic sample preparation
Dielectric breakdown tests were performed on ceramic samples with different thicknesses d
and relative permittivities εr. Therefor cylindrical polycrystalline Al2O3-, TiO2- and BaTiO3-
samples with a diameter of 28 mm were prepared.
All polycrystalline samples were formed using uniaxial- and cold-isostatic dry pressing and
sintered in a chamber furnace in air (for more details see Table 1). After sintering the samples
were ground plan-parallel to thicknesses in the range of 0.3-2 mm. Sample thicknesses in the
range of 0.7-0.24 mm were prepared by cutting grooves of different depth into 0.3 mm thick
samples with a precision cutting machine (Exakt Apparatebau GmbH & Co.KG, Germany).
In order to extend the variety of relative permittivities, {110}-oriented SrTiO3 single crystals
grown by the flame fused method (Crystal GmbH and Co.KG, Berlin) were tested. The
squared SrTiO3 single crystals had an edge length of 20 mm and a thickness of 0.3 mm.
5
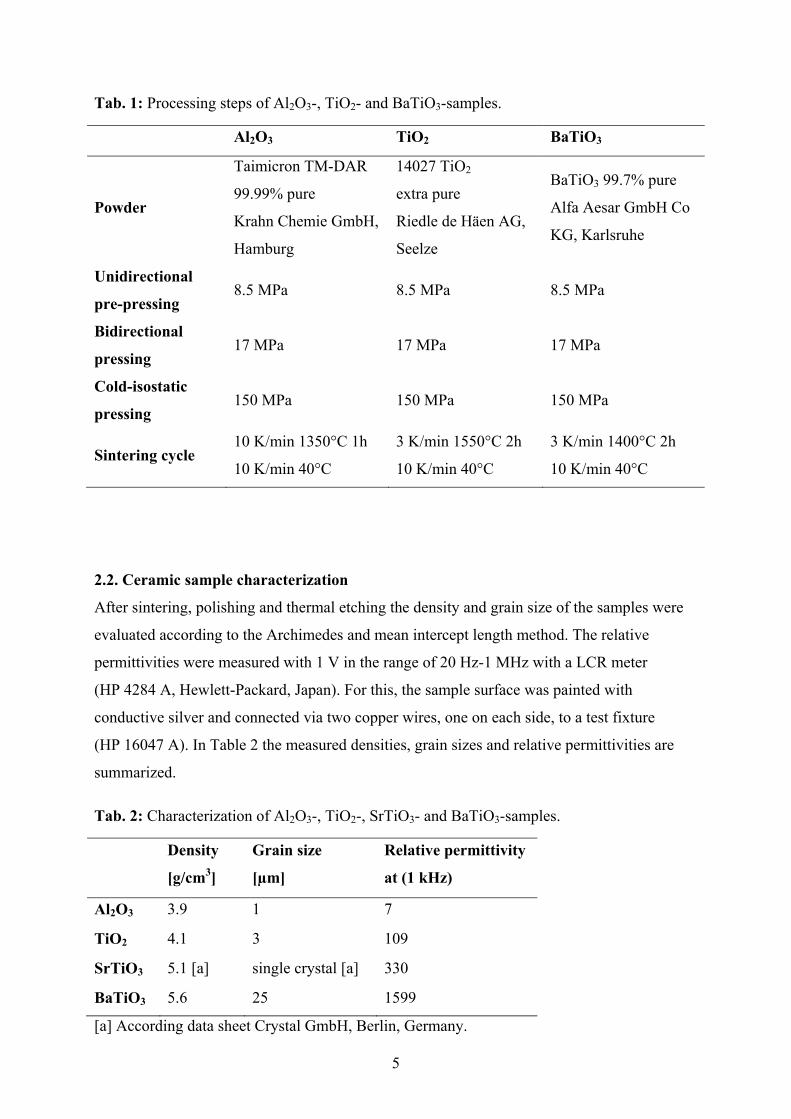
Tab. 1: Processing steps of Al2O3-, TiO2- and BaTiO3-samples.
2.2. Ceramic sample characterization
After sintering, polishing and thermal etching the density and grain size of the samples were
evaluated according to the Archimedes and mean intercept length method. The relative
permittivities were measured with 1 V in the range of 20 Hz-1 MHz with a LCR meter
(HP 4284 A, Hewlett-Packard, Japan). For this, the sample surface was painted with
conductive silver and connected via two copper wires, one on each side, to a test fixture
(HP 16047 A). In Table 2 the measured densities, grain sizes and relative permittivities are
summarized.
Tab. 2: Characterization of Al2O3-, TiO2-, SrTiO3- and BaTiO3-samples.
Density
[g/cm3]
Grain size
[µm]
Relative permittivity
at (1 kHz)
Al2O3 3.9 1 7
TiO2 4.1 3 109
SrTiO3 5.1 [a] single crystal [a] 330
BaTiO3 5.6 25 1599
[a] According data sheet Crystal GmbH, Berlin, Germany.
Al2O3 TiO2 BaTiO3
Powder
Taimicron TM-DAR
99.99% pure
Krahn Chemie GmbH,
Hamburg
14027 TiO2
extra pure
Riedle de Häen AG,
Seelze
BaTiO3 99.7% pure
Alfa Aesar GmbH Co
KG, Karlsruhe
Unidirectional
pre-pressing 8.5 MPa 8.5 MPa 8.5 MPa
Bidirectional
pressing 17 MPa 17 MPa 17 MPa
Cold-isostatic
pressing 150 MPa 150 MPa 150 MPa
Sintering cycle 10 K/min 1350°C 1h
10 K/min 40°C
3 K/min 1550°C 2h
10 K/min 40°C
3 K/min 1400°C 2h
10 K/min 40°C
6
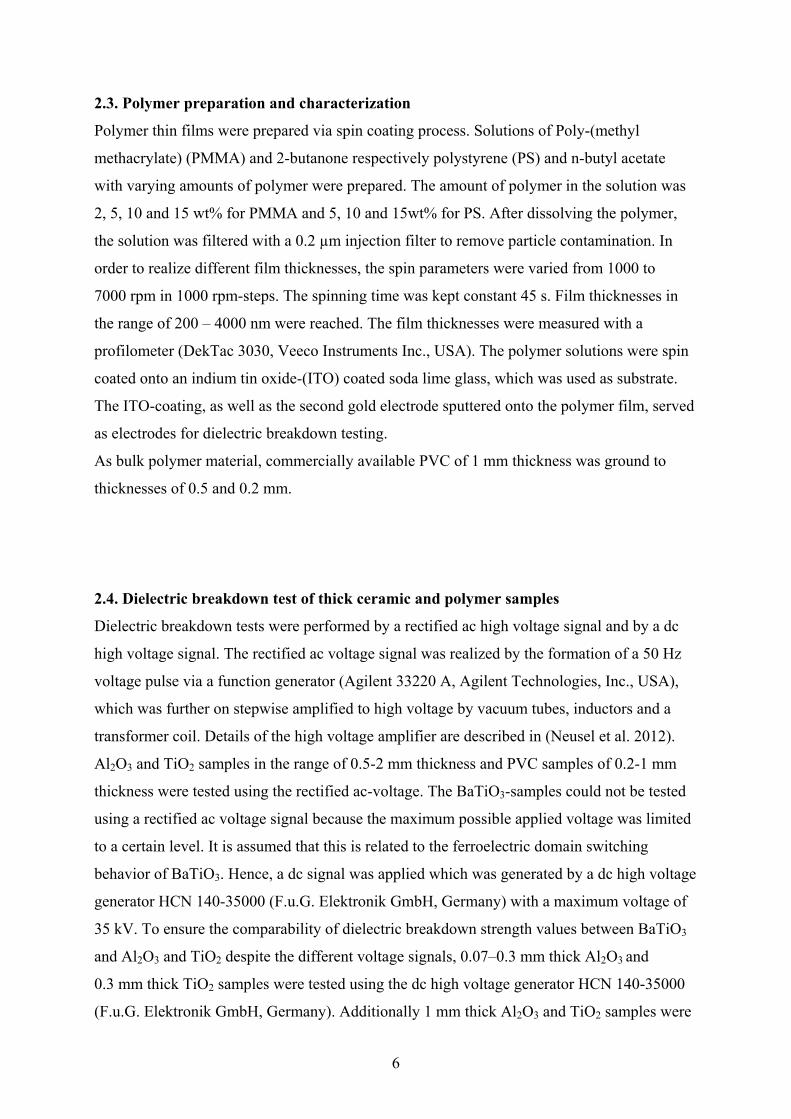
2.3. Polymer preparation and characterization
Polymer thin films were prepared via spin coating process. Solutions of Poly-(methyl
methacrylate) (PMMA) and 2-butanone respectively polystyrene (PS) and n-butyl acetate
with varying amounts of polymer were prepared. The amount of polymer in the solution was
2, 5, 10 and 15 wt% for PMMA and 5, 10 and 15wt% for PS. After dissolving the polymer,
the solution was filtered with a 0.2 µm injection filter to remove particle contamination. In
order to realize different film thicknesses, the spin parameters were varied from 1000 to
7000 rpm in 1000 rpm-steps. The spinning time was kept constant 45 s. Film thicknesses in
the range of 200 – 4000 nm were reached. The film thicknesses were measured with a
profilometer (DekTac 3030, Veeco Instruments Inc., USA). The polymer solutions were spin
coated onto an indium tin oxide-(ITO) coated soda lime glass, which was used as substrate.
The ITO-coating, as well as the second gold electrode sputtered onto the polymer film, served
as electrodes for dielectric breakdown testing.
As bulk polymer material, commercially available PVC of 1 mm thickness was ground to
thicknesses of 0.5 and 0.2 mm.
2.4. Dielectric breakdown test of thick ceramic and polymer samples
Dielectric breakdown tests were performed by a rectified ac high voltage signal and by a dc
high voltage signal. The rectified ac voltage signal was realized by the formation of a 50 Hz
voltage pulse via a function generator (Agilent 33220 A, Agilent Technologies, Inc., USA),
which was further on stepwise amplified to high voltage by vacuum tubes, inductors and a
transformer coil. Details of the high voltage amplifier are described in (Neusel et al. 2012).
Al2O3 and TiO2 samples in the range of 0.5-2 mm thickness and PVC samples of 0.2-1 mm
thickness were tested using the rectified ac-voltage. The BaTiO3-samples could not be tested
using a rectified ac voltage signal because the maximum possible applied voltage was limited
to a certain level. It is assumed that this is related to the ferroelectric domain switching
behavior of BaTiO3. Hence, a dc signal was applied which was generated by a dc high voltage
generator HCN 140-35000 (F.u.G. Elektronik GmbH, Germany) with a maximum voltage of
35 kV. To ensure the comparability of dielectric breakdown strength values between BaTiO3
and Al2O3 and TiO2 despite the different voltage signals, 0.07–0.3 mm thick Al2O3 and
0.3 mm thick TiO2 samples were tested using the dc high voltage generator HCN 140-35000
(F.u.G. Elektronik GmbH, Germany). Additionally 1 mm thick Al2O3 and TiO2 samples were
7
tested using the dc high voltage generator ER75P4 (Glassman high voltage Inc., UK), which
can generate a maximum high voltage signal of 75 kV. In Table 3 the high voltage signals
used for different samples and thicknesses are summarized.
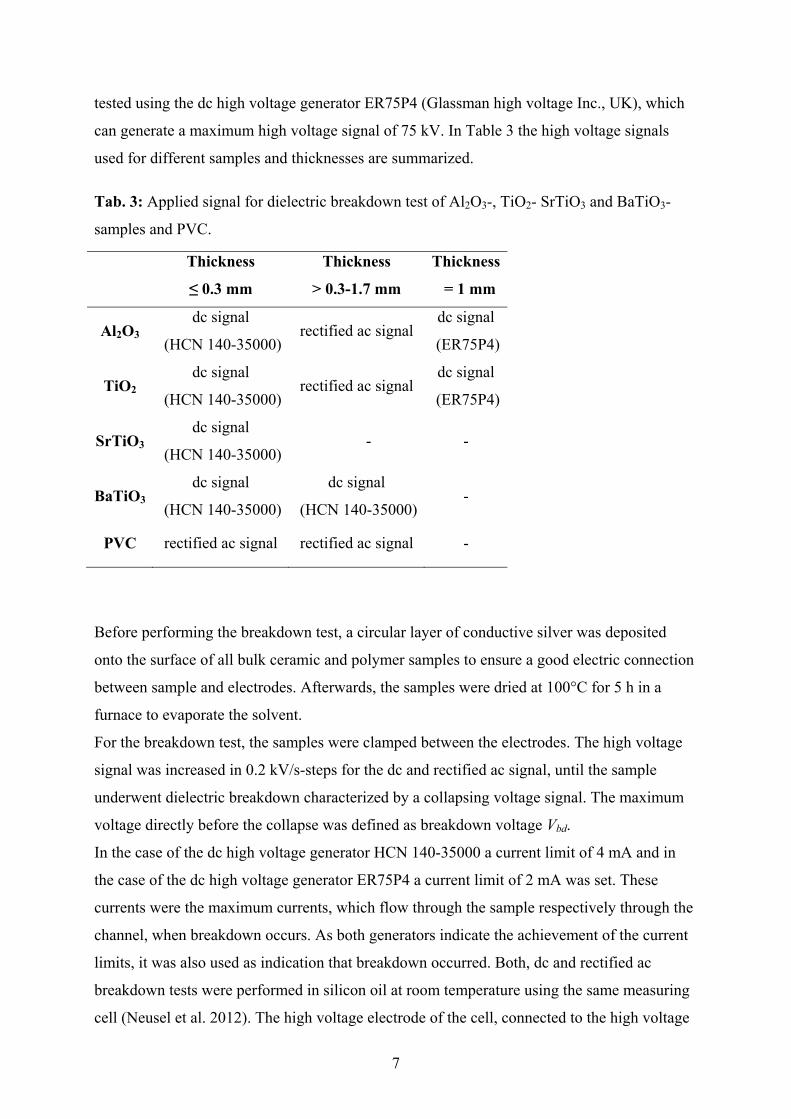
Tab. 3: Applied signal for dielectric breakdown test of Al2O3-, TiO2- SrTiO3 and BaTiO3-
samples and PVC.
Thickness
≤ 0.3 mm
Thickness
> 0.3-1.7 mm
Thickness
= 1 mm
Al2O3 dc signal
(HCN 140-35000) rectified ac signal
dc signal
(ER75P4)
TiO2 dc signal
(HCN 140-35000) rectified ac signal
dc signal
(ER75P4)
SrTiO3 dc signal
(HCN 140-35000) - -
BaTiO3 dc signal
(HCN 140-35000)
dc signal
(HCN 140-35000)-
PVC rectified ac signal rectified ac signal -
Before performing the breakdown test, a circular layer of conductive silver was deposited
onto the surface of all bulk ceramic and polymer samples to ensure a good electric connection
between sample and electrodes. Afterwards, the samples were dried at 100°C for 5 h in a
furnace to evaporate the solvent.
For the breakdown test, the samples were clamped between the electrodes. The high voltage
signal was increased in 0.2 kV/s-steps for the dc and rectified ac signal, until the sample
underwent dielectric breakdown characterized by a collapsing voltage signal. The maximum
voltage directly before the collapse was defined as breakdown voltage Vbd.
In the case of the dc high voltage generator HCN 140-35000 a current limit of 4 mA and in
the case of the dc high voltage generator ER75P4 a current limit of 2 mA was set. These
currents were the maximum currents, which flow through the sample respectively through the
channel, when breakdown occurs. As both generators indicate the achievement of the current
limits, it was also used as indication that breakdown occurred. Both, dc and rectified ac
breakdown tests were performed in silicon oil at room temperature using the same measuring
cell (Neusel et al. 2012). The high voltage electrode of the cell, connected to the high voltage
8
source, was designed as brass-made pin electrode with rounded tip, enclosed by a PVC
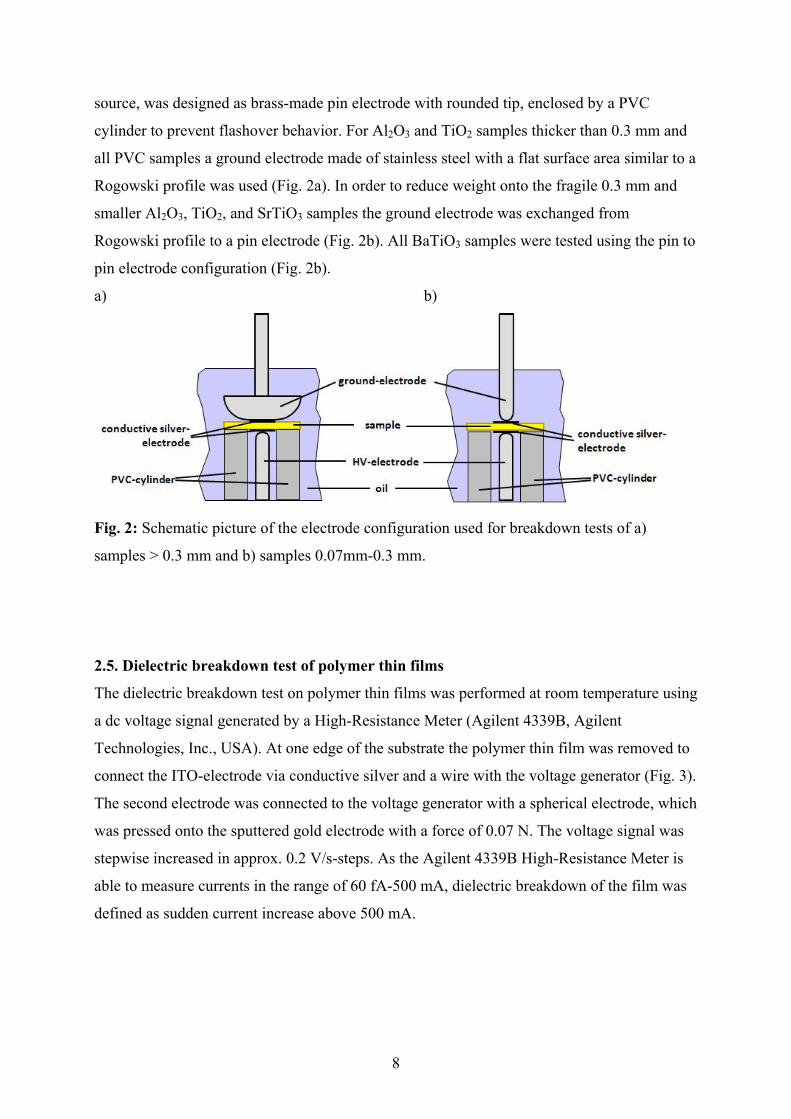
cylinder to prevent flashover behavior. For Al2O3 and TiO2 samples thicker than 0.3 mm and
all PVC samples a ground electrode made of stainless steel with a flat surface area similar to a
Rogowski profile was used (Fig. 2a). In order to reduce weight onto the fragile 0.3 mm and
smaller Al2O3, TiO2, and SrTiO3 samples the ground electrode was exchanged from
Rogowski profile to a pin electrode (Fig. 2b). All BaTiO3 samples were tested using the pin to
pin electrode configuration (Fig. 2b).
a) b)
Fig. 2: Schematic picture of the electrode configuration used for breakdown tests of a)
samples > 0.3 mm and b) samples 0.07mm-0.3 mm.
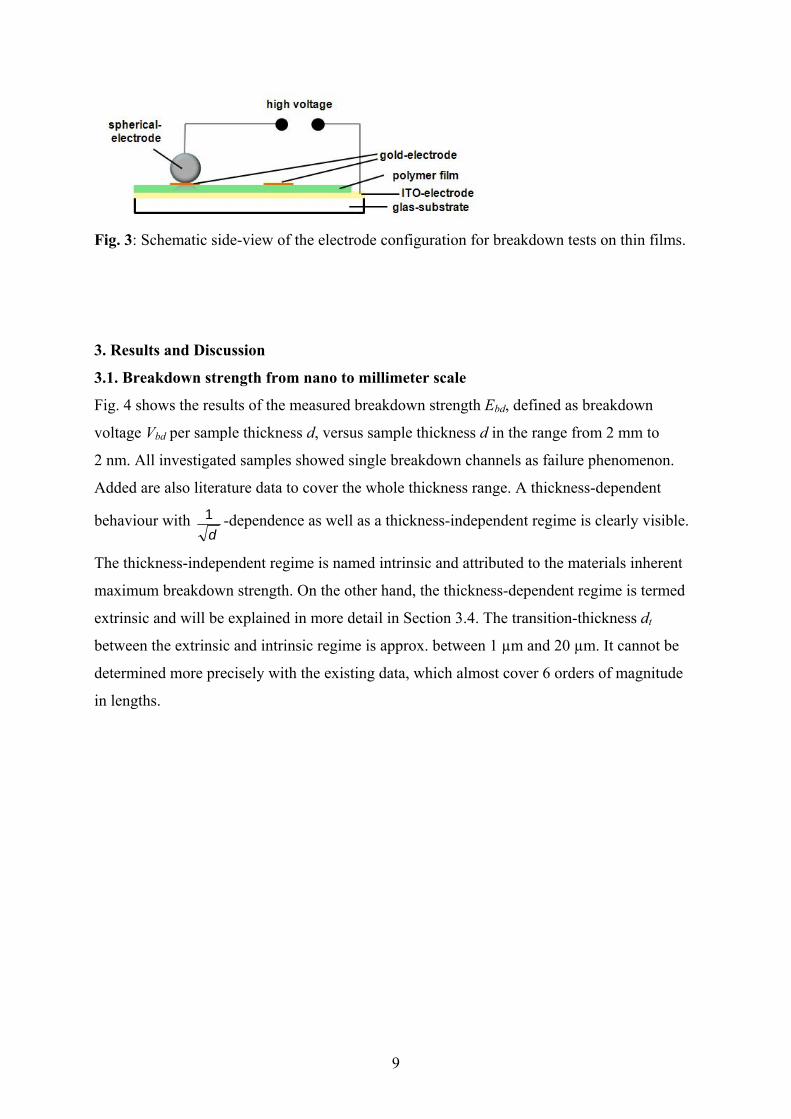
2.5. Dielectric breakdown test of polymer thin films
The dielectric breakdown test on polymer thin films was performed at room temperature using
a dc voltage signal generated by a High-Resistance Meter (Agilent 4339B, Agilent
Technologies, Inc., USA). At one edge of the substrate the polymer thin film was removed to
connect the ITO-electrode via conductive silver and a wire with the voltage generator (Fig. 3).
The second electrode was connected to the voltage generator with a spherical electrode, which
was pressed onto the sputtered gold electrode with a force of 0.07 N. The voltage signal was
stepwise increased in approx. 0.2 V/s-steps. As the Agilent 4339B High-Resistance Meter is
able to measure currents in the range of 60 fA-500 mA, dielectric breakdown of the film was
defined as sudden current increase above 500 mA.
9
Fig. 3: Schematic side-view of the electrode configuration for breakdown tests on thin films.
3. Results and Discussion
3.1. Breakdown strength from nano to millimeter scale
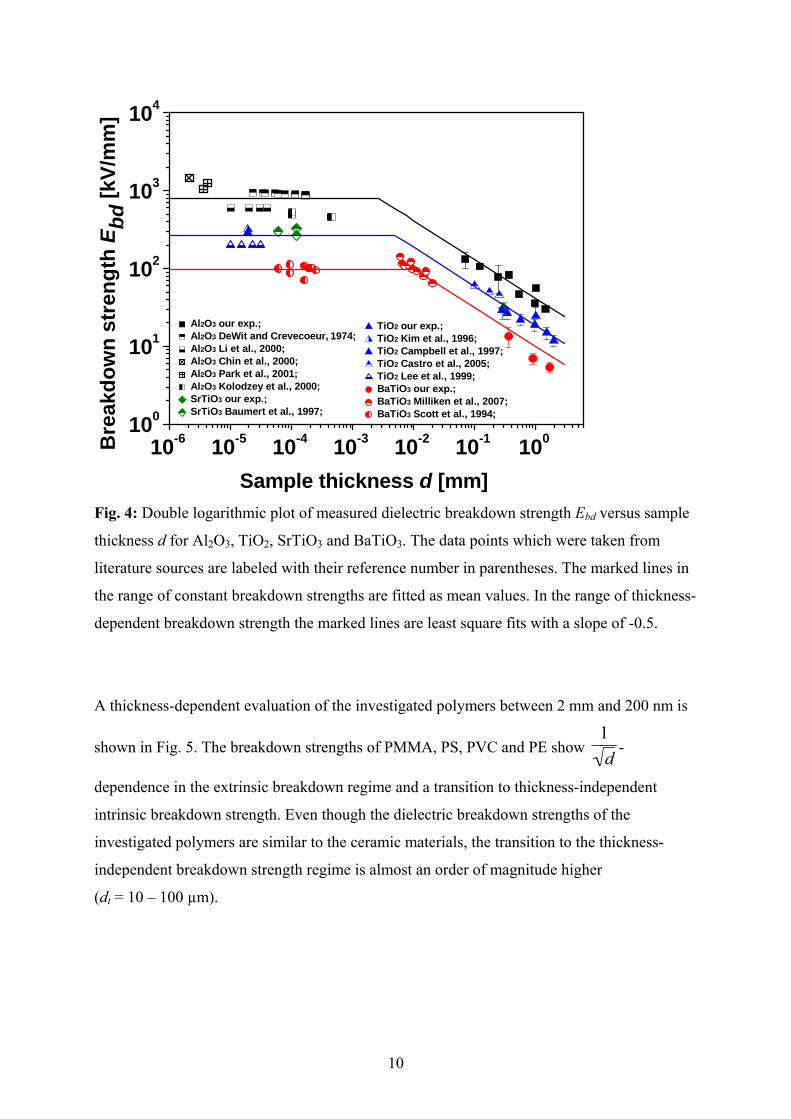
Fig. 4 shows the results of the measured breakdown strength Ebd, defined as breakdown
voltage Vbd per sample thickness d, versus sample thickness d in the range from 2 mm to
2 nm. All investigated samples showed single breakdown channels as failure phenomenon.
Added are also literature data to cover the whole thickness range. A thickness-dependent
behaviour with d
1 -dependence as well as a thickness-independent regime is clearly visible.
The thickness-independent regime is named intrinsic and attributed to the materials inherent
maximum breakdown strength. On the other hand, the thickness-dependent regime is termed
extrinsic and will be explained in more detail in Section 3.4. The transition-thickness dt
between the extrinsic and intrinsic regime is approx. between 1 µm and 20 µm. It cannot be
determined more precisely with the existing data, which almost cover 6 orders of magnitude
in lengths.
10
TiO2 our exp.;TiO2 Kim et al., 1996;TiO2 Campbell et al., 1997;TiO2 Castro et al., 2005;TiO2 Lee et al., 1999;BaTiO3 our exp.;BaTiO3 Milliken et al., 2007;BaTiO3 Scott et al., 1994;
Al2O3 our exp.;Al2O3 DeWit and Crevecoeur, 1974;Al2O3 Li et al., 2000;Al2O3 Chin et al., 2000;Al2O3 Park et al., 2001;Al2O3 Kolodzey et al., 2000;SrTiO3 our exp.;SrTiO3 Baumert et al., 1997;
10-6 10-5 10-4 10-3 10-2 10-1 100100
101
102
103
104B
reak
do
wn
str
eng
th E
bd
[kV
/mm
]
Sample thickness d [mm]
Fig. 4: Double logarithmic plot of measured dielectric breakdown strength Ebd versus sample
thickness d for Al2O3, TiO2, SrTiO3 and BaTiO3. The data points which were taken from
literature sources are labeled with their reference number in parentheses. The marked lines in
the range of constant breakdown strengths are fitted as mean values. In the range of thickness-
dependent breakdown strength the marked lines are least square fits with a slope of -0.5.
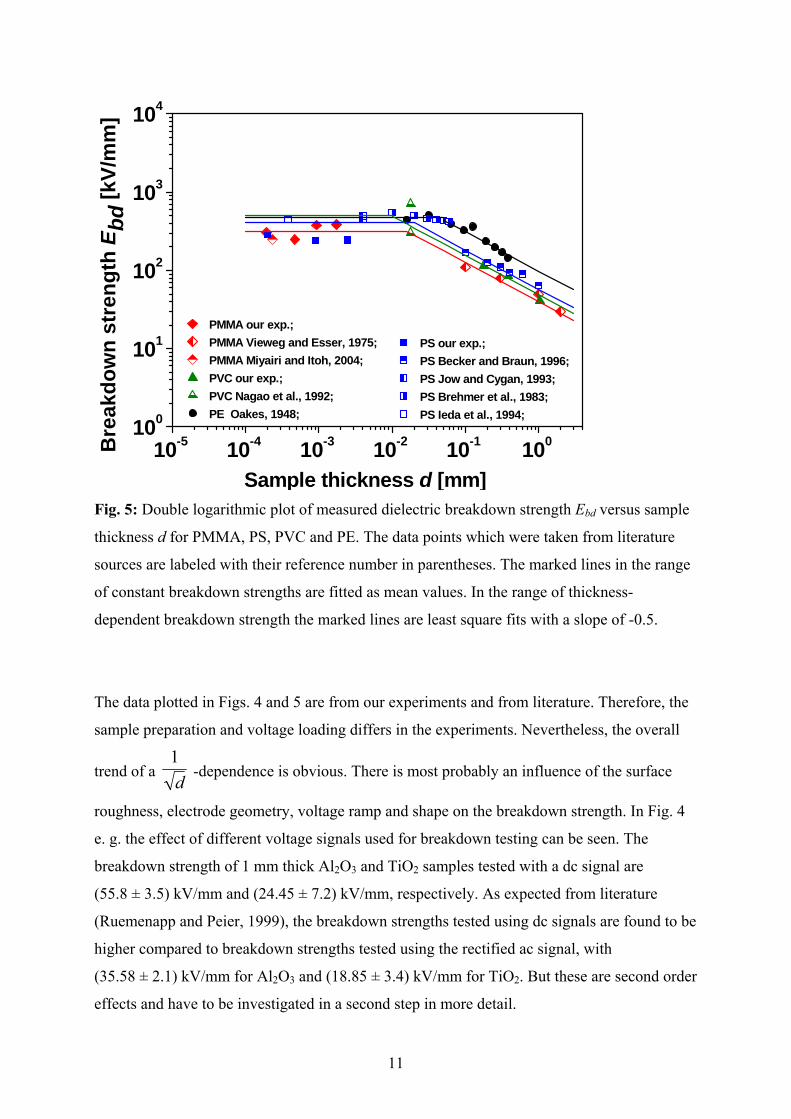
A thickness-dependent evaluation of the investigated polymers between 2 mm and 200 nm is
shown in Fig. 5. The breakdown strengths of PMMA, PS, PVC and PE show -
dependence in the extrinsic breakdown regime and a transition to thickness-independent
intrinsic breakdown strength. Even though the dielectric breakdown strengths of the
investigated polymers are similar to the ceramic materials, the transition to the thickness-
independent breakdown strength regime is almost an order of magnitude higher
(dt = 10 – 100 µm).
1
d
11
10-5 10-4 10-3 10-2 10-1 100100
101
102
103
104
PS our exp.;
PS Becker and Braun, 1996;
PS Jow and Cygan, 1993;
PS Brehmer et al., 1983;
PS Ieda et al., 1994;
PMMA our exp.;
PMMA Vieweg and Esser, 1975;
PMMA Miyairi and Itoh, 2004;
PVC our exp.;
PVC Nagao et al., 1992;
PE Oakes, 1948;
Bre
akd
ow
n s
tren
gth
Eb
d [
kV/m
m]
Sample thickness d [mm]
Fig. 5: Double logarithmic plot of measured dielectric breakdown strength Ebd versus sample
thickness d for PMMA, PS, PVC and PE. The data points which were taken from literature
sources are labeled with their reference number in parentheses. The marked lines in the range
of constant breakdown strengths are fitted as mean values. In the range of thickness-
dependent breakdown strength the marked lines are least square fits with a slope of -0.5.
The data plotted in Figs. 4 and 5 are from our experiments and from literature. Therefore, the
sample preparation and voltage loading differs in the experiments. Nevertheless, the overall
trend of a -dependence is obvious. There is most probably an influence of the surface
roughness, electrode geometry, voltage ramp and shape on the breakdown strength. In Fig. 4
e. g. the effect of different voltage signals used for breakdown testing can be seen. The
breakdown strength of 1 mm thick Al2O3 and TiO2 samples tested with a dc signal are
(55.8 ± 3.5) kV/mm and (24.45 ± 7.2) kV/mm, respectively. As expected from literature
(Ruemenapp and Peier, 1999), the breakdown strengths tested using dc signals are found to be
higher compared to breakdown strengths tested using the rectified ac signal, with
(35.58 ± 2.1) kV/mm for Al2O3 and (18.85 ± 3.4) kV/mm for TiO2. But these are second order
effects and have to be investigated in a second step in more detail.
1
d
12
Both Figs. 4 and 5 show that when the thickness d is reduced below the transition-thickness dt
a maximum materials specific breakdown strength Emax is reached.
Sun et al. (2012, 2013) calculated the breakdown strength of non-oxide ionic and covalently
bonded materials with DFPT. The DFPT calculations were based on von Hippels electron
avalanche model. The comparison of these calculated breakdown strengths with
experimentally determined breakdown strengths for approx. 1µm thick films show good
agreement. DFPT results for the materials in this study are not published. The avalanche
model treats the dielectric breakdown as an intrinsic effect. As a consequence, it does not
predict a thickness effect and is appropriate for d < dt.
The thickness-dependence of the breakdown strength is often explained as Weibull effect
similar to the mechanical case (Owate and Freer 1992, Malec et al. 2010). If a Weibull effect
similar to the mechanical case were true, one is able to analyze the Weibull modulus from a
plot of the breakdown strength as function of the sample thickness (for samples of constant
electrode areas), which shows a slope of -1/2. In the mechanical case with these data the
Weibull modulus can be analyzed to be m = 2 because the mechanical strength σ scales with
the effective volume Veff as m
eff
eff
V
V/1
1
2
2
1
(Munz and Fett 2001). In the case of the
dielectric breakdown strength not exactly the same equation must hold, but one can draw the
following conclusion. If all measured materials (ceramics and polymers) show the same
thickness-dependence, it follows that they all should have the same defect distribution. This is
highly unlikely and does not happen in the mechanical case. It would mean that all ceramic
materials have the same Weibull modulus.
3.2. Permittivity-dependence of breakdown strength for ceramic materials
Besides the size-dependence the permittivity-dependence of the dielectric breakdown strength
was evaluated. In Fig. 6 the experimental results of thin film measurements and 0.3 mm thick
Al2O3, TiO2, SrTiO3 and BaTiO3-samples are plotted as a function of the relative permittivity
εr. The calculation of the theoretic breakdown strength Eth, which is also shown in Fig. 6, is
explained in detail in the following chapter. With these four oxide ceramics a range of relative
permittivities from 10 to 1000 could be covered.
13
100 101 102 103100
101
102
103
104
105
Eth
Ebd(0.3mm)
Emax
Al2O3
TiO2
SrTiO3
BaTiO3
Bre
akd
ow
n s
tren
gth
Eb
d [
kV
/mm
]
Relative permittivity r [-]
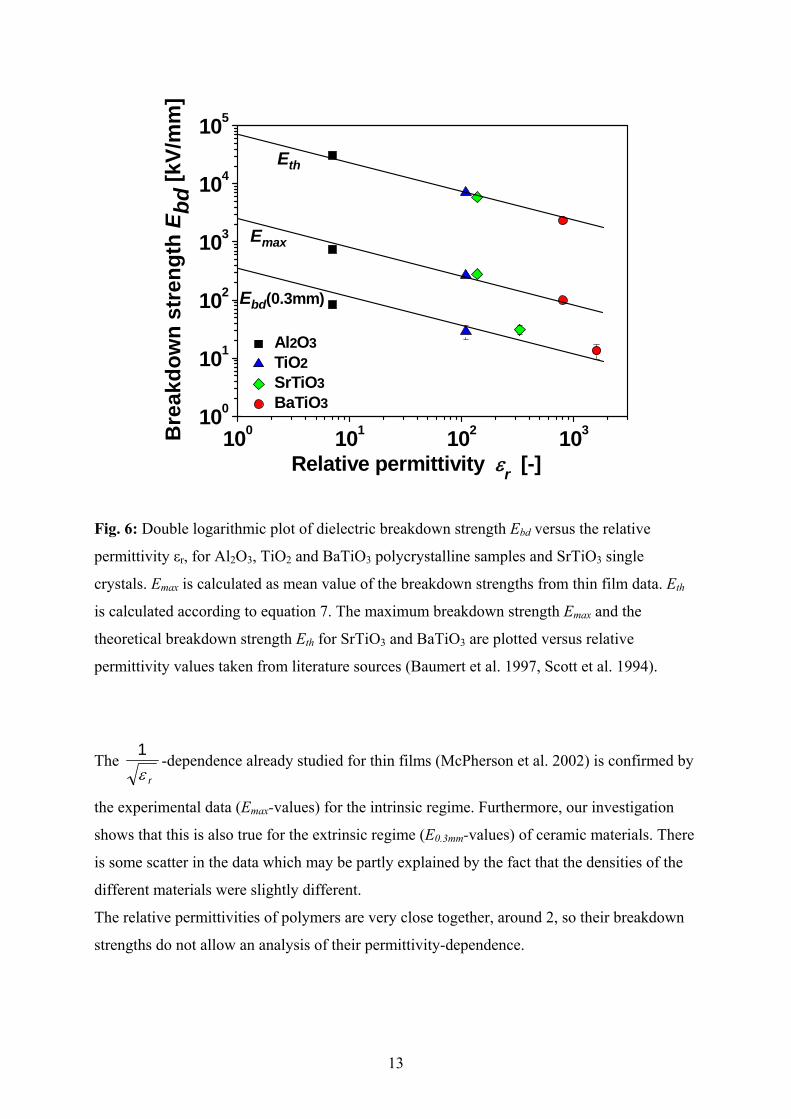
Fig. 6: Double logarithmic plot of dielectric breakdown strength Ebd versus the relative
permittivity εr, for Al2O3, TiO2 and BaTiO3 polycrystalline samples and SrTiO3 single
crystals. Emax is calculated as mean value of the breakdown strengths from thin film data. Eth
is calculated according to equation 7. The maximum breakdown strength Emax and the
theoretical breakdown strength Eth for SrTiO3 and BaTiO3 are plotted versus relative
permittivity values taken from literature sources (Baumert et al. 1997, Scott et al. 1994).
The r
1-dependence already studied for thin films (McPherson et al. 2002) is confirmed by
the experimental data (Emax-values) for the intrinsic regime. Furthermore, our investigation
shows that this is also true for the extrinsic regime (E0.3mm-values) of ceramic materials. There
is some scatter in the data which may be partly explained by the fact that the densities of the
different materials were slightly different.
The relative permittivities of polymers are very close together, around 2, so their breakdown
strengths do not allow an analysis of their permittivity-dependence.
14
3.3. Theoretical intrinsic breakdown strength
As mentioned in the introduction, the most recent DFPT-calculations by Sun et al. (2012,
2013) are very convincing. These calculations are physically based on an electron avalanche
mechanism originally developed by von Hippel (1931a, b, 1932). In search of a simple
intuitive model we think that Suo (1993) developed a nice physical approach, which is
attractive to be presented and further developed. This breakdown model is based on models of
the cleavage strength by Orowan (1949) and Polanyi (1921). In the following it will be shown
that a further development of this model leads to the experimentally observed permittivity
behavior. As an avalanche process needs a certain minimum sample thickness to develop, the
following model might be the mechanism which leads to dielectric breakdown for samples,
which are even not thick enough to develop an avalanche.
In analogy to the cleavage strength in fracture mechanics Emax is interpreted as intrinsic
breakdown strength. Based on the ideas of Suo (1993), Orowan (1949) and Polanyi (1921) a
simple intuitive theoretical model for the intrinsic or theoretical breakdown strength Eth is
presented.
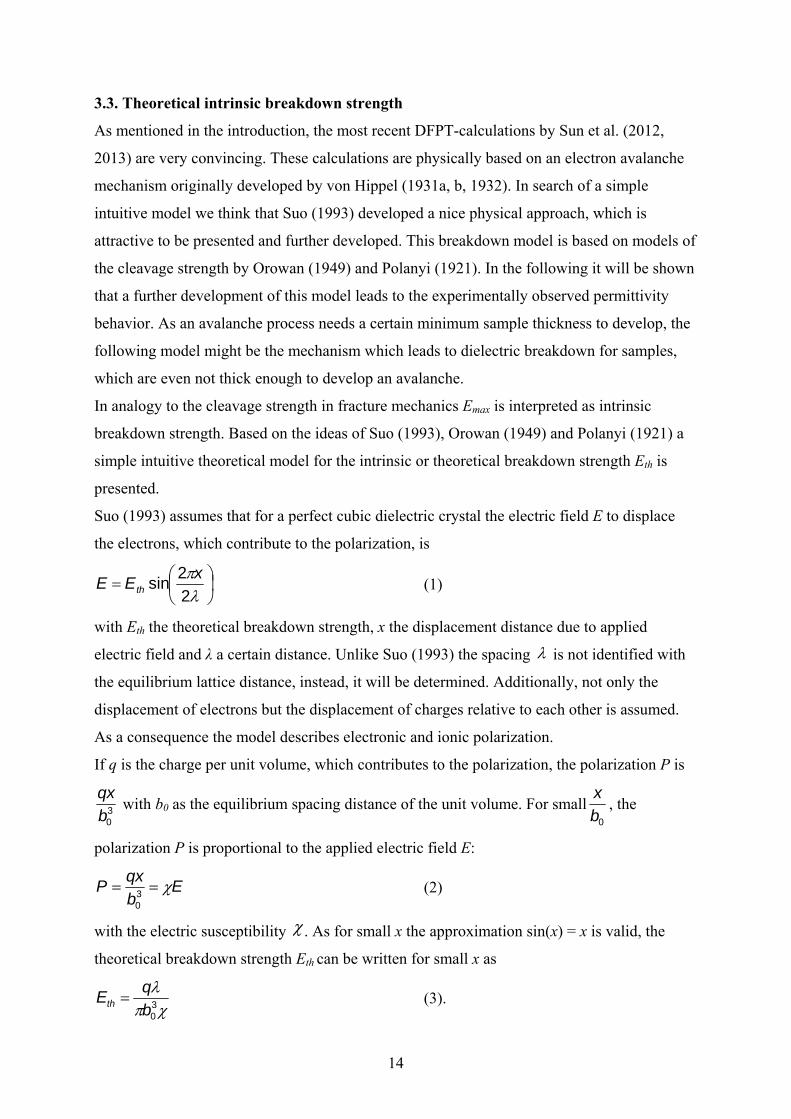
Suo (1993) assumes that for a perfect cubic dielectric crystal the electric field E to displace
the electrons, which contribute to the polarization, is
2
2sin
xEE th (1)
with Eth the theoretical breakdown strength, x the displacement distance due to applied
electric field and λ a certain distance. Unlike Suo (1993) the spacing is not identified with
the equilibrium lattice distance, instead, it will be determined. Additionally, not only the
displacement of electrons but the displacement of charges relative to each other is assumed.
As a consequence the model describes electronic and ionic polarization.
If q is the charge per unit volume, which contributes to the polarization, the polarization P is
30b
qx with b0 as the equilibrium spacing distance of the unit volume. For small
0b
x, the
polarization P is proportional to the applied electric field E:
Eb
qxP 3
0
(2)
with the electric susceptibility . As for small x the approximation sin(x) = x is valid, the
theoretical breakdown strength Eth can be written for small x as
30b
qEth (3).
15
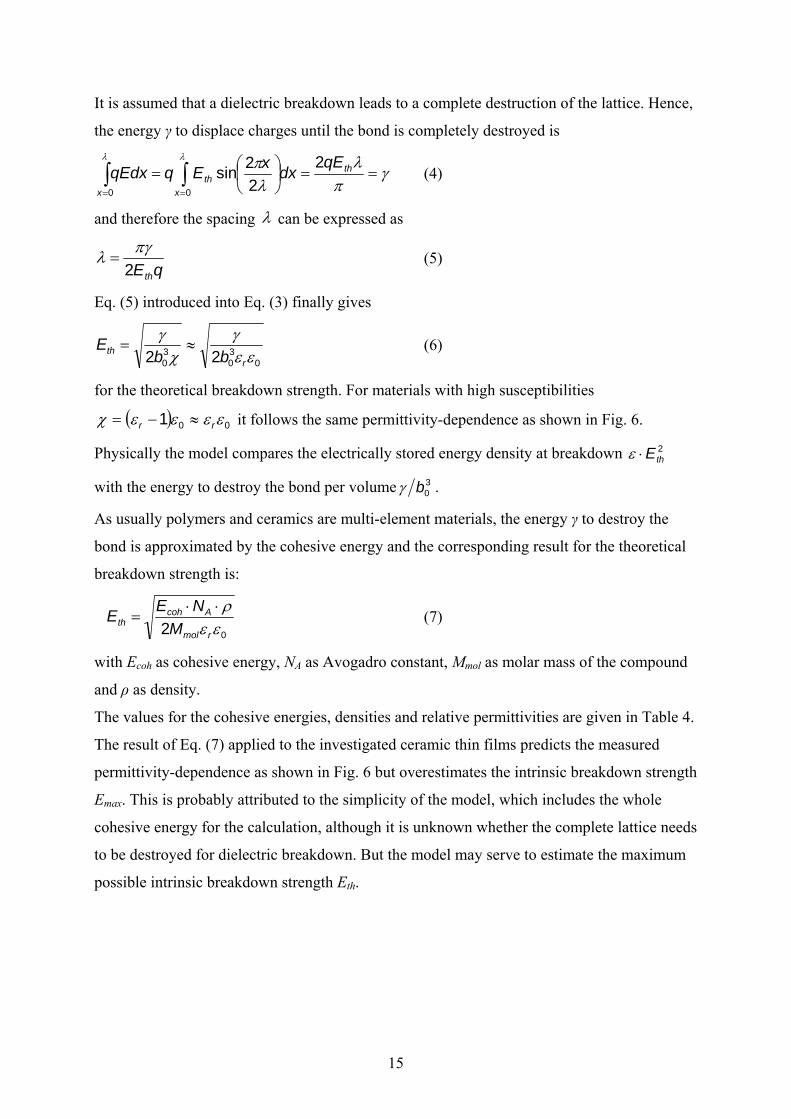
It is assumed that a dielectric breakdown leads to a complete destruction of the lattice. Hence,
the energy γ to displace charges until the bond is completely destroyed is
th
x
th
x
qEdx
xEqqEdx
2
2
2sin
00
(4)
and therefore the spacing can be expressed as
qEth2
(5)
Eq. (5) introduced into Eq. (3) finally gives
030
30 22
rth bb
E (6)
for the theoretical breakdown strength. For materials with high susceptibilities
001 rr it follows the same permittivity-dependence as shown in Fig. 6.
Physically the model compares the electrically stored energy density at breakdown 2thE
with the energy to destroy the bond per volume 30b .
As usually polymers and ceramics are multi-element materials, the energy γ to destroy the
bond is approximated by the cohesive energy and the corresponding result for the theoretical
breakdown strength is:
02
rmol
Acohth M
NEE
(7)
with Ecoh as cohesive energy, NA as Avogadro constant, Mmol as molar mass of the compound
and ρ as density.
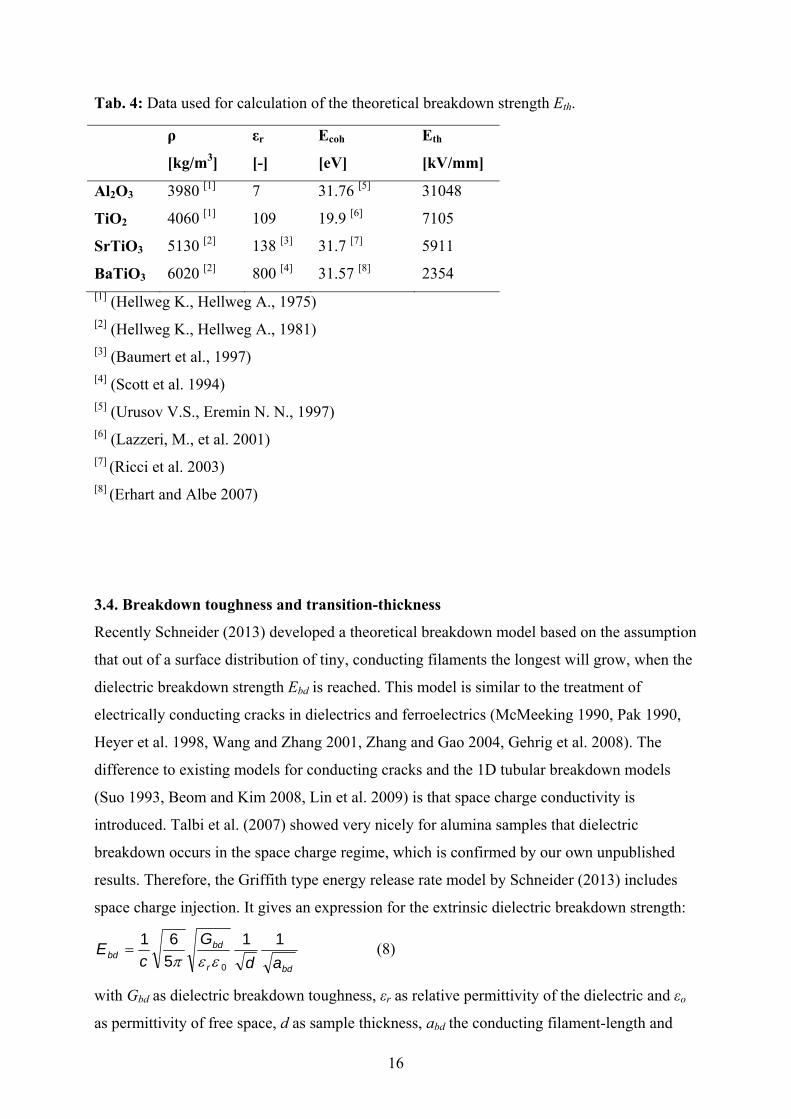
The values for the cohesive energies, densities and relative permittivities are given in Table 4.
The result of Eq. (7) applied to the investigated ceramic thin films predicts the measured
permittivity-dependence as shown in Fig. 6 but overestimates the intrinsic breakdown strength
Emax. This is probably attributed to the simplicity of the model, which includes the whole
cohesive energy for the calculation, although it is unknown whether the complete lattice needs
to be destroyed for dielectric breakdown. But the model may serve to estimate the maximum
possible intrinsic breakdown strength Eth.
16
Tab. 4: Data used for calculation of the theoretical breakdown strength Eth.
ρ
[kg/m3]
εr
[-]
Ecoh
[eV]
Eth
[kV/mm]
Al2O3 3980 [1] 7 31.76 [5] 31048
TiO2 4060 [1] 109 19.9 [6] 7105
SrTiO3 5130 [2] 138 [3] 31.7 [7] 5911
BaTiO3 6020 [2] 800 [4] 31.57 [8] 2354 [1] (Hellweg K., Hellweg A., 1975) [2] (Hellweg K., Hellweg A., 1981) [3] (Baumert et al., 1997) [4] (Scott et al. 1994) [5] (Urusov V.S., Eremin N. N., 1997) [6] (Lazzeri, M., et al. 2001) [7] (Ricci et al. 2003) [8] (Erhart and Albe 2007)
3.4. Breakdown toughness and transition-thickness
Recently Schneider (2013) developed a theoretical breakdown model based on the assumption
that out of a surface distribution of tiny, conducting filaments the longest will grow, when the
dielectric breakdown strength Ebd is reached. This model is similar to the treatment of
electrically conducting cracks in dielectrics and ferroelectrics (McMeeking 1990, Pak 1990,
Heyer et al. 1998, Wang and Zhang 2001, Zhang and Gao 2004, Gehrig et al. 2008). The
difference to existing models for conducting cracks and the 1D tubular breakdown models
(Suo 1993, Beom and Kim 2008, Lin et al. 2009) is that space charge conductivity is
introduced. Talbi et al. (2007) showed very nicely for alumina samples that dielectric
breakdown occurs in the space charge regime, which is confirmed by our own unpublished
results. Therefore, the Griffith type energy release rate model by Schneider (2013) includes
space charge injection. It gives an expression for the extrinsic dielectric breakdown strength:
bdr
bdbd
ad
G
cE
11
5
61
0 (8)
with Gbd as dielectric breakdown toughness, εr as relative permittivity of the dielectric and εo
as permittivity of free space, d as sample thickness, abd the conducting filament-length and
17
15.0c . Eq. (8) predicts the measured thickness- and permittivity-dependence (see
Figs. 4 - 6) in the extrinsic regime correctly and gives confidence that its physical
assumptions are correct. It is based on the idea of a critical energy release rate or dielectric
breakdown toughness Gbd necessary to initiate the unstable growth of the longest conducting
filament in the sample surface. This dielectric breakdown toughness can be expressed as
(Schneider 2013)
20
2
65
bdbdrbd dEac
G (9)
The transition from the extrinsic to the intrinsic breakdown regime offers the possibility to
determine the dielectric breakdown toughness. With the assumption of tiny, tubular
conducting filaments it can be concluded that these filaments are typically shorter than the
transition-thickness that means < 20 µm for ceramics and < 100 µm for polymers. Secondly if
the filaments are tiny channels, their diameter should be at least 10 times smaller. As the
transition-thickness is an upper estimate for the conducting filament-length, abd is
approximated by dt/5 at
Ebd = Emax.
Hence, the breakdown toughness can be calculated as:
2max
20
2
6Ed
cG trbd
(10)
For the calculation of the breakdown toughness a transition-thickness dt between 1–20 µm for
BaTiO3, TiO2 and Al2O3 is used. The relative permittivities εr are taken from the sample
characterization (Table 2), whereas the maximum breakdown strength Emax is evaluated as
mean value in the thickness range < dt from Fig. 4 with 804 kV/mm for Al2O3, 270 kV/mm
for TiO2 and 97 kV/mm for BaTiO3. Applying Eq. 10, the breakdown toughness Gbd is
calculated to be 3 - 1259 µJ/m for Al2O3, 6 - 2210 µJ/m for TiO2 and 11 - 4217 µJ/m for
BaTiO3. The large intervals of the Gbd-values stem from the great uncertainty in dt, which is
squarely included. For polymer samples the data bases for PVC and PE samples is not
sufficient for further calculation, therefore, only PMMA and PS were used to calculate the
breakdown toughness Gbd. Here, a transition-thickness dt between 10 - 100 µm is used for the
calculation. The relative permittivity for PMMA and PS are taken from literature (Table 5),
whereas the maximum breakdown strength Emax is evaluated as mean value in the thickness
range < 10 µm from Fig. 5 with 311 kV/mm for PMMA and 407 kV/mm for PS. Applying
Eq. 10, the breakdown toughness Gbd is calculated to be 18 - 1749 µJ/m for PMMA and 29 -
18
2880 µJ/m for PS. These breakdown toughness values for the ceramics and polymers are first
estimations as the transition-thickness dt is not determined very precisely.
The permittivities enter linearly in the 1D-toughness calculation (Eq. 10) but also in the
toughness calculation given by Lin et al. (2009). Therefore, as BaTiO3 and PZT have similar
permittivities, we compare the 1D-toughness results for these two ceramics once determined
in this study and by Lin et al. (2009). For the PZT ceramic PZT807 Lin et al. (2009)
determine a value of 0.01-0.03 J/m which is a factor of 3 beyond the upper limit of our
estimate for BaTiO3 (0.004 J/m). In regard to the uncertainty of the transition-thickness as
well as the estimate of the filament-length from the transition-thickness, this difference is
acceptable. Additional experiments also with well-defined starter filaments are needed to
determine the 1D-breakdown toughness more precisely.
Fu et al. (2000), Wang and Zhang (2001) determined a 2D-breakdown toughness for PZT
ceramics. They showed that independent of the initial notch length a 2D-breakdown
toughness of 223 J/m2 can be determined for unpoled PZT-4-ceramics. This value is approx.
25 times larger than the measured mechanical toughness of this material. As this dielectric
toughness is a 2D-toughness, it is difficult to compare it with a 1D-toughness.
3.5 Calculation of breakdown channel radius rbd
The dielectric breakdown toughness Gbd is interpreted as the energy required for the initiation
and growth of the breakdown channel by evaporating the material. An evaporation process
due to heating is assumed because investigations of the breakdown channel show tubular
holes with melted borders (Chao et al. 2010, Neusel et al. 2012, and Tunkasiri and
Rujijanagul 1996). The breakdown channel is approximated as a cylindrical tube with
constant radius rbd. The thermal energy per channel length Q/a, which is required to create the
breakdown channel, is calculated for the ceramic materials as follows
mol
Acohbd M
NEr
a
Q 2 (11a)
with Ecoh the cohesive energy, Mmol the molar mass of the compound, NA the Avogadro
constant and ρ the density of the material. For the amorphous polymers it is used
02 TTcr
a
Qdecpbd (11b)
with ρ the density of the material, cp the specific heat capacity, Tdec and To as decomposition
and room temperature.
19
If the thermal energy per channel length Q/a is set to be equal to the breakdown toughness Gbd,
the radius of the breakdown channel rbd can be determined as
cohA
molbdbd EN
MGr
(12a)
for the ceramics and for the polymers:
0TTc
Gr
decp
bdbd
(12b).
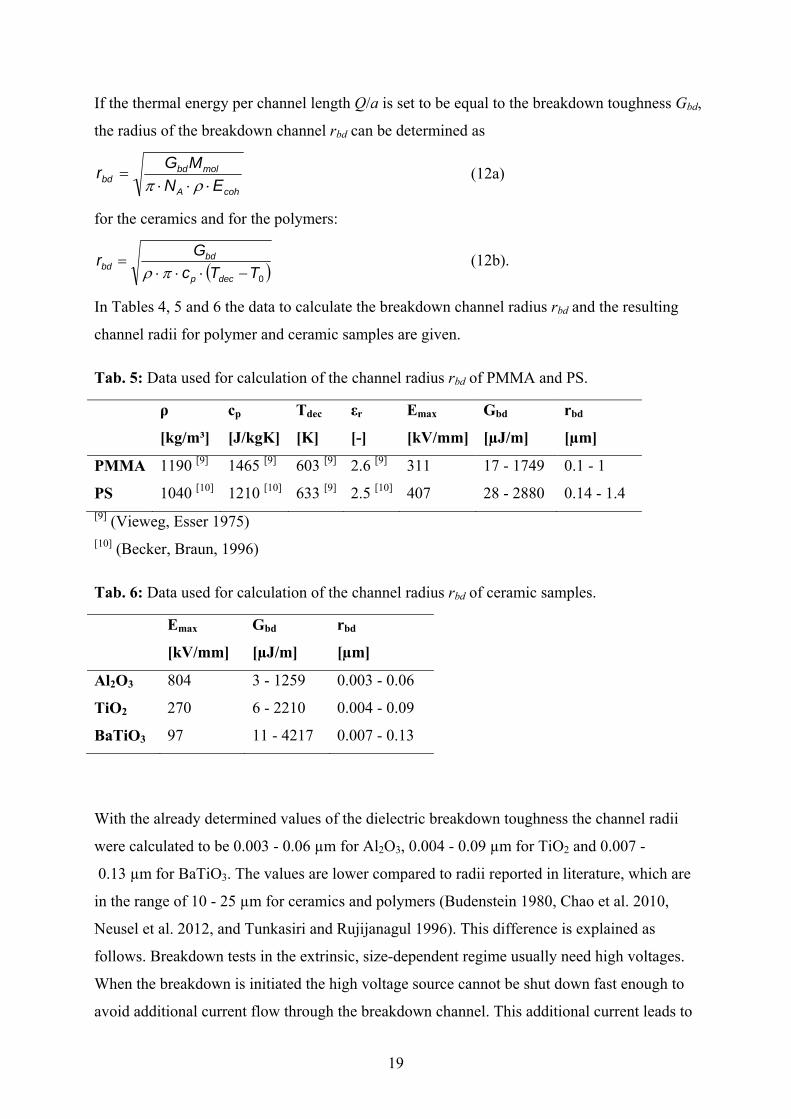
In Tables 4, 5 and 6 the data to calculate the breakdown channel radius rbd and the resulting
channel radii for polymer and ceramic samples are given.
Tab. 5: Data used for calculation of the channel radius rbd of PMMA and PS.
ρ
[kg/m³]
cp
[J/kgK]
Tdec
[K]
εr
[-]
Emax
[kV/mm]
Gbd
[µJ/m]
rbd
[µm]
PMMA 1190 [9] 1465 [9] 603 [9] 2.6 [9] 311 17 - 1749 0.1 - 1
PS 1040 [10] 1210 [10] 633 [9] 2.5 [10] 407 28 - 2880 0.14 - 1.4 [9] (Vieweg, Esser 1975) [10] (Becker, Braun, 1996)
Tab. 6: Data used for calculation of the channel radius rbd of ceramic samples.
Emax
[kV/mm]
Gbd
[µJ/m]
rbd
[µm]
Al2O3 804 3 - 1259 0.003 - 0.06
TiO2 270 6 - 2210 0.004 - 0.09
BaTiO3 97 11 - 4217 0.007 - 0.13
With the already determined values of the dielectric breakdown toughness the channel radii
were calculated to be 0.003 - 0.06 µm for Al2O3, 0.004 - 0.09 µm for TiO2 and 0.007 -
0.13 µm for BaTiO3. The values are lower compared to radii reported in literature, which are
in the range of 10 - 25 µm for ceramics and polymers (Budenstein 1980, Chao et al. 2010,
Neusel et al. 2012, and Tunkasiri and Rujijanagul 1996). This difference is explained as
follows. Breakdown tests in the extrinsic, size-dependent regime usually need high voltages.
When the breakdown is initiated the high voltage source cannot be shut down fast enough to
avoid additional current flow through the breakdown channel. This additional current leads to
20
additional evaporation and melting and results in a bigger channel radius than at the initial
breakdown. In addition, dissipating processes nearby the channel are not taken into account.
The radii for the polymer samples are calculated as 0.1 - 1 µm for PMMA and PS. According
to Fothergill (1991), who calculated the filament-radius of PE to be 0.29µm, this is
comparable to the dimensions of the gross morphology of polymer films.
3.6 Master curve of dielectric breakdown strength for ceramic materials
With the assumption that the length of the conducting filament is independent of the sample
thickness d it follows by introducing Eq. (10) in Eq. (8)
d
dEE t
bd max (13).
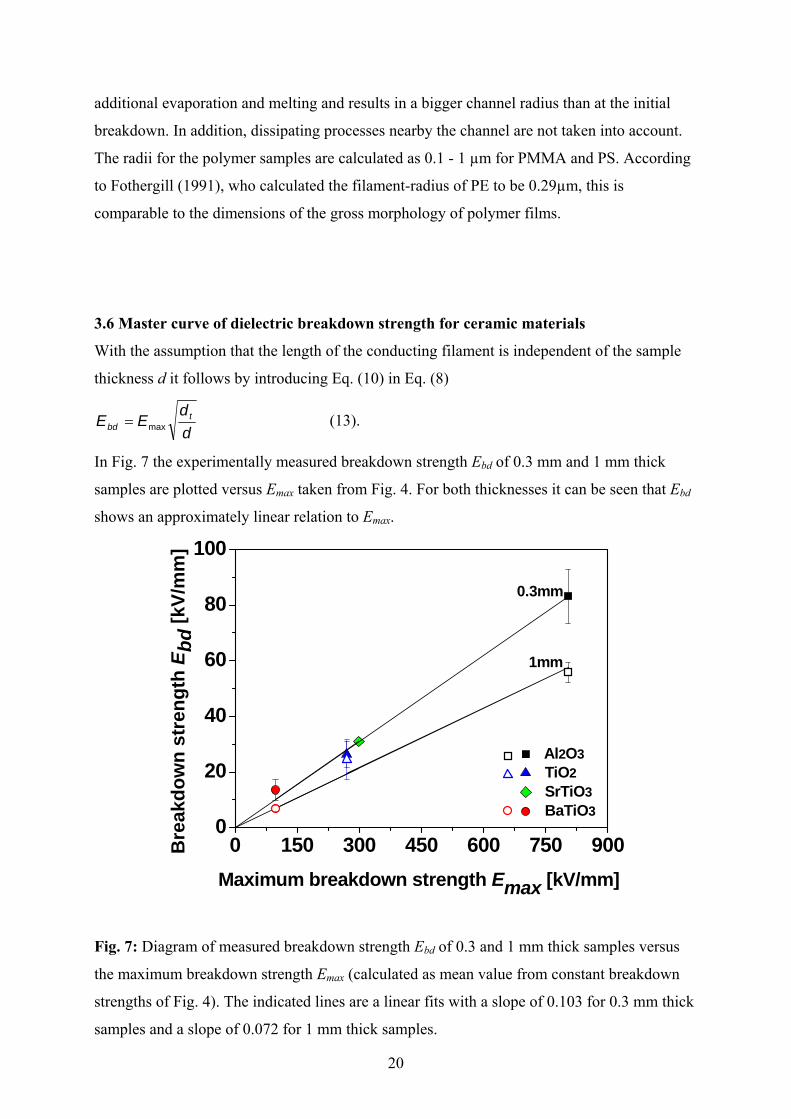
In Fig. 7 the experimentally measured breakdown strength Ebd of 0.3 mm and 1 mm thick
samples are plotted versus Emax taken from Fig. 4. For both thicknesses it can be seen that Ebd
shows an approximately linear relation to Emax.
0 150 300 450 600 750 9000
20
40
60
80
100
Al2O3
TiO2
SrTiO3
BaTiO3
1mm
0.3mm
Bre
akd
ow
n s
tren
gth
Eb
d [
kV/m
m]
Maximum breakdown strength Emax [kV/mm]
Fig. 7: Diagram of measured breakdown strength Ebd of 0.3 and 1 mm thick samples versus
the maximum breakdown strength Emax (calculated as mean value from constant breakdown
strengths of Fig. 4). The indicated lines are a linear fits with a slope of 0.103 for 0.3 mm thick
samples and a slope of 0.072 for 1 mm thick samples.
21
Hence, it follows that dt must be more or less constant for different ceramic materials. From
the linear fits of Fig. 7 dt is calculated to be 3 µm for the 0.3 mm thick samples and 5 µm for
the 1 mm thick samples. The mean value of the calculated thicknesses 4 µm can be
interpreted as a mean value of the transition-thickness range from Fig. 4. If this result is
generally true, Fig. 7 can be used as a master curve to easily determine the maximum
breakdown strength of thin films from bulk measurements or vice versa.
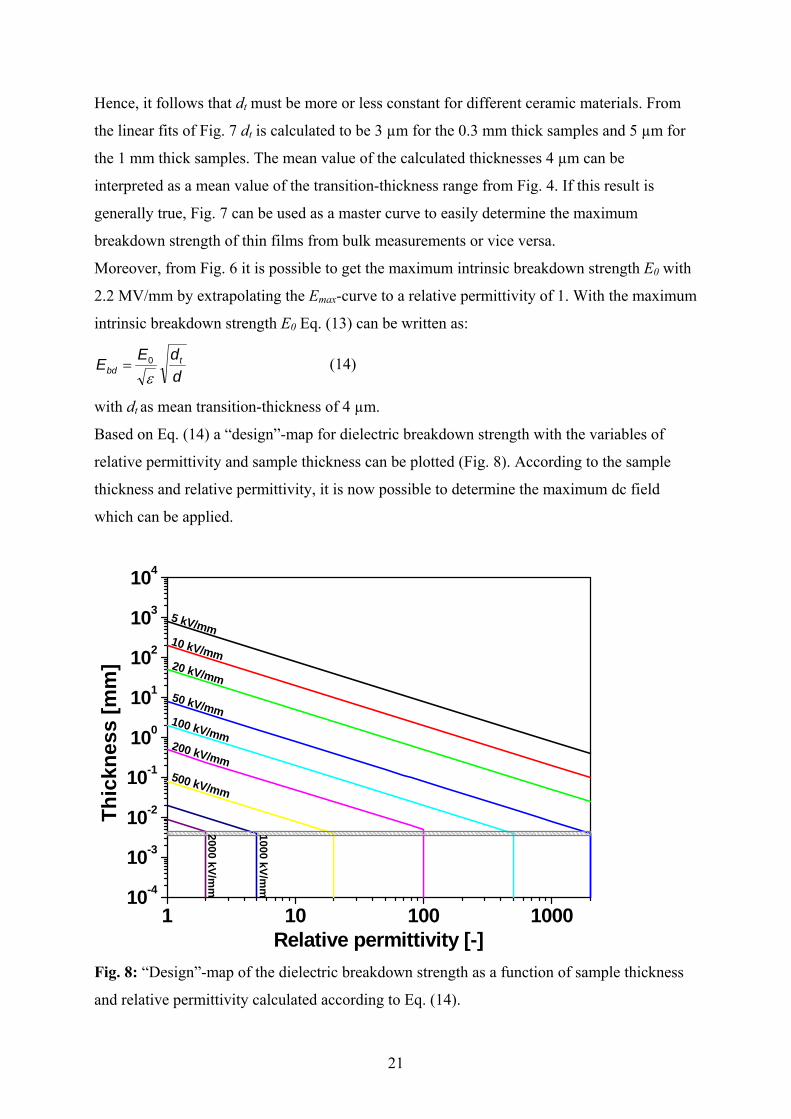
Moreover, from Fig. 6 it is possible to get the maximum intrinsic breakdown strength E0 with
2.2 MV/mm by extrapolating the Emax-curve to a relative permittivity of 1. With the maximum
intrinsic breakdown strength E0 Eq. (13) can be written as:
d
dEE t
bd 0 (14)
with dt as mean transition-thickness of 4 µm.
Based on Eq. (14) a “design”-map for dielectric breakdown strength with the variables of
relative permittivity and sample thickness can be plotted (Fig. 8). According to the sample
thickness and relative permittivity, it is now possible to determine the maximum dc field
which can be applied.
1 10 100 100010-4
10-3
10-2
10-1
100
101
102
103
104
500 kV/mm
200 kV/mm
100 kV/mm
50 kV/mm
20 kV/mm
10 kV/mm
Th
ickn
ess
[mm
]
Relative permittivity [-]
5 kV/mm
2000 kV/m
m
1000 kV/m
m
Fig. 8: “Design”-map of the dielectric breakdown strength as a function of sample thickness
and relative permittivity calculated according to Eq. (14).
22
4. Conclusions
The thickness-dependence of the extrinsic dielectric breakdown strength scales as d
1 down
to the micrometer scale. Below a materials dependent transition-thickness a roughly
thickness-independent intrinsic dielectric breakdown regime exists. The investigations
demonstrate that the r
1-dependence of the dielectric breakdown strength for ceramic
materials is thickness-independent. All these results strongly support the idea that in the
extrinsic breakdown regime conducting surface-filaments exist, which initiate breakdown.
Therefore, future research should be directed towards a validation of an energy release rate
based breakdown model and the experimental determination of the dielectric breakdown
toughness Gbd by introducing tiny, conducting filaments. This would allow characterising the
dielectric breakdown behaviour not only in terms of the breakdown strength but also in terms
of the dielectric breakdown toughness. Finally the physical nature of the initial conducting
filaments must be determined in order to be able to tailor the chemistry and microstructure of
dielectric materials for better dielectric breakdown resistance. All these investigations open
new space for a novel “dielectric breakdown electrics” research area.

23
Acknowledgements
The authors gratefully acknowledge financial support by the German Research Foundation
(DFG) under Project number SCHN-372/17-1. We thank Dieter Schmidt and Hans Jelitto for
their assistance during ac breakdown measurements. We thank Manfred Eich allowing us to
use their clean room and spin-coating equipment and Zied Fahem for his advices concerning
the polymer thin-film preparation.
24
References
Baumert, B. A., Chang L.-H., Matsuda A. T., Tsai T.-L., Tracy C. J., Gregory R. B., Fejes P. L.,
Cave N. G., Chenet W., 1997. Characterization of sputtered barium strontium titanate and
strontium titanate-thin films. J. Appl. Phys. 82, 2558-2566.
Becker, G.W., Braun, D., 1996. Kunststoff-Handbuch 4., Hanser Verlag, München.
Beom, H. G., Kim, Y. H., 2008. Application of J integral to breakdown analysis of a dielectric
material. Int. J. Solids Struct. 45, 6045–6055.
Brehmer L., Eberhardt M., Konietzko K. D., Böhm J., Röhr L., Lerch C., Winkler H., 1983.
Elektrische Eigenschaften polymerer Festkörper–Physikalische Grundlagen und technische
Anwendungen. Teil II. Polymere Isolatoren und Dielektrika. Acta Polym. 34, 287–298.
Budenstein P. P., 1980. On the mechanism of dielectric breakdown of solids. IEEE Trans. Electr.
Insul. EI-15, 225-240.
Campbell, S. A., Gilmer D. C., Wang X.-C., Hsieh M.-T., Kim H.-S., Gladfelter W. L., Yan J.,
1997. MOSFET transistors fabricated with high permittivity TiO2 dielectrics. IEEE Trans.
Electron Devices 44, 104-108.
Castro, P., Buchenauer, C.J., Gaudet, J., Schamiloglu, E., 2005. Studies of dielectric breakdown
under pulsed power conditions. IEEE Pulsed Power Conference. pp. 978-981.
Chao, S., Petrovsky, V., Dogan, F., 2010. Effects of sintering temperature on the microstructure
and dielectric properties of titanium dioxide ceramics. J. Mater. Sci. 45, 6685-6693.
Chin, A., Wu, Y.H., Chen, S.B., Liao, C.C., Chen, W.J., 2000. High quality La2O3 and Al2O3
gate dielectrics with equivalent oxide thickness 5-10 Å. Symposium on VLSI Technology.
Digest of Technical Papers.
De Wit H.J., Crevecoeur C., 1974. The dielectric breakdown of anodic aluminum oxide. Phys.
Lett. 50 A, 365-366.
Dissado, L. A., Fothergill J. C., 1992. Electrical degradation and breakdown in polymers, part 2.
Peter Peregrinus Ltd., London, pp.69-74.
Erhart, P., Albe, K., 2007. Thermodynamics of mono- and di-vacancies in barium titanate.
J. Appl. Phys. 102, 0841111-0841118.
Fock, V., 1927. Zur Wärmetheorie des elektrischen Durchschlags. Archiv f. Elek. 19, 71-81.
Fothergill, J. C., 1991. Filamentary electromechanical breakdown. IEEE Transactions on
Electrical Insulation. 26, 1124-1129.
Fröhlich, H. 1939. Dielectric breakdown in solids. Rep. Prog. Phys. 6, 411-430.
Fu, R., Qian, C.-F., Zhang, T.-Y., 2000. Electrical fracture toughness for conductive cracks
driven by electric fields in piezoelectric materials. Appl. Phys. Lett. 76, 126-128.
25
Gao, H., Ji, B., Jäger I. L., Arzt E., Fratzl P., 2003. Materials become insensitive to flaws at
nanoscale: lessons from nature. PNAS 100:10, 5597–5600.
Gehrig, F., Jelitto, H., Schneider G.A., 2008. Fracture criterion for a conducting crack in poled
PZT-PIC 151 investigated by stable crack growth. Acta Mater. 56, 222–229.
Hellwege, K.-H., Hellwege A.M., 1975. Landolt-Börnstein, Crystal structure data of inorganic
compounds. 7 b, Springer Verlag, Berlin.
Hellwege, K.-H., Hellwege, A.M., 1981. Landolt-Börnstein, Ferroelectrics and related systems.
16, Springer Verlag, Berlin.
Heyer, V., Schneider, G.A., Balke, H., Drescher, J., Bahr, H.-A., 1998. A fracture criterion for
conducting cracks in homogeneously poled piezoelectric PZT-PIC 151 ceramics. Acta Mater. 46,
6615-6622.
Ieda, M., Nagao, M., Hikita, M., 1994. High-field conduction and breakdown in insulating
polymers. Present situation and future prospects. IEEE Trans. Dielectr. Electr. Insul. 1, 934-945.
Joffé, A. F., 1927. Mechanical and electrical strength and cohesion. Trans. Faraday Soc. 24, 65-
72.
Jow, J.R., Cygan, P.J., 1993.Dielectric breakdown of polyvinylidene fluoride and its
comparisons with other polymers. J. Appl. Phys. 73, 5147-5151.
Kim, H.-S., Gilmer, D. C., Campbell, S. A., Polla, D. L., 1996. Leakage current and electrical
breakdown in metal-organic chemical vapor deposited TiO2 dielectrics on silicon substrates.
Appl. Phys. Lett. 69, 3860-3862.
Klein, N., Gafni, H., 1966. The maximum dielectric strength of thin silicon oxide films. IEEE
Trans. Electron. Devices.13, 281-289.
Kolodzey, J., Chowdhury E. A., Thomas A. N., Qui G, Rau I., Olowolafe J. O., Suehle J. S.,
Chen Y., 2000. Electrical conduction and dielectric breakdown in aluminum oxide insulators on
silicon. IEEE Trans. Electron Devices 47, 121-128.
Lazzeri, M., Vittadini, A., Selloni, A., 2001. Structure and energetics of stoichiometric TiO2
anatase surfaces. Phys. Rev. B. 63, 155409, 1-9.
Li, W.-T., McKenzie, D. R., McFall, W. D., Zhang, Q.-C., Wiszniewski, W., 2000. Breakdown
mechanism of Al2O3 based metal-to-metal antifuses. Solid-State Electron. 44, 1557-1562.
Lin, S., Beom, H. G., Tao, D., Kim, Y. H., 2009. Dielectric breakdown of an unpoled
piezoelectric material with a conductive channel. Fatigue Fract. Eng. Mater. Struct. 32, 580-586.
Lee, B.H., Jeon Y., Zawadzki K., Qi W.-J., Lee J., 1999. Effects of interfacial layer growth on
the electrical characteristics on thin titanium oxide films on silicon. Appl. Phys. Lett. 74, 3143-
3145.
26
Malec, D., Bley, V., Talbi, F., Lalam, F., 2010. Contribution to the understanding of the
relationship between mechanical and dielectric strength of alumina. J. Eur. Ceram. Soc. 30,
3117-3123.
McMeeking, R. M., 1986. On mechanical stresses at cracks in dielectrics with supplication to
dielectric breakdown. J. Appl. Phys. 62, 3116-3122.
McMeeking, R. M., 1990. A J-integral for the analysis of electrically induced mechanical stress
at cracks in elastic dielectrics. Int. J. Eng. Sci. 28, 605-613.
McPherson, J., Kim, J., Shanware, A., Mogul, H., Rodriguez, J., 2002. Proposed universal
relationship between dielectric breakdown and dielectric constant. International Electron Devices
Meeting. IEDM '02, pp. 633-636.
Milliken, A.D., Bell, A.J., Scott, J.F., 2007. Dependence of breakdown field on dielectric
(interelectrode) thickness in base-metal electrode multilayer capacitors. Appl. Phys. Lett. 90,
112910-112913.
Miyairi, K., Itoh, E., 2004. AC electrical breakdown and conduction in PMMA thin films and the
influence of LiClO4 as an ionic impurity. Proc. ICSD 1, 99-102.
Moon, P. H., 1931. The theory of thermal breakdown of solid dielectrics. In: Proceedings of the
North Eastern District Meeting of the A.I.E.E. pp. 1008-1021.
Munz, D., Fett, T., 2001. Ceramics mechanical properties, failure behavior, materials section. In:
Hull, R., Osgood Jr., R. M., Sakaki, H., Zunger, A. editors, Springer Series in Material Science
36. Springer-Verlag Berlin.
Nagao, M., Kosaki, M., Mizuno, Y., 1992. On temperature dependence of electric strengths of
polar polymeric films in low-temperature region. Sixth International Conference on Dielectric
Materials, Measurements and Applications. pp. 85-88.
Nafría, M., Suñé, J., Aymerich, X., 1996. Breakdown of thin gate silicon dioxide films—A
review. Microelectronics Reliability. 36, 871-905.
Neusel, C., Jelitto, H., Schmidt, D., Janssen, R., Felten, F., Schneider, G.A., 2012. Dielectric
breakdown of alumina single crystals. J. Eur. Ceram. Soc. 32, 1053-1057.
Oakes, W.G., 1948. The intrinsic electric strength of polythene and its variation with
temperature. J. Inst. Electr. Eng. Part I: Gen., 95, 36-44.
O’Dwyer, J.J., 1958. Dielectric breakdown in solids. Adv. Phys. 7, 349-394.
O’Dwyer, J.J., 1967. The theory of avalanche breakdown in solid dielectrics. J. Phys. Chem.
Solids 28, 1137-1144.
O’Dwyer, J.J., 1982. Breakdown in solid dielectrics. IEEE Trans. Electr. Insul. EI-17, 484-487.
Orowan, E., 1949. Fracture and strength of solids. Rep. Prog. Phys. 12, 183-232.
27
Owate, I.O., Freer, R., 1988. The dielectric breakdown of alpha alumina ceramic at room
temperature. Sci. Ceram. 14, 1013-1018.
Owate, I.O., Freer, R., 1989. The ac electrical breakdown of some aluminum nitride ceramics.
Silic. Ind. 7-8, 123-127.
Owate, I.O., Freer, R., 1990. The electrical properties of some cordierite glass ceramics in the
system MgO-Al2O3–SiO2–TiO2. J. Mater. Sci. 25, 5291-5297.
Owate, I.O., Freer, R., 1991. Solidification structures on alumina ceramics and cordierite glass-
ceramics after dielectric breakdown. Proc. Brit. Ceram. Soc. 48, 25-34.
Owate, I. O., Freer, R., 1992. Dielectric breakdown of ceramics and glass ceramics. Sixth
International Conference on Dielectric Materials, Measurements and Applications. pp. 443-446.
Pak, Y. E., 1990. Crack extension force in a piezoelectric material. J. Appl. Mech. 57, 647-653.
Park, D.-G., Cho, H.-J., Lim, K.-Y., Lim, C., Yeo, I.-S., Roh, J.-S., Park, J. W., 2001.
Characteristics of n+ polycrystalline-Si/Al2O3/Si metal-oxide-semiconductor structures prepared
by atomic layer chemical vapor deposition using Al(CH3)3 and H2O vapor. J. Appl. Phys. 89,
6275-6280.
Polanyi, M., 1921. Über die Natur des Zerreißvorgangs. Z. Phys. 7, 323-327.
Ricci, D., Bano, G., Pacchioni, G., 2003. Electronic structure of a neutral oxygen vacancy in
SrTiO3. Phys. Rev. B. 68, 224105.
Ruemenapp, T., Peier, D., 1999. Dielectric breakdown in aluminum nitride. High Voltage
Engineering Symposium, 467, 22-27.
Schneider, G.A., 2013. A Griffith type energy release rate model for dielectric breakdown under
space charge limited conductivity. J. Mech. Phys. Solids. 61, 78–90.
Scott, J.F., Azuma M., Paz de Araujo C. A., McMillan L. D., Scott M. C., Roberts T., 1994.
Dielectric breakdown in high-ε films for ULSI DRAMs: II. Barium-strontium titanate ceramics.
Integ. Ferroelec. 4, 61-84.
Stark, K. H., Garton, C. G., 1955. Electric strength of irradiated polythene. Nature. 176, 1225-
1266.
Sun, Y., Boggs, S. A., Ramprasad, R., 2012. The intrinsic electrical breakdown strength of
insulators from first principles. Appl. Phys. Lett. 101, 132906.
Sun, Y., Bealing, C., Boggs, S., Ramprasad, R., 2013. 50+ years of intrinsic breakdown. IEEE
Electr. Insul. Mag. 29, 8-15.
Suo, Z., 1993. Models for breakdown-resistant dielectric and ferroelectric ceramics. J. Mech.
Phys. Solids. 41, 1155-1176.
28
Talbi, F., Lalm, F., Malec, D., 2007. DC conduction of Al2O3 under high electric field. J. Phys.
D: Appl. Phys. 40, 3803–3806.
Tunkasiri, T., Rujijanagul, G., 1996. Dielectric strength of fine grained barium titanate ceramics.
J. Mater. Sci. Lett. 15, 1767-1769.
Urusov, V.S., Eremin, N. N., 1997. Charge–transfer energy in computer modeling of structure
and properties of minerals. Phys. Chem. Miner. 24, 374-383.
Vieweg, R., Esser, F., 1975. Kunststoff-Handbuch. 9, Hanser Verlag, München.
Vojta, A., Clarke, D.R., 1998. Electric field singularity at an electrode tip in a nonlinear
electrical conductor. J. Appl. Phys. 83, 5632–5635.
von Hippel, A., 1931a. Der Mechanismus des elektrischen Durchschlags in festen Isolatoren I. Z.
Phys. 67, 707-724.
von Hippel, A., 1931b. Der Mechanismus des elektrischen Durchschlags in festen Isolatoren II.
Z. Phys. 68, 309-324.
von Hippel, A., 1932. Der Mechanismus des elektrischen Durchschlags in festen Isolatoren III.
Z. Phys. 75, 145-170.
Wagner, K. W., 1948. Der elektrische Durchschlag von festen Isolatoren. Archiv f. Elek. 39,
215-233.
Wang, T., Zhang, T.-Y., 2001. Electrical fracture toughness for electrically conductive deep
notches driven by electric fields in depoled lead zirconate titanate ceramics. Appl. Phys. Lett. 79,
4198-4200.
Zeller, H. R., Schneider, W. R., 1984. Electrofracture mechanics of dielectric aging. J. Appl.
Phys. 56, 455-459.
Zhang, T.Y., Gao, C.F., 2004. Fracture behaviors of piezoelectric materials. Theor. Appl. Fract.
Mech. 41, 339-379.