Dielectric Constant and Breakdown Strength of Polymer...
22
1 Dielectric Constant and Breakdown Strength of Polymer Composites with High Aspect Ratio Fillers Studied by Finite Element Models Zepu Wang a , J. Keith Nelson b , Henrik Hillborg c , Su Zhao c , Linda S. Schadler a a Department of Material Science and Engineering Rensselaer Polytechnic Institute Troy, NY 12180 USA b Department of Electrical, Computer and Systems Engineering Rensselaer Polytechnic Institute Troy, NY 12180 USA c ABB AB, Corporate Research, Power Technology Västerås, SE-721 78 Sweden Abstract A finite element model was used to study the dielectric constant and breakdown strength of polymer composite filled with high aspect ratio fillers. The impact of composite microstructure and filler aspect ratio on the dielectric properties was investigated. The results were used to explain the experimental data for BaTiO 3 fiber filled poly(dimethyl siloxane) published previously. The effect of filler shape, aspect ratio distribution, curvature, grain boundary and alignment on the composite permittivity was studied. A model was proposed to correlate the composite microstructure, the electric field distribution in the polymer matrix, and the dielectric breakdown strength of composites. Keywords A. Polymer-matrix composites (PMCs) B. Electrical properties C. Finite element analysis (FEA) C. Modelling
Transcript of Dielectric Constant and Breakdown Strength of Polymer...

1
Dielectric Constant and Breakdown Strength of Polymer Composites with
High Aspect Ratio Fillers Studied by Finite Element Models
Zepu Wanga, J. Keith Nelson
b, Henrik Hillborg
c, Su Zhao
c, Linda S. Schadler
a
aDepartment of Material Science and Engineering
Rensselaer Polytechnic Institute
Troy, NY 12180 USA
bDepartment of Electrical, Computer and Systems Engineering
Rensselaer Polytechnic Institute
Troy, NY 12180 USA
cABB AB, Corporate Research, Power Technology
Västerås, SE-721 78 Sweden
Abstract
A finite element model was used to study the dielectric constant and breakdown
strength of polymer composite filled with high aspect ratio fillers. The impact of composite
microstructure and filler aspect ratio on the dielectric properties was investigated. The
results were used to explain the experimental data for BaTiO3 fiber filled poly(dimethyl
siloxane) published previously. The effect of filler shape, aspect ratio distribution,
curvature, grain boundary and alignment on the composite permittivity was studied. A
model was proposed to correlate the composite microstructure, the electric field distribution
in the polymer matrix, and the dielectric breakdown strength of composites.
Keywords
A. Polymer-matrix composites (PMCs)
B. Electrical properties
C. Finite element analysis (FEA)
C. Modelling

2
1. Introduction
Ferroelectric ceramic particles with high dielectric constant are widely used to increase
the dielectric constant of polymer composites for energy storage applications. However,
according to the rule of mixtures, the increase in composite permittivity is small for
spherical fillers especially at low volume fractions. The permittivity of composites with
high aspect ratio (AR) fillers increases more rapidly with loading [1]. Recently, traditional
inorganic materials have become available in high AR forms [2–6]. Some of those new
materials have a high dielectric constant, and can be processed with controlled geometry.
Analytical models based on effective medium theory (such as the rule of mixtures) can
be used to predict composite permittivity [1]. The analytical models are accurate when the
filler volume fraction is low, but do not consider filler-filler interaction and filler
dispersion. Numerical approaches such as finite element analysis and finite difference
methods can be used to predict the electric field and permittivity based on the properties of
individual phases and the detailed composite microstructure. Some early work using 2-
dimensional periodic models found reasonable agreement for the effective permittivity
between the two approaches [7–9]. 3-dimendisonal finite element (FE) and finite difference
(FD) simulations have been used to predict the effective permittivity of composites, and the
results were compared to experimental data [10–13]. The numerical simulations fit the
experimental data better because they include particle geometry, dispersion and
distribution. Only a few numerical modeling studies have focused on high AR fillers [14,
15] and simple geometries with a few fillers were used due to computing limitations.

3
In our previous work [16], polymer composites filled with electrospun BaTiO3 fibers
showed that the dielectric constant and breakdown strength depended on filler AR. The
results are summarized in Figure 3. The composite permittivity was below the Maxwell
Garnett (MG) rule of mixtures prediction [17] for high AR fillers, while the composites
with low AR fillers matched the prediction. The MG equation is supposed to be accurate at
the low filler volume fraction, 0.2, used in the study. However, there are several differences
between the model and the real composite as listed below.
Ellipsoidal fillers are considered in the rule of mixtures and the real fibers have a rod-
like or capsule-like shape.
The distribution in fiber AR may affect the dielectric constant.
There were grain boundaries in the BaTiO3 fibers. These low dielectric constant grain
boundaries separate the high dielectric constant fiber into many lower AR segments,
which might lead to a reduction in the composite permittivity.
Real fibers have curvature which is not considered in the rule of mixtures. High AR
fillers have a larger tendency to bend in the composite.
Fiber alignment cannot be completely avoided in the compression molding process.
Filler alignment in the sample plane decreases the out-of-plane dielectric constant.
The five reasons stated above are potential explanations for the difference between the
MG model prediction and the experimental results. However, the impact of each proposed
mechanism is difficult to differentiate using experiments. In this work, FEA was performed
in both 2D and 3D models to examine the influence of each factor on the dielectric
constant. The goal is to evaluate the applicability of the MG rule of mixtures for composites

4
with high AR fillers, and the impact of composite microstructure on the effective
permittivity.
In addition, finite element simulations can provide a statistical view of the local
electric field distribution in the polymer. When high dielectric constant fillers are used, the
polymer matrix sustains most of the electric stress. The local enhanced field can be linked
to the electrical breakdown strength for a short term breakdown process. A statistical
analysis of the local field in the polymer was performed to obtain a comprehensive
understanding of the field enhancement by high permittivity fillers and its effect on the
composite breakdown strength.
2. Finite Element Analysis (FEA) Approach
The methodology for 3D simulations is presented. The 2D models followed a similar
approach. The FEA was performed using commercial software, COMSOL Multiphysics
and MATLAB. High AR fillers were represented by elongated capsules consisting of a
cylinder with two semi-spheres at the ends (Fig. 1a). The AR was calculated as the ratio of
the end-to-end length and the diameter of the cylinder. An AR of one reduces the geometry
to a spherical particle. To compare filler shapes, ellipsoidal fillers were also studied
because ellipsoids are considered in the rule of mixtures.
The composites were represented as cubes (Fig. 1d). To ensure random filler
orientation, the orientation parameters were pre-generated for each filler, following a
uniform distribution from a pseudorandom number generator. The fillers were then added
into the cube using Random Sequential Addition (RSA) to avoid overlapping of fillers.
While the position parameters followed a uniform distribution in the box, two parameters in

5
spherical coordinates, φ and θ, were used as the orientation parameters as shown in Fig. 1c.
To ensure a uniform distribution of filler orientation, the following equations were used,
where φ and t followed a uniform distribution over the designated range.
[ ] ( )
( ) ( )
[ ] ( )
To ensure a continuous electrical field and avoid edge effects, a 3D periodic geometry
was used to form an infinite composite material. In addition, periodic electric boundary
conditions were applied to the six faces of the cube. For the boundaries of the cube in the x
and y directions, the potential of any two corresponding points on the opposite boundary
were set to be the same, so the tangential electric field was continuous across the periodic
boundary. For the two boundary faces in the z direction where an electrical potential drop
was applied, a constant voltage difference was set to each of the corresponding points with
the same x and y coordinates. In this way, the potential drop along the z axis is continuous
and constant across every repeating unit, which is essentially equivalent to the situation of
an infinite size material immersed in an applied electric field. A 2D model filled with high
permittivity particles is shown in Fig. 1b for simplicity of illustration.
This work focuses on high dielectric constant fillers. The material properties used are
listed in Table 2. The field distribution and effective dielectric constant of composites is not
sensitive to filler permittivity once the permittivity contrast between filler and polymer is
large enough. For example, when the filler dielectric constant varies from 500 to 5000, the
composite dielectric constant (according to the rule of mixtures) increases from 5.28 to 5.47

6
in a composite with a filler AR of 5 and a filler volume fraction of 0.1. For this reason, the
permittivity of filler was set to 1000 to represent the BaTiO3 fiber even though the exact
permittivity of the prepared BaTiO3 fibers is unknown and different permittivity values
from 500 to 10000 have been reported in the literature [18, 19]. Moderate anisotropy was
observed with less than 50% variation in the dielectric constant along different crystal
orientations [20, 21]. Because the composite dielectric constant is not sensitive to this
magnitude of variation for the high dielectric constant fillers, an isotropic dielectric
constant was assigned to the BaTiO3 fibers for the simplicity of simulation. A loss factor of
0.01 was assigned to the filler [22]. Because the imaginary permittivity is 1/100 of the real
permittivity, the latter is the dominant factor causing the increase in the composite
permittivity.
The study was carried out in the frequency domain of the harmonic field condition.
The frequency of the applied ac field was set to 100 Hz. The effective permittivity of the
composites was calculated from the constitutive relation of the electric flux density D and
the electric field E [1], which is shown in Equation (4). < f > represents the spatial average
of a physical quantity over a certain volume.
⟨ ⟩ ⟨ ⟩ ( )
The composite permittivity was evaluated as a function of the number of fillers. It was
found that 100 fillers lead to a representative geometry while maintaining computational
simplicity. The electric field in the polymer matrix was sampled and plotted as a probability
distribution function of the local field relative to the applied field.

7
3. Result and discussion
3.1 Dielectric constant
3.1.1 FEA results compared with MG rule of mixtures – effect of filler shape
The applicability of the rule of mixtures to composites with high AR fillers was
examined. Fig. 2 shows a comparison between the FEA results and the MG rule of
mixtures. Since the rule of mixtures uses ellipsoidal fillers in the derivation and BaTiO3
fibers have a capsular shape, a comparison of filler shape was performed to confirm
whether the difference between experimental data and the rule of mixtures was from the
particular shape of the BaTiO3 fibers. The FEA results agree with the MG prediction at low
filler loading, and are slightly higher for the filler volume fraction above 0.1. The filler
shape does not affect the composite permittivity significantly given the same filler AR.
3.1.2 Effect of filler aspect ratio distribution
The MG rule of mixtures assumes the fillers have uniform AR. Although a precise
control of filler AR is desired in the processing of composites, a distribution of filler AR
exists and the effect on the composite dielectric constant is unknown. To investigate the
effect of filler AR distribution, the AR of fillers was generated following a normal
distribution in a 3D model. In this study, the average filler AR was set to 15 and a filler
volume fraction of 0.1 was used. The relative standard deviation of the normal distribution
was varied from 0 to 1. Any negative filler AR generated was excluded and any filler AR
larger than twice the average was also excluded to keep the distribution symmetric. The
results are shown in Fig. 3. A larger distribution of fiber AR increases the composite
permittivity at a given constant average AR. However, the increase in the composite

8
permittivity cannot explain the lower permittivity observed in the experiments.
3.1.3 Effect of grain boundary in the ferroelectric fillers
BaTiO3 grain/particle consists of a tetragonal core with high permittivity and a cubic
surface layer with low permittivity [23, 24], resulting in low dielectric constant regions at
the surface and grain boundaries of BaTiO3 as illustrated in Fig. 4a. The cubic phase at the
BaTiO3 surface does not have a strong influence on the composite permittivity because the
calculated volume fraction is 0.0014 of the filler volume, based on the reported cubic layer
thickness of 15nm [25] and a fiber diameter of around 800 nm. On the other hand, the cubic
phase at the grain boundary could change the composite permittivity since it separates the
fiber into several sections with lower AR as shown in Fig. 4b-c.
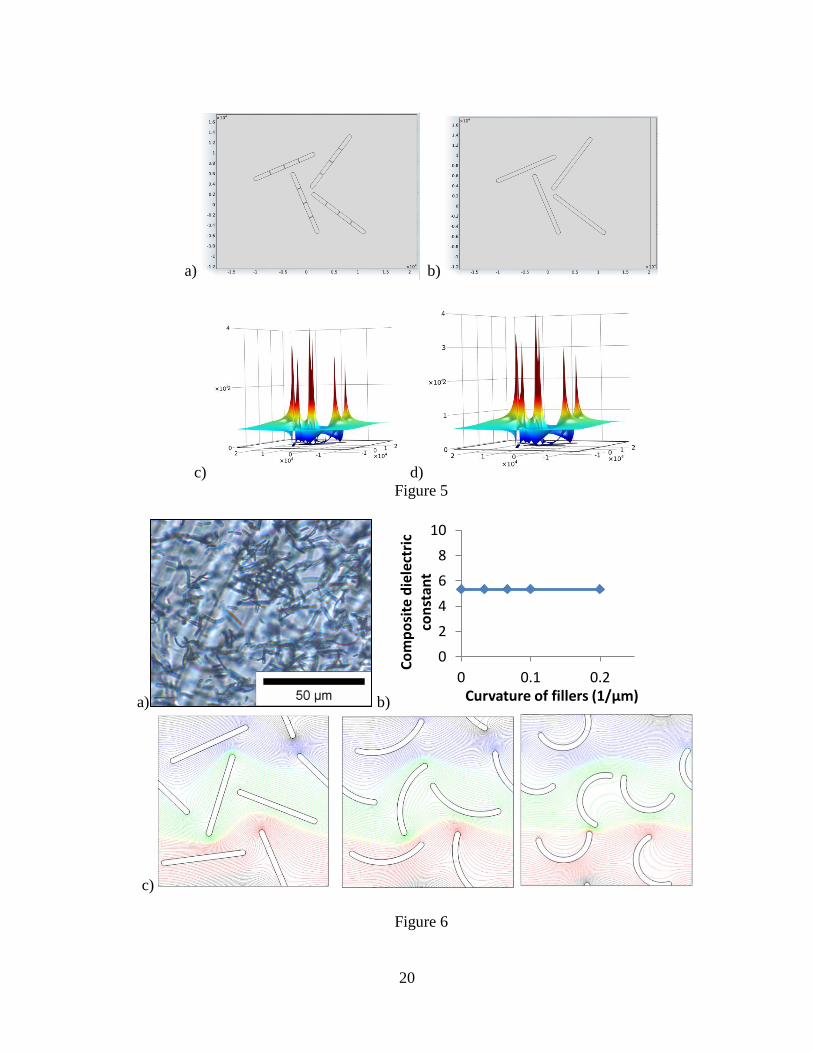
The effect of grain boundaries in the BaTiO3 fibers was studied by 2D FEA to evaluate
the field distribution around fillers. Fig. 5a-b shows the geometric arrangement of several
fibers without or with grain boundaries placed in an external electric field of 1 kV/mm. The
fiber length was 12 µm and the diameter was 0.8 µm according to experiment [16]. The
size of the low permittivity region around the grain boundary of BaTiO3 was set to 100 nm
and the dielectric constant of that region ranged from 10 – 500 according to the literature
[19, 23, 25–30]. Fig. 5c-d shows the height plot of the electric field strength with and
without the existence of grain boundaries. The area near the tip of the fiber is under higher,
while the polymer along the fiber sustains reduced stress. The field distribution was very
similar for the two conditions upon a close check of the field amplitude at around the
fillers. Varying the grain boundary permittivity from 10 to 500 caused no difference in the
field distribution. The "aligned low AR segments" are equivalent to high AR fillers in terms
of field distribution. Because a change in the composite effective permittivity

9
fundamentally comes from a change in the field distribution within the polymer, the
composite permittivity is not affected by the low permittivity grain boundaries.
3.1.4 Filler curvature
BaTiO3 fibers are curved in the composites. An optical microscopy image of the
BaTiO3 fiber composite is shown in Fig. 6a. Fibers with both large and small curvature can
be identified. A simple 2D FEA was conducted to analyze the effect of filler curvature on
the permittivity of composites. Several capsule-shaped fillers with an AR of 15 were
dispersed in the polymer with the composite structure shown in Fig. 6c. The filler volume
fraction was 0.1. To study the effect of filler curvature, the fillers were bent into arcs and
the filler curvature is defined as the reciprocal of the arc radius. The arc length and width
remained unchanged, as well as the position and orientation of the fillers.
The simulation result is shown in Fig. 6b. There is no change in the composite
permittivity as the filler curvature increases. Although the result is based on a simple 2D
simulation, the conclusion should be applicable to real composites. A qualitative
explanation is provided as the following without a rigorous derivation. In the rule of
mixtures, the effect of the high AR fillers is based on the reduction of the depolarization
factor in the "high AR direction" [1]. The existence of the filler curvature increases the
depolarization factor in the filler direction (average vector direction along the curved filler),
but reduces the depolarization factor in the orthogonal direction. The average contribution
of these two effects to the composites might be independent of filler curvature if the fillers
are randomly orientated in the composites. As a result, the effective permittivity is
independent of filler curvature for the composites with randomly orientated fillers. The
curvature of the BaTiO3 fibers, as shown in Fig. 6a, is smaller than the largest curvature

10
used in the FEA. Thus the difference between the rule of mixtures prediction and the
dielectric constant data does not come from filler curvature.
3.1.5 Filler alignment
Filler alignment creates an anisotropic dielectric constant. Alignment along the field
direction increases the measured composite permittivity, while alignment perpendicular to
the field direction reduces the permittivity. A comparison between the MG rule of mixtures
and the experimental data is shown in Fig. 7a. The experimental data lies between the
composites with randomly oriented fillers and fillers perfectly aligned perpendicular to the
field direction. The comparison suggests that the fibers have a certain degree of alignment
in the composites, if only the influence of filler alignment is considered.
To study the effect of fiber alignment in the compression molding process on the
composite dielectric constant, the fiber orientation was set to follow a distribution function.
The applied electric field is along the z-axis and the fibers are aligned in the xy-plane in the
FEA. The orientation parameter t was randomly generated following a normal distribution
with a mean value of 0 and a standard deviation ranging from 0 to infinity. Any value of t
that was out of the range, [-1, 1], was discarded. A standard deviation of 0 corresponds to
perfect alignment in the xy-plane, while a standard deviation of infinity corresponds to
completely random orientation. The composite dielectric constant is plotted as a function of
the standard deviation of t ranging from 0 to 1.4 as shown in Fig. 7b. Increasing the
standard deviation of t leads to a gradual transition in the composite permittivity from the
aligned condition to the randomly orientated condition. A further increase in the standard
deviation does not result in any significant increase in the composite dielectric constant. As
shown in Fig. 7b, a standard deviation of 0.45 matches the experimental data. This partial

11
alignment in the sample plane is likely from the compression molding process used to make
the composites.
3.2 Breakdown strength
3.2.1 Modeling of electric field statistics in composites
The probability distribution function of the local electric field in the polymer
normalized with respect to the applied electric field is plotted in Fig. 8a-b. The normalized
electric field (x-axis in Fig. 8) can also be called the field intensification factor. The peak
probability appears generally at a field that is slightly larger than the nominal applied
electric field. The results suggest that a large portion (larger than 50%) of the polymer
sustains intensified electric fields. The effect of filler AR is shown in Fig. 8a. Higher filler
AR results in a larger tail in the high field side of the distribution plot. The probability of
finding a local field that is larger than 3 times the applied field, calculated by integrating
the probability distribution function, is plotted in Fig. 8c. The probability increases from
0.003 to 0.055 when the filler AR increases from 1 to 15. Consequently, the breakdown
strength of the composite decreases because the breakdown is likely to initiate at those
highly stressed spots. Similarly, the effect of filler AR is shown in Fig. 8b and Fig. 8d. The
increase in filler volume fraction also broadens the probability distribution on the high
electric field side and results in a reduction in the breakdown strength.
3.2.2 Quantitative comparison of modeling results and experimental data
A semi-empirical approach is presented to correlate the field distribution results from
modeling and the experimental data of breakdown strength (EB) shown in Figure 3. To
achieve this, it is necessary to define a characteristic value for the distribution of electric
12
field obtained from the modeling. The average electric field strength or the average field
strength modified by a fluctuation term has been used as the characteristic value, assuming
they are inversely proportional to the breakdown strength [10, 12]. In this work the field
distribution is represented by a critical intensification factor (IC), corresponding to a
threshold field strength, than which 30% of the total polymer is under a higher stress as
shown in Fig. 9a. IC is designated as the characteristic value of the field intensification
effect caused by the high permittivity fillers, and is considered to be inversely proportional
to the electrical breakdown strength, EB, as shown in Equation (5), where the threshold
value ET is the short term breakdown strength of neat polymer measured at the same
condition. This makes no assumptions about the mechanism of breakdown other than that it
is facilitated by increased electric field.
( )
This argument is based on the assumption that once a certain portion (30% in this work
determined empirically to fit the breakdown data) of polymer is under an electrical stress
larger than the threshold value, electrical breakdown is observed. When the applied field on
the composites is lower than the breakdown strength, less than 30% of polymer is under a
field beyond the breakdown threshold. That volume fraction might be too small to initiate
global breakdown propagation through the bulk polymer considering the short term
breakdown mechanisms such as electronic, thermal and electromechanical breakdown.
Because only the field amplitude distribution and the threshold field strength are
considered, the correlation between the field intensification factor and composite
breakdown strength will be valid for any short term thermal or electronic breakdown
mechanism, under the assumption that the breakdown mechanism is the same for the neat

13
polymer and the composites. For long term breakdown behavior which might be related to
partial discharge, treeing or electrochemical mechanisms, a much smaller probability value
is expected because initiation depends on the most stressed region in the polymer.
The relation between IC and EB is plotted in Fig. 9b for BaTiO3 fiber filled composites.
The IC for the neat polymer is unity since no field enhancement effect is present. The solid
line shows the proposed relation in Equation (5). All the results show good agreement with
the proposed relation.
Although the chosen probability of 30% is an empirical to fit the data in this work, it is
possible that this value is universal, considering an assumption that the highly stressed
polymer region needs to reach percolation for the propagation of global breakdown.
Whether this number would work in other systems needs further examination. The
approach presented here addresses the change in breakdown strength with respect to the
filler volume fraction and AR. Only a geometric factor of the inhomogeneous structure was
considered in the study. Other influential factors, such as chemical species, thermal-
mechanical behavior of composites and interfacial interaction between the polymer and
fillers, are not evaluated. The role of interfacial regions might not stand out in this case,
however, due to the sub-micron size of the fillers. Assuming a 10 nm interfacial layer
thickness [31], the calculated interfacial volume fraction is about 5% for high AR BaTiO3
fibers. For other systems in which other influential factors stand out, the proposed model
might not be applicable.
3.2.3 Comparison with data in the literature
The proposed model in this work is also compared with the experimental data of
BaTiO3 particle filled composites in the literature [10] and the results are shown in Fig. 10.

14
The characteristic probability of 30% was still used to obtain the estimated breakdown
strength. The estimation matches the breakdown results well. The highest filler volume
fraction that can be obtained in the FEA is 0.3, due to the Random Sequential Addition
(RSA) method of the composite structure generation. A better algorithm is needed to
predict the breakdown strength at a higher filler volume fraction.
4. Summary
By FEA, several microstructure parameters of the composites filled with high AR
fillers were studied for their impact on the composite permittivity, field distribution and
breakdown strength. The geometric microstructure of composites was studied without
introducing other influential factors such as the interfacial region between the filler and
polymer matrix, and the defects introduced in the composite preparation process.
Several potential influential parameters of composite permittivity were analyzed
individually and differentiated by the results. Their influence on the composite permittivity
was compared to the rule of mixtures prediction and the experimental data. The difference
in filler shape, the filler curvature and the low permittivity grain boundary in the high
permittivity fillers have no influence on the composite permittivity. The distribution of
fiber AR increases the composite permittivity, which did not lead to the smaller permittivity
value observed in the experiment. Filler alignment in the compression molding process was
determined to be responsible for the observed smaller composite permittivity compared to
the rule of mixtures prediction.
The stress concentration in the polymer matrix caused by the high permittivity fillers
was analyzed by FEA and a correlation between the field distribution statistics in the FEA
15
and the experimental data of composite breakdown strength was established. It was
speculated that the percolation of polymer regions sustaining higher electrical stress than
the threshold value leads to the propagation of electrical breakdown. The proposed model
was used to successfully estimate the experimental data in the literature.
5. Acknowledgement
This work was supported by ABB and the Nanoscale Science and Engineering Center
for Directed Assembly of Nanostructures at Rensselaer Polytechnic Institute under NSF
Contract # DMR 0642573. One of us (H. Hillborg) also acknowledges support from the
Swedish Research Council (IFA 2007-5095).
6. Reference
[1] Sihvola A. Mixing rules with complex dielectric coefficients. Subsurf Sens Technol Appl
2000;1: 393–415.
[2] Ramaseshan R, Sundarrajan S, Jose R, Ramakrishna S. Nanostructured ceramics by
electrospinning. J Appl Phys 2007;102: 111101.
[3] Li D, McCann JT, Xia Y, Marquez M. Electrospinning: A simple and versatile technique for
producing ceramic nanofibers and nanotubes. J Am Ceram Soc 2006;89: 1861–1869.
[4] Badrossamay MR, McIlwee HA, Goss JA, Parker KK. Nanofiber assembly by rotary jet-
spinning. Nano Lett 2010;10: 2257–61.
[5] Ju Z, Xu L, Pang Q, Xing Z, Ma X, Qian Y. The synthesis of nanostructured SiC from waste
plastics and silicon powder. Nanotechnology 2009;20: 355604.
[6] Liu D, Yan Y, Zhou H. Synthesis of micron-scale platelet BaTiO3. J Am Ceram Soc 2007;90:
1323–1326.
[7] Myroshnychenko V, Brosseau C. Finite-element method for calculation of the effective
permittivity of random inhomogeneous media. Phys Rev E 2005;71: 016701.
[8] Kr , Myroshnychenko V. Modeling dielectric properties of composites by finite-
element method. J Appl Phys 2002;92: 6743.
[9] Myroshnychenko V, Brosseau C. Finite-element modeling method for the prediction of the
complex effective permittivity of two-phase random statistically isotropic heterostructures. J
Appl Phys 2005;97: 044101.
[10] Kim P, Doss NM, Tillotson JP, Hotchkiss PJ, Pan M-J, Marder SR, et al. High energy density
nanocomposites based on surface-modified BaTiO3 and a ferroelectric polymer. ACS Nano
2009;3: 2581–92.
[11] Calame JP. Finite difference simulations of permittivity and electric field statistics in ceramic-
polymer composites for capacitor applications. J Appl Phys 2006;99: 084101.
[12] An L, Boggs SA, Calame JP. Energy storage in polymer films with high dielectric constant
fillers. IEEE Electr Insul Mag 2008;24: 5–10.

16
[13] Cheng Y, Chen X, Wu K, Wu S, Chen Y, Meng Y. Modeling and simulation for effective
permittivity of two-phase disordered composites. J Appl Phys 2008;103: 034111.
[14] Nilsson F, Gedde UW, Hedenqvist MS. Modelling the relative permittivity of anisotropic
insulating composites. Compos Sci Technol 2011;71: 216–221.
[15] Brosseau C, Beroual A, Boudida A. How do shape anisotropy and spatial orientation of the
constituents affect the permittivity of dielectric heterostructures? J Appl Phys 2000;88: 7278.
[16] Wang Z, Nelson JK, Miao J, Linhardt RJ, Schadler LS, Hillborg H, et al. Effect of high aspect
ratio filler on dielectric properties of polymer composites: a study on barium titanate fibers and
graphene platelets. IEEE Trans Dielectr Electr Insul 2012;19: 960 –967.
[17] Sihvola AH, Alanen E. Studies of mixing formulae in the complex plane. IEEE Trans Geosci
Remote Sens 1991;29: 679–687.
[18] Curecheriu L, Buscaglia MT, Buscaglia V, Zhao Z, Mitoseriu L. Grain size effect on the
nonlinear dielectric properties of barium titanate ceramics. Appl Phys Lett 2010;97: 242909.
[19] Wada S, Yasuno H, Hoshina T, Nam S-M, Kakemoto H, Tsurumi T. Preparation of nm-sized
barium titanate fine particles and their powder dielectric properties. Jpn J Appl Phys 2003;42:
6188–6195.
[20] Ohara Y, Koumoto K, Yanagida H. Effect of crystal-axis orientation on dielectric properties of
ceramics prepared from fibrous barium titanate. J Am Ceram Soc 1994;77: 2327–2331.
[21] Gao L, Zhai J, Song S, Yao X. Crystal orientation dependence of the out-of-plane dielectric
properties for barium stannate titanate thin films. Mater Chem Phys 2010;124: 192–195.
[22] Fang T-T, Hsieh H-L, Shiau F-S. Effects of pore morphology and grain size on the dielectric
properties and tetragonal-cubic phase transition of high-purity barium titanate. J Am Ceram
Soc 1993;76: 1205–1211.
[23] Takeuchi T, Tabuchi M, Ado K, Honjo K, Nakamura O, Kageyama H, et al. Grain size
dependence of dielectric properties of ultrafine BaTiO3 prepared by a sol-crystal method. J
Mater Sci 1997;32: 4053–4060.
[24] Li X, Shih W-H. Size effects in barium titanate particles and clusters. J Am Ceram Soc
1997;80: 2844–2852.
[25] Hoshina T, Wada S, Kuroiwa Y, Tsurumi T. Composite structure and size effect of barium
titanate nanoparticles. Appl Phys Lett 2008;93: 192914.
[26] Uchino K, Sadanaga E, Hirose T. Dependence of the crystal structure on particle size in barium
titanate. J Am Ceram Soc 1989;72: 1555–1558.
[27] Tsurumi T, Hoshina T, Takeda H, Mizuno Y, Chazono H. Size effect of barium titanate and
computer-aided design of multilayered ceramic capacitors. IEEE Trans Ultrason Ferroelectr
Freq Control 2009;56: 1513–1522.
[28] Takeuchi T, Ado K, Asai T, Kageyama H, Saito Y, Masquelier C, et al. Thickness of cubic
surface phase on barium titanate single-crystalline grains. J Am Ceram Soc 1994;77: 1665–
1668.
[29] Begg BD, Vance ER, Nowotny J. Effect of particle size on the room-temperature crystal
structure of barium titanate. J Am Ceram Soc 1994;77: 3186–3192.
[30] Tsurumi T, Sekine T, Kakemoto H, Hoshina T, Nam S-M, Yasuno H, et al. Evaluation and
statistical analysis of dielectric permittivity of BaTiO3 powders. J. Am. Ceram. Soc. 2006;89:
1337–1341.
[31] Lewis TJ. Interfaces: nanometric dielectrics. J. Phys. D: Appl. Phys. 2005;38: 202–212.
17
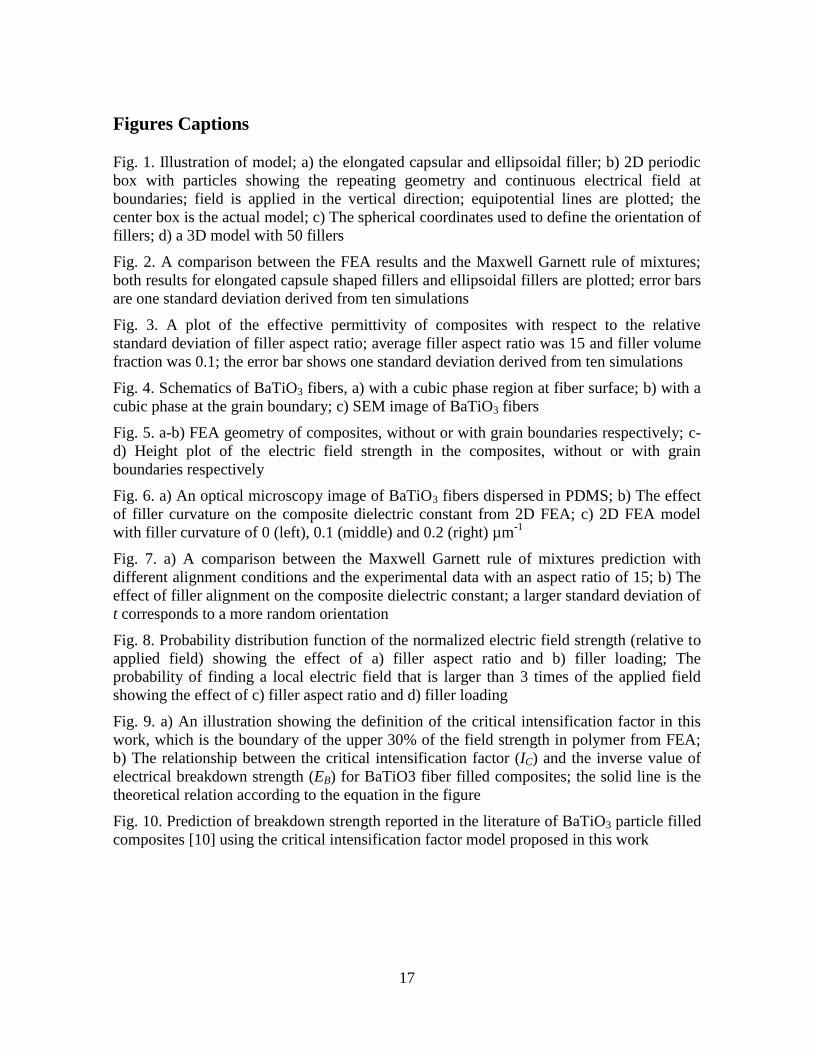
Figures Captions
Fig. 1. Illustration of model; a) the elongated capsular and ellipsoidal filler; b) 2D periodic
box with particles showing the repeating geometry and continuous electrical field at
boundaries; field is applied in the vertical direction; equipotential lines are plotted; the
center box is the actual model; c) The spherical coordinates used to define the orientation of
fillers; d) a 3D model with 50 fillers
Fig. 2. A comparison between the FEA results and the Maxwell Garnett rule of mixtures;
both results for elongated capsule shaped fillers and ellipsoidal fillers are plotted; error bars
are one standard deviation derived from ten simulations
Fig. 3. A plot of the effective permittivity of composites with respect to the relative
standard deviation of filler aspect ratio; average filler aspect ratio was 15 and filler volume
fraction was 0.1; the error bar shows one standard deviation derived from ten simulations
Fig. 4. Schematics of BaTiO3 fibers, a) with a cubic phase region at fiber surface; b) with a
cubic phase at the grain boundary; c) SEM image of BaTiO3 fibers
Fig. 5. a-b) FEA geometry of composites, without or with grain boundaries respectively; c-
d) Height plot of the electric field strength in the composites, without or with grain
boundaries respectively
Fig. 6. a) An optical microscopy image of BaTiO3 fibers dispersed in PDMS; b) The effect
of filler curvature on the composite dielectric constant from 2D FEA; c) 2D FEA model
with filler curvature of 0 (left), 0.1 (middle) and 0.2 (right) µm-1
Fig. 7. a) A comparison between the Maxwell Garnett rule of mixtures prediction with
different alignment conditions and the experimental data with an aspect ratio of 15; b) The
effect of filler alignment on the composite dielectric constant; a larger standard deviation of
t corresponds to a more random orientation
Fig. 8. Probability distribution function of the normalized electric field strength (relative to
applied field) showing the effect of a) filler aspect ratio and b) filler loading; The
probability of finding a local electric field that is larger than 3 times of the applied field
showing the effect of c) filler aspect ratio and d) filler loading
Fig. 9. a) An illustration showing the definition of the critical intensification factor in this
work, which is the boundary of the upper 30% of the field strength in polymer from FEA;
b) The relationship between the critical intensification factor (IC) and the inverse value of
electrical breakdown strength (EB) for BaTiO3 fiber filled composites; the solid line is the
theoretical relation according to the equation in the figure
Fig. 10. Prediction of breakdown strength reported in the literature of BaTiO3 particle filled
composites [10] using the critical intensification factor model proposed in this work

18
Figures
a) b)
c) d)
Figure 1
Figure 2
0
5
10
15
20
25
0 0.1 0.2
Effe
ctiv
e p
erm
itti
vity
of
com
po
site
s
Filler volume fraction
MG AR=15
FEA ellipsoid AR=15
FEA capsule AR=15

19
Figure 3
a) b) c)
Figure 4
Table 1. Summary of the permittivity and breakdown strength of BaTiO3 fiber filled composite in [16]
Aspect ratio (AR) Neat Polymer
3 3 6 6 15 15
Filler volume fraction 0.1 0.2 0.1 0.2 0.1 0.2
Permittivity 3.02 4.53 6.38 4.90 8.33 7.47 11.97
BD strengtha (kV/mm) 31.5 - - 23.2 19.1 18.3 15.3 aBD strength represents the 63% probability value in the Weibull distribution of
dielectric breakdown strength
91011121314151617
0 0.5 1
Effe
ctiv
e p
erm
itti
vity
of
com
po
site
s
Relative standard deviation of fiber aspect ratio
20
a) b)
c) d)
Figure 5
a) b)
c)
Figure 6
0
2
4
6
8
10
0 0.1 0.2
Co
mp
osi
te d
iele
ctri
c co
nst
ant
Curvature of fillers (1/µm)

21
Figure 7
a) b)
c) d)
Figure 8
0
2
4
6
8
10
12
14
0.00 0.10 0.20
Co
mp
osi
te d
iele
ctri
c co
nst
ant
Filler volume fraction
MG aligned parallel to EMG aligned perpendicular to EMG randomly orientatedBaTiO3 fiber composite AR=15
02468
1012141618
0 0.5 1 1.5Co
mp
osi
te d
iele
ctri
c co
nst
ant
Standard deviation of t
FEA resultMG aligned perpendicular to EMG random orientationExperimental data

22
Figure 9
Figure 10
Table 2. Material properties used in the FEA.
Permittivity Loss factor
Filler 1000 0.01
Polymer 3 0.001
0
0.5
1
1.5
2
2.5
3
0 0.05 0.1
I c
1/EB (kV/mm)-1
AR=6 Vol=0.1AR=6 Vol=0.2AR=15 Vol=0.1AR=15 Vol=0.2Neat PDMS
Ic × EB(composite)= Ethreshold
200
250
300
350
400
0 0.2 0.4 0.6
Co
mp
osi
te b
reak
do
wn
st
ren
gth
(kV
/mm
)
Filler volume fraction
Prediction from FEA
Data in literature