
SCB_061966
88
Digitized for FRASER http://fraser.stlouisfed.org/ Federal Reserve Bank of St. Louis
Transcript of SCB_061966

Digitized for FRASER http://fraser.stlouisfed.org/ Federal Reserve Bank of St. Louis
"OF
JUNE 1 968 / VOLUME 46 NUMBER
CONTENTS
THE BUSINESS SITUATION
Summary 1
Residential Construction Activity 3
National Income and Product Tables 6
Capital Investment To Rise Throughout 1966 8
Manufacturers' Inventory and Sales Expectations-Second and Third Quarters 1966 13
ARTICLES
Foreign Travel Payments Continue To Rise in 1965 15
The U.S. Balance of International Payments:First Quarter of 1966 18
NEW OR REVISED STATISTICAL SERIES
Production of Electric Energy in 1964 43
Money Supply and Related Data, 1959-64 44
CURRENT BUSINESS STATISTICS
General S1-S24
Industry S24-S40
Subject Index (Inside Back Cover)
U,S.
John T. Connor / Secretary
Office of
George Jaszi / DirectorMorris R. Goldman Louis J, Paradise
Associate Directors
Murray F. Foss /Editor
Leo V. Barry, Jr. / Statistics Editor
Billy Jo Hurley / Graphics
Business Review and Features:
Francis L, Hirt
Charles A« Waite
David R. Hull, Jr.
Leo Bernstein
Genevieve B» Winisatt
Marie P. Hertzberg
Articles:Etienne H. Miller
Walther Lederer
Samuel Pizer
Evelyn M. Parrish
Subscription prices* including weekly statistical sup-plements, are'$6 a year for domestic and $9.7$ for foreignmailing* Single issue 45 cents*
Make checks payable to the Superintendent of Docu~ments and send to U.S. Government Printing Office,Washington, D.C., 20402, or to any U.S. Department ofCommerce Field Office.
U.S. OF OFFICES
, N.-Mex.,. 87101U.S. Courthouse Ph. 247-0311.
„,-,.-—~a, 99501c-Sogu Bldg. 272-6331.
Atlanta, Ga., 3030375 ForsytJb St. NW. 526-6000.
Baltimore, M<L, 21202 '305 U.S. Customhouse PL 2-8460.
gham, Ala., 35205908 S. 20th St, Ph. 325-3327.
Boston, Mass., 02110' -80 Federal St. CA 3-2312.
Buffalo* H.Y., 14203 , '.117 Eifieott St. ' Ph, 842-3208,
Charleston, S.C., 29403334 MeeHog St.
' Ph. 747-4171. ' -' - •Charleston, W; Va.,, 25301 ' •'
500 QjaarHer St. Ph. 343-6196.
Cheyenpe, Wyo^ 82001' •• -6022 U;S. Federal Bldg.Ph* 634-59201
Chleago, 111.; 60604 ' - .1486 New Federal Bldg.Pb. 828-4400.
Cincinnati, Ohio, 45202''550 Main St, ; Ph. 684-2944.
, Cleyelaiidy Ohio, 44101 ' • ', ' ' E* -6th St. and Superior Ave. ' -
' Ph, 241-7900.Pallas, Tex*,, 75202 <• ' '
1114 Commerce St. Ht 9-3287.
Deivftsr, Colo*, 80202 ' '. '16407 Fed. BMg.s 20th Stoiit Sts.Ph. 297-3246.
Bes Moines, Iowa, 50309 :1216 Paramowit Bldg,Ph. 284-4222. '
Detroit, Mich., 48226445 Federal Bldg. Ph. 226-6088,
Greensboro, N.CU 27402' .412 U.S. Post Office Bldg.Ph. 275-9111.
Hartford, Con**;', 06103,18 Asylum St. Ph. 244-3530.
Honolulu, Hawaii, 96813202 International Savings Bldg.Ph. 588-977.
Houston, Tex., 77002515 Rusk Ave. Ph. 228-0611.
Jacksonville, Fla.,, 32202''208 Laura St. Ph. 354-7111.
Kansas City, Mo., 64106 '911 Walnut St. FR 4-3141.
Los Angeles, Calif*, 900151031 S. Broadway Ph. 688-2833.
Memphis, Teira»,.-345. Federal Office Bldg, ' ', :
- Ph.534-3214.- ' / , ' ' , - *Miami, Fla,-, 33130, > ' ' • '
Sl-SW. First Ave., Ph. 350-5267,-,,Mawaw|:ee,-Wis., 53203' ' ' 'V
238 W. Wkeomiu Ave, BE 2^8600.., 55401 ''Ph. 334-2133,306 Federal Bldg,
^610; South St, ' Ph. 557^6546. . •ew' Yoirk^ N . Y. v 10001 - ' - . . - 'Empire State Btdg, - 'LO 3-3377,
^Fa ' 19107 / ' •1015 Chestnut St. Ph. 597-2850,
Phoenix, Ariz. y 85025" ' ' ' - • -230 N. First Ave. Ph. 261-^328$,
- Pi tltsh«rgh , Fa ; v 15222 " : - , * '" ' ' •1000 Liberty Ave. Ph, 644-2850,
Portland, Oreg,, ^7204217 Old U.S. Courthouse Bltig.Ph. 226-3361,
, ., • .300 Booth St, Ph. 784-5203.
/ R!«hnxoitid, Va'M 23240': . •2105 Federal Bldg. Ptu 649-3611,
. St.. Louis, Mo., 63103-25.11 Federal BHg. MA 2-4243. '
Salt Lake City, Utah, 84111 ; ."; 125 South State St. Pk 524-5116,
' Satt Fr^nelseo, Calif., 94102450 Golden Gate Ave.
- , Ph. 556-5864. ,-• - . - - , / / _/Santtir^e, Puerto Bico, 00907
605 Condado Ave. Ph. 723-4640.'Savannah, Gsu, 31402 : \ ',
235 U.S. Courthouse and P.O.Bldg. 232-4321.
Seattle,' Wash*, 98104809 Federal Office BWg.583-5615.
Digitized for FRASER http://fraser.stlouisfed.org/ Federal Reserve Bank of St. Louis

the BUSINESS SITUATION
JL HE May statistics on businessactivity gave further support to whatthe April data had suggested: Totaloutput and sales in the second quarterhave increased at a good pace, but therate of advance has been well belowthat of the two preceding quarters;moreover, the slowdown in the demandincrease has centered in the consumersector, chiefly durable goods and espe-pecially automobiles. These changeshaVe occurred while upward pressureson industrial prices have continuedstrong.
The comprehensive payroll figuresafford a good indication of how thetempo of the advance has changed.They were up by $2.2 billion (seasonallyadjusted annual rate) from April toMay and brought the May total to apoint $6X billion above February. Thegain over the past 3 months has beensomewhat greater than the averagequarterly rise from 1964 to 1965 butlow&r than the $9 billion increases thattook place in the last quarter of 1965and the first quarter of this year.
On the demand side, it appears thatactivity this spring has advanced main-ly under the stimulus of rising plant andequipment expenditures and defenseoutlays'. However, consumer demand,after two quarters of extraordinaryincrease, has lost some of its buoyancy.According to the advance report forMay, retail sales declined (seasonallyadjusted) for the second straight month,chiefly because of lower sales of durablegoods. For both automobiles and otherdurable goods, the rate of sales so farin the second quarter is running belowthe first; for nondurables, it is some-what higher.
Last month, wholesale industrialprices rose 0.4 percent as a result ofwidespread price increases among thevarious commodity groups, but farmprices were lower and processed foodprices not much changed. Conse-
CHART 1
Plant and Equipment ExpendituresInvestment in 1966 now anticipatedat 17 percent above 1965
Billion $
80
60
40
20
TOTAL BUSINESS
40
20
0
40
20
0
MANUFACTURING
" 5 " >V
—F\\n
—
—
NONIV1AI\ UFACTU RING
- - tV —
1962 63 64 65 66*
*Last three quarters are anticipated.
U.S. Department of Commerce. Office of Business Economics
1 2 3 4
1966*
Quarterly,Seasonally Adjusted
at Annual Rates
Data: OBE-SEC
66-6-1
quently, for the 3d month in a row,there was little change in the overallwholesale price index. The rise inindustrial prices was the fifth straightmonthly increase this year and broughtthe annual rate of advance sinceDecember to approximately 8)2 percent.
Auto sales decline further
The slump in new car sales thatbegan in April continued in May.After a seasonally adjusted drop of 13percent from March to April, retailsales of domestically built passengercars fell 7 percent last month. Com-bined sales for April and May were 15percent below the first quarter rate.Aside from the strike-affected fallmonths of 1964, the May rate of newcar sales was the lowest since June 1964.However, sales improved in the first 10days of June.
New car inventories held by dealershave been rising steadily since Januaryand in May increased by 100,000 units,the largest monthly addition in thecurrent model year. End-of-Maystocks, seasonally adjusted, were at anew peak of 1.5 million units. Relativeto sales, dealers' stocks now representtwo and one-half times the May rateof deliveries, as compared with a stock-sales ratio of 1.78 in the first quarterof this year and 1.86 in the finalquarter of 1965.
Reflecting the lower rate of sales andrelatively high inventories, passengercar production was cut back fairlysharply in May. It was the firstsignificant reduction in assemblies in thecurrent business expansion, except forthe loss of output due to work stoppages.On the other hand, truck production,where demand from business and
Digitized for FRASER http://fraser.stlouisfed.org/ Federal Reserve Bank of St. Louis

SURVEY OF CURRENT BUSINESS June 1966
government continued strong, has beenmaintained at about record rates.The auto industry is shutting down formodel changeovers somewhat earlierthan in 1965, and for some models, theshutdown will be for longer periodsthan last year.
Steel adds to output rise
The reduction in auto assemblieswas the chief factor limiting the rise(seasonally adjusted) in industrial pro-duction from April to May. TheFederal Reserve index increased closeto 1 percent over the month, paced bysizable advances in business and defenseequipment, a substantial pickup insteel production, and the recovery ofcoal production from the April strikes.
The May increase in steel milloperations—about 4 percent—marked
the 6th straight month of advance.Steel ingot output in May, at anannual rate of about 141 million tonson a seasonally adjusted basis, was thehighest since the early summer monthsof 1965, when steel users were pressingthe mills for strike-hedging tonnage.Steel output has increased about 30percent since November 1965.
With consumption at a record rate,the steel inventory adjustment bymanufacturing consumers, underwaysince September 1965, seems to beabout over. There was some liquida-tion of stocks in April, but the reductionwas only 100,000 tons (unadjusted);this compares with an average monthlydecline of 700,000 tons in the firstquarter and of 1.4 million tons in theprevious quarter. At the end of April,
Corporate Profits Before Tax Related toCorporate Gross Product-NonfinanciaI CorporationsThe profit ratio rose in the first quarter to a new peak for the current expansion
CHART 2
70
65
60
55
Note: Percentages represent the ratio,of corporate'profits before tax to corporate gross product,%
100 125 275
I300
I . I.
225 250Billion $
Corporate Gross Product
Note: Data are seasonally adjusted at annual rates and exclude profits originating in the rest of the world.
. Department of Commerce. Office of Business Economics
325 350 375 400
manufacturing consumers' stocks weredown to 10.8 million tons from a highof 17.2 million tons in August 1965,the peak of the 1965 steel inventorybuildup. This carryover was thelowest since December 1964 and, interms of the April rate of consumption,represented a 38-day supply, a levelof inventories that has prevailed inearlier periods of fairly normal operat-ing conditions. With steel productionin May near a record rate and con-sumption held down somewhat by thecutback in automobile production, steelstocks held by manufacturing con-sumers may well show some increasein May.
First quarter profits higher
The regular estimates of first quartercorporate profits were about the sameas the preliminary figures presentedlast month. Including the inventoryvaluation adjustment, profits beforetaxes rose $2.9 billion to a seasonallyadjusted annual rate of $78.1 billion.Durable goods manufacturers accountedfor almost $2 billion of the rise andnondurable goods producers for mostof the remainder. The advance inprofits was due mainly to the unusuallylarge increase in output in the firstquarter and also to a rise in profitmargins, as chart 2 shows.
Federal Fiscal Position
The Federal fiscal position improvedsharply in the first quarter. Withfurther improvement likely in theApril-June quarter (from the step-up inreceipts because of the new graduatedwithholding rates and the restorationof certain excises), the fiscal 1966 deficitshould be somewhat lower than the$2.2 billion estimated in the Januarybudget (national accounts basis).
Recent estimates of fiscal 1966receipts by the Treasury Departmentand the Joint Committee on InternalRevenue show corporate and personalincome tax receipts running well aboveearlier estimates. Expenditures areexpected to match budget projectionsclosely. On balance, since no new meas-ures of fiscal restraint beyond thosecalled for in the January budget wereintroduced, most of the fiscal 1966
Digitized for FRASER http://fraser.stlouisfed.org/ Federal Reserve Bank of St. Louis

June 1966 SURVEY OF CURRENT BUSINESS
improvement reflects higher-than-pro-jected levels of economic activity.
Federal deficit fallsThe Federal budget position on a
national income and product accountsbasis moved to-virtual balance in thefirst quarter of 1966, despite a $6%billion rise in expenditures, the largestabsolute increase since the Koreanwar period. This increase was morethan offset by an upsurge in receipts,about $8% billion at a seasonallyadjusted annual rate. As a result, theFederal fiscal position moved from a$1% billion deficit in the fourth quarterto a surplus of about $% billion in thefirst.
The advance in first quarter receiptswas paced by a $6% billion rise insocial insurance contributions, a resultof the boost in social security tax ratesfrom 7.25 to 8.4 percent and of theexpansion in the wage base from $4,800to $6,600. Sharp increases in personalincome and corporate profits during thequarter raised personal and corporatetax receipts substantially. Personaltaxbs rose over $2 billion and corporatetax liabilities rose $1% billion. Highnet final settlements on 1965 personaltax liabilities also contributed to thestrong advance in personal taxes andare expected to increase further in the
second quarter. Graduated withhold-ing rates on wages and salaries thatwere introduced in early May are
.estimated to add more than $% billion(annual rate) to second quarter per-sonal tax receipts.
Indirect business taxes fell in thefirst quarter as a result of the $1%billion reduction in excise taxes. Thecut was partially canceled in mid-March when Congress restored the ex-cises on passenger automobiles and ontelephone and teletypewriter service topre-January 1 levels. The budget im-pact of the restored excise taxes—about $1 billion at annual rates—willbe felt in the second quarter.
Nearly half of the large rise in ex-penditures occurred in national defensepurchases as military procurement forVietnam jumped sharply during thequarter. Purchases of goods and ser-vices for civilian purposes were up onlymoderately. Grants-in-aid, transferpayments, and net interest paid alsomoved up strongly. Higher outlaysfor education and public assistanceprograms accounted for most of therise in grants. New programs of socialsecurity assistance, such as liberalizedbenefits for widows, children, and thedisabled, contributed to the step-up intransfers. Higher interest rates ac-counted for most of the marked advancein net interest paid.
Residential Construction ActivityTHE increased stringency in credit con-ditions apparent this year has intro-duced considerable uncertainty into theoutlook for honaebuilding activity forthe rest of 1966, despite the continuedstrong flow of consumer income. Thisuncertainty follows a period whenhousing starts in a number of largemetropolitan areas were reduced tocorrect overbuilding, particularly ofapartment houses and especially in theSouthwest and along the West Coast.
Outlays level off this spring
So far in 1966, current-dollar outlaysfor private nonfarm residential struc-tures have fluctuated within the rela-tively narrow range evident since the
spring of 1964. Outlays rose $1 billionin the first quarter of this year to aseasonally adjusted annual rate of$27.6 billion but appear to have leveledoff this spring.
Construction costs have shown sonxesigns of accelerating this year. In thefirst quarter, costs were some 4 percentabove those a year earlier, as comparedwith increases of about 3 percent duringthe 2 previous years. Constant-dollarresidential outlays, which make allow-ance for higher costs, also appeared toshow a pickup in the first quarter and aleveling this spring. However, in con-trast to the current-dollar expenditures,real outlays have been in a moderatedowntrend over the past 2 years or so;
since the recent peak in the first quarterof 1964, real outlays have declinedabout 8 percent.
The short-run changes in real ex-penditures reflect the pattern of housingstarts with a lag of almost one quarter.
CHART 3
Housing Starts
• U.S. total has fluctuated near1.5 million units since mid-1964
• Since then gains in the Northeast and NorthCentral regions have been largely offset bycurtailment of starts in the West
•21959 61 63 65
Quarterly, Seasonally Adjusted at Annual Rates
Note: Regional figures include a small number of housing starts on farms.
U.S. Department of Commerce, Office of Business Economics
Data: Census66-5-3
Digitized for FRASER http://fraser.stlouisfed.org/ Federal Reserve Bank of St. Louis

SURVEY OF CURRENT BUSINESS June 1966
Private nonfarm starts rose to a season-ally adjusted annual rate of 1.55 millionunits in the fourth quarter of last yearand fell back to a rate of 1.49 millionin the first quarter. The first quarterrate was about the same as the rate for1965 as a whole and some 10 percentbelow the first quarter 1964 peak.Starts have declined somewhat morethan real expenditures because of thetrend toward units of higher qualityand cost.
Starts edged down from March toApril and dropped sharply in May,Data on housing permits, which nor-mally lead starts slightly, suggest adeveloping weakness in homebuildingsince seasonally adjusted permits thisApril and May were some 9% percentbelow the first quarter 1966 average.
Regional patterns differ
Regional figures have shown diversetrends in housing starts over the past 2years or so (chart 3). Through the endof 1965, starts rose in the two northernregions, decreased slightly in the South,and showqd a sharp and prolonged de-cline in the West.
The overall strength of the economy,especially the durable goods manufac-turing sector, was unquestionably im-
portant in sustaining housing activity inthe heavily industrialized Northeast.and North Central regions throughout1965. In addition, these areas havewitnessed considerable demolition ofolder dwelling units, especially urbanapartment and tenement buildings, forwhich replacement structures have beenerected. The easing of starts in theSouth reflected largely a drop in apart-ment construction in the major metro-politan areas of Texas, after verysubstantial increases—apparently in ex-cess of demand—from 1960 to 1963.Overbuilding accompanied by high va-cancy rates was also an acute problemin the West; the correction that began2K years ago. has been severe and hasbrought starts below their 1960 level.
This spring, both starts and permitsdata have shown some departure fromrecent trends. According to permitsdata, which are somewhat less irregularthan starts, homebuilding activity hasfallen considerably in the northern re-gions and has edged down a littlefurther in the West and in the South.
Housing mix fairly stable since mid-1964
From 1960 to about mid-1964,changes in multifamily housing con-
Table 1.—Private Housing Units Authorized by Building Permits, by Region
[Thousands of units, seasonally adjusted at annual rates]
1963:
1st qtr2d qtr3d qtr4th qtr .
1964:
1st qtr___ _ _ __ ' _ _2d qtr3d qtr4th qtr _
1965:
1st qtr2d qtr3d qtr4th qtr _
1966:
1st qtr _ _2dqtr.i
U.S. total
1, 2581, 33'21,3261,387
1, 37121,2901, 2641, 229
1 2571, 2271, 2131,289
1,2491, 130v
Northeast
236231235247
254243242239
264243255266
275222
NorthCentral
222279267284
313. 268290289
301312334346
343285
South
377398401435
410409394394
413407371430
398396
West
423424423421
395370338307
297265253247
233228
Based on 12,000 permit-issuing places.1 Based on average of April and May.
Source: U.S. Department of Commerce, Bureau of the Census.
struction accounted for most of thechange in total private housing starts.Multifamily housing rose sharply untillate 1963 and early 1964 and thenexperienced a brief but fairly substan-tial cutback because of rising vacancyrates. Since the middle of 1964, whenconstant-dollar housing activity startedto show a decline, there has been rela-tively little change in the mix of singlefamily and multifamily housing. Untilvery recently, single family starts fluc-tuated within a rather narrow range.Multifamily starts have been roughlystable at about 15 percent below theirrecent quarterly peaks- but more thandouble their level of 1959-60.
Seasonally adjusted data on startsare not available by type of structure.To judge from seasonally adjusted per-mit statistics, both single family andmultifamily units in the first quarter of1966 were about the same as their 1965quarterly averages. However, bothdeclined this spring with the singlefamily starts off sharply and the multi-family down only slightly.
Single family housing starts
Demographic factors are mainly re-sponsible for the failure of single familyhousing starts to show any markedchanges over the past 5 or 6 years.Although incomes have risen substan-tially over this period and mortgagefunds, until recently at least, havegenerally been ample, the number ofpersons 25 to 44 years old—the mostimportant home-buying age group—has been quite stable. Data publishedby the Census Bureau show that salesof single family housing erected bymerchant builders have been steady atabout 50,000 per month, seasonallyadjusted, for more than 3 years (mid-dle panel, chart 4). Sales showed aslight pickup in the fourth quarter of1965 and a small dip in the first quarterof 1966.
The difficulties in accurately gagingdemand have led to some mild cyclicalmovements in starts by merchant build-ers since 1960. For example, in 1963,starts increased moderately without acorresponding rise in sales; as a result,inventories of unsold new houses rose,reaching a peak around the middle of
Digitized for FRASER http://fraser.stlouisfed.org/ Federal Reserve Bank of St. Louis

June 1966 SURVEY OF CURRENT BUSINESS
1964. With sales about unchanged, acutback in starts reduced unsold stocksfrom the second half of 1964 through thefirst quarter of this year. Judging bythe limited experience of the CensusBureau survey, stocks of unsold homeshave been quite low relative to salessince late last year, even though thefirst quarter 1966 ratio was slightlyabove the fourth quarter 1965 figure.
Multifamily housing
The most remarkable aspect of themultifamily housing market is not thatstarts are down from their peaks of late1963 and early 1964 but that they haveheld up so well. On an annual basis,multifamily starts in 1965 were only 8percent below 1963, the recent annual
CHART 4
New Single Family HousesThe ratio of houses for sale to sales has beenrelatively low since mid-19te5
RATtO OF HOUSES FOR SALE TO SALES ^
nin Html mi EMI nras sales of new houses have been stable. . .
Thousand Units
100 ' , • . - • >'"-::.r.:-*
o I i:i.:'i t i It n -tTft H $i t tit t It Vet i \i\\fiand the inventory of new houses forsale has fallen
300
250
200
Houses for Sale;
1963 1964 1965
Seasonally Adjusted
*Months of inventory at current sales rate.
U.S. Department of Commerce. Office of Business Economics
1966
Data: Census
66-6-4
high. There are several underlyingreasons for the comparatively high rateof multifamily housing. Demographicfactors are undoubtedly important:The number of very young householdheads, who typically rent rather thanbuy, began to increase a few years agoand is expected to grow considerablyover the next several years. Apart-ment house construction has been verystrong in suburban areas, which havehad large population growth and whichup to a few years ago had shown rela-tively little construction of this type.Multifamily construction was com-paratively low throughout the 1930's,1940's, and 1950's, and the apartmenthouse stock was in need of a majorrenewal. The many new conveniencesintroduced in modern apartment houseshave undoubtedly attracted many fam-ilies and individuals.
The decline in apartment house con-struction from the peaks reached morethan 2 years ago was dampened becausecutbacks in response to increased vacan-cies did not occur simultaneously in allregions. While starts were being re-duced in some areas, they were stillrising in others, and in some areas thatcompleted their adjustment to over-building relatively early, starts beganto increase once again.
According to Census data, the na-tional vacancy rate for rental units—which include a substantial proportionof single family houses for rent—wasslightly lower in the first quarter of1966 than in the corresponding 1965period. For both years, vacancy rateswere above those prevailing in early1963 and 1964.
A more detailed view of the apart-ment house situation is provided by theannual FHA vacanc)y survey of FHArental projects. On a national basis,the 1965 data show a small rise in thevacancy rate over early 1964, whichshowed a rather sharp increase overearly 1963. Among the largest metro-politan areas, changes in vacancy ratesfrom 1964 to 1965 were mixed outsideof the Southwest and the West Coast,where rates were uniformly higher andat very high levels. The 1966 resultsare not yet available. Apartment con-struction has been sharply curtailed inthose metropolitan areas with unusually
high vacancy rates. Last year, forexample, permits for apartment unitsdeclined almost 35 percent in SanFrancisco, about 40 percent in Houston,Dallas, and San Diego, and 50 percentin Los Angeles.
Mortgage markets tight
This spring, homebuilders and homebuyers have been faced with the mostunfavorable credit market conditionssince 1959. Even though there hasbeen a substantial rise in yields avail-able on home mortgage investments,rates on other types of debt instrumentshave risen even faster, and mortgageinvestments have become relatively lessattractive. In previous postwar years,such a development has been associatedwith a reduction in funds availablefor construction and a cutback inhomebuilding.
Table 2.—Vacancy RatesTforFHA Apart-ments, Selected Areas, March 31
U.S. total..
Northeast:
New YorkPhiladelphiaBostonBuffalo /_Newark.
North Central:
ChicagoDetroitPittsburghSt. Louis -.Cleveland
South:
WashingtonBaltimoreHouston _ _ _ _DallasAtlanta
West:
Los Angeles _ _San Francisco. _ _SeattleSan DiegoDenver
1961
5.4
2.06.31.25.21.2
1.37.75.3
17.15.4
1.82.3
18.69.98.3
5. 36.1
11.217.13.2
1962
5.5
2 67 32 45.73.0
3.312.36.6
13.08.7
1.54.9
12.77.67.3
4.94/06.94.85.5
1963
5.1
2 67 83 34.03.7
2.44.28.39.77.8
1.64.8
10.27.96.4
4.84.16.9
16.711.6
1964
6.3
6 07 35 43.34.2
5.56.24.78.37.5
2.93.0
15.713.34.5
8.05.8
11.714.66.3
1965
6.5
4.89.25.*2.44.7
2.'03.75.97.95.8-
2.84.6
15.425.15.4
10.98.9
12.316.110.6
Source: Federal Housing Administration.
Until late 1965, mortgage funds weregenerally in ample supply and mortgageyields had shown a slight downdriftsince the start of the economic expan-
Digitized for FRASER http://fraser.stlouisfed.org/ Federal Reserve Bank of St. Louis
6 SURVEY OF CURRENT BUSINESS June 1966
sion. At present, however, conven-tional mortgage rates on new houses areclose to 6}i percent, as compared withapproximately 5% percent last fall.The maximum rates permissible on
FHA-insured and VA-guaranteed homemortgages have been boosted twice thisyear. In early April, these rates wereraised % of a percent to 5% percent,after a %-percent increase earlier in
1966. In secondary market trading,yields on FHA mortgages have risen toabout 6% percent, after staying under5K percent from early 1963 throughlate 1965.
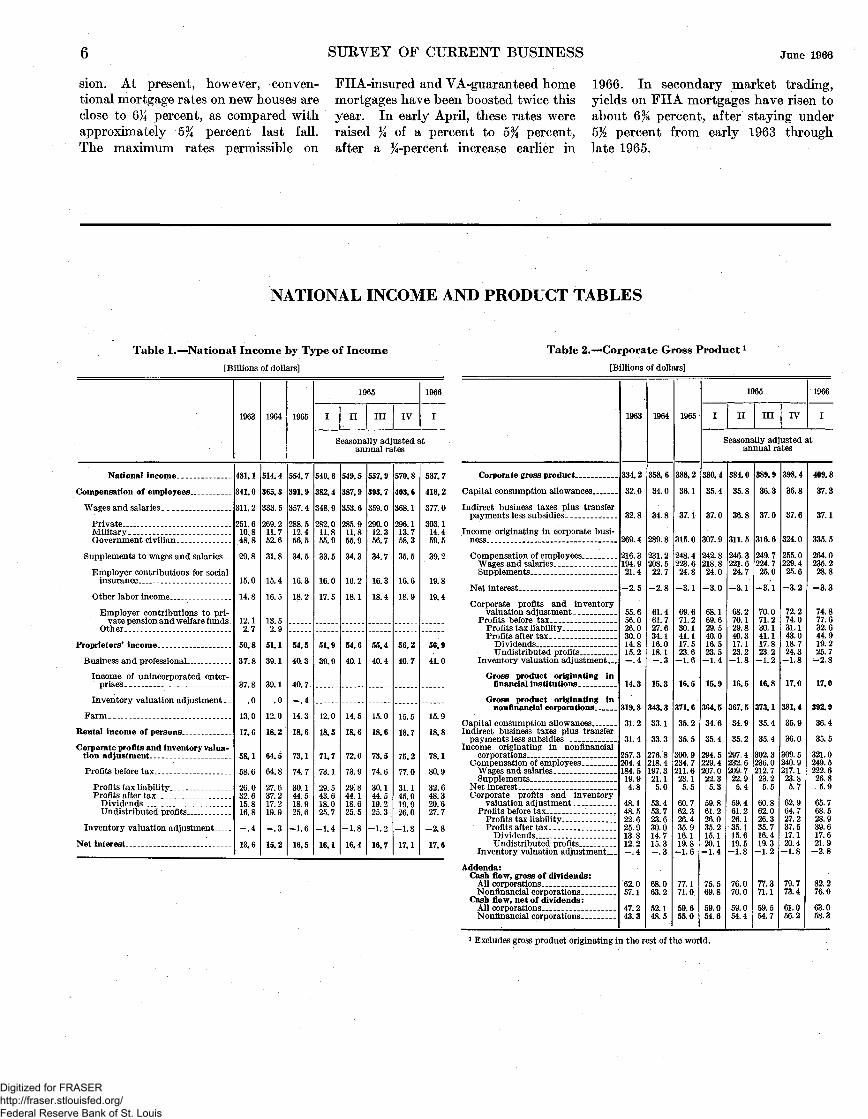
NATIONAL INCOME AND PRODUCT TABLES
Table 1.—National Income by Type of Income
[Billions of dollars]
Table 2.—Corporate Gross Productl
[Billions of dollars]
National income
Compensation of employees
Wages and salaries
PrivateMilitaryGovernment civilian
Supplements to wages and salaries _ _
Employer contributions for socialinsurance
Other labor income. _ _ . _ _ _ _ _ _
Employer contributions to pri-vate pension and welfare funds
Other .__.-.
Proprietors' income
Business and professional
Income of unincorporated enter-prises. _
Inventory valuation adjustment _ _
Farm... _ _
Rental income of persons
Corporate profits and inventory valua-tion adjustment
Profits before tax .
Profits tax liabilityProfits after tax
Dividends ._ __•Undistributed profits
Inventory valuation adjustment
Net interest
1963
481.1
341.0
311.2
251.610.848.8
29.8
15.0
14.8
12.12.7
50.8
37.8
37.8
.0
13.0
17.6
58.1
58.6
26.032.615.816.8
-.4
13.6
1964
514.4
365.3
333.5
269.211.752.6
31.8
15.4
16.5
13.52.9
51.1
39.1
39.1
.0
12.0
18.2
64.5
64.8
27.637.217.219.9
q— . o
15.2
1965
554.7
391.9
357.4
288.512.456.5
34.5
16.3
18.2
54.5
40.3
40.7
-.4
14.3
18.6
73.1
74.7
30.144.518.925.6
-1.6
16.5
1965
I II III IV
1966
I
Seasonally adjusted atannual rates
540. 6
382.4
348.9
282.011.855.0
33.5
16.0
17.5
51.9
39.9
12.0
18.5
71.7
73.1
29.543.618.025.7
-1.4
16.1
549.5
387.9
353.6
285.911.855.9
34.3
16.2
18.1
54.6
40.1
14.5
18.6
72.0
73.9
29:844.118.625.5
-1.8
16.4
557.9
393.7
359.0
290.012.356.7
34.7
16.3
18.4
55.4
40.4
15.0
18.6
73.5
74.6
30.144.519.225. 3
-1.2
16.7
570.8
403.6
368.1
296.113.758.3
35.5
16.6
18.9
56.2
40.7
15.5
18.7
75.2
77.0
31.145.919.926.0
-1.8
17.1
587.7
416.2
377.0
303. 114.459.5
39.2
19.8
19.4
56.9
41.0
15.9
18.8
78.1
80.9
32.648.320.627.7
-2.8
17.6
Corpora te gross product
Capital consumption allowances
Indirect business taxes plus transferpayments less subsidies
Income originating in corporate busi-ness
Compensation of employeesWages and salariesSupplements
Net interest
Corporate profits and inventoryvaluation adjustment
Profits before taxProfits tax liabilityProfits after tax
DividendsUndistributed profits
Inventory valuation adjustment...
Gross product originating infinancial institutions
Gross product originating innonfinancial corporations
Capital consumption allowances „ _ _Indirect business taxes plus transfer
payments less subsidiesIncome originating in nonfinancial
corporationsCompensation of employees.
Wages and salariesSupplements
Net interestCorporate profits and inventory
valuation adjustment -Profits before tax
Profits tax liabilityProfits after tax
DividendsUndistributed profits
Inventory valuation adjustment
Addenda:Cash flow, gross of dividends:
All corporationsNonfinancial corporations
Cash flow, net of dividends:All corporationsNonfinancial corporations..
1963
334. 2
32.0
32.8
269.4
216.3194.921.4
-2.5
55.656.026.030.014.815.2-.4
14.3
319.8
31.2
31.4
257.3204.4184.519.94.8
48.148.522.625.913.812.2-.4
62.057.1
47.243.3
1964
358. 6
34.0
34.8
289.8
231.2208. 522.7
-2.8
61.461.727.634.116.018.1-.3
15.3
343.3
33.1
33.3
276.8218.4197.321.15.0
53.453.723.630.014.715.3-.3
68.063.2
52.148.5
1965
388.2
36.1
37.1
315.0
248.4223.624.8
-3.1
69.671.230.141.117. 523.6
-1.6
16.5
371.6
35.2
35.5
300.9234.7211.623.15.5
60.762.326.435.916.119.8
-1.6
77.171.0
59.655.0
1965
I II III IV
1966
I
Seasonally adjusted atannual rates
380.4
35.4
37.0
307.9
242.8218.824.0
-3.0
68.169.629.540.016.523.5-1.4
15.9
364.5
34. 6
35.4
294.5229.4207.022.35.3
59.861.226.035.215.120.1
-1.4
75.569.8
59.054.6
384.0
35.8
36.8
311.5
246.3221. 624.7
-3.1
68.270.129.840.317.123.2
-1.8
16.5
367.5
34.9
35.2
297. 4232.6209.722.95.4
59.461.226.135.115.619.5
-1.8
76.070.0
59.054.4
389.9
36.3
37.0
316.6
249.7224.725.0
-3.1
70.071.230.141.117.823.2-1.2
16.8
373. 1
35.4
35.4
302.3236.0212.723.25.5
60.862.026.335.716.419.3
-1.2
77.371.1
59.554.7
398.4
36.8
37.6
324.0
255.0229.425.6
-3.2
72.274.031. 143.018.724.3-1.8
17.0
381.4
35.9
36.0
309.5240.9217.123.85.7
62.964.727.237.517.120.4
-1.8
79.773.4
61.056.2
409.8
37.3
37.1
335.5
264.0235.228.8
-3.3
74.877.632.644.919.225.7
-2.8
17.0
392.9
36.4
35.5
321.0249. 5222.626.85.9
65.768.528.939.617.621.9
-2.8
82.276.0
63.058.3
1 Excludes gross product originating in the rest of the world.
Digitized for FRASER http://fraser.stlouisfed.org/ Federal Reserve Bank of St. Louis
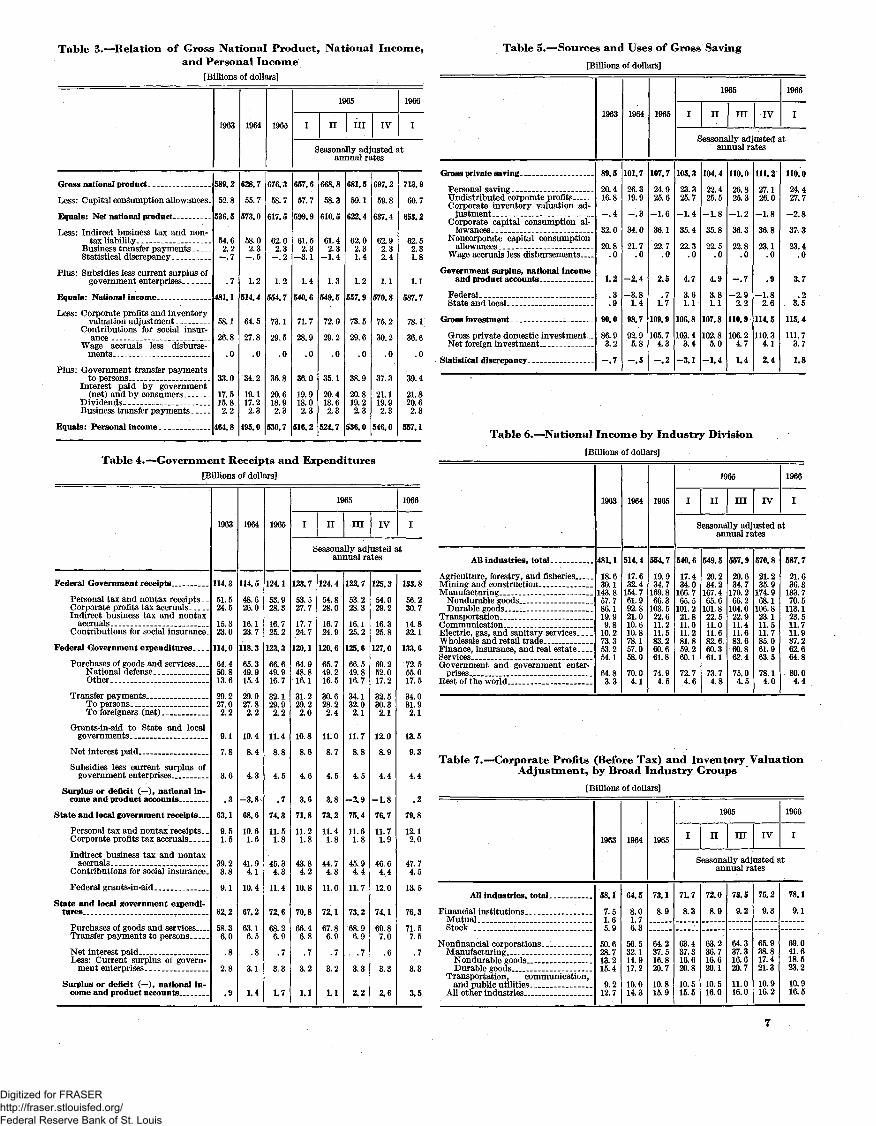
Table 3.—Relation of Gross National Product, National Income,and Personal Income
[Billions of dollars]
Table 5.—Sources and Uses of Gross Saving
[Billions of dollars]
Gross national product- _
Less: Capital consumption allowances.
Equals : Net national product
Less: Indirect business tax and non-tax liability
Business transfer paymentsStatistical discrepancy
Plus: Subsidies less current surplus ofgovernment enterprises
Equals: National income
Less: Corporate profits and inventoryvaluation adjustment
Contributions for social insur-ance - --
Wage accruals less disburse-ments
Plus: Government transfer paymentsto persons
Interest paid by government(net) and by consumers
DividendsBusiness transfer payments
Equals: Personal income. _
1963
589.2
52.8
536.5
54.62.2-.7
.7
481.1
58.1
26.8
.0
33.0
17.515.82.2
464.8
1964
628.7
55.7
573.0
58.02.3-.5
1.2
514.4
64.5
27.8
.0
34.2
19.117.22.3
495.0
1965
676.3
58.7
617.5
62.02.3-.2
1.2
554.7
73.1
29.5
.0
36.8
20.618.92.3
530.7
1965
I II III IV
1966
I
Seasonally adjusted atannual rates
657. 6
57.7
599.9
61.52.3
-3.1
1.4
540.6
71.7
28.9
.0
36.0
19.918.02.3
516.2
668.8
58.3
610.5
61.42.3
-1.4
1.3
549.5
72.0
29.2
• 0
35.1
20.418.62.3
524.7
681.5
59.1
622.4
62.02.31.4
1.2
557.9
73.5
29.6
.0
38.9
20.819.22.3
536.0
697.2
59.8
637.4
62.92.32.4
1.1
570.8
75.2
30.2
.0
37.3
21.119.92.3
546.0
713.9
60.7
653.2
62.52.31.8
1.1
587.7
78.1
36.6
.0
39.4
21.820.62.3
557.1
Table 4.—Government Receipts and Expenditures
[Billions of dollars]
Federal Government receipts. _ _ _ _ _ _
Personal tax and nontax receipts- _Corporate profits tax accrualsIndirect business tax and nontax
accrualsContributions for social insurance-
Federal Government expenditures. . _ _
Purchases of goods and services.. ._National defenseOther
Transfer payments. _ _To personsTo foreigners (net)
Grants-in-aid to State and localgovernments
Net interest paid
Subsidies less current surplus ofgovernment enterprises
Surplus or deficit (— ), national in-come and product accounts
State and local government receipts. __
Personal tax and nontax receipts _.C orporate profits tax accruals
Indirect business tax and nontaxaccruals _ __
Contributions for social insurance-
Federal grants-in-aid
State and local government expendi-tures _ _ _ _
Purchases of goods and servicesTransfer payments to persons
Net interest paidLess: Current surplus of govern-
men t enterprises
Surplus or deficit (— ), national in-come and product accounts
1963
114.3
51.524.5
15.323.0
114.0
64.450.813.6
29.227.02.2
9.1
7.8
3.6
.3
63.1
9.51.5
39.23.8
9.1
62.2
58.36.0
.8
2.8
.9
1964
114.5
48.626.0
16.123.7
118. 3
65.349.915.4
29.927.82.2
10.4
8.4
4.3
-3.8
68.6
10.61.6
41.94.1
10.4
67.2
63.16.5
•8
3.1
1.4
1965
124.1
53.928.3
16.725.2
123.3
66.649.916.7
32.129.92.2
11.4
8.8
4.5
.7
74.3
11.51.8
45.34.3
11.4
72.6
68.26.9
.7
3.3
1.7
1965
I II III IV
1966
I
Seasonally adjusted atannual rates
123.7
53.527.7
17.724.7
120.1
64.948.816.1
31.229.22.0
10.8
8.6
4.6
3.6
71.8
11.21.8
43.84.2
10.8
70.8
66.46.8
.7
3.2
1.1
124.4
54.828.0
16.724.9
120.6
65.749.216.5
30.628.22.4
11.0
8.7
4.5
3.8
73,2
11.41.8
44.74.3
11.0
72.1
67.86.9
.7
3.2
1.1
122.7
53.228.3
16.125.2
125.6
66.549.816.7
34.132.02.1
11.7
8.8
4.5
-2.9
75.4
11.61.8
45.94.4
11.7
73.2
68. 96.9
.7
3.3
2.2
125.3
54.029.2
16.325.8
127.0
69.252.017.2
32.530.32.1
12.0
8.9
4.4
-1.8
76.7
11.71.9
46.64.4
12.0
74.1
69.87.0
.6
3.3
2.6
133.8
56.230.7
14.832.1
133.6
72.555.017.5
34.031.92.1
13.5
9.3
4.4
.2
79.8
12.12.0
47.74.5
13.5
76.3
71.57.5
.7
3.3
3.5
Gross private saving
Personal savingUndistributed corporate profitsCorporate inventory valuation ad-
justmentCorporate capital consumption al-
lowances -Noncorporate capital consumption
allowances"Wage accruals less disbursements... _
Government surplus, national incomeand product accounts
Federal _State and local
Gross investment
Gross private domestic investment ._Net foreign investment _ _ _
Statistical discrepancy
1963
89.5
20.416.8
-.4
32.0
20.8.0
1.2
.3
.9
90.0
86.93.2
-.7
1964
101.7
26.319.9
-.3
34.0
21.7.0
-2.4
-3.81.4
98.7
92.95.8
-.5
1965
107.7
24.925.6
-1.6
36.1
22.7.0
2.5
.71.7
109.9
105.74.3
-.2
1965
I II III IV
1966
I
Seasonally adjusted atannual rates
105.3
23.325.7
-1.4
35.4
22.3.0
4.7
3.61.1
106.8
103.43.4
-3.1
104.4
22.425.5
-1.8
35.8
22.5.0
4.9
3.81.1
107.8
102.85.0
-1.4
110.0
26.825.3
-1.2
36.3
22.8.0
__ ri
-2.92.2
110.9
106.24.7
1.4
111.2
27.126.0
-1.8
36.8
23.1.0
.9
-1.82.6
114.5
110.34.1
2.4
110.0
24.427.7
-2.8
37.3
23.4.0
3.7
.23.5
115.4
111.73.7
1.8
Table 6.—National Income by Industry Division
[Billions of dollars]
1966
I
All industries, total
Agriculture, forestry, and fisheries133. 8 Mining and construction
Manufacturing56. 2 Nondurable goods30. 7 Durable goods
Transportation __ _14.8 Communication32. 1 Electric, gas, and sanitary services
Wholesale and retail trade133. 6 Finance, insurance, and real estate
Services72.5 Government and government enter-55. 0 prises. ...17. 5 Rest of the world
1963
481.1
18.630.1
143.857.786.119.99.8
10.273.353. 254.1
64.83.3
1964
514.4
17.632.4
154.761.992.821.010.610.878.157.058.0
70.04.1
1965
554.7
19.934.7
169.866.3
103.522.611.211.583.260.661.8
74.94.5
1965
I II III IV
1966
I
Seasonally adjusted atannual rates
540.6
17.434.0
166.765.5
101.221.811.011.281.859.260.1
72.74.6
549.5
20.234.2
167.465.6
101. 822.511.011.682.660.361.1
73.74.8
557.9
20.634.7
170.266.2
104. 022.911.411.683. 660.862.4
75.04.5
570.8
21.235.9
174.968.1
106.823.111.511.785.061.963.5
78.14.0
587.7
21.636.3
183.770.5
113.123.511.711.987.262.664.8
80.04.4
31.92.1
13.5
9. 3Table 7.—Corporate Profits (Before Tax) and Inventory Valuation
Adjustment, by Broad Industry Groups
[Billions of dollars]
All industries, total
Financial institutionsMutualStock
Nonfinancial corporations.Manufacturing
Nondurable goodsDurable goods
Transportation, communication,and public utilities
All other industries
1963
58. 1
7.51 65.9
50.628.713.215.4
9.212.7
1964
64.5
8.01 76.3
56.532.114.917.2
10.014.3
1965
73.1
8.9
64.237.516.820.7
10.815.9
1965
I II III IV
1966
I
Seasonally adjusted atannual rates
71. 7
8.3
63. 437.316.620.8
10.515.5
72.0
8.9
63.236.716.620.1
10.516.0
73.5
9.2
64.337.316.620.7
11.016.0
75.2
9.3
65.938.817.421.3
10.916.2
78.1
9.1
69.041.618.523.2
10.916.5
Digitized for FRASER http://fraser.stlouisfed.org/ Federal Reserve Bank of St. Louis
8 SURVEY OF CURRENT BUSINESS June 1966
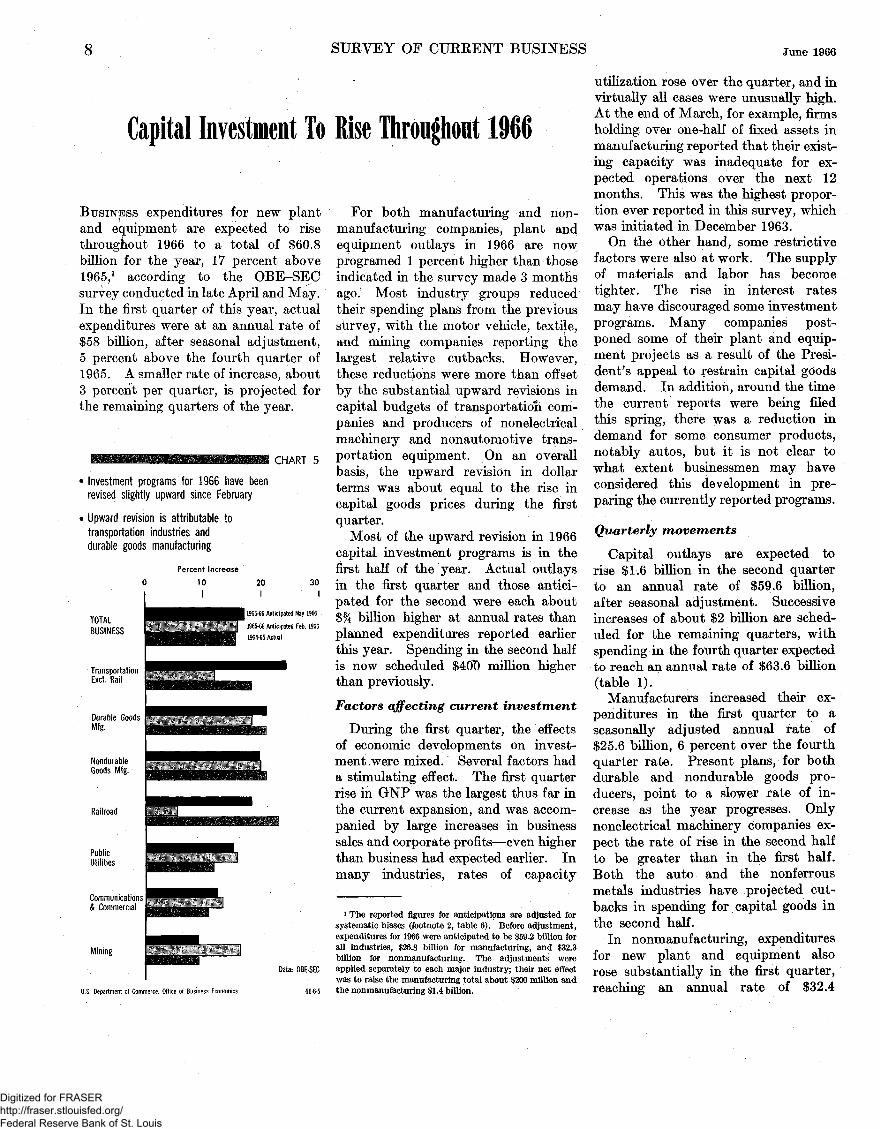
Capital Investment To Rise Throughout 1966
BUSINJESS expenditures for new plantand equipment are expected to risethroughout 1966 to a total of $60.8billion for the year, 17 percent above1965,1 according to the OBE-SECsurvey conducted in late April and May.In the first quarter of this year, actualexpenditures were at an annual rate of$58 billion, after seasonal adjustment,.5 percent above the fourth quarter of1965. A smaller rate of increase, about3 percent per quarter, is projected forthe remaining quarters of the year.
CHART 5
1 Investment programs for 1966 have beenrevised slightly upward since February
• Upward revision is attributable totransportation industries anddurable goods manufacturing
Percent Increase
10
I
30I
TOTALBUSINESS
TransportationExcl. Rail
Durable GoodsMfg.
NondurableGoods Mfg.
Railroad
PublicUtilities
Communications& Commercial
Mining
U.S. Department of Commerce. Office of Business Economics
1965-6S Anticipated May 1966
1965-66 Anticipated Feb. 1966
1964-65 Actual
For both manufacturing and non-manufacturing companies, plant andequipment outlays in 1966 are nowprogramed 1 percent higher than thoseindicated in the survey made 3 monthsago. Most industry groups reducedtheir spending plans from the previoussiirvey, with the motor vehicle, textile,and mining companies reporting thelargest relative cutbacks. However,these reductions were more than offsetby the substantial upward revisions incapital budgets of transportation com-panies and producers of nonelectricalmachinery and nonautomotive trans-portation equipment. On an overallbasis, the upward revision in dollarterms was about equal to the rise incapital goods prices during the firstquarter.
Most of the upward revision in 1966capital investment programs is in thefirst half of the year. Actual outlaysin the first quarter and those antici-pated for the second were each about$% billion higher at annual rates thanplanned expenditures reported earlierthis year. Spending in the second halfis now scheduled $40T) million higherthan previously.
Factors affecting current investment
During the first quarter, the effectsof economic developments on invest-ment .were mixed. Several factors hada stimulating effect. The first quarterrise in GNP was the largest thus far inthe current expansion, and was accom-panied by large increases in businesssales and corporate profits—even higherthan business had expected earlier. Inmany industries, rates of capacity
* The reported figures for anticipations are adjusted forsystematic biases (footnote 2, table 6). Before adjustment,expenditures for 1966 were anticipated to be $59.2 billion forall industries, $26.8 billion for manufacturing, and $32.3billion for nonmanufacturing. The adjustments wereapplied separately to each major industry; their net effectwas to raise the manufacturing total about $200 million andthe nonmanufacturing $1.4 billion.
utilization rose over the quarter, and invirtually all cases were unusually high.At the end of March, for example, firmsholding over one-half of fixed assets inmanufacturing reported that their exist-ing capacity was inadequate for ex-pected operations over the next 12months. This was the highest propor-tion ever reported in this survey, whichwas initiated in December 1963.
On the other hand, some restrictivefactors were also at work. The supplyof materials and labor has becometighter. The rise in interest ratesmay have discouraged some investmentprograms. Many companies post-poned some of their plant and equip-ment projects as a result of the Presi-dent's appeal to restrain capital goodsdemand. In addition, around the timethe current reports were being filedthis spring, there was a reduction indemand for some consumer products,notably autos, but it is not clear towhat extent businessmen may haveconsidered this development in pre-paring the currently reported programs.
Quarterly movements
Capital outlays are expected torise $1.6 billion in the second quarterto an annual rate of $59.6 billion,after seasonal adjustment. Successiveincreases of about $2 billion are sched-uled for the remaining quarters, withspending in the fourth quarter expectedto reach an annual rate of $63.6 billion(table 1).
Manufacturers increased their ex-penditures in the first quarter to aseasonally adjusted annual rate of$25.6 billion, 6 percent over the fourthquarter rate. Present plans, for bothdurable and nondurable goods pro-ducers, point to a slower rate of in-crease as the year progresses. Onlynonelectrical machinery companies ex-pect the rate of rise in the second halfto be greater than in the first half.Both the auto and the nonferrousmetals industries have projected cut-backs in spending for capital goods inthe second half.
In nonmanufacturing, expendituresfor new plant and equipment alsorose substantially in the first quarter,reaching an annual rate of $32.4
Digitized for FRASER http://fraser.stlouisfed.org/ Federal Reserve Bank of St. Louis

June 1966 SURVEY OF CUREENT BUSINESS 9
Table 1.—Plant and Equipment Expenditures 1965 and Anticipated 1966
[Billions of dollars, seasonally adjusted at annual rates]
All industries
ManufacturingDurable goodsNondurable goods _ _ _ _.
Nonmanufacturing
I
49.00
20.7510.4010.40
28.25
19
II
50.35
21.5510.8010.70
28.80
65
III
52.75
23.0011.7511.25
29.75
IV
55 35
24.1512 4511.70
31 20
I
58.00
25.6013 1512 45
32 40
19
Hi
59 60
26.6013 5513. 05
33 00
66
IIIi
61 65
27. 5514 0033 50
34 15
IV i
63 55
28.1014 3013 75
35 50
1. Anticipated.
Sources: U.S. Department of Commerce, Office of Business Economics, and Securities and Exchange Commission.
billion, after seasonal adjustment.Current plans call for a moderateincrease in the second quarter and anacceleration in the third and fourth;railroads and the commercial groupaccount for most of the expected ac-celeration in the second half of theyear. Although the quarterly patternsamong the various industry groups
CHART 6
Plant and Equipment Expenditures,Carryover, and Starts of Projects
Billion $
' ,'.DURABLE ;G0QD$.:W^
1 0 : • -Y;; '-::K-^. - ;
fEnW^
" ' * * ' ' " ' '''''* ' - "' ' ' " ' ' '
10PUBLIC UTILITIES::
! „" " " ','' ' > "'
•^'•'^/••''•v-''
4 1 2 3 4 1 2 3 4 1 2 3 4 11962 1963 1964 1965 1966
Note: Starts and expenditures are quarterly totals.All data unadjusted for seasonal variation.
U.S. Department of Commerce, Office of Business Economics
Data: OBE-SEC66-6-6
are mixed, in most cases capital out-lays in the second half of 1966 areexpected to be a little higher thanduring the first half.
Manufacturers IncreasePrograms
Although investment by manufac-turers has been rising sharply and hasadded substantially to capacity, ad-ditions thus far in the current expansionhave not kept pace with rising demand.As noted above, an increasing numberof manufacturers considered their ca-pacity inadequate to meet outputrequirements over the next few quar-ters. Investment commitments havebeen undertaken on a very large scale,and the carryover of expenditures yetto be made on projects already startedwas at a record level at the end ofMarch. However, if some allowanceis made for seasonal movements, thesurvey data for the first quarterindicate only a further small rise incarryover and a decline in starts ofnew projects. These results may implythat manufacturers foresee some easingof capacity pressures from the additionsin current investment programs.
Manufacturers are planning to spend$27 billion on new plant and equipmentthis year, one-fifth more than in 1965.This rate of increase matches the 1964-65 advance. Under current plans, out-lays of durable goods producers arescheduled to reach $13.8 billion andthose of nondurable goods producers$13.2 billion. Both totals representincreases of one-fifth—about the samerates of rise as in 1965.
Under the stimulus of strong demandfor capital goods and defense products,
the nonelectrical machinery and non-automotive transportation equipmentindustries are scheduling the largestyear-to-year increases in investmentoutlays of any industry—one-third andtwo-thirds respectively. Current plansare upward revisions over plans reportedin February. In 1965, nonelectricalmachinery producers also increasedtheir expenditures for new plant andequipment by one-third; nonautomotivetransportation equipment producers byone-fifth. Electrical machinery pro-ducers plan outlays of about one-thirdmore in 1966 than in 1965. Thisprogram is little changed from plansof 3 months earlier and shows about thesame rise as in 1965.
Expenditures by the motor vehicleindustry for the year are scheduled at$2 billion, 3 percent more than in 1965;earlier plans called for a 7-percentincrease. In each of the 2 precedingyears, spending rose about one-third.Steel, nonferrous metals, and stone,clay, and glass producers also reducedtheir anticipated outlays for new plantand equipment from February plans.For each of these groups, the projected
Table 2.—Percent Change in Plant andEquipment Expenditures; 1964-66
All industries _ _ — - - _ _ .._
Manufacturing 1
Durable goodsPrimary metals.MachineryMotor vehicles and parts __Transportation equip-
ment, except motorvehicles
Stone, clay, and glass
Nondurable goodsFood and beverageTextilePaperChemical _ _Petroleum ___
Nonmanufacturing..
Mining
Railroad .
Transportation, other thanrail..
Public utilities
Communications
Commercial and other
Actual1964-65
15i7
20.8
2d.920. 032.6s
42f2
-9.214.'9
20.716. 529.820.031.713.7
11.8
9.3
.23.1
18.4
11.7
15.0
8.8
Actual, 1965 toanticipated1966 as re-ported in
February
15.9
19.1
18.49.8
67.47.1
45.711.3
19.918.537. 128.615.715.4
13.4
16.3
5.5
12.0
15.8
13.3
May
17.0
20.4
20.98.0
78.72.7
65.26.6
19.816.029.729.914.317.5
14.3
9.2
18.2
24.3
15.1
12.4
1. Includes industries not shown separately.Sources: U.S. Department of Commerce, Office of Busi-
ness Economics, and Securities and Exchange Commission.
217-518 O-66-2
Digitized for FRASER http://fraser.stlouisfed.org/ Federal Reserve Bank of St. Louis
10 SURVEY OF CURRENT BUSINESS June 1966
1966 increase is smaller than the 1965advance.
Among nondurable goods industriesboth paper and textile companies areplanning substantial advances-—30 per-cent—in capital expenditures for 1966.Last year, textile companies also in-creased their capital spending 30 per-cent; paper companies increased theirs2 percent. Other nondurable goodsindustries are expanding their spendingmoderately—somewhat over the 20-percent average for the nondurablegoods group. For the nondurablegoods industries as a whole, 1966capital spending programs formulatedin May were about the same as 3months earlier. Petroleum, paper, andrubber companies raised their sights
somewhat while textile, chemical, andfood-beverage groups scaled theirsdown.
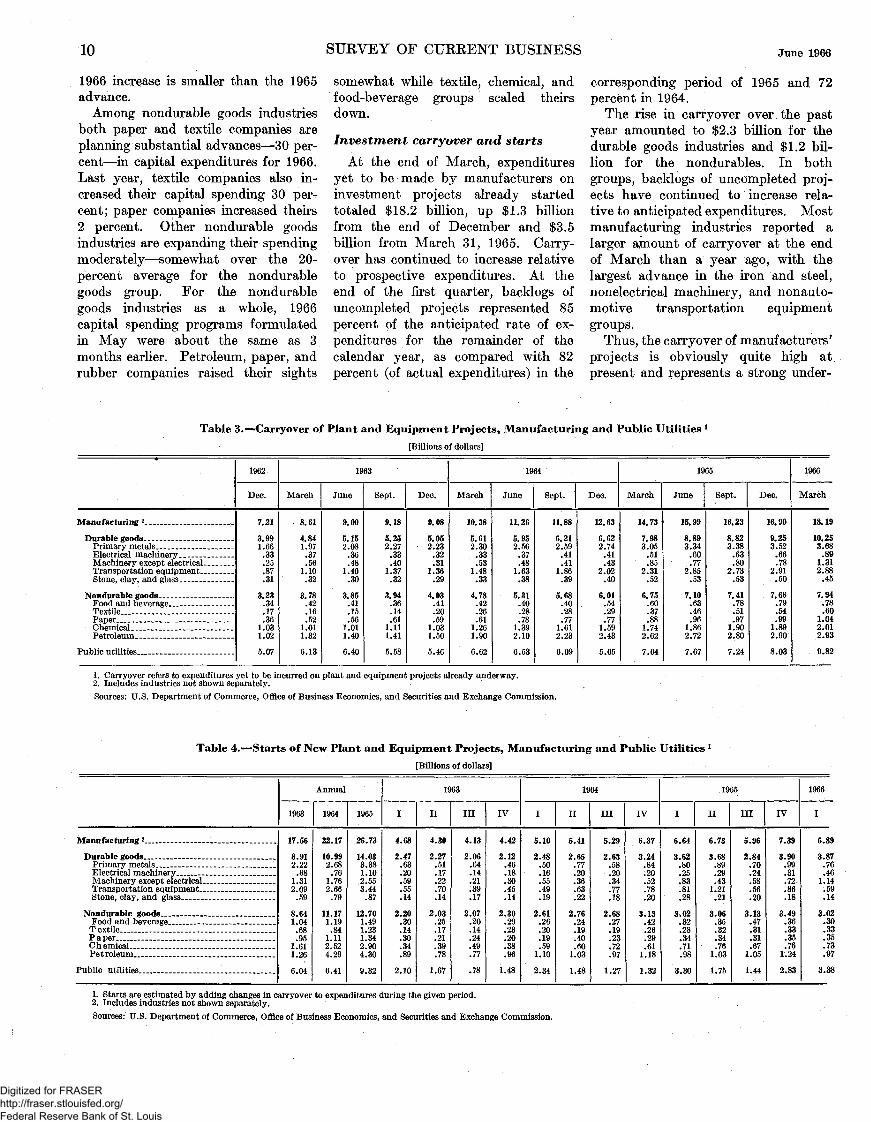
Investment carryover and starts
At the end of March, expendituresyet to be made by manufacturers oninvestment projects already startedtotaled $18.2 billion, up $1.3 billionfrom the end of December and $3.5billion from March 31, 1965. Carry-over has continued to increase relativeto prospective expenditures. At theend of the first quarter, backlogs ofuncompleted projects represented 85percent of the anticipated rate of ex-penditures for the remainder of thecalendar year, as compared with 82percent (of actual expenditures) in the
corresponding period of 1965 and 72percent in 1964.
The rise in carryover over the pastyear amounted to $2.3 billion for thedurable goods industries and $1.2 bil-lion for the nondurables. In bothgroups, backlogs of uncompleted proj-ects have continued to increase rela-tive to anticipated expenditures. Mostmanufacturing industries reported alarger amount of carryover at the endof March than a year ago, with thelargest advance in the iron and steel,nonelectrical machinery, and nonauto-motive transportation equipmentgroups.
Thus, the carryover of manufacturers'projects is obviously quite high atpresent and represents a strong under-
Table 3.—Carryover of Plant and Equipment Projects, Manufacturing and Public Utilities 1
[Billions of dollars]
Manufacturing 2
Durable goods _ _ _Primary metals ,_Electrical machinery.Machinery except electricalTransportation equipmentStone, clay, and glass _ _
Nondurable goodsFood and beverage - - - -Textile _ _ - _ ..PaperChemical _ _Petroleum
Public utilities
1962
Dec.
7.21
3. 991.66.33.25.87.31
3.23.34.17.36
1.031.02
5.07
March
8 61
4.841.97.37.56
1.10.32
3.78.42.16.52
1.011.32
6.13
19
June
9 00
5.152.08
.36
.481.40.30
3.85.41.15.56
1.011.40
6.40
63
Sept.
9 18
5.252.27.33.40
1.37.32
3.94.36.14.61
1.111.41
5.58
Dec.
9.08
5.052.23
.32
.311.36
.29
4.03.41.20.59
1.031.50
5.46
March
10 38
5.612.30.33.53
1.48.33
4.78.42.26.61
1.261.90
6.62
19
June
11.26
5.952.56.37.48
1.63.38
5.31.40.28.78
1.392.10
6.53
64
Sept.
11 88
6.212.59.41.41
1.86.39
5.68.40.28.77
1.612.23
6.09
Dec.
12 63
6.622.74.41.43
2.02.40
6.01.54.29.77
1.592.43
5.65
March
14 73
7.983.05.51.85
2.31.52
6.75.60.37.88
1.742.62
7.64
19
June
15.99
8.893.34
.60
.772.85.53
7.10.63.46.96
1.862.72
7.67
65
Sept.
16.23
8.823.38.63.80
2.73.53
7.41.78.51.97
1.902.80
7.24
Dec.
16.90
9.253.52
.66
.782.91.50
7.66.79.54.99
1.892.90
8.03
1966
March
18.19
10.253.68
.891.312.88
.45
7.94.78.60
1.042.012.93
9.82
1. Carryover refers to expenditures yet to be incurred on plant and equipment projects already underway.2. Includes industries not shown separately.Sources: U.S. Department of Commerce, Office of Business Economics, and Securities and Exchange Commission.
Table 4.—Starts of New Plant and Equipment Projects, Manufacturing and Public Utilities l
[Billions of dollars]
Manufacturing 2 _
Durable goodsPrimary metals _ _Electrical machinery _ _Machinery except electrical- _ _ _ _Transportation equipment __Stone, clay, and glass
Nondurable goodsFood and beverageT extilePaper _ _ChemicalPe t roleum
Public utilities
1963
17.56
8.912.22.68
1.312.09
.59
8.641.04.68.95
1.611.26
6.04
Annual
1964
22.17
10.992.68
.761.762.66.79
11.171.19.84
1.112.524 29
6.41
1965
26.73
14.033.381.102.553.44
.87
12.701.491.231.342.904.30
9.32
I
4.68
2.47.63.20.59.55.14
2.20.30.14.30.34.89
2.10
19
II
4.30
2.27.51.17.22.70.14
2.03.25.17.21.39.78
1.67
63
III
4.13
2.06.64.14.21.39.17
2.07.20.14.24.49.77
.78
IV
4.42
2.12.46.18.30.45.14
2.30.29.23.20.38.96
1.48
I
5.10
2.48.50.16.55.49.19
2.61.26.20.19.59
1.10
2.34
19
II
5.41
2.65.77.20.36.63.22
2.76.24.19.40.60
1 03
1.48
64
III
5.29
2 63.58.20.34.77.18
2.68.27.19.23.7297
1.27
IV
6.37
3.24.84.20.52.78.20
3.1342
.26
.29
.611 18
1.32
I
6.64
3.62.80.25.83.81.28
3.02.32.28.34.7198
3.30
19
II
6.73
3 68.89.29.43
1.21.21
3.06.35.32.34.76
1 03
1.75
35
III
5.96
2.84.70.24.58.56.20
3.13.47.31.31.67
1.05
1.44
IV
7.39
3.90.99.31.72.86.18
3.49.36.33.35.76
1.24
2.83
1966
I
6.89
3.87.76.46
1.14.59.14
3.02.30.33.35.73.97
3.38
1. Starts are estimated by adding changes in carryover to expenditures during the given period.2. Includes industries not shown separately.
Sources: U.S. Department of Commerce, Office of Business Economics, and Securities and Exchange Commission.
Digitized for FRASER http://fraser.stlouisfed.org/ Federal Reserve Bank of St. Louis

June 1966 SURVEY OF CURRENT BUSINESS 11
pinning for current investment pro-grams. However, the figures, whichare not available on a seasonally ad-justed basis, suggest that the $1.3billion increase in carryover in theopening quarter of this year was mostlyseasonal in nature. The motor vehicle,stone, clay, and glass, and food-beverageindustries actually reduced their carry-over during the first quarter, while theincrease for petroleum was probablybelow seasonal expectations. Increasesin backlogs in the machinery and otherdurable goods industries more thanoffset these reductions.
Starts of new projects by manufac-turers during the first quarter of 1966totaled $6.9 billion—up $250 millionfrom the first quarter of 1965, but $500million below the fourth quarter of lastyear. This was the smallest year-to-year and first-to-fourth-quarter risesince the series was initiated in 1963.It probably represents a decline inseasonally adjusted starts from the veryhigh fourth quarter rate. The valueof new projects undertaken during thefirst 3 months of this year was smallerthan in the first and fourth quarters of1965 in all major durable goods indus-tries except electrical and nonelectricalmachinery, where commitments fornew projects were substantially in-creased. In nondurables, the compo-nent industries reported starts in thefirst quarter equal to, or lower than,those in the fourth quarter of 1965.
Manufacturers9 evaluation of capac-ity
The latest survey indicated risingpressures on capacity. Companiesholding 51 percent of total manufactur-ing fixed assets considered their facili-ties on March 31 to be inadequate forthe next 12 months. This ratio was 3percentage points above December 1965and 9 percentage points above a yearearlier.
The rise from a year earlier in theproportion of capacity considered inade-quate was widespread among manufac-turing industries. For the durablegoods group, the figure was 52 percent,as against 42 percent at the end ofMarch 1965 and 36 percent in March1964. Both primary metal producersand metal fabricating companies re-
ported much larger increases in theinadequate proportion in the yearended March 1966 than in the yearended March 1965. In the nondurablegoods group, all the component indus-tries reported a rise in the proportionof assets considered inadequate at theend of March, as compared with a yearearlier; the percentage for the groupas a whole rose from 43 to 49. How-ever, the increases were a little smallerthan those shown from March 1964 toMarch 1965.
The proportion of assets held byfirms reporting facilities in excess ofprospective needs dropped to a low of4 percent as of March 31, with declinesfrom a year earlier general among thevarious industries. An exception wasthe primary metals industry, whichshowed no change.
Producers accounting for 45 percentof fixed assets in manufacturing feltthat their facilities were about adequatefor current and prospective needs overthe next 12 months—as compared with52 percent as of March 1965 and 58percent as of March 1964.
Nonmanufacturing Programs
Transportation companies are plan-ning to spend $5}£ billion on new plantand equipment this year. For therailroads, the planned outlays are one-fifth larger than 1965 expenditures; forother transportation companies, theyare one-fourth larger. Increases ofthese proportions would be about thesame as those realized last year.
Railroads have revised their programsupward since the survey 3 months agoand are now projecting sizable increasesin spending in each quarter. The bulkof the rise over last year's total andthe strong upward trend during 1966occur primarily in spending for equip-ment. However, more than half of theupward revision since February inplanned 1966 outlays was for roadways.
The shortage of freight cars relativeto demand continues to persist. Atthe end of March, the number of freightcars owned by railroads was about thesame as at the end of 1964 and smallerthan in the 2 preceding years—althoughthe freight cars currently being installed
Table 5.—Manufacturers' Evaluation of Their Capacity
[Percent distribution of gross capital assets] *
More plant and equipment needed
All manufacturing 2 _
Durable goodsPrimary metals __Metal fabricators 3
Nondurable goods _ ._ _Food and beverageChemical. .Petroleum. __ _ _
About adequate
All manufacturing 2
Durable goodsPrimary metals ._Metal fabricators 3
Nondurable goodsFood and beverageChemicalPetroleum
Existing plant and equipment ex-ceeds needs *
All manufacturing 2
Durable goods _ _ _Primary metalsMetal fabricators 3
Nondurable goodsFood and beverageChemicalPetroleum
1963
Dec. 31
40
38483142396133
52
49315955523867
8
132110391
(*)
Mar. 31
36
36453135296923
58
53336362643077
6
11226371
(*)•
19
June 30
38
36453040327723
56
55396457582277
6
91663
101
(*)
64
Sept. 30
39
36433241347724
56
56426456562276
5
81543
101
(*)
Dec. 31
43
41444146397928
51
51425451502072
6
81453
111
(*)
Mar. 31
42
42483943377924
52
50385654542076
6
8145391
(*)
19
June 30
47
49535145408324
47
44324650501670
6
71535
1016
65
Sept. 30
49
53536146448024
45
40333750471971
6
71424915
Dec. 31
48
50535146468323
47
44334750441673
5
61424
1014
1966
Mar. 31
51
52615149478131
45
42254748461867
4
61423712
*Less than 0.5 percent.1. According to respondent companies' characterizations of their plant and equipment facilities, taking into account their
current and prospective sales for the next 12 months.2. Includes industries not shown separately. " • • .3. Includes machinery, transportation equipment, and fabricated metals industries.Sources: U.S. Department of Commerce, Office of Business Economics, and Securities and Exchange Commission.
Digitized for FRASER http://fraser.stlouisfed.org/ Federal Reserve Bank of St. Louis

12 SURVEY OF CUKKENT BUSINESS June 1966
are larger and more efficient than thosebeing replaced.
New orders for freight cars placed bythe railroads during the first quarterwere at the highest levels in 10 yearsand totaled one-third more than in thecorresponding period of last year. Atthe end of April, backlogs were at thehighest point in 10 years, having risenby nearly one-third during the firstquarter.
In nonrail transportation, the airlinesaccount for most of the rise in invest-ment from 1965 to 1966; trucking firmsare planning to spend moderately morethis year. The airlines expect to spend
$1.8 billion—more than one and one-half times their 1965 outlays. Orderbacklogs for civilian aircraft are morethan two-fifths above those of a yearearlier.
Public utilities spent over $K billionmore (annual rates) on new plant andequipment in the first quarter thananticipated 3 months ago; both theelectric and gas portions of the industrycontributed to the upward revision.Electric utilities are projecting a risingrate of outlays throughout 1966, but gasutilities expect some tapering of pro-grams during the remainder of this year.
The carryover of uncompleted proj-
ects by utility companies rose sizablyin the first quarter of this year. Carry-over totaled a record $9.8 billion at theend of March, up $1.8 billion fromDecember 31, 1965, and $2.2 billionfrom a year earlier. Projects with atotal anticipated cost of $3.4 billionwere started during the first quarter ofthis year—up 2 percent from the corre-sponding period of 1965. The rise fromthe fourth quarter of last year to thefirst quarter was a little smaller than inthe corresponding periods of the 2previous years; this suggests that thisyear's, rise was probably seasonal innature.
Table 6.—Expenditures for New Plant and Equipment by U.S. Business,1 1964-66
[Billions of dollars]
All Industries
Manufacturingindustries
Durable goodsindustries
Primary ironand steel
Primary non-ferrous metaL . _
Electrical ma-chinery andequipment
Machinery, ex-cept electrical__ _
Motor vehiclesand parts
Transportationequipment, ex-cluding motorvehicles
Stone, clay, andglass
Other durablegoods3
Nondurable goodsindustries
Food and beverage.Textile _ _ . _ _PaperChemicalPetroleumRubberOther non-
durable goods 4 _
Mining _ _
Railroad
Transportation, otherthan rail
Public utilities
Communications
Commercial andother 5
Annual
1964
44.90
18.58
9.43
1.69
.48
.66
1.64
1.51
.48
.68
2.28
9.16
1. 06.76.94
1.973.36.27
.80
1.19
1.41
2.38
6.22
4.30
10.83
1965
51.96
22.45
11.40
1.93
168
.85
2.21
1. 98
.58
.78
2.41
11.05
1. 24.98
1.122.593.82.34
.96
1.30
1.73
2.81
6.94
4.94
11.79
1966 2
60.78
27.02
13.78
2.06
.75
1.13
2.99
2.03
.96
.83
3.04
13.24
1.441.271.462.964.49.43
1.19
1.42
2.05
3.49
7.99
Il8.80
Quarterly unadjusted
1964
I
9.40
3.79
1.93
.34
.09
.14
.33
.25
.11
.14
.51
1.87
. 24
.14
.18
.37
.70
.06
.18
.26
.32
.51
1.18
1'"I 2.37
II
11.11
4.53
2.30
.40
.11
.16
.40
.37
.12
.17
.58
2.23
. .27.18.22.47.84.06
.20
.29
.36
.63
1.58
1.10
2.61
III
11.54
4.67
2.37
.42
.13
.16
.40
.43
.11
.17
.56
2.30
272024508407
.19
.30
.37
.59
1.71
1.06
2.84
IV
12.84
5.59
2.83
.54
.15
.20
.51
.47
.14
.19
.62
2.76
.28
.25
.30
.63
.99
.08
.23
.33
.35
.64
1.76
1.17
3.01
1965
I
10.79
4.54
2.25
.36
.14
.15
.41
.43
.10
.16
.51
2.28
.25
.20
.22
.55
.79
.07
.19
.29
.39
.58
1.32
1.08
2.59
II
12.81
5.47
2.76
44
.15
.20
.51
.53
.13
.20
.60
2.70
.32
.22
.26
.64
.92
.09
.24
.33
.44
.77
1.71
1.24
2.85
III
13.41
5.73
2.91
.50
.16
.22
.55
.52
.16
.20
.60
2.82
.32
.26
.30
.63
.97
.09
.25
.32
.44
.72
1.88
1.22
3.10
IV
14.95
6.72
3.48
.62
.22
.29
.74
.50
.18
.21
.71
3.24
.34
.30
.33
.771.14.09
.28
.35
.46
.73
2.04
1.41
3.25
1966
I
12.77
5.61
2.87
.42
.18
.23
.61
.43
.18
.19
.62
2.74
.31
.27
.30
.61
.94
.08
.24
.33
.40
.75
1.60
1.26
2.83
112
15. 17
6.74
3.44
51
.19
.28
.71
.53
.23
.20
.78
3.30
.38
.30
.35
.771.09.10
.31
.36
.51
.97
1.97
I 4.62
III 2
15.66
6.84
3.46
.54
.18
.28
.74
.51
.2^
.20
.76
3.38
.37
.31
.37
.731.17.12
.31
.36
.54
.89
2.23
4.80
Quarterly, seasonally adjusted at annual rates
1964
I
42.55
17.40
8.85
1.60
.40
.70
1.45
1.25
.50
8.55
1.05.60.80
1.653.30
1.15
1.40
2.30
5.95
!4.05
10.25
II
43.50
17.80
9.00
1.60
.45
.65
1.55
1.35
.45
8.80
1.00.65.90
1.803.35
1.15
1.25
2.25
6.30
4.30
10.45
III
45. 65
18.85
9.60
1.65
.50
.65
1.75
1.65
.45
9.20
1.10.80.95
2.053.30
1.20
1.50
2.40
6.30
4.40
11.00
IV
47.75
20.15
10.15
1.90
.55
.70
1.80
1.80
.50
10.00
1.10.95
1.052.253.50
1.30
1.55
2.60
6.35
4.40
11.40
1965
I
49.00
20.75
10.40
1.70
.60
.70
1.80
2.10
.45
10.40
1.10.85
1.052.503.70
1.25
1.75
2.55
6.80
4.55
11.30
II
50.35
21.55
10.80
1.80
.60
.80
2.00
1.95
.55
10.70
1.20.85
1.052.503.75
1.30
1.55
2.70
6.85
4.80
11.60
III
52.75
23.00
11.75
1.95
.65
.90
2.35
2.00
.65
11.25
1.251.051.202.603.80
1.25
1.70
3.00
6.75
5.05
11.95
IV
55.35
24.15
12.45
2.20
.80
.95
2.60
1.90
.60
11.70
1.351.101.202.704.00
1.35
1.95
3.00
7.30
5.30
12.25
1966
I
58.00
25.60
13. 15
2.00
.80
1.10
2.70
2.10
.85
12.45
1.351.201.352.754.40
1.40
1.75
3.30
8.25
5.35
12.35
112
59.60
26.60
13.55
2.05
.80
1.15
2.80
2.00
.95
13.05
1.451.151.403.054.40
1.40
1.85
3.40
7.80
18. 5C
III 2
61.65
27.55
14.00
2.10
.70
1.15
3.15
1.95
1.00
13.50
1.451.251.453.004.60
1.40
2.10
3.65
8.10
18.85
1. Data exclude expenditures of agricultural business and outlays charged to current account.2. Estimates are based on anticipated capital expenditures reported by business in late April and May 1966. The estimates for the second and third quarters of 1966 have been adjusted
when necessary for systematic tendencies in anticipatory data. The adjustment for each industry and time period is based on the median ratio of actual to anticipated expenditures for the past5 years. However, no adjustment is made unless the anticipations have shown a bias in the same direction in at least 4 of the last 5 years and in at least two-thirds of all years since 1956.
3. Includes fabricated metal, lumber, furniture, instrument, ordnance, and miscellaneous industries.4. Includes apparel, tobacco, leather, and printing-publishing.5. Includes trade, service, finance, and construction.
NOTE.—Details may not ad<i to totals due to rounding. Data for earlier years were published in the June 1956,.March 1958,1960,1961,1962,1963,1964,1965, and 1966 issues of the SURVEYOF CURRENT BUSINESS.
Sources: U.S. Department of Commerce, Office of Business Economics, and Securities and Exchange Commission.
Digitized for FRASER http://fraser.stlouisfed.org/ Federal Reserve Bank of St. Louis

June 1966
The communications and commercialsectors scaled down their 1966 capitalspending programs between the Feb-ruary and May surveys. Actual ex-penditures in the first quarter—at$17.7 billion—were $% billion less thananticipated earlier this year. Outlaysare expected to rise in the succeedingquarters of 1966 but at slightly lowerrates than previously scheduled.
SURVEY OF CURRENT BUSINESS
Both the communications and thecommercial groups are expecting ex-penditures to be about one-eighthhigher than in 1965. If realized, theseincreases would be about the same aslast year for communications but some-what larger for commercial companies.Within the commercial group, whole-sale and service firms anticipate thelargest year-to-year increases.
Manufacturers' Inventory and Sales Expectations-Second and Third Quarters 1966
CHART 7
Manufacturers Expect:• Sales gains at more moderate rates in second
and third quarters• Inventory accumulation to continue• Stock-sales ratios in September to be little
different from year earlier
IstQtr. 1961=100i/
180DURABLE GOODS MANUFACTURERS
80Ratio
I I I
Inventory-Sales Ratio
1 1 I 1 1 I I II
1961 62 63 64Seasonally Adjusted
• Expectations1. Trough for sales2. Sales, quarterly total; inventories, end of quarter
I). S. Department of Commerce, Office of Business Economics
66
66-6-7
MANUFACTURERS expect more moderatesales increases in the spring and summerquarters than they experienced in 1965and early 1966. They expect inventoryadditions to ease slightly in the secondquarter and then return to the highaccumulation rate that has prevailedsince mid-1965. These projections im-ply that stocks would be maintainedthrough September at 1.6 months ofsales, a ratio that has changed littlesince early 1965. Manufacturers' eval-uations of their inventory conditionhave also been stable from March 1965to March 1966. During this period,manufacturers holding approximatelyfour-fifths of producers' stocks con-sidered them "about right"; producersholding 15 to 16 percent of stocks con-sidered them "high"; and holders ofonly 3 to 4 percent of stocks consideredthem "low."
These findings are based on reportsfiled in May by manufacturers inOBE's quarterly expectations survey.
Modest sales gains projected
Durable goods producers expect salesto rise almost 1 percent from the first tothe second quarter and somewhat under2 percent from the second to the third,after seasonal adjustment. These in-creases follow sales gains of 4K percentin the first quarter of 1966 and 2 percentin the fourth quarter of 1965. Indus-tries that supply capital goods anddefense products expect continuingsubstantial increases in shipments, butthe motor vehicles industry anticipatessome easing from the high first quarterrate.
13
Sales gains projected by nondurablegoods producers about match those ofthe durable goods producers. A rise ofabout 1 percent is expected in the sec-ond quarter and a rise of slightly under1% percent in the third. These are nottoo different from the increases in thesecond half of last year but are muchsmaller than the 3% percent gainachieved in the first quarter of 1966.
Manufacturers' sales totaled $129.5billion in the first quarter and are ex-pected to reach $132.4 billion in thethird, with durable goods producersprojecting sales of $69.6 billion andnondurable goods producers projectingsales of $62.8 billion.
Inventory expansion continues
Durable goods producers plan to add$950 million to their stocks in the cur-rent quarter; this would match the in-ventory rise of the first quarter. Forthe third quarter, they are currentlyplanning additions of $1K billion—
CHART 8
Condition of Manufacturers' InventoriesPercent of inventories judged "high"declined for metal producers, butrose elsewhere
Percent of Inventories
30
1961 63 64
End of Quarter
merce. Office of Business Economics
65 66
Digitized for FRASER http://fraser.stlouisfed.org/ Federal Reserve Bank of St. Louis

14 SUEVEY OF CURRENT BUSINESS June 1966
equal to the peak accumulation rates ofthe current expansion. The machineryand aircraft industries expect sizableadditions to stocks in this period.
The book value of durable goodsproducers' stocks was $43.3 billion onMarch 31 and is expected to rise to$45K billion by September 30, after
seasonal adjustment. If these salesand inventory expectations eventuate,the stock-sales ratio, which was 1.94 inSeptember 1965 and 1.91 this March,will rise to about 1.95 in September.
Nondurable goods producers expectto add $300 million to their inventoriesin both the second and the third
Table 1.—Manufacturers' Inventories and Sales: Actual and Anticipated
\ [Billions of dollars]
Inventories, end of quarter
Unadjusted:
All manufacturingDurablesNondurables
Seasonally adjusted:
All manufacturingDurablesNondurables . _ _ _ _ _ • _ _
Sales, total for quarter
Unadjusted:
All manufacturingDurablesNondurables _
Seasonally adjusted:
All manufacturingDurables _ _ _ _Nondurables
I
60.736.424.3
60 336.124.2
108.056.351.7
109.157.152.1
i 19(
II
60.736.823.9
60 436.523.9
114.260.653.6
111.157.553.6
)4
III
60.736.923.8
61 037.024.0
109.655.454.3
112.458.354.1
IV
62.638.024.6
62 938.424.5
113.758.655.2
113.658.555.2
I
64.139.324.8
63 739.024.7
117.061.555.5
117.962.155.8
19
II
65.040.324.7
64 640.024.7
123. 365.457.9
119.862.157.7
35
III
65.941.124.8
66 341.325.0
118.560.258.3
122. 163.958.2
IV
67.641.825.8
68 042.325.7
124.665.159.4
124.665.159.5
I
70.043.626. 5
69.643.326.4
128.867.661.1
129.568.061.5
1966
II i
71.344.626.7
70 944.226.7
134. 372.162.2
130.468.462.0
III i
72.145.326.8
72.545.527.0
128.465.562.9
132.469.662.8
1. Anticipations reported by manufacturers in May 1966. Inventories have been corrected for systematic tendencies inanticipatory data.
Source: U.S. Department of Commerce: Anticipations, Office of Business Economics; actuals, Bureau of the Census.
Table 2.—-Manufacturers' Evaluation of the Condition of Their Inventories l
[Percent distribution]
March 31, 1961-June 30, 1961September 30, 1961 _December 31, 1961
March 31, 1962 _ _ _June 30, 1962September 30, 1962. __ _ _ _December 31, 1962
March 31, 1963_June 30, 1963.. • _ _September 30, 1963___ _ _ _December 31, 1963
March 31, 1964June 30, 1964 .September 30, 1964 _December 31, 1964
March 31, 1965June 30, 1965. _September 30, 1965 _December 31, 1965
March 31, 1966 _
Total
High
18141010
14141514
15151713
16131413
16161615
15
Aboutright
81858888
84848384
82838185
82848284
81808182
81
Low
1122
2222
3222
2343
3433
4
Durables
High
20151110
19171817
17181914
17161515
20202219
18
Aboutright
79848788
80828182
81. 80
8084
8181.8182
77777678
79
Low
1122
1111
2212
2343
3323
3
Nondurables
High
161399
89
1111
12101410
149
119
91088
10
Aboutright
83858889
89898686
85888387
84888487
87858888
85
Low
1232
3233
3233
2354
4544
5
1. Condition of actual inventories relative to sales and unfilled orders position as viewed by reporting companies. Percentdistribution of inventory book values according to company's classification of inventory condition.
Source: U.S. Department of Commerce, Office of Business Economics.
quarters. Their anticipated additionsare below actual additions in each ofthe two previous quarters, which wereat the very high rate of $700 million.However, the projected increases arenot much different from the averagequarterly accumulation rates of 1965.Chemicals and, to a lesser extent,rubber and textile companies accountfor most of the expected rise fromMarch to September.
Nondurable goods producers' stocksare anticipated at $27 billion in Septem-ber, as compared with $26,4 billion inMarch. These levels and the salesexpectations imply maintenance of thestock-sales ratio at 1.3 months of sales.
Inventory condition, end of March
Manufacturers7 evaluation of theirinventory condition relative to theirsales and unfilled orders showed onlyminor shifts from December 31, 1965,to March 31, 1966. For both dates,companies holding 15 percent of totalinventories judged their inventories as"high." This ratio has ranged from 13to 17 percent during the past 4 years.
Producers holding 18 percent ofdurable goods stocks considered theirinventories "high" on March 31—down1 percentage point from December 31,1965, and 2 points from a year earlier.The "about right" group held 79 per-cent of inventories on March 31, 1966,and the "low" group 3 percent.
The "high" proportion for primarymetals producers fell from 9 percent inDecember to 6 percent in March andwas close to the lowest point for thecurrent expansion period. Metal fab-ricators classifying stocks as "high"reported a ratio of 20 in March—up1 point from December, with motorvehicles and fabricated metals pro--ducers accounting for the rise.
The "high" ratio for nondurablegoods producers rose from 8 percent inDecember to 10 percent in March,with the rise widespread among theindustries. The "about right" cate-gory held 85 percent of soft goodsstocks, and the "low" category 5 per-cent.
Digitized for FRASER http://fraser.stlouisfed.org/ Federal Reserve Bank of St. Louis

by ETIENNE H. MILLER
Foreign Travel Payments Continue To Rise in 1965
LORE U.S. residents than ever be-fore traveled abroad last year, spendinga record $3.1 billion in foreign countriesand for transportation on foreign trans-ocean steamships and airlines (table 1).These combined expenditures were 10percent more than in 1964, a rate ofincrease slightly higher than the aver-age during the last 10 years.
About $1.1 billion of the total wasspent in the neighboring countries ofCanada and Mexico, about $1.3 billionin oversea areas, and $0.7 billion forfares on foreign carriers (table 2). Thetotal does not include the $0.6 billionpaid to U.S. airlines and steamship
CHART 9
Expenditures of U.S. Residentsfor Foreign Travel Reached $3.7 Billionin 1965
1.0
1953 55 57 59 61 63 65U.S. Department of Commerce, Office of Business Economics 66-6-9
companies for transocean transporta-tion.
Although the number of travelers tooversea areas rose 18 percent from 1964to 1965 (table 3), a decline in averageexpenditure per traveler (excludingtransocean fares) limited the increasein total expenditures overseas to 11percent. The decline in average ex-penditures was the result of a largeincrease in the number of trips to thenearby Caribbean area and a shorteningof the average trips to Europe and theMediterranean.
Receipts from foreign visitors to theUnited States, including fares paid toU.S. transocean carriers, were nearly$1.4 billion in 1965, 10.6 percent morethan in 1964 (table 7). Canadian ex-penditures in the United States reacheda new high of $490 million. Receiptsfrom Mexico were $265 million, a riseof $15 million from the year before.Oversea visitors spent about $460 mil-lion in the United States, 15 percentmore than last year, and paid $165million to U.S. sea and air carriers.
The balance on travel expenditureswas about $1,740 million in 1965, ascompared with $1,600 million in 1964.This balance measures the differencebetween U.S. travel expendituresabroad (including U.S. fare paymentsto foreign carriers) and U.S. receiptsfrom foreign visitors (including receiptsby U.S. carriers of fares paid by foreignvisitors). These figures do not takeinto consideration the expenditures ofU.S. carriers abroad or those of foreigncarriers in the United States (includingthe share of their purchases of airplanesthat may be attributed to the transpor-tation of U.S. travelers abroad).Neither does the balance take intoaccount the fact that these funds—aswell as any funds obtained from other
U.S. transactions—add to the abilityof foreign countries to finance theirexpenditures or other obligations in theUnited States. Canada, Mexico, andother nearby countries in particularspend a relatively large part of theirforeign exchange income in the UnitedStates.
U.S. travel spending by region
In Europe and the Mediterranean,average expenditures continued theirdownward trend in 1965, but once morethe increase in the number of travelerswas large enough to raise total spending.Average expenditures of U.S. travelersin the area were $611 last year, downfrom $637 in 1964 (table 4). Thenumber of Americans visiting the area
Table 1.—Expenditures for Foreign Travel,by U.S. Residents
[Millions of doUars]
1929 ... _ _
1937
1947
1955195619571958
1959196019611962
19631964___1965
Total
688
470
716
1,6121,8141, 9552,140
2,3802, 5972,6002,875
3,1953,3663,730
Payments to foreigncountries
Total
647
443
628
1,3541,5131,6331,780
1,9902,2372,2422,460
2,7052,8463,120
Ex-pendi-
tures inforeign,coun-tries
483
348
573
,153,275,372,460
,610,732,735
1,885
2,0902,2012,400
Faresto
foreigncarriers
164
95
55
201238261320
380*505507575
615645720
Farespaid to
U.S.carriers
41
27
88
258301322360
390*360358415
490520610
* Begins new series.
NOTE.—Excludes travel by military personnel and otherGovernment employees stationed abroad and by their de-pendents and U.S. citizens residing abroad; includes shoreexpenditures of cruise travelers; passenger fares exclude farespaid by emigrant aliens.
Source: U.S. Department of Commerce, Office of BusinessEconomics.
15
Digitized for FRASER http://fraser.stlouisfed.org/ Federal Reserve Bank of St. Louis

16 SURVEY OF CUEEENT BUSINESS June 1966
rose from 1,250,000 in 1964 to 1,400,000,a 12-percent increase. Thus, total U.S.travel expenditures in the area were$865 million, 8 percent more than the$800 million spent in 1964.
The number of visitors increased lastyear in all European and Mediterra-nean countries except Ireland. How-ever, half of these countries showed adecrease or no change in their receiptsfrom U.S. travelers (table 5). InFrance, Austria, and Switzerland, thenumber of visitors did not increaseenough to offset lower average outlays,and U.S. travel spending fell. Expend-itures were the same as in 1964 for
Table 2.—Expenditures for Foreign Travel,by U.S. Residents, 1961-65
[Millions of dollars]
Total
Transportation
Foreign-flag carriersU.S.-flag carriers. ___
Expenditures abroad.
CanadaMexico. _ - _ _
Persons visitingMexican borderonly _ - _ _ .
Oversea areas
Europe and Medi-terranean
United Kingdom....France-.-ItalySwitzerland
GermanyAustriaDenmarkSweden
NorwayNetherlandsBelgium-Luxem-
bourgSpain. _
Portugal _.Ireland.. ._IsraelGreece _
West Indies andCentral America
Bermuda.. _.BahamasJamaicaOther British West
Indies...-Netherlands West
Indies
South America
Other oversea areas
JapanHong Kong. _ _Australia-New
ZealandOther
1961
2,600
865
507358
1,735
425370
254
940
618
10510311046
62241913
1217
924
n.a.121916
160
314530
18
11
48
114
4624
1133
1962
2,875
990
575415
1,885
479395
280
1,011
652
11311311844
64211811
1117
928
n.a.152217
178
304838
18
10
55
126
5023
1241
1963
3,195
1, 105
615490
2,090
522448
322
1,120
755
11912413855
75242113
1321
938
n.a.162526
180
324840
19
10
56
129
5224
1340
1964'
3,366
1,165
645520
2,201
550480
340
1, 171
800
13012714856
79292314
1522
1147
n.a.202526
190
335545
20
12
57
124
5425
1431
1965
3,730
1,330
720610
2,400
600502
342
1,298
864
14212515253
79272314
1624
1351
17203131
220
356252
22
14
68
146
6028
1543
'Revised. n.a.—Not available.NOTE.—For coverage, see table 1.Source: U.S. Department of Commerce, Office of Business
Economics.
Germany, Sweden, and Denmark,where reduced per capita spendingoffset the increase in visitors, and forIreland, where average spending rose.Israel, Greece, and Belgium-Luxem-bourg registered the largest gains, from18 to 24 percent in U.S. travel receipts.
Americans spent more money fortravel in Canada than in any othercountry last year. A 9-percent risebrought the total spent in that countryto $600 million. U.S. visitors to Mex-ico spent $500 million, about 5 percentover the 1964 figure of $480 million.
In the West Indies and Caribbeanregion, the number of U.S. travelersrose 27 percent to 890,000 last year.Together with cruise travelers (who arenot included in the total number ofvisitors), they spent a record $220million in the region. As in 1964, thechange in the number of travelers waslargest in Jamaica, where the increasewas considerably more than the areaaverage, and in the Bahamas. Dollarexpenditures, however, rose less sharply,with Jamaica and the Bahamas gaining16 percent and 13 percent respectively.
The rising trend of U.S. travel toother oversea areas reasserted itselflast year after leveling off in 1964.Dollar receipts from U.S. travelers wereup 18 percent to $145 million althoughaverage per capita spending was loweronce again. An increase of 23 per-cent brought the number of U.S. travel-ers to other oversea areas to 200,000.More than three-quarters of all travel-ers to the Pacific area visited Japan,and about half visited Hong Kong.Japan and Hong Kong earned $60 mil-lion and $18 million respectively fromU.S. travelers in 1965.
Average European trip costs reducedlast year
U.S. travelers spent an average of$1,120 for a trip to Europe last year,about $40 less per person than in 1964and a continuation of the downwardtrend evident since 1956. Transatlan-tic fares accounted for a slightly higherproportion of the total trip cost, 46percent, as compared with 45 percentin 1964. Fares averaged $510 per U.S.traveler, only 2 percent below the 1964
r™"-£—• HART 10
Average Expenditures of U.S. Travelersin the European and Mediterranean Area
Dollars
1,100
1,000
900
800
700
600
Sea Travel
=Air Travel
son (
1953 55 57 59 61 63 65
* New series
Note: Excludes transocean transportation
U.S. Department of Commerce, Office of Business Economics 66-6-10
average of $520. Air fares were downvery slightly from $490 to $488, butsea fares rose by $5 to $665.
The length of stay of the averageU.S. traveler was 39 days, 2 days lessthan in 1964 (table 6). One reason for
Table 3.—U.S. Travelers to Oversea Coun-tries, by Means of Transportation
[Thousands of travelers]
Total
SeaAir
Europe and Mediterra-nean__ _ _ _. _
Sea .Air
West Indies and CentralAmerica
Sea..Air
South America. ..
Sea _Air
Other
Sea _ . - - -Air
1961
1,575
2681 307
826
206620
550
37513
83
1073
116
15101
1962
1, 767
2801 487
931
221710
609
33576
85
877
142
18124
1963
1,990
3181,672
1,102
254848
634
41590
97
592
160
18142
1964
2,220
2771 943
1,250
2231,027
701
35666
107
5102
162
14148
1965
2,620
2372 386
1,405
1841,221
890
37854
127
4123
200
12188
NOTE.—For coverage, see table 1; also excludes cruisetravelers, who numbered about 212,000 in 1961, 266,000 in1962, and 322,000 in 1963, 295,000 in 1964, and 300,000 in 1965.
Source: U.S. Department of Commerce, Office of BusinessEconomics, based on data of U.S. Department of Justice,Immigration and Naturalization Service.
Digitized for FRASER http://fraser.stlouisfed.org/ Federal Reserve Bank of St. Louis

June 1966 SURVEY OF CUKEENT BUSINESS 17
the shorter stay was the continuedavailability of lower transocean faresfor 14- to 21-day trips. The shorterlength of stay contributed to the con-tinuation of the decline in average out-
Table 4.—Numbers and Expenditures ofU.S. Residents Traveling in Europe andthe Mediterranean Area, Selected Coun-tries, 1964-65
Europe and Mediterranean :1965_1964r
Sea:1965IQQfr __
Air:19651964r
United Kingdom:1965 _ .1964 _ _ _ _ —
France:1965 _ _ _1964
Italy:19651964 _ _
Switzerland:1965 —1964
Germany:1965 _1964
Austria:19651964 -
Denmark:1965 __ _1964
Sweden:1965 „ _ _ _1964
Norway:19651964
Belgium-Luxembourg :19651964 ..
Netherlands:19651964
Spain:1965--1964
Portugal:19651964
Ireland:19651964.
Israel:19651964
Greece:19651964
Numberof travel-
ers(000)
1,4051,250
184223
1,2211,027
668620
671634
584548
426402
490473
262256
193189
109104
9788
204181
292275
242215
142n.a.
105114
10984
131109
Total ex-pendi-tures
(Milliondollars)
864800
166195
698605
142130
125127
152148
5356
7979
2729
2323
1414
1615
1311
2422
5147
17n.a.
2020
3125
3126
Averageexpendi-
tures(Dollars)
611637
875857
571589
213210
186200
257268
123139
162167
101116
118122
127125
160170
6261
8380
211219
122n.a.
185175
285286
235238
••—Revised.n.a.—Not available.
NOTE.—For coverage see table 1: includes expenditures butnot the number nor the average expenditures of cruise trav-elers.
A breakdown of the data in this table between U.S.-bornand foreign-born travelers is available upon request from theBalance of Payments Division.
Source: U.S. Department of Commerce, Office of BusinessEconpmics, based on data of U.S. Department of Justice,Immigration and Naturalization Service.
217-518 O-66-3
lays for travel within Europe and theMediterranean area. Lodging, food,transportation within Europe, personalpurchases, and other expenses cost theaverage U.S. traveler $611 during hisvisit in Europe last year, about 4 per-cent less than in 1964. Per capita dailyexpenditures were not significantly dif-ferent from the previous year's.
Average expenses of sea travelers toEurope, at $875, were 2 percent higherlast year, but those of air travelers, at$570, were 3 percent lower. Sea trav-elers tend to stay abroad for longerperiods and spend more per trip but lessper day than air travelers. Part of theexplanation for this phenomenon is thatmany of the sea travelers are foreign-born Americans who return to theirnative lands for extended periods; the
Table 5.—Percent Change in Total andAverage Expenditures of U.S. ResidentsTraveling in Europe and the Mediter-ranean Area, 1964-65
Europe and Mediterranean
Sea . .Air
United KingdomFranceItalySwitzerland . __ _
•GermanyAustriaDenmarkSweden
NorwayBelgium-LuxembourgNetherlands —Spain
Ireland _. . . ..-_ ..Israel _ . __ .Greece
Totalexpendi-
tures
8
—1515
9—2
3—5
o—7
00
71899
02419
Averageexpendi-
tures
—5
0—3
1—7-4
-12
—3-13-3
2
—624
-4
60
Source: U.S. Department of Commerce, Office of BusinessEconomics.
Table 6.—Average Length of Stay of U.S.Travelers in Europe and the Mediter-ranean Area, 1963-65
(Days)
All travelers, total
Sea _— _ _Air
U.S. -born travelers, total-
SeaAir
Foreign-born travelers, total
SeaAir
1963
45
6738
44
5536
55
8842
1964
41
6736
39
5935
49
8041
1965
39
7034
36
6332
49
8442
hospitality of their friends and relativesmay reduce their average daily outlays.
U.S. oversea travelers pass 2^/2 millionmark
The number of U.S. residents trav-eling overseas in 1965 increased 18 per-cent to 2,620,000, as compared with the1964 increase of about 12 percent. Arise of almost one-fourth in the numberof air travelers brought their total to
(Continued on page 43)
Table 7.—U.S. Receipts From Foreign Visi-tors for Travel in the United States andPayments to U.S. Transocean Carriers,1961-65
[Millions of dollars]
Total U.S. receipts from'foreign visitors
Fares to U.S. carriers1 ._.Spent by visitors in the
United States
CanadaMexico
Total overseacountries. -
Europe andMediterranean. _
United Kingdom..
West Indies,Central andSouth America
Other overseacountries. ._ ..
Japan
1961
995
110
885
449200
236
9330
90
5313
1962
991
113
878
392217
269
10537
110
5412
1963
1,052
118
934
372232
330
11340
147
7020
1964
1,245
150
1,095
448250
397
16055
157
8025
1965
1,377
165
1,212
490265
457
18462
184
8926
1. Includes fares paid as part of a visit to and from theUnited States only.
NOTE.—Includes expenditures of travelers for businessand pleasure, foreigners in transit through the United States,and students; excludes expenditures by foreign governmentpersonnel and foreign businessmen employed in the UnitedStates.
Source: U.S. Department of Commerce, Office of BusinessEconomics.
Table 8.—Foreign Visitors to the UnitedStates From Oversea Countries, 1964-65
[Thousands of travelers]
Oversea countries total:19651964
Europe and Mediter-ranean:
19651964
West Indies, Centraland South America:
19651964
Other oversea areas:19651964
To-tal
1,2041,098
584527
450414
170157
Busi-ness
176150
11293
2521
3936
Pleas-ure
864807
400376
375346
8985
Tran-sit
130110
6654
3735
2721
Stu-dent
3431
64
1312
1515
NOTE.—For coverage, see table 1; also excludes cruisetravelers.
Source: U.S. Department of Commerce, Office of BusinessEconomics.
NOTE.—Excludes visitors from Canada and Mexico;excludes foreign government personnel and foreign busi-nessmen employed in the United States.
Source: U.S. Department of Justice, Immigration andNaturalization Service.
Digitized for FRASER http://fraser.stlouisfed.org/ Federal Reserve Bank of St. Louis
by WALTHER LEDERER, SAMUEL PIZER, and EVELYN M. PARRISH
The U.S. Balance of International Payments: First Quarter 1966
J.HE balance of the internationalpayments of the United States meas-ured on the liquidity basis—i.e., bychanges in U.S. official reserve assetsand in U.S. liabilities to all foreignresidents—was adverse by nearly $80million in the first quarter of 1966.Seasonal factors had a strong favorableinfluence on the balance, and adjust-ment for them raises the adversebalance by about $485 million.
The seasonally adjusted balance of$563 million was more adverse than thebalance of about $350 million duringthe fourth quarter of last year and theaverage quarterly balance of $340 mil-lion for 1965 as a whole. However, itwas more favorable than the adversebalance of nearly $700 million in thefirst quarter of last year.
The balance measured on the basisof official reserve transactions—con-sisting of changes in U.S. official reserveassets and in liquid and certain non-liquid liabilities to foreign central banksand other official organizations—wasadverse by about $245 million, afterseasonal adjustment. This was a verysubstantial improvement over the ad-verse balance of $1.2 billion in the lastquarter of 1965, and it also comparesfavorably with the average quarterlybalance of $325 million for 1965 as awhole.
The principal difference between thetwo balances in the first quarter ofthis year was that after seasonal ad-justment liquid liabilities to foreignprivate residents increased while thoseto foreign official organizations declined.In the preceding quarter, these liabil-ities shifted in opposite directions.
U.S. official reserves declined duringthe first quarter by $424 million, ascompared with $271 million in thepreceding quarter. Gold holdings fellby $68 million, convertible currencyholdings by $222 million, and the U.S.
18
gold tranche position in the Interna-tional Monetary Fund by $134 million.Net gold sales were less than in thepreceding quarter, but the decline innet sales was facilitated by a purchaseof $100 million from Canada.
Chart 11 shows the relationshipbetween the two measures of thebalance and the changes in reserveassets since 1960.
Summary of MajorDevelopments
The major developments thataffected the international transactionsof the United States in the secondhalf of last year seem to have con-tinued during the first quarter.
Effects of U.S. business activity
The rapid expansion in domesticbusiness activity and incomes con-tributed to the continuing sharp risein merchandise imports and certainservice expenditures. Merchandise im-ports reached a seasonally adjustedannual rate of $24 billion in the firstquarter as compared with $22.7 billionin the second half of 1965 and $21.5billion for 1965 as a whole. DuringMarch and April, they even exceededa $25 billion rate.
The domestic business expansionalso increased domestic capital require-ments relative to funds available forinvestments and thus contributed to afurther tightening of the domesticmoney and capital markets. Althoughthe effects of these developments onthe balance of payments cannot beseparated from those of the variousGovernment programs to restrain capi-tal outflows, it is reasonable to assumethat they-reinforced each other inachieving that result.
After taking account of $185 millionborrowed abroad by U.S. corporationsto finance their foreign investments,
The tabular presentation of theU.S. balance of payments hasbeen reorganized. In this work,the Office of Business Economicshas benefited from the advice ofthe Review Committee on Bal-ance of Payments Statistics, theSubcommittee on Economic Sta-tistics of the Joint EconomicCommittee of the Congress of theUnited States, the Executive Com-mittee of the Cabinet Committeeon Balance of Payments, and theTechnical Committee on Balanceof Payments Statistics chaired bythe U.S. Bureau of the Budget.Professor Peter Kenen of Colum-bia University served as consult-ant to the Technical Committee.
To provide comparable backdata for an extensive period,annual figures on the internationaltransactions of the United Statesare presented in the new formatback to 1946 in table 1. Thearea breakdown that used to bepart of this table is now shownseparately in table 8 for yearsbeginning with 1960.
As part of the regular June re-visions, seasonal adjustments ofthe quarterly data have been re-computed by extending through1965 the period on which theseadjustments are based. The re-vised seasonally adjusted data arepresented for the years 1960 to1965 in table 2. This table corre-sponds in format to table 1, whichcontains the data prior to seasonaladjustment. Other statistical re-visions of data presented in earlierissues of the SURVEY are, with afew exceptions, limited to 1965.
Digitized for FRASER http://fraser.stlouisfed.org/ Federal Reserve Bank of St. Louis

June 1966 SURVEY OF CURRENT BUSINESS 19
the net outflow of U.S. private capitalduring the first quarter was at anannual rate of $2.8 billion, about thesame as during the previous quarter,but about half of the average annualrate during 1964 or the first quarter of1965. The outflows in the last quarterof 1965 and the first quarter of thisyear were affected by the postponementfrom the former to the latter period ofnew issues of Canadian securities inU.S. markets. If the data on capitalflows are adjusted by shifting about$110 million—representing these post-poned transactions less offsetting re-purchases of Canadian securities by theCanadian Government-—back to thefourth quarter of last year, those forthe first quarter would indicate anannual rate of outflow of only $2.4billion. Thus, the decline in net capitaloutflows that took place during 1965would appear to have continued throughthe first 3 months of this year.
The low rate of outflows was duemainly to a decline from last year inforeign investments by U.S. corpora-tions and to continued liquidations offoreign assets reported by U.S. banks.
However, the favorable effects thatthe decline in capital outflows had onthe balance of payments were partlyoffset by a further increase in interest
U.S. Balance of International PaymentsBillion $
5 . \. .- • •• ' . ' ;
payments to foreigners resulting fromthe rise in domestic interest rates,particularly on money market assets.
The tight money market in the UnitedStates may also have affected the dis-tribution of liquid dollar liabilities onthe books of U.S. banks between thoseattributed to foreign official organiza-tions and those attributed to foreigncommercial banks and other foreignprivate accounts. Part of the increasein foreign private accounts may repre-sent dollar funds that otherwise wouldhave been sold to foreign official organi-zations. Another part may representan increase in dollar funds depositedby foreign official organizations inforeign commercial banks (including for-eign branches of U.S. banks), whichwould then become iJie holders of thesedeposits in U.S. bants. However, thereare also many other factors that affectthe distribution of foreign holdings ofliquid dollar assets, such as official inter-ventions in the forward exchange mar-kets, frequently involving very largeamounts, and changes in confidence inthe ability of foreign countries to main-tain the exchange value and the freeconvertibility of their currency. Ex-perience in recent periods has shownthat changes in liquid dollar holdingsby foreign commercial banks and other
private residents can vary sharply fromquarter to quarter.
The rise of interest rates in the UnitedStates was followed by a rise in discountrates by the central banks of several ofthe major foreign countries during thesecond quarter. This would tend, toreverse the direction of the first quarterchanges in the distribution of foreignliquid dollar assets between official andprivate accounts,
Effects of foreign business develop-ments
Changes in foreign business activityaffect primarily U.S. merchandise ex-ports and income from direct invest-ments abroad; they probably affect U.S.imports and capital outflows also, butto a lesser extent.
As compared with the earlier yearsof the 1960's, the rise in businessactivity during most of 1965 in theindustrially advanced foreign countriesother than Canada was relatively slow,but it accelerated in some of thesecountries in the latter part of the yearand in the first quarter of this year.
Merchandise exports generally re-flected these changes. During the firstquarter, they were at a seasonallyadjusted annual rate of $28.5 billion,more than $2 billion above the annual
1 CHART 11
Billion $
5
Balance on dfficiai reserve,' transactions basis , \ J
-5
Change in U,S, official;•' 'reserve,;assets'--,:'
-5
-10I960
i .1961
U.S. Department of Commerce. Office of Business Economics
' I ' " • ' . * ' . i , V •"•'.'}:. i . : I ' , ' •". ' : , i : ' / ' 'h'' " i ' ..V". i .':"T;' 'f' i A- .;.V1962 1963 1964 1965
Quarterly, Seasonally Adjusted at Annual Rates
1966
i-10
Source: Tables66-6-11
Digitized for FRASER http://fraser.stlouisfed.org/ Federal Reserve Bank of St. Louis

20 SURVEY OF CUEEENT BUSINESS June 1966
total of $26.3 billion in 1965. Thiswas a considerable acceleration overthe $1 billion rise from 1964 to 1965.First quarter exports were approxi-mately at the rate that could be ex-pected on the basis of the relationshipsbetween exports and foreign businessactivity in prior years. Through thatperiod, at least, neither limitations ofproductive capacity nor rising pricesin the United States apparently had ameasurable adverse effect on exports.
Investment income rose relativelyslowly last year, particularly in view ofthe increase in the size of foreign in-vestments and if allowance is made forspecial dividend distributions duringthe first half of the year. Incomesfrom investments by the petroleumindustry were adversely affected bylower petroleum prices and highertaxes in the oil-producing countries.During the first quarter, however, theupward movement in investment in-comes seems to have been resumed.
Effect of rise in military expenditures
The $66 million rise in militaryexpenditures was another major factorinfluencing the balance of payments.The total during the first quarter,according to reports that are stillpreliminary, was about $835 million,or $3.35 billion at an annual rate.This was about $0.5 billion higher thanthe average rate in 1964, before therecent rise began.
The increase in total expendituressince 1964 was slightly less than the$0.6 billion rise in expenditures in thearea comprising all of Asia and Africa(shown in table 8) as well as in Japan,and may be attributed to the hostilitiesin Vietnam. The figure above coversonly direct expenditures by the militaryorganizations and their personnel. Itdoes not cover the indirect effects on theforeign transactions of the UnitedStates, particularly imports that areattributable to the increase in domesticdemand associated with the increase inmilitary orders and expenditures. Itmay be noted, however, that the with-drawal of strategic materials from theU.S. stockpile helped to dampen therise in imports, through its effect not
only on the volume of imports but alsoon their prices.
Major erratic changes
The first quarter balance was alsoinfluenced by changes in certain typesof transactions that are either tempo-rary, self-reversing, or subject to major
CHART 12
Net Capital Outflow for U.S. DirectForeign Investments
1964 1965 1966
-.2
2 &li ^
1964 1965 1966
Areas Not Seasonally Adjusted
U.S. Department of Commerce. Office of Business Economics 66-6-12
erratic changes. The postponement of$150 million of new issues of Canadiansecurities from the fourth quarter of1965 to the first quarter of this yearwas mentioned earlier. In part, theoutflow of funds resulting from thepurchases of these securities was re-duced through repurchases by theCanadian Government of $40 millionof its own obligations that had beensold to U.S. insurance companies in1962 at the time of the Canadianexchange difficulties. These securitiestransactions increased U.S. net pay-ments in the first quarter by $110million. Net payments were alsoraised by the liquidations by foreignofficial organizations of $53 million ofnonconvertible, nonmarketable, me-dium-term Government securities.
On the positive side of the ledgerwere net receipts of about $100 millionfrom long-term investments by foreignofficial and international agencies. Ad-vance receipts on military contracts,including those from purchases by aforeign central bank of special U.S.Treasury bonds that will be paid offthrough the transfer of funds to themanufacturers of the military equip-ment, are estimated to have been$70 million, but this was about $80million less than in the fourth quarterof last year.
The total of such transactions—ini-tiated largely by the U.S. Governmentor by foreign official agencies—wasless favorable to the U.S. balance ofpayments than were similar transac-tions in the preceding quarter, and it isthis difference that accounts to a largeextent for the deterioration of the(liquidity) balance in the first quarter.The balance on transactions (particu-larly in goods and services and capitalflows) that are affected mainly by do-mestic and foreign business activity,by the various programs to improve thebalance of payments, and by the or-dinary operations under the foreign aidprograms had improved sufficiently tooffset the rise in military expendituresabroad. However, this was accom-plished by a continued decline in netcapital outflows to a rate that may notbe maintained, much less reducedsignificantly.
Digitized for FRASER http://fraser.stlouisfed.org/ Federal Reserve Bank of St. Louis

June 1966 SURVEY OF CURRENT BUSINESS 21
Merchandise TradeIn the first quarter of 1966, U.S.
exports and imports, adjusted to abalance of payments basis, were atrecord levels. Imports, however, ad-vanced more strongly than exports andthe export surplus dropped to a season-ally adjusted annual rate of $4.5 billion.This was below the export balances of$4.8 billion in 1965 and $6.7 billion in1964.
Exports
Exports rose by about 1 percent fromthe fourth quarter of 1965 to a season-ally adjusted annual rate of $28.5 billionin the first quarter. The first quarterrate was about 8 percent above the 1965total. This gain was well above the 4percent rise from 1964 to 1965 and ex-ceeded the . 7 percent annual averagegrowth rate of the preceding 10 years.
The increase from the fourth quarterwas concentrated in exports of nonagri-cultural goods to areas other thanCanada. Shipments to Canada, whichhad comprised a large part of the gainin exports in 1965, leveled off in thefirst quarter. Agricultural exports,which had risen in the second half oflast year, remained unchanged; thoseunder aid programs increased somewhatwhile commercial exports fell off.
Agricultural exports in the firstquarter, after adjustment for seasonalvariations, were at an annual rate of$6.7 billion, about the same amount asin the two preceding quarters. Duringthe remainder of this year, exports ofwheat, other grains, and soybeans areexpected to continue to expand. Ex-ports of cotton, which declined in thefirst quarter, should recover after thestart of the new marketing year onAugust 1, when the export price of U.S.cotton will be free to adjust to the worldmarket prices, thus making U.S. cottonmore competitive in international trade.
Exports of most major nonagricul-tural commodities in the first quarter of1966 were considerably above the 1965quarterly average. Increases in ma-chinery exports, after seasonal allow-ance, probably accounted for a largepart of the nonagricultural export risefrom the fourth quarter. New exportorders for machinery rose substantiallyduring 1965 and have remained at the
high fourth quarter level during thefirst 4 months of 1966. Since exportsgenerally lag about 6 months behind thereceipt of orders, a further expansion ofmachinery exports above the firstquarter rate may be» expected.
The first quarter rise in total exportswas held down by the failure offseason-ally adjusted) shipments of automobilesand parts to increase. These had risensharply in the last quarter of 1965,reflecting the implementation of theU.S.-Canadian trads agreement for theautomotive industry. Although virtu-ally unchanged in the first quarter ofthis year, automotive exports remainedwell above the 1965 quarterly average.
Agricultural exports are expected toincrease during the year, and thereshould be an early resumption in theupward trend in shipments to Canada,in view of the continued expansion ofthe Canadian economy. Improve-ments in industrial production in Japanshould also help to stimulate foreigndemand for U.S. goods. Business con-ditions in Western Europe, however,remain mixed, and thus may not makea major contribution to an expansionof U.S. exports in the near future.
Imports
With domestic business activity ex-panding rapidly and capacity utiliza-tion pressing against optimum operatingrates, U.S. imports continued to growrapidly in the early months of this year.Last year, imports rose by 15 percent,as compared with an average rise ofabout 6 percent in the preceding 10years. It is true that 1965 imports
were increased by an extraordinary risein the demand for steel in anticipationof a strike in the U.S. steel industry,but this addition was partly offsetby exceptionally low imports of food-stuffs.
From 1964 to 1965, imports otherthan foodstuffs increased about 18percent, as compared with a rise inGNP of 7.6 percent. The ratio ofthese two percentage figures—whichapproximately measures the incomeelasticity of nonfood imports for thatperiod—was 2.3, or more than doublethe 1.1 ratio for the 1960 to 1964period (table A). (The omission ofthe extraordinary imports of steel andof automobile imports from Canada,which increased sharply because of theU.S.-Canadian automotive trade agree-ment, would lower the 1964-65 ratioonly slightly.) The ratio based onchanges from the average of 1965 tothe first quarter of 1966 was 2.2.The slight drop from the ratio for the1964-65 period seems to have been duemainly to a slower rise in imports ofindustrial materials relative to GNP—-even after adjustment for last year'sextraordinary steel imports.
First quarter imports of industrialsupplies were affected by larger draw-ings on the Government stockpile anda steep rise in foreign relative todomestic prices for copper. The declinein imports of primary copper was partlyoffset by an increase in imports offabricated copper products. In viewof limited domestic supplies, a furtherexpansion in the domestic demand for
Table A.—Percentage Change in U.S. Imports and in Gross National Product
Gross national product. __ _ _ _ _
Imports:
Total i.
Foodstuffs and beverages - - _Other imports. _
Industrial supplies and materialsExcluding extraordinary steel imports. _
Conpnnier goodsExcluding automotive products from
Canada _ _Capital equipment
Percentage change from
1960 to 1964(annual
rate)
5.7
6.0
4.26.04.84.88.3
7.716.0
1964 to 1965
7.6
15.4
1.217.715.312.721.3
18.440.1
1965 quar-terly aver-age to 1stquarter
1966
5.6
11.8
11.012.64.06.5
30.5
19.228.5
Batio of percentage change in im-ports to percentage change in GNP
1960 to 1964
1.1
0,71.10.80.81.5
1.42.8
1964 to 1965
2.0
0.22.32.01.72.8
2.45.3
1965 quar-terly aver-age to 1stquarter
1966
2.1
2.02.20.71.25.4
3.45.1
Total on balance of payments basis; commodity detail on Census basis.
Digitized for FRASER http://fraser.stlouisfed.org/ Federal Reserve Bank of St. Louis

22 SURVEY OF CURRENT BUSINESS June 1966
industrial materials could again accel-erate the rise in these imports relativeto the rise in GNP.
In contrast to imports of industrialsupplies and materials, the rate ofexpansion in imports of consumer goodsrose relative to the rate of expansionin GNP in the first quarter. If thesudden rise of imports of automobilesfrom Canada is omitted, the expansionfrom 1965 to the first quarter of 1966was over 19 percent, or nearly 3% timesthe rise in GNP. This represents aconsiderable acceleration in imports ofconsumer goods relative to GNP ascompared with the 1964-65 period,when imports grew nearly 2% times asfast as GNP, and is far in excess of theratio over the 1960-64 period, whenimports rose only \% times as fast asGNP.
The recent relative rise in consumergoods imports was not limited to anarrow range of commodities but wasrather widespread. Among the importsthat had the largest rates of growthwere such diverse commodities as motor-cycles, diamonds, watches, and tele-vision equipment. Automobile imports(other than those from Canada) alsoincreased sharply, even more thandomestic sales in 1965 and the firstquarter of 1966, but some slowdownoccurred in April.
The relatively large rise in demand forimports applied also to capital equip-ment. In the 1960 to 1964 period,the percentage increase in these im-ports was 2.8 times as large as thepercentage rise in GNP. From 1964 to1965, the ratio nearly doubled, butfrom the average of 1965 to the firstquarter of 1966, it fell slightly.
The expansion in imports of food-stuffs from 1965 to the first quarterof 1966 was twice as large as the risein GNP, and a ratio of this size is notlikely to continue. On the other hand,the relative rise in imports of industrialmaterials may have been temporarilyreduced in the first quarter. All told,it appears that the rise in total importsearly this year was about consistentwith the change in domestic businessactivity.
Private Capital Movements andIncome on Investments
Direct investments
Capital outflows for direct invest-ment abroad in the first quarter of thisyear are now estimated at about $570million or a seasonally adjusted annualrate of $2.5 billion. This was signifi-cantly below the extremely high out-flows—$3.8 billion at an annual rate—for the period from September 1964through mid-1965. The peak ratesof that period reflected in part abunching of several very large transac-tions affecting Canada, WesternEurope, and the Middle East oil-producing countries (chart 12). Inaddition, some funds were probablymoved abroad in anticipation of changesin Government programs to restraincapital outflows.
Since the middle of 1965, the outflowhas held fairly steady though therate of investment exceeded that ofany year prior to 1965. In the firstquarter of this year, the outflow wasnot significantly affected by large singletransactions, but some transactions ofthis type are expected later this year.
The capital outflow for directinvestment since mid-1965 was alsomoderated by adherence to the Presi-dent's program to improve the balanceof payments. While capital outlaysabroad are scheduled to rise sharplythis year,1 many firms are arranging tofinance these expenditures by borrowingabroad. A recapitulation of announcedlong-term borrowing abroad shows thefollowing totals (in millions of dollars):
Period
1965:2d quarter3d quarter4th quarter
Total
1966:1st quarter - _2d quarter (to June
15) _ _ _
ThroughU.S.-in-
corporatedaffiliates
20192212
185
113
Throughforeign-in-corporatedaffiliates
631488
165
30
20
Total
6334
280377
215
138
The total of over $700 millionincludes some long-term loans arrangedwith foreign banks, as well as publicly
i SURVEY OF CURRENT BUSINESS, March 1966, p. 7.
offered debt instruments of variouskinds. Also, it is somewhat largerthan the amounts actually received bythe borrowers since discounts andcommissions have not been deducted.Out of the $397 million borrowedthrough U.S.-incorporated affiliates upto the end of March, it is believedthat approximately $100 million hadbeen transferred to foreign subsidiariesby that date. This includes somewhatless than $40 million transferred duringthe first quarter. The difference be-tween the amounts realized from bor-rowing and the amounts transferredwas retained by the U.S. corporationsin liquid assets abroad and is recordedas a short-term capital outflow (table 1,line 40). The disposition of the fundsborrowed through foreign-incorporatedaffiliates is not currently known.
The net result of foreign borrowinghas been to reduce the need for U.S.funds considerably. In the remainderof the year, as the accumulated liquidforeign assets of the U.S.-incorporatedaffiliates are transferred to foreignaffiliates to finance their investments,the capital outflow for direct invest-ment will be increased, but this will beoffset by a corresponding reduction inshort-term investments, so that therewill be no net effect on the balance.
Notable features of first quarterdirect investments were the relativelylow figure for Western Europe, $230million, and the sustained large outflowto Canada, $210 million. The annualflow to Europe in 1964 and 1965 was$1.4 billion, and in view of the enlargedinvestments projected for that areaby major firms in 1966, a somewhathigher pace of outflows may be ex-pected for the rest of the year. In thecase of Canada, a considerable numberof major projects that will probablykeep the outflow relatively high are inprogress. However, the outflow of$0.9 billion to Canada in 1965 includedabout $0.2 billion to refinance out-standing debt of foreign enterprises tothe United States; such transactionsare unlikely to recur in 1966. Asizable part of the financing of Cana-dian affiliates is obtained by sales oftheir bonds in U.S. capital markets.
Digitized for FRASER http://fraser.stlouisfed.org/ Federal Reserve Bank of St. Louis
June 1966 SURVEY OF CUB RENT BUSINESS 23
In 1965, such sales amounted to $219million; they totaled about $70 millionin the first quarter of 1966, and a similaramount may be sold in the secondquarter.
In contrast to the large capitaloutflow to Middle East oil-producingcountries in early 1965, the flow in thefirst quarter of 1966 was relativelysmall. These capital movements arequite irregular, and heavy tax or otherpayments may result in larger outflowslater in the year.
Other private investments
Purchases of new foreign securitiesoffered in the United States were un-usually high—$460 million—in the firstquarter of 1966. Even if $150 millionof delayed Canadian issues is deducted,the annual rate of outflow would be$1.2 billion. This is as high as theaverage of the 1963-65 period. Cana-dian issues accounted for $413 millionof the first quarter total, and largeamounts of Canadian issues have al-ready been sold or are scheduled forsale in the second quarter. It appearsthat Canadian issues in the U.S. marketin 1966 will considerably exceed the$700 million annual average of 1963-65.In contrast, sales by other countrieswill be well under their 1963-65 averageof $470 million. This decline reflectsthe application of the Interest Equaliza-tion Tax, from which Canadian issuesare exempt, to new issues of otherdeveloped countries.
Redemptions of outstanding issuesby foreigners were unusually large inthe first quarter because of the advancerepurchase by the Canadian Govern-ment of $40 million of its bonds heldin the United States. This offset partof the heavy new flow of funds toCanada. Americans continued to re-duce their holdings of foreign equitysecurities.
Other private capital transactionsincluded a net accumulation of $160million of short-term assets in Europeby nonbanking concerns. This repre-sents largely the proceeds of $185million borrowed abroad by U.S.-in-corporated firms, less the use of fundsborrowed in the same period or in1965. Apparently there was very little
further repatriation of outstandingshort-term funds held abroad, in con-trast to the net recorded inflow ofnearly $250 million in the first quarterof 1965.
U.S. banks further reduced both theirlong- and their short-term assets in thefirst quarter. The reduction in short-term assets by $137 million, afterseasonal adjustment, largely reflectedrepayments by Colombia and Vene-zuela. Reductions in longer term loansresulted primarily from repayments byEuropean countries, especially Italy,and by Brazil and Venezuela. Theonly sizable outflow of longer termbanking funds was to' Australia. Atthe end of March, the banks' foreignassets were about $700 million belowthe limit suggested under guidelinesestablished by the Federal ReserveSystem.
Foreign investments in theUnited States
Foreign transactions in U.S. securi-ties in the first quarter of 1966 weremarked by a continuing net liquidationof U.S equity securities, amounting to$50 million for the quarter, offset bypurchases of U.S. bonds (other thanbonds of the U.S. Government) of $191million. The foreign purchases of U.S.bonds include nearly $185 million ofthe issues of companies especially or-ganized to finance direct foreign invest-ments. In addition, $73 million werepurchased by international organiza-tions. Other trading in U.S. bondsresulted in a net liquidation of about$65 million. This liquidation and asimilar but smaller net liquidation inthe fourth quarterof 1965 contrast witha small net purchase balance (asidefrom transactions related to the liqui-dation of British Government holdingsof U.S. securities) registered during1964 and the first three quarters of1965. Such a shift could be relatedto market conditions abroad, whereyields were driven up by intense de-mands for funds. One important ele-ment in the market was the sale toforeigners of the bonds of the newlyorganized affiliates of U.S. companies;to the extent the purchase of thesebonds was financed by the liquidation
of other U.S. securities, the gain tothe U.S. balance of payments wasdiminished.
Other foreign investments in theUnited States were relatively minor inthe first quarter. Long-term depositswith U.S. banks were raised by $50million and foreigners increased theirshort-term claims on U.S. commercialconcerns by about the same amount.There were inflows on a similar scale inboth of these types of assets during 1965but the timing was highly irregular.
Income on investments
Income received from direct foreigninvestments was at an annual rate ofabout $4.0 billion in the first quarter,about the same as the total for 1965.Dividend distributions, however, wereunusually large in the early part of 1965because of changes in taxation and otherspecial reasons. These special distribu-tions amounted to about $125 million.There were no such unusual distribu-tions this year. Without these specialdistributions, income received in 1965would have been about $3.8 billion, andthe first quarter 1966 rate would indi-cate a continued rise.
Data by industry are not yet avail-able, but in 1965 some weakening inpetroleum income appeared offset byhigher income from other industries.In the first quarter of 1966, incomecontinued to be relatively low in theareas where petroleum production isimportant and to rise gradually in otherareas. Income could ordinarily beexpected to rise as the investment basegrows, unless much larger amounts areretained abroad for reinvestment. How-ever, the petroleum industry is beingadversely affected by higher taxes andintensified competition, and manufac-turing and other enterprises may alsobe experiencing reduced profit rates.
Income on private investments otherthan direct made further gains in thefirst quarter. This reflected partly thegrowing holdings of foreign bonds, butto an even greater extent, it reflectedrising interest rates. Income paymentsby the United States are also rising,primarily because of the higher interestrates on time deposits and U.S. Govern-ment obligations.
Digitized for FRASER http://fraser.stlouisfed.org/ Federal Reserve Bank of St. Louis
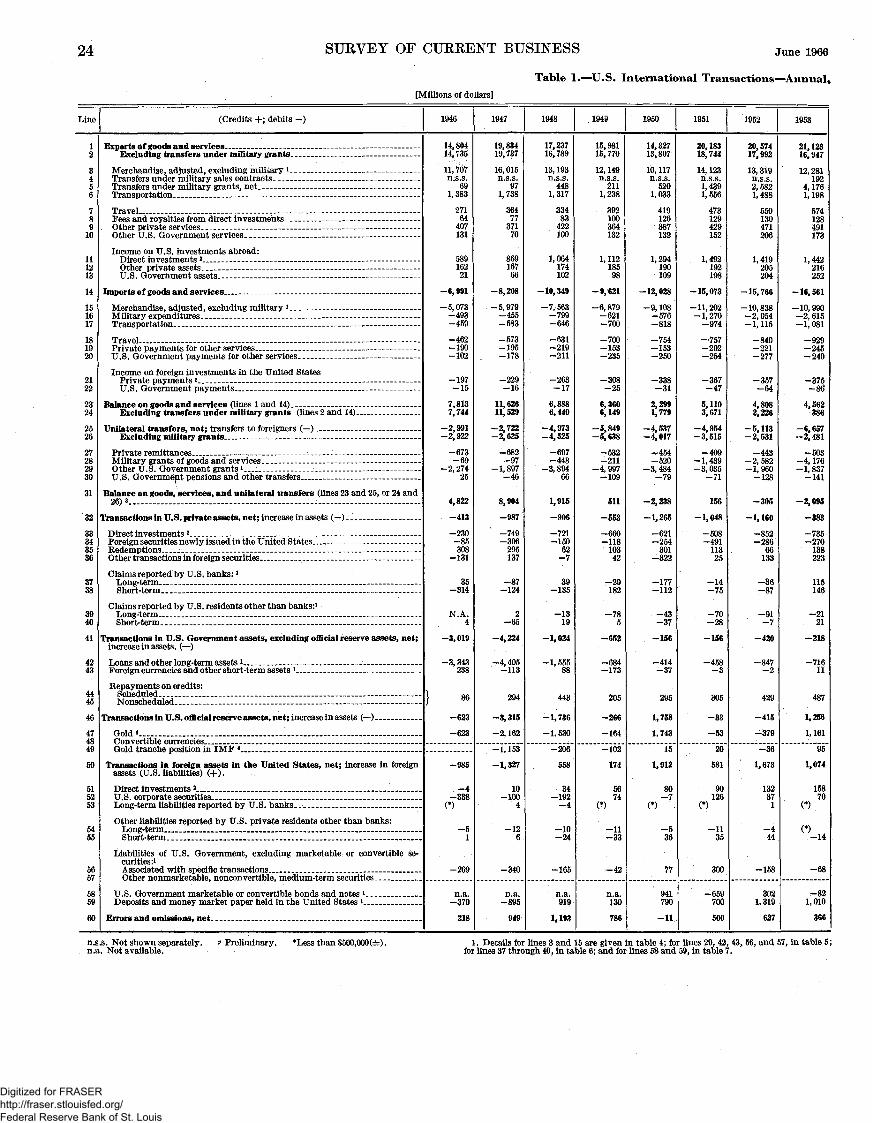
24 SURVEY OF CUREENT BUSINESS June 1966
Table 1.—U.S. International Transactions—Annual,[Millions of dollars]
Line
12
3456
7g9
10
111213
14
151617
181920
2122
2324
2526
27282930
31
32
33343536
3738
3940
41
4243
4445
46
474849
50
515253
5455
5657
5859
60
(Credits +; debits -)
Exports of goods and services - -Excluding transfers under military grants
Merchandise adjusted excluding military *Transfers under military sales contractsTransfers under military grants netTransportation - '•
Travel - : -Fees and royalties from direct investmentsOther private services -- -- -- - -- -- -- -- -Other U S Government services - -
Income on U.S. investments abroad:Direct investments 2
Other private assetsU S Government assets --
Imports of goods and services -
Merchandise adjusted excluding military *Military expenditures -Transportation - -
Travel --Private payments for other services -U S Government payments for other services - -
Income on foreign investments in the United StatesPrivate payments 2 -U S Government payments
Balance on goods and services (lines 1 and 14)Excluding transfers under military grants (lines 2 and 14) -
Unilateral transfers, net; transfers to foreigners ( — )Excluding military grants - .
Private remittances _ _ _ _ _ _Military grants of goods and services -_Other U.S. Government grants 1
U S Government pensions and other transfers
Balance on goods, services, and unilateral transfers (lines 23 and 25, or 24 and26)3 __
Transactions in U.S. private assets, net; increase in assets (— )
Direct investments 2
Foreign securities newly issued in the United States .RedemptionsOther transactions in foreign securities - _-
Claims reported by U.S. banks: lLong-termShort-term -
Claims reported by U.S. residents other than banks:1Long-termShort-term - - -
Transactions in U.S. Government assets, excluding official reserve assets, net;increase in assets. (— )
Loans and other long- term assets *Foreign currencies and other short-term assets * _ _ _
Eepay ments on credits :ScheduledNonscheduled
Transactions in U.S. official reserve assets, net ; increase in assets (— ) _
Gold 4 -Convertible currenciesGold tranche position in IMF 4 . __ _ _
Transactions in foreign assets in the United States, net; increase in foreignassets (U.S. liabilities) (+).
Direct investments 2
U.S. corporate securities _ _ _ . _ __Long-term liabilities reported by U.S. banks
Other liabilities reported by U.S. private residents other than banks:Long-term.. .Short-term .
Liabilities of U.S. Government, excluding marketable or convertible se-curities:1Associated with specific transactions _^__ . _ _ . _ _ _Other nonmarketable, nonconvertible, medium-term securities
U.S. Government marketable or convertible bonds and notes *Deposits and money market paper held in the United States 1
Errors and omissions, net _ _ _.
1946
14,80414,735
11,707n.s.s.
691, 383
27164
407131
58916221
-6,991
-5,073-493-459
-462-190-102
-197-15
7,8137,744
-2,991-2,922
-673-69
-2, 27425
4,822
—413
-230—85308
-131
35-314
N.A.4
-3,019
—3. 343238
1 Q«| 86
-623
-623
-985
—4—338
(*)
-51
-269
n.a.—370
218
1947
19,83419 737
16 015n.s.s.
971,738
36477
37170
86916766
-8,208
-5,979-455-583
-573--195-178
-229-16
11,62611,529
-2,722-2,625
-682-97
-1,897-46
8,904
-987
-749-396
295137
—87—124
2-65
-4,224
-4, 405—113
294
-3,315
—2, 162
-1J53
-1,327
10-100
4
-126
-340
n.a.—895
949
1948
17,23716, 789
13, 193n.s.s.
4481,317
33483
422100
1,064174102
-10,349
-7,563-799-646
-631-219-211
-263-17
6,8886,440
-4,973-4,525
-697-448
-3,89466
1,915
—906
-721—150
62—7
39—135
-1319
-1,024
-1, 55588
443
—1,736
-1, 530
-206
558
34-192
—4
-10-24
—165
n.a.919
1, 193
1949
15, 98115, 770
12, 149n.s.s.
2111, 238
392100364132
1,11218598
-9,«21
-6,879—621-700
-700— 153—235
-308—25
6,3606,149
-5,849-5,638
—532-211
—4, 997—109
511
—553
—660—118
10342
—29182
—785
-652
—684—173
205
—266
—164
—102
174
5674
(*)
—11-33
-42
n.a.130
786
1950
14, 32713,807
10 117n.s.s
5201,033
419126387132
1, 294190109
— 12,028
—9, 108-576-818
-754— 153—250
—338—31
2, 2991,779
—4,537—4,017
-454-520
-3, 484—79
—2,238
—1,265
—621—254
301—322
—177—112
—43—37
-156
—414—37
295
1, 758
1,743
15
1,912
80-7
(*)
-536
77
941790
-11
1951
20, 18318 744
14 123n s s1, 4391,556
473129429152
1,492192198
-15,073
-11,202-1,270
-974
—757—202-254
-367—47
5,1103 671
—4, 954—3, 515
—409-1,439-3, 035
—71
156
—1,048
—508—491
11325
—14—75
—70-28
-156
—458—3
305
—33
—53
20
581
90126
(*)
—1135
300
—659700
500
1952
20 57417 992
13 319n s s2 5821, 488
550130471206
1 419205204
— 15 766
—10 838—2,054— 1, 115
—840—221—277
—357—64
4,8082 226
—5 113—2 531
—443—2, 582-1,960
—128
—305
-1,160
—852—286
66133
—36—87
—91—7
-420
—847—2
429
—415
—379
—36
1,673
132371
-444
—158
3021,319
627
1953
21 12316 947
12 281192
4 1761 198
574128491173
1 442216252
— 16 561
—10 990—2, 615—1,081
—929—245— 240
—375—80
4,562386
—6 657—2 481
—503—4, 176—1,837
—141
-2, 095
-383
—735—270
138223
115146
—2121
-218
-71611
487
1, 256
1,161
95
1,074
15870
(*)
(*)-14
-68
-821, 010
366
n.s.s. Not shown separately,n.a. Not available.
Preliminary. *Less than $500,000(±). 1. Details for lines 3 and 15 are given in table 4; for lines 29, 42, 43, 56, and 57, in table 5;for lines 37 through 40, in table 6; and for lines 58 and 59, in table 7.
Digitized for FRASER http://fraser.stlouisfed.org/ Federal Reserve Bank of St. Louis
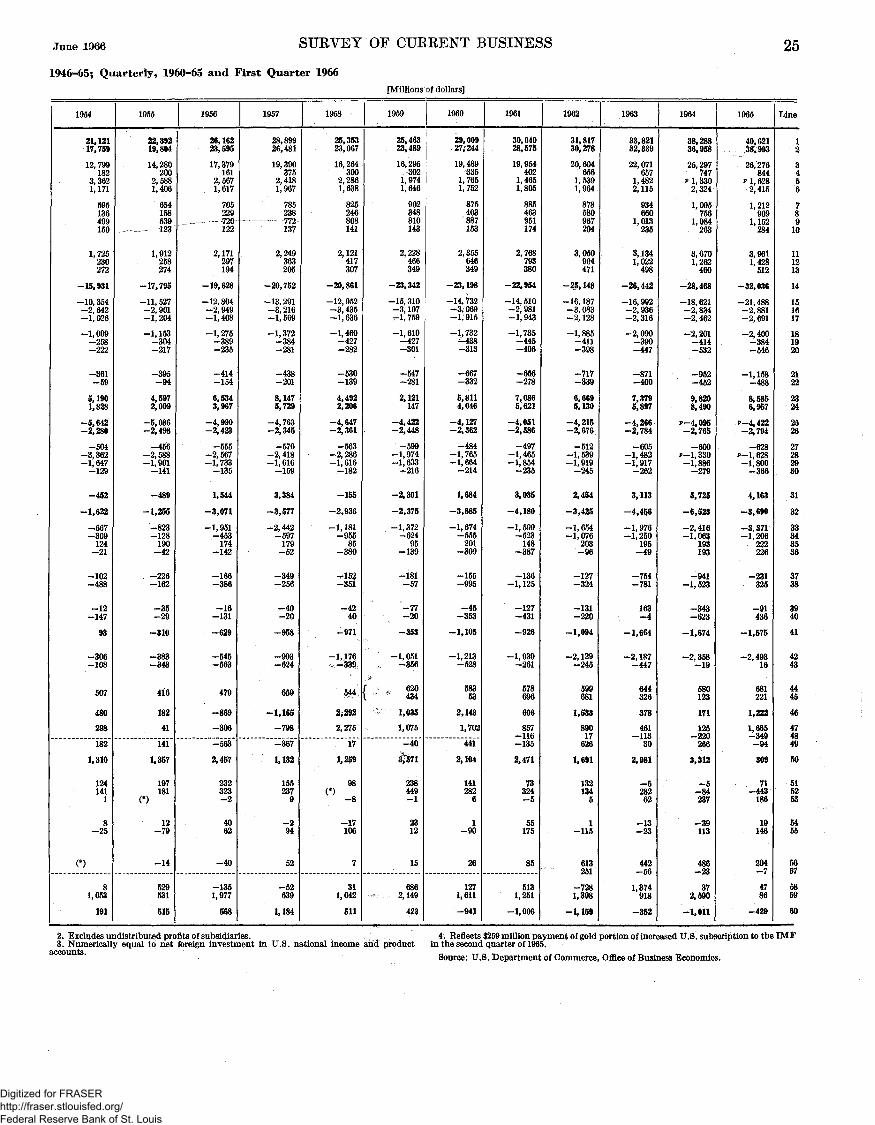
June 1966 SURVEY OF CURRENT BUSINESS 25
1946-65; Quarterly, 1960-65 and First Quarter 1966[Millions of dollars]
1954
21, 12117,759
12,799182
3, 3621,171
595136499150
1,725230272
-15,931
-10, 354-2, 642-1,026
-1, 009-258-222
-361-59
5,1901,828
-5,642-2,280
-504-3,362-1,647-129
-452
-1,622
-667-309124-21
-102-488
-12-147
93
-306-108
507
480
298
182
1,310
1241411
8-25
(*)
81,053
191
1955
22,39219,804
14,280200
2, 5881,406
654158539
._ - 123"
1,912258274
-17,795
-11, 527-2, 901-1,204
-1, 153-304-217
-395-94
4,5972,009
-5,086-2,498
-456-2,588-1,901-141
-489
-1,255
-823-128190-42
-226-162
-35-29
-310
-383-343
416
182
41
141
1,357
197181
(*)
12-79
-14
529531
515
1956
26,16223,595
17,379161
2, 5671, 617
705229
-..— 720"122
2,171297194
-19,628
-12, 804-2, 949-1,408
-1, 275-389-235
-414-154
6,5343,967
-4,990-2,423
-555-2,567-1, 733-135
1,544
-3,071
-1,951-453174
-142
-166-386
-16-131
-629
-545-563
479
-869
-306
-563
2,457
232323-2
4062
-40
-1351,977
568
1957
28,89926,481
19,390375
2,4181,967
785238772137
2,249363205
-20,752
-13, 291-3,216-1, 569
-1,372-384-281
-438-201
8,1475,729
-4,763-2,345
-570-2,418-1, 616-159
3,384
-3,577
-2,442-597179-52
-349-256
-40-20
-958
-993-624
659
-1,165
-798
-367
1,132
1552379
-294
52
-52639
1, 184
1958
25,35323,067
16,264300
2,2861,638
825246808141
2,121417307
-20,861
-12, 952-3,435-1,636
-1,460-427-282
-530-139
4,4922,206
-4,647-2,361
-563-2, 286-1, 616-182
-155
-2,936
-1,181-955
85-380
-152-351
-4240
-971
-1,176-339
544
2,292
2, 275
17
1,259
980 -8
-17106
7
311,042
511
1959
25,46323,489
16,295302
1,9741,646
902348810143
2,228466349
-23,342
-15,310-3, 107-1,759
-1, 610-427-301
-547-281
2, 121147
-4,422-2,448
-599-1,974-1,633-216
-2,301
-2,375
-1, 372-624
95-139
-181-57
-77-20
—353
-1, 051-356
f -v 620I ' 434
1,035
1,075
-40
3;571
238449-1
2312
15
6862,149
423
1960
29,00927; 244
19,489335
1,7651,752
875403887153
2,355646349
-23,198
-14, 732-3/069-1,915
-1,732-438-313
-667-332
5,8114,046
-4,127-2,362
-484-1,765-1,664-214
1,684
-3,885
-1, 674-555201
-309
-155-995
-45-353
-1,105
-1,213-528
58353
2,143
1,702
441
2,104
1412826
1-90
26
1271,611
-941
1961
30,04028,575
19, 954402
1,4651,805
8854639,51174
2,768793380
-22,954
-14, 510-2, 981-1, 943
-1, 735-445-406
-656-278
7,0865,621
-4,051-2,586
-497-1,465-1,854-235
3,035
-4,180
-1,599-523148
-387
-136-1, 125
-127-431
-926
-1,939-261
578696
606
857—116-135
2,471
73324-5
55175
85
5131,251
-1,006
1962
31,81730,278
20,604656
1,5391,964
878580967204
3, 050904471
-25, 148
-16,187-3, 083-2, 128
-1,885-411-398
-717-339
6,6695,130
-4,215-2,676
-512-1, 539-1,919-245
2,454
-3,425
-1,654-1,076
203-96
-127-324
-131-220
-1,094
-2,129-245
599681
1,533
89017626
1,691
1321345
1-115
613251
-7281,398
-1,159
1963
33,82132,339
22, 071657
1,4822,115
934660
1,013235
3, 1341,022498
-26,442
-16, 992-2, 936-2,316
-2,090-390-447
-871-400
7,3795,897
-4,266-2,784
-605-1,482-1,917-262
3,113
-4,456
-1,976-1,250
195-49
-754-781
163-4
-1,664
-2, 187-447
644326
378
461—113
30
2,981
-528262
-13-23
442—56
1,374918
-352
1964
38,28836,958
25,297747
* 1, 3302,324
1, 095756
1,084263
3,6701,262460
-28,468
-18,621-2,834-2, 462
-2, 201-414-532
-952-452
9,8208,490
p-4,095-2,765
-600p-1,330-1,886-279
5,725
-6,523
-2,416-1,063
193193
-941-1,523
-343-623
-1,674
-2,358-19
580123
171
125—220266
3,312
-5-84237
-39113
486—23
372,590
-1,011
1965
40,621,38,993
26,276844
» 1, 6282,415
1,212909
1,152284
3,9611,428512
-32,036
-21, 488-2, 881-2, 691
-2,400-384-546
-1,158-488
8,5856,957
»-4,422-2,794
-628P- 1,628-1,800-366
4, 163
-3,690
-3.371-1, 206
222226
-231325
-91436
-1,575
-2,49316
681221
1,222
1,665—349-94
309
71-443186
19146
204—7
4786
-429
Line
12
3456
78910
111213
14
151617
181920
2122
2324
2526
27282930
31
32
33343536
3738
3940
41
4243
4445
46
474849
50
515253
5455
5657
5859
60
2. Excludes undistributed profits of subsidiaries.3. Numerically equal to net foreign investment in U.S. national income and product
accounts.
4. Reflects $259 million payment of gold portion of increased U.S. subscription to the IMFin the second quarter of 1965.
Source: U.S. Department of Commerce, Office of Business Economics.
Digitized for FRASER http://fraser.stlouisfed.org/ Federal Reserve Bank of St. Louis

26 SURVEY OF CURRENT BUSINESS June 1966
Table 1.—U.S. International Transactions-—Annual,[Millions of dollars]
Line
12
3456
789
10
111213
14
151617
181920
2122
2324
2526
27282930
31
32
33343536
3738
3940
41
4243
4445
46
474849
50
515253
5455
5657
5859
60
(Credits +; debits -)
Exports of goods and services _ _Excluding transfers under military grants
Merchandise, adjusted, excluding military 1 _ _Transfers under military sales contractsTransfers under military grants, netTransportation.. __ _ __ _
TravelFees and royalties from direct investments _ _Other private servicesOther U.S. Government services
Income on U.S. investments abroad:Direct investments 2
Other private assets • _ _ 'U.S Government assets
Imports of goods and services _
Merchandise, adjusted, excluding military 1
Military expendituresTransportation _
Travel _Private payments for other services _ _ _ _ _ _ _ _ _ _U.S. Government payments for other services
Income on foreign investments in the United States:Private payments 2
U.S. Government payments
Balance on goods and services (lines 1 and 14)_ _Excluding transfers under military grants (lines 2 and 14)
Unilateral transfers, net; transfers to foreigners (—)Excluding military grants
Private remittancesMilitary grants of goods and servicesOther U.S. Government grants l _ „ ^U.S. Government pensions and other transfers __
Balance on goods, services, and unilateral transfers (lines 23 and 25, or 24 and 26) 8_
Transactions in U.S. private assets, net; increase in assets (— ) _ _
Direct investments 2__ __ _Foreign securities newly issued in the United States _RedemptionsOther transactions in foreign securities
Claims reported by U.S. banks:iLong-termShort-term _
Claims reported by U.S. residents other than banks: lLong-term. _ _ ..Short-term _
Transactions in U.S. Government assets, excluding official reserve assets, net;increase in assets (— ).
Loans and other long-term assets 1 _ __ _ _ _ _ _ _ _Foreign currencies and other short-term assets *
Repayments on credits:ScheduledNonscheduled _ _
Transactions in U.S. official reserve assets, net; increase in assets (— )
Gold 4Convertible currencies _Gold tranche position in IMF 4 -
Transactions in foreign assets in the United States, net; increase in foreignassets (U.S. liabilities) (+)
Direct investments 2
U.S. corporate securitiesLong-term liabilities reported by U S banks
Other liabilities reported by U.S. private residents other than banks:Long-termShort-term
Liabilities of U.S. Government, excluding marketable or convertible se-curities: '1
Associated with specific transactions _Other nonmarketable nonconvertible medium-term securities
U.S. Government marketable or convertible bonds and notes l _Deposits and money market paper held in the United States L_
Errors and omissions, net
I
6 7816 338
4 62358
443418
17284
22236
51814760
—5 744
—3 833—775-427
—277—100—64
—167—101
1,037594
—987—544
—107—443—381
—56
50
—658
—305—296
53—23
10—104
—512
-230
—238—141
13217
160
50
110
684
40170
1
4—4
-65
124414
-6
196
II
7 5646 942
5 015122622449
23490
21936
56415657
—6 045
—3 860—764—530
—466—102—70
—167—86
1 519897
—1 208—586
119—622—418
—49
311
—737
—312—111
55—110
—66—37
—12—144
-390
—353—150
1085
175
94
81
834
59117
1
3—53
54
56597
-193
0
III
6 9256 643
4 69970
282453
28898
22543
52016087
—6 Oil
—3 553—797—538
—663—118—110
—155—77
914632
—871—589
—119—282—417
—53
43
—947
—329—53
47—105
—27—419
2—63
-145
—234—95
16024
739
637
102
499
5351
— 5—7
10
-185627
—189
IV
7 7397 321
5 15285
418432
18113122138
753183145
—5 398
—3 486—733-420
—326—118
—69
—178—68
2,3411 923
—1,061—643
—139—418—448
—56
1,280
—1 543
—728—95
46—71
—72—435
—30—158
-340
—388—142
1837
1 069
921
148
87
—11—10
3
—1—26
27
132-27
-553
I
7,2686 944
5,02371
324416
17310123042
64018464
-5,285
—3, 401-780-414
—272—102—88
—159—69
1,9831 659
-987—663
—121—324—480
—62
996
—1,011
—458—107
41—69
82—356
—31—113
-383
—409—77
985
371
371—25
25
158
21104
(*)
-377
-1
206-246
-131
196
II
7,6267 083
4,928150543464
24510324143
62119791
—5,637
—3, 461-776-546
—450—103-77
—159—65
1,9891,446
-1,206—663
—117—543—486
—60
783
-992
-334-187
29—88
-34—159
-2—217
414
—309—103
192634
—320
—170-161
11
473
31152—1
-379
-32
-94341
-358
1
III
7,0416 794
4,68188
247456
28311422844
64319661
-6,086
-3, 687-701-545
-665-117-150
—153-68
955708
-839-592
—123—247—413-56
116
-680
-365-91
40-73
—15—13
-45—118
-467
-537-14
786
-213
146124
-483
1,153
-53
-3
26-13
20
203922
91
IV
8,1057 754
5,32293
351469
18414525245
864216164
-5,946
-3, 961-724-438
-123-91
—185-76
2, 1591,808
-1,019-668
—136-351-475-57
1,140
-1,497
-442-138
38—157
—169-597
-4917
-490
-684-67
21051
768
510-54312
687
2665-I
3532
98
198234
-608
n.s.s. Not shown separately,n.a. Not available.
9 Preliminary. "Less than $500,000 (±). 1. Details for lines 3 and 15 are given in table 4; for lines 29, 42, 43, 56, and 57, in table 5;for lines 37 through 40, in table 6; and for lines 58 and 59, in table 7.
Digitized for FRASER http://fraser.stlouisfed.org/ Federal Reserve Bank of St. Louis

June 1966 SURVEY OF CUERENT BUSINESS 27
1946-65; Quarterly, 1960-65 and First Quarter 1966—Continued[Millions of dollars]
I
7,4927,102
5,01596390465
18712123746
64421972
-5,891
-3,941-765-457
-286-103-82
-177-80
1,6011,211
-1,115-725
-120-390-537-68
486
-1,023
-235-170
66-91
-119-254
-66-154
-397
-479-48
1291
427
304-114237
359
41145
(*)
7-23
142
-282329
148
1?
II
8,5507,924
5,463228626493
26014323650
701224126
-6,367
-4, 086-760-598
-496-96-74
-173-84
2, 1831,557
-1,278-652
-126-626-467-59
905
-673
-476-312
36-33
-36159
-2312
-446
-507-151
15458
-164
116-324
44
526
776
-1
-16-50
24
-214700
-148
62
III
7,4297,211
4,920127218501
26414623654
64722591
-6,517
-3, 967-755-562
-730-107-143
-167-86
912694
-827-609
-121-218-430-58
85
-521
-342-133
45(*)
5106
-40-162
25
-486-75
109477
881
446104331
-27
6-234
312
159
-1935
-443
IV
8,3468,041
5,206205305505
16717025854
1,058236182
-6,373
-4,193-803-511
-373-105-99
-200-89
1,9731,668
-995-690
-145-305-485-60
978
-1,208
-601-461
5628
23-335
-284
-276
-65729
207145
389
2435114
833
862
7-54
288251
-39364
-716
I
7,7897,342
4,974166447454
18515325156
78223388
-5,985
-3,928-757-502
-316-92-95
-204-91
1,8041,357
-1,111-664
-148-447-447-69
693
-1,062
-582-486
43-79
2777
-47-15
-462
-558-50
12125
32
111-33-46
749
-5143
-6-30
955
478195
50
19
II
8,9968,321
5,718243675552
26415125159
717258108
-6,626
-4, 227-741-628
-543-96-92
-204-95
2,3701,695
-1,391-716
-150-675-500-66
979
-1,717
-525-513
50-72
-177-402
50-128
-721
-620-266
13134
124
11662
1,301
4711433
465
-19—10
393674
34
63
III
7,7977,663
5,223103134561
28815225058
666253109
-7,066
-4,316-719-645
-823-103-157
-199-104
731597
-809-675
-146-134-466-63
-78
-276
-162-166
5215
-11674
225
-68
-441-31
163241
227
196-2859
502
405112
-617
69—50
390-21
-307
IV
9,2399,013
6,156145226548
19720426162
969278193
-6,765
-4, 521-719-541
-408-99-103
-264-110
2,4742,248
-955-729
-161-226-504-64
1,519
-1,401
-707-855087
-488-530
158114
-413
-568-100
22926
-5
38-5815
429
-8710314
-5-75
297_1
11370
-129
I
9,2338,935
6,15?193297533
22317126760
93229196
-6,533
-4,349-740-533
-339-S7-133
-231-in2,7CO2,403
-9*1-6*4
-144-2£>7-473-f.7
1,719
-1,21>3
-416-1517
{14{14
-248-4(15
-i!6-219
-an
-55!2(18
1411)2
-i»l
46-2J!8
1JS1
-116
:L7-42
518
-55
1,56— 50
-2-171
-58
19
II
9,7279,203
6,309186524584
30317127665
880315114
-7,112
-4,588-725-690
-569-101-99
-230-110
2,6152,091
-1,268-744
-145-524-533-66
1,347
-1,557
-610-284
3840
-72-531
-58-80
-462
-69773
12933
303
-73258118
387
291452
(*)19
-54—2
46283
-18
64
III
9,0008,785
5, 936162
»215609
33418126665
802309121
-7,463
-4, 653-686-676
-849-107-165
-218-109
* 1,5371,322
-857-642
-143p -215-427-72
680
-1,188
-475-713835
-23984
-271-289
-392
-60422
15931
70
-20-45135
1,120
-27-3014
-2965
176/*\v /
8943
-290
IV
10,32810,034
6,895201
P294593
23523027573
1,056347129
-7,360
-5, 031-683-563
-444-109-135
-273-122
*>2,9682,674
-989-695
-168» -294-453-74
1,979
-2,485
-915-581
6324
-382-671
12-35
-559
-535-182
1517
-151
172-205-118
1,861
-24-26135
-524
20829
-151,535
-645
I
8,9698,597
5,615200
»372508
23220228668
1,036344106
-6,809
-4, 597-664-559
-398-102-112
-255-122
*2,1601,788
-1,035-663
-153P -372-437-73
1, 125
-1,537
-1,148-302
5549
-46123
6241
-336
-648150
15210
842
832-5868
-332
9035152
8-5
45
-39-618
238
19
II
11,03210,367
7,032229
*665638
34020628771
1,060369135
-8,183
-5,488-701-766
-619-95-117
-280-117
*2,8492, 184
-1,461-796
-153P -665-510-133
1,388
-524
-936-329
52130
201176
-6188
-582
-689-64
1665
68
590-56-466
-388
-91-256
43
-568
111_1
78-335
38
55
III
9,7009,428
6,331199
*272631
37022428773
849343121
-8,521
-5,487-745-722
-919-93-171
-266-118
*> 1, 179907
-938-666
-152p -272-431-83
241
-424
-419-304
4253
-41260
-205
-225
-500-116
208183
41
124-413330
714
41-235-51
1039
-55
156809
-347
IV
10,92010,601
7,298216
»319638
27027729272
1,016372150
-8,523
-5,916-771-644
-464-94-146
-357-131
"2,3972,078
-988-669
-170P -319-422-77
1,409
-1,205
-868-271
73-6
70-134
-712
-432
-65646
15523
271
119178-26
315
311342
644
103—6
-14g230
-358
1966 »
I
n.a.10,131
7,033194n.a.615
26022029471
957374113
-8,480
-5,900-837-643
-430-95-137
-300-138
n.a.1,651
n.a.-854
-157n.a.-615-82
797
-822
-566-45511321
128139
-42-160
-302
-57186
1803
424
68222134
-107
2914250
2046
5—53
-546200
10
Line
12
3456
78910
111213
14
151617
181920
2122
2324
2526
27282930
31
32
33343536
3738
3940
41
4243
4445
46
474849
50
515253
5455
5657
5859
60
2. Excludes undistributed profits of subsidiaries. 4. Reflects $259 million payment of gold portion of increased U.S. subscription to the IMF3. Numerically equal to net foreign investment in U.S. national income and product in the second quarter of 1965.
accounts.Source: U.S. Department of Commerce, Office of Business Economics.
Digitized for FRASER http://fraser.stlouisfed.org/ Federal Reserve Bank of St. Louis

28 SURVEY OF CURRENT BUSINESS June
Table 2.—U.S. International Transactions—Quarterly
[Millions of dollars]
Line
12
34K
6
7g9
10
111213
14
151617
181920
2122
2324
2526
27282930
31
32
33343536
3738
3940
41
4243
4445
46
474849
50
515253
55
55
55
6
(Credits +; debits -)
ExDorts of floods &nd services - -Excluding transfers under military grants _
Merchandise adjusted excluding military 1
Transfers under military sales contractsTransfers under military grants netTransportation
Travel -Fees and royalties from direct investmentsOther private services. ' -Other U S Government services
Income on U.S. investments abroad:Direct investments 2 - --Other private assetsU S Government assets - -
ntports of goods and services
Merchandise adjusted, excluding military J _ _ _ _Military expendituresTransportation
Travel _ _ __Private payments for other servicesU S Government payments for other services
Income on foreign investments in the United States:Private payments ^ -U S Government payments -
Balance on goods and services (lines 1 and 14) -Excluding transfers under military grants (lines 2 and 14)
Unilateral transfers net; transfers to foreigners ( — ) - -Excluding military grants -
Private remittances -- - _ _ _ _ _IMilitary grants of goods and servicesOther U S Government grants *U S Government pensions and other transfers
Balance on goods, services, and unilateral transfers (lines 23 and 25, or 24 and26).3
Transactions in U S private assets net; increase in assets ( — )
Direct investments 2
Foreign securities newly issued in the United StatesRedemptions _ _Other transactions in foreign securities
Claims reported by U.S. banks: *Long-termShort-term __
Claims reported by U.S. residents other than banks: 1Long-termShort-term __
Transactions in U.S. Government assets, excluding official reserve assets,net; increase in assets (— ).
Loans and other long-term assets *Foreign currencies and other short-term assets * -
Repayments on credits:Scheduled __ _Nonscheduled
Transactions in U S official reserve assets, net; increase in assets ( — )
Gold4 _ _— _Convertible currenciesGold tranche position in IMF 4 _
Transactions in foreign assets in the United States, net; increase in foreignassets (U.S. liabilities) (+).
Direct investments 2 -_ _ _ __ __U S corporate securitiesLong-term liabilities reported by U.S. banks
Other liabilities reported by U.S. private residents other than banks:Long-termShort-term _ __
Liabilities of U.S. Government, excluding marketable or convertible securities: l
Associated with specific transactions __
U.S. Government marketable or convertible bonds and notes *•Deposits and money market paper held in the United States l
Errors and omissions, ne t ___ _ _ _
I
6 9746 531
4 66558
443439
21389
22036
57315187
5 937
3 804775481
—43110874
163101
1 037594
976—533
—11044336756
61
747
3512675323
—33— 102
-5-19
-212
[• —386
15717
160
50
110
876
40170
1
44
-51
\ Tlft} 716
-138
196
II
7 4636 841
4 882122622436
21695
22036
59415387
5 968
3 g4Q764479
—44210879
17086
1 495873
1 201579
122622408
49
294
593
2536655
110
—52—72
—12-83
-327
-465
1335
175
94
81
714
59117
1
-53
68
519
-263
0
III
7 1666 884
4 94870
282443
22610322743
57116687
5 814
—3 663797486
—432111
—80
168—77
1 3521 070
917—635
125282457
—53
435
1 229
43111347
105
—31— 553
2-45
-147
—346
17524
739
637
102
421
53K
1
-5
24
350
-219
IV
7 4066 988
4 99485
418434
22011622038
61717688
5 479
—3 425__733—469
—427— 111—80
—166—68
1 9271 509
—1 033—615
—127418432
—56
894
1 316
—6391094671
—39—268
—30-206
-419
—544
1187
1,069
921
148
93
—11—10
3
—1-26
-15
153
-321
I
7 4g57 141
5 06171
324440
21410623042
69518894
—5 493
—3 388780
—468
—424110
—98
—156—69
1 9721 648
—977—653
—124324467
—62
995
1 097
—507—90
4169
46-351
—31-136
-376
—504
1235
371
371—25
25
407
21104
(*)
— i77
13
-300
1961
II
7 4926 949
4 765150543451
22210924243
654193120
—5 539
—3 408776
—493
—425— 109— 101
—162—65
1 9531 410
—1 196—653
—120543473
—60
757
842
—274—130
2988
—27-204
-2-146
486
—365
217634
—320
-170-161
11
362
31152
79
-18
-443
III
7 3847 137
4 99388
247445
22412023344
71820270
—5 911
—3 831701
—493
—434— 111— 106
—167—68
1 4731 226
—888-641
—128247
—457—56
585
1 009
—480—158
40—73
-26—177
-45-90
-477
—576
936
-213
146124
-483
1,028
e
3— c
26-13
34
QSfi
86
IV
7 6997 34g
5 13593
351469
22512824645
70121096
—6 Oil
—3 883—724—489
—452— 115— 101
—171—76
1 6881 337
—990—639
— 125—351—457
— 57
698
— 1 232
—338—145
38—157
-129-393
-49-59
-559
—755
14551
768
510-54312
674
2665-1
3532
56
4fi1
-349
v Preliminary. n.a. Not available. *Less than $500,000 (±).1. Details for lines 3 and 15 are given in table 4; for lines 29, 42, 43, 56, and 57, in table 5;
for lines 37 through 40, in table 6; and for lines 58 and 59, in table 7.
2. Excludes undistributed profits of subsidiaries.3. Numerically equal to net foreign investment in U.S. national income and product
accounts.
Digitized for FRASER http://fraser.stlouisfed.org/ Federal Reserve Bank of St. Louis
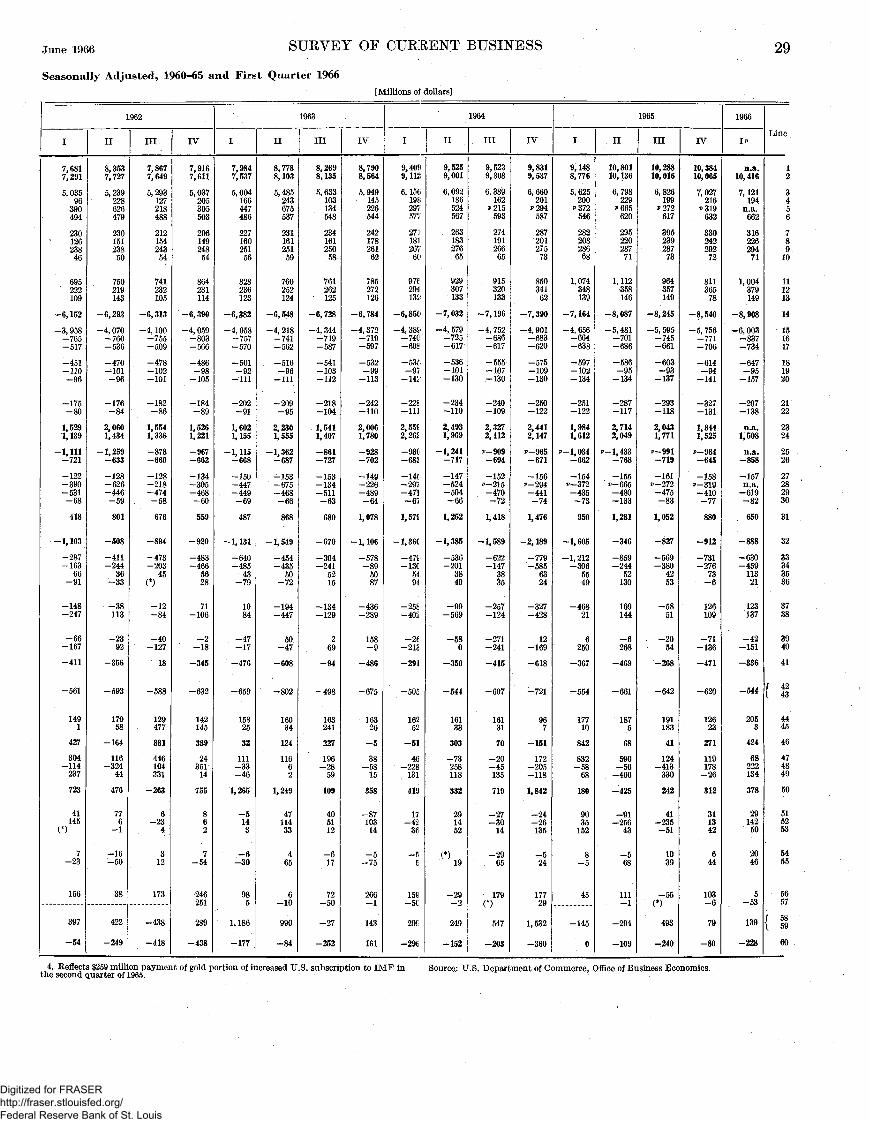
June 1966 SURVEY OF CURRENT BUSINESS
Seasonally Adjusted, 1960-65 and First Quarter 1966
[Millions oJ dollars]
29
I
7,6817,291
5,03596390494
23012623846
695222109
-6,152
-3, 958-765-517.
-451-110-96
-175-80
1,5291, 139
-1,111-721
-122-390-531-68
418
-1,103
-287-163
66-91
-148-247
-66-167
-411
-561
1491
427
304-114237
723
41145
(*)
7-23
156
397
-54
1
II
8,3537,727
5,239228626479
23015123850
750219143
-6,293
-4, 070-760-536
-470-101-96
-176-84
2,0601,434
-1,259-633
-128-626-446-59
801
-508
-411-244
36-33
-38113
-2392
-356
-593
17958
-164
116-324
44
476
776
-1
-16-50
38
422
-249
962
III
7,8677,649
5,293127218488
21215424354
741232105
-6,313
-4, 100-755-509
-478-102-101
-182-86
1,5541,336
-878-660
-128-218-474-58
676
-894
-473-203
45(*)
-12-84
-40-127
18
-588
129477
881
446104331
-263
6-234
312
173
-438
-418
IV
7,9167,611
5,037205305503
20614924854
864231114
-6,390
-4,059-803-566
-486-98-105
-184-89
1,5261,221
-967-662
-134-305-468-60
559
-920
-483-466
5628
71-106
o-18
-345
-632
142145
389
2435114
755
862
7
246251
289
-438
I
7,9847,537
5,004166447486
22716025156
828236123
-6,382
-4, 058-757-570
-501-92-111
-202-91
1,6021,155
-1,115-668
-150-447
. -449-69
487
-1,131
-640-485
43-79
1084
-47-17
-476
-659
15825
32
111-33-46
1,265
-5143
-6-30
985
1, 186
-177
II
8,7788,103
5,485243675537
23116125159
760252124
-6,548
-4, 218-741-562
-516-96-111
-209-95
2,2301,555
-1,362-687
-153-675-468-66
868
-1,549
-454-435
50-72
-194-447
50-47
-608
-802
16034
124
11662
1,249
4711433
465
6—10
990
-84
1963
III
8,2698,135
5,633103134548
23416125058
761262
- 125
-6,728
-4, 344-719-587
-541-103-112
-218-104
1,5411,407
-861-727
-153-134-511-63
680
-670
-304-241
5215
-134-129
269
-94
-498
163241
227
196-2859
109
405112
-617
72—50
-27
-252
IV
8,7908,564
5,949• 145
226544
24217826162
785272126
-6,784
-4, 372-719-597
-532-99-113
-242-110
2,0061,780
-928-702
-149-226-489-64
1,078
-1,106
-578-895087
-436-289
158-9
-486
-675
16326
-5
38-5815
358
-8710314
-5-75
2661
143
161
I
9,40J»9, 112;
6, 156198297577
27118126760
976294132
-6,85C>
-4, 38£<-74C-60S
-53£.-97-142
-228-111
2,55S2,262
-98C-683
-Ut-297-471-67
1,578
-1,36C
-47£-13C
54:94
-25*.-402
-26.-212
-291
-50£
16252
-51
46-228. 131
418
17-4236
E
15S— 5C
29£
-29C
II
9,5259,001
6,092186524567
26318327665
929307133
-7,032
-4, 579-725-617
-536-101-130
-234-110
2,4931,969
-1,241-717
-147-524-504-66
1,252
-1,385
-536-201
3840
-99-569
-580
-350
-544
16133
303
-73258118
332
291452
(*)19
-29—2
249
-152
1964
III
9,5239,308
6,389162
"215593
27419126665
915320133
-7, 196
-4, 752-686-617
-555-107-130
-240-109
2,3272,112
"-909-694
-152p-215-470-72
1,418
-1,589
-622-147
3835
-257-124
-271-241
-415
-607
16131
70
-20-45135
719
-27-3014
-2965
179(*\\ )
547
-203
IV
9,8319,537
6,660201"294587
28720127573
85034162
-7,390
-4, 901-683-620
-575-109-130
-250-122
2,4412,147
"-965-671
-156"-294-441-74
1,476
-2, 189
-779-585
6324
-327-428
12-169
-618
-721
967
-151
172-205-118
1,842
-24-26135
-524
17729
1,532
-360
I
9,1488,776
5,625200"372546
28220828668
1,074348139
-7, 164
-4, 656-664-638
-597-102-134
-251-122
1,9841,612
"-1,034-662
-154"-372-435-73
950
-1,605
-1,212-306
5549
-46821
6250
-367
-554
17710
842
832-5868
180
9035152
8-5
45
-145
0
II
10,80110, 136
6, 798229
"665620
29522028771
1,112•358146
-8,087
-5, 481-701-686
-586-95-134
-287-117
2,7142,049
"- 1,433-768
-155"-665-480-133
1,281
-346
-859-244
52130
169144
-6268
-469
-661
1875
68
590-56-466
-425
-91-256
43
-568
1111
-294
-109
1965
III
10,28810,016
6,826199
"272617
30523928773
964357149
-8,245
-5,595-745-661
-603-93-137
-293-118
2,0431,771
"-991-719
-161P-272-475-83
1,052
-827
-569-380
4253
-5851
- -2054
-268
-642
191183
41
124-413330
242
41-235-51
1039
-55(*\\ )
493
-240
IV
10,38410,065
7,027216
"319632
33024229272
81136578
-8,540
-5, 756-771-706
-614-94-141
-327-131
1,8441,525
"-964-645
-158"-319-410-77
880
-912
-731-276
73-6
126109
-71-136
-471
-620
12623
271
119178-26
312
311342
644
103—6
79
-80
1966
IP
n.a.10,416
7,121194n.a.662
31622629471
1, 004379149
-8,908
-6, 003-837-734
-647-95-157
-297-138
n.a.1,508
n.a.-858
-157n.a.-619-82
650
-888
-630-45911321
123137
-42-151
-336
-544
2053
424
68222134
378
2914250
2046
5—53
139
-228
Line
12
3456
78910
111213
14
151617
181920
2122
2324
2526
27282930
31
32
33343536
3738
3940
41
f 42I 43
4445
46
474849
50
515253
5455
5657
f 58\ 59
60
4. Reflects $259 million payment of gold portion of increased U.S. subscription to IMF inthe second quarter of 1965.
Source: U.S. Department of Commerce, Office of Business Economics.
Digitized for FRASER http://fraser.stlouisfed.org/ Federal Reserve Bank of St. Louis

30 SURVEY OF CURRENT BUSINESS June 1966
Table 3.—U.S. Balance of Payments and Reserve Position—Annual Balances, 1946-65;
[Millions of dollars]
Line
1
2
3
4
567
8
91011
12
13
14
15
16
17
18
19
20
Balance on liquidity basis — meas-sured by increase in U.S. officialreserve assets and decrease inliquid liabilities to all foreigners :
Seasonally adjusted; decreasein net assets (— ).
Less seasonal adjustment _
Before seasonal adjustment(lines 4 and 8, with signreversed).
U.S. official reserve assets (table1 line 46); increase (-).
Gold iConvertible currenciesIMF gold tranche position i_
Liquid liabilities to all for-eigners (table 1, lines 58 and59); decrease (— ).
To official agenciesTo commercial banks 2 _To other foreign residents
and unallocated 3.To international and re-
gional organizations.
Balance on official reserve transac-tions basis— measured by in-crease in U.S. official reserveassets and decrease in liquid andcertain no illiquid liabilities toforeign official agencies:
Seasonally adjusted; decreasein net assets (— ).
Less seasonal adjustment
Before seasonal adjustment(lines 16 through 18, with signreversed).
U.S. official reserve assets(line 4); increase (-).
Liquid liabilities to foreignofficial agencies (portionof line 9 4); decrease (— ).
Certain nonliquid liabili-ties to foreign official agen-cies; decrease (— ).
Liabilities of U.S. pri-vate residents (table1, portions of lines 53through 55).
Liabilities of U,S. Gov-ernment (table 1, por-tions of lines 56 and 57) .
1946
993
993
-623
—623
-370
n.a.n.a.n.a.
n.a.
n.a.
n.a.
-623
n.a.
n.a.
n.a
n.a
1947
4,210
4,210
-3, 315
—2, 162
-1,153
-895
n.a.n.a.n.a.
n.a.
n.a.
n.a.
-3, 315
n.a.
n.a.
n.a.
n.a
1948
817
817
-1,736
— 1, 530
-206
919
n.a.n.a.n.a.
n.a.
n.a.
n.a.
-1,736
n.a.
n.a.
n.a.
n.a.
1949
136
136
-266
— 164
-102
130
n.a.n.a.n.a.
n.a.
n.a.
n.a.
-266
n.a.
n.a.
n.a.
1950
-3,489
-3,489
1,758
1 743
15
1,731
n.a.n.a.n.a.
n.a.
n.a.
n.a.
1,758
n.a.
n.a.
n.a.
n.a.
1951
-8
-8
-33
—53
20
41
n.a.498
n.a.
n.a.
n.a.
n.a.
-33
n.a.
n.a.
n.a.
n.a
1952
-1,206
-1,206
-415
—379
-36
1,621
n.a.32
n.a.
n.a.
n.a.
n.a.
-415
n.a.
n.a
n.a
n.a
1953
-2, 184
-2, 184
1,256
1, 161
95
928
n.a.— 59n.a.
n.a.
n.a.
n.a.
1,256
n.a.
n.a
n.a
n.a
1954
-1,541
-1,541
480
298
182
1,061
n.a.1
n.a.
n.a.
n.a.
n.a.
480
n.a.
n.a
n.a
n.a
1955
-1,242
-1,242
182
41
141
1,060
n.a.410
n.a.
n.a.
n.a.
n.a.
182
n.a.
n.a.
n.a
n.a
1956
-973
-973
-869
—306
-563
1,842
n.a.428
n.a.
n.a.
n.a.
n.a.
-869
n.a
n.a
n.a
n.a
1957
578
578
-1,165
—798
-367
587
n.a.60
n.a.
n.a.
n.a.
n.a.
-1, 165
n.a
n.a
n.a
n.a
1958
-3,365.....
-3,365
2,292
2,275
17
1,073
n.a.48
n.a.
n.a.
n.a.
n.a.
2,292
n.a.
n.a
n.a
n.a
1959
-3,870
-3,870
1,035
1,075
-40
2,835
n.a.1, 158n.a.
n.a.
n.a.
n.a.
1,035
n.a
n.a
n.a
n.a
1960
-3,881
-3,881
2,143
1,702
441
1,738
1,449140
-188
337
-3,402
-3,402
2,143
1,259
1961
-2,370
-2,370
606
857-116-135
1,764
68158690
407
-1,347
-1,347
606
741
1962
-2,203
-2,203
1,533
89017
626
670
v 457-138
140
211
-2,706
-2,706
1,533
919
254
254
1963
-2,670
-2,670
378
461-113
30
2,292
1,673470385
-236
-2,044
-2,044
378
1,673
7
9
—16
1964
-2,798
-2,798
171
125-220
266
2,627
1,0731,454
345
-245
-1,546
-1,546
171
1,073
30?
148
154
1965
-1,355
-1,355
1,222
1,665-349-94
133
-17116306
-272
-1,302
-1,302
1,222
-17
97
-41
138
p Preliminary. n.a. Not available. 2. Includes deposits of foreign branches of U.S. banks and of foreign commercial banks,1. Keflects $259 million payment of gold portion of increased U.S. subscription to the IMF associated with their U.S.-dollar denominated liabilities to foreign official agencies,
in the second quarter of 1965.
Digitized for FRASER http://fraser.stlouisfed.org/ Federal Reserve Bank of St. Louis

June 1966 SURVEY OF CURRENT BUSINESS 31
Quarterly Balances, 1960-65 and First Quarter 1966; and Position at March 31, 1966
[Millions of dollars]
I
—876
-178
-698
160
50
110
538
102450-95
81
-409
-389
-20
160
-140
1
II
—694
134
-828
175
94
81
653
32514632
150
-453
147
-600
175
425
960
III
— 1,089
92
-1,181
739
637
102
442
48839
-96
11
-1,015
219
-1,234
739
495
IV
— 1,222
-48
-1,174
1,069
921
148
105
534-495-29
95
-1,525
23
-1,548
1,069
479
I
—566
—235
-331
371
371—2525
-40
44-21-115
52
-864
-441
-423
371
52
1£
II
198
125
73
-320
-170— 161
11
247
-31846076
29
774
158
616
-320
-296
61
III
—773
139
-912
-213
146124
-483
1,125
9008460
81
-454
261
-715
-213
928
IV
— 1,229
—29
-1,200
768
510—54312
432
556369
245
-803
22
-825
768
57
I
—824
—350
-474
427
304—114237
47
-65344740
213
—428
—539
111
427
-538
1
II
—258
64
-322
-164
116—324
44
486
462-250276
-2
—286
126
—412
-164
577
—I
1
962
III
—443
250
-693
881
446104331
-188
270-212-140
-106
—935
351
— 1,286
881
385
20
20
IV
—678
36
-714
389
2435114
325
378-123-36
106
— 1,057
62
— 1 119
389
495
235
235
I
— 1,218
—513
-705
32
11133
-46
673
27638676
-65
— 1,081
—692
—389
32
276
81
81
196
II
— 1,114
77
-1,191
124
11662
1,067
92681109
-49
—871
184
— 1 055
124
926
5
9
4
3
III
—200
396
-596
227
196—2859
369
320-2486
-13
471
—471
227
320
—76
76
IV
—138
40
-178
t
38—5815
183
15127114
-109
—92
37
— 129
f
151
—17
17
I
—248
—472
224
-51
46—228131
-173
-40025657
-86
—144
—629
485
-51
-400
—34
25
—59
1<
II
—552
80
-632
303
-73258118
329
2159346
-25
—326
215
—541
303
215
23
44
—21
)64
III
—617
404
-1,021
70
-2045135
951
389588114
-140
-231
450
—681
70
389
222
15
207
IV
—1381
-12
-1,369
-151
172—205-118
1,520
869517128
6
—845
-36
—809
-151
869
91
64
27
I
—697
—512
-185
842
832—5868
-657
-860164104
-65
-618
-659
41
842
-860
—23
—21
_2
]
II
226
37
189
68
590—56-466
-257
-107-206
82
-26
238
184
54
68
-107
—15
—28
13
L965
III
-534
472
-1,006
41
124—413330
965
25369772
-57
236
508
-272
41
253
—22
-20
—2
IV
-350
3
-353
271
119178-26
82
697-539
48
-124
-1,158
-33
-1,125
271
697
157
28
129
1966
I*
-563
-485
-78
424
68222134
-346
-833408112
-33
-245
-625
380
424
-833
29
47
-18
Amountsoutstand-
March 31,1966
15, 026
13,738559729
28, 786
15, 3727,8274,171
1,416
15, 026
15,372
676
163
513
Line
1
2
3
4
567
8
91011
12
13
14
15
16
17
18
19
20
May include U.S. Government bonds and notes held by foreign commercial banks. 4. Excludes changes in Treasury liabilities to certain foreign military agencies during1960-62, which are included in line 9.
Digitized for FRASER http://fraser.stlouisfed.org/ Federal Reserve Bank of St. Louis

32 SURVEY OF CURRENT BUSINESS June 1966
Table 4.—U.S. Merchandise Trade—Annual, 1960-65; Quarterly, 1964-65 and First Quarter 1966[Millions of dollars]
Line
1
2
3
4
5
6
7
89
10
11
12
13
14
15
16
17
181920
2122
23
2425262728
29
30
31
Merchandise exports, adjusted(table 1, line 3)
Plus merchandise exports, otherthan military grant shipmentsexcluded from line 1 but includedin Census data - 1
Less merchandise exports includedin line 1 but excluded fromCensus data 2
Less miscellaneous and specialadjustments to Census dataincorporated in line 1, net 3
Equals: Merchandise exports,Census basis, including reex-ports, excluding military grantshipments
Plus military grant shipmentsrecorded in Census data.
Equals: Merchandise exports,Census basis, including reex-ports and military grant ship-ments
Agricultural goodsNonagricultural goods
Excluding military grantshipments
Merchandise imports, adjusted(table 1 line 15)
Plus merchandise imports ex-cluded from line 11 but includedin Census data 4
Less merchandise imports includedin line 11 but excluded fromCensus data 5 _ _ _
Less miscellaneous and specialadjustments to Census data in-corporated in line 11 net 3
Equals: Merchandise imports,Census basis (general imports) . _
Food and beverages.-
Industrial supplies and' ma-terials -
Iron and steel _ _ _PetroleumOther
Consumer goods (nonfood)Passenger cars, new and
used - __ _Other _- _
Capital equipmentMachinery and partsTrucks and busesOther
All other, including uranium,and unclassified
Balance on merchandise trade,adjusted (line 1 less line 11)
Memorandum items:
Merchandise exports, adjustedexcluding those financecby U.S. Government grantsand capital outflows (line1 less line A .28 of table 5) 8 __
Balance on merchandise tradeadjusted, excluding exportsfinanced by U.S. Government grants and capital outflows (line 29 less line A. 28of table 5) 8
960
9,489
268
127
1
9,629
949
0,578
4,8325,746
4,797
4,732
482
126
70
5,018
3,209
7,59508
1,5485,53
2,45
541,91
60513
1,15
4,75
17,59
2,85
961
9,954
386
149
3
0,188
810
0,998
5,0245,974
5,164
4,510
394
125
65
14,714
3,259
7,3942
1,675,29
2,20
311,88
72551
15
1,13
5,44
17,74
3,23
962
0,604
531
111
51
0,973
727
1,700
5,0346,666
5,939
6,187
384
150
41
16,380
3, 514
8,198538
1,815,84
2,70
432,27
79651
12
1,17
4,41
18,27
2,08
1963
2,071
512
145
11
2,427
920
3,347
5,5847,763
6,843
6,992
341
157
38
17, 138
3,659
8,445692
1,835,922
2,89
462,42
867529
1,27
5,07
19,35
2,35
964
5,297
453
218
-139
5,671
818
6,489
6,3470,142
9,324
8,621
248
176
8,684
3,78
9,1582
1,916,42
3,38
592,79
1,09921
15
1,26
6,67
22,49
3,87
965
6,276
498
123
84
6,567
779
7,346
6,2291,117
0,338
1,488
174
204
92
21,366
3,82
10,561,262,097,19
4,11
663,44
1,521,24
225
1,33
4,78
23,50
2,02
1964
I
157
86
45
13
,185
241
,426
,590,836
,595
,349
72
44
4,372
890
2,180180494
1 50
71
1457
2521
£
32
1,80
5,51
1,16
II
309
124
29
-10
414
206
,620
,511,109
,903
,588
66
42
4,608
920
2,280210464
1 60
81
1565
2722
4
32
1,72
5,56
97
III
936
127
40
-13
,036
203
,239
,3934,846
,643
4,653
53
41
4,665
888
2,322048
1,63
90
1178
2722
3
28
1,28
5,24
59
V I
895
116
104
-129
,036
168
,204
,853,351
5,183
5,031
5
4
5,03
1,08
2,372247
1,67
95
1778
2924?
4
32
1,86
6,17
1,14
1965
I i
,615
98
36
84
,593
226
5 819
2324 587
4,361
4 597
51
3
4,60
75
2,372354
1,59
84
1470
3226
4
31
1,01
5,04
44
III
032
125
29
,128
247
,375
,618,757
5,510
5,488
49
5
5,48
96
2,793753
1,88
99
1781
3932
6
34
1,54
6,17
69
III
6,331
130
25
6,436
160
6,596
1,4925,104
4,944
5,487
37
4
32
75,14
89
2,573447
1,75
1,01
1288
3529
6:31
84
5, 65
16
IV
7,298
145
33
7,410
146
7,556
1,8875,669
5, 523
5,916
37
6
-23
7 6, 12
1,21
2,823054
1,97
1,26
221,03
4536418
36
1,38
6,63
71
966
IP
033
96
39
,090
158
7,248
1,6495,599
5 441
5,900
80
62
2
5,89
1,04
2,732456
1,91
1,26
3194
504126
35
1,13
6,27
37
Seasonally adjusted
1964
I
,156
6,173
1,617
4, 556
4,389
4,395
90
2,161945
1,51
75
1362
2420
3
31
1,76
n.a
n.a
II
,092
,185
1,501
4,684
4 579
4,53
92
2,231947
1,56
85
1569
2521
3
31
1,51
n.a
n.a
III
,389
,479
1,568
4 911
4,752
4,745
921
2,35204502
1,65
87
1472
2925j
31
30
1,63
n.a
n.a
Vi
,660
,789
1,655
5,134
4,90
4,89
99
2,382347
1,67
89
1672
2925
4!
32
1,75
n.a
n.a
1965
I i
,625
,568
1,257
4 311
4,656
4,65
78
2,362550
1,604
89
1276
3025
4
30
96
n.a
n.a
I i
,798
,870
1,602
5,268
5,481
5,45
97
2,733554
1,83
1,03
1786
3730
5
33
1,31
n.a
n.a
III
6,826
6,912
1,678
5 234
5,595
75,234
926
2, 609343494
1,772
97
156820
3832J
6
33
1,23
n.a
n.a
IV
7,027
7,106
1,689
5,417
5,756
75,944
1,118
2,832312546
1,974
1,179
212967
45736
1082
35
1,27
n.a
n.a
1966
IP
7,121
7,178
1,682
5, 496
6,003
6,001
1,062
2, 747268532
1,947
1,341
2841,057
4913972569
360
1,117
n.a.
n.a.
p Preliminary. n.a. Not available.1 Exports and imports in the fourth quarter of 1964 and the first two quarters of 1965 were
distorted by the longshoremen's strike in the first quarter of 1965.2.Consists mainly of exports of military equipment under Defense Department sales con-
tracts with foreign governments to the extent that such exports are included in the Censusdata. Also includes exports of domestically owned goods into storage abroad (e.g., U.S.grain stored in Canada); exports to the Panama Canal Zone; and exports of exposed motionpicture film for rental rather than sale.
3 Includes exports of domestically owned goods out of storage abroad (e.g., U.S. grainsold from storage in Canada); exports of electrical energy; exports of nonmonetary gold andsilver, and net sales of gold by U.S. private residents to the U.S. monetary gold stock;personal remittances in kind (gift parcels sent through the mail); and transfers, financedunder nonmilitary aid programs, of goods to recipient countries from Defense Departmentstocks located abroad.
4 Includes valuation adjustments for goods considered to be underpriced or overpricedin Census data; timing adjustments for goods recorded in the Census data in one period butknown to have been shipped in another period; and coverage adjustments for special situationsin which shipments are omitted from the Census data.
5 Consists mainly of Defense Department and other imports which duplicate in wholeor in part purchases (e.g., of nuclear materials) included in table 1, line 16 (Military expendi-tures) . Also includes imports of domestically owned goods returned from storage abroad(e.g., grain from storage in Canada); imports from the Panama Canal Zone; and foreigncharges for repair of U.S. vessels. ' ,6 Includes imports of electrical energy; and imports of nonmonetary gold and silver, andnet purchases of gold by the U.S. private residents from the U.S. monetary gold stock.
7 Imports in the third and fourth quarters of 1965 were distorted by the U.S. seamen sstrike and by changes in Customs Bureau procedures for verifying and handling importdocuments. An adjustment for these factors is included in lines 11 and 14 of the table, butcould not be carried into the commodity detail.8 The entries in this line reflect only an approximate measure of merchandise exports notfinanced by Government grants and capital outflows since Government financing of exportsmay not coincide with actual shipments.
Source: U.S. Department of Commerce, Office of Business Economics.
Digitized for FRASER http://fraser.stlouisfed.org/ Federal Reserve Bank of St. Louis

June 1966 SURVEY OF CUKKENT BUSINESS 33
Table 5.—Major U.S. Government Transactions—Annual, 1960-65; Quarterly, 1965 and First Quarter 1966[Millions of dollars]
Line
A. 1
la
234
56789
1011121314151617
18192021222324
2526
27
282930
313233
34
3. 1
la
23
456
789
1011
12
131415
3. 1
23
U.S. Government grants (excluding military) and capital outflows, total (table!,lines 29, 42, and 43, with sign reversed) _ _ N _. _ _
Seasonally adjusted
By category:Grants, net _ _ _ _ _Credits repayable i n foreign currencies _ _ _ _ _ _ _ _ _ _ _ _ _ .Other foreign currency assets (excluding administrative cash holdings), net.
Receipts from—Sales of agricultural commodities. __ _ _ _ __• _ _ __ _ _Interest . _ _ _ _ - _ _Repayments of principalReverse grants. _ _ _ _ _ _ _ _ _ _ _ _ _ _ _Other sources _ _ _ _ _ _ _.
Less disbursements for —Grants in the recipient's currency- _ _ _ _ _ _Credits in the recipient's currencyOther grants and creditsOther U.S. Government expenditures __ _
Capital subscriptions to international and regional organizationsCredits repayable in dollarsOther long-term assets, net__ _ _ _ _ _ _ _ _ _ _O ther short-term assets (including changes in administrative cash holdings) ,
net.
By program :Under farm product disposal programsUnder Foreign Assistance Acts and related programs _ _ _ ...Under Export-Import Bank ActSubscriptions to international and regional organizations, excluding IMF. .Other assistance programs _ _ _ _ _ _ _ _ _ _ _ _ _ _ _ _ _ _ _Other foreign currency assets acquired (lines A. 6, A. 7, and A. 9)Less foreign currencies used by U.S. Government other than for grants or
credits (line A. 13) _ _ _ _ _ ..Advances under Exchange Stabilization Fund agreements, netOther (including changes in administrative cash holdings), net
By disposition:^Estimated transactions involving no direct dollar outflow from the United
StatesExpenditures on U.S. merchandiseExpenditures o n U.S. services. _ _ _ _ _ _ _ _Military sales contracts financed by credits (including short-term, net)2
(line B.4)U.S. Government credits to repay prior U.S. Government credits 3
U.S. Government credits to repay prior U.S. private creditsIncrease in claims on U.S. Government associated with Government
grants and capital outflows (including changes in retained accounts)(line B.7)
Estimated dollar payments to foreign countries and international andregional organizations through U.S. Government grants and capitaloutflows _ _ _ _ _ _ _ _ _ _ _ _ _ _ ' _ _ _ _ _
U.S. Government liabilities associated with specific transactions (table 1, line 56);net increase (+)-- - -- - - - _ _ _ _ _ __ ___
Seasonally adjusted
Associated with military sales contracts 4
Defense and Treasury Departments receipts from foreign governments(including .'principal repayments to Defense Department), net of refunds;.
Plus sales contracts financed by U.S. Government credits 5 (line A. 30)Less Defense Department receipts from principal repayments. _ _ . _Less transfers of goods and services (including transfers financed by credits]
(table 1, line 4)
Associated with U.S. Government grants and capital outflows (line A.33)Non-interest-bearing securities issued to IDA _Non-interest-bearing securities issued to IDBNon-interest-bearing securities issued to UN for special programsForeign funds retained in U.S. Government accounts for purchases in tho
United StatesOther
Associated with other specific transactions _ _ _ _ _ _ _ _ _ _Purchase of Columbia River downstream power rightsU.S. Government nonmilitary sales and miscellaneous operations _ _ _ _ ....
Foreign holdings of nonmarketable, nonconvertible, medium-term U.S. Govern-ment securities not associated with specific transactions (table 1, line 57); netincrease (+) _ _
Export-Import Bank Portfolio Certificates of ParticipationU.S. Treasury securities not included elsewhere 6 .
1960
3,4053,405
1,664541573
1, 18769222741
17931244
23815450018
-45
1,2781,658
40515421
132
238-5
(*)
2,2791,898
300
1723
41
1,126
2626
-16
3281726
335
4158
-17
1
1
1961
4,0544,054
1,854758219
1,13374502329
26249060
278172
1,009
42
1, 3511,790
82217227
153
27823-6
2,9082,209
431
1562
111
80
1,146
8585
5
4171525
402
805825
-3
(*)
(*)
1962
4,2934,m
1,919862228
1,084115611667
37344819
275122
1,145
17
1,5031,949
621122111243
27520-1
3,2492,333
575
119093
147
1,044
61361S
470
1,1421127
656
14736
100
47
-4
-4
251
251
1963
4,5514,551
1, 917726433
1,216147931569
39342028
26662
1,399
14
1, 6712,158
50962
100309
26626
-18
3,7372,721
. 666
4817533
94
814
442'44*
347
964488
657
9414
43
361
1
1
-56
18-74
1964
4,263•4, MS
1,88688549
1, 313169887
22
53164723
349112
1, 361
-30
1, 7652,009
338112148279
349-31-8
3,5782, 801
594
3130
50
685
486486
228
98139
747
50152530
-14-6
208204
4
-23
-3-20
1965
Total
4,2774,277
1,80073914
980187922
53
33657213
379
1,754
-30
1, 4752,196
532
155332
379-18-16
3,5692,768
643
130113
-85
708
204204
314
1,08413056
844
-85-79
-15
10-1
-25-30
5
-7
-7(*)
I
935989
437256
-124
23044241
28
131212
3105
392
-26
31451094
4796
105-3
-18
752571150
1623
-8
183
4545
51
242167
200
-8-20
-2
113
2
2
II
1,2631,W
51020260
3265126
(*)8
90157
4100
487
4
516577148
3885
100-3
2
1,071853173
2842
-25
192
111111
130
336285
229
-25-21
5
5-14
6
6
-1
-1(*)
III
1,0471,117
43195
112
21539201
10
36513
83
405
4
349570112
3169
83-3
2
856678150
3824
-34
191
-55-55
-16
1813836
199
-34-20
-18
31
-5
-5
(*)
(*)
IV
1,0321,030
422186
-34
2095322
«7
79152
391
470
-12
296539178
3982
91-9-2
890666170
4824
-18
142
103103
149
325488
216
-18-18
(*)
1-1
-28-30
2
-6
-6(*)
1966
IP
1,1001,163
615106
-80
2154826
(*)3
212803
77
465
-6
368563143
3577
77-10
1
910760167
938
-64
190
55
71
25892
194
-64-36-8
-20
(*)(*)
-2
-2
-53
-53
p Preliminary. *Less than $500,000 (±).1. As reported by the operating agencies.2. Consists of transfers of military goods and services financed by U.S. Government credits and of advance payments to the Defense Department (on military sales contracts) financed
by credits extended .to foreigners by U.S. Government agencies other than the Defense Department.3. Includes estimated net accumulations of foreign currency from principal repayments recorded in line A. 7.4. Estimates for the 11 quarters in fiscal years 1964-66 for the several categories or transactions related to mi. ^ „ agones or transactions related to military sales contracts—other than for cash receipts—in this and the other
tables are based upon incomplete reports.5. Consists of transfers of military goods and services financed by U.S. Government credits (included in line B.6) and of increases in Defense Department liabilities (on military sales
contracts) which arise from advance payments to the Defense Department financed by credits to foreigners by U.S. Government agencies other than the Defense Department.6. Through the last period shown, all securities included here have been payable in foreign currencies.
Source: U.S. Department of Commerce, Office of Business Economics.
Digitized for FRASER http://fraser.stlouisfed.org/ Federal Reserve Bank of St. Louis
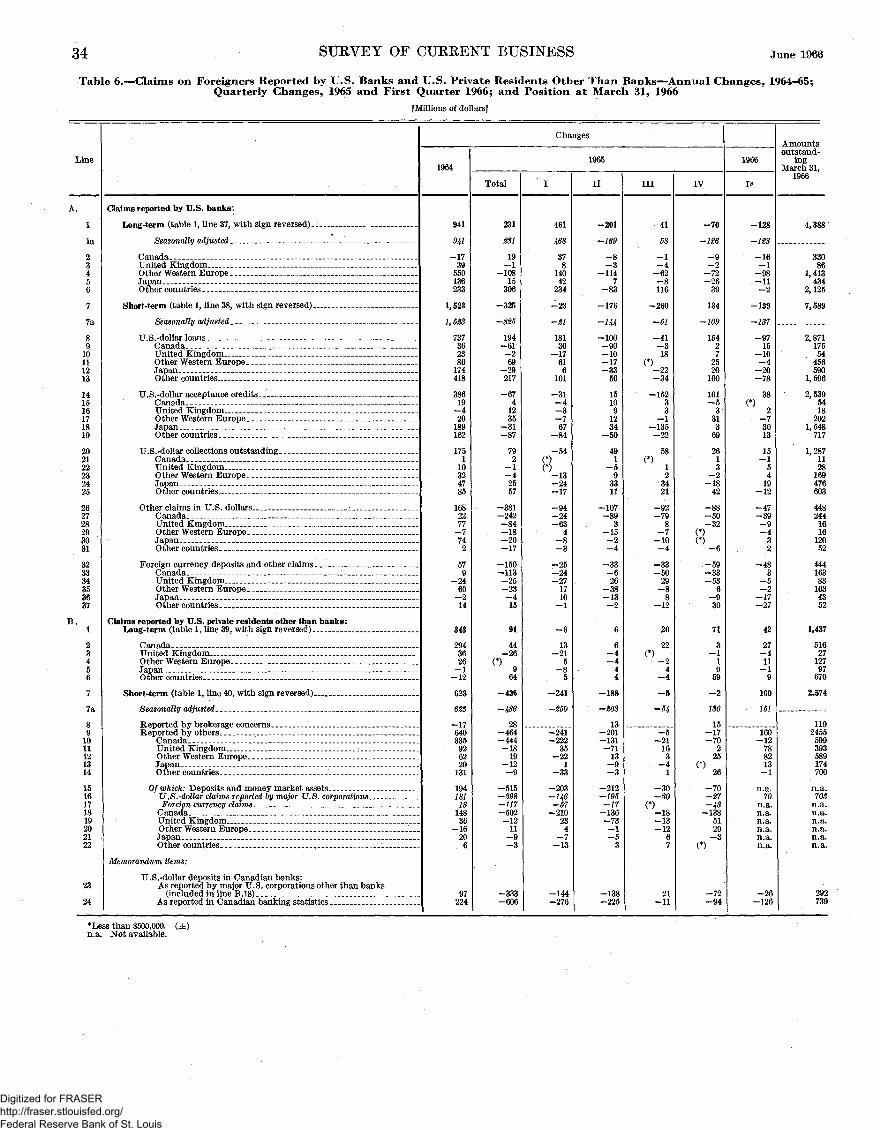
34 SURVEY OF CURRENT BUSINESS June 1966
Table 6.—Claims on Foreigners Reported by U.S. Banks and U.S. Private Residents Other Than Banks—Annual Changes, 1964-65;Quarterly Changes, 1965 and First Quarter 1966; and Position at March 31, 1966
[Millions of dollars]
Line
Changes
19641965
Total II III IV
1966
Amountsoutstand-
ingMarch 31,
1966
A.
91011121314
1516171819202122
23
24
Claims reported by U.S. banks:
Long-term (table 1, line 37, with sign reversed).
Seasonally adjusted
CanadaUnited Kingdom....___Other Western Europe.Japan - _ _ _0 ther countries
Short-term (table 1, line 38, with sign reversed).
Seasonally adjusted
U.S.-dollar loansCanada _.
10 United Kingdom11 Other Western Europe.12 Japan..13 Other countries •_
14 U.S.-dollar acceptance credits. .15 Canada _-16 United Kingdom17 Other Western Europe18 Japan19 Other countries
20 U.S.-dollar collections outstanding21 Canada _.22 United Kingdom23 Other Western Europe24 Japan25 Other countries
26 Other claims in U.S. dollars. i27 Canada28 United Kingdom29 Other Western Europe
Japan31 Other countries •
32 Foreign currency deposits and other claimsCanada _ _ _ : _ _
34 United Kingdom..35 Other Western Europe36 Japan37 Other countries ._
Claims reported by U.S. private residents other than banks:1 Long-term (table 1, line 39, with sign reversed)
2 CanadaUnited Kingdom
4 Other Western Europe5 Japan
Other countries
7 Short-term (table 1, line 40, with sign reversed)
7a Seasonally adjusted
Reported by brokerage concerns.Reported by others
CanadaUnited KingdomOther Western EuropeJapanOther countries .
Of which: Deposits and money market assetsU.S.-dollar claims reported by major U.S. corporations..Foreign currency claims
CanadaUnited KingdomOther Western EuropeJapan____Other countries ,
Memorandum items:
U.S.-dollar deposits in Canadian banks:As reported by major U.S. corporations other than banks
(included in line B. 18)_-As reported in Canadian banking statistics
941
-1739550136233
1,523
1,528
737362386174418
19-420189162
175I10324785
1682277-7742
579
-2460-214
343
2943626-1-12
-17640335926220131
1941811314836
-1620
97224
231
19-1
-10815306
-325
194-61-269
-29217
-6741235
-31-87
792
-1-42557
-381-242-84-18-20-17
-150-113-25-23-415
91
44-26
64
436
28-464-444-1819
-12
-515-398-117-502-1211q-3
-333
461
378
14042234
-23
-21
18130
-17616
101
-31-4-3-767
-84
-54(*)(*)-13-24-17
-94-24-634
-25-24-271710-1
-6
13-21
5-85
-241
-241-222
35-22
1-33
-203-146-57-210
234
-7-13
-144-276
-201
-169
-1147
-83
-176
-144-100-90-10-17-3350
151091234
-50
491
-593311
-107-893
-15-2-4
26-38-13-2
6-4-444
-188
13-201-131-7113-9-3
-212-195-17-136-73—1-53
-138-225
41
58
—1-4-62-8116
-260
-61
-41-318
(*)-22-34
-15233i
-135-22
(*)
-92-798
—7-10-4
-5029
-12
(*)
20
22
-24
-4
-5
-5-21163
-41
-30-80
(*)-18-13-12
21-11
-70
—186
-9-2-72-26
134
-109
154272520100
101-5331
2613
-2-1842
-50-32
-536
-930
71
3-11
15-17-70225
.(*)26
-70-27-43-138
5120-3
(*)
-72-94
-16-1-98-11-2
-139
-137
-9715
-10-4-20-78
(*)38
2-73013
15-15419
-12
-47
-432
-483
-5-2-17-27
42
27-411-19
160
151
160-12788213-1
n.a.70
n.a.n.a.n.a.n.a.n.a.n.a.
-26-126
4,388'
33086
1,413434
2,125
7,589
2,87117554456590
1, 596
2,5395418202
1,548717
1,2871128169476
448244161612052
444163831034352
1,437
5162712797670
2,574
1192455599393589174700
n.a.703n.a.n.a.n.a.n.a.n.a.n.a.
292739
*Less than $500,000. (±)n.a. Not available.
Digitized for FRASER http://fraser.stlouisfed.org/ Federal Reserve Bank of St. Louis

June 1966 SURVEY OF CURRENT BUSINESS 35
Table 7.—U.S. Liquid Liabilities to Foreigners—Annual Changes, 1960-65; Quarterly Changes, 1965 and First Quarter 1966; andPosition at March 31, 1966
[Millions o:: dollars]
Line
1
2
3456
7g9
10111213
14
15
16171819
20
212223
2425
26
272829
3031
Liquid liabilities to all foreigners (table 1, lines 58 and 59; table 3, lines 8through 12)
To foreign official agencies _~
Central banks and governments _ _ _ _Demand deposits _Time deposits 1 - _ _Other private obligations, mainly money market paper L... .
U.S. Government obligations:Short-term securities and other obligations
-.Payable in U.S. dollars 2Payable in foreign currencies _ _ _ _ _
Bonds and notes, marketable _ __Bonds and notes, nonmarketable, convertible _ _-
Payable in U.S. dollarsPayable in foreign currencies
International Monetary Fund 3
To foreign commercial banks _ _ _ _ _ _ _ _ _
Dema'nd deposits - —Time deposits 1 - ~ ~Other private obligations, mainly money market paper L_U S Government short-term securities
To other foreign residents and unallocated _ _ _
Demand deposits - -Time deposits *Other private obligations, mainly money market paper 1 _ _.
U.S. Government obligations:Short-term securities _Bonds a n d notes _ _ _ _ _
To international and regional organizations not included above
Demand depositsTime deposits 1 _ _ _Other private obligations, mainly money market paper *
U.S. Government obligations:Short-term securitiesBonds and notes _ _ __
1960
1,738
1, 449
1,149[• 204
400
645645
-100
300
140
I 841-284-417
-188
1 1C
/ 16
-38
-1682
337
\ UK> 145-6
82116
196:L
1,764
681
681351110
20616046
14
K86
1544-26-32
90
L26-2
-1-33
407
13555
-237454
1962
670
457
457—127-164
887885
2
-139
-138
—2396140
140
119122
-33-68
211
18582
278-334
1963
2 292
1,673
1,673619114
-229-211-18
466703150653
470
263222-15
385
363117
2-97
-236
—114-7
-356241
.
1964
2 627
1, 073
1,073/ 189\ 369
223
—246
-30
-59375
375
1,454
/ 903I 129
34874
345
r 31\ 291
33
-4737
-245
r -51 -177
176
16-255
Changes
Total
133
-17
—51-56
46224
—368—368
-20123
i2~s34
116
-86-67298
—29
306
44323
-171
1595
-272
-23-7
-30
-61—151
I
—657
-860
-860-105
3651
—909-909
1651
51
164
22-74
66150
104
1090-2
7-1
-65
-41519
10-105
1965
II
—257
-107
—107127
-55137
—301-301
-15
—206
-29026
107-49
82
-1956
-54
792
-26
2-30-12
131
5
III
965
253
245-73-16-35
249249
-2122
122
g
697
55822
225-108
72
-1774
-20
-540
-57
4124
-73-4
IV
82
697
671—58171
593693
-19-50
-50
26
-539
-376-41
-100—22
48
70103
—95
6-36
-124
-25-4
-41
-11-43
1966
IP
—346
-833
—96440g
-208
-434-751
317
—5-365
—365
131
408
486-158
83—3
112
-4511223
220
-33
13147
129-196
Amountsoutstand-
ingMarch 31,
1966
28 78(
15 372
14 40'1 57,2,87(1, 27,
6 75$6,43i
sr1 10(
QOf
15(.68i
96.
7 82'
5 42$74,
1, 54510<
4,17
1,53(1,70
35<
8149S
1,41
5,21,29
29<55(
v Preliminary.1. With maturity of 1 year or less; negotiable certificates of deposit with a maturity of 1
year or less are included with money market paper.2. Includes changes in Treasury liabilities to certain foreign military agencies during
1960-62.
3. Includes liabilities of U.S. monetary authorities for gold deposited by and held for IMF.Excludes dollar holdings of IMF except holdings acquired through gold sales to the UnitedStates with the option to reverse the transactions. These reversible transactions amountedto $200 million in 1956, $300 million in 1959, and $300 million in 1960.
Digitized for FRASER http://fraser.stlouisfed.org/ Federal Reserve Bank of St. Louis
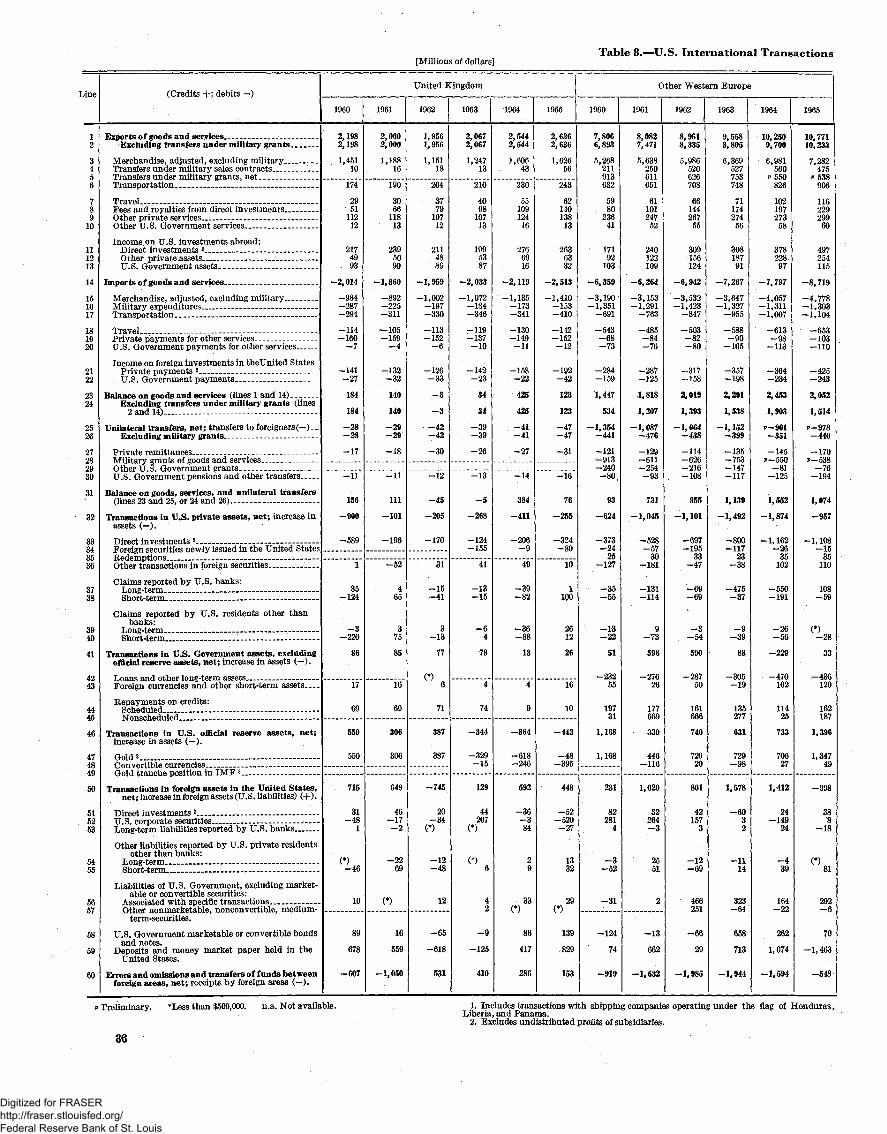
[Millions of dollars]Table 8.—U.S. International Transactions
Line
12
3456
789
10
111213
14
151617
181920
2122
2324
2526
27282930
31
32
33343536
3738
3940
41
4243
4445
46
474849
50
515253
5455
5657
58
59
60
(Credits -f; debits -)
Exports of goods and services -Excluding transfers under military grants
Merchandise, adjusted, excluding military _ _ _ _ _Transfers under military sales contractsTransfers under military grants, netTransportation _ _
Travel - -Fees and royalties from direct investmentsOther private servicesOther U.S. Government services _ _ .
Income on U.S. investments abroad:Direct investments 2
Other private assets -U.S Government assets
Imports of goods and services •.-.
Merchandise adjusted, excluding military _ _Military expendituresTransportation
Travel - - - - - -Private payments for other servicesU S Government payments for other services
Income on foreign investments in theUnited StatesPrivate payments 2
U S Government payments _ _ _
Balance on goods and services (lines 1 and 14)Excluding transfers under military grants (lines
2 and 14) - -_
Unilateral transfers, net; transfers to foreigners (—)__ .Excluding military grants
Private remittancesMilitary grants of goods and servicesOther U S Government grantsU.S. Government pensions and other transfers
Balance on goods, services, and unilateral transfers(lines 23 and 25 or 24 and 26). -
Transactions in U.S. private assets, net; increase inassets (— ).
Direct investments 2 - ---Foreign securities newly issued in the United StatesRedemptions -Other transactions in foreign securities _ _ _
Claims reported by U.S. banks:Long-term - _Short-term _
Claims reported by U.S. residents other thanbanks:
Transactions in U.S. Government assets, excludingofficial reserve assets, net; increase in assets (— ).
Foreign currencies and other short-term assets
Repayments on credits:
Transactions in U.S. official reserve assets, net;increase in assets (— ).
GoldsConvertible currencies
Transactions in foreign assets in the United States,net ; increase in foreign assets (U.S. liabilities) (+) .
U S corporate securities ;Long-term liabilities reported by U.S. banks
Other liabilities reported by U.S. private residentsother than banks:
Long-term .
Liabilities of U.S. Government, excluding market-able or convertible securities:
Associated with specific transactions _ _ __Other nonmarketable, nonconvertible, medium-
term-securities.
U.S. Government marketable or convertible bondsand notes.
Deposits and money market paper held in theUnited States.
Errors and omissions and transfers of funds betweenforeign areas, net; receipts by foreign areas (-).
United Kingdom
1960
2,1982,198
1,45110
174
29• 5111212
2174993
-2,014
-984-287-294
-114-160
-7
-141-27
184
184
-28-28
-17
-11
156
-900
-589
1
35-124
-3-220
86
17
69
550
550
715
31-48
1
(*)-46
10
89
678
-607
1961
2,0002,000
1,18816
190
3066
11813
2395090
-1,860
-892-225-311
—105-159
-4
-132-32
140
140
-29-29
-18
-11
111
-101
-196
-52
465
375
85
16
69
306
306
649
46-17-2
-2269
(*)
16
559
-1,050
1962
1,9561,956
1,15118
204
3779
10712
2114889
-1,959
-1,002-197-330
-113-152
-6
-126-33
-3
-3
-42-42
-30
-12
-45
-205
-170
31
-15-41
3-13
77
(*)6
71
387
387
-745
20-34
(*)
-12-48
12
-65
-618
531
1963
2,0672,067
1,24713
210
4098
10713
1995387
-2,033
-1,072-184-346
-119-137-10
-142-23
34
34
-39-39
-26
-13
-5
-268
-124-155
41
-13-15
-64
78
4
74
-344
-329-15
129
44207
(*)
<%
42
-9
-125
410
1964
2,5442,544
1,60643
230
5510912416
2766916
-2, 119
-1,135-173-341
-130-149-11
-158-22
425
425
-41-41
-27
-14
384
-411
-206-9
49
-39-82
-36-88
13
4
9
-864
-618-246
592
-36Q
84
29
33(*)
86
417
286
1965
2,6362,636
1,62656
243
6214013813
2636332
-2,513
-1,410-153-410
-142-152-12
-192-42
123
123
-47-47
-31
-16
76
-255
-324-80
10
1100
2612
26
16
10
-443
-48-395
443
-52-520-27
1332
29(*)
139
829
153
Other Western Europe
1960
7,8066,893
5,268211913632
5980
23641
17192
103
-6,359
-3,190-1,351
-691
-543-68-73
-284-159
1,447
534
-1,354-441
-121^913-240-80.
93
-624
-373—24
25-127
-35-55
-13-22
51
-23255
19731
1,168
1, 168
231
82281
4
-3-52
-31
-124
74
-919
1961
8,0827,471
5,638250611651
61101247
52
240122109
-6,264
-3,153-1,291
-763
-485-84-76
-287-125
1,818
1,207
-1,087-476
-129-611-254-93
731
-1,045
-528-57
30-181
-131-114
9-73
596
-27626
177669
330
446-116
1,020
32264-3
2551
2
-13
662
-1,632
1962
8,9618,335
5,986520626708
6614426755
309156124
-6,942
-3,532-1,423
-847
-503-82-80
-317. -158
2,019
1,393
-1,064-438
-114-626-216-108
955
-1, 101
-697-195
33-47
-69-69
-3-54
590
-28750
161666
740
72020
801
42157
3
-12-69
466251
-66
29
-1,985
1963
9,5588,805
6,369527753748
71174274
56
30818791
-7,267
-3,647-1,327
-955
-588-90
-105
-357-198
2,291
1,538
-1,152-399
-135-753-147-117
1,139
-1,492
-800-117
23-38
-475-37
-9-39
88
-305-19
135277
631
729-98
1,578
-6032
-1114
323-64
658
713
-1,944
1964
10,2509, 700
6,981560
P550826
10219727358
378228.97
-7,797
-4,057-1,311-1,007
-613-98
-113
-364-234
2,453
1,903
p-901-351
-145*-550
-81-125
1,552
-1,874
-1, 162-26
35102
-550-191
-26-56
-229
-470102
11425
733
70627
1,412
24-149
24
-439
164-22
262
1,074
-1,594
1965
10,77110,233
7,282475
*>538906
116229299
60
497254115
-8,719
-4,778-1,303-1,104
-653-103-110
-425-243
2,052
1,514
z-978-440
-170p-538
-76-194
1,074
-957
-1, 108-15
35110
108-59
(*)-28
33
-436120
162187
1,396
1,34749
-998
388
-18
(*)81
292-6
70
-1,463
-548
Preliminary. *Less than $500,000. n.a. Not available.
36
1. Includes transactions with shipping companies operating under the flag of Honduras,Liberia, and Panama.
2. Excludes undistributed profits of subsidiaries.
Digitized for FRASER http://fraser.stlouisfed.org/ Federal Reserve Bank of St. Louis
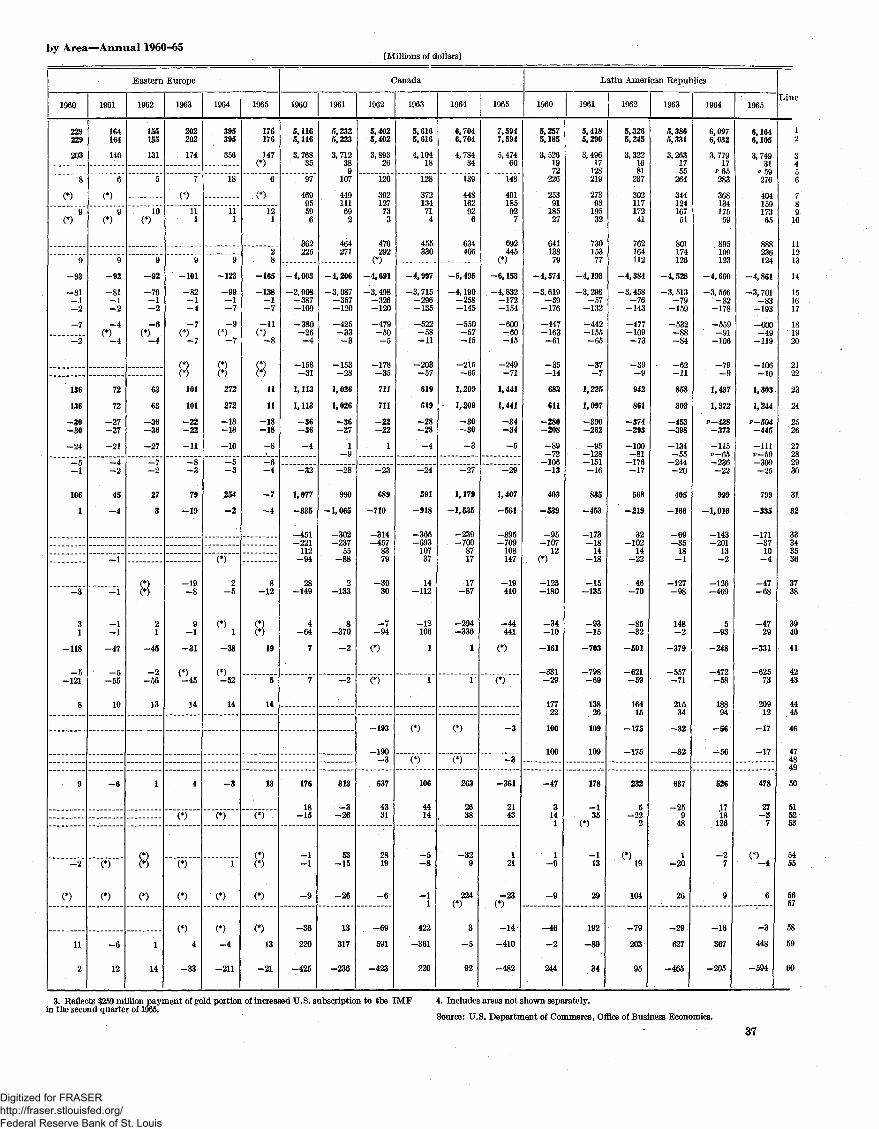
by Area—Annual 1960-65[Millions of dollars]
Eastern Europe
1960
229229
203
8
(*)
9(*)
9
-93
-81—1-2
-7
-2
136
136
-30-30
-24
-5-1
106
1
-3
31
-118
-5-121
8
9
-2
(*)
11
2
1961
164164
140
6
(*)
9(*)
9
-92
-81-1-2
-4(*)
-4
72
72
-27-27
-21
-4-2
45
-4
1
-1
-1-1
-47
-5-55
10
-6
(*)
(*)
-6
12
1962
155155
131
5
16(*)
9
-92
-79-1-2
-6(*)
63
63
-36-36
-27
-7-2
27
3
821
-45
-2-56
13
1
8•(*)
l
14
1963
202202
174
7
(*)
111
9
-101
-82-1-4
-7(*)
(*)(*)
101
101
-22-22
-11
-8-3
79
-19
-19-8
9-1
-31
(*)-45
14
4
(*)
(*)
(*)
(*)
4
-33
1964
395395
356
18
111
9
-123
-99-1-7
-9(*)
(*)(*)
272
272
-18-18
-10
-5-3
254
-2
(*)
2-5
(*)
-38
(*)-52
14
-3
(*)
1
(*)
(*)
-4
-211
1965
176176
147(*)
6
.(*)
121
28
-165
-138-1_IT
-11
(*)-8
81111
-18-18
-8
-6-4
-7
-4
8-12
(*)(*)
19
5
14
13
(*)
(*)•(*)
(*).
(*)
13
-21
Canada
1960
5,1165,116
3,76835
97
46995596
362225
-4,003
-2,908-387-109
-380-26-4
-158-31
1,113
1,113
-36-36
-4
-32
1,077
-835
-451-221
112-94
28-149
4-64
7
7
176
18-15
-1-1
-9
-36
220
-425
1961
5,2325,223
3, 712389
107
449111692
464271
-4,206
-3, 087-357-120
-425-33~3
-153-28
1,026
1,026
-36-27
1—9
-28
990
-1,065
-302-237
55' -88
2-133
8-370
-2
-2
313
-3-26
53-15
-26
13
317
-236
1962
5,4025,402
3,89326
120
392127733
476292
(*)
-4,691
-3,498-326-120
-479-50-5
-178-35
711
711
-22-22
1
-23
689
-710
-314-457
8379
-3030
-7-94
(*)
(*)
-193
-190-3
637
4331
2819
-6
-69
591
-423
1963
5,6165,616
4,10418
128
372134714
455330
-4,997
-3, 715-296-135
-522-58-11
-203-57
619
619
-28-28
-4
-24
591
-918
-365-693
10737
14-112
-12106
1
1
(*)
(*)
106
4414
-5-8
-11
422
-361
220
1964
6,7046,704
4,78434
139
448162926
634405
-5,495
-4,190-258-145
-550-57-15
-215-65
1,209
• 1,209
-30-30
-3
-27
1,179
-1,535
-239-700
8717
17. -87
-294-336
1
1
(*)
(*)
263
2638
-329
224(*)
3
-5
92
1965
7,5947,594
5,47460
148
491185927
692445
(*)
-6,153
-4, 832-172-154
-600-60-15
-249-71
1,441
1,441
-34-34
-5
-29
1,407
-561
-895-709
108147
-19410
-44441
(*)
(*)
-3
-3
-361
2143
121
-23(*)
-14
-410
-482
Latin American Republics
1960
5,2575,185
3,5261972
226
25391
18527
64113879
-4,574
-3,619-59
-176
-447-163-61
-35-14
683
611
-280-208
-89-72
-106-13
403
-539
-95-107
12(*)
-125-180
-34-10
-161
-331-29
17722
100
100
-47
3141
1-9
-9
-46
-2
244
1961
5,4185,290
3,49617
128219
27398
19532
73015377
-4, 193
-3, 298-57
-132
-442-155-65
-37-7
1,225
1,097
-390-262
-95-128-151-16
835
-453
-173-18
14-18
-15-135
-93-15
-703
-798-69
13826
109
109
178
-135
(*)
i13
29
192
-89
34
1962
5,3265,245
3,3221681
237
30211717241
762164112
-4,384
-3,458-76
-143
-477-109-73
-39-9
942
861
-374-293
-100-81
-176-17
568
-219
32-102
14-22
46-70
-85-32
-501
-621-59
16416
-175
-175
232
5-22
2
'(*)19
104
-79
203
95
1963
5,3865,331
3,2631755
264
34412416751
801174126
-4,528
-3, 513-79
-159
-532-88-84
-62-11
858
803
-453-398
-134-55
-244-20
405
-166
-69-35
18-1
-127-98
148-2
-379
-557-71
21534
-32
-32
637
-259
48
1-20
26
-29
627
-465
1964
6,0976,032
3,77917
*65283
36813417559
895199123
-4,660
-3, 556-82
-178
-559-91
-106
-79-9
1,437
1,372
p-438-373
-115p-65-236-22
999
-1,016
-143-201
13-2
-126-469
5-93
-248
-472-58
18894
-56
-56
526
,1718
126
-27
9
-16
367
-205
1965
6,1646, 105
3,74931
* 59276
40415917365
888236124
-4,861
-3, 701-83
-193
-600-49
-119
-106-10
1,303
1,244
p-504-445
-111*-59-309-25
799
-335
-171-37
10-4
-47-68
-4729
-331
-62573
20912
-17
-17
478
27-3
7
(<)-4
6
-3
448
-594
Line
12
3456
789
10
111213
14
151617
181920
2122
23
24
2526
27282930
31
32
33343536
3738
3940
41
4243
44.45
46
474849
50
515253
5455
5657
58
59
60
3. Reflects $259 million payment of gold portion of increased U.S. subscription to the IMFin the second quarter of 1965.
4. Includes areas not shown separately.
Source: U.S. Department of Commerce, Office of Business Economics.
37
Digitized for FRASER http://fraser.stlouisfed.org/ Federal Reserve Bank of St. Louis

38 SURVEY OF CURRENT BUSINESS June 1966
Table 8.—U.S. International Transactions
Line
12
3456
789
10
111213
14
151617
181920
2122
2324
2526
27282930
31
32
33343536
3738
3940
41
4243
4445
46
474849
50
515253
5455
5657
5859
60
(Credits +; debits -)
Exports of goods and services _Excluding transfers under military grants
Merchandise, adjusted , excluding military _ ._ _ _ _Transfers under military sales contractsTransfers under military grants, netTransportation __ __ _ _ _ _ -
Travel --Fees and royalties from direct investments _ _ ._ ..Other private servicesOther U.S. Government services
Income on U.S. investments abroad:Direct investments 2
Other private assetsU.S. Government assets ..
Imports of goods and services
Merchandise, adjusted, excluding military _ _Military expendituresTransportation
TravelPrivate payments for other services - -U.S. Government payments for other services
Income on foreign investments in the United States:Private payments 2
U S Governme nt payments
Balance on goods and serviceis (lines 1 and 14)Excluding transfers under military grants (lines 2 and 14) ._
Unilateral transfers net; transfers to foreigners ( — )Excluding military grants
Private remittances - --Military grants of goods and services --Other U S Government grants - -U S. Government pensions and other transfers
Balance on goods, services, and unilateral transfers (lines 23and 25, or 24 and 26).
Transactions in U.S. private assets, net; increase in assets (-)__
Direct investments ^Foreign securities newly issued in the United StatesRedemptionsOther transactions in foreign securities
Claims reported by U.S. banks:Long-term - -Short-term
Claims reported by U.S. residents other than banks:Long-term -Short-term _
Transactions in U.S. Government assets, excluding officialreserve assets, net; increase in assets (— ).
Loans and other long-term assetsForeign currencies and other short-term assets
Repayments on credits:ScheduledNonscheduled
Transactions in U.S. official reserve assets, net; increase inassets (— ).
Gold 3 -Convertible currencies -- .;Gold tranche position in IMF 3
Transactions in foreign assets in the United States, net; in-crease in foreign assets (U.S. liabilities) (+ ).
Direct investments 2
U S corporate securitiesLong-term liabilities reported by U.S. banks.—
Other liabilities reported by U.S. private residents other thanbanks:
Long-tern; -
Liabilities of U.S. Government, excluding marketable orconvertible securities:Associated with specific transactionsOther nonmarketable, nonconvertible, medium-term
securities.
U.S. Government marketable or convertible bonds and notes-Deposits and money market paper held in the Unite* States-
Errors and omissions and transfers of funds between foreignareas, net; receipts by foreign areas (— ).
Other countries
Total
I960*
8,1357,355
5,26054
780480
6573
22867
96010365
-5,628
-3, 916-984-267
-241-21
-109
-47-43
2,5071,727
-2,283-1,503
-227-780
-1,199-77
224
-858
-154-106
33-49
-58-484
-2-38
-891
-571-450
130
150
150
426
737
(*)
420
7
19332
949
1961*
8,8638,146
5,78057
717510
7279
24975
1,07815195
-5,747
-3, 961-1,050
-260
-274-14
-118
-45-25
3,1162,399
-2,370-1,653
-233-717
-1,335-85
746
-1,525
-392-199
31-62
4-807
-53-47
-782
-801-163
1811
109
109
-r26
-156
(*)
C)57
22
-35-125
1,478
19624
9,7158,883
6,12163
832558
8110426993
1,260197137
-6,465
-4,560-1,060
-300
-307-18
-130
-56-34
3,2502,418
-2,521-1,689
-240-832
-1,366-83
729
-953
-431-238
57-39
-59-174
-41-28
-1,094
-1, 098-184
188
90
90
538
22-14
(•*)•
-3-36
1
-7575
690
1963
10, 68110,007
6,91471
674605
107122306110
1,352235185
-6,904
-4,894-1,049
-334
-322-17
-157
-91-40
3,7773,103
-2,426-1,752
-291-674
-1,376-85
1,351
-1,523
-591-250
35-33
-134-511
33-72
-1,344
-1,247-314
20215
24
24
585
-82711
2-15
345
2527
907
1964
11,96411,249
7, 79192
v 715659
122148324123
1, 460316214
-7,582
-5, 495-1,009
-369
-340-19
-186
-120-44
4,3823,667
*>-2,522-1,807
-297p-715
-1,423-87
1,860
-1,631
-586-123
4016
-245-689
8-52
-1,134
-1, 353-35
2504
3
41
731
-36-6
2
-348
11-1
10706
171
1965
12,88611,855
7,998222
9 1,031661
139186345138
1, 552382232
-8,954
-6, 511-1, 169
-433
-394-20
-216
-161-50
3,9322,901
p-2,750-1,719
-300"-1,031-1,321
-98
1,182
-1,383
-830-186
40-35
-282-46
-26-18
-1,326
-1, 432-198
28222
40
40
802
378
30
516
-3-1
4706
685
Japan
1961
2,1242, 124
1,76724
119
1310777
158012
-1,612
-1,054-385-91
-46-4-7
-6-19
512512
-27-27
-21
_2-4
485
-828
-29-61
2-11
-4-670
-30-25
-23
-644
37
-256
(*)32
9
(*)-297
622
1962
1,9511,951
1,54024
118
1314837
2511215
-1,938
-1,358-378-108
-50-6-7
-16-15
1313
-28-28
-21
-1-6
-15
-527
-54-101
4-23
-51-212
-57-33
-56
-983
39
535
25
(*)-15
(*)
(*)524
63
1963
2,2942,294
1,82025
127
2015889
2613331
-2, 118
-1,497-362-126
-52-5
-12
-40-24
176176
-32-32
-25
(*)
144
-839
-68-164
9-29
-155-431
35-36
-53
-93-21
61
250
-1111
3-28
-5
(*)289
498
1964
2,5252,525
1,97416
136
2518
1008
3118433
-2,370
-1,769-312-136
-54-6
-16
-53-24
155155
-29-29
-21
-1-7
126
-697
-78
18(*)
-136-482
1-20
50
-183
65
-1
I
200
-38
"i-4
7
1
(*)235
322
1965
2,6922,692
2,05131
148
2620
11312
5020932
-3,082
-2,427-323-154
-60-6
-14
-73-25
-390-390
-30-30
-22
(*)-8
-420
-12
-21-52
77
-1559
-912
62
-245
6714
292
33
2
C ) 4
1
4247
78
NOTE.—See footnotes on pp. 36 and 37.
Digitized for FRASER http://fraser.stlouisfed.org/ Federal Reserve Bank of St. Louis
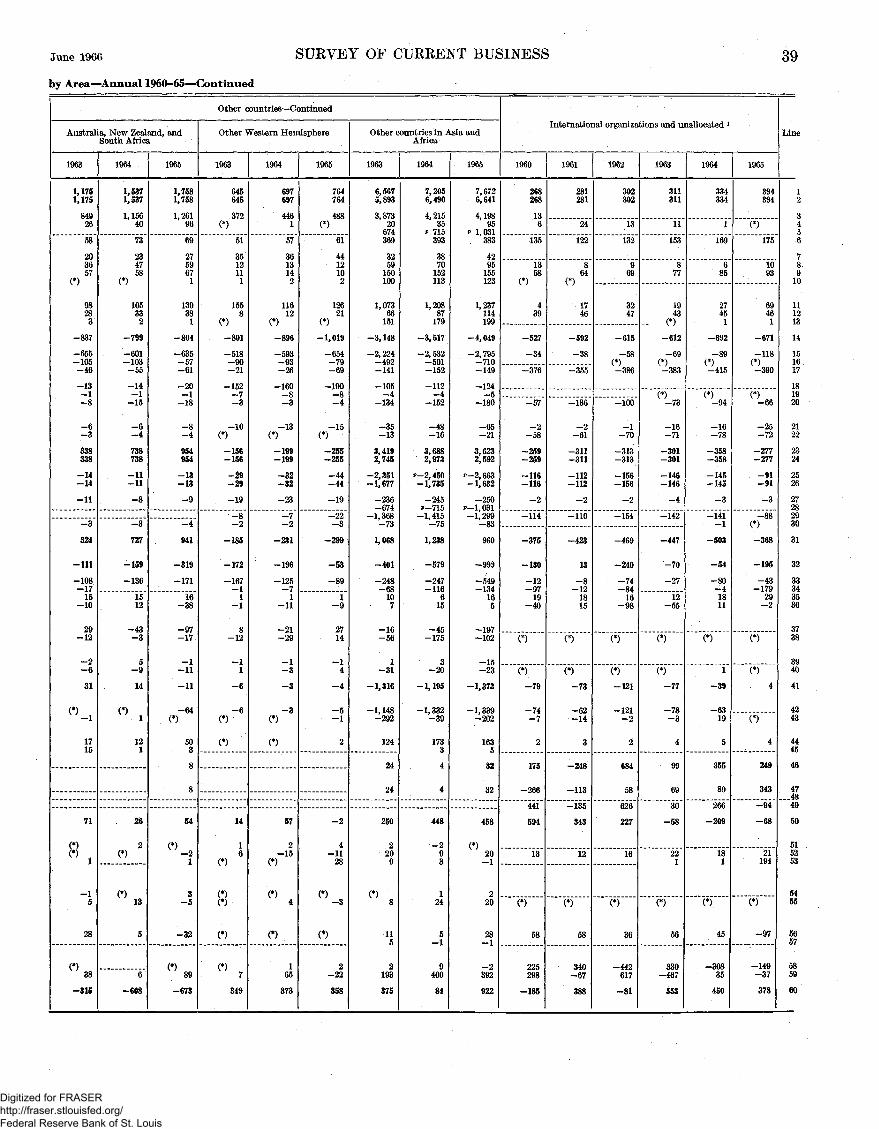
June 1966
by Area—Annual 1960-65—Continued
SURVEY OF CURRENT BUSINESS 39
Other countries— Continued
Australia, New Zealand, andSouth Africa
1963
1,1751,175
84926
68
203657
(*)
98283
-837
-655-105-46
-13
-8
-6-3
338338
-14-14
-11
-3
324
-111
-108-17
15-10
29-12
-2-6
31
"-i1715
71
8,_ i
5
28
• w «-315
1964
1,5371,537
1,15640
73
234758
(*)
105332
-799
-601-103-55
-14-1
-15
-6
738738
-11-11
-8
-3
727
-159
-136
1512
-43-3
5-9
14
(*> i121
26
2(*)
« 13
5
6
-608
1965
1,7581,758
1,26196
69
2759671
139381
-804
-635-57-61
-20-1
-18
-8-4
954954
-13-13
-9
-4
941
-319
-171
16-38
-97-17
-1-11
-11
-64(*)
503
8
8
54
(>)-21
3-5
-32
%
-673
Other Western Hemisphere
1963
645645
372(*)
51
3512111
1558
(*)
-801
-518-90-21
-152-7-3
-10(*)
-156-156
-29-29
-19
-8-2
-185
-172
-167-1
1-1
8-12
-11
-6
-6(*)
(*)
14
16
(*)
(*)(*)
(•>.
<*> 7
349
1964
697697
4461
57
3613142
11612
(*)
-896
-593-93-26
-160-8-3
-13(*)
-199-199
-32-32
-23
-7-2
-231
-196
-125-7
1-11
-21-29
-1-3
-3
-3(*)
(*)
57
2-15
(*)
> 4
(*)
165
373
1965
764764
488(*)
61
4412102
12621
(*)
-1,019
-654-79-69
-190-8-4
-15(*)
-255-255
-44-44
-19
-22-3
-299
-53
-89
1-9
2714
-14
-4
-5-1
2
-2
4-11
28
(*)-3
(*)
2-22
358
Other countries in Asia andAfrica
1963
6,5675,893
3,87320
674369
3259
150100
1,07366
151
-3,148
-2, 224-492-141
-105-4
-134
-35-13
3,4192,745
-2,351-1,677
-236-674
-1,368-73
1,068
-401
-248-68
107
-16-56
1-31
-1,316
-1,148-292
124
24
24
250
2209
° 8
11
5
2193
375
1964
7,2056,490
4,21535
p 715393
3870
152113
1,20887
179
-3,517
-2, 532-501-152
-112-4
-152
-48-16
3,6882,973
p-2,450-1,735
-245*-715-1, 415
-75
1,238
-579
-247-116
615
-45-175
3-20
-1,195
-1,332-39
1733
4
4
448
-293
124
5-1
9400
84
1965
7,6726,641
4,19895
p 1,031383
4295
155123
1,237114199
-4,049
-2,795-710-149
-124-5
-180
-65-21
3,6232,592
p-2,663-1,632
-250p-1,031-1,299
-83
960
-999
-549-134
165
-197-102
-15-23
-1,373
-1,339-202
1635
32
32
458
(*)20-1
220
28i
-2392
922
International organizations and unallocated l
1960
268268
136
135
1358
(*)
439
-527
-34
-376
-57
-2-58
-259-259
-116-116
-2
-114
-375
-130
-12-97
19-40
(*)
(*)
-79
-74-7
2
175
-266
441
594
13
(*)
58
225298
-185
1961
281281
24
122
864
(*)
1746
-592
-38
-355
-136
-2-61
-311-311
-112-112
-2
-110
-423
13
-8-12
1815
(*)
(*)
-73
-62-14
3
-248
-113
-135
343
12
(*)
58
340-67
388
1962
302302
13
132
969
3247
-615
-58(*)-386
-100
-1-70
-313-313
-156-156
-2
-154
-469
-240
-74-84
16-98
(*)
(*)
-121
-121-2
2
684
58
626
227
16
(*)
36
-442617
-81
1963
311311
11
153
877
1943
(*)
-612
-69(*)-383
(*)-73
-16-71
-301-301
-146-146
-4
-142
-447
-70
-27
12-55
(*)
(*)
-77
-78-3
4
99
69
30
-58
221
(*)
56
330-467
553
1964
334334
1
169
685
27451
-692
-89(*)-415
(*U-16-78
-358-358
-145-145
-3
-141-1
-503
-54
-80-41811
(*)
1
-39
-6319
5
355
89
266
-209
181
(*)
45
-30835
450
1965
394394
(*)
175
1093
69461
-671
-118(*)-390
(t)-66
-25-72
-277-277
-91-91
-3
-88(*)
-368
-195
-43-179
29-2
(*)
(*)
4
(*)
4
249
343
-94
-68
21194
(*)
-97
-149-37
378
Line
12
3456
789
10
111213
14
151617
181920
2122
2324
2526
27282930
31
32
33343536
3738
3940
41
4243
4445
46
47...48
49
50
515253
5455
5657
5859
60
Digitized for FRASER http://fraser.stlouisfed.org/ Federal Reserve Bank of St. Louis

Table 8.—U.S. International Transactions by Area[Millions of dollars]
Line
12
3
4
5678
910
1112131415
1617181920
212223
24
25
262728
2930
31
32
3334
3536
3738
394041
4243
444546
47484950
515253
5455
56
57
58
59
60
(Credits +; debits -)
Exports of goods and servicesExcluding transfers under mili-
tary grants.Merchandise, adjusted, excluding
military.Transfers under military sales con-
tracts.Transfers under military grants, net.TransportationTravel _ _ _ .Fees and royalties from direct in-
vestments.Other private servicesOther U.S. Government services. _ _Income on U.S. investments abroad:
Direct investments 2
Other private assetsU.S. Government assets.
Imports of goods and servicesMerchandise, adjusted, excluding
military.Military expendituresTransportationTravel _Private payments for other services.U.S. Government payments for
other services.Income on foreign investments in
the United States:Private payments 2
U S Government paymentsBalance on goods and services (lines
1 and 14).Excluding transfers under military
grants (lines 2 and 14).Unilateral transfers, net; transfers to
foreigners (— ).Excluding military grants .-
Private remittancesMilitary grants of goods and ser-
vices.Other U.S. Government grantsU.S. Government pensions and
other transfers.Balance on goods, services, and uni-
lateral transfers (lines 23 and 25, or24 and 26).
Transactions in U.S. private assets,net; increase in assets (— ).Direct investments 2_~Foreign securities newly issued in
the United States.RedemptionsOther transactions in foreign
securities.Claims reported by U.S. banks:
Long-termShort-term
Claims reported by U.S. residentsother than banks:
Long-termShort-term - __ _
Transactions in U.S. Governmentassets, excluding official reserveassets, net; increase in assets (-).Loans and other long-term assetsForeign currencies and other short-
term assets.Repayments on credits:
Scheduled - -Nonscheduled
Transactions in U.S. official reserveassets, net; increase in assets (— ).Gold 3
Convertible currencies .-- -Gold tranche position in IMF 3
Transactions in foreign assets in theUnited States, net; increase in for-eign assets (U.S. liabilities) (+).Direct investments 2
U S corporate securitiesLong-term liabilities reported by
U.S. banks.Other liabilities reported by U.S.
private residents other thanbanks:
Long-termShort-term
Liabilities of U.S. Government, ex-cluding marketable or convert-ible securities:
Associated with specific transac-tions.
Other nonmarketable, noncon-vertible, medium-term securi-ties.
U.S. Government marketable orconvertible bonds and notes.
Deposits and money market paperheld in the United States.
Errors and omissions and transfers offunds between foreign areas, net;(receipts by foreign areas (— )).
United Kingdom
1965
I
631631
349
6
521029
323
134133
-504-273
-45-84-18-38-3
-38—5127
127
-10
-10—6
—4
117
20
-68
-8110
21-35
4
4
-40
76-116
277
1
-25
313
-378
II
644644
417
14
621833
344
37187
-635-338
-36-122-42-38-3
-48—8
9
9
-11
-11—7
-4
-2
-60
-122
7
3-23
47115
10
e
-70
-30-40
59
-77-230-31
16
(*)
95
291
58
III
621621
386
16
652133
363
42154
-668-365
-40-112-60-38-4
-36-13-47
-47
-13
-13—9
-4
-60
-163
-34-68
10
4-59
<?»4
4
'(*)
-544
-132-412
359
50-228-20
35
46
473
404
IV
740740
474
20
641345
363
501718
-706-434
-32-92-22-38-2
-70-16
34
34
-13
-13—9
-4
21
-52
-100-12
—7
^72
1~1
5
211
38173
-252
-26-60
49
10I
12
(*)
-248
69
1966
I P
756756
465
11
611130
353
118202
-640-379
-46-94-22-39-3
-41-16116
116
-11
-11—7
—4
105
-136
-74
-6
117
4~7*—2
t
365
19346
501
i-62
168
13
11
510
-833
Other Western Europe
1965
I
2,3522,205
1,537
136
"1471841853
7715
986324
-1,794-976
-314-210-72-28-29
-100-65558
411
v— 232
-85—40
*>-147
-13-32
326
-651
-477-9
416
-140-62
22-40
-10946
22
809
72683
-905
2422
(\
46
21
-1,033
461
II
3,0452,824
1,965
137
"2212403655
7515
2066629
-2,370-1,283
-326-337-203-27-27
-107-60675
454
"-376
-15541
"-221
-23-91
299
-92
-291
942
11449
4-17-79
-15931
49
329
364-35
-395
26—64
9
44
111
-511
-62
III
2,5092,422
1,711
106
"872433556
7215
916132
-2,300-1,177
-332-311-275-24-26
-98-57209
122
"-179
-92—41
"-87
-14-37
30
33
-93
744
6214
141
-875
44179207
214
-118
-1(
12
(*)
125
-231
-293
IV
2,8652,782
2,069
96
"83239
2765
7515
1026430
-2,255-1,342
-331-246-103-24-28
-120—61610
527
"-191
-108—48
"-83
-26-34
419
-247
-247—4
158
72-60
-1-30
11
-8138
47
51
438
420
— 1160
-24
14
142
-69
312
-654
1966
I"
n.a.2,765
2,054
124
n.a.229
2255
8015
1016025
-2,306-1,380
-359-253-78-27-26
-120-63n.a.
459
n.a.
-91—42n.a.
-14-35
368
-107
-156
526
9813
-11-82-67
—11410
361
28
155-127
-743
9811
8
26
-53
-370
-447
521
Eastern Europe
1965
I
3131
26
(*)
1
3(*)
1-34-30
(*)-2
(*)(*i2
(*)
-3
-3
-4
4—2
-1-1
-7
-2
(*)
2— 3
(*)-]
1
c
A
4
(*)
(*)
4
II
4848
42
(*)
2
3(*)
(*)1
-39-33
-1-2-1
(*)-2
(*)(*)
9
9
-5
-5_2
-2-1
4
-1
(*)
2_P
(*)^3
e
1
-3
(*)
-1
(*)
(*)
—
III
3838
25
(*)
2
31
16
-44-33
(*)-1-8
(*)—2
(*)(*)
-6
-5
-52
-1
-11
-3
3e
(*)
8
(*)
8
6
(*)
(*)
(*)
6
IV
5959
54
(*)
1
3(*)
1(*)-48-42
(*)-2-2
(*)— 2
(*)(*)
11
11
-4
-4
-1-1
7
(*)
11
8i
(*)
1
6
(*)
(*)
(*)
(*)
5
-16
1966
I"
6262
56
1
(*)3
11
-45-40
(>)-2-1
(*)
(*)
(*)
17
— L
_1
13
— 1
1
6
^
-5
-13
Canada
1965
I
1,6391,639
1,181
11
3010540
231
145103
(*)-1,270-1, 055
-42-32-50-17-3
-54-17369
369
— 7
-7/*\
—7
362
-62
-241-98
3746
-3722
—13222
1
1
-25
. -25
-311
6314
6-2
26
45
-463
35
II
1,9801,980
1,442
29
3814540
222
142120
-1,519-1,211
-48-38
-130-15-4
-56-17461
461
-9
-9
452
34
-146-235
2489
8174
-6126—4
—4
19
19
-157
-5330
-27
-13/*\
-8
-118
-344
III
1,8101,810
1,295
13
4015150
242
135100
-1,736-1, 233
-43-43
-325-14-3
-57-18
74
74
-9
-9
-8
65
-236
-185-195
17-2
1129
-22211
1
6
6
379
-18-6
(*)
13
-5
-9
413
-215
IV
2,1652,165
1,556
7
409055
232
270122
-1,628-1,333
-39-41-95-14
-82-19537
537m
-9
528
-297
-323-181
3014
985
-3722
2
—3
— 2
-272
29
(*) 5
-413
-31
(*\
-42
-242
42
1966
I P
1,9811,981
1,470
12
3612045
231
158116
-1,521-1,299
-40-33-55-14-4
-56-20460
460
-8
-8
452
-531
-210-413
80-11
1622
-2712
-3
-97
-100
-182
1521
—424
21
7
-266
361
NOTE.—See footnotes on pp. 36 and 37.
40
Digitized for FRASER http://fraser.stlouisfed.org/ Federal Reserve Bank of St. Louis
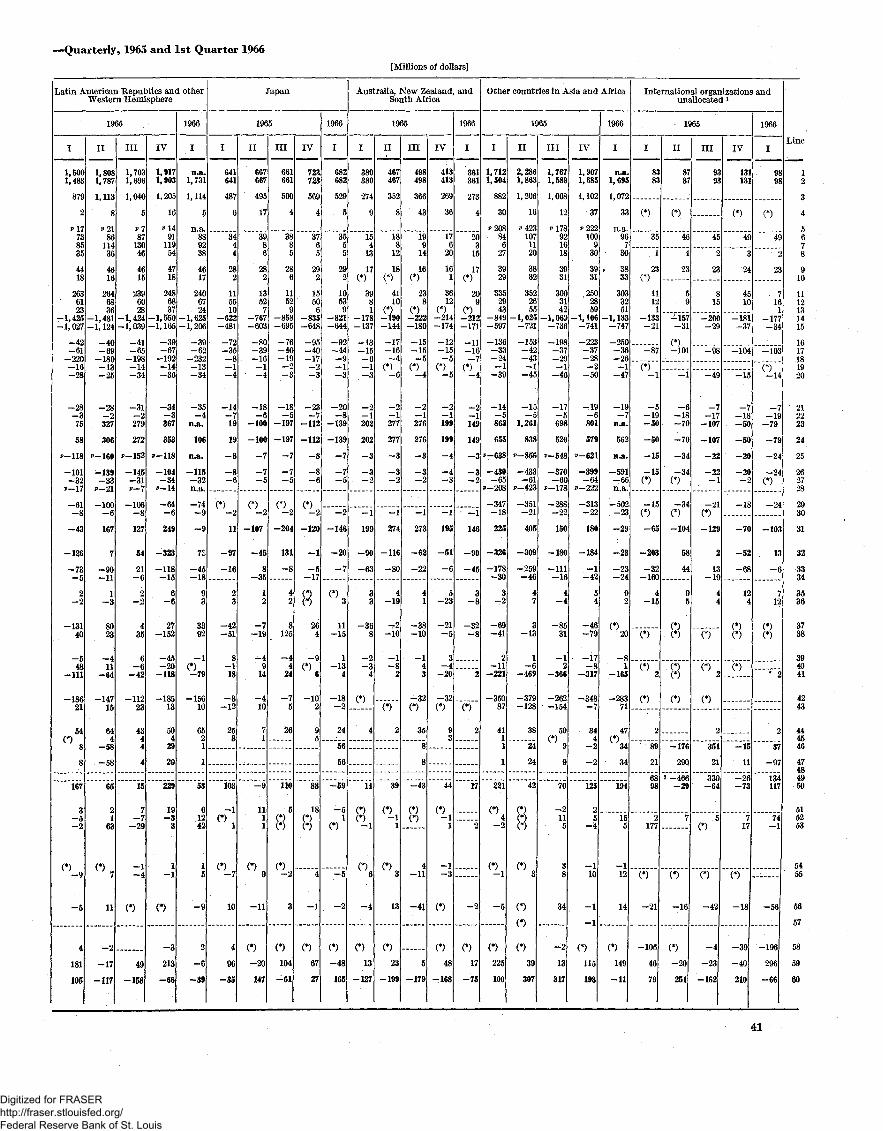
—Quarterly, 1965 and 1st Quarter 1966[Millions of dollars]
Latin American Republics and otherWestern Hemisphere
1965
I
1,5001,483
879t
738535
4418
2636123
-1,425-1, 027
-42-61
-220—16-28
-28
75
58
"-118
-101-32
-61
-43
-126
-73-5
2-2
-13140
-548
-111
-18621
* 54
8
167
3-5
-5
4
181
105
II
1,8081,787
1,113
8
8611436
4616
2646836
-1,481-1, 124
-40-69
-180—13-25
-28
327
306
p-160
-139-33
-100
167
7
-90-11
1-3
8023
—411
-64
-14715
644
-58
-58
65
21
63
11
-2
-17
-117
III
1,7031,696
1,040
v 787
13046
4615
2396028
-1,424-1,039
-41-65
-198—14-34
-31
279
272
p-152
-145-31
-106
127
54
21-6
2-2
435
6-6
-42
-11223
4344
4
15
7-7
-29
-1-4
(*)
49
-158
IV
1,9171,903
1,205
16
9111954
4718
2486837
-1,550-1, 165
-39-67
-192
-36
-34
367
353
-104-34
-64
249
-323
-118-15
6-6
27-152
-45-20
-118
-18513
504
29
29
229
19-3
3
1-1
(*)
-3
213
-66
1966
I
n.a.1,731
1, 114
5
n.a.889238
4617
2406724
-1,625-1,206
-39-62
-232—13-34
-35
n.a.
106
n.a.
-115-32n.a.
-74
—9
n-45-18
93
3392
-15610
6521
1
53
61242
15
-9
2
-6
-39
Japan
1965
I
641641
487
6
3444
28£
115510
-622-481
-72-35-8
-4
-14
19
19
-8-6
(*)
11
-97
-16
23
-42-51
8-118
-3-12
258
103
-7
10
4
96
-35
II
667667
495
17
3986
28
1352
-76T-603
-80-39-16
—4
-18
-100
-100
-5
(*)
-107
-45
8-35
12
-7-19
-49
14
-410
71
-9
1111
-11
(*)
-20
147
III
661661
500
4
3885
286
11529
-858-695
-76-40-19
o
-3
-18e
-197
-197
-5
-(*)
-204
131
-8
42
8125
-44
24
-75
26
110
5
8.
3
(*)
104
-61
IV
72a723
569
4
3765
292
15506
-835-648
-95-40-17
-23
-112
-112
-8-6
0-120
-1
-5—17
8264
*~9
-102
95
88
18(*)(*)
4
-1
(*)
67
27
1966
I
682682
529
5
35E
e
292
10539
-821-644
-92-44-9
-3
-20
-139
-139
—7-5
o
-146
-20
—7
11-15
1-13
4
-18-2
24
56
56
-59
-51
(*)
-5
-2
(*)
-48
165
Australia, New Zealand, andSouth Africa
1965
I
380380
274
9
154
13
17(*)
3981
-178-137
-13-15-6
-3
-2
202
202
-3-2
199
-90
-63
33
-368
-2-3
4
(*)
4
14
(*)
(*)6
-4
(*)
13
-127
II
467467
352
8
188
12
18(*)
4110
(*)-190-144
-17-16
-2
277
277
-3-2
274
-116
-80
4-19
-2-10
-1-8
2
~~(*T2
39
1
13
(*)
23
-199
III
498498
366
43
199
14
16(*)
238
(*)-222-180
-15-15-5
-2
276
276
-3-2
273
-62
-22
41
-38-10
-143
-32(*)
35
8
8
-43
(*)(*)
4-11
5
-179
IV
413413
269
36
176
20
161
3612
(*)-214-174
-12-15-5
-2i199
199
-4-3
195
-51
-6
5-23
-21-5
3-4
-20
-32
93
44
1
-1-3
(*)
(*)
48
-168
1966
I
361361
273
4
203
15
17(*)
209
(*)-212-171
-11-16
— 7(*)-4
—2
149
149
-3— 2
146
-90
-45
3-8
-32-8
2
(*)
2
17
2
-2
(*)
17
-75
Other countries in Asia and Africa
1965
I
1,7121,504
882
30
*>208846
27
3929
3352943
-849-597
-136-33-24
-39
-14
863
655
-430-65
-347
225
-326
-178-30
3—2
-69-41
2-11
-221
-35087
4111
1
221
-2
(*)
-5
(*)
225
100
II
2,2861,863
1,206
16
*>4231071120
3832
3522655
-1,025-721
-153-42-43
-45
-15K
.1,261
838
-433-61
p-423
-351
405
-309
-259-46
47
g
-13
1-6
-469
-379-128
38
24
24
42
1?
(*)
(*)
O
39
307
III
1,7671,589
1,008
12
921618
3931
3003142
-1,069-736
-198-37-29
-46
-17
698
520
-370-60
-288
150
-180
-111-16
4-4
-8531
-1
-366
-262-154
* 5°
9
70
-2115
38
34
-2
13
317
IV
1,9071,685
1,102
37
10(9
30
3931
2502859
-1, 106-741
-223-37-28
-50
-19
801
579
-399-64
p-222
-313
180
-184
-1-42
t
-46-79
-17-8
-317
-348
344
— 2
-2
125
25
-4
•i10
-1
-1
(*)
115
198
1966
I
n.a1,695
1,072
33
n.a.96
30
3833
3033251
-1,133-747
-250-36-26
-47
-19
n.a.
562
n.a.
-591-66n.a
-502
-29
-23
—23-24
9f
-81
-165
-28371
47(*)
34
34
194
155
i12
14
(*)
149
-11
International organizations andunallocated 1
1965
I
8383
(*)
35
23(*)
1112
-133-21
-87
(*)
-5
-50
-50
-15
-15(*)
(*)
-65
-203
-32-160
_ii
(*)
(*)
(*)
289
21
6898
177
(*)
-21
-106
46
79
II
88
(*)
46
23
I
-157-31
.(*)-101
— (
-70
-70
-34
-34(*)
-34(*)
-104
58
44
8.(*)
(*)
(*)
-176
290
2 -4662<
*
(*)
-16
(*)
-20
251
III
99
4
23
15
-200-29
-98
-49
-107
-107
-22
-22
-2(*)
-129
13-19
(*)
(*)
(*)
35
21
330-64
(*)
(*)
-42
-4
-23
-162
IV
1313
(*)
4
'2
410
-18-37
-104
-15
-50
-50
-20
-18
-7
-52
-68
12
(*)(*)
(*)
-15
11
— 2i
ii
(*)
-18
-39
-40
210
1966
I
99
(*)
4
2
1
-17'-34
-103
(*)
-79
-79
-2
-2(*)
-24
-10
13
12
(*)(*)
37
-97
134117
— -
-56
-196
296
-66
Line
12
3
4
5678
910
1112131415
1617181920
212223
24
25
262728
2930
31
32
3334
3536
3738
394041
4243
444546
47484950
515253
5455
56
57
58
59
60
41
Digitized for FRASER http://fraser.stlouisfed.org/ Federal Reserve Bank of St. Louis
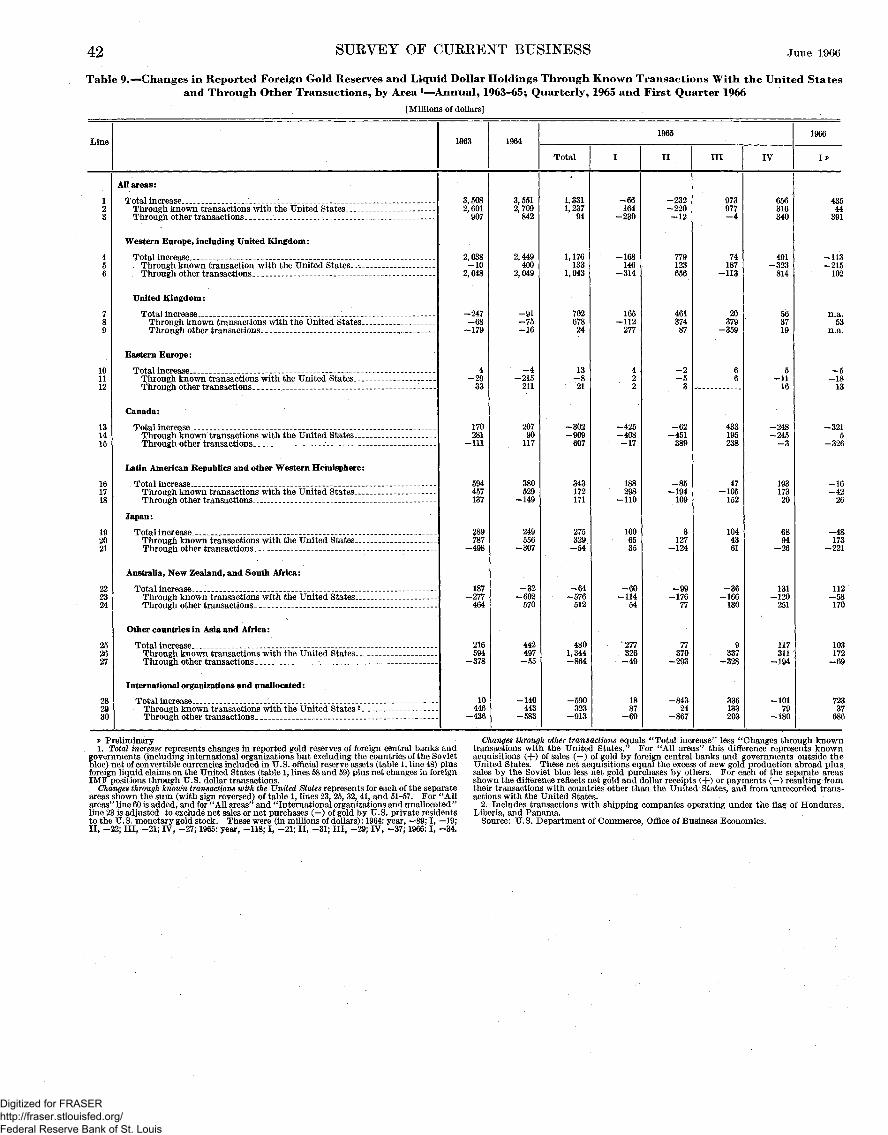
42 SUKVEY OF CUEEENT BUSINESS June
Table 9.—Changes in Reported Foreign Gold Reserves and Liquid Dollar Holdings Through Known Transactions With the United Statesand Through Other Transactions, by Area 1—Annual, 1963-65; Quarterly, 1965 and First Quarter 1966
[Millions of dollars]
Line 1963 19641965
Total II III IV
1966
IP
All areas:
Total increase :Through known transactions with the United States. _Through other transactions ._
Western Europe, including United Kingdom:
Total increase .Through known transaction with the United States._Through other transactions
United Kingdom:
Total increase __•Through known transactions with the United States..Through other transactions
Eastern Europe:
Total increaseThrough known transactions with the United States._Through other transactions
Canada:
13 Total increase i _ _ _.-..14 Through known transactions with the United States.__.15 Through other transactions.. .
Latin American Republics and other Western Hemisphere:
16 Total increase17 Through known transactions with the United States_..18 Through other transactions
Japan:
19 Total increase20 Through known transactions with the United States.--21 Through other transactions
Australia, New Zealand, and South Africa:
Total increase....23 Through known transactions with the United States._ _24 Through other transactions ..
Other countries in Asia and Africa:
25 Total increase .Through known transactions with the United States.__
27 Through other transactions - _ _ _ - _ _ _
International organizations and unallocated:
28 Total increase .29 Through known transactions with the United States2.30 Through other transactions
3,5082,601
907
2,038-10
2,048
-247-68
-179
4-29
170281
-111
594457137
787
187-277
464
216594
-378
10446
3,5512,709
842
2,449400
2,049
-91-75-16
-4-215
211
20790
117
529-149
249556
-307
-32-602
570
442497
-55
-140443
-583
1,3311,237
94
1,176133
1,043
70267824
-302-909
607
343172171
275329
-54
-64-576
512
4801,344
-590323
-913
-66164
-230
-168146
-314
165-112
277
-425-408-17
188298
-110
1006535
-60-114
54
"277326
-49
-232-220-12
779123
46137487
-2
-451
-85-194
109
3127
-124
-17677
77370
24-867
973977-4
74187
-113
20379
-359
433195
47-105
152
1044361
130
9337
133203
656316340
491-323
814
5-11
16
-248-245-3
19317320
94-26
131-120
251
117311
-194
-10179
-180
43544
391
-113-215
102
n.a.53
n.a.
-5-18
13
-3215
-326
-16-42
26
173-221
112-58170
103172
72337
v Preliminary1. Total increase represents changes in reported gold reserves of foreign central banks and
governments (including international organizations but excluding the countries of the Sovietbloc) net of convertible currencies included in U.S. official reserve assets (table 1, line 48) plusforeign liquid claims on the United States (table 1, lines 58 and 59) plus net changes in foreignIMF positions through U.S. dollar transactions.
Changes through known transactions with the United States represents for each of the separateareas shown the sum (with sign reversed) of table 1, lines 23, 25, 32, 41, and 51-57. For "Allareas" line 60 is added, and for "All areas" and "International organizations and unallocated"line 23 is adjusted to exclude net sales or net purchases (—) of gold by U.S. private residentsto the U.S. monetary gold stock. These were (in millions of dollars): 1964: year, -89; I, -19;II, -22; III, -21; IV, -27; 1965: year, -118; I, -21; II, -31; III, -29; IV, -37; 1966:1, -34.
Changes through other transactions equals "Total increase" less "Changes through knowntransactions with the United States." For "All areas" this difference represents knownacquisitions (+) of sales (—) of gold by foreign central banks and governments outside theUnited States. These net acquisitions equal the excess of new gold production abroad plussales by the Soviet bloc less net gold purchases by others. For each of the separate areasshown the difference reflects net gold and dollar receipts (-}-) or payments (—) resulting fromtheir transactions with countries other than the United States, and from'unrecorded trans-actions with the United States.
2. Includes transactions with shipping companies operating under the flag of Honduras,Liberia, and Panama.
Source: U.S. Department of Commerce, Office of Business Economics.
Digitized for FRASER http://fraser.stlouisfed.org/ Federal Reserve Bank of St. Louis
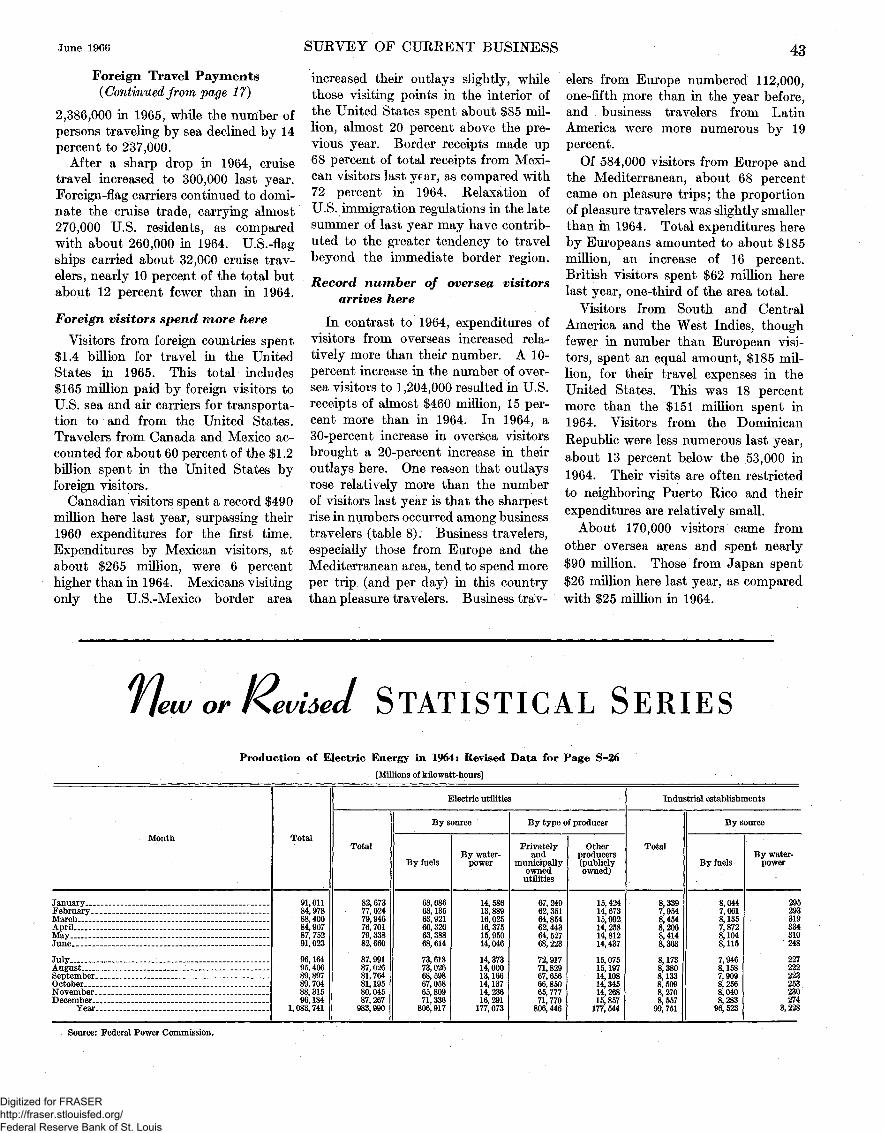
June 1966
Foreign Travel Payments(Continued from page 17)
2,386,000 in 1965, while the number ofpersons traveling by sea declined by 14percent to 237,000.
After a sharp drop in 1964, cruisetravel increased to 300,000 last year.Foreign-flag carriers continued to domi-nate the cruise trade, carrying almost270,000 U.S. residents, as comparedwith about 260,000 in 1964. U.S.-flagships carried about 32,000 cruise trav-elers, nearly 10 percent of the total butabout 12 percent fewer than in 1964.
Foreign visitors spend more here
Visitors from foreign countries spent$1.4 billion for travel in the UnitedStates in 1965. This total includes$165 million paid by foreign visitors toU.S. sea and air carriers for transporta-tion to and from the United States.Travelers from Canada and Mexico ac-counted for about 60 percent of the $1.2billion spent in the United States byforeign visitors.
Canadian visitors spent a record $490million here last year, surpassing their1960 expenditures for the first time.Expenditures by Mexican visitors, atabout $265 million, were 6 percenthigher than in 1964. Mexicans visitingonly the U.S.-Mexico border area
SURVEY OF CUEEENT BUSINESS
increased their outlays slightly, whilethose visiting points in the interior ofthe United States spent about $85 mil-lion, almost 20 percent above the pre-vious year. Border receipts made up68 percent of total receipts from Mexi-can visitors last year, as compared with72 percent in 1964. Eelaxation ofU.S. immigration regulations in the latesummer of last year may have contrib-uted to the greater tendency to travelbeyond the immediate border region.
Record number of oversea visitorsarrives here
In contrast to 1964, expenditures ofvisitors from overseas increased rela-tively more than their number. A 10-percent increase in the number of over-sea visitors to 1,204,000 resulted in U.S.receipts of almost $460 million, 15 per-cent more than in 1964. In 1964, a30-percent increase in oversea visitorsbrought a 20-percent increase in theiroutlays here. One reason that outlaysrose relatively more than the numberof visitors last year is that the sharpestrise in numbers occurred among businesstravelers (table 8). Business travelers,especially those from Europe and theMediterranean area, tend to spend moreper trip (and per day) in this countrythan pleasure travelers. Business trav-
43
elers from Europe numbered 112,000,one-fifth more than in the year before,and business travelers from LatinAmerica were more numerous by 19percent.
Of 584,000 visitors from Europe andthe Mediterranean, about 68 percentcame on pleasure trips; the proportionof pleasure travelers was slightly smallerthan in 1964. Total expenditures hereby Europeans amounted to about $185million, an increase of 16 percent.British visitors spent $62 million herelast year, one-third of the area total.
Visitors from South and CentralAmerica and the West Indies, thoughfewer in number than European visi-tors, spent an equal amount, $185 mil-lion, for their travel expenses in theUnited States. This was 18 percentmore than the $151 million spent in1964. Visitors from the DominicanEepublic were less numerous last year,about 13 percent below the 53,000 in1964. Their visits are often restrictedto neighboring Puerto Eico and theirexpenditures are relatively small.
About 170,000 visitors came fromother oversea areas and spent nearly$90 million. Those from Japan spent$26 million here last year, as comparedwith $25 million in 1964.
flew or Revited STATISTICAL SERIES
Production of Electric Energy in 1964: Revised Data for Page S-26[Millions of kilowatt-hours]
Month
January _ _ _FebruaryMarchApril _ _ __ _MavJune
July __.AugustSeptember _ _ __OctoberNovemberDecember
Year _ _
Total
91, Oil84, 97888,40084, 90787, 75291,023
96, 16495,40689, 89789,70488, 31596, 184
1,083,741
Electric utilities
Total
82, 67377, 02479, 94676, 70179, 33882, 660
87, 99187, 02681, 76481, 19580, 04587, 267
983,990
By source
By fuels
68, 08663, 13563,92160, 32663, 38868, 614
73,61873, 02668, 59867, 05865, 80971,336
806, 917
By water-power
14, 58613, 88916, 02516, 37515, 95014, 046
14, 37314, 00013, 16614, 13714, 23616, 291
177, 073
By type of producer
Privatelyand
municipallyownedutilities
67, 24962, 35164,85462,44364, 52768, 223
72,91771, 82967, 65666, 85065, 77771, 770
806,446
Otherproducers(publiclyowned)
15, 42414, 67315, 09214, 25814, 81214, 437
15,07515, 19714, 10814, 34514, 26815, 857
177, 544
Industrial establishments
Total
8,3397,9548,4548, 2068,4148,363
8,1738,3808, 1338, 5098,2708,557
99, 751
By source
By fuels
8,0447, 6618,1357,8728,1048,115
7,9468,1587,9098,2568,0408,283
96, 523
By water-power
295293319334310
' 248
227222223253230274
3, 228
Source: Federal Power Commission.
Digitized for FRASER http://fraser.stlouisfed.org/ Federal Reserve Bank of St. Louis

44 SUEVEY OF CUEEENT BUSINESS
Money Supply and Related Data, 1959-64: Revised Data for Page S-19[Billions of dollars]
June 1966
Year and month
1959:JanuaryFebruaryMarch _ _ _ _ _ _ _ _ _AprilMavJune _ _ _JulyAugustSeptember _October -. _ _NovemberDecember _ -_
Annual1960:
January _ _ _ _ _ _FebruaryMatch _AprilMayJune __ __July _ _ —AugustSeptember _October _ _ _NovemberDecember _ __
Annual1961:
January _ _February _MarchAprilMay •June _JulvAugustSeptemberOctoberNovemberDecember - _ _
Annual1962:
January _February _ _MarchAprilMayJuneJulyAugust - _ _ _ _ _ _September _ _ _October _ _ _November _ _ _ _ _ _ _ _D ecpmber
Annual1963:
January . _ _ _February _ _March. __ _ _ ^ _AprilMavJune -JulyAugust _ _ _ _SeptemberOctober __ _ _ _ _ _ _ _ _ _November --December
Annual1964:
JanuaryFebruary _ _ _March _ _ _AprilMavJune _July __AugustSeptemberOctoberNovember __ _ _December. _.
Annual
Deposits and currrency (average of daily figures)
Money supply
TotalCurrencyoutsidebanks
Demanddeposits
Timedeposits
adjusted *
U.S. Gov-ernmentdemanddeposits i
(Unadjusted for seasonal variation)
144.9142.0141.3142.3141.2141.9142. 7142.2142.7143. 0144.0145.6142.8
145.0141.2139.7140.7138.4138.6139.1139.6140.5141.3142. 1144.7140.9
144.5141.6140.8142.5140. 8141.3141.6141. 6143.1144. 5146.3149.4143.2
149.0145.6144.8146.8144.1144.4144.6144.0145. 0146. 5148.2151.6146.2
151.8148.4147.6149. 8147.5148.3149. 5149.2150. 6152.5154.8157. 3150.6
157.7153.7152.9154.9152.2153.4155.0155.0157.1159. 0160.6164.0156. 3
28.628.428.528.528.728.929.129.129.129. 029.229.528.9
28.928.628.728.828.828.929.129.129.129.129.329.629.0
28.828.628.628.728.728.929.229.229.329.429.730.229. 1
29.529.329. 529.729.730.030.330.330.330.430.831.230.1
30.530.530.730.931.031.431.831.932.032,132.633.131.5
32.432.332.632.833.133.433.733,933.934.134.635.033.5
116.3113.6112.8113.8112.5113.0113.5113.0113.6113.9114.8116.1113.9
116.1112.6111.0111.9109.6109.7109. 9110.5111.4112.2112.8115. 2111.9
115.6113. 0112.2113.8112.1112.4112.4112.4113.8115.1116.6119. 2114.1
119.4116.3115.3117.1114.4114.4114.3113.7114.6116.2117.5120.3116.1
121.2117.9116.9118. 9116.5116.9117. 7117.3118.6120.4122.1124. 1119. 0
125. 3121.3120.2122.2119. 2120.0121.3121.1123.2124. 9126.1129.1122.8
65.665.866.266.767.067.467.567.467.567.466.866.666.8
66.866.667.067.567.868.369.170.070.771.471.572.169.1
73.274.675.576.577.778.679.580.280.981.581.581.878.5
83.685.687.789.290.091.192.292.993. 895. 095.596.791.1
98.6100.1101.9103.1104.3105.2106.2107.5108.3109.5110.2111. 0105. 5
113.0114.5115. 7116.7118. 0119.1120. 0121.1122. 0123.4124.1125.2119.4
3.24.33.74.65.24.04.95.15.24.94.74.94.6
4.14.14.33. 66.46.36.76.15.45.65.84.75.3
4.14.84.72.84.74.54.35.55.26.45.84.94.8
3.84.75.03.87.07.27.06.87.27.36.05.65.9
4.85.76.04.27.17.57.86.36.65.34.45.15.9
4.14.86.04.26.87.66.96.36.55.55.85.55.8
Money supply
TotalCurrencyoutsidebanks
Demanddeposits
Timedepositsadjusted 1
(Adjusted for seasonal variation)
141. 6142. 0142.5142.7143.2143.4144.1143.6143.3142.9142. 7141.9
141.7141.3140.9140. 8140.3140.1140.4140.9141. 1141.1140. 8141.1
141. 2141.8142.0142. 3142. 7143. 0143.0143.3143.9144. 3145. 0145. 5
145. 5145.8146.0146.5146.1146.2146.1146.0145.8146.4146. 9147.5
148. 0148. 6148.8149.3149.7150.2151.0151. 3151. 6152.3153.2153. 1
153. 6153.8154. 1154. 5154.5155. 5156.6157.1158.2158. 8
' 159.1159. 7
28.628.728.828.829.029.029.029.129. 029.028.928.9
29.029.029.029.029.029. 029.029.029.029.029.028. 9
29. 029.028.928.928.928.929.029.129.229.329.429.6
29.629.729.830. 030.030.130.130.230.330.330.530.6
30.730. 931.031.231.331.531.631.831.932.032.332.5
32.632.832.933.033.333.433.633.833.934.034.234. 2
112.9113.2113.7113.9114.2114.3115.1114.5114.3113.9113.8113. 1
112.7112.4111.9111.8111.3111.1111.5112.0112.1112.1111.8112.1
112.3112.8113.1113.4113.8114.0114. 0114. 3114.7115.0115.5116.0
115. 8116.1116.2116. 5116.1116.1115. 9115. 8115.6116.0116.4116. 9
117. 4117. 7117.8118.2118.4118. 8119. 4119.5119.7120.3120.9120. 6
121. 0121. 1121. 2.121.4121.2122.1123.0123. 3124. 3124. 8124.8125.4
66.066.066.266.566.667.067.167.267.367.367.367.4
67.266.967.067.367.467.968.769.770.571.372.172.9
73. 674.975.576.277.278.179.179.980.781.582.282.7
84.186.0
• 87.688. 889.590.691.792.693.795.096.297.8
99.1100.3101.6102.7103. 6104.6105.7107.3108. 4109. 6111. 1112.2
113.5114. 6115.3116.2117.3118.5119.4121. 0122.1123. 5125.1126.6
* At all commercial banks.SOURCE: Board of Governors of the Federal Keserve System,
U.S. GOVERNMENT PRINTING OFFICE : 1966 0—217-518
Digitized for FRASER http://fraser.stlouisfed.org/ Federal Reserve Bank of St. Louis
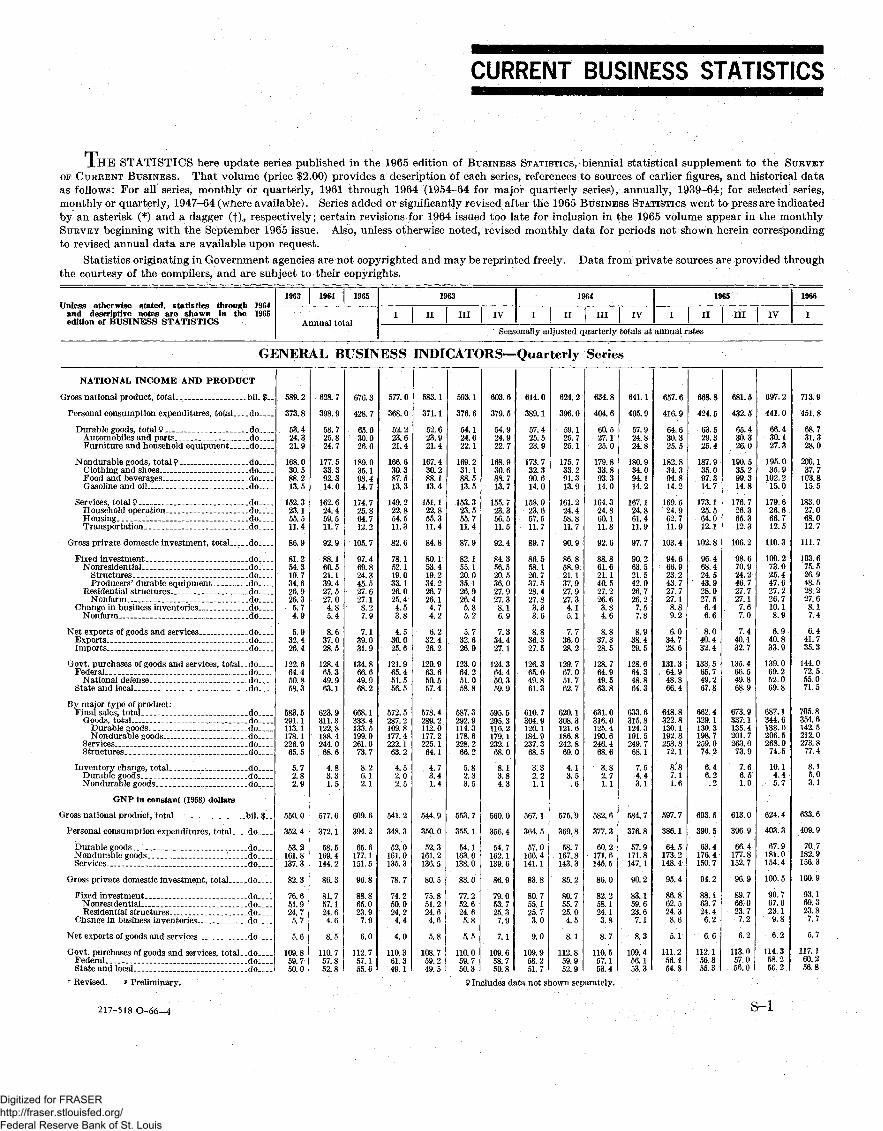
CURRENT BUSINESS STATISTICS
JLHE STATISTICS here update series published in the 1965 edition of BUSINESS STATISTICS, biennial statistical supplement to the SUKVEYOF CUKEENT BUSINESS. That volume (price $2.00) provides a description of each series, references to sources of earlier figures, and historical dataas follows: For all series, monthly or quarterly, 1961 through 1964 (1954-64 for major quarterly series), annually, 1939-64; for selected series,monthly or quarterly, 1947-64 (where available). Series added or significantly revised after the 1965 BUSINESS STATISTICS went to press are indicatedby an asterisk (*) and a dagger (f) , respectively; certain revisions for 1964 issued too late for inclusion in the 1965 volume appear in the monthlySURVEY beginning with the September 1965 issue. Also, unless otherwise noted, revised monthly data for periods not shown herein correspondingto revised annual data are available upon request.
Statistics originating in Government agencies are not copyrighted and may be reprinted freely. Data from private sources are provided throughthe courtesy of the compilers, and are subject to their copyrights.
Unless otherwise stated, statistics through 1964and descriptive notes are shown in the 1965edition of BUSINESS STATISTICS
1963 1964 1965
Annual total
1963
I II III IV
1964
I II III | IV
1965
I II III IV
1966
I
Seasonally adjusted quarterly totals at annual rates
GENERAL BUSINESS INDICATORS—Quarterly Series
NATIONAL INCOME AND PRODUCT
Gross national product, total bil. $
Personal consumption expenditures, total _ do
Durable goods, total 9 doAutomobiles and parts _ _ _ _ doFurniture and household equipment do
Nondurable goods, total 9 _ — doClothing and shoes __ _ _ _ _ do _Food and beverages doGasoline and oil__ do
Services, total 9 doHousehold operation _ _ _ _ _ _ d oHousing doTransportation do
Gross private domestic investment, totaL____do
Fixed investment _ _ doNonresidential _ _ ; _ _ _ do __
Structures doProducers' durable equipment do
Residential structures. _ _ _ _ _ do_Nonfarm do
Change in business inventories doNonfarm. _ _ _ _ do
Net exports of goods and services doExports. _ doImports do
Govt. purchases of goods and services, total__doFederal do
National defense _ _ doState and local do
By major type of product:Final sales, total ___ __ _ _ • • _ do
Goods, total _ _ _ _ _ _ d oDurable goods doNondurable goods do
Services _ _ _. doStructures _ do
Inventory change, total doDurable goods doNondurable goods do
GNP in constant (1958) dollars
Gross national product, total _ • . bil. $
Personal consumption expenditures, total do
Durable goods _ _ _ doNondurable goods _ _ J _ doServices do
Gross private domestic investment, total do
Fixed in vestment __ _ doNonresidential _ _ _ _ d oResidential structures _ _ _ d o _
Ch ange in business inventories do
Net exports of goods and services do _
Govt. purchases of goods and services, total. _doFederal. _ _ doState and local. do
589.2
373.8
53.424.321.9
168. 030.588.213.5
152.323.155 511.4
86.9
81.254.319.734.626.926. 35.74.9
5.932.426 4
122.664.450.858 3
583.5291.1113.1178 1226. 965.5
5.72.82.9
550. 0
352.4
53.2161.8137 3
82.3
76.651.924.75.7
5.6
109.859 750.0
628 7
398.9
58.725.824.7
177. 533.392.314.0
162.624.459 511.7
92.9
88.160.521 139.427. 527 04.85.4
8.637.028 5
128. 465.349.963 1
623.9311.3122.8188 4244.068 6
4.83.31.5
577. 6
372.1
58.5169.4144 2
86.3
81.757.124.64.6
8.5
110.757 852.8
676 3
428 7
65 030 026.0
189 035.198.414 7
174 725.864 712 2
105. 7
97.469.824 345.527.697 18.27.9
7.139.031 9
134.866.649.968.2
668.1333.4133.5199.9261.073.7
8.26.12.1
609.6
394.2
65.6177.1151.5
96.8
88.865.023.97.9
6.0
112.757 155.6
577.0
368.0
52.223.621.4
166.630.387.513.3
149.222.854 511.3
82.6
78.152.119.033.126.025 44.5O 0
4.530.025 6
121.965.451.556.5
572. 5287.2109.8177.4222. 163.2
4.52.02.5
541.2
348.3
52.0161.0135.3
78. 7
74.250.024.24.4
4.0
110.361 349.1
583. 1
371.1
52.623.921.4
167.430.288.113.4
151. 122.855 311.4
84.8
80.153.419.234.226.726.14.74.2
6.232.426 2
120.963.650.557 4
578.4289. 2112.0177.2225. 164.1
4.73.41.4
544.9
350.0
52.3161.2136.5
80.5
75.851.224.64.6
5.8
108.759 249.5
593. 1
376.6
54.124.622.1
169.231.188.513.5
153. 323. 555 711.4
87.9
82.155.120.035.126.926.45.85.2
5.732.626 9
123.064.251.058.8
587.3292.9114.3178.6228.266.2
5.82.33.5
553. 7
355.1
54. 1163.0138.0
83.0
77.252.624.65.8
5.5
110.059 750.3
603 6
379.5
54 924.922.7
168.930.688:713.7
155. 723.356 511.5
92.4
84.356.520 536.027.927 38 16.9
7.334.427 1
124. 364 450.359 9
595.5295 3116.2179 1232.168 0
8. 13.84 3
560. 0
356.4
54.7162.1139 6
86.9
79.053.725.37.9
7.1
109.658 750.8
614 0
389.1
57.425.523.9
173. 732.390.614.0
158. 023.657 511.7
89.7
86.558.120.737.528.427 83.33.6
8.836.327 5
126.365.049.861 3
610.7304 9120. 1184 9237.368.5
3.32.21.1
567.1
364.5
57.0166.4141.1
83.8
80.755.125.73.0
9.0
109.958.251.7
624 2
396.0
59.125.725.1
175.733.291.313.9
161. 224.458 811.7
90.9
86.858.921. 137.927.927 34.15.1
7.736.028 2
129.767.051.762.7
620.1308. 3121.6186 8242.869 0
4.13.5.6
575. '9
369.8
58.7167.8143.3
85.2
80. 755.725.04.5
8.1
112.859 952.9
634. 8
404.6
60.527.125.0
179.833.893.314.0
164.324.860 111.8
92.6
88.861.621.140.527.226.63.84.6
8.837.328 5
128.764.949.563 8
631.0316.0125.4190.6246.468.6
3.82.71. 1
582.6
377.3
60.2171.6145.5
86.0
82.258.124.13.8
8.7
110.557.153.4
641.1
405.9
57.924.824.8
180.934.094.114.2
167. 124.861 411.9
97.7
90.263.521.542.026.726.27.57.8
8.938.429 5
128.664.348.864.3
633.6315. 8124.3191.5249.768. 1
7.54.43.1
584.7
376. 8
57.9171.8147.1
90.2
83.159.623.67.1
8.3
109.456.153.3
657 6
416.9
64.630.325.5
182.834.394.814.2
169.524.962.711.9
103.4
94.666.923.243.727.727.18.89.2
6.034.728.6
131.364.948.866.4
648.8322.8130. 1192.8253.872. 1
8J87.11.6
597.7
386.1
64.5173.2148. 4
95.4
86.862.524.38.6
5.1
111.256.454.8
668. 8
424.5
63.529.325.4
187.935.097.314.7
173.125.564.012.1
102. 8
96.468.424.543.928.027.56.46.6
8.040.432.4
133.565.749.267.8
662.4329.1130.3198.7259. 074.2
6.46.2.2
603. 5
390.5
63.4176.4150.7
94.2
88.163.724.46.2
6.6
112.156.855.3
681. 5
432.5
65.430.326.0
190.535.299.314.8
176.726.365.312.3
106.2
98.670.924.246.727.727.17.67.0
7.440.132.7
135.466.549.868.9
673.9337.1135.4201.7263.073.9
7.66.51.0
613.0
396.9
66.4177.8152. 7
96.9
89.766.023.77.2
6.2
113.057.056.0
697.2
441.0
66.430.127.3
195.035.9
102.215.0
179. 626.666.712.5
110.3
100.273.025.447.627.226.710.18.9
6.940.833.9
139. 069.252.069.8
687.1344.6138.0206.5268. 0
74.5
10.14.45.7
624.4
403. 3
67.9181.0154.4
100.5
90.767.623.19.8
6.2
114.358.256.2
713.9
451. 8
68.731.328.0
200.137.7
103.815.5
183.027.068.012.7
•111.7
103.675.526.948.528.227.68.17.4
6.441.735.3
144.072.555.071.5
705.8354.6142.5212.0273.8
• 77.4
8.15.03.1
633. 6
409.9
70.7182.9156.3
100.9
93.169.323.87.7
5.7
117. 160.256.8
r Revised. * Preliminary. 9 Includes data not shown separately.
217-518 O-66-4 s-l
Digitized for FRASER http://fraser.stlouisfed.org/ Federal Reserve Bank of St. Louis
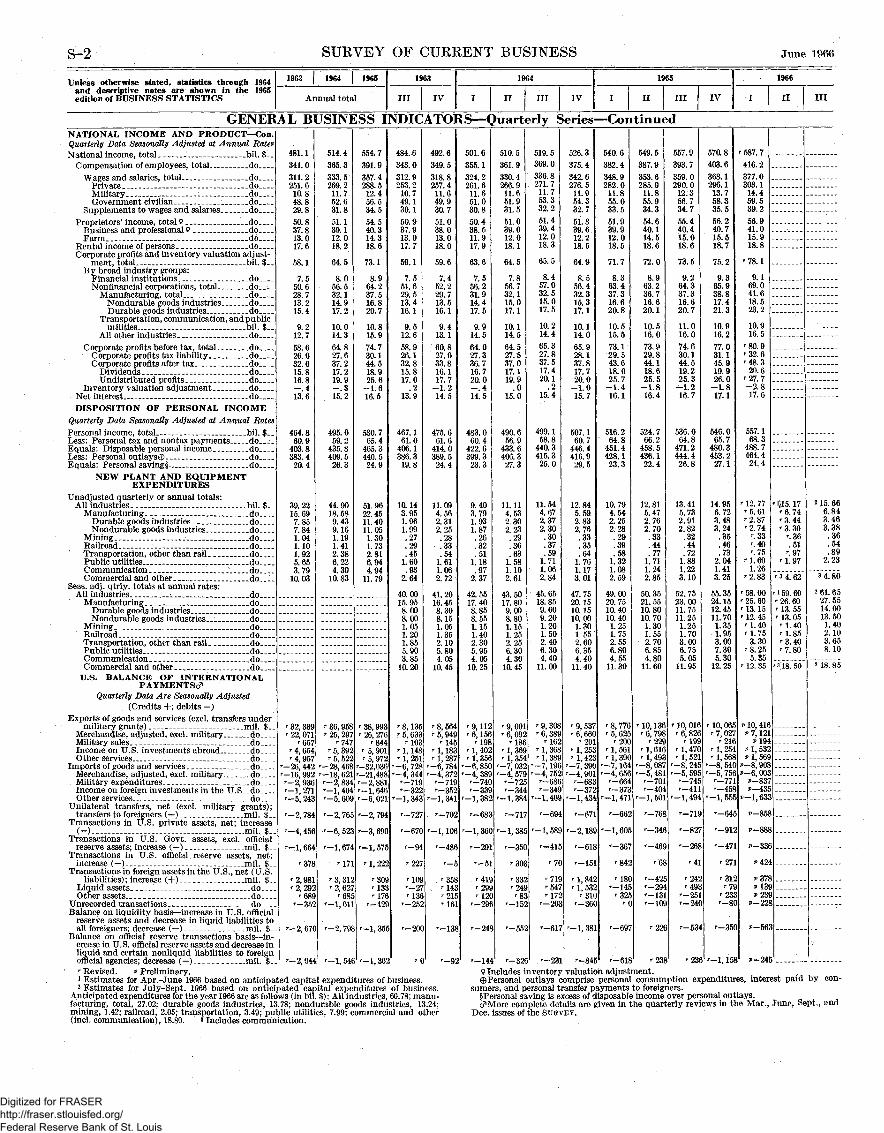
S-2 SUKVEY OF CUKKENT BUSINESS June 1966
Unless otherwise stated, statistics through 1964and descriptive notes are shown in the 1965edition of BUSINESS STATISTICS
1963 1964 1965
Annual total
1963
III IV
1964
I II III IV
1965
I II III IV
1966
I II III
GENERAL BUSINESS INDICATORS— Quarterly Series— ContinuedNATIONAL INCOME AND PRODUCT— Con.Quarterly Data Seasonally Adjusted at Annual RatesNational income total foil $
C ompensation of employees total doWages and salaries, total do
Private - - doMilitary doGovernment civilian do
Supplements to wages and salaries doProprietors' income total 9 do
Business and professional 9 doFarm do
Rental income of persons doCorporate profits and inventory valuation adjust-
ment total foil $By broad industry groups:
Financial institutions doNonfinancial corporations, total -_do__-_
Manufacturing total doNondurable goods industries do
Transportation, communication, and publicutilities bil. $
All other industries doCorporate profits before tax total do
Corporate profits tax liability doCorporate profits after tax do
Dividends do
Inventory valuation adjustment doNet interest doDISPOSITION OF PERSONAL INCOME
Quarterly Data Seasonally Adjusted at Annual RatesPersonal income total bil $Less* Personal tax and nontax payments doEquals: Disposable personal income _ _ __doLess: Personal outlays© doEquals* Personal saving§ do
NEW PLANT AND EQUIPMENTEXPENDITURES
Unadjusted quarterly or annual totals:All industries - _ _ _ bil. $
Manufacturing. ; _ _ _ _ _ doDurable goods industries doNondurable goods industries do
Mining _ doRailroad doTransportation, other than rail doPublic utilities. _. doCommunication doCommercial and other do
Seas. adj. qtrly. totals at annual rates:All industries __: do _
Manufacturing doDurable goods industries doNondurable goods industries __ _ _ _ do _
Mining doRailroad.- doTransportation, other than rail do _Public utilities doCommunication doCommercial and other do _
U.S. BALANCE OF INTERNATIONALPAYMENTS^
Quarterly Data Are Seasonally Adjusted(Credits +; debits -)
Exports of goods and services (excl. transfers undermilitary grants) • _ _ mil. $__
Merchandise, adjusted, excl. military __doMilitary sales doIncome on U.S. investments abroad doOther services do
Imports of goods and services doMerchandise adjusted excl military doMilitary expenditures doIncome on foreign investments in the U.S__do___ .Other services . do
Unilateral transfers, net (excl. military grants);transfers to foreigners ( — ) mil $
Transactions in U.S. private assets, net; increase(— ) mil $
Transactions in U.S. Govt. assets, excl. officialreserve assets* increase ( — ) mil $
Transactions in U.S. official reserve assets, net;increase ( — ) mil $
Transactions in foreign assets in the U.S., net (U.S.liabilities)' increase (+) mil $
Liquid assets doOther assets do
Unrecorded transactions doBalance on liquidity basis— increase in U.S. official
reserve assets and decrease in liquid liabilities toall foreigners* decrease ( — ) mil $
Balance on official reserve transactions basis — in-crease in U.S. official reserve assets and decrease inliquid and certain nonliquid liabilities to foreignofficial agencies' decrease ( — ) mil $' Revised. * Preliminary.1 Estimates for Apr.- June 1966 based on anticipa2 Estimates for July-Sept. 1966 based on antici
Anticipated expenditures for the year 1966 are as foliofacturing, total, 27.02; durable goods industries, Hmining, 1.42; railroad, 2.05; transportation, 3.49; pu(incl. communication), 18.80. 3 includes commun
481.1341.0311.2251.610.848.829.850.837.813.017.6
58.1
7.550.628.713.215.4
9.212.758.626. 032.615.816.8-.413.6
464. 860.9
403.8383.420.4
39.2215.697.857.841.041.101.925.653.79
10. 03
' 32, 339' 22, 071
'657' 4, 654' 4, 957
'-26,442'-16,992'-2,936'-1, 271'-5, 243
'-2, 784
'-4,456
'-1, 664
'378
'2,981' 2, 292
'689'-352
'-2, 67C
'-2,044
ted capitapated cajws (in bil.78; noiidblic utilitii cation.
514.4365.3333.5269.2
11.7:52.631.851.139.112.018.2
64.5
8.056. 532.114.917.2
10.014.364.827.637.217.219.9-.315.2
495.059.2
435.8409.526.3
44.9018.589.439.161.191.412.386.224.30
10.83
' 36, 958'25,297
'747'5,392' 5, 522
'-28,468'-18,621'-2,834'-1, 404'-5, 609
'-2,765
'-6, 523
'-1,674
'171
' 3, 312'2,627
'685'-1,011
'-2, 798
'-1, 546
1 expendi)ital expe$): All in
urable goes, 7.99; c
554.7391.9357.4288.512.456.534.554.540.314.318.6
73.1
8.964.237.516.820.7
10.815.974.730.144.518.925.6
-1.616.5
530.765.4
465.3440.524.9
51.9622.4511.4011.051.301.732.816.944.94
11.79
' 38, 993' 26, 276
'844' 5, 901' 5, 972
'-32,036'-21,488'-2,881'-1, 646'-6,021
'-2, 794
'-3, 690
r i 575
' 1, 222
'309'133'176
'-429
'-1, 35
'-1, 30
tures of 1ndituresdustries,ods induommerci
484.6343.0312.9253.210.749.130.150.937.913.017.7
59.1
7.551.629.513.416.1
9.512.658.926.132.815.817.0
.213.9
467.161.0
406.1386.319.8
10.143.951.961.99.27.29.45
1.60.93
2.64
40.0015.958.008.001.051.201.855.903.85
10.20
' 8, 135' 5, 633
'103' 1, 148'1,251
'-6, 728'-4, 344
'-719'-322
'-1,343
'-727
'-670
'-94
'227
'109'-27'136
'-252
'-200
'
Dusiness.of busir60.78; m£stries, 1,al and o
492.6349.5318.8257.411.649.930.751.038.013.018.0
59.6
7.452.229.713.516.1
9.413.160.827.033.816.117.7
-1.214.5
475.661.6
414.0389.524.4
11.094.562.312.25.28.33.54
1.611.062.72
41.2016.458.308.151.051.352.105.804.05
10.45
' 8, 564' 5, 949
'145' 1, 183'1,287
'-6, 784'-4,372
'-719'-352
'-1, 341
r_702
'-1, 106
'-486
'358, '143
'215'16
'-13
'-9
ICSS.mu-J.24;ther
501.6355.1324.2261.611.651.030.850.438.511.917.9
63.6
7.556.231.914.417.5
9.914.564.027.336.716.720.0-.414.5
483.060.4
422.6399.323.3
9.403.791.931.87.26.32.51
1.18.97
2.37
42.5517.408.858.551.151.402.305.954.05
10.25
' 9, 112' 6, 156
'198' 1 402' 1, 356
'-6,850'-4,389
'-740'-339
'-1,382
'-683
'-1, 360
'-291
'-5
'419'299'12
'-29
'-24
'-149li0F
sume§Pe<?*,
Dec.
510.5361.9330.4266. 911.651.931.551.039.012.018.1
64. 5
7.856.732.115.017.1
10.114.564.527.537.017.119.9
.015.0
490.656.9
433.6406.327. 3
11.114.532.302.23.29.36.63
1.581.102.61
43.5017.809.008.801.151.252.256.304.30
10.45
' 9, 001' 6 092
'186' 1, 369' 1, 354
'-7, 032'-4, 579' 725'-344
'-1,384
'-717
'-1,385
'-350
'303
'33'24S'8
'-15
'-55
'-32deludes iersonalrs, and prsonal salore comissues of
519.5369. 0336.8271.711.753.332.251.439.412.018.3
65.5
8.457.032.515.017.5
10.214.465.327.837.517.420.1
.215.4
499.158.8
440.3415.325.0
11.544.672.372.30.30.37.59
1.711.062.84
45.6518.859.609.201.201.502.406.304.40
11.00
' 9, 308' 6, 389
'162' 1, 368' 1, 389
'-7, 196'-4, 752
'-686'-349
'-1,409
'-694
'-1,589
'-415
'70
'719'547'172
'-203
'-617
'-23nventoryoutlays cersonal tving is eplete detthe SUR\
526.3375. 4342.6276.511.954.332.751.839.612.218.5
64.9
8.556.432.315.317.1
10.114.065.928.137.817.720.0-1.015.7
507.160.7
446.4416.929.5
12.845.592.832.76.33.35.64
1.761.173.01
47.7520.1510.1510.001.301.552.606.354.40
11. 40
' 9, 537' 6, 660
'20' 1, 253' 1, 423
'-7, 390'-4, 90
'-683'-37
'-1, 434
'-67
'-2, 18
'-61
'-15
'1,84'1,53
'31'-36
'-1,38
'-84valuatic
ompriseransfer pxcess of dails are §rrsr.
540.6382.4348.9282.011.855.033.551.939.912.018.5
71.7
8.363.437.316.620.8
10.515.573.129.543.618.025.7-1.416.1
516.264. 8
451.4428.123.3
10.794.542.252.28.29.39.58
1.321.082.59
49.0020.7510.4010.401.251.752.556.804.55
11.30
' 8, 776'5,625
'200' 1, 561' 1, 390
'-7, 164'-4, 656
'-664'-373
'-1, 471
'-662
'-1,605
'-367
'842
'180'-145'32
'-697
'-618n adjustpersonalaymentsisposablc£ven in t
549. 5387. 9353.6285.911.855.934.354.640.114.518.6
72.0
8.963.236.716.620.1
10.516.073.929.844.118.625.5-1.816.4
524.766.2
458. 5436.122.4
12.815.472.762.70.33.44.77
1.711.242.85
50.3521.5510.8010.701.301.552.706.854.80
11.60
' 10, 136' 6, 798
'229'1,616' 1, 493
'-8, 087'-5, 481
'-701'-404
'-1, 50
'-768
'-346
'-469
'6
'-42'-29'-13'-10
'226
'23ment.consum
to foreigi5 incomehe quart
557.9393.7359. 0290.012.356.734.755.440.415.018.6
73.5
9.264.337.316.620.7
11.016.074.630.144.519.225.3-1.216.7
536. 064.8
471.2444.426.8
13. 415.732.912.82
.32
.44
.721.881.223.10
52.7523.0011.7511.251.251.703.006.755.05
11.95
' 10, 016'6,826
'199' 1, 470'1,52
'-8,24'-5, 59
'-74'-41
'-1, 49
'-71
'-82
'-26
'4
'24'49
'-25'-24
'-53
'23
ption exlers.over pererly revi
570. 8403. 6368.1296.113.758.335.556.240.715.518.7
75.2
9.365.938.817.421.3
10.916.277.031.145.919.926.0-1.817.1
546.065.7
480.3453.227.1
14.956.723.483.24.35.46.73
2.041.413.25
55.3524.1512.4511.701.351.953.007.305.30
12.25
' 10, 06'7,02
'21'1,25'1,56
'-8, 54'-5, 75
'-77'-45
'-1,55
'-64
'-91
'-47
'27
'31' 7
'23r_g
'-35
'-1, 15
penditur
sonal outews in tl
' 587. 7416.2377.0303.114.459.539.256.941.015.918.8
'78.1
9.169.041.618.523.2
10.916.5
'80.9'32.6'48.3
20.6'27.7-2.817.6
557.168.3
488.7464.4
24.4
' 12. 77'5.61'2.87'2.74
'.33'.40'.75
'1.601.26
'2.83
' 58. 00' 25. 60' 13. 15' 12. 45'1.40'1.75
3.30' 8. 25
5.35' 12. 35
P 10, 416P 7, 121
P194p 1 532p 1, 569
p-S, 908p-6,003
p-837p-435
p-1, 633
p-858
p-888
p-336
*42
*378*13*>23
*-22S
p-56
p-24
es, inter<
lays,le Mar.,
1J15. 17'6.74'3.44'3.30
'.36.51
'.97'1.97
'34.62
'159.60' 26. 60' 13. 55' 13. 05' 1. 40'1.85' 3. 40'7.80
'318.50
2 15. 666.843.463.38.36.54.89
2.23
34.80
2 61. 6527.5514.0013.501.402.103.658.10
3 18. 85
jst paid by con-
June, Sept., and
Digitized for FRASER http://fraser.stlouisfed.org/ Federal Reserve Bank of St. Louis

June 1966 SURVEY OF CURRENT BUSINESS S-3
Unless otherwise stated, statistics through 1964and descriptive notes are shown in the 1965edition of BUSINESS STATISTICS
1964 1965 v
Annual
1965
Apr. May June July Aug. Sept. Oct. Nov. Dec.
1966
Jan. Feb. Mar. Apr. May v
GENERAL BUSINESS INDICATORS—Monthly Series
PERSONAL INCOME, BY SOURCE
Seasonally adjusted, at annual rates:Total personal income bil. $
Wage and salary disbursements, total doCommodity-producing industries, total-do
Manufacturing _ doDistributive industries. do
Service industries doGovernment. . do
Other labor income doProprietors' income:
Business and professional _ _ _ d oFarm do
Rental income of persons doDividends. doPersonal interest income doTransfer payments. _ _ doLess personal contributions for social insurance
bil. $-
Total nonagricultural income _.do
FARM INCOME AND MARKETINGS
Cash receipts from farming, including Governmentpayments (48 States), total ' mil. $
Farm marketings and CCC loans, total doCrops _ _ _ _ doLivestock and products, total 9 do
Dairy products doMeat animals. _ doPoultry and eggs do
Indexes of cash receipts from marketings and CCCloans, unadjusted:
All commodities 1957-59=100._Crops doLivestock and products do
Indexes of volume of farm marketings, unadjusted:All commodities 1957-59—100
Crops doLivestock and products do
INDUSTRIAL PRODUCTION
Federal Reserve Index of Quantity Output
Unadj., total index (incl. utilities) 1957-59 =100. _By industry groupings:
Manufacturing, total. _ _ doDurable manufactures doNondurable manufactures -do
Mining _ doUtilities do
By market groupings:Final products, total do
Consumer goods _ doAutomotive and home goods _ doApparel and staples do
Equipment, including defense do
Materials. doDurable goods materials doNondurable materials do
Seas, adj., total index (incl. utilities) doBy industry groupings:
Manufacturing, total do
D urable manufactures 9 -doPrimary metals _ do
Iron and steel doNonferrous metals and products do
Fabricated metal products . . doStructural metal parts do
Machinery doNonelectrical machinery... doElectrical machinery do
Transportation equipment 9 doMotor vehicles and parts.. . doAircraft and other equipment do
Instruments and related products doClay, glass, and stone products doLumber and products... doFurniture and fixtures doMiscellaneous manufactures— _ do
Nondurable manufactures doTextile mill products doApparel products doLeather and products do ,___Paper and products. do
T Revised. v Preliminary.1 Italicized total excludes and other footnoted figi
495.0
333.5133.9107.281.1
54.164.316.5
39.112.0
18.217.234.336.6
12.4
478.7
39, 068
36, 89917, 13519, 7645,008
11, 0903,335
114124107
118119117
132.3
133.1133.5132.6111.3151.3
131.8131.7142.8128.1132.0
132. 8131.2134.3
132.3
133.1
133.5129.1126.5138.3132.7130.3
141.4142.1140.6130.7150.1112.4
136.4126.0112.6143.4133.4
132.6122.9134.1102.6133.4
ires inclu<
530.7
357.4143.9115. 586.5
58.168.918.2
40.314.3
18.618.937.139.2
13.2
512. 1
41,380
38, 93017, 14321, 7875,086
12, 8733,523
121125118
118120117
143.3
144.9148.4140.7114.4161.0
142.4140.2159.9134.0146.9
144.1144.2144.0
143.3
144.9
148.4137.5133.6152.1147.8145.4
160.4160.3160.6149.2175.2125.3
151.4133.5117.4157.4146.0
140. 7134.8145.0107. 8142.3
le retroac
520.5
351.5141.4113.685.6
57.267.418.0
40.012.9
18.618.236.537.8
12.9
503.2
2,549
2,466804
1,662438916267
9270
108
8648
114
141. 6
143.4147.5138/2113.0
138.5136.9162.6128.7142.0
144.3144.4144.3
140.9
142.4
145.5141.4141.2153.6147.4144.3
155.4155.2155.8144.6173.2118.6
145.5129.9114.2155.6143. 2
138.5132.2144.3105.0140.0
tive luni
525.0
353.9142.3114. 186.2
57.667.718.1
40.114.7
18.618.536.737.4
13.0
505. 8
2,574
2,546823
1,723454972261
9572
112
8751
114
142. 6
144.6149.0139.0114.4
139.8137. 8163.6129.6144.2
145. 0146.9143.1
141.6
143.1
146.4140.2139.7153. 4146.0142.7
166.9157.0156.8147.3175.5121.7
147.0130.3117.1156.5143.6
138.8131. 6145.3110. 9140.9
p-sum p
528.5
355.4143. 1114. 886.5
57.868.018.2
40.115.9
18.619.137.037.2
13.1
508.2
2,922
2,8961,1061,790
4381,050
278
10896
116
10591
115
145.2
147.2151.7141.5115.9
143.2141.6165. 8133.9146.8
147.0149.5144.5
142.7
144.1
148.1143.0143.3146.1146.4144.3
159.0159.4158. 4149.5178.0123.3
149.8131.6112.8156.8143.6
139.0132.2145.4105.1139.4
>ay-
530.4
357.4144.0115.686.8
58.268.318. 3
40.315.2
18.619.037.237.6
13.2
510. 8
3,152
3,0461,2971,749
4131,029
291
113113114
114117111
139.3
140.3144.9134.6112.3
138.3135.2147.0131.4144.9
140.3142.9137.5
144.2
145.7
150.0148.7152.1138.4148.0145. 5
160.6161.7159.2149.8177.4124.1
152.1132.6115. 4155.8143.5
140.4133.8143.8107.7142.1
ment oamount
532.1
358.8144.6116.187.0
58.568.718.4
40.414.9
18.619.237.537.7
13.3
512.9
3,864
3,2241,3361,888
4051,146
318
120116123
118116119
143.2
143.9143. 3144.7118.2
141.1138.9129.6141.8145.9
145.1144.5145.7
144.5
146.0
150.5146.5143.3149.0147.5145.0
161.4162.4160.1151.5177.5127.3
152.6133. 5117.2156.3146. 6
140. 4134.8141.9107.0141.1
f socialed to $1
i 534. 8545.4
360.8144.7116.487.2
58.870.118.4
40.514.9
18.619.537.7
148.4
13.4
i 526. 2
4,521
3, 9031,8832,020
3971, 275
332
145164131
140160126
145.9
147.5148.3146.5114. 2
145.7143.8148.4142.3149.7
146.2146.6145.8
143.5
145.2
148.2131.2125.0152.3147.0144.7
162. 3162.4162.1149.4175.2125. 6
155.7133.8116.2156.8147.1
141.3135.7143. 8108.2143.9
security3.6 billioi
541.3
364.7146.1117.587.8
59.671.318.6
40.615.3
18.719.737.939.3
13.5
521.7
5,263
4,9232,7702,153
4221,359
358
183241140
181242135
149.9
152.3154.6149.4118.4
151. 4150.1174.9142.2154. 2
148. 6147.6149.7
145. 1
146.7
150.3123.7115.8155.0150.9148.2
166.0165.8166.2155. 0177.1134 *
158. 0134.4118.3159.7150. 4
142.1137. 7145.7109.3143.6
benefitsa. 91
546.1
368.3148.1119. 188.2
60.072.018.9
40.715.5
18.719.938.239.6
13.6
526. 3
4,370
4,2872.2082; 079
4101,309
348
160192135
160200129
148.1
150. 5154.5145.5117.2
148.7145.2173.4136. 2156.1
147.6145.4149.9
146.4
148.2
151.3119.4110.5158.8153. 6152.6
167. 5166. 9168.4157. 3178.0138.0
159.0135.5119.1162.6153.0
144. 2139.4147.2110.1147.4
disburcncludes
550.9
371.3149.5120.088.7
60.472.619.0
40.815.7
18.720.238.540.3
13.7
530.7
3,751
3,6981,7731,925
4371,133
332
138155125
132158113
146.6
148.3155.4139.3117.4
146.4140.0168.7130.9160.3
146.8145. 9147.7
148.7
150. 6
155.0126. 5118.2162.1156.3154.0
170.7169.2172.8160.7179.2143.4
162.2137.6125.4164.3155.5
145.1140.3148.5113.9147.7
ementsdata for
552. 5
373. 8150. 4121.189.4
60. 773.219.2
40.915.7
18.820.438.941.4
16.6
532.5
P 3, 713
3,6481,7191,929
4291,170
297
p 136150125
p 131158111
148.3
149.9156.3141.9115.6
148.5142.2167.4134.1162.1
148.1147.4148. 7
150.2
152.4
157.6130. 8122.9159.1157.0154.2
174.3171.9177.6163.1176.7150.1
166.0139.4125.6165.4151.2
146.0140.1146.9111.7148.4
of $885items no
557.4
377.3152.4123. 089.9
61.074.019.3
41.015.9
18.820.639.441.8
16.8
537.2
p 2, 921
2,754884
1,870405
1,149281
p 10277
121
*9074
103
'152.0
' 154.1' 160. 2' 146. 5
116. 9
'151.6' 145. 6
170.7' 137. 6' 164. 6
' 152. 4' 151. 7' 153. 1
'151.9
' 154. 1
' 159. 7' 133. 6
128.7' 164. 0' 160. 7158.9
176.7174.4179.8163.2175.5151.6
'169.4' 141. 4
126.5166.8155. 3
' 147. 0' 140. 7' 148. 3110.1
' 148. 5
million pt shown
561.4
379.9153.7123.790.2
61.474.619.5
41.216.1
18.920.640.042.0
16.9
540.9
9 3, 139
2,965792
2,173462
1,339337
p 11069
141
P9356
120
' 154. 4
' 157. 0' 163. 8' 148. 3' 118. 5
' 153. 4' 146. 7' 172. 9
138.3' 167. 8
r 155. 4' 155. 8r 155. 0
' 153. 3
' 155. 6
r 161. 6' 141. 4' 136. 1r 168. 5' 160. 7r 158. 9
176.2r 174.0
'179.2' 165. 8' 178. 1' 154. 3
'.171.9' 143. 2' 126. 6r 168. 8' 156. 8
' 148. 0r 140. 7
149.1110.5
' 153. 2
>ut on aiseparate
563.1
'381.6' 154. 2' 124. 7
90.4
61.6'75.3
19. 6
41.3'15.7
18.920.7
'40.4'41.9
16. 9
' 543. 0
P2.885
2,766767
1,999460
1, 189308
P10367
130
p8748
115
' 154. 7
' 157. 8' 165. 0' 148. 8' 114. 9
152.8' 145. 6' 173. 1
' 168. 3
156.4158.3154.4
' 153. 6
' 156. 3
' 162. 8' 143. 0
137. 2169.5
' 160. 9' 159. 3
178.1174.8
' 182. 4' 166. 2' 176. 7' 157. 0
' 174. 8' 143. 0
129. 4169.6
' 156. 4
' 148. 2141.6
150.0
inual ratiy.
565. 5
383.8155. 0125.590.8
61.976.019.7
41.415.5
19.020.740.741.8
17.0
545.6
156.4
159.3166.8149.9120.8
153.8145.8170
170.9
158.6161156
154.8
157.1
163.7148143
162158
180176184164169160
177142
172158
148.9
e basis
Digitized for FRASER http://fraser.stlouisfed.org/ Federal Reserve Bank of St. Louis
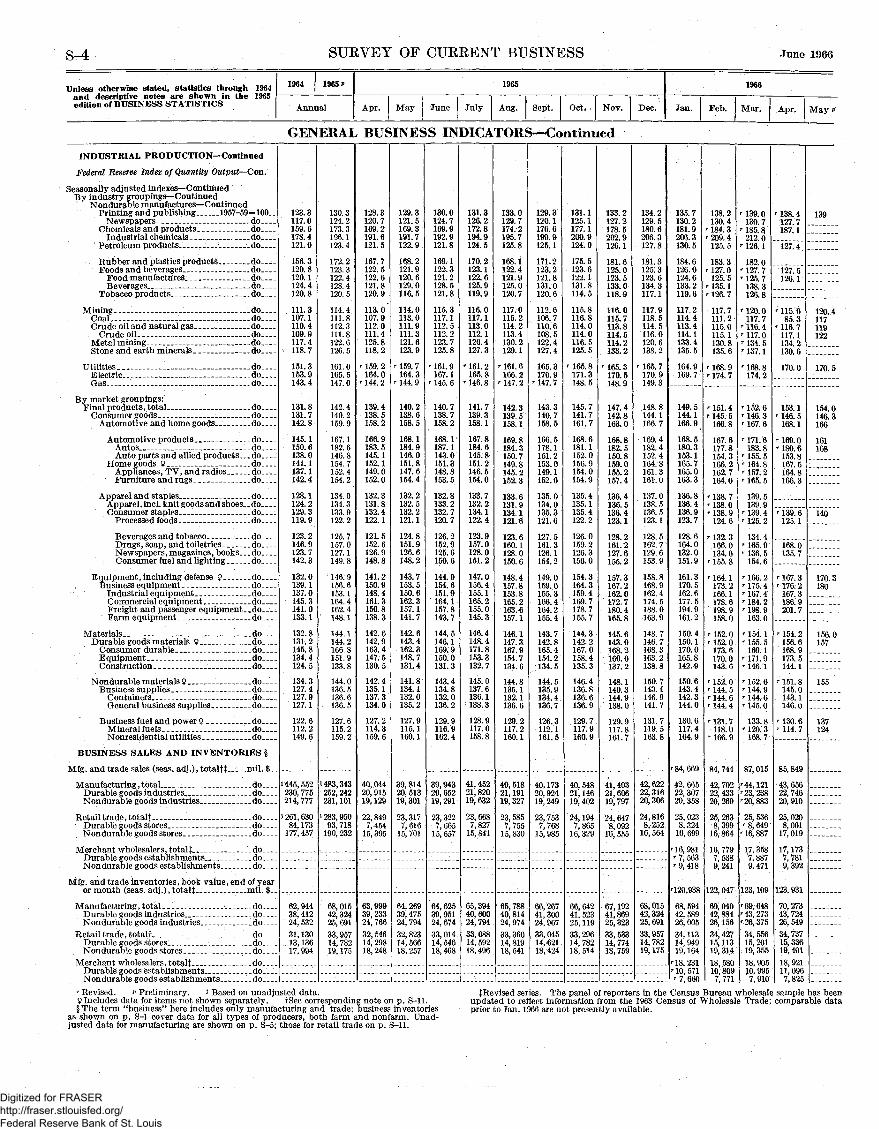
S-4 SURVEY OF CUEEENT BUSINESS June 1966
Unless otherwise stated, statistics through 1964and descriptive notes are shown in the 1965edition of BUSINESS STATISTICS
1964 1965 v
Annual
1965
Apr. May June July Aug. Sept. Oct. Nov. Dec.
1966
Jan. Feb. Mar. Apr. May p
GENERAL BUSINESS INDICATORS—Continued
INDUSTRIAL PRODUCTION— Continued
Federal Reserve Index of Quantity Output—Con.
Seasonally adjusted indexes— ContinuedBy industry groupings— Continued
Nondurable manufactures — ContinuedPrinting and publishing 1957-59=100
Newspapers do__.Chemicals and products __do
Industrial chemicals do_ _Petroleum products _ _ _ _ _ _ _ _ _ _ _ _ _ d o
Rubber and plastics products. _ _ _ _ _ _ _ do _ _Foods and beverages __ .do _
Food manufactures _ _ _ _ _ . _do_ _Beverages _ do _ _
Tobacco products _ _ _ _ do
Mining doCoal - -_ doCrude oil and natural gas _ do_ _.
Crude oil doMetal mining doStone and earth minerals _ _ do
Utilities doElectric _ _ _ do _Gas _ _ ~- _- _do_ _ _
By market groupings:Final products, total do
Consumer goods doAutomotive and home goods _ do _
Automotive products _ _ _ _ do_ _ _ _Autos _ __ _ _ _ _ d oAuto parts and allied products. _ .do____
Home goods 9 doAppliances, TV, and radios. _ do _•_Furniture and rugs do____
Apparel and staples, _ _ „ _ _ _ _ doApparel, incl. knit goods and shoes. _ do _ _ _Consumer staples do
Processed foods _ ' _ _ _ _ _ _ _ do
Beverages and tobacco.- do___Drugs, soap, and toiletries do ___Newspapers , magazines , books_ _ _ doConsumer fuel and lighting do
Equipment, including defense 9 _ _ _ doBusiness equipment _ _ _ _ _ _ _ _ _ _ _ do _
Industrial equipment. __ _ _ _ do_ _C ommer cial e quipment doFreight and passenger equipment __do_ _Farm equipment do
Materials doDurable goods materials 9 do
Consumer durable..-- _~ _ _ _do _ _ _Equipment doConstruction do
Nondurable materials 9-_ - _ _ • _ ' . doBusiness supplies __ __ _ _ _ _ _ _ _ do __
Containers doGeneral business supplies _ do_ _
Business fuel and power 9 d o _ _ _ _Mineral fuels _ _ __ _ __ do _Nonresidential utilities do
BUSINESS SALES AND INVENTORIES §
Mfg. and trade sales (seas, adj.) , totalft - mil. $
Manufacturing , total doDurable goods industries _ _ _ _ _ _ _ d o _Nondurable goods industries. _ _ do. _
Retail trade, totalt _ _ doDurable goods stores _ doNondurable goods stores do
Merchant wholesalers, total|__ _ _ do _ _Durable goods establishments doNondurable goods establishments do
Mfg. and trade inventories, book value, end of yearor month (seas, adj.), totalj mil. $
Manufacturing, total. _ _ _ _ _:_ doDurable goods industries doNondurable goods industries _ _ do
Retail trade, totalf- _ _ _ _ do _Durable goods stores doNondurable goods stores do
Merchant wholesalers, total J doDurable goods establishments _ _ _ do _Nondurable goods establishments- _ _ do_
123.3117.0159.6178.4121. 0
156.3120.8120.1124.4120.8
111.3107.1110. 4109.9117. 4118.7
151. 3153.9143.4
131.8131.7142. 8
145. 1150. 6138. 0141.1137. 1142.4
128.1124.2129.3119.9
123.2146.9123.7142.3
132. 0139.1137.0145.3141. 0133.1
132.8131. 2145.8134. 4124.5
134. 3127.4127. 9127. 1
122.6112.2149.6
1445,552230, 775214, 777
1 261, 63084, 173
177,457
62, 94438, 41224,53231,13013, 13617, 994
130 3124.2173.3196.1123.4
172.2123 3122.4128. 4120.5
114 4111 8112. 3111 8122 6126.5
161.0165.5147.0
142 4140 2159.9
167. 1182.6146.8154.7152.4154.2
134.0134.3133.9122. 2
125.7157.0127.1149.8
146. 9156. 6153.1164.4162.4148. 1
144 1144. 2166.8151 9133 8
144. 0136.5136. 6136. 5
127.6115.2159. 2
i 483, 343252,242231, 101
1 283, 95093,718
190, 232
68,01542, 32425,69133, 95714 78219 175
128.3120.7169. 2191.6121.5
167.7122. 5122.6121.8120.9
113.0107.9112.0111.4125.8118.2
' 159. 2164.0
' 144. 2
139.4138. 5158.2
166.9183. 5145.1152.1149.0152. 0
132.3131.8132. 4122.1
121.5152.6126.9148.8
141.2150.9148.4161.3150.8138.3
142.6142.9163. 4147. 5130. 5
142.4135.1137.3134.0
127.2114. 3159.6
40, 04420, 91519, 129
22, 8497,454
15 395
63, 99939, 23324, 76632, 54614, 29818,248
129.3121.5169. 3191.7122. 9
168.2121.9120.6129.0116. 5
114.0113.0111. 9111.3121.6123.9
' 159. 7164.3
' 144. 9
140.2138.6158. 5
168.1184.9146. 0151.8147.6154.4
132. 2132.5132. 2121.1
124.8151.9126.6148.2
143.7153.5150. 6162. 3157. 1141.7
142.6143.4162. 3148. 7131. 4
141. 8134. 1132.0135.2
127.9115.1160. 1
39, 81420, 51319, 301
23, 3177,616
15 701
64, 26939,47524,79432, 82314, 56618, 257
130. 0124.7169.9192.9121.8
169.1122. 3121.2128.5121.8
115.3117.1112.5112.2123. 7125. 8
r 161. 9167.1
r 145. 6
140.7138. 7158. 2
168.1187. 1143.0151.3148.8153. 5
132. 8133.2132.7120.7
126.2152.9125.6150. 6
144.9154. 6151. 9164. 1157. 8143. 7
144.5146. 1169.9150 0131.3
143.4134.8132.0136.2
129.9116.9162.4
39,94320, 65219, 291
23 3227, 665
15 657
64, 62539,95124, 67433,01414, 54618, 468
131.3126.2172.8194.9124.5
170. 2123.1122.6125.9119.9
116. 0117.1113.0112.1126.4127. 3
r 161. 2165. 8
'146.8
141.7139.3158. 1
167. 8184.6145:8151.2146.5154.0
133.7132.2134.1122.4
123.9157.0128.0151.2
147. 0156.4155.1165.2155.0145. 3
146.4148.4171. 8153. 3132.7
145.0137.6136. 1138. 3
128.9117.0158.8
41, 45221, 82019, 632
23, 6687,827
15,841
65, 39440, 60024, 79433,08814, 59218, 496
133.0129.7174.2195.7125.8
168.1122.4121.9125.0120.7
117.0115.2114.2113.4130.2129.1
r 161. 6166. 2
' 147. 2
142 3139 5158 1
169.8184 3150.7149 8145 2152. 3
133 6131.9134 1121 6
123.6160.1128.0150 6
148 4157 8153.8165. 2163.6157 1
146 1147 3167. 9154 7134 6
144.8135.1132 1136. 6
129.2117.2160.1
40,51821, 19119,327
23 5857 755
15 830
65,78840, 81424, 97433,36014 81918, 541
129. 3120.1176.6199.9125.1
171.2123.2121.8131.0120 6
112 6106.7110.6108 5122 4127. 4
165 3170.9
' 147. 7
143 3140 7158 5
166.5178. 1151.2153 0149 1152.0
135. 0134.0135 3121 6
127.5161. 3126.1154.2
149 0159 0155. 3166.4164.2155 4
143 7142 8165. 4154 2134 5
144. 5135.9134 4136. 7
126.3112.1161 5
40,17320 92419 249
23 7537,768
15 985
66,26741 30024 96733, 04514,62118,424
131. 1125. 1177.1200.9124. 0
175. 5123.6122. 1131. 8114. 5
115. 8116.8114. 0114. 0116.5125.5
r 165. 8171. 3148.5
145.7141. 7161. 7
168. 6181. 1152.0156.9154.0154. 9
135. 4135.1135.4122.2
126. 0159.2126.3156. 0
154.3164.3159.4169. 7178. 7155.7
144. 3142.2167.0158. 4135.3
146.4136.8136. 6136.9
129.7117.9160. 9
40 54821 14619 402
24 1947, 865
16 329
66, 64241 52325 11933, 29614 78218, 514
133 2127.2178. 5202.9126 1
181. 6125 0123. 5133. 0118 9
116 0115 7113.8114 5114 2133.2
' 165 3170 5148 9
147 4142 8163 0
168. 8182 5150.8159 0155 2157.4
136 4136.5136 4123 1
128. 2161. 2127.6155.2
157 3167 2162. 0172.7180. 4165 8
145 6143 0168 2160 0137 2
148.1140.3144 9138.0
129.9117. 8161 7
41 40321 60619, 797
J24 6478 092
16 555
67, 19241 86925, 32333, 53314 77418, 759
134 2129 5180.6206.3127 8
181.3125 3123.6134.3117 1
117 9118 5114. 5116 0120 6138.2
' 165. 7170 9149.3
148 8144 1166 7
169. 4182.4152. 4164 8161. 3161.0
137.0138.5136 5123.1
128. 5162. 7129.6153. 9
158.8168.9162.4174.5188. 0163 9
148 7146 7168.3163 2138.8
150. 7143. 4146.9141.7
131.7119. 5163.8
42, 62222,31620,306
24,8168,252
16, 564
68, 01542, 32425, 69133,95714, 78219, 175
135.7130.2181.9206.3130.5
184.6126.0124.6133. 2119.6
117. 2114.4113.4114.1133.4135.5
164.9169.7
149. 5144.1166.9
168. 5180.3153.1165. 7165.0163.3
136.8136.4136.9123.7
128.6164. 0132.0151.9
161.3170. 5162.6177.5194.9161.2
150.4150.1170.0165.8142.9
150.6143.4142.3144.0
130.6117.4164.9
'84,669
42, 66522,30720, 358
25, 0238, 324
16 699r 16, 981' 7 563r 9, 418
"120,938
68, 59442, 58926, 00534, 11314 94919, 164
r 18, 231'10,571' 7. 660
138 2130 4
'184.3' 209. 4
125 5
183. 3r 127 0
125 5r 135. 1r 126 7
117 7111 2115 0115 1130 8135.6
r 168 9r 174 7
r 151 4r 145 5
166 8
167.6177 8154. 3166 2162 7164.0
r 138 7
r 138. 0r 138 9
124 6
r 132 3
166.0134.0
'155 8
' 164 1173 2166 1178. 6198 9158 0
r 152 0r 152 o
173 6170 0143 6
' 152. 0r 144 5r 144 6r 144. 4
' 131. 7118 0
r 166 9
84 744
42 70222 43320,269
25 2638, 399
16 864
16, 7797 5389 241
122 047
69, 04042,88426,15634,42715 11319, 31418, 58010,8097. 771
r 139 o130 7
' 185. 8.212 0
r 126 1
182.0r 127 7r 125 7
138 3126 8
r 120 0
117 7' 116 4r ii7 Qr 134 5' 137. 1
r 168 8
174 2
r 152 6r 146 3
' 167 6
'171.6183 8
'155.5r 164 8r 157 2' 165. 5
139 5139.9
T 139 4r 125 2
134.4'165.9' 136. 5
154 6
' 166 2' 175 4'167 4'184.2'198 9
163 0
' 154 1' 155 5
169 1r 171 9
'146 1
' 152. 6' 144.9' 144 6'145.0
133.8' 120. 3
168 7
87, 015
' 44, 121'23,238'20,883
25, 536'8,649'16 887
17, 3587 8879,471
123, 109
'69,648'43,273••26,37534, 55615, 20119, 35518, 90510,9957. 910
r 138 4
127 7187. 1
127 4
127 5126 1
r 115 o85 3
r H6 7
117 1134 2130. 6
170 0
153 ir 146 5
168 1
r 169.0r 180 6
153. 8167 5164 8166.3
'139 6125 1
168. 0135.7
' 167 3'176 2
167.3186.9201 7
' 154 2156 6168 9173 5144 1
' 151. 8145.0143 1146.0
' 130. 6' 114. 7
85 849
43, 65622, 74620,910
25, 0208,001
17, 019
17, 1737,7819,392
123, 931
70,27343, 72426,54934,73715, 33619, 40118,92111, 0967,825
139
ion 4.
117119122
170 5
154 0146 3166
161168
140
170 3180
156 0157
155
137124
' Revised. ? Preliminary. i Based on unadjusted data.9Includes data for items not shown separately. fSee corresponding note on p. S-ll.§The term "business" here includes only manufacturing and trade; business inventories
as shown on p. S-l cover data for all types of producers, both farm and nonfarm. Unad-justed data for manufacturing are shown on p. S-5; those for retail trade on p. S-ll.
^Revised series. The panel of reporters in the Census Bureau wholesale sample has beenupdated to reflect information from the 1963 Census of Wholesale Trade; comparable dataprior to Jan. 1966 are not presently available.
Digitized for FRASER http://fraser.stlouisfed.org/ Federal Reserve Bank of St. Louis

June 1966 SUKVEY OF CUKKENT BUSINESS S-5
Unless otherwise stated, statistics through 1964and descriptive notes are shown in the 1965edition of BUSINESS STATISTICS
1964 1965
Annual
1965
Apr. May June July Aug. Sept. Oct. Nov. Dec.
1966
Jan. Feb. Mar. Apr. May
GENERAL BUSINESS INDICATORS—ContinuedBUSINESS SALES AND INVENTORIES— Con.Inventory-sales ratios:
Manufacturing and trade, totalft ratio
Manufacturing, total doDurable goods industries do
Materials and supplies. doWork in process doFinished goods _ _ _ _do
Nondurable goods industries.- _do__Materials and supplies doWork in process.... _ doFinished goods do
Retail trade, totalf- _ _ > doDurable goods stores, __ _ _ _ _ _ _ _ _do __Nondurable goods stores do
Merchant wholesalers, totalt __ _ _do _Durable goods establishments doNondurable goods establishments do
MANUFACTURERS' SALES, INVENTORIES,AND ORDERS
Manufacturers' export sales-Durable goods industries (unadj.), total___mil. $__
Shipments (not seas, adj.), total . _ _ • _do _
Durable goods industries, total 9 ... doStone, clay, and glass products. _ _ doPrimary metals do
Blast furnaces, steel mills doFabricated metal products _ do
Machinery, except electrical doElectrical machinery. doTransportation equipment _ . _ do _
Motor vehicles and parts... _do_Instruments and related products do
Nondurable goods industries, total 9 - -- doFood and kindred products.. doTobacco products doTextile mill products _ doPaper and allied products. _ doChemicals and allied products . doPetroleum and coal products doKubber and plastics products __ do
Shipments (seas, adj.), total _ doBy industry group:
Durable goods industries, total 9 doStone, clay, and glass products doPrimary metals. _ do
Blastfurnaces, steel mills __do ___Fabricated metal products do
Machinery, except electrical doElectrical machinery doTransportation equipment do
Motor vehicles and parts... . _ doInstruments and related products do
Nondurable goods industries, total 9 _ doFood and kindred products doTobacco products doTextile mill products.... _ __ doPaper and allied products.. _ doChemicals and allied products doPetroleum and coal products. _ _ _ doRubber and plastics products _ do
By market category:Home goods and apparel d o _ _ _ _Consumer staples doEquipment and defense prod., excl. auto doAutomotive equipment __ _ _ _ doConstruction materials and supplies doOther materials and supplies do
Supplementary market categories:Consumer durables doDefense products doMachinery and equipment _ _ _ _ _ _ _ d o
Inventories, end of year or month:Book value (unadjusted), total do
Durable goods industries, total doNondurable goods industries, total do
Book value (seasonally adjusted), total doBy industry group:
Durable goods industries total 9 doStone, clay, and glass products doPrimary metals _ _ _ _ _ _ d o
Blast furnaces, steel mills doFabricated metal products do
Machinery, except electrical doElectrical machinery doTransportation equipment do
Motor vehicles and parts doInstruments and related products do
r Revised. 1 Advance estimate. 2 Based on dtSee corresponding note on p. S-ll.
1.641.91.57.79.54
1.35.53.19.62
1.401.861.18
9,001
445, 552
230, 77511, 52538, 83221, 23623, 549
33, 69630, 20759, 628 .38, 4507,523
214, 77775, 8834,693
17, 80817, 11633, 57818, 18710, 212
2 41, 7502 94, 3972 55, 1852 43, 3442 35, 878174, 998
2 17, 9022 25, 9532 42, 331
62, 64238, 00124, 641
62, 944
38, 4121,5876,1113,7074, 251
7,5585,3887,9083,0131,619
Ua not se
1.611.91.59.80.52
1.29.50.19.60
1.381.841.16
9,941
483, 343
252, 24211, 75341, 91022, 91624,292
36, 49033, 59368, 03945, 4128,347
231, 10180, 6784,864
19, 31819,38536, 03019, 17811, 653
2 44, 909101, 305
2 60, 3002 50, 4032 37, 543188, 883
2 19, 2832 27, 9652 47, 115
67, 62041, 83125, 789
68, 015
42, 3241,6266,3493,6784,856
8,5086,0938,9303,3181, 788
isonally a
1.601.88.59.77.51
1.29.50.18.60
1.421.92L19
853
41, 282
21, 968967
4,0742,4382,085
3,2282,7185,8663,970
696
19, 3146,594
4271,5741,6173,2211,5531,007
40, 044
20, 915935
3,7962,2452,048
2,9842,7575,4083,620
701
19, 1296,667
4401,5641, 5913,0091,583
967
3,6818,3954,9074,0203,063
15,978
1,5942,2593,871
64,36639, 63324, 733
63, 999
39, 2331,6065,9003,4274,517
7,7265,6288,0953,1501,653
djusted.
1.611.92.61.79.52
1.28.50.18.60
1.411.911.16
800
40, 074
21, 1571,0103,6131,9232,025
3,1642,6465,7553,898
679
18, 9176,575
3741,5531, 5663,1801,584
998
39,814
20, 513923
3,4351,8351,955
2,9932,7485,5193,680
688
19, 3016,661
3641,6101,5723,0301,631
988
3,7698,2804,9484,0883,001
15, 728
1,5672,2813,849
64,76940, 03324, 736
64, 269
39, 4751,6205,9963,5314,544
7,7635,6628,1043,2491,676
1.621.93.61.80.53
1.28.50.19.59
1.421. 901.18
831
41, 914
22,2801,0953,6391,9542,147
3,2992,8446,1064,144
732
19, 6346,825
4391,6791,6533,1891,6471,028
39,943
20, 652962
3,3891,8201,974
3, 0092,7015,6683,814
691
19, 2916,671
4111,6001,5753,0571,637
958
3,7058,3744,9424,2323,062
15, 628
1,5532,2983,838
64, 97940, 32124, 658
64, 625
39, 9511,6236,0743,5974,565
7,8785,7268,2673,2901,687
1.581.86.58.78.50
1.26.49.18.59
1.401.861.17
747
37, 844
19, 5641,0223,2731,8471,905
2,8572,5395,0693,366
650
18, 2806,545
4151, 3681,5032,8231,624
883
41, 452
21, 820969
3,7822,1702,036
3, 1192,8945,8704,004
728
19, 6326,777
4001, 6031,6563,0631, 648
980
3,7888,5825,0934,4083,169
16, 412
1, 6442,3244,070
65, 08840, 41024,678
65, 394
40, 6001,6006,1633,6314,611
7,9885, 8108,6533,5271,683
<
1.621.93.60.82.51
1.29.50.19.60
1.411.911.17
805
39, 443
19, 8131,0463, 5902,0762,089
2,8142,7464,3552,570
675
19, 6306,780
4071,6861,6582,9441,637
948
40, 518
21, 191926
3,7082,1051,968
2,9902,8005,8033,932
703
19, 3276,843
3871,6191,6162,9571,615
968
3,7008,5545,0014,3473,058
15, 858
1,5642,3413, 878
65, 48140, 70424, 777
65, 788
40, 8141,6186,1423,5764,685
8,1425,8738,6003,3701,696
? Include:See corr
1.651.97.61.83.53
1.30.51.19.60
1.391.881.15
870
41, 198
20, 7781,0463,2661,6752,122
3,0633,0025, 0353,071
742
20, 4207, 215
4251,7251,7063,1331,628
983
40, 173
20,924953
3,2371,6521,995
3,0812,7965,8633,905
694
19, 2496,821
4151, 5811,6312,9421, 614
951
3,7158, 5495,1254,3233,080
15, 381
1, 5672,4223,980
65, 86941, 09624, 773
66, 267
41, 3001,6146,2243,6334,766
8,2985,9078,7073, 4301, 711
s data foespondin
1.641.96.61.83.53
1.29.50.20.59
1.381.881.13
856
42, 185
21, 7481,0503,2151,5952,088
3.0483,0636,0574,178
728
20, 4377,154
4051, 7511,7183,0701,6501,032
40, 548
21, 146947
3,2041,6081,963
3,1272,9065,9734,037
707
19, 4026,845
4051,6091,6562,9821,639
958
3,7358,6155,1724,4523,066
15, 508
1,6182,4024,035
66, 21841,21225, 006
66, 642
41,5231,6406,2753,6694,772
8,3645,9478,7063,4121,714
r items ng note or
1.621.94.60.82.52
1.28.50.19.59
1.361.831.13
884
41, 642
21, 738993
3,2661,6122,101
2,9703,0876,2234,326
729
19, 9047,018
4101,7211,6752,9581,613
985
41, 403
21,6061,0133,3351,6812,139
3,1502,9625, 9073, 981
710
19, 7977, 001
3941,6731,6913,0671,6191,012
3,8618,8125,1754,4183, 252
15, 885
1,6742,3854,087
66, 77741, 40725, 370
67, 192
41, 8691,6346, 2613,6584,816
8,4535,9938,8603,3661,730
ot showni p. S-4.
1.601.90.58.81.51
.1.27.49.19.58
1.371.791.16
1,006
40, 766
21, 659934
3,1881,5462,014
3,1243,1176,3424,180
773
19, 1076,832
4001,5801,6492, 7971,625
995
42,622
22,3161,1403,4701,7302, 166
3,2423,0736,0753,993
713
20,3067,131
4101, 7031,7623,1331,5941,064
4,0678,9555,3854,4483,409
16, 358
1,7702,5304,188
67, 62041,83125, 789
68,015
42, 3241,6266,3493,6784,856
8,5086,0938,9303,3181,788
i separat
'1.43
1.611.91.58.82.51
1.28.49.19.59
1.361.801.15
'1.07'1.40'.81
855
39, 982
20, 751856
3, 3791,7131,908
2,9522,8545,9814,034
678
19, 2316,861
3871,4951,6322,9981,622
986
42, 665
22,3071,0923,4991,7412,130
3,2573,1455, 9623,824
764
20, 3587,157
4271,6591,7173,1431,6051,055
4,0058,9795,4844,2983,427
16, 472
1, 6982, 6044,272
68, 65142, 46326, 188
68, 594
42, 5891, 6386,4383,7604,828
8,5216,1778,9843,2631, 806
ely.
1.44
1.621.91.58.82.51
1.29.50.19.60
.1.361.801.15
1.111.43.84
882
43,570
22,878885
3,7731,9192,110
3,3123,1936,4854,270
742
20,6927,234
4101,6721,7433,1451,6681,061
42,702
22,4331,0423,6431,8432,202
3,1793,1206,0493,955
740
20,2697,114
4331,6241,7103, 1271,6381,051
3,9568, 9615,3144,4103,36116,700
1,7112,5774,192
69,44143,07026,371
69,040
42,8841,6436,4863,7864,829
8,5756,2109,0473,2761,822
1.41
1.58"1.86
.56
.81'.49
'1.26.49.19.59
1.351.76
'1.15
1.091.39.84
'983
'45,218
'23,996r976
' 3, 9552,076
' 2, 203
' 3, 526' 3, 332' 6, 655' 4, 431
'809
'21,222' 7, 259
'430' 1, 754' 1, 810'3,404' 1, 597' 1, 113
'44,121
'23,238' 1, 078' 3, 726
1,930' 2, 288
' 3, 285' 3, 266' 6, 243r 4, 096
'803
' 20, 883r 7, 257
'450' 1, 729' 1, 763r 3, 326' 1, 640' 1, 081
' 4, 140r9,14Qr 5, 529' 4, 573' 3, 488
'17,251
'1,817r 2, 637' 4, 376
70, 04943, 59426, 455
69, 648
43, 273r 1, 652' 6, 5533,813
' 4, 779 '
' 8, 610' 6, 334' 9, 186' 3, 226' 1, 851
1.44
1.611.92.58.84.50
1.27.49.19.59
1.391.921.14
1.101.43.83
938
45, 040
23,9091,0134,0712,1782,193
3, 5303, 2386,5204,288
796
21, 1317,220
4031,7041,7663,5071,7171,125
43, 656
22, 746980
3,8012,0062,154
3,2493,3065,9593,850
802
20, 9107,299
4151,6881,7363,2681,7501, 080
4,1129,1295,4854,2933,317
17, 320
1,7952,6554, 313
70, 67744, 16226, 515
70, 273
43, 7241,6636,5913,8174,753
8, 6466,4119,4683, 2871,873
123,7001 4, 000
1 6, 500
1 23, 100
13,800
!6,200
Digitized for FRASER http://fraser.stlouisfed.org/ Federal Reserve Bank of St. Louis
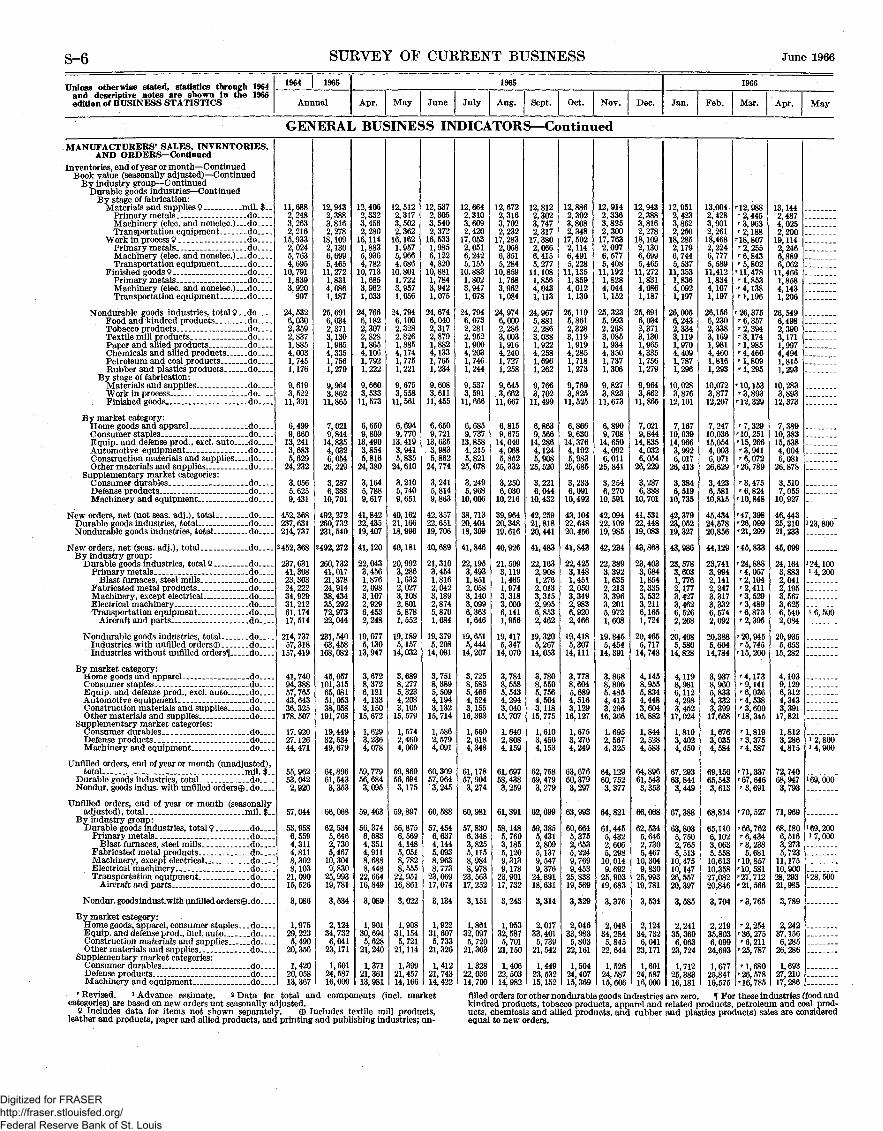
S-6 SURVEY OF CURRENT BUSINESS June 1966
Unless otherwise stated, statistics through 1964and descriptive notes are shown in the 1965edition of BUSINESS STATISTICS
1964 | 1965
Annual
1965
Apr. May June July Aug. Sept. Oct. Nov. Dec.
1966
Jan. Feb. Mar. Apr. May
GENERAL BUSINESS INDICATORS—ContinuedMANUFACTURERS' SALES, INVENTORIES,
AND ORDERS— ContinuedInventories, end of year or month— Continued
Book value (seasonally adjusted)— ContinuedBy industry group— Continued
Durable goods industries— ContinuedBy stage of fabrication:
Materials and supplies 9 ._ mil. $_Primary metals _ _ _ d o _ _ _ _Machinery (elec. and nonelec.)___doTransportation equipment _ __do _.
Work in process? doPrimary metals doMachinery (elec. andnonelec.)_._doTransportation equipment do
Finished goods 9 doPrimary metals _ _ _ do _ _Machinery (elec. andnonelec.)---doTransportation equipment do
Nondurable goods industries, total 9 - -doFood and kindred products. _ . _ doTobacco products _ _ _ do _Textile mill products doPaper and allied products doChemicals and allied products doPetroleum and coal products doRubber and plastics products do
By stage of fabrication:Materials and supplies doWork in process doFinished goods do
By market category:Home goods and apparel _ _ _ _ _ d oConsumer staples _ _ _ _ _ _ doEquip, and defense prod., excl. auto doAutomotive equipment doConstruction materials and supplies doOther materials and supplies... .do
Supplementary market categories:Consumer durables doDefense products doMachinery and equipment _._ .do _
New orders net (not seas. adj.)» total doDurable goods industries, total .do ._Nondurable goods industries, total do
New orders, net (seas, adj.), total . doBy industry group:
Durable goods industries, total 9 doPrimary metals _ _ _ _ . _ _ _ . _ d o _
Blast furnaces, steel mills. _ do. _Fabricated metal products. ___doMachinery, except electrical . doElectrical machinery.. _ _ _ _ _ _ _ d o _ _Transportation equipment do
Aircraft and parts _ do
Nondurable goods industries, total doIndustries with unfilled orders© doIndustries without unfilled order sf do. _ _
By market category:Home goods and apparel do. _Consumer staples doEquip, and defense prod., excl. auto. doAutomotive equipment . do _Construction materials and supplies. .—_ doOther materials and supplies.. _ _ - do _
Supplementary market categories:Consumer durables.. _do_ ._Defense products doMachinery and equipment ._ do
Unfilled orders, end of year or month (unadjusted),total _ _ _ _ mil. $
Durable goods industries, total doNondur. goods indus. with unfilled orders ©.do
Unfilled orders, end of year or month (seasonallyadjusted), total ._ . mil. $
By industry group:Durable goods industries, total 9 ...do
Primary metals _ _ doBlast furnaces, steel mills _ _ _ _ do _
Fabricated metal products. doMachinery, except electrical doElectrical machinery do _Transportation equipment do. _
Aircraft and parts do
Nondur. goods indust. with unfilled orders®, do
By market category:Home goods, apparel, consumer staples. __ doEquip, and defense prod., incl. auto doConstruction materials and supplies doOther materials and supplies.. _ _ _ _ do
Supplementary market categories:Consumer durables . doDefense products... do .Machinery and equipment do
'Revised. i Advance estimate. 2 Data forcategories) are based on new orders not seasonally a(
9 Includes data for items not shown separatel1leather and products, paper and allied products, am
11, 6882, 2483,2632,216
15,9332,0245,7634,695
10, 7911, 8393,920
997
24, 5326,0302,3592,8371,8854,0031,7451,176
9,6193,522
11, 391
6,4999,660
13, 2413,6835,629
24, 232
3,0565,6259,431
452,368237, 631214, 737
2452,368
237, 63141, 30823, 30324, 22234, 92931, 21261, 17417, 514
214, 73757, 318
157, 419
41, 74094,38857, 76543, 64336, 325
178, 507
17, 92027, 12644, 471
55, 96253,0422,920
57,044
53, 9586, 5594,3114,8118,3028,103
21, 09015, 526
3,086
1,97529,2235,490
20, 356
1,42020, 05813, 367
total anIjusted.y. © I]printing
12,9432,3883,8162,278
18, 1092,1306,6995,465
11, 2721,8314,0861, 187
25, 6916,0342,3713,1301,9654,3351,7561,279
9,9643,862
11,865
7,0219,844
14,8354,0326,054
26,229
3,2876,388
10,701
492, 272260,732231, 540
2492, 272
260,73241, 01721,37824,91438,43435,29272,97322,044
231,54063,458
168,082
45, 057101,31565, 08151,05338,058
191, 708
19,44932,53449,679
64,89661,5433,353
66,068
62,5345,6462,7305,467
10,3049,830
25,99319,781
3,534
2,12434, 7326,041
23, 171
1,60124,58716, 000
d compo
deludes tand pubh
12,4062, 3323,4562,280
16, 1141,8835,9364,782
10, 7131,6853,9621,033
24, 7666,1822,3072,8281,8654,1061,7921,222
9,6603,533
11, 573
6, 6509,809
13, 4903,8545,816
24, 380
3,1645,7889,617
41,84222,43519, 407
41, 120
22,0433,4561,8762,0983,1072,9296,4532,248
19, 0775,130
13, 947
3,6728,3726,1214,1333,150
15, 672
1,6293,2364,078
59, 77956, 6843,095
59, 463
56, 3746,6834,3514,9118,6888,448
22, 66416,849
3,089
1,90130,6945,628
21, 240
1,37121, 36113, 981
nents (i
3xtile mishing inc
12, 5122,3173,5022,362
16, 1621,9575,9664,686
10, 8011,7223,9571,056
24, 7946,1002,3282,8261,8854,1741,7751,221
9,6753,558
11,561
6,6949,770
13, 4193,9415,835
24, 610
3,2105,7409,651
40, 16221, 16618,996
40, 181
20,9923,2861,6322,0273,1082,8015,8781,552
19, 1895,157
14, 032
3,6898,2775,3234,2083,105
15, 579
1,5742,4604,069
59, 86956, 6943,175
59, 897
56, 8756,5694,1485,0518,7828,555
22, 95116, 861
3,022
1,90831, 1545, 721
21, 114
1,39921, 45714, 166
ncl. mai
11 produlustfies;
12, 5372,3053,5402,372
16, 5331,9856,1224,820
10, 8811,7843,9421, 075
24, 6746,0402,3172,8791,8824,1331, 7651,234
9,6083,611
11, 455
6,6509,721
13,6353, 9835,862
24, 774
3,2415,8149,863
42, 35722, 65119,706
40, 689
21, 3103,4541,8162,0423,1892,8745,8701,684
19, 3795,298
14, 081
3,7518,3895,5094,1943,132
15, 714
1,5862,5794,091
60, 30957,0643, 245
60, 588
57, 4546,6374,1445,0938,9638,773
23,06917, 074
3,134
1,92231,6075,733
21, 326
1,41221, 74314, 422
ket
cts,un-
12,6642,3103,6092,420
17, 0532,0516,2425,155
10,8831,8023,9471,078
24, 7946,0732,2812,9521,9004,2031,7461,244
9,5373,591
11, 666
6,6859,737
13,8584,2155,821
25, 078
3,2495,968
10,006
38, 71320,40418,309
41, 846
22, 1953,4931,8512,0583,1403,0996,3631,646
19, 6515,444
14, 207
3,7258,5835,4664,5243,155
16, 393
1,5602,6184,348
61, 17857,9043,274
60,981
57, 8306,3483,8255,1158,9848,978
23, 56317, 252
3,151
1,86132,0975,720
21, 303
1,32822, 03614,700
filledkindructs,equal
12, 6722,3163,7022,232
17, 2832,0586,3515,284
10,8591,7683,9621,084
24, 9746,0002,2863,0031,9164,2401,7271,258
9,6453, 662
11, 667
6,8159,675
14,0464,0685,852
25, 332
3,2506,030
10,216
39,96420, 34819, 616
40,926
21,5093,1191,4651,9743,3183,0006,1411,956
19,4175,347
14, 070
3,7848,5585,5434,2943,040
15, 707
1,6402,8084,159
61, 69758, 4383,259
61,391
58, 1485,7603,1855,1209,3139,178
23,90117, 732
3,243
1,95332,5875,701
21, 150
1,40622, 50314, 982
orders foied produchemicalto new c
12, 8122,3023,7472,317
17,3802, 0666,4155,277
11,1081,8564,0431,113
24, 9675,8812,2863,0381,9224,2581,6961,262
9,7663,702
11, 499
6,8639,566
14,2864,1245,908
25, 520
3,2216,044
10,432
42, 25921, 81820, 441
41,483
22, 1632,9081,2762,0133,3152,9956,8532,462
19, 3205,267
14, 053
3,7808,5505,7564,5043,118
15, 775
1,6103,4504,153
62, 75859, 4793,279
62, 699
59, 3855,4312,8095,1379,5479,376
24, 89118, 631
3,314
2,01733,4015,739
21, 542
1,44923. 53215, 152
• other nccts, tobas and allrders.
12,8862,3023,8082, 348
17, 5022,1146,4915,228
11, 1351, 8594,0121,130
25, 1195,8612,3283,1191,9194,2851,7181,273
9,7693,825
11, 525
6,8669,630
14,3764,1025,983
25,685
3,2336,091
10,492
43. 10422.64820. 456
41,843
22,4253,1481,4512,0503,3492,9836,9202,466
19,4185,307
14, 111
3,7788,6045.6894,5163,129
16, 127
1,6753,2764,249
63, 67660,3793,297
63,993
60,6645,3752,6535,2249,7699,453
25, 83819, 569
3,329
2,04633,9835,803
22, 161
1,50424,40715,369
ndurabl«ceo prodiied prodi
12, 9142,3363,8252,300
17, 7632,0976,5775,408
11, 1921,8284,0441,152
25, 3235,9932,2683,0851,9344, 3501,7371,306
9,8273,823
11, 673
6,8909,708
14, 6504,0926,011
25, 841
3,2546,270
10, 591
42, 09422, 10919, 985
42, 234
22, 3893,3921,6352,2133,3963,2015, 9721,608
19, 8455,454
14, 391
3, 8688,8065,4854,4133,296
16, 366
1,6952,5674,325
64, 12960, 7523,377
64, 821
61, 4455,4322,6065,298
10, 0149,692
25, 90319, 683
3,376
2,04834, 2845,845
22, 644
1,52624, 58715, 606
$ goods icicts, appicts, and
12, 9432,3883,8162,278
18,1092,1306,6995,465
11, 2721,8314,0861,187
25, 6916,0342,3713,1301,9654,3351,7561,279
9,9643,862
11,865
7,0219,844
14,8354,0326,054
26,229
3,2876,388
10, 701
41,53122,44819, 083
43, 868
23,4033,6841,8542,3353, 5323,2116,1651,724
20,4655,717
14, 748
4,1458,9555,8344,4483,604
16,882
1,8442,5284,583
64,89661, 5433,353
66,068
62, 5345,6462,7305,467
10,3049,830
25,99319, 781
3,534
2,12434,7326,041
23, 171
1,60124, 58716,000
dustriesarel andrubber
12, 9512,4233,8622,250
18, 2852,1796,7445,537
11, 3531,8364,0921,197
26, 0056,2432,3343,1191,9704,4091,7871,296
10, 0283,876
12, 101
7,16710, 03914,9663,9926,017
26, 413
3,3846,519
10,735
42, 37923,05219,327
43,986
23, 5783,6031,7762,1773, 4273,4626,5262,268
20, 4085,580
14, 828
4,1198,9816,1124,2983,452
17,024
1,8103, 4024,450
67,29363,8443,449
67,388
63,8035,7502,7655,513
10, 47510, 14726, 55720,397
3,585
2, 24135, 3606,063
23, 724
1,71225, 38316, 181
are zero,related pand plas
13,0042,4283,9012,261
18,4682,2246,7775,589
11,4121,8344,1071,197
26,1566,2302,3383,1691,9814,4601,8161,293
10,0723,87712,207
7,24710,03615,0544,0036,071
26,629
3, 4236,581
10,815
45,43424,57820,856
44,129
23,7413,9942,1412,2473,3173,3326,5742,092
20,3885,604
14,784
3,9378,9605,8334,3323,39917,668
1, 6763,0354,584
69,15665,5433,613
68,814
65,1106,1023,0635,55810,61310,35827,08220,846
3,704
2,21935,8036,099
24,693
1,67725,84116,575
IFoiroducts,>tics pro<
'12,988^•2,445r3,963' 2, 188
••18,807' 2, 255'6,843r 5, 802'11,478' 1, 853' 4, 138' 1, 196
26, 375'6,357'2,394' 3, 174'1,985'4,460'1,809'1,295
'10,153'3,893'12,329
'7,329' 10, 251'15,266'3,941' 6, 072'26,789
'3,475'6,824'10,848
'47,398'26, 099'21,299
'45,833
'24,888'4,057'2,104'2,411' 3, 529'3,489'6,873'2,395
'20,945' 5, 745
'15,200
' 4, 173' 9, 141'6,036' 4, 538' 3, 600'18,345
'1,819'3,375' 4, 587
'71,337'67,646' 3, 691
'70,527
'66,762'6,434' 3, 238
5,681'10,857'10,581'27, 712'21,566
'3,765
'2,254'36,275' 6, 211
'25,787
'1,680'26,578'16,785
these inpetroleulucts) sal
13, 1442,4874,0252,200
19, 1142, 2466,8896,062
11,4661,8584,1431,206
26,5496,4982,3903,1711,9974,4941,8151,293
10,2833,893
12, 373
7,38910, 38315, 5384,0046,081
26,878
3, 5107,055
10,927
46,44325,21021,233
45, 099
24, 1643,8832,0412,1953,5673,6256,5402,084
20,9355,653
15,282
4,1039,1296,3124,3433,391
17, 821
1,8123,2864,815
72,74068,9473,793
71,969
68,1806,5163,2735,723
11, 17510,90028,29321,985
3,789
2,24237, 1566,285
26,286
1,69327,21017,286
dustriesm and c(es are co
.......
1 23, 800
124,100i 4, 200
i 6, 500
i 2, 800i 4, 900
169,000
169,200i 7, 000
128,500
food and>al prod-nsidered
Digitized for FRASER http://fraser.stlouisfed.org/ Federal Reserve Bank of St. Louis

June 1966 SURVEY OF CUERENT BUSINESS S-7
Unless otherwise stated, statistics through 1964and descriptive notes are shown in the 1965edition of BUSINESS STATISTICS
1964 1965
Annual
1965
Apr. May June July Aug. Sept. Oct. Nov. Dec.
1966
Jan. Feb. Mar. Apr. May
GENERAL BUSINESS INDICATORS—Continued
BUSINESS INCORPORATIONS d"
New incorporations (50 States and Dist. Col.):Unadjusted numberSeasonally adjusted do
INDUSTRIAL AND COMMERCIALFAILURES d"
Failures, total _ _ number
Commercial service _ _ _ _ _ d oConstruction doManufacturing and mining doEetail trade _ _ doWholesale trade ___ . . do
Liabilities (current), total. _ _ thous. $
Commercial service doConstruction _ doManufacturing and mining _ doRetail trade doWholesale trade do
Failure annual rate (seasonally adjusted)No. per 10j,000 concerns
197,724
13, 501
1,2262,3882 2546,2411,392
1,329,223
182 527262, 392361, 864281 948240, 492
1 53 2
203, 897
13 514
1 2992,5132 0976 2501 355
1,321,666
248 523290 980350 324287 478144 361
i 53 3
17, 71216,504
1,179
99228183535134
83, 247
6 03919, 55426, 09020 06711 497
50 8
16, 54016,043
1 183
126204191549113
133, 113
48 80617 72932,97820 94412 656
54 1
17, 63516, 671
1,094
90205172510117
144, 607
54 20735 60122, 43522 35310 Oil
50 1
16, 79416, 369
1,074
82205157514116
121, 485
4 89153, 37231, 14521 35210 725
52 8
16, 11416, 957
1,131
114208176533100
135, 039
47 12724 08030,09719 70414 031
56 9
15, 96217, 138
1,100
124205172479120
104, 976
23 03919 00724, 88027 46310 587
59 7
15, 88916,744
1,047
11021214549090
82 066
10 38119 13917, 86227 8766 808
51 5
15, 13017,418
1,033
10320115547797
71, 722
7 63514 42022, 53920 6066 522
51 4
18, 18516, 999
1,090
119210156492113
97, 575
7,89522, 74124, 97228 79313, 174
54.2
19, 73117,677
1,084
101203160515105
103, 175
8 02113, 87723, 02942 21616,032
50.7
16, 58517, 868
946
103167139430107
95, 536
8, 59524,30618, 16335, 1659,307
44.1
20, 15617, 305
1,226
130209171601115
103,471
11 00516 63029, 92829 74916 159
50 2
17,29917,022
1,106
121206154509116
110, 141
20 76135, 02422, Oil22 4449,901
47 4
COMMODITY PRICES
PRICES RECEIVED AND PAID BYFARMERS
Prices received, all farm products! 1910-14= 100. _Crops? _ _ do
Commercial vegetables _ _ doCotton _ doFeed grains and hay _ _ doFood grains doFruit _ _ doTobacco _ do
Livestock and products 9 doDairy products doMeat animals _ doPoultry and eggs do
Prices paid:All commodities and services _ do
Fainily living items doProduction items. _ _ _ _ do
All commodities and services, interest, taxes, andwage rates (parity index) 1910-14=100
Parity ratio §_ do
CONSUMER PRICES
(17. S. Department of Labor Indexes)
Unadjusted indexes:All items 1957-59=100__
Special group indexes:All items less shelter __doAll items less food doCommodities do
Nondurables doDurables 9 do
New cars _ doUsed cars ._ _ do
Commodities less food doServices do
Services less rent- __ _ doFood 9 _ do
Meats, poultry, and fish doDairy products doFruits and vegetables do
Housing doShelter 9 do
Bent doHomeownership do
Fuel and utilities 9 doFuel oil and coal doGas and electricity _ _ d o _ _ _ _
Household furnishings and operation_do_I__Apparel and upkeep doTransportation _ do
Private- _ doPublic , do
Health and recreation 9 doMedical care __ doPersonal care doReading and recreation do
Seasonally adjusted indexes:*Food.. doApparel and upkeep doTransportation do
'237'239••247
262166190
r307490
'236256270142
282300270
31376
108.1
108.0108 9105 2106 0103 0101 2121 6104. 4115 2117 0106 498.6
104 7115.3107 2108 7107 8109.1107 3103 5107.9102.8105 7109.3107 9119 0113.6119 4109 2114.1
248232
r261245173164
r236r 513
261r261r 319
145
288306276
32177
109.9
109.6110 4106 4107 9102 699 0
120 8105.1117 8120 0108 8105.1105 0115.2108 5110 6108 9111.4107 2105 6107.8103.1106 8111 1109 7121 4115.6122 3109 9115.2
'244243287
r247180164241
r 500r245
248292144
287303276
32076
109.3
109.1110 1105 9107 0103 0100 7120 6105.0117 3119 3107 399.8
104 5117.6108 2110 1108 8110.8107 2105 4107.7103.1106 3111 0109 5121 3115.4121 6110 7115.9
251r247' 321r252
182162249499254
r241r 319r 137
290r 307r 277
32378
109.6
109.4110 3106 2107 5102.9100 2121 1105.2117 5119 5107 9100.3104 2121.4108 2110 2108 8110. 8107 1104 6107.7103.1106 8111 4110 0121 3115.6121 8111 0115.9
' 254'241r282'254
180r 157r228' 499r265r240r 342r 139
290307278
32379
110.1
110.0110 3106 9108 6102 697 4
122 7105.1117 6119 7110 1106. 4104 0125.9108 2110 3108 8111.0106 9103 4107.8103.1106 9111 2109 7121 3115.7122 2111 0115.7
'252'232'249
253177160
'197'501
269'249'343
142
290307278
32378
110.2
110.1110 2106 9108 7102 397 2
123 0104. 7117 8120 0110 9109.2104 3124. 3108 3110 6108 9111.2106 6103 2106.9102.9106 1111 5110 0121 4115.3122 7108 7114.6
'249'223'233
244171162
'231'517
272'258'341'147
289305277
32178
110.0
109.8110 2106 6108 5101.897 1
120 3104.7117 9120 0110 1109.8105 0114.6108 2110 7109 0111.4105 3103 5107.7102.9106 4111 0109 5121 5115.6122 8109 0114.3
'249'223'237
249171160
'248'528
271'270'333
150
288305277
32178
110.2
110.0110 6106 6108 6101.796 5
118 9104.9118 5120 7109 7109.8105 3108. 5108 6110 8109 1111.6107 4104 3107.9103. 1107 2111.0109 5121 6115.8122 8109 2114. 8
'249'221'252
248161164
r 234'528
273277
r 332'151
288305276
32277
110.4
110. 2110 9106 9108 7102.197 7
119 4105.3118.7121 0109 7108.9105 5108.5109 0111 2109 2112. 1107 7106 9107.9103.3107 8111 2109 7121 6116.2123 0109 2115.2
'249'219'259
245156167
'211'550'275'282
332r 155
289307276
32277
110.6
110.4111 2107 1108 9102.498 7
118 7105.6119.0121 3109 7108.5105 8109.9109 2111 5109 3112.5107 9107 2108.0103.3108.1111. 5110 1121.6116.4123.4109 6115.4
259
'224259236166170'231'549
'290'281'357164
291309278
324
80
111.0
110.8111.3
107.4109.4102.498.7118.2
105.7119.3121.6
110.6110.1106.1111.0
109.4111.8109.5112.9
108.1108.6108.0103.6
108.1111.6110.1122.0
116.6123.7110. 0115.4
110.8107.6111.3
'226'287225171171'225540
293'277369160
293309281
327
a 111. 0
110.8111.1107.4109.6101.997.4114.8105.3119.5121.8111.4112.9106.6111.3109.2112.0109.7113.1106.4108.9107.9103.6107.3111.2109.6122.0116.9124.2110.4115.7
111. 6107.8110.8
'270'232'312
224174173
'232'545'303'277
384170
295312282
111.6
111.4111.3108.0110.6101.897.2
114.0105.4119.7122.0113.1115.7107. 0116.5109.4112.1109.8113.3106.5109.0108.2103.8107.6111.1109.6122.0117.1124.5110.8115.9
113.1108.0111.4
'269'231'291236170171'234'545303277380174
297314284
331'81
112. 0
111.9111.6108.4111.1102.097.1115.4105.6120.1122. 5113.9116.9108.1117.4109.6112.3109.9113.5106.6108.9108.2104.0108. 2111.4109.9122.1117.6125.3111.0116.6
114.2108.5111.8
'265'236'313
240172168
'243'547
291272365161
296314
333
112.5
112.4112.2108.8111.4102.397.4
117.4106.0121.1123.6114.0115.6108.9119.8110.3113.0110.1114.3108.3108.5108.3104.4108.7112.0110.5122.1118.1125.8111.6116.8
114.3108.8112.3
263239290240175174262546284266361150
296315
79
' Revised. 1 Based on unadjusted data.2 Beginning with indexes for Jan. 1966, data for six additional areas (Cincinnati, Houston,
Kansas City, Milwaukee, Minneapolis-St. Paul, and San Diego) have been incorporatedinto the national CPI. These areas were "linked" into the CPI as of Dec. 1965 and werefirst used in calculating the Dec. 1965-Jan. 1966 price change.
d"Compiled by Dun & Bradstreet, Inc. (failures data are for 48 States and Dist. Col.).
^Revisions for Jan. 1963-Mar. 1965 are available upon request.§ Ratio of prices received to prices paid (parity index). 9Includes data for items not
shown separately. * New series. Beginning with indexes for Jan. 1966, seasonally adjustedindexes for selected groups and subgroups of the CPI were published by the Dept. of Labor.Additional information and a description of the BLS Seasonal Factor Method are availablefrom the Bureau of Labor Statistics, U.S. Dept. of Labor, Washington, D.C. 20210.
Digitized for FRASER http://fraser.stlouisfed.org/ Federal Reserve Bank of St. Louis

S-8 SURVEY OF CURRENT BUSINESS June 1966
Unless otherwise stated, statistics through 1964and descriptive notes are shown in the 1965edition of BUSINESS STATISTICS
1964 1965
Annual
1965
Apr. May June July Aug. Sept. Oct. Nov. Dec.
1966
Jan. Feb. Mar. Apr. May
COMMODITY PRICES— Continued
WHOLESALE PRICES^1
( 17. S. Department of Labor Indexes)
Spot market prices, basic commodities:22 Commodities 1957-59=100
9 Foodstuffs _ .. --. do13 Raw industrials _ _ d o _ _ _
Al l commodities _ _ _ _ _ _ _ _ _ _ do
By stage of processing:Crude materials for further processing— _ _ doIntermediate materials, supplies, etc doFinished goods O do
By durability of product:Durable goods. _ _ _ _ _ _ _ _ _ _ d o _ _Nondurable goods doTotal manufactures _ do
Durable manufactures _ _ _ _ doNondurable manufactures _ do_ __
Farm products and processed foods do
Farm products 9 doFruits and vegetables, fresh and dried-doGrains. _ _ _ _ _ _ _ _ _ _ d o _Livestock and live poultry do
Foods, processed 9- - - - - _ doCereal and bakery products doDairy products and ice cream _ __ _ doFruits and vegetables, canned, frozen, .doMeats, poultry, and fish do
Commod. other than farm prod, and foods. _do
Chemicals and allied products 9 - -doChemicals, industrial doDrugs and Pharmaceuticals doFats and oils, inedible doFertilizer materials.. doPrepared paint ._ _ _ _ do
Fuels and related prod., and power 9 _ doCoal... _ _ _ _ _ _ _ _ _ doElectric power. Jan. 1958=100.Gas fuels doPetroleum products, refined 1957-59=100__
Furniture, other household durables 9 d o _ _ _ _Appliances, household doFurniture, household _ _ _ _ _ _ _doRadio receivers arid phonographs. _ _ _doTelevision receivers do
Hides, skins, and leather products 9 _ _ . _ _ d oFootwear _ _ _ _ _ _ _ _ d oHides and skins doLeather do
Lumber and wood products..- _ __ doLumber do
Machinery and motive prod. 9 doAgricultural machinery and equip _ _ _ _ _ d oConstruction machinery and equip d o _ _ _ _Electrical machinery and equip. __doMotor vehicles. _ _ _ _ d o
Metals and metal products 9 — _ _do_Heating equipment doIron and steel _ _ _ _ _ _ do_Nonferrous metals _ _ . _ do
N onmetallic mineral products 9 — . doClay products, structural _ doConcrete products doGypsum products ... do
Pulp, paper, and allied products doPaper do
Rubber and products doTires and tubes . ' do
Textile products and apparel 9 _ doApparel.. _ _ _ _ _ _ d oCotton products. _ _ _ _ ... _ _ _ d o _Manmade fiber textile products doSilk products _ _ _ _ _ _ _ _ d oWool products. do
Tobacco prod, and bottled beverages 9 ... doBeverages, alcoholic. _ _ _ doCigarettes _ _ _ __ _ do _ _
Miscellaneous doToys, sporting goods. do
PURCHASING POWER OF THE DOLLAR
As measured by-Wholesale prices 1957-59=$!. 00__Consumer prices. _ _ do
1 97. 7!88.8
1 104. 6
100. 5
94.1100. 9101.8
102. 499. 1
101. 1102. 599.7
98. 0
94. 3103. 294.184.7
101.0107.8107.8104.890.8
101. 2
96.794.295.096.8
100. 1104.7
97.196.9
101. 1121. 392.7
98.591.3
105.381.590.9
104. 6108.587.5
102.9100.6100.7
102. 9112.9112. 496.8
100.5
102.892. 0
100.5105.9
101.5104.2100.9108.299.0
103.692. 589.0
101.2102.899.695.8
117.3103. 0
107.4100.7105.6109.2101.0
$0.995.925
* 104. 7191.9
1 114. 6
102.5
98.9102.2103.6
103.7"101.5102.8103.7101.9
102.1
98.4101.889.698.9
105. 1109.0108.5102.1101.0
102. 5
97.495.094.4
112.7103.5105.4
98.996.5
100.8124.195.9
98.089.2
106.280.288.5
109.2110. 7111.2108.1101. 1101. 9
103.7115.1115.396.8
100. 7
105.791.7
101.4115.2
101.7105. 1101.5104.099.9
104. 192.990.0
101.8103.7100.295.0
134. 3104.3
107. 7100.8105.8111.0102. 7
$0. 976.910
105.390.6
116. 7
101.7
96.9101.8102.8
103.4100.4102. 1103.4100. 7
100.2
97.6117.791.291.4
102.3108.3107. 5100. 993.6
102.1
97.694.894.8
121.2104.3104.4
97. 694.6
100.8122.594.1
98.089.4
106.081.188.9
106.3109.796.3
103.6100. 5101.0
103.7114.6115.097.0
100.8
105.291.9
101.4113.4
101.9104.9101.3108. 199.8
103.992.388.5
101.5103.199.796.1
134.5103. 1
107. 8100. 7106.5110.3102. 4
$0. 983.915
105.290.3
116.9
102. 1
98.3101. 9103. 2
103.6100.8102.4103. 6101.1
101.1
98.4118.591.096.2
103.3108.3106. 8100.497.7
102.3
97.694.895.0
116.7104.3105.7
98.494.6
100. 8122.295.4
98.089.2
106.081.188.9
107.4109.7105.9104.2100.4101.0
103.7114.7115.197.1
100.8
105. 791.6
101.5115.2
101.9104.9101.3108.1100.0104.092.989.7
101.6103.299.996.0
135.1103.8
108.1100.8107.3108.9102.5
$0. 979.912
104.290.1
115. 3
102.8
100.6102. 2103.9
103.7102. 0103.0103.7102.3
103.5
100. 3109.0
89.6104.6
106.1108. 5107.1101.5105. 5
102.5
97.494.893.9
114.0104.3105. 7
98.794.7
100. 8122.796.0
98.089.4
105.981.188.9
107.7109.8103.1107.6100.3101.1
103.8114.7115.296.9
100.7
105.992.0
101.3116.2
102.0104.9101.6107. 5100.0104. 193.190.2
101.9103.6100.295.9
132.2104.0
107.6100.7105.6111.0102.5
$0. 973.908
103.389.0
114.6
102.9
100.5102.3104.0
103.7102.2103. 1103. 7102. 5
103.7
100. 0103.9
88.4105.0
106.6109.3107.8101.8106.3
102.5
97.495.094.0
110.3103.3105.7
98.795.2
100.7122.596.0
97.889.2
105.979.687.8
108.8110.0117.4105. 9100.5101.2
103.7114.9115.397.0
100.7
105.891.7
101.5115. 5
101.9105.3101.7105.799.9
104.193.090.2
101.9103. 8100.395.7
127.6104.4
107.6100.7105.6112.6102.9
$0. 972.907
104.791.2
115. 2
102.9
100.8102.4103.8
103.9102.0103.2103.9102.4
103.3
99.185.588.3
106.4
106.7108.8108.5100.4106.3
102.7
97.195. 093.9
104.4102.1105.7
99.095.8
100.8123.996. 4
97.788.6
106.179.088.0
112.2110.2133.4112.5101.8102.5
103.8114. 8115. 696.7
100. 7
106. 291.9
101.4116.5
101.6105.3101. 5100.699.9
104.193.291.1
101.9104.1100.494.7
132.8105.0
107.6100.7105.6111.5102.7
$0. 972.909
105.493.2
114.8
103.0
100.0102.5104.1
103.9102.2103.2103.9102.5
103.5
99.596.189.3
102.6
106.7109.1109.1101. 8105.3
102.7
97.295.093.9
108.4102.5105.7
99.296.6
100.8125.396.4
97.788.6
106.279.088.0
111.3110.3124.9110.9102.0103.1
103. 8115.0115.696.6
100.5
106.291.9
101. 2117.0
101.6105.4101.699.9
100. 0104.193.391.1
102. 1104.2100. 694.2
134.9105.2
107. 7100.9105. 6111.5103.2
$0. 971.907
105.693.4
115.0
103. 1
100.1102.6104.3
104.0102.4103.4104.0102.7
103. 6
99.495.688.6
103.2
106.9109.4109. 4104.7104.9
102. 8
97.695.494.1
110.1103. 4105.9
99.497.3
100.8125.896.6
97.888.6
106. 479.287.9
113.3113.6125.6111.9101. 6103.0
103.9114.9115. 896.6
100.5
106.391.9
101.2117.4
101.6105.4101.699.1
100.5104.593. 491.1
102.0104. 3100.893. 3
140.3105.4
107.7100.9105.6111.2103.1
$0. 970.906
106.193.9
115.5
103.5
100.8103.0104.7
104.2102. 9103.7104.2103.2
104.3
100.394.287.4
104.0
107.6110.6110.4105.4105.5
103.2
97.595.594.7
106.7103.8105.9
100.397.5
100.8126.898.1
98.088.6
106.679.287.9
113.6113.7126.5113.3101.6103.0
104.1116. 8116.496.5
100.5
106.791.6
101.3118.7
101.6105. 4101.898.6
100.8104.893.5
.91.1
101.9104.2101.092.5
142.2105.4
107.7100.9105.6113.2103.0
$0. 966.904
108.997.9
117.1
104.1
103.2103.0105. 3
104.2103.9104.1104.2103.8
106.5
103.092.290.1
109.0
109.4111.2111.3105.1110.5
103.2
97.695.594.6
110. 11C3.8105.9
100.697.6
100.7128.698.4
98.288.8
106. 779.287.9
114.6113.8132.3114.2101.9103.4
1C4.2117.0116. 596.6
100.5
106.691.6
101.7117.2
101. 6105.6101.897.4
100. 9104. 993.591.1
102. 0104.3101. 291.9
143.6105. 4
107.9101.3105.6112.5103.1
$0. 961.901
112.0100.7120.5
104.6
105.2103.4105. 6
104.6104. 5104.4104.5104.3
107.7
104.597.592.4
112. 6
110. 3111. 8110.9104.7112. 7
103.5
97.695.194.4
113. 1103.8105.9
100.598.1
100.4128.298.3
98.3'89.0107.0
78.487.9
116.0114. 4140.0116.6102.8104.3
104.4117.3116.997.0
100.5
107. 091.5
102.0118.3
102.0105.6102.0101. 4101.2105.293.791. 1
101.9104.6101.091.3
147.6105.9
108.1101.1105.6114. 3103. 2
$0. 956.901
113. 8101.9122.9
105.4
107.5103.8106.3
104.9105.5104.9104.8104.8
109.8
107.498.092.9
116.7
111.8. 112.1
112.7105.5114.9
103.8
97.695.294.5
110.0104.7105.9
100.398.2
100.4128.997.8
98.489.0
107.278.587.7
117.8114.9152.8118.0103.7105.6
104.7117.8117.597.8
100.4
107.591.7
102.2119.5
102. 1105.8102.1101.4101.3105.494.191.1
102.0104.7101.591.0
155.3105.8
108.0101.0105.6116.0103.3
$0.949.896
113.6100.7123.5
105.4
106.9103.9106.4
105.3105.3105.0105.1104.7
109.4
106.8101.390.8
114.2
111.5112.2
' 115. 0' 104. 8
113.3
104.0
97.695.294.4
106.4104.7105.9
99.997.5
100.4128.2
97.2
98.489.1
107.278.487.2
118.7115.3147.8123.3105.6107.4
105.0118.0117.998.2
100.3
108.091.8
102. 3120.8
102.1105.9102.2101. 4101.8105.494.391. 1
102. 1104.7101.890.8
151. 4106.0
109.2101. 0109.5113.1103.3
$0. 949.893
112.5100.8121. 5
105.5
106. 4104.3106.3
105.7105.1105.1105.6104.6
108.7
106. 4' 110. 3
91.2112. 4
' 110. 6112.6
' 114. 8' 104. 8'110.9
104.3
'97.695.6
'94.1' 104. 0
105.5' 106. 2
100.0'94.9100.3
' 129. 297.7
'98.6'89.3
' 108. 378.4
'86.8
' 120. 8' 118. 6
148.8122.4108.4
' 110. 9
105. 2118. 1
' 118. 5' 98. 4
' 100. 2
' 108. 292.1
102.0'122.1
'102.3106.0102. 7101.4102.3
' 106. 095.494.4
102. 2' 104. 7
102. 390.5
151.6106.3
109.4101.0110.0113.0
'103.7
$0.948.889
110.7100.4118.3
105.5
104.5104.8106.2
106.1105.0105.5106.0104.8
107.8
104.5102.793.6
110. 4
110.5113.0114.9105.4110. 9
104.7
97.795.894.1
102.5106.6106.2
100. 596.9
100.2128.398.4
98.989.4
108.878.486.8
122.8119.2163. 0125.1109.7113.1
105.7118.1118.798.6
101.0
108.492.1
101.8122.6
102.4106.3102.7102.2102. 6107.195.494.4
102. 2104. 8102.689.9
140.9106.5
109.4101.0110.0115.1103.7
$0. 948
' Revised. * Preliminary l Annual averages computed by OBE.cf For actual wholesale prices of individual commodities, see respective commodities.
O Goods to users, including raw foods and fuels. 9 Includes data not shown separately.
Digitized for FRASER http://fraser.stlouisfed.org/ Federal Reserve Bank of St. Louis

June 1966 SURVEY OF CURRENT BUSINESS S-9
Unless otherwise stated, statistics through 1964and descriptive notes are shown in the 1965edition of BUSINESS STATISTICS
1964 1965
Annual
1965
Apr. May June July Aug. Sept. Oct. Nov. Dec.
1966
Jan. Feb. Mar. Apr. May
CONSTRUCTION AND REAL ESTATE
CONSTRUCTION PUT IN PLACE f
New construction (unadjusted), total _mil. $__
Private, total 9 doResidential (nonf arm) _.. do
New housing units do. __Nonresidential buildings, except farm and pub-
lic utilities total 9 mil $Industrial . _ _ _ d o _ __Commercial— ..__ _ _ _do_ __
Farm construction doPublic utilities . do. _
Public, total 9 do
Buildings (excluding military) _doResidential _ do
Military facilities _ _doHighways and streets. do
New construction (seasonally adjusted at annualrates), total mil. $
Private, total 9 _ do. __
Residential (nonfarm) doNonresidential buildings, except farm and pub-
lic utilities, total 9 mil. $Industrial doCommercial _ _ ^ do.
Farm construction _ _ _. doPublic utilities do
Public, total 9 . „_ do
Buildings (excluding military) doResidential _ _ _ do.
Military facilities .doHighways and streets do
CONSTRUCTION CONTRACTS
Construction contracts in 48 States (F. W. DodgeCo.):
Valuation, total mil. $
Index (mo. data seas, adj.) 1957-59=100__
Public ownership mil $Private ownership __ _ _ do_ _By type of building:
NonresidentiaL _ doResidential _. _ do
Non-building construction. _ ._ _. _ doNew construction:
Advance planning (ENR) § doConcrete pavement awards:
Total thous. sq. ydsAirports doRoads _ doStreets and alleys _ _ _ _ _ _ . _ doMiscellaneous do
HOUSING STARTS AND PERMITS
New housing units started:Unadjusted:
Total, incl. farm (private and public) thous _ _One-family structures- _ _ do_
Privately owned do
Total nonfarm (private and public) _. doIn metropolitan areas. _ __ __ do__
Privately owned. _ do
Seasonally adjusted at annual rates:Total, including farm (private only) doTotal nonfarm (private only) _ do
New private housing units authorized by bldg. per-mits (12,000 permit-issuing places) :
Seasonally adjusted at annual rates:Total thous_.
One-family structures _ _ _ do-
CONSTRUCTION COST INDEXES
Dept. of Commerce composite 1957-59=100--American Appraisal Co., The:
Average, 30 cities 1913—100Atlanta doNew York doSan Francisco doSt. Louis do
Associated General Contractors (building only)1957-59=100-
66,221
45, 91426, 50720, 612
12 9983,5725, 4061, 2214,850
20, 307
7,052474968
7,144
2 47, 299
31372 15 3712 31, 9282 15, 4952 20, 5612 11, 244
44, 405
123 7685 352
89, 87225, 5782,967
1, 590. 7973.0
1, 557. 4
1, 563. 71, 117. 71, 530. 4
1,286720
112
802878888792785
119
' 71, 903
49, 99926, 68920, 765
16 5215, 0866,7041 1955,178
' 21, 904
' 7, 684'464
883r 7, 539
49, 831
144
16 33033, 501
17, 47021, 46110, 900
45, 625
125, 5804,410
86, 77929, 0165,376
1, 542. 7963.5
1, 505. 0
1, 520. 41, 067. 51, 482. 7
1,242709
116
824904925814808
123
5,634
3,9482,1341,559
1 28237652092
409
1,686
6123066
553
71 411
49, 717
26, 675
16 2204, 7756,7091,2095,181
21, 694
7,351393888
7 559
4 770
152
1 5393,231
1,5462,1391,086
3,322
154. 9100.2152.2
152.8102. 5150.1
1 5521,532
1,187677
114
815901917804803
121
6, 197
4 3192,3711,728
1 38244053495
435
1 878
6583277
645
71 973
50, 132
27 070
16 3905 4166,0911, 2015 034
21, 841
7,536395887
7 512
4 864
145
1 5173,348
I 7752,0741, 015
2,962
162.1102.3157.5
159.8110. 4155.2
1 5161,501
1,240722
114
818901917804810
122
6,768
4 6472,6301,935
1 423440560102456
2,121
7084083
778
71 756
50, 317
27 224
16 3005 4266,1991,1965 187
21, 439
7,315451834
7 523
4 625
139
1 5533,072
1 5512,- 080
993
4,174
34 4551 601
22, 4218,9911,443
162.399.9
155 5
159.7114.3152.8
1,5661,539
1, 254703
116
820901917804809
123
6,768
4 5872,5912,019
1 397422548109454
2,181
6964478
880
70 358
49, 122
26 983
15 4064 9075 8821,1885 185
'21, 236
7, 382471980
7,499
4 795
149
1 7503,045
1 6911,9521, 151
3 215
143.994. 1
141 3
141.695.1
139.0
1,4731,447
1,243704
116
825907917804809
124
6,806
4 6232,5272, 009
1 488438615112465
2,183
7034586
851
70 863
49 222
26 621
15 9494 9736 2391,1865 142
21, 641
7, 609472910
7 494
4 265
139
1 3132 952
1 5071,971
788
3 714
138.088.5
134 7
136.294.8
132.8
1 4271,409
1,217692
116
827908917804809
124
'6,789
4 6072,4501,955
1 549478646107465
r 2 182
'722'48
91'825
'72 830
50, 167
26, 413
16 9845, 321
, 6, 9771,1865, 208
'22,663
' 8, 187' 505
1,025' 7, 689
4 153
147
1 3322,821
1, 4641, 756
934
3,915
33 048857
20, 6929,5491,950
125.980.0
124.3
124.387.8
122.7
1,4531,436
1,180677
117
829908939834809
124
' 6, 754
4 6062,3701, 897
1 605478678104487
' 2 148
'728' 50
82'799
'72 687
50, 084
26, 343
16 9235, 0687,0561, 1855,196
'22,603
' 8, 311' 522
832' 7, 734
4,356
147
1 2943,061
1,5821,897
877
3,895
135.787.2
133 6
133.094.8
130.9
1 4111,380
1,259741
117
834909940834805
124
' 6, 486
4 5302 2831,836
1 60550068299
500
' 1, 956
'687'46
88'666
'74 039
51, 209
26 243
17 8395 2917 7061,1835 429
'22, 830
' 8, 382'525
967'7,398
3, 745
141
1,1632,582
1,3281,696
721
4,618
118.371.4
116. 1
117. 178.8
114.9
1,5471,531
1,282736
117
835909940834815
124
'6,010
4 3812 1381,723
1 63557564095
466
' 1, 629
'637'42
63'468
'76 046
53, 445
26 684
19 5516, 2508, 0171,1825,412
'22,601
' 8, 196'522
760' 7, 559
3,698
153
1,3042,395
1,4331,446
819
5,707
29, 1471,329
20, 8315, 6391, 347
103.259.9
102 3
101. 675.9
100.8
1,7691,735
1,325735
118
837909941837817
124
' 5, 065
3,6511, 8431,483
1 30244251092
367
'1 414
' 588' 38
54'362
'76 055
53,285
27,460
18 8125 9877,8461,1855 220
'22,770
'8 404' 524
733' 7 507
3 374
149
1 1252,249
1, 1771,290
906
3,384
87.348.284 6
86.361.583.7
1 6111,585
1, 262709
118
840913945839821
124
4,650
3,3891,6271,315
1 26645345191
354
1,261
5563752
277
77 017
54, 290
27, 463
19 3886, 6297,2941,1905 512
22, 727
8,357529823
7 457
3 270
144
1 0662,204
1,2591,299
712
3,942
'81.0'46.8r 78 2
' 79. 5'55.4'76.7
' 1, 374' 1, 349
1,191659
118
843916946840822
124
' 5, 418r 3, 861' 1, 873'1,443
' 1 452'511'530
92395
' 1, 557
'6183869
436
'78 140
'55,066
'27 279
'20 495'7 073' 7, 672
1,194' 5 409
'23,074
' 8 355530
1,0097 409
4 737
158
1 4633 274
1 7262,0041,007
4,608
25 684513
21, 2983,161
711
' 130. 980.8
•r 126 3
'128.790.9
' 124. 1
' 1 569' 1 538
' 1, 293'760
118
845917949841830
124
'5,986
'4 228'2 192' 1, 621
1 46550453891
'431
' 1 758
'67841
(i)538
'75 839
'53,342
'27 447
18 5576 4006 9421, 197
' 5 458
'22, 497
'8 148535
(i)7 360
5 098
161
1 5743,524
1 8832, 0811, 134
3,686
' 148. 897.2
' 146 7
' 146. 6105.5
'144.5
' 1 499' 1, 478
' 1, 169'641
'119
854926954852836
125
6,560
4 6112 4321,799
(i)(i)(i)
96474
1 949
72043
(i)628
76 234
53 584
27 820
(i)0)0)
1 2015 474
22 650
8 383535
(i)7 309
3,578
137.8
133 9
134.5
130. 6
1,3061,275
1,091601
119
126
' Revised. l Not yet available; estimate included in total. 2 Annual total includesrevisions not distributed to months. 3 Computed from cumulative valuation total,
f Revised series. Monthly data for 1962-64 appear on p. 40 of the May 1966 SURVEY.
9 Includes data not shown separately.§Data for Apr., June, Sept., and Dec. 1965 and Mar. 1966 are for 5 weeks; other months,
4 weeks.
217-518 O-66-5
Digitized for FRASER http://fraser.stlouisfed.org/ Federal Reserve Bank of St. Louis

S-10 SURVEY OF CURRENT BUSINESS June 1966
Unless otherwise stated, statistics through 1964and descriptive notes are shown in the 1965edition of BUSINESS STATISTICS
1964 1965
Annual
1965
Apr. May June July Aug. Sept. Oct. Nov. Dec.
1966
Jan. Feb. Mar. Apr. May
CONSTRUCTION AND REAL ESTATE—Continued
CONSTRUCTION COST INDEXES— Con.
E. H. Boeckh and Associates: fAver age, 20 cities:
All tvpes combined . 1957-59=100Apartments, hotels, office buildings. _doCommercial and factory buildings doResidences do
Engineering News-Record:Building doConstruction do
Bu. of Public Roads— Highway construction:Composite (avg for year or qtr.) 1957-59—100
CONSTRUCTION MATERIALS
Output index:Composite, unadjusted 9 1947-49—100
Seasonally adjusted do
Iron and steel products, unadjusted doLumber and wood products, unadj doPortland cement unadjusted do
REAL ESTATE
Mortgage applications for new home construction:Applications for FHA commitments
thous. units. .Seasonally adjusted annual rates J_ .do
Requests for VA appraisals doSeasonally adjusted annual rates J do
Home mortgages insured or guaranteed by-Fed Hous. Adm.: Face amount mil. $Vet Adm * Face amount! do
Federal Home Loan Banks, outstanding advancesto member institutions end of period mil $
New mortgage loans of all savings and loan associa-tions, estimated total mil. $
By purpose of loan:Home construction doHome purchase doAll other purposes do
New nonfarm mortgages recorded ($20,000 andunder) estimated total mil $
Nonfarm foreclosures number
Fire losses Con bld^s contents etc ) mil $
113.4114. 6113.4111. 6
116.1123. 2
102.0
152. 6
154.2151.9183 2
182.1
113.6
6, 573. 222 852 21
5 325
24, 505
6 51510, 3977 593
36 921108 620
1 367 13
117. 2118.5117.2115.2
118.9127. 8
105.7
157.1
161 1157.5186 2
188.9
102.1
7, 464. 592 652.23
5 997
23, 847
5 92110, 6967 230
116 664
1 455 63
115.6117.0115.5113.7
117.8X26.0
162.7160.0
183.4159.1179 4
18.71879.5100
541. 38178 87
5 219
2,068
558850660
10 259
128 48
116.1117.5116 1114.1
117.8126.0
159 6148.9
165 9155.5207 3
16.6180
10.4113
515. 58182 49
5 227
2,022
526861635
9 578
116 92
117.2118.4117 3115.0
118.8127.6
106 9
171 2160.3
170.0161.9233 2
15.71549.7100
610. 77217 36
5 586
2,399
6141,099
686
10 248
119 54
118.0119.2118.1116.0
119.1128.6
159 5165.6
163 6149 1236 2
15.11658.695
646. 67217 21
5 793
2,186
5201,063
603
9 753
lqO 5°
118.2119.4118.3116.1
119.5129.5
176.7160.8
187 5167 5246 7
17.31868.995
757. 29244 70
5 770
2,187
5111,099
577
9 521
111 78
118.4119.7118. 5116.4
120.1129.8
106.7
171.0164.1
161 6173 8224 5
16. 61898.497
755. 77254. 42
5 802
2,079
4901,015
574
9 806
11 5 44
118.8120.0118 8117.0
120.4129.8
165 9146.8
159.8166 3235 8
15.11927.2
94
714.36245 00
5 826
1,961
487910564
9 577
108 72
118.9120.1118 9117.0
120.2129.7
150.0157. 2
143 6159.5188 1
14.52226.8100
706. 02242. 64
5 724
1,825
431834560
9 642
112 28
119.5120.7119.5117.6
120.4130.0
106.6
144.9168.8
148.0156.6150 2
13.32196.7105
698. 25227. 87
5 997
1,996
491865640
10, 421
124 04
119.7121.1119.8117.1
120.5130.0
134. 8144.4
136.4' 148. 0
103.6
13.62145.989
727. 41236. 31
5, 898
1,549
322640587
9,375
120 40
119.5120.6119.5117.6
121.7131.2
137.1155.5
' 144. 0151.4101.6
13.81795.4
72
511. 89189. 76
5,739
1,554
307645602
9,211
131 10
119 8120.8119 8118 0
122.0131.4
109 0
178.0172.2
17.71609.192
607.09163. 04
5 687
' 1, 998
'454'814'730
10, 179
133 36
120.3121.4120.3118. 7
123.1132.4
16.0168
10.1111
515. 71131.82
6,516
1,891
429802660
123 59
1 123. 71 133. 4
12.81339.498
497. 79
DOMESTIC TRADE
ADVERTISING
Printers' Ink advertising index, seas, adj.:Combined index 1957-59—100
Business papers doM^agazines do
Outdoor doRadio (network) doTelevision (network) do
Television advertising:Network (major national networks) :
Net time costs total HP! $Automotive incl accessories doDrugs and toiletries doFoods soft drinks, confectionery doSoap*3 cleansers etc doSmoking materials doAll other do
Spot (natl. and regional, cooperating stations):Gross time costs total mil $
Automotive, incl. accessories. ... doDrugs and toiletries doFoods, soft drinks, confectionery doSoaps, cleansers, etc... doSmoking materials doAll other do
Magazine advertising (general and natl. farm maga-zines) :
Cost total mil $Apparel and accessories doAutomotive, incl. accessories. doBuilding materials doDrugs and toiletries doFoods, soft drinks, confectionery do
Beer, wine, liquors doHousehold equip., supplies, furnish ings.. d o _ _ _ _Industrial materials. __ __ _ __ _do _Soaps, cleansers, etc doSmoking materials doAll other _ ._ __ _ do
12511213610389
103157
1, 145. 996.5
360.6209.5103.2146.8229.2
1, 016. 038.5
192.9352.798.550.2
283.2
996.861.8
110.727.1
108.9134.8
58.371.748.416.038.3
320.9
13612214710992
108175
1, 260. 399.1
409.2234.8112. 0145.4259.8
1, 075. 538.9
207.4377.7100.448.7
302.4
1, 076. 964. 8
111.730.4
115.9133. 9
69.371.550.521.741.6
365.6
« '130114
82
« '170
103.48.6
11.93.79.7
11.3
6.17.74.62.83.4
33.5
'135126
'145'104
108'119
103.76.6
11.03.79.4
11.6
5.99.24.92.7.3.635.2
'135114
'145'110
99'112'178
279.217 388.756 627 931 057 7
273.69 5
48 197.725 913.479.1
86.62.49.03.19.8
12.7
6.06.14.21.44.3
27.5
'13512215110877
'101'173
68.7.9
5.92.48.39.4
4.63.83.91.73.3
24.3
'141129
'160'108
91'89
'178
65.36.64.41.78.08.5
3.23.43.11.63.5.
21.3
'138126
'145'113
78'118'183
269.216 391.052.026.829 353 8
248 310 151 182.726 410.567.5
90.010.13.63.0
10.19.3
5.26.05.01.63.4
32.7
13812614711297
126174
120.58.0
16.93.2
12.013.1
7.38.56.52.23.9
38.8
143131151112108110187
117.85.9
15.22.2
12.314. 3
9.29.15.71.73.7
38.6
142121159111109102182
401.544.4
123. 967 328.646.790.6
303 910 656. 4
107. 125 811.592.5
91.53.97.21.2
11.911.1
11.35.43.9.9
3.431.3
14413115611596
125184
64.61.78.81.66.67.7
2.43.02.91.12.2
26.7
83.14.0
11.22.39.1
10.7
3.83.63.31.52.6
31.0
354.524.0
116.372.230.341.170.6
290.212.957.0
107.826.312.773.6
101.96.8
11.53.4
10.812.2
5.27.64.01.42.5
36.4
112.49.2
12.54.7
11.110.9
6.08.94.21.73.0
40.2
' Revised. 1 Index as of June 1, 1966: Building, 124.5; construction, 135.4.? Copyrighted data; see last paragraph of headnote, p. S-l.0 Revisions for Jan.-Mar. 1965 are as follows (unit as above): Combined index, 130; 131;
135; magazines, 136; 143; 145; newspapers, 112; 107; 110; radio, 96; 98; 108; television, 169; 164; 171.
9 Includes data for items not shown separately.t Revised seasonally adjusted data for 1958-64 will be shown later.§ Data include guaranteed direct loans sold.
Digitized for FRASER http://fraser.stlouisfed.org/ Federal Reserve Bank of St. Louis

June 1966 SURVEY OF CURRENT BUSINESS S-ll
Unless otherwise stated, statistics through 1964and descriptive notes are shown in the 1965edition of BUSINESS STATISTICS
1964 1965
Annual
1965
Apr. May June July Aug. Sept. Oct. Nov. Dec.
1966
Jan. Feb. Mar. Apr. May
. DOMESTIC TRADE—Continued
ADVERTISING— Continued
Newspaper advertising linage (52 cities) :Total _ ___mil. lines__
Classified doDisplay, total _ _ _ ._ .do
Automotive doFinancial - _» - do _General __ •__ __doRetail do
RETAIL TRADE
All retail stores: fEstimated sales (unadj.), total t mil. $
Durable goods stores 9 -- - doAutomotive group d o _ _ _ _
Passenger car, other auto, dealers doTire, battery, accessory dealers _ do__
Furniture and appliance group 9 doFurniture, homefurnishings stores, -do _Household appliance, TV, radio. _ _ _ _ d o
Lumber, building, hardware group. doLumber, bldg. materials dealers cf____doHardware stores do
Nondurable goods stores 9 __doApparel group do
Men's and boys' wear stores . _ doWomen's apparel, accessory stores _doFamily and other apparel stores doShoe stores do
Drug and proprietary stores _._doEating and drinking places .. _ d o _ _ _ _Food group .. __do
Grocery stores doGasoline service stations _ do__
General merchandise group 9 doDepartment stores do _Mail order houses (dept store mdse) doVariety stores do
Liquor stores _ _ _. do
Estimated sales (seas, adj.), total f do.
Durable goods stores 9 doAutomotive group _ do_ _
Passenger car, other auto, dealers doTire, battery, accessory dealers do
Furniture and appliance group 9 doFurniture, homefurnishings stores do __Household appliance, TV, radio do
Lumber, building, hardware group doLumber, bldg. materials dealers cf doHardware stores _ do__ _
Nondurable goods stores 9 — - ..do
Men's and boys' wear stores do_Women's apparel accessory stores doFamily and other apparel stores doShoe stores do_ _
Drug and proprietary stores doEating and drinking places doFood group do
Grocery stores doGasoline service stations do
General merchandise group 9 doDepartment stores doMail order houses (dept. store mdse.) doVariety stores do
Liquor stores do
Estimated inventories, end of year or month: tBook value (unadjusted), total f mil. $
Durable goods stores 9 — - _ _ _ _ d oAutomotive group doFurniture and appliance group. __doLumber, building, hardware group, .do
Nondurable goods stores 9 .. doApparel group doFood group doGeneral merchandise group do
Department stores _ _ . . do
Book value (seas, adj.), total t doDurable goods stores 9 do
Automotive group doFurniture and appliance group doLumber, buildine. hardware erouD— _do.___
2, 973. 5787 1
2,186.3159 760 9
292.51 673 2
261 630
84 17348, 73045 7992 931
13, 0908 0794,199
11 3408,6902 650
177, 45715 2823,1215,9443 6262,591
8,61319, 57762, 86457 27220, 269
32, 35020, 8092 4024,9486,011
30, 18112, 8545,5782,2272,461
17, 3273,4323,8225,3813,174
31, 13013, 1365, 6452,2722. 550
3, 164. 6865.6
2, 298. 9170 463.4
288. 51,776.7
283 950
93, 71856, 26653 2173 049
13,7378,5384,223
12, 1159,3022 813
190, 23215 7523 2586,2433 6802 571
9,33521 42366, 92061 06821 765
35, 84023 4212 5815 3206 305
32, 90314, 4337,1892,3122,427
18, 4703 6774, 0745,8313,466
33, 95714 7827,3292,3592.512
271.872 7
199.116 65 7
25.4151 4
23 525
7,9845,0564 796
260
1,015642298
973745228
15, 5411,383
265538309271
7381,7135,4364 9691,765
; 2, 8421,841
199436486
22,849
7 4544 4724,218
254
1 104675337
942724218
15,3951 242
265485289203
7621 7465 4514 9861 792
2 8391 850
205420516
33, 38414, 981
7, 1512,4162,611
18, 4033,7793,8625,9233,465
32, 54614, 2986,5132, 3952.538
286.079 9
206.016 95 0
28.5155 6
23 820
8,1445,0064 729
277
1,044666312
1,090839251
15, 6761 256
256496282222
7511,8315,4965 0101, 844
2,8091,836
194423510
23 317
7 6164 5554 295
260
1 088682332
1 004776228
15,7011 299
271502306220
7551,7695 4975 0211 811
2 9401 909
215450530
33, 27715, 0987,3382,3892,611
18, 1793,7093,8035,8473,419
32, 82314, 5666,8132,3832.535
266.075 7
190.317 35.4
24.9142 7
23 825
8,3625,0944 812
282
1,106708329
1,143900243
15,4631 208
268456275209
7461,8655,4774 9861,895
2,7461,806
184409497
23322
7 6654 6064 359
247
1 099699334
1 Oil783228
15,6571 278
262501303212
7601,7695 5345,0531 824
2,8941 885
211442525
33, 08715, 0027,3082,3832,590
18, 0853,6313,8035,8253,378
33, 01414,5466,9002,3932,525
238.774 1
164. 613 45.7
18.2127 3
24 129
8 0664,8214 540
281
1,129724335
1,160916244
16,0631,145
236440278191
7662,0156,0435 5191,963
2,6631,731
172412542
23 668
7 8274 7434,491
252
1 118722334
1 016782234
15,8411 315
268510326211
7751,8125 5715,0761 831
2,9611 936
219443527
32, 93514, 9187,3002,3382,547
18, 0173,6383,7625,8553,400
33, 08814, 5926,9792,3572,525
261.479 1
182 313 33 9
18 1147 1
22 989
7,4484,2433 984
259
1,139724347
1,119889230
15, 5411,173
226443309195
7571,9845,4534,9561, 926
2,8651,863
212426497
23,585
7 7554 6604,402
258
1 127706353
1 002768234
15,8301 306
271500327208
7791,8075 5685,0781,820
2,9881 961
211448513
32, 74314, 3176,6152,3962,520
18, 4263,9303,7356, 0253,517
33, 36014, 8197,2132,4012,507
271.972 9
198.913 24 6
27.4153 8
22 732
7,0823,7843 540
244
1,201712393
1,102865237
15, 6501 324
250496348230
7591,8565,4985 0171,820
2,9621,942
223422505
23 753
7 7684 6584,398
260
1 184'716389
1 002765237
15,9851 343
278508344213
7941 8145 5865,0971 827
3 0431 982
223452530
32, 52713, 6235, 9452,4262,529
18, 9044,1413,7206,3093,693
33,04514, 8217,0362,3932,534
296.378 4
217. 918 85 4
30.6163 2
25 067
8 4134 9944 719
275
1,272790394
1,132885247
16,6541 360
280553310217
7981,8785,9625 4481,884
3,1222,035
225448533
24.194
7 8654 6144 345
269
1 221'749380
1 021775246
16,3291 321
276535290220
8161 8255 7885 2711 843
3 0551 978'220459531
33,70814, 0166,3442,4192,526
19, 6924,2133,8926,7494,023
33, 29614, 7827,2502,335?,562
292.471.8
220.714 65.2
28.7172 2
25 158
8,3904,9544,689
265
1,318819397
1,098846252
16,7681 455
299602341213
7861,7475,5775 0721,849
3,6002, 344
328484561
24 647
8 0924 7764 509
267
1 218*756366
1 074819255
16.5551 384
280566311227
8181 8105 7575 2351 860
3 1992 087
235469543
34, 77114, 5336,7722,5022, 525
20,2384,2663,9826,9204, 175
33, 53314, 7747,3042, 3832,563
285.462 0
223.49 65.4
22.9185 6
30 601
8 9764,8354 516
319
1,619941546
1 084729355
21, 6252 418
554992566306
1,0891 8816 5595 9771 889
5,6443 745
358888826
24 816
8 2524 9534*714
239
1 207*735378
1 070825245
16,5641 340
269560297214
8281 8755 9565 4321 838
3 0692 019
?09433533
32, 90314, 4337,1892,3122,427
18, 4703,6774,0745, 8313,466
33, 95714, 7827,3292,3592.512
240.073 7
166 312 87 8
18.8126 8
29 054
6 9854 3004 089'211
1, 058645342
817619198
15 0691 152
249466244193
7781 7085 6005 1271 815
2,3751 564
166313496
25 023
8 3244' 8844' 610
274
1 208' 759378
I 149896253
16 6991 417
289570318240
8061 8795 7835 ?781 907
3 2302 119
243451560
33 10314, 9237 5412,3122,462
18,1803 5443 9595, 9333,442
34, 11314 9497,3152,3982.541
231.069.5
161.513. 14.7
22.1121.7
21, 260
6, 9984,3664,166
200
1,015614335
774594180
14, 2621, 009
200428213168
7521,6185,3484,8741, 667
2,2851,474
166335470
25 263
8 3994,9954,718
277
1 220730405
1,114862252
16, 8641 450
289594327240
8061 9155 8795,3591 907
3 2252 127
223457561
34 14815 4807 9512 3072,504
18 6683 7533 9456 0713,546
34, 12715 1137 3612,3832.558
282.379.4
202.916 25.9
26.0154.8
r24, 712
r 8, 606' 5, 430T 5, 169
••261
' 1, 150'714'368
'980'762'218
'16,1061, 277'225' 544••275••233
7981,809
' 5, 808'5 297' 1, 827
' 2, 887T 1, 892
218'393'496
25, 536
' 8, 649r 5, 121r 4, 822
••299
'1,249' 765' 405
f 1, 150'895'255
'16,887'1,377
'277'569'299'232
8161,935
' 5, 917r 5, 391f 1, 907
3,225'2 119
220'459' 559
35, 28515, 9168,1232,3722,587
19, 3693,9394,0336, 4323,787
34, 55615, 2017,3652,3892.532
282.481.6
200.816.06.6
27.2151.0
'25, 552
' 8, 439' 5, 204
4,916288
' 1, 109707341
1,038795243
'17,113' 1,463
266609308280
'819' 1, 892' 6, 103' 5, 578'1,917
' 3, 085' 2, 016
198460536
'25, 020
'8,0014,6384, 362
276
1,215750385
1,034798236
'17,0191,395
277584311223
8381,9156,0095,4861,946
3,1992,109
224453558
35, 69916, 1188,2182,4802,602
19, 5813,9514,0796,5433,887
34, 73715, 3367,4842,4582.532
i 24 711
1 8, 040i 4, 835
i 1, 133
i 16, 6711 1, 359
18021,9875,6845 2101,986
2,9971,943
124 424
i 7 479
1 16, 945
'Revised. 1 Advance estimate. t Revised series. Data reflect use of new sample(effective with data for Oct. 1965) based on definitions and classifications according to the1963 Census of Business. See p. 20 ff. of the Feb. 1966 SURVEY for data back to 1959 for mfg,and trade inventories, total and retail inventories. See p. 18 ff. of the April SURVEY forinventory-sales ratios, mfg. and trade sales, total, and retail sales back to 1959 (revised ac-
counts receivable data prior to Oct. 1965 are not presently available). Complete details ap-pear in the Monthly Retail Trade Report, Jan. 1966 and subsequent issues, available from theBureau of the Census, Wash., D.C., 20233. 9 Includes data not shown separately. cfCom-prises lumber yards, building materials dealers, and paint, plumbing, and electrical stores.
Digitized for FRASER http://fraser.stlouisfed.org/ Federal Reserve Bank of St. Louis
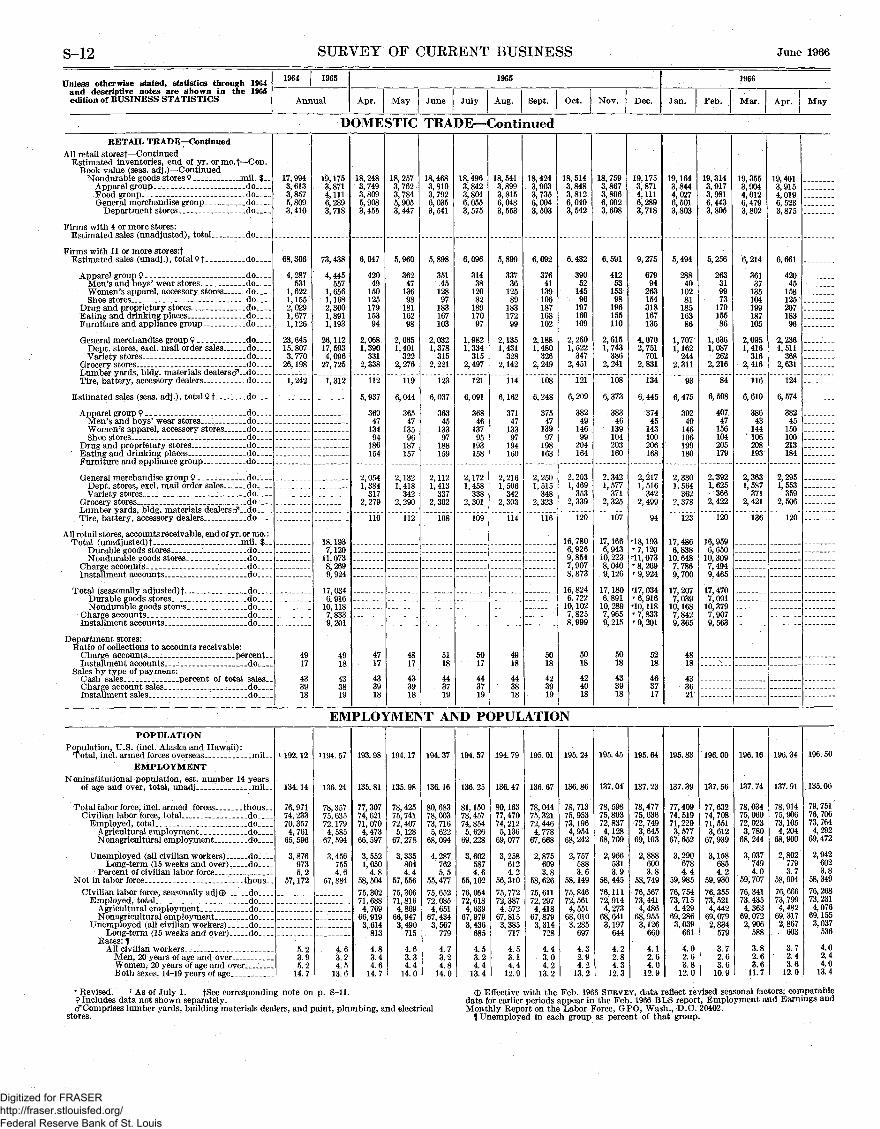
S-12 SURVEY OF CUERENT BUSINESS June 1966
Unless otherwise stated, statistics through 1964and descriptive notes are shown in the 1965edition of BUSINESS STATISTICS
1964 1965
Annual
1965
Apr. May June July Aug. Sept. Oct. Nov. Dec.
1966
Jan. Feb. Mar. Apr. May
DOMESTIC TRADE—ContinuedRETAIL TRADE— Continued
All retail storesf— ContinuedEstimated inventories, end of yr. or mo. f— Con.
Book value (seas, adj.)— ContinuedNondurable goods stores 9 mil. $
Apparel group doFood group. _- __doGeneral merchandise group do
Department stores _ • __ _ _ _ do _
Firms with 4 or more stores:Estimated sales (unadjusted), total do _
Firms with 11 or more stores :fEstimated sales (unadj.), total 9 1 do
Apparel group 9 doMen's and boys' wear stores _ doWomen's apparel, accessory stores do_ _Shoe stores do
Drug and proprietary stores. _ doEating and drinking places.. do. _ .Furniture and appliance group do
General merchandise group 9 _-_ . _do_ _ _Dept stores, excl. mail order sales doVariety stores _ do
Grocery stores _ _ __ do_ _Lumber yards bldg. materials dealers cf doTire battery, accessory dealers do _
Estimated sales (seas adj.), total 9 1 do
Apparel group 9 _ _ do. __Men's and boys' wear stores doWomen's apparel, accessory stores doShoe stores do_ _ _
Drug and proprietary stores doEating and drinking places doFurniture and appHance group.. do
General merchandise group 9 doDept stores excl mail order sales doVariety stores do
Grocery stores do _Lumberyards bldg materials dealers d" doTire battery, accessory dealers do
All retail stores, accounts receivable, end of yr. or mo. :Total (unadjusted) f mil. $
Durable goods stores doNondurable goods stores do
Charge accounts doInstallment accounts d o
Total (seasonally adjusted)! doDurable goods stores doNondurable goods stores do
Charge accounts doInstallment accounts do
Department stores:Eatio of collections to accounts receivable:
Charge accounts percentInstallment accounts do
Sales by type of payment:Cash sales percent of total salesCharge account sales - doInstallment sales do
17, 9943,6133,8575,8093,410
68,306
4,287531
1,6221, 1552,0291,6771,126
23,64515, 8073,770
26,198
1,242
4917
433918
19, 1753,8714, 1116,2893,718
73, 438
4,445557
1,6561,1682, 3001,8911,193
26, 11217, 5934,096
27, 725
1,312
18,1937,120
11 0738, 2699,924
17 0346,916
10, 1187 8339,201
4918
433819
18, 2483,7493,8095,9083,455
6,047
42049
15012517915394
2,0681,390
3312,338
112
5,937
36047
13494
186154
2, 0541,384
3172,279
110
4717
433918
18, 2573, 7623,7845, 9053,447
5,960
36247
13698
18116298
2,0651,401
3222,276
119
6,044
36547
13596
187157
2,1321,418
3422,290
112
4817
433918
18, 4683,8103,7926,0353,541
5,898
35145
12897
183167103
2,0321,378
3152,221
123
6,037
36345
13397
188159
2,1121,413
3372,302
108
5118
443719
18, 4963,8423,8046,0553,575
6,096
31438
12082
18917097
1,9821,334
3152,497
121
6,091
36846
13795
193158
2,1721,458
3382,301
109
5017
443719
18,5413,8993, 8156,0483,553
5,899
33736
12589
18317299
2,1351,431
3282, 142
114
6,162
37147
13397
194160
2, 2161,506
3422,303
114
4918
443818
18, 4243,9033,7356,0043,503
6,092
37641
139106187168102
2,1881,480
3262, 249
108
6,248
37547
13997
198163
2, 2501,515
3482,323
116
5018
423919
18, 5143,8483, 8126,0403,542
6,432
39052
14596
197169109
2,2601,522
3472,451
121
6,209
38249
14699
204164
2, 2031,469
3532,339
120
16, 7806,9269, 8547,9078,873
16, 8246,722
10, 1027,8258, 999
5018
424018
18,7593,8673,8966,0923,608
6,591
41253
15398
196155110
2, 6151,743
3862,241
108
6,373
38346
139104203160
2,3421,577
3712, 325
107
17, 1666,943
10, 2238,0409, 126
17, 1806,891
10, 2897,9659,215
5018
433918
19,1753,8714,1116,2893,718
9, 275
67994
263154318167135
4,0702,751
7012,831
134
6,445
37445
143100206168
2,2171,516
3422,499
94
•18, 193'7,120"11, 073' 8, 269'9,924
'17, 034' 6, 916'10, 118'7,833' 9, 201
5218
463717
19, 1643, 8444,0276, 5013, 803
5, 494
28840
10281
18516386
1,7071, 162
2442,311
93
6,475
39249
146106199180
2,3301,564
3622, 378
123
17, 4866,838
10, 6487,7869,700
17, 2077,039
10, 1687,8429,365
4818
433621
19,3143,9173,9816, 4433, 805
5,256
263319973
17915586
1,6361,087
2622,216
84
6,598
407.47
156104205179
2,3921,625
3662,422
120
16, 9596,650
10, 3097,4949,465
17, 4707,091
10, 3797,9079,563
\
19, 3553,9044,0126,4793,802
6, 214
36137
135104199187105
2,0951,416
3162,416
116
6, 610
38643
144106208193
2,3631,587
3712,421
136
19, 4013, 9154,0196,5233,875
6,661
42045
15812520718396
2, 2361, 511
3682, 631
124
6,574
38245
150100213184
2,2951,553
3592,506
120
EMPLOYMENT AND POPULATIONPOPULATION
Population, U.S. (incl. Alaska and Hawaii):Total, incl. armed forces overseas mil
EMPLOYMENTNoninstitutional population, est. number 14 years
of age and over, total, unadj mil
Total labor force, incl. armed forces ___thous__Civilian labor force, total _ do. _
Employed, total doAgricultural employment. _ _ - _ doNonagricultural employment _ _ do
Unemployed (all civilian workers) d o _ _ _ _Long-term (15 weeks and over) _ _ do
Percent of civilian labor force...Not in labor force thous
C i vilian labor force, seasonally adj © . do _Employed, total do
Agricultural employment _ _ doNonagricultural employment.. __do_ _
Unemployed (all civilian workers) doLong-term (15 weeks and over) . do
Rates: fAll civilian workers
Men, 20 years of age and over _Women, 20 years of age and over :Both sexes, 14-19 years of age. _ ___ __
1 192 12
134 14
76, 97174, 23370, 3574,761
65, 596
3,8769735.2
57 172
5 23.95.2
14.7
1194 57
136 24
78, 35775, 63572, 1794,585
67, 594
3,4567554.6
57 884
4 63 24.5
13.6
193. 98
135. 81
77, 30774, 62171,0704,473
66, 597
3,5521,050
4.858, 50475, 30271, 6884,769
66, 9193,614
813
4.83.44.6
14.7
194. 17
135. 98
78, 42575, 74172, 4075,128
67, 278
3,3358044.4
57 55675, 30671, 8164,869
66, 9473 490
715
4.63.34.4
14.0
194. 37
136. 16
80, 68378, 00373, 7165,622
68, 094
4,2877625.5
55, 47775, 65272, 0854,651
67, 4343,567
779
4.73.24.8
14.0
194. 57
136. 25
81, 15078, 45774, 8545,626
69, 228
3,6025874.6
55, 10276, 05472, 6184,639
67, 9793,436
685
4.53.24.4
13.4
194. 79
136. 47
80, 16377, 47074, 2125, 136
69, 077
3,2586124.2
56, 31075, 77272, 3874,572
67, 8153,385
717
4.53.14.4
12.9
195. 01
136. 67
78,04475, 32172, 4464,778
67, 668
2,8756093.8
58 62675,61172, 2974,418
67,8793, 314
728
4.43.04.2
13.2
195. 24
136. 86
78, 71375, 95373, 1964, 954
68,242
2,7575883. 6
58, 14975, 84672, 5614,551
68, 0103,285
697
4.32.94.2
13.2
195. 45
137. 04
78, 59875, 80372, 8374,128
68, 709
2, 9665313.9
58, 44576,11172, 9144,273
68, 6413,197
644
4.22.84.3
12.3
195. 64
137. 23
78, 47775, 63672, 7493,645
69, 103
2, 8886003.8
58, 74976, 56773, 4414,486
68, 9553,126
660
4.12.64.0
12.9
195. 83
137. 39
77,40974, 51971, 2293,577
67, 652
3, 2906784.4
59, 98576, 75473, 7154,429
69, 2863,039
661
4.02.63.8
12.0
196. 00
137. 56
77,63274,70871, 5513,612
67, 939
3,1586854.2
59, 93076, 35573,5214,442
69, 0792,834
579
3.72.63.6
10.9
196. 16
137.74
78, 03475, 06072, 0233,780
68, 244
3,0377494.0
59,70776, 34173, 4354,363
69, 0722,906
588
3.82.63.6
11.7
196. 34
137. 91
78, 91475, 90673, 1054, 204
68, 900
2,8027793.7
58, 99476, 66673,7994,482
69, 3172, 867
603
3.7' 2.4
3.612.0
196. 50
135. 06
79,751'76, 70673, 7644,292
69,472
2,9426023.8
58, 34976, 26873,2314,076
69, 1553,037
536
4.02.44.0
13.4
' Revised. l As of July 1. fSee corresponding note on p. S-ll.9 Includes data not shown separately.cf Comprises lumber yards, building materials dealers, and paint, plumbing, and electrical
stores.
© Effective with the Feb. 1966 SURVEY, data reflect revised seasonal factors; comparabledata for earlier periods appear in the Feb. 1966 BLS report, Employment and Earnings andMonthly Report on the Labor Force, GPO, Wash., D.C. 20402.
1 Unemployed in each group as percent of that group.
Digitized for FRASER http://fraser.stlouisfed.org/ Federal Reserve Bank of St. Louis
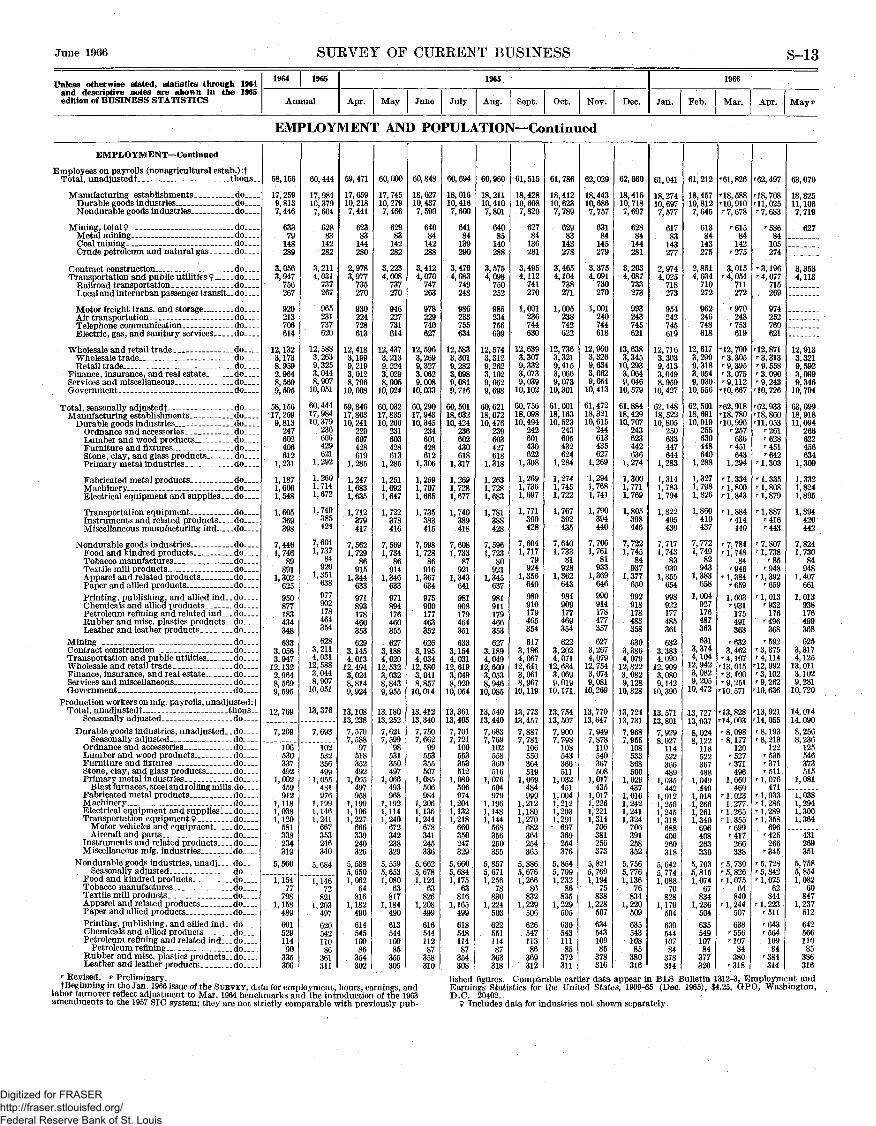
June 1966 SURVEY OF CUERENT BUSINESS S-13
Unless otherwise stated, statistics through 1964and descriptive notes are shown in the 1965edition of BUSINESS STATISTICS
1964 | 1965
Annual
1965
Apr. May June July Aug. Sept. Oct. Nov. Dec.
1966
Jan. Feb. Mar. Apr. May*
EMPLOYMENT AND POPULATION—Continued
EMPLOYMENT— Continued
Employees on payrolls (nonagricultural estab.) :fTotal, unadjusted!- _ thous._
Manufacturing establishments _ __doDurable goods industries - doNondurable goods industries _ _ _ _ do _
Mining, total 9 doMetal mining _ __ _ _ doCoal mining doCrude petroleum and natural gas do
C ontract construction. _ _ _ ' ' _ • _ _ doTransportation and public utilities 9 do
Railroad transportation _ _ _ doLocal and interurban passenger transit, do
Motor freight trans, and storage __do _Air transportation. _ _doTelephone communication doElectric, gas, and sanitary services. _ do _
Wholesale and retail trade doWholesale trade _ do _Retail trade do
Finance insurance, and real estate - doServices and miscellaneous do_Government do
Total, seasonally adjustedf -- --- doManufacturing establishments _ _ do
Durable goods industries •_ _ _ _ doOrdnance and accessories do_ _Lumber and wood products... doFurniture and fixtures _ _ doStone, clay, and glass products.- doPrimary metal industries . ... do
Fabricated metal products. doMachinery _ • _ ' _ ___ _ doE lectr ical equipment and supplies _ _ _ do
Transportation equipment. _ _ _ doInstruments and related products. _ _ _ doMiscellaneous manufacturing ind do
Nondurable goods industries. doFood and kindred products.. __doTobacco manufactures _ _ doTextile mill products _ _ _ doApparel and related products_~____--doPaper and allied products. _ _ _ _ _ do____
Printing, publishing, and allied ind-.do____Chemicals and allied products _ doPetroleum refining and related ind___doRubber and misc. plastics products. _ doLeather and leather products do
Mining doContract construction _ __ doTransportation and public utilities doWholesale and retail trade _ do.Finance, insurance, and real estate. doServices and miscellaneous doGovernment _ . _ _ _ _ _ do _
Production workers on mfg. payrolls, unadjusted:!Total, unadjusted! _ _ _ _ _ _ _ t h o u s _ .
Seasonally adjusted do.__
Durable goods industries, unadjusted- _ do_ .Seasonally adjusted do_ _
Ordnance and accessories. ._ doLumber and wood products..... _ _ do.Furniture and fixtures _ _ _ doStone, clay, and glass products. _. doPrimary metal industries _ _ _ do
B last furnaces , steel and rolling mills, doFabricated metal products. _ _ _ _ _ d oMachinery _ doElectrical equipment and supplies! __doTransportation equipment 9 do
Motor vehicles and equipment doAircraft and parts do
Instruments and related products. ... do. _ _ _Miscellaneous mfg. industries do
Nondurable goods industries, unadj. doSeasonally adjusted __ _ do
Food and kindred products . _ _ _ do. _ _ .Tobacco manufactures. _ _ _ _ _ doTextile mill products doApparel and related products. _ _ _ _ _ do ._Paper and allied products _ _ _ _ _ _ _ d o
Printing, publishing, and allied ind._doChemicals and allied products. _ _ _ _ _ _ do_ .Petroleum refining and related ind___ do
Petroleum refining doRubber and misc. plastics products _ _ d o _ _ _ .Leather and leather products •. __do
58, 156
17, 2599 8137 446
63379
148289
3, 0563,947
756267
920213706614
12, 1323, 1738 9592 9648,5699 595
58, 15617, 2599,813
247602406612
1,231
1,1871,6061, 548
1,605369398
7,4461,746
89891
1, 302625
950877183434348633
3 0563 947
12 1322,9648 5699 595
12, 769
7,209
106530337492
1 002459912
1 1181,0381 120
581338234319
5 560
1,15477
7981 158
48960152911490
335306
60, 444
17 98410 3797 604
62883
142282
3,2114,031
737267
965231737620
12, 5883,2639,3253,0448,907
10, 051
60, 44417, 98410, 379
236606429621
1,292
1, 2601,7141,672
1,740385424
7,6041,737
84920
1,351638
977902178464354
6283,2114,031
12, 5883,0448, 907
10, 051
13,376
7,693
102532356499
1 055481976
1 1991,1461 241
667353246340
5 684
1,14672
8211 203
49762054211086
361311
59, 471
17, 65910 2187,441
62383
144280
2,9783,977
735270
930224728613
12, 4183,1999 2193 0128,796
10 008
59, 84617, 80310, 241
229607428619
1,285
1,2471,6831, 635
1,712379417
7, 5621,729
86915
1,344633
971893178460353
6293 1454 013
12 4943,0248 8149 924
13, 10813 2387, 5707,588
97518352492
1 065497958
1 1901,1061 227
666339240326
5 5385 6501,062
64816
1 182490
61454510986
354302
60,000
17, 74510 2797 466
62983
142282
3,2234,008
737270
946227731614
12,4373,2139 2243 0298,905
10 024
60, 03217, 83510, 266
231603428613
1,285
1,2511,6921,647
1, 722378416
7,5691,734
86914
1,346633
971894176460355
6273 1884 020
12 5323,0328 8439 955
13, 18013 2527,6217,599
98531350497
1 066493968
1 1921,1141 240
672342238329
5 5595 6531,080
63817
1 184490
61354410985
355305
60, 848
18, 02710, 4377,590
64084
142288
3,4124,070
747263
978229740627
12, 5963, 2699 3273 0629,008
10 033
60, 29017, 94310, 345
234601428612
1,306
1, 2591,7071, 665
1,735383415
7,5981, 728
86916
1,367634
975900177463352
6263 1954 034
12 5803,0418 857
10 014
13, 41213 3407,7507,662
99553355507
1 085506984
1 2061,1361 244
678341245336
5 6625 6781,124
63826
1 208499
61654411287
358310
60, 694
18, 01610 4167,600
64184
139290
3,4764,083
749248
986233755634
12,5833,3019 2823 0989, 0819 716
60, 50118, 03210, 424
236602430618
1, 317
1,2691,7281,677
1,740389418
7,6081, 733
87921
1, 343641
981908179464351
6333 1544 031
12 6193,0498 929
10 054
13, 36113 4057, 7017, 721
100553353512
1 080506974
1 2041, 1321 218
660350247329
5 6605 6841, 175
63816
1 165499
61854811487
354308
60,960
18, 21110 4107 801
64085
140288
3,5754,098
750252
985234756639
12,5743,3129 2623 1029 0629 698
60,62118,07210, 476
239603427618
1,318
1,2631,7281,683
1,781388428
7,5961,723
80921
1,345637
981911179466353
6273 1894 049
12 6003,0538 946
10 085
13, 54013 4407,6837,769
102558360516
1 076504979
1 1961,1481 144
568356250355
5 8575 6711,256
78830
1 224503
62255111487
363318
61,515
18, 42810 6087 820
62784
136281
3,4954,112
741270
.1,001236744630
12,6393,3079,3323,0739,039
10, 102
60, 75618, 09810,494
242601430622
1,308
1,2691,7361,697
1, 771390428
7,6041,717
79924
1,356640
980910179465354
6173,1864 067
12 6413,0618 967
10 119
13,77313 4577, 8877 781
106550364519
1 069484999
1 2121,1801 270
682364254365
5 8865 6761,266
86832
1 229506
62654711386
369312
61,786
18, 41210 6237 789
62983
143278
3,4654,104
738271
1,005238742622
12, 7363,3219,4153,0669,073
10, 301
61, 00118, 16310, 523
243605432624
1,284
1,2741, 7451,722
1,767392435
7,6401, 733
81928
1,362643984909177469354
6223, 2024 071
12 6843,0699 019
10, 171
13,75413 5077,9007,798
108543366511
1 032451
1,0041 2121,2031 291- 697
369254376
5 8545 7091,232
86835
1,229505
63054311185
372311
62, 029
18 44310 6867 757
63184
145279
3,3754,091
730270
1,001240744618
12, 9603,3269,6343,0629,054
10, 413
61,47218, 32110, 615
244613435627
1,269
1,2941, 7681,741
1,790394440
7,7061, 761
81933
1,369646
990914178477357
6273, 2674,079
12,7543,0749, 081
10, 269
13, 77013 647
7,9497 878
110540367508
1 017435
1,0171 2261,2211 314
706381256373
5 8215,7691, 194
75838
1,228507
63454310985
378316
62, 660
18, 41510 7187 697
62884
144281
3,2034,087
733273
993243745621
13, 6383,345
10, 2933,0649,046
10, 579
61, 88418, 42910,707
243623442636
1,274
1,3001,7711,769
1,805398446
7, 7221,745
84937
1,377650
992918178483358
6303 3864 079
12 8223,0829 128
10 328
13, 72413 7317 9687 955
108533368500
1 026437
1, 0161 2421,2411 324
706391258352
5 7565 7761,136
76834
1,220509
63554310885
380316
61, 041
18 27410 6977 577
61783
143277
2,9744,025
718273
954242745619
12, 7163 3039 4133 0498 959
10 427
62. 14818,52210,805
250633447644
1,283
1,3141,7831,794
1,822405430
7,7171,743
83939
1, 355654
998922177485361
6323 3834' 090
12 9093,0809 142
10 390
13, 57113 8017 9298 027
114522366489
1 03*5442
1,0121 2501, 2451 318'ggg
400260318
5 6425' 7741,088
70898
1 17950463054410784
378314
61, 212
18 45710 8127*645
61384
143275
2,8514,034
710272
962246748618
12, 6173,2999,3183,0549,030
10, 556
62, 50118, 69110, 919
255630448640
1,288
1, 3271,7981,826
1,860410437
7,7721,749
82943
1,383658
1, 004927176487363
6313,3744,104
12,9423,0829,205
10, 472
13,7271 q QQ7
8 0248 122' 118522367488
1 049'449
1,0181 2661,2611 340
696408263330
5 7035 8151,074
67834
1 236504
63554910784
377320
'61,826
'18 588'10 910r 7 678
r 61584
142'275
3,015'4,054
711272
'970248
'753619
'12,700' 3, 305' 9 395'3 075' 9, 112'10 667
'62,918'18, 780'10,996
'257636
'451643
1,294
'1,334'1,800'1,843
' 1, 884'414
440
'7,784' 1, 748
84'946
'1,384' 659
1,003'931
175491363
'6323 462
'4 107'13 015'3,100'9 251
'10'571
'13,828'14 003'8 098'8 177
120'527r 371
4961 060'460
'1,0231 277
' 1, 265r i 355
'699' 417
266338
' 5 730' 5 826'1,075
64840
'1 244507638
'556'107
84380
'318
'62,497
'18 708'11 025' 7 683
' 58684
105274
' 3, 196' 4, 077
715269
974252760621
'12,871' 3, 313'9 558'3,090' 9, 243'10 726
'62,933'18,860'11,053
'261'628'451'642
' 1, 303
'1,335'1,808'1,879
' 1, 887'416'443
' 7, 807' 1, 738
'85'948
' 1, 392'659
' 1, 013'932
176' 496
368
'592' 3, 375' 4, 114
'12,992' 3, 102' 9, 262
'10,636
'13,921'14 055' 8, 193'8,213
122'535'371' 511
'1 076471
' 1, 033' 1 286r 1,289'1 358
696'425
266'345
' 5, 728' 5, 842' 1, 075
62844
' 1, 223' 511
'643'564
10984
'384314
63,070
18 82511 1067 7i9
627
3,3534,113
12, 9133 3219 5923 0999 346
10 794
63, 09918, 91811,094
266622456634
1,309
1,3321,8241,895
1,894420442
7,8241,730
84948
1,407661
1, 013938176499368
6253,3174,125
13, Oil3,1029,281
10, 720
14, 01414 0908,2568,236
125546373515
1, 081
1,0381 2941,3001 364
431269351
5,7585,8541,082
60847
1,237512
64256611085
386316
f Revised, p Preliminary.fBeginning in the Jan. 1966 issue of the SURVEY, data for employment, hours, earnings, and
labor turnover reflect adjustment to Mar. 1964 benchmarks and the introduction of the 1963amendments to the 1957 SIC system; they are not strictly comparable with previously pub-
lished figures. Comparable earlier data appear in BLS Bulletin 1312-3, Employment andEarnings Statistics for the United States, 1909-65 (Dec. 1965), $4.25, GPO, Washington,D.C. 20402.
9 Includes data for industries not shown separately.
Digitized for FRASER http://fraser.stlouisfed.org/ Federal Reserve Bank of St. Louis

S-14 SUEVEY OF CUEKENT BUSINESS June 1966
Unless otherwise stated, statistics through 1964and descriptive notes are shown in the 1965edition of BUSINESS STATISTICS
1964 1965
Annual
1965
Apr. May June July Aug. Sept. Oct. Nov. Dec.
1966
Jan. Feb. Mar. Apr. May?
EMPLOYMENT AND POPULATION—Continued
EMPLOYMENT-Continued
Miscellaneous employment data:Federal civilian employees (executive branch) :
United States __ _ thousWash., D.C., metropolitan area - do__
Railroad employees (class I railroads):©Total _ - -do
Index, seasonally adjusted 1957-59= 100__
INDEXES OF WEEKLY PAYROLLS!
Construction (construction workers)!- 1957-59 = 100__Manufacturing (production workers)! doMining (production workers)! do
HOURS AND EARNINGS!
Average weekly gross hours per production workeron payrolls of nonagric. estab., unadjusted:!
All manufacturing estab., unadj.! hoursSeasonally adjusted - _ _ _ _ _do _
Average overtime. _doDurable goods industries do
Seasonally adjusted _ _ do_Average overtime. - do
Ordnance and accessories _ _doLumber and wood products.. doFurniture and fixtures _ doStone, clay, and glass products doPrimary metal industries do
Blast furnaces, steel and rolling mills .do
Fabricated metal products doMachinery _ _ _ __do_ .Electrical equipment and supplies do
Transportation equipment 9 do _Motor vehicles and equipment doAircraft and parts _ _ do
Instruments and related products do_ ,. _ _Miscellaneous mfg . industries do
Nondurable goods industries, unadj doSeasonally adjusted do
Average overtime doFood and kindred products _ _ _ doTobacco manufactures d o _ _ _ _Textile mill products doApparel and related products _ _ _doPaper and allied products _ _ _ d o __.Printing, publishing, and allied ind_ _ d o _ _Chemicals and allied products _ _ doPetroleum refining and related ind do_
Petroleum refining doRubber and misc. plastics products doLeather and leather products _ _ _do_ _
Nonmanufacturing establishments:!Mining 9 _ do
Metal mining •__ _ _ _ _ doCoal mining doCrude petroleum and natural gas do
Contract construction doGeneral building contractors doHeavy construction doSpecial trade contractors do
Transportation and public utilities:Local and suburban transportation doMotor freight transportation andstorage doTelephone communication doElectric gas and sanitary services do
Wholesale and retail trade do _Wholesale trade. - . do _ _Retail trade do
Services and miscellaneous:Hotels tourist courts, and motels doLaundries, cleaning and dyeing plants do
Average weekly gross earnings per productionworker on payrolls of nonagric. estab.:!
All manufacturing establishments f dollars. -Durable goods industries _do_ _ _
Ordnance and accessories _ _ __ _._do_ _Lumber and wood products doFurniture and fixtures doStone, clay, and glass products _ doPrimary metal industries doFabricated metal products _ _ d o _ _ _Machinery. _ _ _ _ _ _ _ _ _ _ _ d o _ _Electrical equipment and supplies doTransportation equipment doInstruments and related products . -do __Miscellaneous mfs. industries _ do
2,317244
68375.8
132.5124.293.0
40.7
3.141.4
3.3
40.540.441.241.741.841.1
41.742.440. 5
42.143.041.440.839.6
39.7
2.941.038.841.035.942.838.541.641.941.441.337.9
41.941.4
« 39 042.537.235 840.836 6
42.041.940 241 237.940.737.0
38 438 7
102. 97112. 19122. 3185.2484.46
105. 50130. 00111. 34121. 69101. 66130. 09103. 6382.37
2,347251
p652P73.4
145.3135.996 5
41.2
3.642.0
3.9
41.940.841.541.942.141.0
42.143.141.0
42.944.242.041.439.9
40.1
3.141.137.941.736.443.138.641.942.241.842.038.2
42.341.6
a 39 942 337 436 140.836 9
42 142.540 441 437.740.836 6
37 938 8
107. 53117.18130. 7388 5487 98
109. 78133. 88116. 20127. 15105. 78137. 71108. 0584.99
2,306246
64973.0
128.0130.993.5
40.741.03.1
41.741.93.5
41.040.740.741.344.145.7
41.442.440.2
42.343.641.140.339.2
39.439.92.7
40.335.641.035.642.238.342.442.442.540.837.0
41.741.539 142.036.735.639.636 3
41.641.639.841 437.640.636.7
37 839.4
105. 82115. 93126. 2886.6985.06
106. 97141. 12113. 02*123. 38102. 91134. 09104. 3883.10
2,308246
65372.7
148.2133.897.5
41.241.13.5
42.142.03.9
41.641.440.942.442.341.3
42.343.341.0
43.244.641.941.539.7
40.040.03.1
41.037.241.636.443.038.542.242.441.941.738.0
42.642.040.042.638.436.842.037.8
42.642.240.141.537.640.936.5
37.739.6
107. 53117. 46128. 9689.4285.89
110. 66134. 09116. 75127. 74105. 37137. 81107. 9084. 56
2,342255
66373.1
156,8136.799.1
41.341.03.6
42.241.84.0
41.840.741.442.342.641.8
42.443.441.1
43.144.542.041.639.7
40.239.93.1
41.237.841.936.643.338.542.042.441.642.138.4
42.641.741.041.938.0
i36. 341.737.4
42.642.939.941 137.940.936.9
37 739.2
107. 79117. 74129. 5888.7386.94
110. 40135. 89117. 02128. 03106. 04137. 49108. 9984.96
2,375258
66773.7
162.0135.198.3
41.041.03.4
41.641.73.7
42.240.841.042.342.442.0
41.742.840.3
42.142.941.941.239.3
40.240.03.1
41.937.641.336.543.138.441.642.841.841.738.6
42.441.9
42.538.636.942.837.8
42.442.940.641.338.441.037.5
38.939.0
107. 01116. 06131. 6688.9486.51
110. 83135. 68114. 68125. 83103. 97133. 46107. 5383. 71
2,376256
66674.2
170.2136.1100.5
41.141.03.5
41.741.73. 8
41.941.442.042.541.841.0
42.042.540.7
41.441.641.741.440.0
40.340.03.2
41.537.941.936.943.338.741.742.741.742.138.4
43.241.640.842.938.937.143.438.0
42.743.240.441 238.341.037.4
38 938.6
106. 45115. 51131. 1591.0889.04
111. 78132. 51115. 08124. 95104. 60130. 82108. 0584.80
2,341251
65674.3
160.7140.397.2
41.040.93.8
41.741.6,4.0
41.941.041.742.341.739.9
41.942.840.8
41.842.341.541.640.0
40.240.13.5
41.439.441.636.243.338.842.243.542.842.037.8
42.441.939.142.237.135 640.336.5
42.343.241.341 737.540.836.5
37.738.6
107. 83117. 18131. 1590.6189.24
112. 10133. 44116. 48127. 12106. 08135. 01108. 5885.20
2,352251
65274.6
165.3141.499.4
41.341.23.9
42.142.04.2
42.441.442.242.340.938.2
42.443.341.2
43.444.742.341.940.4
40.240.13.4
41.439.242.136.343.738.641.842.541. 942.337.8
42.841.541.442.038.336.642.737.5
42.543.140.941.737.440.936.2
37.938.8
108. 62118. 72133. 5691.4990.73
112. 94130. 06118. 30129. 47107. 12141. 48109. 7886.46
2,371253
64475.1
151.2142.497.4
41.441.43.9
42.242.24.3
42.440.842.042.340.737.8
42.443.441.5
43.945.443.142.040.4
40.340.33.4
41.337.942.336.443.538.542.042.342.042.438.2
41.841.237.442.436.435 139.635 9
42 142.442 041 837.140.835.9
37 438.2
109. 71119. 43133. 5689.7690.30
112. 94129. 83118. 72130. 20108. 32144. 87110. 8886.46
i 2, 5121254
P645P 75.5
146.5143.899 4
41.741.44.0
42.642.24.4
42.941.242.642.241.438.5
42 644.242.0
44.145 343.742.040.5
40.440 23 4
41 439.042 336.243.839.142.141.741.742.839.2
42 841 841 242 937 136 438 937 0
42 242 740 541 537.741 236 7
37 438 5
110. 92120 98136. 8589 4092 02
112 25132 48119. 71133. 48110 04145 53111 3087.48
2,375251
P633P70.3
132.5140.896.9
41.241.53.7
42.142.44.1
42.740.941.041.641.940.1
42.043.741.3
43.343.744.042.039.6
39.840.23.1
40.738.141.835.742.838.141.741.841.842.138.8
42.242.140.742.736.535.639.336.2
41.741.639.941 637.140.835.9
37.438.1
110. 00119. 99135. 3688. 7588.15
110. 66135. 34118. 02132. 41108. 21142. 46111. 7287.12
2,400252
p 631p 70.7
126.4143.2
95.9
41.341.63.8
42.142.44.2
42.240.441.241.442.040.3
42.244.041.4
42.943.243.642.240.2
40.240.63.3
40.839.642.336.643.138. 541.941.741.642.039.2
42.141.740 742 336.335 538.136 3
41 842.340 641 637.040.735 8
37 238 1
110.27120. 41132. 9388.4888 58
110. 54136.08119. 00133. 76108. 47141. 14112. 2588.44
2,429255
P631P 71.3
' 139. 0' 144. 7'•97.1
41.441.5'3.842.242.34.2
'41.8'40.6
41.5'42.0
42.1'40.6
42.244.141.3
'42.742.9
'43.442.2
'40.4
40.240.43.3
40.538.242.336.943.338.842.041.941.9
'42.038.5
'42.6'41.641.1
'43.037.736.8
'40.9'37.2
42.042.0
'40.3'41 0'36.9
40.7'35.7
'37 438.1
110. 95120. 69
'131.67' 88. 51
89.64'112.56
137. 25119. 85134.51107. 79
'140.06112. 67'88.88
2,462256
P 636p 71.8
' 146. 5' 146. 1'87.8
41.241.5'3.942.242 .44.3
'42.1'41.0'40.9'42.0'42.3
41.1
42.143.8
'41.1
'43.043.6
'43.0'41.9'39.7
'39.8'40.3'3.340.4
'37.9'41.4'36.1
43.2'38.5'42.4
42.6'42.6'41.7'37.8
'41.742.534.642.737.035.840.236.4
42.041.840.141 136.9
'40.635.7
37.238.0
'111.24'121.54'132.62' 91. 84' 88. 75
'113.82'138.74'119.99'134.03'107.68'141.47'112.29' 87. 74
' 155. 3'148.3' 101. 9
41.541.44.0
42.342.24.4
42.141.841.442.342.2
42.644.141.1
42.7
43.642.540.0
40.340.33.4
40.937.942.336.643.738.842.242.342.142.238.5
42.7
37.1
36.940.735.7
112. 05121. 82132. 1994. 4790.67
115. 06137. 99121. 84135. 83108. 09140. 48114. 3388.80
'Revised. p-Preliminary. » Average for 11 months.i Includes Post Office employees hired for the Christmas season; there were about 140,000
such employees in the United States in Dec. 1965.© Effective Jan. 1965, data reflect change in definition of class I railroads (to $5 million or
more annual railway operating revenues). The index (back to 1963) has been adjusted forcomparability, whereas the number of employees has not.
! See corresponding note, bottom p. S-13. 9 Includes data for industries not shownseparately.
Digitized for FRASER http://fraser.stlouisfed.org/ Federal Reserve Bank of St. Louis

June 1966 SURVEY OF CURRENT BUSINESS S-15
Unless otherwise stated, statistics through 1964and descriptive notes are shown in the 1965edition of BUSINESS STATISTICS
1964 1965
Annual
1965
Apr. May June July Aug. Sept. Oct. Nov. Dec.
1966
Jan. Feb. Mar. Apr. May
EMPLOYMENT AND POPULATION—Continued
HOURS AND EARNINGS— ContinuedAverage weekly gross earnings per production
worker on payrolls of nonagric. estab.f— Con.All manufacturing establishments f— Continued
Nondurable goods industries dollarsFood and kindred products _ _ doTobacco manufactures _ ' _ _ _ _do-Textile mill products doApparel and related products _ _ doPaper and allied products doPrinting, publishing, and allied ind _ doChemicals and allied products _ _ _do.Petroleum refining and related ind__ _ _ d o _ _ _Rubber and misc. plastics products doLeather and leather products .,_ do
Nonmanufacturing establishments : tMining 9 do
Metal mining doCoalmining _ _ _ do_Crude petroleum and natural gas. do
Contract construction doGeneral building contractors doHeavy construction. __ _ _ do._ _Special trade contractors do
Transportation and public utilities:Local and suburban transportation doMotor freighttransportationandstorage.doTelephone communication _ - doElectric, gas, and sanitary services do _ • _
Wholesale and retail trade _ doWholesale trade- _ _ _ _ _ _ _ __ do _Retail trade do
Finance, insurance, and real estate:Banking doInsurance carriers - do
Services and miscellaneous:Hotels, tourist courts, and motels _ _ d o _ _ _Laundries, cleaning and dyeing plants, do _ _
Average hourly gross earnings per productionworker on payrolls of nonagric. estab.:f
All manufacturing establishments t dollars. _Excluding overtimed1 do
Durable goods industries—- _ _ _ -do _Excluding overtimed1 —do
Ordnance and accessories do__ _Lumber and wood products doFurniture and fixtures doStone, clay, and glass products. _doPrimary metal industries _ _ _ _do_._
Blastfurnaces, steel and rolling mills doFabricated metal products doMachinery—. doElectrical equipment and supplies. _. do _ " _Transportation equipment 9 — - -do
Motor vehicles and equipment . doAircraft and parts. _ do
Instruments and related products. _ _ _do__Miscellaneous mfg. industries _ do
Nondurable goods industries. doExcluding overtimed1 -- do
Food and kindred products _ _ _ d o _ _ _Tobacco manufactures doTextile mill products _ _ _ _ _ .do _Apparel and related products . doPaper and allied products _ doPrinting, publishing, and allied ind doChemicals and allied products _ do__ _Petroleum refining and related ind do
Petroleum refining. __ ... __ do__Rubber and misc. plastics products __ doLeather and leather products do
Nonmanufacturing establishments^Mining 9 _ __ __ ... __do
Metal mining doCoal mining doCrude petroleum and natural gas _ do
Contract construction. _ _ _ _ _ _ _ _ _ d oGeneral building contractors doHeavy construction. _ __ __ _do__ _Special trade contractors do
Transportation and public utilities:Local and suburban transportation. _ _ -doMotor freight transportation andstorage.doTelephone communication doElectric, gas, and sanitary services . do
Wholesale and retail trade doWholesale trade __ _ _ _ __-do ._ _Retail trade do
Services and miscellaneous:Hotels tourist courts and motels doLaundries, cleaning and dyeing plants— do
•Revised. * Preliminary. ° Average for 11t See corresponding note, bottom p. S-13.
90.9197.1776.0573. 3964.26
109.57114. 35116. 48133. 66104.9068.98
117. 74122. 54126. 82113. 05132. 06122. 79131. 78138. 35
104. 16124.02105. 32125. 2574.28
102. 5664.75
76. 6792.01
49.5455.73
2.532.442.712.603.022.112.052.533.113.412.672.872.513.093.213.022.542.082.292.212.371.961.791.792.562.972.803.193.372.541.82
2.812.96
-3.262.663.553.433.233.78
2.482.962.623.041.962.521.75
1.291.44
months.
94.6499.8779. 5977.9866.61
114. 22118.12121. 09138. 42109. 6271.82
123. 52127. 71137. 38115.90138. 01128. 16137. 50144. 65
107. 78130. 48109. 08131. 2476.53
106. 4966.61
79.2495. 12
51. 1758.98
2.612.502.792.673.122.172.122.623.183.462.762.952.583.213.343.142.612.132.362.272.432.101.871.832.653.062.893.283.472.611.88
2.923.07
«3.452.743.693.553.373.92
2.563.072.703.172.032.611.82
1.351.52
92.2098. 7477.9675.0363.72
109. 72115. 67120. 84139. 07104. 4569.56
120. 51125. 33134. 11114. 66132. 49124. 24126. 72139. 76
106. 50126. 46106. 66130. 0075. 58
105. 1566.06
79.2494.49
49.9059.10
2.602.502.782.673.082.132.092.59
• 3.203.482.732.912.563.173.313.092.592.122.342.262.452.191.831.792.603.022.853.283.462.561.88
2.893.023.432.733.613.493.203.85
2.563.042.683.142.012.591.80
1.321.50
94.00100. 4581.1076.5465.52
112.66117. 04120. 69137. 80107. 5971.44
123. 97127. 68138.40117. 15140. 16129. 54139. 86147. 04
109. 06129.55107. 87131. 1476.33
106. 7566. 43
78.8694.86
51.6560.19
2.612.502.792.663.102.162.102.613.173.432.762.952.573.193.323.122.602.132.352.262.452.181.841.802.623.042.863.253.432.581.88
2.913.043.462.753.653.523.333, 89
2.563.072.693.162.032.611.82
1.371.52
94.47100. 5383.1677.5266. 61
114. 31117. 43120. 96137. 38109. 4672.19
123.97126. 77142. 27113. 97139.08127. 78140. 53145. 86
109. 06131. 27107. 33129. 4776.56
105. 9367.16
78.4494.74
50.9059.58
2.612.502.792.673.102.182.102.613.193.462.762.952.583.193.323.122.622.142.352.262.442.201.851.822.643.052.883.243.452.601.88
2.913.043.472.723. 663.523.373.90
2.563.062.693.152.022.591.82
1.351.52
94.87100. 98
82. 7277.6466.43
114. 65117. 12120. 22139. 10109.2571.80
122.96128. 21134. 46116. 03140. 50129. 15143. 38147.04
108. 97131. 27108. 40130. 5177.95
106. 6068.25
79.2495.74
52.1359.28
2.612.502.792.673.122.182.112.623.203.472.752.942.583.173.293.112.612.132.362.272.412.201.881.822.663.052.893.253.452.621.86
2.903.06
2.733.643.503.353.89
2.573.062.673.162.032.601.82
1.341.52
<?D9 In
95.1199.1978. 0779.1967. 53
115. 18118. 81121. 35138. 35109. 8872.19
126. 14127. 71141.98117. 12143. 15131. 33148. 43148. 96
110. 17132. 62108. 27130. 6077.75
106. 6068.07
79.2495. 86
51.7458.67
2.592.492.772.653.132.202.122.633.173.432.742.942.573.163.283.132.612.122.362.262.392.061.891.832.663.072.913.243.432.611.88
2. 923.073.482.733.683.543.423.92
2.583.072.683.172.032.601.82
1.331.52
erived beludes d
95.68100. 1978.4178.6267.33
116.48120.28123. 65142.68110. 4671.82
124. 66131.57135. 29116. 47138. 75128. 52138. 63145. 27
109. 56133. 92112. 75133.8677.25
106. 9067.53
79.1895. 86
51. 6559.06
2.632.512.812.683.132.212.142.653.203.492.782.972.603.233.363.152.612.132.382.282.421.991.891.862.693.102.933.283.482.631.90
2.943.143.462.763.743.613.443.98
2.593. 102.733.212.062.621.85
1.371.53
y assumiata for in
95.68100. 1977.6279.9967.52
117. 12119. 66122. 06141. 10112. 1071. 82
126. 26130. 31143. 24115. 92144. 01132. 49149. 45150.00
110. 08133. 18111.66134. 6977.42
107.5767.33
80.3595.86
52.3060.14
2.632.522.822.683.152.212.152.673.183.472.792.992.603.263.393.182.622.142.382.282.421.981.901.862.683.102.923.323.522.651.90
2.953.143.462.763.763.623.504.00
2.593.092.733.232.072.631.86
1.381.55
ng thatiustries i
96.32100. 7780.3580.7967.70
116. 58118.97123. 06142.97111. 9472.58
123. 73128.96129. 78117. 87136.14126. 71135. 83142. 52
109.04131. 44115. 50135. 4376.80
108. 1267.13
80.3596.49
51.9958.83
2.652.532.832.693.152.202.152.673.193.472.803.002.613. 303.443.212.642.142.392.292.442.121.911.862.683.092.933.383.592.641.90
2.963.133.472.783.743.613.433.97
2.593.102.753.242.072.651.87
1.391.54
overtimelot show
96. 96101. 8483.0780.7967.33
117. 82121. 60123. 35140.53113. 4274. 87
127. 12131. 67142. 96119. 69139. 50132. 13131. 87148. 00
108. 88132. 37112. 59134. 0577.29
109. 5967.90
80.3596.87
52.3659.68
2.662.542.842.703.192.172.162.663.203.502.813.022.623.303.433.232.652.162.402.302.462.131.911.862.693.112.933.373.572.651.91
2.973.153.472.793.763.633.394.00
2. 583.102.783.232.052.661.85
1.401.55
hours <n separal
95. 52100.9482.3079.8466.05
115.13117. 73122. 18140. 87111.1474.11
126. 18132. 19142. 04121. 27137. 97129. 23132. 44145. 89
108. 00128. 54110. 12135. 2077.54
108. 9467.49
82.2897.73
51.9959. 44
2.672.552.852.723.172.172.152.663.233.532.813.032.623.293.403.252.662.202.402.312.482.161.911.852.693.092.933.373.552.641.91
2.993.143.492.843.783.633.374.03
2.593.092.763.252.092.671.88
1.391.56
are paidely.
96. 48101. 5988.3181. 2268.81
115. 94119. 74123. 19140. 95110. 8875. 26
126. 30130. 94142.45120. 13138. 30129. 93130. 68146. 65
109. 10132. 40112. 87135.6277.70
109. 0867.30
81.4798.74
52.0859.06
2.672.562.862.723.152.192.152.673.243.542.823.042.623.293.393.262.662.202.402.312.492.231.921.882.693.112.943.383.562.641.92
3.003.143.502.843.813. 663.434.04
2.613.132.783.262.102.681.881.401.55
at the r
96.88'101.25' 84. 80
81.2269. 37
'116.91121. 06122. 64141. 62
'110.46' 73. 92
127.37129. 79'143.44'121.69
142. 88134.32
'138.65'149.92
'109. 62131. 88
'111.63'133.25
77. 49109. 4867.47
81. 84' 98. 47
' 51. 9959. 82
2. 682.562.86
'2.723.15
'2.182.16
'2.683.263.562.843.052.613.283.373.262.67
'2.202.412.31
'2.50'2.22
1.921.88
'2.703.122.923.383.57
'2.63'1.92
2. 993.12
'3.492.833.793.653.394.03
'2.613.142.773.252.102.691.891.391.57
ate of til
'96.71'102.21' 85. 65
79. 90' 67. 51
'117.50'120.12'124.66'146.12'110.51' 72. 95
'122.60134. 30117. 64122. 12140. 60131. 74137. 48147. 42
110. 88131.25111. 08133. 9977.86
110. 0367.47
81.9998.74
52.4560. 04
'2.70'2.58'2.88' 2. 74'3.15'2.24
2.17' 2. 71'3.28
3.59'2.85'3.06' 2. 62'3.29
3.41'3.25'2.68'2.21
2.432.33
' 2. 532.261. 93
'1.87'2.72'3.12
2.94'3.43'3.63'2.65'1.93
'2.943.163.402.863.803.683.424.05
2.643.142.773.262.112.711.891.411.58
ne and <
97. 93103.8986.4181.6468.44
119. 30122.22124.49144. 24111.4174. 69
129. 81
141.35
78.23111.1167. 83
2.702.582.882.743.142.262.192.723.27
2.863.082.633.29
3.252.692.222.432.332.542.281.931.872.733.152.953.413.612.641.94
3.04
3.81
2.122.731.90
me-half.
Digitized for FRASER http://fraser.stlouisfed.org/ Federal Reserve Bank of St. Louis
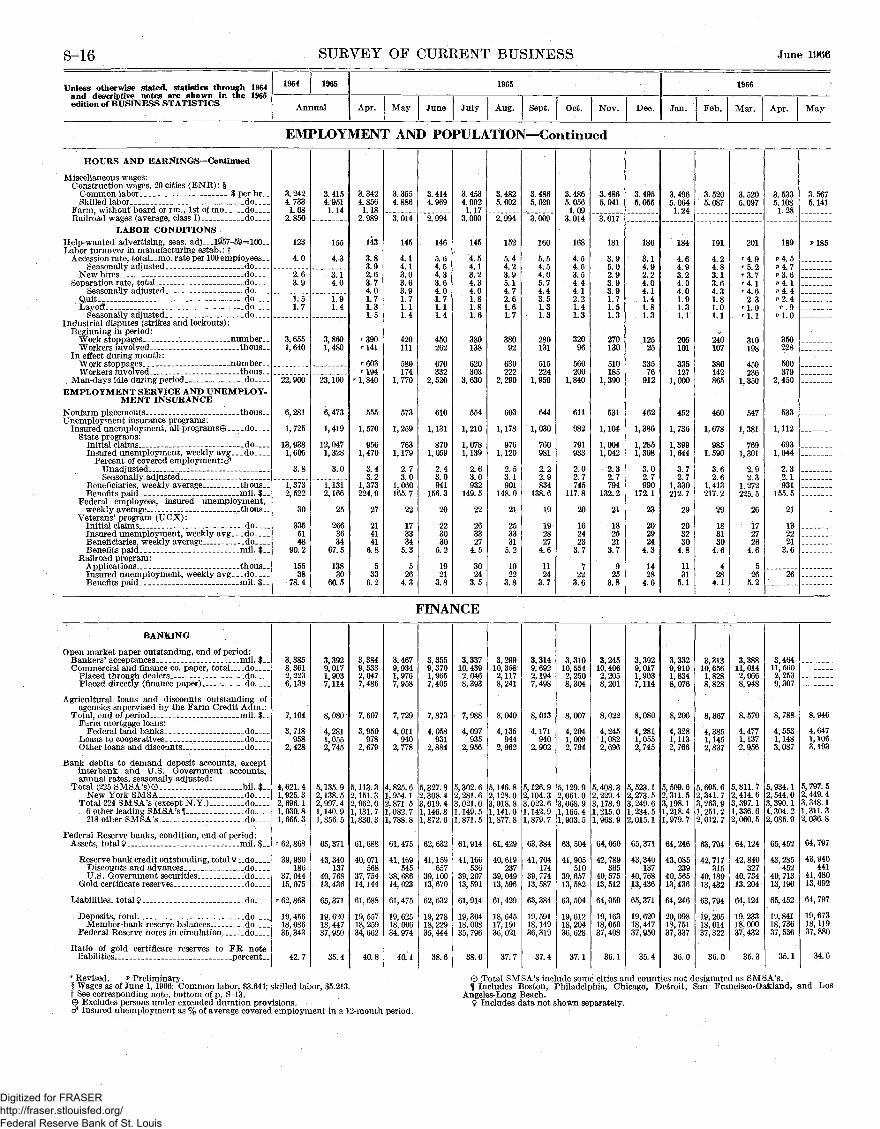
S-16 SURVEY OF CURRENT BUSINESS June 1966
Unless otherwise stated, statistics through 1964and descriptive notes are shown in the 1965edition of BUSINESS STATISTICS
1964 1965
Annual
1965
Apr. May June July Aug. Sept. Oct. Nov. Dec.
1966
Jan. Feb. Mar. Apr. May
EMPLOYMENT AND POPULATION—Continued
HOURS AND EARNINGS— Continued
Miscellaneous wages:Construction wages, 20 cities (ENR): §
Common labor _ _$perhrSkilled labor _ _ _ _ _ _ _ _ _ _ _ _ d o
Farm, without board or rm., 1st of mo _doRailroad wages (average, class I) _ _ _ d o
LABOR CONDITIONSHelp-wanted advertising, seas, adj.— 19*57-59 =100__Labor turnover in manufacturing estab.: f
Accession rate, total mo. rate per 100 employeesSeasonally adjusted do __
New hires - doSeparation rate, total _ _ do
Seasonally adjusted _ _ _ _ d o _ _ _Quit doLayoff - - do
Seasonally adjusted __ _ _. _ _ do ___Industrial disputes (strikes and lockouts):
Beginning in period:Work stoppages number-Workers involved.-. _ _ __thous__
In effect during month:Work stoppages _ -_ numberWorkers involved _ _ _ _ __thous__
Man-days idle during period doEMPLOYMENT SERVICE AND UNEMPLOY-
MENT INSURANCE
Nonfarm placements thousUnemployment insurance programs:
Insured unemployment, all programs© doState programs:
Initial claims - - doInsured unemployment, weekly avg _ _ d o __
Percent of covered employment:^UnadjustedSeasonally adjusted
Beneficiaries weekly average thousBenefits paid - - mil. $
Federal employees, insured unemployment,weekly average thous
Veterans' program (UCX):Initial claims - - - _ _ _ _ do_Insured unemployment, weekly avg doBeneficiaries, weekly average _ _ doBenefits paid __mil. $
Railroad program:Applications thousInsured unemployment, weekly avg doBenefits paid mil. $
3.2424.7331.08
2.850
123
4.0
2 63.9
151.7
3,6551, 640
22 900
6 281
1 725
13, 9381,605
3.8
1 3732 522
30
3355148
90.2
15538
78 4
3 4154.9511.14
155
4 3
3 14 0
1 91 4
3,8601,480
23 100
6 473
1 419
12, 0471,328
3.0
1 1312,166
25
2663634
67.5
13830
60 5
3 3424.8561.18
2. 989
143
3.83.92 63.74.01 71.31.5
r390'141
'603^194
r 1 840
555
1 570
9561,470
3 43 2
1 373224 9
27
214141
6.8
533
6 2
3 3554.886
3.014
145
4 14.13 03 63.91 71 11.4
420111
580174
1 770
573
1 259
7631,179
2 73 0
1 060165 7
22
173334
5.3
526
4 3
3 4144 969
2.994
146
5 64.54 33 64.01 71 11.4
450262
670332
2 520
610
1 131
8701,059
2 43 0941
156 3
20
223030
5.2
1921
3 8
3 4534 9921.17
3.000
145
4 54.13 24 34.01 81 81.6
380138
620303
3 630
554
1 210
1 0781,139
2 63 0932
149 5
22
263327
4.5
3024
3 5
3 4825 002
2.994
152
5 44.23 95 14.72 61 61.7
38092
630222
2 290
603
1 178
9761,120
2 53 1901
148 0
21
253331
5.2
1022
3 8
3 4865 029
3.009
160
5 54.54 05 74.43 51 31.3
280131
515224
1 950
644
1 030
760981
2 22 9834
138 6
19
192827
4.6
1124
3 7
3 4865 0561 09
3.014
168
4 54.53 54 44.12 21.41.3
32096
560200
1 840
611
982
791933
2 02 7745
117 8
20
162423
3.7
722
3 6
3 4865 041
3.017
181
3 95 02 93 93.91 71 51 3
270130
510185
1 390
531
1 104
1 0041,042
2.32 7794
132 2
21
182521
3.7
925
3 8
3 4955 055
186
3 14.92 24 04.11 41.81.3
12525
33576
912
462
1 386
1 2851,308
3.02 7990
172. 1
23
202924
4.3
1428
4 6
3 4965 0641 24
184
4 64 93 24 04 01 91 31 1
205101
335127
1 000
452
1 736
1 3991 644
3 72 7
1 330212 7
29
203230
4.8
1131
51
3 5205 087
191
4 24 83 13 64 31 81 01 i
240107
380142865
460
1 678
9851,590
3 62 6
1 413217 2
29
183130
4.6
428
4 1
3 5905 097
201
T 4 9r 5 2r 3 7r 4 1T 4 6
2 3r 1 0r 1 1
310198
450236
1 350
547
1 381
7691 301
2 92 3
1 272225 5
26
172726
4 6
526
5 2
3 5335 1081.28
189
v 4 5?4 7p 3 6J » 4 1?4 4p2 4
p 9p 1.0
350228
500379
2 450
533
1 112
6931,044
2.32 1931
155.5
21
132221
3.6
26
3 5675 141
P185
FINANCE
BANKING
Open market paper outstanding, end of period:Bankers' acceptances mil. $__Commercial and finance co. paper, total do
Placed through dealers -_doPlaced directly (finance paper) do_ _ _ _
Agricultural loans and discounts outstanding ofagencies supervised by the Farm Credit Adm.:
Total, end of period --.mil. $__Farm mortgage loans:
Federal land banks__ _doLoans to cooperatives _doOther loans and discounts..- d o _ _ _ _
Bank debits to demand deposit accounts, exceptinterbank and U.S. Government accounts,annual rates, seasonally adjusted:
Total (225 SMSA's)O-_—- bil. $_.New York SMSA _ _ _ — _ — _ d o _ _ _ .
Total 224 SMSA's "(except N.Y.)___ d o _ _ _ _6 other leading SMSA'sf do218 other SMSA's— _ _ _ d o _ _ _ .
Federal Reserve banks, condition, end of period:Assets, total 9 —- —„_• mil. $_
Reserve bank credit outstanding, total 9 --doDiscounts and advances _ _ d o _ _ _U.S. Government securities. do___
Gold certificate reserves... d o _ _ _
Liabilities, total 9 - - _ -dQ___
Deposits, total doMember-bank reserve balances do
Federal Reserve notes in circulation _ d o _ _ _ .
Ratio of gold certificate reserves to FR noteliabilities.. percent-.
3,3858,3612, 223
7,104
3,718958
2,428
4,621.41,925.32, 696.11,030.81,665.3
r 62,868
39,930186
37, 04415, 075
r 62, 868
19, 45618, 08635,343
42.7
3,3929,0171,9037,114
8,080
4,2811,0552,745
5,135. 92,138.52,997. 41,140. 91,856. 5
65,371
43,340137
40,768
65,371
19. 62018,44737,950
35.4
3,3849,5332,0477,486
7,607
3,950978
2,679
5,113.32,151.32, 962.01,131.71,830.3
61,688
40, 071568
37, 75414,144
61, 688
19, 55718, 25934, 662
40.8
3,4679,9341,9767,958
7,729
4,011940
2,778
4,825.61,954.12,871.51,082. 71, 788.8
61,475
41,169545
38, 68614, 023
61, 475
19, 62518, 00634,974
40.1
3,3559,3701,9657,405
7,873
4,058931
2,884
5,327.82,308.43,019.41,146.81,872.6
62,632
41,159657
39,10013, 670
62, 632
19, 27818, 22935,444
38.6
3,337
2,0468,393
4,097935
2,956
5,302.62,281.63,021.01,149. 51,871.5
61,914
41,166536
39, 20713, 591
61, 914
19, 30418, 00835, 796
38.0
3,29910,3582,1178,241
8,040
4,135944
2,962
5,146.82,128.03,018.81,141.01,877.8
61,429
40,619237
39,04913, 596
61, 429
18, 64517,19136, 021
37.7
3,3149,6922,1947,498
8,013
4,171940
2,902
5,126.92,104.33,022. 61,142.91,879. 7
41, 704174
39,77413, 587
63,384
19, 59118,14936,319
37.4
3,31010, 5542, 2508,304
8,007
4,2041, 0092,794
5,129.92,061.03,068.91,165.41,903. 5
63, 504
41,905510
39,65713, 582
63, 504
19, 61218, 204
37.1
3,24510,4062,2058,201
8,022
4,2451,0822,696
5,408.32,229.43,178.91,215.01,963.9
64,050
42,789365
40, 57513,512
64,050
19,16318,05037,408
36.1
3,3929,0171,9037,114
4,2811,0552,745
5, 523.12, 273. 53, 249.61,234.52,015.1
65,371
43,340137
40,76813,436
65,371
19,62018,44737,950
35.4
3,3329,9101,8348,076
8,206
4,3281,1132,766
5,509. 62,311.53,198.11,218.41,979. 7
64,246
43,085239
40, 56513,436
64,246
20,09818,75137,337
36.0
3,31310,656"
4,3851,1452,837
5,605.62,341.73,263.91,251.22,012. 7
42,717315
40,18913,432
63,794
19, 20518, 01437,322
36.0
3,38811, 0142,066
8, 570
4,4771,1372,956
5,811. 72,414.63,397.11,336.62,060.5
64,124
42,840327
40, 73413,204
64,124
19, 23318,00037,432
5.3
3,46411,5602,2539,307
4,5531,1483,087
5, 934.12, 544. 03,390.11,304. 22, 085.9
65,452
43,285452
40, 71313,190
65, 452
19,84118,73637,536
35.1
4, 6471,1063,193
5, 797. 52, 449. 43, 348.11,311. 32,036. 8
64,797
43,940441
41,48013, 092
64, 797
19,67318,11937,880
34. €
••Revised. p Preliminary.§ Wages as of June 1, 1966: Common labor, $3.644; skilled labor, $5.213.t See corresponding note, bottom of p. S-13.© Excludes persons under extended duration provisions.cf Insured unemployment as % of average covered employment in a 12-month period.
O Total SMSA's include some cities and counties not designated as SMSA's..f Includes Boston, Philadelphia, Chicago, Detroit, San Francisco-Oakland, and Los
Angeles-Long Beach.9 Includes data not shown separately.
Digitized for FRASER http://fraser.stlouisfed.org/ Federal Reserve Bank of St. Louis

June 1966 SUKVEY OF CUKKENT BUSINESS S-17
Unless otherwise stated, statistics through 1964and descriptive notes are shown in the 1965edition of BUSINESS STATISTICS
1964 | 1965
End of year
1965
Apr. May June July Aug. Sept. Oct. Nov. Dec.
1966
Jan. Feb. Mar. Apr. May
FINANCE—Continued
BANKING- Continued
All member banks of Federal Reserve System,averages of daily figures:
Reserves held, total mil. $Required --. __doExcess _do_ __
Borrowings from Federal Reserve banks _ _ . do. ___Free reserves ._ -_do_ __
Weekly reporting member banks of Fed. Res. Sys-tem, condition, Wed. nearest end of yr. or mo.:
Deposits:Demand adjusted c? mil $Demand, total 9 _ _ _ __do
Individuals, partnerships, and corp d o _ _ _ _State and local Governments doU.S. Government _ _ _ do_ __Domestic commercial banks _ „ ; do
Time, total 9 _ _ _ _ _ _ doIndividuals, partnerships, and corp.:
Savings _ doOther time _ _ do
Loans (adjusted) , totalcf - -_ - - - do. __Commercial and industrial do_For purchasing or carrying securit ies_____do____To nonbank financial institutions _ _ _ do_ _Real estate loans. __ ___ doOther loans do
Investments, total doU.S. Government securities, to ta l__-__.__do
Notes and bonds... doOther securities do
Commercial bank credit (last Wed. of mo., exceptfor June 30 and Dec. 31 call dates) , seas, adjusted:
Total loans and investments© bil. $Loans O doU.S. Government securities. _ _ _ ___ doOther securities. _ do
Money and interest rates: §Bank rates on short-term business loans:
In 19 cities percentNew York City do7 other northern and eastern cities do11 southern and western cities do
Discount rate (N.Y.F.R. Bank), end of year ormonth percent--
Federal intermediate credit bank loans d o _ _ _ _Federal land bank loans doHome mortgage rates (conventional 1st mort-
gages) :New home purchase (U.S. avg.) percent..Existing home purchase (U.S. avg.) do
Open market rates, New York City:B ankers' acceptances (prime , 90 days) _ . doCommercial paper (prime, 4-6 months) .._do___.Finance Co. paper placed directly, 3-6 mo. doStock Exchange call loans, going rate do___ .Yield on U.S. Government securities (taxable):
3-month bills (rate on new issue) per cent ..3-5 year issues _ _ _ . _ _ _ do
Savings deposits, balance to credit of depositors:N.Y. State savings banks, end of period _ mil. $__U.S. postal savings f do
CONSUMER CREDIT!(Short- and Intermediate-term)
Total outstanding, end of year or month mil. $Installment credit, total do
Automobile paper doOther consumer goods paper doRepair and modernization loans doPersonal loans doBy type of holder:
Financial institutions, total.— _ _ _ _ doCommercial banks doSales finance companies doCredit unions _ doConsumer finance companies doOther _ _ do
Retail out lets, total _ _ doDepartment stores doFurniture stores doAutomobile dealers doOther do
Noninstallment credit, total doSingle-payment loans total do
Commercial banks doOther financial institutions. _ do _
1 21, 6091 21, 198
i 41112431168
68 045102, 57473, 6545,2394,563
12, 539
66,881
40, 69816, 407
102, 22742, 1196,6779,032
20, 00829,156
48,78327,67921, 97921, 104
267. 2167.161.438.7
2 4. 992 4. 752 5. 022 5. 30
4.002 4. 702 5. 45
2 5. 782 5. 93
3 3. 77»3.9733.83« 4. 50
8 3. 5493 4. 06
28, 260390
78, 44260 54825 19515 5933 532
16 228
53, 14125 09414 7626 4585,0781,749
7,4073 9221 152
3701 963
17 8946 9545 9501. 004
i 22, 7191 22, 267
145214541—2
69 723
103, 50775, 2695, 3553,866
12,429
78, 260
45, 36221, 258
117, 16550, 6296,420
10,91922, 54032 068
48 29924, 25219, 50224 047
294 0191.857.644.6
25.0624 8325.0925.34
4.5024.9425.43
2 5. 7625.89
34.22M.38s 4. 273 4. 69
33.95434.22
30,312309
87, 88468,565
28,84317 6933,675
18, 354
60, 27329, 17316 1387,5125, 6061,844
8,2924 4881, 235
4472 122
19 319
7 6826 5871.095
21, 51121, 145
366471
-105
64 74196, 13068, 5715,2695,266
10, 965
72,082
42, 14819, 052
105, 23444, 5976,5728, 703
20, 55929, 977
47, 43824, 51020, 84122, 928
277.3177.159.141.1
4.004. 885.43
5. 745.89
4. 194.384.254. 55
3.9324. 12
28, 883356
79, 23761,886
26, 23515, 2923,488
16, 871
54, 91126, 20014, 9916,7395, 2021,779
6,9753 7011,077
3951, 802
17 351
7 2776 2431,034
21, 47221, 147
325505
-180
62 606
97, 84067, 5215,5456,384
12, 046
72, 994
42, 54019, 679
107, 45045, 2706,8039,290
20, 84230, 47446,70824,02620,82322, 682
279. 4179.558.641.3
4.004.935.43
5.775.88
4.254.384.254. 75
3.8954.11
28,995350
80, 46962, 80726,71715, 4583,534
17, 098
55, 76226,67015, 1586, 8715, 2431,820
7, 0453 7451, 076
4051,819
17, 662
7 4006,3421,058
21, 70921,363
346528
-182
63, 809
103,55369, 6515,4108,664
12, 404
73, 817
43, 12820, 130
110, 92546, 8477, 4189, 830
21, 14929,326
47, 51524, 25420, 61923,261
282.8183.057.742.1
4.994.745.015.31
4.004.995.43
5.765.86
4.254.384.254.75
3.8104.09
29, 272342
81, 71763,85027,28015, 6483, 576
17, 346
56, 72627, 21415,3727,0325,2871, 821
7,1243 7851, 084
4171,838
17, 867
7 5466,4771, 069
21, 86321,513
350524
-174
64, 17194, 57268,0964,9005,022
10,86174, 764
43, 43320,542
108, 54846, 2825,7129,484
21, 36730,224
47, 24423,66720, 67723, 577
281.5182.756.442.4
4.004.985.43
5. 775.86
4.224.384.254.75
3.8314.10
29, 380338
82, 539
64, 70427,77915, 8183,604
17, 503
57, 53727, 70515, 5657, 1245,3341,809
7, 1673 8111,090
4251,841
17, 835
7 5396,4761,063
21, 61721, 187
430564
-134
63, 50596, 10168, 1895,1053,914
12, 566
75, 896
43, 82720, 990
111, 07146, 9876,224
10, 28921, 73930, 11347, 08622, 99220,32224, 094
286.1185.857.043. 3
4.004.985. 43
5. 765.86
4.144.384.254.75
3.8364.19
29, 498332
83,319
65,50828, 11115,9963,648
17, 753
58, 29628,10715, 7217,2355,3871,8467, 2123 8471,103
4311,831
17, 811
7 5756, 4971,078
21, 74021,356
384528
-144
64 133
97, 04868, 2804,9405,591
12,075
76,276
44,31921, 003
111, 75548, 1175,453
10,15422, 01230,55347, 02322, 83020,20224, 193
286, 2186.256.543.5
5.004.765.035.31
4.005.025.43
5.755.89
4.254.384.254. 75
3.9124.24
29,785327
83, 80165,979
28, 17516, 2293,664
17, 911
58, 70328, 34315, 8027,3105,4101,8387,2763 9101, 117
4331,816
17, 822
7 6006, 5201,080
21, 95821, 614
344490
-146
65, 012
100, 02871,3485,5722,442
13, 692
77, 170
44,80521, 342
112, 72748, 7785,587
10, 05822, 23130, 585
47, 76923, 99119, 94823,778
288 9188.057.043.9
4.005.015.43
5.755.87
4.254.384.324. 75
4.0324.33
29,845321
84,46566,51128, 39316, 4923,676
17, 950
59, 10528, 61815, 8767,3635,4221, 826
7,4063 9791,138
4381,851
17, 954
7 6246,5461,078
21, 95821, 589
369452-83
66, 175101, 20472, 1275,4293,789
12,97777,662
45, 09421, 511
114, 74149,1676,482
10, 31922, 42531, 245
47,79024, 11919, 55023, 671
291.5189.857.644.1
4.005.025.43
5. 805.91
4.254.384.384.75
4.0824.46
30,001317
85, 29167,16828,61216 7973,689
18, 070
59, 56728, 85515, 9637,4365, 4651,8487,6014 1011,167
4431,890
18,123
7 6486,5551,093
22, 71922, 267
452454-2
69,723
103, 50775,2695,3553,866
12,429
78, 260
45, 36221,258
117, 16550,6296,420
10, 91922,54032, 06848, 29924, 25219, 50224, 047
294.0191.857.644.6
5.275 085.325.46
4.505.025.43
5.785.91
4.554.654.604.97
4.3624.77
30,312314
87, 88468,565
28,84317 6933,675
18, 354
60, 27329,17316,1387, 5125.6061,8448,2924 4881,235
4472,122
19, 3197 6826,5871,095
22, 75022, 392
358402
-44
68,22099,64772,4155,5323,153
11,982
78,868
45,01522, 259
116,02550,4626,429
10,34922,63831,444
47, 55723,94218, 95723, 615
297.0195.057.444.6
4.50c5.06
5.43
5.815.97
4.754.824.825.07
4. 5964.89
30,442303
87, 02768,31428, 78917, 5663,634
18, 325
60, 20229,20116,1067,4475,5981,8508,1124 4191,208
4482,037
18,713
7 6666,5741,092
22,23321, 862
371478
-107
65 231
99, 18271,3715,5313, 147
12, 619
79,600
45, 06422, 961116, 93951,3156,249
10,41922, 73031,124
46,22022,41818,29623, 802
297 1195.556.345.3
4. 50c 5.15
5.43
5.855.97
4.864.884.885.25
4.6705.02
30, 574299
86, 56568,27928,89417, 3863,603
18,396
60,33129, 31216, 0727,4735,6211,853
7,948
451
18, 286
7 7316,6301,101
22, 16021, 855
305551
-246
66, 29297, 16270, 3135,6513,223
11,51281,001
45, 11124, 160
118, 41052, 6406,035
10, 61822, 86732, 019
45,25221,47417, 94523, 778
299. 9199.355.645.0
5.555.415.585.70
4. 50c 5. 17
5.48
5.906.01
4.965.215.025.41
4.6264.94
30,797292
87, 05968,827
29, 24817, 4503,597
18, 532
60, 86329,68416, 1067, 5935,6301,8507,964
459
18,232
7,7956,6761, 119
••22 528••22, 170
»-358626
>-268
67 921
101 08273,3035 4693 983
11, 807r81, 813
43 37726, 040
119, 494'52,495
6,66610, 78923, 04131 757
46 37121, 84918,06424 522
302 7201 055.945.8
4.505.265.49
5. 996.09
5.005.385.255. 50
4. 6114.86
30,496277
88, 18469,54329, 59717, 5973,602
18, 747
61, 53930,12716, 191^ 7115, 6701,8408,004
466
18, 6417 8366, 7171,119
22 48122 113
368722
—354
65 630102 61771,7726 0304 700
12 727
82 696
43 09327 133
121 72553 8396,784
10 92423 26032 786
45 36820, 70417 46924 664
304 3202 2
54 947.2
4.505.365.52
6.026.16
5.185.395.385.50
4.6424.94
230
r Revised. « Corrected.1 Average for Dec. 2 Average for year. 3 Daily average.cf For demand deposits, the term "adjusted" denotes demand deposits other than domestic
commercial interbank and U.S. Crovernment, less cash items in process of collection; forloans, exclusive of loans to domestic commercial banks and after deduction of valuationreserves (individual loan items are shown gross; i.e., before deduction of valuation reserves).
217-518 O-66-6
9 Includes data not shown separately.©Adjusted to exclude interbank loans.§For bond yields, see p. S-20.or on y e s , see p. -.^Monthly data are as of the following dates: 1965—Apr. 23; May 21; June 30; July 16; Aug.
13; Sept. 10; Oct. 8; Nov. 5; Dec. 3; 1966—Jan. 28; Feb. 25; Mar. 25; Apr. 22; May 20.J Revised monthly data prior to Mar. 1965 appear in the May 1966 Fed. Reserve Bulletin.
Digitized for FRASER http://fraser.stlouisfed.org/ Federal Reserve Bank of St. Louis

S-18 SURVEY OF CURRENT BUSINESS June 1966
Unless otherwise stated, statistics through 1964and descriptive notes are shown in the 1965edition of BUSINESS STATISTICS
1964 1965
Annual
1965
Apr. May June July Aug. Sept. Oct. Nov. Dec.
1966
Jan. Feb. Mar. Apr. May
FINANCE—Continued
CONSUMER CREDIT§— Continued
Total outstanding, end of year or month— Con.Nonmstallment credit— Continued
Charge accounts total mil. $Department stores doOther retail outlets doCredit cards r - do
Service credit doInstallment credit extended and repaid:
Unadjusted:Extended, total _ _ _ do_ __
Automobile paper doOther consumer goods paper doAll other _ _ - do
Repaid, total -- ---- -do. __Automobile paper doOther consumer goods paper doAll other _ do
Seasonally adjusted:Extended total do
Automobile paper doOther consumer goods paper _ _ _ _do_All other do
Repaid total doAutomobile paper doOther consumer goods paper _ _ _ do_ _ _All other _ _ _ do
FEDERAL GOVERNMENT FINANCE
Net cash transactions with the public: cfReceipts from mil. $Payments to doExcess of receipts or payments ( — ) doSeasonally adjusted, quarterly totals: t
Receipts from _ _ doPayments to doExcess of receipts, or payments ( — ) - do_
Receipts and expenditures (national income andproduct accounts basis), qtrly. totals, seas.adj. at annual rates: *
Receipts bilExpenditures doSurplus or deficit ( — ) do
Budget receipts and expenditures:Receipts, total __ - mil. $
Receipts, netf doCustoms do
Individual income taxes doCorporation income taxes doEmployment taxes doOther internal revenue and receipts do
Expenditures, total^f doInterest on public debt __ _ doVeterans' benefits and services doNational defense doAll other expenditures - do
Public debt and guaranteed obligations:Gross debt (direct), end of yr. or mo., total-bil. $_,
Interest bearing, total. doPublic issues _ do
Special issues _ _ _ _ _ _ _ _ doNoninterest bearing and matured.. do
Guaranteed obligations not owned by U.S. Treas-ury end of year or month bil $
U.S. savings bonds:Amount outstanding, end of yr. or mo__.doSales, series E and H doRedemptions do_ _
LIFE INSURANCE
Institute of Life Insurance:Assets, total, all U.S. life insurance companies i
bil $Bonds (book value) total doStocks (book value) total doMortgage loans, total do
Real estate doPolicy loans and premium notes doCash _ __ do
Payments to policyholders and beneficiaries inU S total mil $
Death benefits doMatured endowments doDisability payments do
Surrender values doPolicy dividends do
1 6, 300!909
1 4 756*635
1 4, 640
67, 50524, 43519, 47323, 597
61, 12121, 67617, 73721, 708
115 031120 340—5 308
114 5118 3—3 8
117, 22288, 6961 352
52 33425 04717 10621 382
96 94511 0395 484
52 26129 067
i 317. 941 313. 551 267 48i i4 301 46 08M.39
1 81
1 49. 894 615.25
1 14Q 471 gy 961 7 94
i 55 15i go g51 4 531 7 141 1.49i 5 26
10 757 84 533 5
898 7160 6Qfii n
1 833 72. 370. 3
i 6 7461968
i 5 055i 723
* 4, 891
75, 50827, 91421, 45426, 140
67, 49524, 26719, 35523, 873
123 376127 920—4 544
r?4 1123.3
.7
124 35496, 6791 646
56 10227 035I?' 26822 303
101 37811 6155 151
52 77332 582
i 320. 90i 316 52i 270 26
1 -I K K-l
i 46 26i 4 39
i 46
i 50. 464 495 44
11 416 64 831 4' 931 1163 0
1 AOQ Q
1 932 32! 519^ 9
5,210626
3 942642
4,864
6,5542,5371,6212,396
5,5311,9931,5102,028
6 2452,2991,6482,2985 5001 9751 4972 028
10 49210 476
16
11 4238,549
1396 9431 1871 3111 8438 268
948452
4 3512 526
316. 56312 21267 81
14 6344 404.35
66
50.0839
.49
152 2768 856 62
56 6952 214 577 311 207 02
922 0398 682 012 9oq c
162 1182.' 9
5,453647
4 142664
4,809
6,2532,4191,6842,150
5,3301,9371,5181,875
6,1672,2491,7312, 187
5 5111 9871,5691,955
11 85710 5671 290
11, 5827,268
1286 067
5202 8612 007
8 116955450
4 3172 486
319. 22314. 17266 33
14 7047. 835.05
61
50.1136
.43
152 9269 126 67
57 0052 484 587 361. 197 00
878 5374 3
75 212 7o-i n
165 2169! 9
5,528627
4 218683
4,793
6,8392,6461,8042,389
5,7962,0821,6142,100
6,1962,2851,7192,192
5 6012,0071,5902,004
15 33411 5713 763
32, 64632 395
251
124 4120. 6
3.8
15, 52513, 404
1455 3246 5971 4062 0539 070
989476
4 9492,700
317. 27313. 11264 46
14 5948 654.16
59
50. 1536
.46
153 5069* 166 74
57 3852 814 617 411.236 97
950 2399 380 914 8OQ f\
162 9203! 3
5,534591
4,217726
4,762
6,5372,5241,7772,2365,6822,0251,6072,050
6,3832,3551,8182,210
5,6592,0071,6082,044
4 9819 696
—4 714
5,0703,807
1371 661
727629
1 915
7,2401,000
2103 8482,261
316. 58312. 20264. 41
14 3947. 79
4.38
47
50.23.39.46
154 4269 636 75
57 6653 044 647 461.287 00
911 6388 071 112 384 fi
157 1198. 5
5,498595
4 149754
4,738
6,4932,4011,7892,303
5,6882,0681,6112,009
6,3852,3721,8162,1975 7292 0681,6621,999
11 59512 299-705
10, 5867,350
1455 540'482
2 5011 918
8 990966483
4 3723,261
318. 24313. 90264. 12
14 9249! 784.34
.50
50.26.37.46
155 1969 826 80
58 0253 364 657 511.317 09
935 5400 467 912 585 5
158 8210.4
5,496647
4,078771
4,726
6,0852,0881,8492,148
5,6162,0241,6171,975
6,4342,3851,8592,190
5,7482,0561,6382,054
12, 59911,0901 509
30, 64632, 104-1,458
122.7125.6-2.9
12,64010, 999
1595 4224 2361 1201 7039 452
966474
4,5313,482
316. 75312. 36264. 2915 4048.074.39
52
50. 28.34.45
156 0469 846 96
58 4153 72
4 687 551.277 34
954 2398 8
74 614 3aa 7
164 5215. 3
5, 645682
4,221742
4,685
6, 2472,3181,8992,030
5,7142,0991,6361,979
6,4252,3381,9072,180
5,8052,0801,6702,055
4,28310, 518-6, 234
4,3273,295
1531 508
625461
1 580
8, 750962486
4,4772,878
318. 90314. 56267. 60
15 1846. 964.34
.49
50. 36.37.41
156 8970 107 07
58.8254 10
4.687 591.257 38
918.9388.875.813 0
83 5148.5209.3
5,740'725
4,291724
4,735
6,6082,4102,0042,194
5.9552,1931,7002,062
6,5302,4801,8732,1775,8312,1481,6832,000
10 72812, 312
—1 584
10, 2208,106
1645 934
5071,5082 107
9,105963526
4 5183,320
321. 71
317. 36270. 30
15 6547.054.36
.46
50.42.34.40
157 6470 227 13
59 2854 52
4.707 621.367 33
879 4381.9
74.612 7
85 3148.3176.6
6,746968
5,055723
4,891
7,5192,3282,6572,534
6,1202,0971,7602,263
6,4892,4431,8622,184
5,8552,1071,7202,028
10, 83811, 121
—283
30, 68533, 098-2,413
125.3127.0-1.8
10, 8079,553
1403 7054 315
8031 844
9,4261,005
2075,0913, 155
320.90316.52270. 2615 5146. 264.39
.46
50.46.33.42
158 7069 977 24
60 0255 20
4.687 671.487 63
1 246 3480 1
74 815 9
85 0174 8415. 7
6,107855
4 509743
4,940
5,5862,0011,6841,901
5, 8372,0551,8111, 971
6, 5442,3401, 9832,2215,9472,1151,7782,054
7 09111 233
—4 142
7,1376,453
1364 140
682423
1 756
8,8091,035
5304,6052,712
322. 00317.60273.2415 5344.36
4.40
.42
50.44.47.65
159 6370 507 29
60.5255 68
4.697 721.307 60
964.3411.885.114 4
104 5162.1186.4
5,505
7465,050
5,5172,0841,5271,9065,5521,9791,7071,866
6,4922,3401,9572,195
5,9542,1351,7812,038
12 40011,2641 136
12, 4328, 335
1296 986
5733,1171 6278,156
976513
4,4832,200
323. 31318. 92273. 1415 8245.784.39
.43
50.45.35.46
160 2370 667 29
60.8855 99
4.707 771.307 63
909. 8403.577.912 2
90 0157.0169.2
5,393
7555,044
6,8652,6761,8902,299
6, 3172,3221,8262,169
6,6732,4791,9592,235
6,0242,2161,7082,100
13, 80412, 0861,718
32, 68436, 908-4, 224
' 133. 8133.6
' .2
15,70111, 297
1684,3767, 2442,0401,873
10, 1931,035
525r 5, 600'3,038
321. 00316. 58270. 62
15 6445.96
4.42
.46
50.49.46.54
160 8070 987.27
61.2956.324.727.851.027 67
1,139.5503.094.816 6
100 3196. 5228.3
5 670
7655,135
6,6582,4861,8742,2985,9422,1371,7272, 078
6,5052,3021,9582,245
5,9742,1451,7292,100
11, 85311, 325
528
13, 0729,929
1517,3412,4401,3201,821
8,3621,013
2894,9952,078
319. 58315. 22270. 3015 4744.924.36
.47
50.52.43.51
161 4871.157.17
61.7156.65
4.737.96.90
7 74
984.2418.182.313.6
90 9178.6200:7
322. 36
317. 93269. 12
48.804.43
.47
50.58.41.47
T Revised. *> Preliminary.1 End of year; assets of life insurance companies are annual statement values.§ See note "J" on p. S-17. cf Other than borrowing. { Revisions prior to 1965 for cash
transactions with the public (seas, adj.) and for Jan. 1964-Mar. 1965 for assets of all life insur-ance cos. will be shown later.
*New series; annual data for 1929-64 and quarterly data for 1946-64 are shown in the Aug.1965 SURVEY. IData for net receipts and total expenditures reflect exclusion of certaininterfund transactions.
Digitized for FRASER http://fraser.stlouisfed.org/ Federal Reserve Bank of St. Louis

June 1966 SURVEY OF CURRENT BUSINESS S-19
Unless otherwise stated, statistics through 1964and descriptive notes are shown in the 1965edition of BUSINESS STATISTICS
1964 1965
Annual
1965
Apr. May June July Aug. Sept. Oct. Nov. Dec.
1966
Jan. Feb. Mar. Apr. May
FINANCE—Continued
LIFE INSURANCE— Continued
Life Insurance Agency Management Association:Insurance written (new paid-tor insurance) :
Value estimated total! mil. $Ordinary! doGroup and wholesale _ . _ _ do_ .Industrial __do
Premiums collected:!Total life insurance premiums _ do
Ordinary doGroup and wholesale _ do- _ _Industrial do
MONETARY STATISTICS
Gold and silver:Gold:
Monetary stock, U.S. (end of period).. .mil. $__Net release from earmark § doExports . thous. $._Imports do
Production, world total. _ ... mil. $South Africa doCanada . _ doUnited States _ _ do.
Silver:Exports thous. $Imports _ _ do_Price at New York dol per fine ozProduction:
Canada ; _ _ thous. fine ozMexico doUnited States ._ _ . do.
Currency in circulation (end of period) bil. $
Money supply and related data (avg. of daily fig.) :!Unadjusted for seas, variation:
Total money supply bil. $Currency outside banks doDemand deposits do
Time deposits adjusted^ doU.S. Government demand deposits do. _
Adjusted for seas, variation:Total money supply __ _ _ _ do.. _
Currency outside banks doDemand deposits _ do
Time deposits adjusted^. do_ v _
Turnover of demand deposits except interbank andU.S. Govt., annualrates, seas, adjusted:
Total (225 SMSA's) 9 -.ratio of debits to deposits..New York SMS A do
Total 224 SMSA's (except N.Y.)_ _ do6 other leading SMSA'sc? - do218 other SMSA's _ _ _ _ do
PROFITS AND DIVIDENDS (QTRLY.)
Manufacturing corps. (Fed. Trade and SE O.-Net profit after taxes, all industries mil. $..
Food and kindred products doTextile mill products doLumber and wood products (except furniture)
mil. $_.Paper and allied products doChemicals and allied products doPetroleum refining _ doStone, clay, and glass products doPrimary nonferrous metal doPrimary iron and steel doFabricated metal products (except ordnance,
machinery, and transport, equip.) mil. $Machinery (except electrical) doElec machinery, equip and supplies doTransportation equipment (except motor
vehicles, etc ) mil $Motor vehicles and equipment doAll other manufacturing industries do
Dividends paid (cash) , all industries doElectric utilities, profits after taxes (Federal Re-
serve) mil $Transportation and communications (see pp. S-23
and S-24).
SECURITIES ISSUED
Securities and Exchange Commission:Estimated gross proceeds, total mil. $..
By type of security:Bonds and notes, total do
Corporate doCommon stock doPreferred stock. do
105, 00873, 13024, 5667,312
14,38510,7682,2251,391
15,388256
422,74440,888
21,395.01, 019. 8
133.451.4
144, 12166,3111.293
29,93341,71645, 872
39.6
156.333.5
122.8119.4
5.8
44.789.532.941.429.2
23,2111,692
507
314754
2,8574,094
681758
1,225
8422,0011,512
5462,8082,617
10, 810
2,385
37,122
34,03010, 8652,679
412
1139,81680, 582
1 51, 8767,358
15,03211,250
2,4191, 364
13, 733-198
1,285,097101, 669
1, 069. 6125.6
54, 06164, 7691.293
31, 91640, 33344,423
42.1
162.635.2
127.4137. 6
6.4
48.499.635.444.931.4
27, 5211,896
694
3388753
3,1884,442
761970
1,401
1,1512,4991,926
7213,496
5 3, 285
11, 979
2,568
40, 108
37, 83613, 7201,547
725
9,1096,8881,595
626
1,204914188102
14, 41013
58, 6371,779
88.011.3
5,3024,9321.293
2,3792,9944,599
38.8
161.634.5
127.1134.0
5.6
161.134.7
126.4133.5
48.4100.035.244.531.2
3,050
2,8871,070
12735
8,9286,6881,549
691
1,218924188106
14, 290124
267, 9562,465
89.210.4
9,2734,3641.293
2,6323,2903,527
39.2
157.634.6
123. 0135.4
9.7
160.034.9
125.1134.6
47.096.034.744.330.6
3,160
2,7121, 324
38465
9,4437,0111,799
633
1,22393019598
13,93499
126, 4071, 562
90.110.7
2,1013,7631. 293
2,8842,9033,418
39.7
159.634.9
124.6136.6
9.3
161.835.0
126.8135.9
50.9107. 036.345.532.2
7,215454166
93188853
1,088220270411
325689455
1871,057
759
2,942
597
4,297
3,9881,729
154155
8,5876,4571,535
595
1,254954194105
13, 857-157
159, 9472,153
90.810.0
8483,9171.293
2,5493,8383,159
39.9
160.935.4
125.6138.3
9.1
162.535.2
127.3137.6
49.3104.935.144.431.1
2,936
2,8141,322
7844
8,7966,6541,537
605
1,222915204103
13, 85743
108, 02817, 794
91.010.5
4,1995,7161.293
2,5073,6473,231
40.2
160.535.5
125.0140.2
7.4
162. 735.4
127.3140.1
48.499.435.544.931.7
2,354
2,262837
7815
9,7076,7002, 423
584
1,191898193100
13, 858142
126, 3241,539
89.710.2
1,5346,1041.293
3, 0433,5662,957
40.4
163.235.6
127.5141.4
5.6
164.335.6
128.7141.6
47.295.435.344.131.4
6,590522176
105184789
1,079253214312
304652471
184469876
2,623
626
3,029
2,8611,370
7692
i 37,6756,919
130,131625
1, 264962196106
13, 85718
101, 2751,888
90.410.5
4,0464,7221.293
3,0203,6773,871
40.8
165.836.0
129.8143.5
5.0
165.635.9
129.7143.6
47.496.335.143.831.4
2,661
2,537861116
8
9,9697,1192,209
641
1,248934211104
13,80581
101,33556,027
10.4
5,07210, 8091.293
2,801
4,104
41.8
167.436.5
130.9144.4
4.0
165.736.1
129.6145.5
50.5104.737.047.632.1
6,340
6,0831,142
16592
11,8927, 4233,937
532
1,5321,026
278228
13,733-72
67,84210, 102
3 Igl 110.2
3,9087,6881.293
2,8673 6, 825
3,625
42.1
172.037.0
135.0145.3
4.5
167.436.3
131.2147.0
50.6102.237.547.733.3
7,484511201
84219815
1,214206251290
278658594
203985976
3,756
632
2, 948
2,7891,487
7286
7,9646,0101,389
565
1,251953188110
13, 732-37
10,8773,037
9.8
4,6166,4751.293
2,3083,5803,496
41.1
173.036.5
136. 5147.4
3.7
168.436.7
131.8148.0
50.7104.537.047.332.7
' 3, 021
' 2, 834' 1, 152
'68119
8,3336,4181,382
533
1 1,21691420696
13,730-31
02, 159
9.6
8,8756,5461.293
3,026
41.3
167. 836.3
131.5148.7
5.1
168.036.8
131.2148.8
50.9105.637.047.632.5
'3,008
'2,878' 1, 143
'5575
11,1207,7972,694
629
1,3641,046
22098
13,63420
67, 77510,766
4 269 6
7,2986, 4521.293
4,149
41.5
167.836.5
131.3150.2
4.6
169.236.9
132.3149.6
52.3107.138.349.133.5
7,229469162
68213847
1,207115294324
313680546
186973833
3,040
758
4, 250
3,8332,065
39621
9,9287,1242, 230
574
1,251947203101
13,632-57
1.293
41.5
171. 636.8
134.8152.2
3.0
171.137.1
134.0151.6
52.8112. 037.747.833.3
3,667
3,4581,383
18128
13, 532
1,293
166.937.0
129.9153.9
7.2
169.537.3
132.2152.9
52.4109.337.849.832.8
' Revised. 1 Includes $28 bil. coverage on U.S. Armed Forces. 2 Estimated; excludesU.S.S.R., other Eastern European countries, China Mainland, and North Korea. 3 Datafor Nov.-Dec. 4 Jan.-Mar. quarter. s Beginning with April 1966 SURVEY, data reflectreclassification of companies between paper and allied products industries and instruments,etc. (included in all other).
!Revisions for insurance written (total and ordinary) for 1964 and premiums collected forJan.-Aug. 1964 will be shown later; those for money supply and related data for 1959-64
appear on p. 43 of the June 1966 SURVEY.§ Or increase in earmarked gold (—).ITime deposits at all commercial banks other than those due to domestic commercial
banks and the U.S. Govt.9 Total SMSA's include some cities and counties not designated as SMSA's.^Includes Boston, Philadelphia, Chicago, Detroit, San Francisco-Oakland, and Los
Angeles-Long Beach.
Digitized for FRASER http://fraser.stlouisfed.org/ Federal Reserve Bank of St. Louis
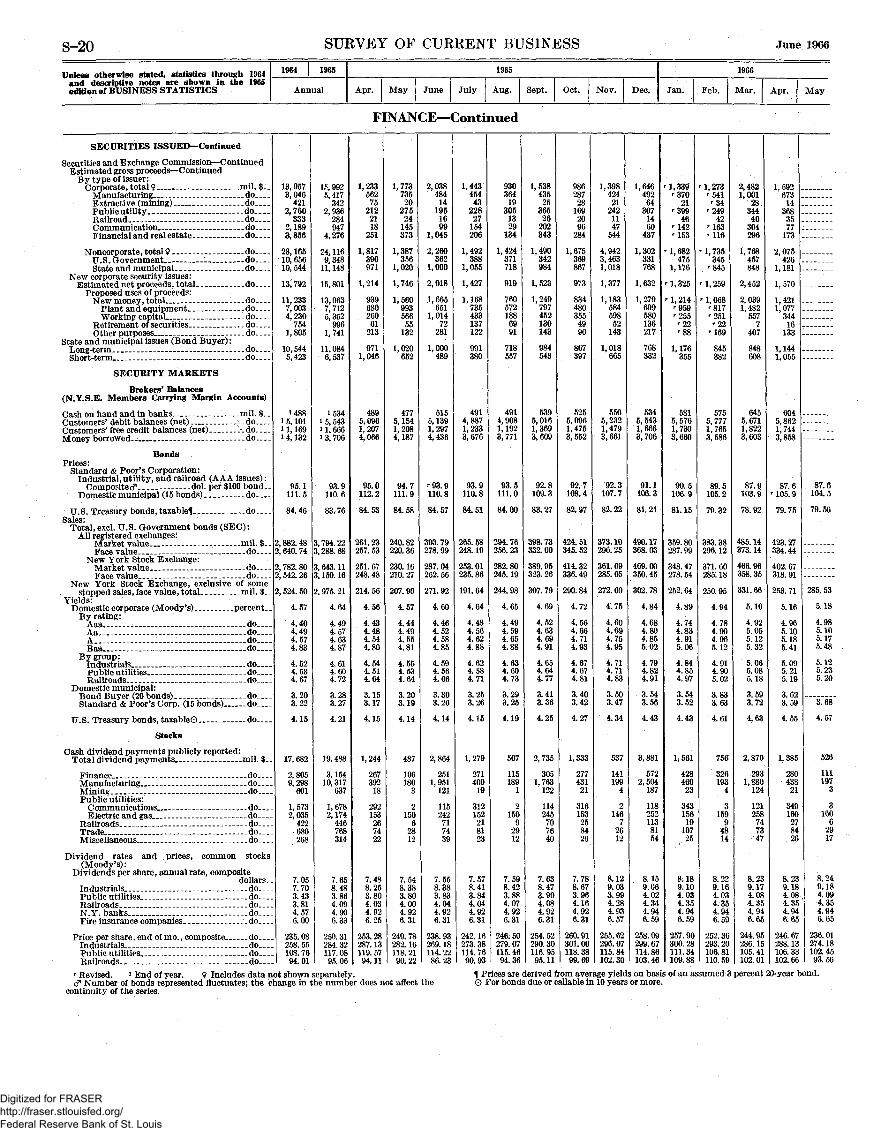
S-20 SURVEY OF CURRENT BUSINESS June 1966
Unless otherwise stated, statistics through 1964and descriptive notes are shown in the 1965edition of BUSINESS STATISTICS
1964 1965
Annual
1965
Apr. May June July Aug. Sept. Oct. Nov. Dec.
1966
Jan. Feb. Mar. Apr. May
FINANCE—Continued
SECURITIES ISSUED— Continued
Securities and Exchange Commission— ContinuedEstimated gross proceeds— Continued
By type of issuer:Corporate total 9 mil. $
Manufacturing _ doExtractive (mining) _ do_ _Public utility doRailroad do _Communication do_ _Financial and real estate do
Noncorporate, total 9 - - _do_ _U S Government - doState and municipal _ _ _ -do
New corporate security issues :Estimated net proceeds, total _ _ do_
Proposed uses of proceeds:New money total do
Plant and eouipment doWorking capital _ do
Retirement of securities doOther purposes do
State and municipal issues (Bond Buyer):Long-term _ __ _ _ doShort-term do
SECURITY MARKETS
Brokers' Balances(N.Y.S.E. Members Carrying Margin Accounts)
Cash on hand and in banks mil $Customers' debit balances (net) doCustomers' free credit balances (net) doMoney borrowed - - do
BondsPrices:
Standard & Poor's Corporation:Industrial, utility, and railroad (AAA issues):
Composite cf - - - dol. per $100 bond-Domestic municipal (15 bonds) .. _ _ do
U.S. Treasury bonds, taxablel. . doSales:
Total, excl. U.S. Government bonds (SEC) :All registered exchanges:
Market value mil $Face value - _ - - _ _ . do
New York Stock Exchange:Market value --- do
New York Stock Exchange, exclusive of somestopped sales, face value, total mil. $__
Yields:Domestic corporate (Moody 's) percent. _
By rating:Aaa doAa - --do_ _ _A _ _ - _ doBaa - do
By group:Industrials _ _ _ _ _ _ _ do_ _Public utilities _ . do___Railroads _ _ _ _ do
Domestic municipal:Bond Buyer (20 bonds) doStandard & Poor's Corp. (15 bonds) -do
U.S. Treasury bonds, taxable© do
Stocks
Cash dividend payments publicly reported:Total dividend payments mil. $_ _
Finance doManufacturing _ _ _ _ _ do_ _Mining doPublic utilities:
Communications _do_ _Electric and gas do
Railroads _ doTrade _ _ _ - _- _ _ do_ _Miscellaneous do
Dividend rates and prices, common stocks(Moody 's):
Dividends per share, annual rate, compositedollars __
Industrials _ do_ _Public utilities doRailroads doN.Y. banks doFire insurance companies _ .do
Price per share, end of mo. , composite doIndustrials _ _ _ _ _ _ _ d oPublic utilities doRailroads do
13, 9573,046
4212,760
oqo
2,1893 856
23, 16510 65610, 544
13, 792
11, 2337 0034,230
7541,805
10,5445,423
*4881 5, 1011 1 169i 4, 132
95. 1111. 5
84. 46
2 882. 482, 640. 74
2,782.802, 542. 26
2, 524. 50
4.57
4.404.494.574.83
4.524.534.67
3.203.22
4.15
17, 682
2,8059,298
601
1,5732,035
422^680268
7.057.703.433.814.576.00
235. 08258. 55108. 7694.01
15 9925 417
3422,936
284947
4 276
24 1169 348
11. 148
15, 801
13, 0637 7125, 352
9961 741
11, 0846 537
1 5341 5,5431 1 666i 3, 706
93.9110. 6
83.76
3 794.223. 288. 68
3,643.113 150.16
2. 975. 21
4.64
4.494.574.634.87
4.614.604.72
3.283.27
4.21
19, 488
3,15410, 317
637
1,6782,174
446768314
7.658.483.864.094.906.33
250.31284. 32117. 0895.06
1,23356275
2122118
251
1,817390971
1,214
93968026061
213
9711,046
4895,0961,2074,066
95.0112.2
84. 53
261. 23257. 53
251. 67248. 48
214. 56
4.56
4.434.484.544.80
4.544.514.64
3.153.17
4.15
1,244
267392
18
292153267422
7.488.253.804.034.926.25
253. 28287. 13119. 5794.11
1,77373520
27524
145373
1,387356
1,020
1,746
1,56099356655
132
1,020652
4775,1541,2084,187
94.7111.9
84.58
240. 82220. 36
230. 16210. 27
207. 90
4.57
4.444.494.554.81
4.554.534.64
3.203.19
4.14
487
106180
3
2150
62812
7.548.383.804.004.926.31
249. 78282. 16118. 2190.22
2,038484
14195
1699
1,045
2,260362
1,000
2,018
1,665651
1,01472
281
1,000489
5155,1391,2974,436
' 93. 9110.8
84.57
303.79278.99
287.04262. 56
271. 92
4.60
4.464.524.584.85
4.594.564.66
3.303.26
4.14
2,864
2511,951
121
115242717439
7.558.383.834.044.926.31
238. 93269. 18114. 2286.23
1,44345443
22827
154206
1,492388
1,055
1,427
1,168735433137122
991380
4914,8871, 2333, 676
93.9110.8
84. 51
265. 58248.19
253. 01235. 86
191. 64
4.64
4.484.564.624.88
4.624.584.71
3.253.26
4.15
1,279
271400
19
312152218123
7.578.413.844.044.926.31
242. 16273. 38114.7690.93
93036419
3051329
134
1,424371718
919
7605721886991
718557
4914,9081,1923,771
93.5111. 0
84.00
294.76256. 23
282. 80245. 19
244. 98
4.65
4.494.594.654.88
4.634.604.73
3.293.25
4.19
507
115189
1
2150
92912
7.598.423.884.074.926.31
246. 50279. 07115. 4694.36
1.53843525
36526
202343
1,490342984
1,523
1,249797452130143
984543
5395,0161,3693,609
92.8109.3
83. 27
398.73332. 00
389. 95323. 26
307. 79
4.69
4.524.634.694.91
4.654.644.77
3.413.36
4.25
2,735
3051,763
122
114245
707640
7.638.473.904.084.926.31
254. 52290. 30116. 9595.11
98628728
1692096
284
1,675369867
973
8344803554990
867397
5255,0961,4753, 552
92.7108.4
82.97
424. 51345. 52
414. 32336. 49
290. 84
4.72
4.564.664.714.93
4.674.674.81
3.403.42
4.27
1,333
27743121
316153258426
7.788.673.964.164.926.31
260. 91301. 00118.3899.69
1,39842421
2421147
544
4,9423, 4631,018
1,377
1,18358459852
143
1,018665
5505,2321,4793,661
92. 3107.7
82.22
373. 10296. 25
361. 09285. 05
272. 00
4.75
4.604.694.754.95
4.714.714.83
3.503.47
4.34
537
141199
4
2146
72612
8.129.033.994.284.936.57
255. 62296. 07115. 84102. 30
1,64649264
3071460
437
1,302331768
1,632
1,279699580136217
768332
5345,5431, 6663,706
91.1106.3
81. 21
490.17368. 03
469.00350. 45
302. 78
4.84
4.684.804.855.02
4.794.824.91
3.543.56
4.43
3,881
5722,504
187
1182521138154
8.159.064.024.344.946.59
258.09299. 67114.86103. 46
1, 339'370
21'399
46r 142r 153
1,682475
1,176
' 1, 325
r 1, 214T 959'255'22'88
1. 176355
5815, 5761,7303,669
90.5106.9
81.15
359. 80287. 99
348. 47278. 54
252.64
4.89
4.744.834.915.06
4.844.854.97
3.543.52
4.43
1,561
42846023
34315619
10725
8.189.104.034.354.946.59
257. 90300. 28111. 34109. 88
1 273'541'34
'24942
'163' 116
'1,735345
'845
' 1, 259
' 1, 068'817'251
r 22'169
845382
5755,7771,7653,586
89.5105.2
79. 32
383. 38296. 12
371. 60285. 18
250. 95
4.94
4.784.904.965.12
4.914.905.02
3.833.63
4. 61
756
326193
4
3159
94814
8.229.164.034.354.946.59
252. 36293. 20106. 81110. 59
2 4821,001
2834440
304296
1,768457848
2,452
2,0391 482
5577
407
848608
6455,6711,8223,603
87.9103.9
78.92
485. 14373. 14
466. 96358. 35
331. 66
5.10
4.925.055.125.32
5.065.085.18
3.593.72
4.63
2,870
2931, 880
124
121258747347
8.239.174.084.354.946.65
244. 95286. 15105. 4]102. 01
1 59267314
3683577
173
2 075426
1,181
1,570
1,4211 077
34416
133
1,1441,055
6045,8621,7443,858
87.6' 105. 9
79.75
423. 27334.44
402. 67318. 91
253. 71
5.16
4.965.105.185.41
5.095.215.19
3.623.59
4.55
1,385
28043821
349160
278426
8.239.184.084.354.946.65
246. 67288. 12106. 32102. 66
87.6104.5
79. 56
285. 53
5.18
4.985.105.175.48
5.125.235.20
3.68
4.57
526
111197
3
3160
62917
8.249.184.094.354.946.65
236. 01274. 18102. 4593.56
' Revised. l End of year. 9 Includes data not shown separately,cf Number of bonds represented fluctuates; the change in the number does not affect the
continuity of the series.
T Prices are derived from average yields on basis of an assumed 3 percent 20-year bond.O For bonds due or callable in 10 years or more.
Digitized for FRASER http://fraser.stlouisfed.org/ Federal Reserve Bank of St. Louis
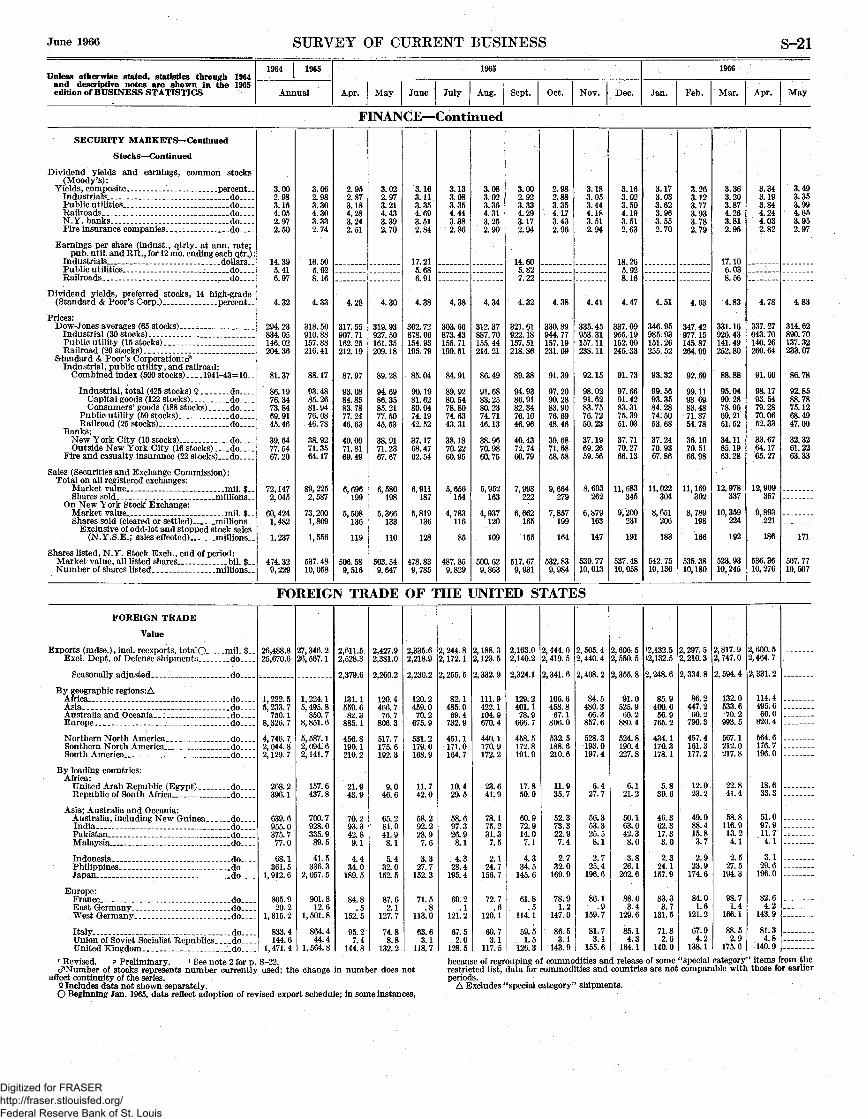
June 1966 SURVEY OF CURRENT BUSINESS S-21
Unless otherwise stated, statistics through 1964and descriptive notes are shown in the 1965edition of BUSINESS STATISTICS
1964 1965
Annual
1965
Apr. May June July Aug. Sept. Oct. Nov. Dec.
1966
Jan. Feb. Mar. Apr. May
FINANCE—Continued
SECURITY MARKETS— Continued
Stocks— Continued
Dividend yields and earnings, common stocks(Moody 's):
Yields, composite _ .percent. _Industrials doPublic utilities doRailroads . doN.Y. banks doFire insurance companies do
Earnings per share (indust., qtrly. at arm. rate;pub. util. and RR., for 12 mo. ending each qtr.) :
Industrials _ _ _ _ dollarsPublic utilities doRailroads do
Dividend yields, preferred stocks, 14 high-grade(Standard & Poor's Corp.) percent. .
Prices:Dow-Jones averages (65 stocks) .
Industrial (30 stocks)Public utility (15 stocks)Railroad (20 stocks) _. ___ .
Standard & Poor's Corporation :cfIndustrial, public utility , and railroad:
Combined index (500 stocks)... ..1941-43=10..
Industrial, total (425 stocks) 9 ...doCapital goods (122 stocks) _ _ doConsumers' goods (188 stocks) do
Public utility (50 stocks) . _ do_ _ _ .Railroad (25 stocks)..... do..._
Banks:New York City (10 stocks) do.__.Outside New York City (16 stocks) _ do
Fire and casualty insurance (22 stocks)___do
Sales (Securities and Exchange Commission):Total on all registered exchanges:
Market value. _ _ _ mil. $Shares sold _._ millions
On New York Stock Exchange:Market value . . mil $Shares sold (cleared or settled) millions
Exclusive of odd-lot and stopped stock sales(N.Y.S.E.; sales effected) millions..
Shares listed, N.Y. Stock Exch., end of period:Market value, all listed shares ___bil. $..Number of shares listed _ _ _ _ . millions
3.002 983 154.052 972.50
14 395.416.97
4.32
294. 23834 05146 02204. 36
81.37
86.1976.3473.8469.9145. 46
39.6477.5467.20
72,1472,045
60 4241 482
1, 237
474. 329, 229
3.062 983 304.30o oo2.74
16 505 928.16
4.33
318. 50910. 88157. 88216. 41
88.17
93.4885.2681.9476.0846. 78
38.9271.3564.17
89, 2252,587
73, 2001 809
1,556
537. 4810, 058
2.952 873 184 283 242.51
4.28
317. 55907 71162 25212 19
87.97
93.0884.8583 7877.2446.63
40.0071.8169.49
6 696199
5 508136
119
506. 589,516
3.022 973 214.433 392.70
4.30
319. 93927 50161 35209 18
89.28
94.6986.3585 2177.5045.53
38.9171.2367. 67
6 580198
5 366133
110
503. 549,647
3.163 113 354.693 512.84
17.215.686.91
4.38
302. 72878 06154 93195. 79
85.04
90.1981.6280.0474.1942.52
37.1768.4762.54
6 911187
5 819136
128
478.839,785
3.133 083 354.443 382.86
4.38
303. 66873 43155 71199. 51
84.91
89.9280.5478.8074.6343.31
38.1870.2260. 95
5 656154
4 783116
85
487. 859,829
3. 083 023 364.313 252.90
4.34
312. 37887 70155 44214. 21
86.49
91.6883.2580.2374. 7146.13
38.9670.9860.75
5,952163
4 937120
109
500. 629,863
3.002 923 334.293 172.94
14. 605.827.22
4.32
321.61922 18157. 51218. 86
89.38
94.9386.9182.3476.1046.96
40.4372.7460. 79
7,993222
6,662165
155
517. 679,931
2.982 883 354. 173 432.96
4.38
330. 89944 77157. 19231. 09
91. 39
97.2090.2883.9076.6948.46
39.6871.6858.58
9,664279
7,857199
164
532. 839,984
3. 183 053 444.183 512.94
4.41
335. 45953 31157. 11238. 11
92. 15
98.0291.6283. 7576.7250.23
37.1969.2659. 56
8, 603262
6, 879163
147
530. 7710,013
3.163 023 504.193 512.63
18 265 928.16
4.47
337. 09955 19152. 00245.33
91.73
97.6691.4283. 3175.3951.03
37. 7170.2766.13
11, 683345
9,200231
191
537.4810, 058
3.173 033. 623.963 552.70
4.51
346.95985. 93151.26255. 52
93. 32
99.5693.3584. 2874.5053.68
37. 2470.9367.86
11, 022304
8,651206
183
542. 7510, 136
3.263 123 773 933 782.79
4.63
347 42977 15145 87264 99
92,69
99. 1193 6983.4871.8754.78
36.1070. 5166.98
11, 169302
8,789198
166
535. 3810, 180
3.363 203 874.263 812.95
17.106.038.56
4.83
331. 16926. 43141. 49252.80
88. 88
95.0490. 2878. 9669. 2151.52
34. 1165.1963.28
12,978337
10,359224
192
523. 9310,245
3.343 193. 844.244 032.82
4. 78
337. 27943. 70140. 26260.64
91. 60
98.1793.5479.2870.0652. 33
33.6764.1765.27
12,909357
9,893221
186
536. 3610,276
3.493.353.994.653.952.97
4.83
314. 62890. 70137. 32233.07
86.78
92.8588.7875. 1268.4947.00
32.3261.2263.33
171
507.7710,507
FOREIGN TRADE OF THE UNITED STATES
FOREIGN TRADE
Value
Exports (mdse ) , incl reexports totalQ mil $Excl. Dept. of Defense shipments do
Seasonally adjusted do
By geographic regions:AAfrica doAsia _ _ _ _ _ _ d oAustralia and Oceania doEurope do
Northern North America doSouthern North America doSouth America do
By leading countries:Africa:
United Arab Republic (Egypt) doRepublic of South Africa _ _ _ d o
Asia; Australia and Oceania:Australia including New Guinea doIndia _ doPakistan doMalaysia do
Indonesia doPhilippines doJapan do
Europe:France doEast Germany doWest Germany do
Italy doUnion of Soviet Socialist Republics doTTnitoirl TT-inorrlnTn Af\
26,488.825,670.6
1,222.55,233.7
750. 18,326.7
4, 746. 72, 044. 82, 129. 7
268. 2396.1
639.6955.0375.777.0
68.1361.5
1,912.6
805.920.2
1, 315. 2
833.4144.6
1 471 4.
27, 346. 226, 567. 1
1, 224. 15, 495. 8
850.78, 851. 6
5, 587. 12, 094. 62, 141. 7
157.6437.8
700.7928.0335.989.5
41.5336.3
2, 057. 5
901.812.6
1, 501. 8
864.444.4
1 Kfi4 8
2,611.52,528.3
2,379.6
131. 1559.682.3
885. 1
456.8190.1210.2
21.943.9
70.293.342.89.1
4.434.0
189.5
84.8.5
152.5
95.27.4
144 8
2,427.92,381.0
2,260.2
120.4466.776.7
806.3
517.7175.6192.3
9.046.6
65. 281.041.98.1
5.432.0
152.5
87.62.1
127. 7
74.88.8
139 9
2,335.62,218.9
2,230.2
120.2459.0
70.2675.9
531. 2179.0168.9
11.742.0
58.292.228.97.6
3.327.7
152.3
71.5.8
113.0
63. 63.1
118 7
2, 244. 82, 172. 1
2,255.5
82.1485.069.4
732.9
451.1171. 0164.7
10.429.5
58.697.326.98.1
4.328.4
195.4
69.2.1
121.2
67.52.0
198 5
2, 188. 32, 123. 5
2,332.9
111.9422.1104.9670.4
440.1170.9172.2
23.641.9
78.175.231.37.5
2.124.7
156.7
72. 7.6
120. 1
60.73.1
117 K
2,163.02,140.2
2,324.1
129. 2401.178.9
666.7
458.5172.8191.9
17.850.0
60.972.914.07.1
4.334.5
145.6
61.8.5
114.1
59.51.5
19fi 3
2, 444. 02, 419. 5
2, 341. 6
105.6458.867.1
806.0
532.5188.6210. 6
11. 935.7
52.373.322.97.4
2.732.0
169. 9
78.91.2
147.0
86.53.1
143. ft
2, 505. 42, 440. 4
2,408.2
84.5480.366.3
857.6
528.3193.0197.4
6.427.7
56.353.325.58.1
2.725.4
196.6
86.1.9
159. 7
81.73.1
155. fi
2, 606. 52, 550. 5
2,355.8
91.0525.960.2
880.4
524.8190.4227.8
6.121.2
50.163.042.38.0
3.826.1
202.6
88.03.4
129.6
85.14.3
164.1
12,132.512,132.5
2, 248. 6
85.9400.656.9
765.2
434.1170.3178.1
5.830.6
46.362.317.33.0
2.324.1
157. 9
83.33.7
131.5
71.82.6
140. 0
2, 297. 52,210.3
2,334.8
86.2447.260. 2
790.3
457.4161.3177.2
12.023.2
49.988.415.83.7
2.923.9
174.6
84.01.6
121.2
67.94.2
138.1
2,817.92, 747. 0
2, 594. 4
132.0533.670.2
993.5
567. 1212.0217.8
22.841.4
58.8116.913. 24. 1
2.527.5
194.3
98.71.4
166.1
88.52.9
175.6
2, 6QO. 52,464.7
2, 331. 2
114. 4495.660.0
820.4
564.6176. 7196.0
18.633.3
51.097.911.74.1
3.129.6
196.0
82.64.2
143.9
81.34.8
140.9r Revised. v Preliminary. 1 See note 2 for p. S-22.cfNumber of stocks represents number currently used; the change in number does not
affect continuity of the series.9 Includes data not shown separately.O Beginning Jan. 1965, data reflect adoption of revised export schedule; in some instances,
because of regrouping of commodities and release of some "special category" items from therestricted list, data for commodities and countries are not comparable with those for earlierperiods.
A Excludes "special category" shipments.
Digitized for FRASER http://fraser.stlouisfed.org/ Federal Reserve Bank of St. Louis

S-22 SURVEY OF CURRENT BUSINESS June 1966
Unless otherwise stated, statistics through 1964and descriptive notes are shown in the 1965edition of BUSINESS STATISTICS
1964 1965
Annual
1965
Apr. May June July Aug. Sept. Oct. Nov. Dec.
1966
Jan. Feb. Mar. 1 Apr.1
May
FOREIGN TRADE OF THE UNITED STATES—ContinuedFOREIGN TRADE— Continued
Value— ContinuedExports (mdse.), incl. reexports— Continued
By leading countries— ContinuedNorth and South America:
Canada - mil. $ _
Latin American Republics, total 9 do
Argentina ' doBrazil doChile --- _-_do
Colombia _ _ _ _ _ _ _ d o _ _Cuba do _ _ _Mexico doVenezuela - do_ _ _
Exports of TJ S merchandise total Ot cloExcl military grant-aid J _ _ do__
By economic classes:Crude materials doCrude foodstuffs doManufactured foodstuffs and beverages doSemimanufactures cf doFinished manufactures c?1 do
Excl military grant-aid doBy principal commodities:
Agricultural products total 9 do
Animal and vegetable oils and fats doCotton unmanufactured doFruits vegetables, and preparations doGrains and preparations doMeat and meat preparations doTobacco and Tp?vnnfaotu''p,s /\ do
N onagri cultural products, total 9 - do
Automobiles, parts, and accessories doChemicals and related products § doCoal and related fuels doIron and steel prod (excl. adv. mfs.) do
Machinery total § 9 do
Agricultural _- -_- _do_Tractors parts and accessories doElectrical doMetalworking§ _ . __do _ _Other industrial do
Petroleum and products doTextiles and manufactures do
General imports total J doSeasonally adjusted J do
By geographic regions:Africa _- doAsia doAustralia and Oceania doEurope _ _ -do _ _
Northern North America doSouthern North America doSouth America _ - do
By leading countries:Africa:
United Arab Republic (Egypt) doRepublic of South Africa do
Asia; Australia and Oceania:Australia, including New Guinea doIndia doPakistan doMalaysia doIndonesia doPhilippines doJapan do
Europe:France doEast Germany doWest Germany doItaly doUnion of Soviet Socialist Republics _ _ _ _ d oUnited Kingdom. _ _ _ _ _ _ do
North and South America:Canada do
Latin American Republics, total 9 _ _ _ _ _ d o — _ _
Argentina doBrazil doChile do
Colombia doCuba doMexico doVenezuela _ __ _do _ _
4, 774. 5
3,737.9
261.6387.8180.9
246.2C1)
1, 092. 4606.3
6, 136. 45, 318. 2
2, 897. 52, 540. 21 687 44, 067. 24, 893. 84, 076. 1
6, 347. 0
429 4690.2434.7
2, 579. 8181.3544.5
19, 739. 0
1, 720. 82, 326. 2
504 7895.7
6 344 8
229.0547.3
1, 540. 2520.6
2 991. 7
471.4804.9
18, 684. 0
916.53, 619. 5
439.75,307.3
4, 241. 61, 639. 32, 508,5
16.2249.5
281.1304. 540.0
161.1169.7387.2
1, 768. 0
495.06.7
1, 171. 1526.220.2
1, 143. 2
4,238.5
3, 523. 7
111.3534. 7218.2
280.40)643.1956.4
5, 586. 7
3,750.6
266.0328.6235.3
196.40)
1, 105. 2623. 7
27, 003. 326, 224. 5
6,228.9
20,777.0
21,366.4
875.14, 528. 4
453.56, 293. 0
4, 837. 11, 741. 12, 626. 2
16.1225.1
314.1348. 044.8
211.9165.3369.1
2,414.1
615.36.5
1,341.6619.742.6
1,405.3
4, 831. 9
3, 676. 6
122. 1511.9209.4
276.70)637.9
1, 020. 6
r 456. 0
352.1
2&726.922.3
20.00)92.963.8
2,584.32, 501. 1
553.9
2, 031. 3
1,856.81,832.9
66.2' 403. 0
30.7r 575. 0
' 377. 0' 162. 0' 242. 8
1.319.3
19.037.5r5.323.516.636.7
204.9
55.6.6
130.752.62.5
r 109. 5
' 376. 8
r 340. 9
11.137.230.3
24.20
61.1"•94.6
517.6
327.6
23.227.521.0
21.40
92.754.6
2, 397. 42,350.5
532.9
1, 864. 8
1,723.31,789.0
75.3339.938.0
542.3
398.6145.4183.0
1.417.4
24.524.33.2
16.712.229.5
177.3
54.2.6
110.349.72.2
115.5
398.3
274.3
10.336.413.8
-20.70
57.266.3
531.2
307. 6
19.420.215.8
13.80
95.255.8
2, 307. 42, 190. 7
530.9
1, 776. 7
1, 907. 01, 829. 5
82.0410.930.8
537.6
441.7158.3245.1
1.018.8
20.133.14.1
17.315.727.1
220.0
63.5.3
117.654.82.6
112.7
441.5
344.2
11.138.922.3
25.20
61.9101.9
451.1
297.6
22.018.818.0
12.80
92.552.2
2, 212. 12,139.4
548.1
1, 664. 1
1, 632. 91,663.1
50.9345.641.7
505.7
400.5114.5173.2
2.68.2
25.923.74.0
16.710.225.6
194.5
55.1.2
110.649.13.3
118.4
399.4
238.6
8.927.89.9
18.80
39.371.1
440.1
304.1
25.924.717.4
13.40
88.952.8
2,161.02,096. 2
459.3
1, 701. 7
1, 716. 01, 763. 6
68.4394.736.7
486.8
408.3123.1198.9
.615.3
25.128.04.2
13.610.835.3
231. 0
53.3.3
91.256.1
2.4112.1
407.6
270.4
10.436.111.9
22.80
41.877.5
458.5
327.3
18.432.031.1
15.50)93.149.9
2, 133. 22, 110. 4
484.7
1, 649. 2
1, 797. 61,806.8
89.1423.447.4
489.9
414.7118.2214.1
.527.6
35.131.83.6
24.514.733.5
224.1
41,71.4
110.453.11.9
111.8
413.5
276.2
11.854.318.9
24.1C1)39.268.9
532. 5
354.5
25.539.921.3
17.20
98.058.3
2, 411. 92, 387. 4
587.0
1, 824. 9
1,997.12,005.9
87.9411.055.5
621.1
416.4136.4268.4
.616.3
43.027.03.3
18.616.231.2
227.8
54.7.3
135.758.58.2
148.2
416.0
348. 5
11.365.624.9
31.40
47.384.5
528.3
344.8
22.735.923.2
18.30
99.254.0
2, 472. 22,407.2
652.2
1, 820. 0
1, 966. 71,903.3
81.1412.435.2
592.3
448.9151.9243.2
.526.3
23.227.32.6
18.513.828. 5
231.3
54.3.4
133.158.83.5
137.1
448.6
342. 4
10.462.923.1
27.00
63.770.3
524.8
375.8
22.852.126.3
23.90
99.056.9
2, 576. 02, 520. 0
647.5
1,928.5
2, 159. 92,034.6
90.0446.637.7
661.5
470. 1178.0274.7
1.225.6
28.733.85.3
26.915.739.9
221. 9
61.51.2
131.967.95.7
165.3
469.7
380.5
10.863.011.5
31.60
65.5110.1
434.1
310.4
16.839.520.8
18.00)93.545.0
22,105.322,105.3
505.7
1, 599. 6
1, 828. 71, 935. 5
70.9373.837.8
556.5
403.1161.3225.2
2.816.5
26.228.96.38.3
12.529.2
200.8
47.6.5
130,149.31.9
124.5
402.5
323.8
11.348.519.4
22.60
62.984.6
457.4
303.4
16.731.522.3
21.90)86.944.6
2, 264. 02, 176. 8
518.6
1,745.4
1, 822. 51, 992. 9
72.2375. 643.3
534.1
417.0153.9225. 4
1.014.1
31.625.45.5
18.712.632.5
190.0
50.4.4
119.751.64.8
106.0
416.9
328.7
9.348.117.2
27.80
65.281.7
567.0
379.6
18.753.620.7
25.2C1)
108.651.7
2, 778. 42, 707. 5
624.8
2,153.6
2, 245. 72, 072. 7
119. 0438.041.7
689.8
520.7182.8252.7
1.931.3
24.326.06.5
10.416.340.6
250.1
63.8.8
156.858.53.4
151.7
519.9
369.1
12.942.922.2
20.90
73.1111.6
564. 5
331.0
15.046.019.4
23.30
88.249. 6
2,557.92, 422. 1
552. 3
2, 005. 6
2, 071. 22, 138. 2
88.5434.648.6
637.7
472.8170.0218.8
3. 617.4
27.329.05.7
17.118.834.6
245.4
53.3.5
131.856.13.7
138.0
472.8
326.3
14.444.916.2
20.70
70.182.2
r Revised. ? Preliminary. 1 Less than $50,000. 2 Military grant-aid shipments forDec. 1965 (ordinarily included with Jan. 1966 data) are included in Feb. 1966 data; subsequentmonths will include these shipments on a 2-months delayed basis. ^Revisions for Jan.-Nov. 1964 will be shown later. 9 Includes data not shown separately. QSee similar
note on p. S-21. d"Data for semimanufactures reported as "special category" are includedwith finished manufactures. AManufactures of tobacco are included in the nonagriculturalproducts total. §Excludes some "special category" exports.
Digitized for FRASER http://fraser.stlouisfed.org/ Federal Reserve Bank of St. Louis
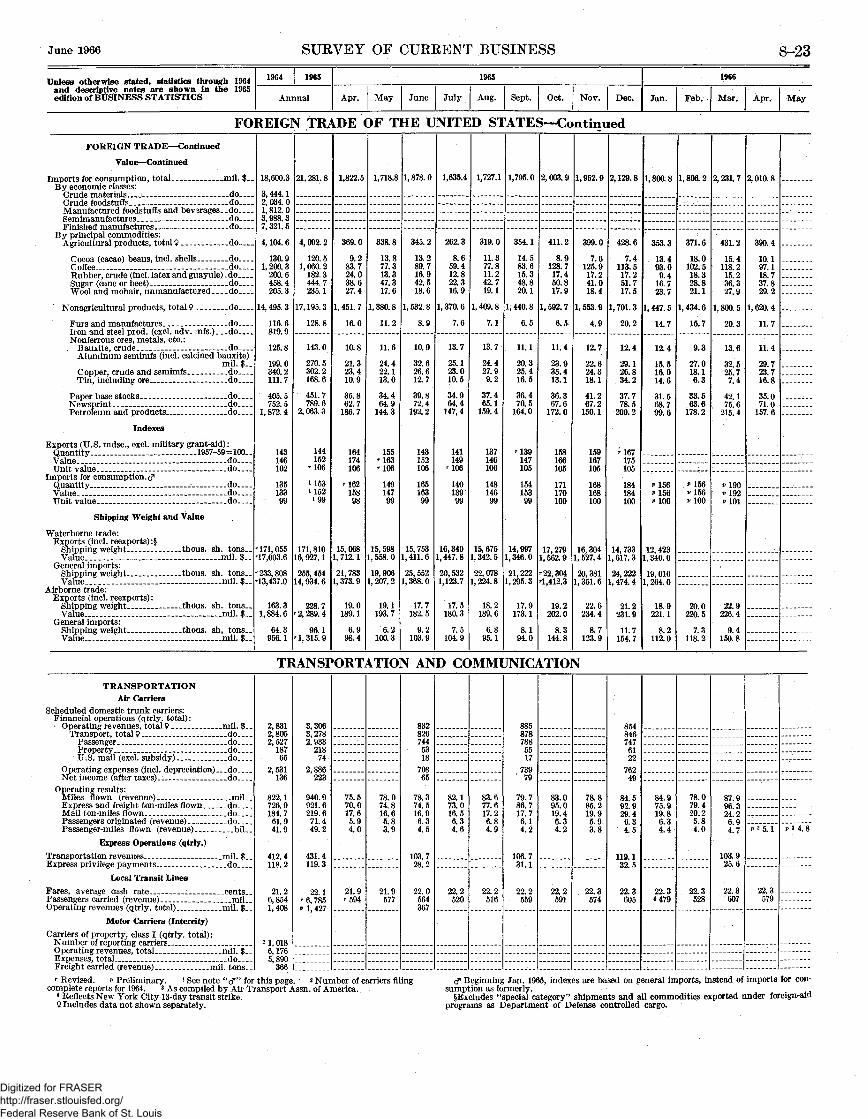
June 1966 SURVEY OF CUREENT BUSINESS S-23
Unless otherwise stated, statistics through 1964and descriptive notes are shown in the 1965edition of BUSINESS STATISTICS
1964 1 1965
Annual
1965
Apr. May June July Aug. Sept. Oct. Nov. Dec.
1966
Jan. Feb. Mar. Apr. May
FOREIGN TRADE OF THE UNITED STATES—Continued
FOREIGN TRADE— Continued
Value— Continued
Imports for consumption total mil. $By economic classes:
Crude materials i - do_Crude foodstuffs doManufactured foodstuffs and beverages _do_ _Sem imanufactures doFinished manufactures do_
By principal commodities:Agricultural products total 9 do
Cocoa (cacao) beans, incl. shells doCoffee doRubber, crude (incl. latex and gtiayule) _doSugar (cane or beet) doWool and mohair unmanufactured do
Nonagricultural products, total 9 do_
Furs and manufactures _ - doIron and steel prod. (excl. adv. mfs.) .doNonferrous ores, metals, etc.:
Bauxite, crude do _Aluminum semimfs (incl. calcined bauxite)
mil. $__Copper, crude and semimfs doTin including ore do
Paper base stocks : doNewsprint - doPetroleum and products do
Indexes
Exports (U.S. mdse., excl. military grant-aid):Quantity - - .1957-59=100Value doUnit value do
Imports for consumption, d*Quantity • doValue doUnit value - . do_ _
Shipping Weight and Value
Waterborne trade:Exports (incl. reexports):!
Shipping weight thoins. sh. tons__Value mil. $
General imports:Shipping weight thous. sh. tons__Value _ _ - _ mil. $
Airborne trade:Exports (incl. reexports) :
Shipping weight thous. sh. tonsValue mil. $_
General imports:Shipping weight thous. sh, tonsValue . _ _ _ mil. $
18,600.3
3, 444. 12, 034. 01, 812. 03, 988. 37, 321. 5
4, 104. 6
130.91, 200. 3
200.6458.4205 3
14, 495. 3
116.6819.9
125.8
199.0340.2111 7
405. 5752.5
1, 872. 4
143146102
13513399
171, 05517,003.6
233, 80813,437.0
163.31, 884. 6
64.3956.1
21, 281. 8
4, 092. 2
120.51, 060. 2
182.3444.7235.1
17, 195. 3
128.8
143.0
270.5302.2168.6
451.7789.6
2, 063. 3
144152
r!06
U53i 152199
171, 81016 927 1
255, 45414 934 6
228 72, 289. 4
96 11, 315. 9
1,822.5
369.0
9.283.724.038.627. 4
1, 451. 7
16.0
10.8
21.323.410.9
35.862.7
186.7
164174106
'16215898
15,0681, 712. 1
21, 7831, 373. 9
19.0189.1
6.998.4
1,718.8
338.8
13.877.313.347.317.6
1, 380. 8
11.2
11.6
24.422.113.0
34.464.9
144.3
155••163'106
14914799
15, 5981, 558. 0
19,9061, 207. 2
19.1193.7
6.2100.3
1, 878. 0
345.2
13.289.716.942.518.6
1,532.8
8.9
10.9
32.626.612.7
39.872.4
192.2
143152106
16516399
15, 7531,411.6
25, 5521, 368. 0
17.7182. 5
9.2103. 9
1,635.4
262.3
8.659.412.822.316. 9
1, 370. 6
7.6
13.7
25.123.010.5
34.964.4
147.4
141149
'106
14013999
16,3401, 447. 8
20, 5321,123.7
17.5180.3
7.5104.9
1,727.1
319.0
11.377.811.242.719.1
1, 409. 8
7.1
13.7
24.427.99.2
37.465.1
159.4
137146106
14814699
15, 6751, 342. 5
22, 0781, 224. 8
18.2189.6
6.895.1
1,795. 0
354.1
14.583.615.348.820.1
1, 440. 8
6.5
11.1
20.325.416.5
36.470.5
164.0
'139147105
15415399
14,9971, 346. 0
21, 2221,295.3
17.9173.1
8.194.0
2,003.9
411.2
8.9128.717.450.817.9
1, 592. 7
6.5
11.4
23.935.413.1
36.367.6
172. 0
158166105
171170100
17, 279L 562 9
••22,304'1 412 3
19 2202.0
8 3144.8
1, 952. 9
399.0
7.6125.917.241.018.4
1, 553. 9
4.9
12.7
22.624.318.1
41.267.2
150.1
159167105
168168100
16 3041 527 4
20,3811 351 6
22.6234.4
8.7123.9
2, 129. 8
428.6
7.4113.517.251.717.5
1, 701. 3
20.2
12.4
29.126.834 2
37.778.5
200. 2
'167175105
184184100
14 7331 617 3
24,2221 474 4
21 2231 9
11 7154 7
1 800 8
353 3
13 493 o9.4
16 723 7
1 447 5
14 7
12 4
15.516 014 6
31 568 799 6
v 156* 156p 100
12 4231 340 0
19 0101 264 0
18 9221 1
8 2112 0
1,806 2
371. 6
18.0102.518.328.821.1
1, 434. 6
15.7
9.3
27.018.16 3
33.563.6
178.2
*156v 156MOO
20 0220 5
7 3118 2
2 231 7
431 2
15 4118 215.236 327 9
1 800 5
20 3
13 6
32 525 77 4
42 175 6
215 4
J> 190P 192p 101
22 9226 4
9 4150 8
2 010 8
390 4
10.197 118.737.829 2
1, 620. 4
11 7
11 4
29.723 716 8
35.071 0
157.6
TRANSPORTATION AND COMMUNICATION
TRANSPORTATIONAir Carriers
Scheduled domestic trunk carriers:Financial operations (qtrly. total) :• Operating revenues total 9 mil. $
Transport, total 9 _ _ _ _ _ d oPassenger doProperty _ _ _ _ _ _ d oU.S. mail (excl. subsidy) do
Operating expenses (incl. depreciation) doNet income (after taxes) do
Operating results:Miles flown (revenue) milExpress and freight ton-miles flown doMail ton-miles flown doPassengers originated (revenue) doPassenger-miles flown (revenue) _ bil
Express Operations (qtrly.)
Transportation revenues __mil. $__Express privilege payments do
Local Transit Lines
Fares average cash rate centsPassengers carried (revenue) milOperating revenues (qtrly total) mil $
Motor Carriers (Intercity)
Carriers of property, class I (qtrly. total) :Number of reporting carriersOperating revenues total mil $Expenses, total doFreight carried (revenue) _ mil. tons__
2 8312,8052,527
18765
2,531136
822 1726 9184 761 941.9
412.4118 2
21 26 8541 408
2 1 0186 1765 890
366
3 3063, 2782,933
21874
2,886223
940.9921 6219.671 449.2
431. 4119.3
99 1r 6 785P 1 427
75 570 017 65 94.0
21 9r 594
78 074 s16 65 83.9
21 9577
8328267445318
70865
78 374 516 96 34.5
103.728 2
22 0564367
82 173 016 56 34.6
22 2520
83 677 617 26 84.9
22 2516
8858787885517
73979
79.786 717.76 14.2
106.731 1
22 2559
83 095 019 46 34.2
22 2591
78 885 219 95 93.8
22 3574
8548467476122
76249
84 599 929 46 34 5
119. 132 5
22 3605
84 975 919 86 34.4
22 3<479
78.079 420.25 84.0
22 3528
87 996 324 26 94*7
103.925.6
22 3607
P 3 5. 1
22 3579
p 3 4. 8
r Revised. *> Preliminary. J See note "d1" for this page. 2 Number of carriers filingcomplete reports for 1964. 3 AS compiled by Air Transport Assn. of America.
4 Reflects New York City 13-day transit strike.9 Includes data not shown separately.
cT Beginning Jan. 1965, indexes are based on general imports, instead of imports for con-sumption as formerly.
§Excludes "special category" shipments and all commodities exported under foreign-aidprograms as Department of Defense controlled cargo.
Digitized for FRASER http://fraser.stlouisfed.org/ Federal Reserve Bank of St. Louis
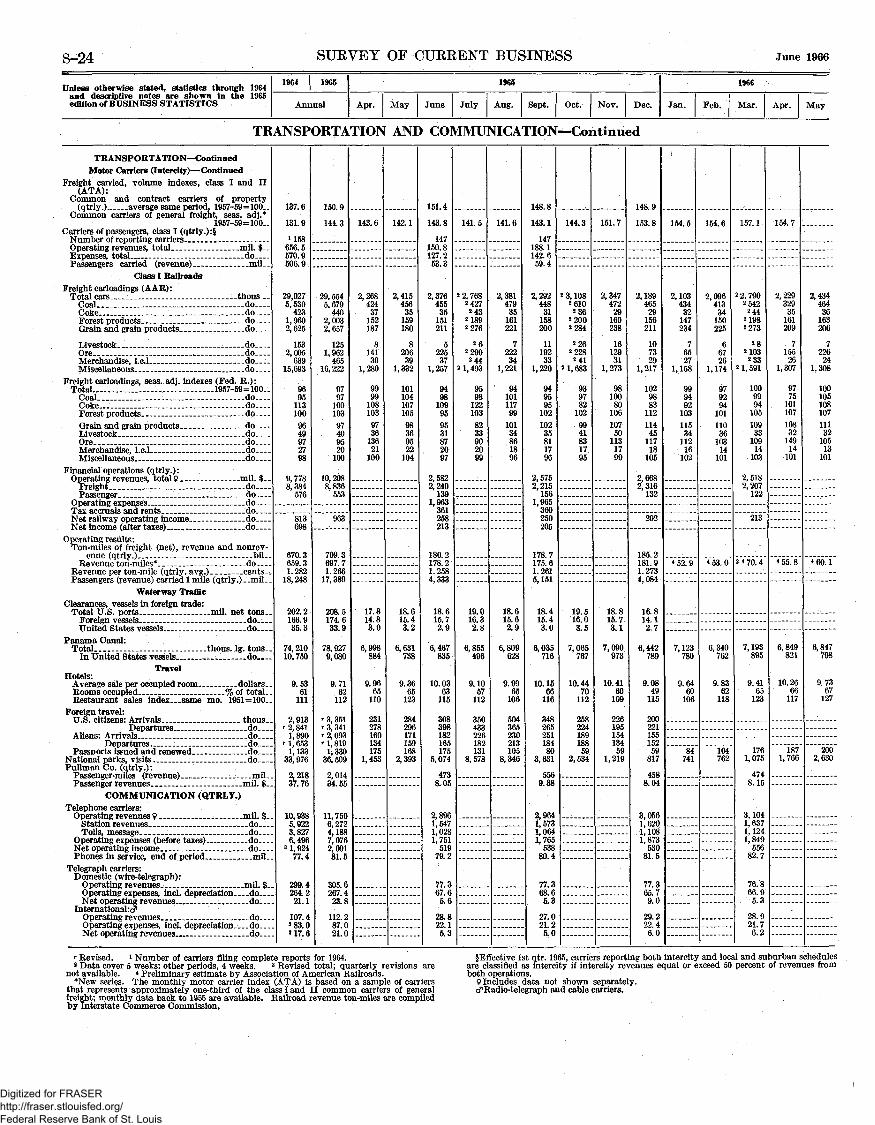
S-24 SURVEY OF CURRENT BUSINESS June 1966
Unless otherwise stated, statistics through 1964and descriptive notes are shown in the 1965edition of BUSINESS STATISTICS
1964 | 1965
Annual
1965
Apr. May June July Aug. Sept. Oct. Nov. Dec.
1966
Jan. Feb. Mar. Apr. May
TRANSPORTATION AND COMMUNICATION—Continued
TRANSPORTATION— ContinuedMotor Carriers (Intercity)— Continued
Freight carried, volume indexes, class I and II(ATA):
Common and contract, carriers of property(qtrly ) average same period, 1957-59 ~~ 100
Common carriers of general freight, seas, adj.*1957-59=100-
Carriers of passengers, class I (qtrly.) :§Number of reporting carriers _Operating revenues total mil. $Expenses, total doPassengers carried (revenue) _ _ ... _mil
Class I RailroadsFreight carloadings (AAR):
Total cars _ _ _ _ -thous _Coal... _ _ _ _ d oCoke doForest products - ' __ _ _ _ doGrain and grain products. do
Livestock . '_ ._ _ _ _ _ _ d o _ _ _Ore doMerchandise, l.c.l do__ _Miscellaneous do__
Freight carloadings, seas. adj. indexes (Fed. R.) :Total 1957-59=100
Coal doCoke... _ _ _ . _ _- doForest products doGrain and grain products _ _ _ d o _ _ _ _Livestock do _Ore . _ _ •-_ - _ _ _ _ d oMerchandise, l.c.l do__ _Miscellaneous do
Financial operations (qtrly.) :Operating revenues total 9 mil- $
'Freight doPassenger do
Operating expenses doTax accruals and rents doNet railway operating income doNet income (after taxes) do
Operating results:Ton-miles of freight (net), revenue and nonrev-
enue (qtrly ) bilRevenue ton -miles* do
Revenue per ton-mile (qtrly. avg.)_ cents__Passengers (revenue) carried 1 mile (qtrly.) ._mil__
Waterway TrafficClearances, vessels in foreign trade:
Total U S ports mil net tonsForeign vessels doUnited States vessels do
Panama Canal:Total thous. Ig. tons
In United States vessels do..Travel
Hotels:Average sale per occupied room dollarsRooms occupied % of totalRestaurant sales index__.same mo. 1951=100__
Foreign travel:U S citizens' Arrivals thous
Departures doAliens* Arrivals do
Passports issued and renewed . doNational parks, visits doPullman Co. (qtrly.):
Passenger-miles (revenue) milPassenger revenues mil $
COMMUNICATION (QTRLY.)Telephone carriers:
Operating revenue^ 9 mil $Station revenues doTolls, message do
Operating expenses (before taxes) doNet operating income doPhones in service, end of period mil
Telegraph carriers:Domestic (wire-telegraph):
Operating revenues.. mil. $Operating expenses, incl. depreciation. ___do__ _Net operating revenues do
International.'^Operating revenues doOperating expenses incl depreciation doNet operating revenues _ _ _ _ _ _ _ _ _.do_—
137.6
131.9
1158656. 5570.9506.9
29,0275,530
4231, 9602,625
1532, 005
63915,693
9695
1131009649972798
9,7788,384
576
813698
670.3659.31.282
18,248
202. 2166.935.3
74,21010,750
9.5361
111
2,913' 2, 841
1,890r 1, 653
1,13333, 976
2,21837.76
10,9385,9223,8276, 496
31,92477.4
299.4264.221.1
107.4«83.08 17. 6
150.9
144.3
29, 5545,679
4402,0032.657
1251,962
46516,222
9797
10010397409520
100
10, 2088,836
553
963
709. 3697.71.266
17,389
208. 5174. 633.9
78.9279,080
9.7162
112
' 3, 351r 3, 341••2,093' 1, 819
1,33036. 509
2,01434.55
11,7506,2724,1887,0762,09181.5
305.6267.4
23.8
112.287.021.0
143.6
2, 26842437
152187
814139
1,280
9999
1081039736
13621
100
17.814.83.0
6,998884
9.9665
110
231278160134175
1,453
142.1
2,41545635
159180
820639
1,332
10110410710598369522
104
18.615.43.2
6,631738
9.3665
123
284296171159168
2,393
151.4
143.8
147150.8127.253.3
2,37645535
151211
522537
1,257
9498
109959531872097
2,5822,240
1391,963
361258213
180. 2178. 21 2584,333
18.615.72.9
6,467835
10.0363
115
308398182165175
5,074
4738.05
2,8961 5471,0281,751
51979.2
77.367 65.6
28.822.15.3
141.5
22,7682427243
21892276
2 62290
2442 1, 493
9598
1221038233902099
19.016.32.8
6,855496
9.1057
112
350433226182131
8,578
141. 6
2,38147935
161221
722234
1, 221
9410111799
10134861896
18.615.62.9
6,809628
9.9965
106
504365230213105
8,346
148.8
143. 1
147188. 1142.659.4
2, 29244831
158200
1119233
1,220
949595
10210235811796
2,5752,215
1561, 965
360250205
178. 7175 61 2615,151
18.415. 43.0
6,035716
10.1566
116
34826525118480
3,631
5569.38
2,9641,5731,0641,765
53880.4
77.368.65.3
27 021.25.0
144.3
23,1082610236
22002284
2262228241
21,683
939782
1029941831795
19.516.03.5
7,065767
10.4470
112
25822418918859
2,534
~~
151.7
2,347472
29160238
1612931
1,273
9810080
10610750
1131799
18.815. 73.1
7, 090973
10.4160
109
22619515413459
1,219
148.9
153.8
2,189465
29156211
107329
1,217
1029883
11211445
11718
105
2,6682,316
132
292
185.2181.91.2734,084
16.814.12,7
6,442789
9.0849
115
20022115515259
817
4588.04
3,0561 6201, 1081,873
53081.5
77.365.79 0
29.222.46.0
154.5
2,10343432
147234
76527
1,158
999492
10311534
11216
102
452.9
7, 123780
9.6460
106
84741
154. 6
2,09641334
150225
66726
1,174
979294
10111036
10314
101
453.0
6,340762
9.8362
118
104762
157. 1
22,7902542
24421982273
282103233
2 1, 591
1009994
10510933
10914
103
2,5182,207
122
213
2 4 70. 4
7,193895
9.4165
123
1761,075
4748.15
3,1041,6371,1241,849
55682.7
76. 866,95.3
28.921.76.2
154.7
2, 22932935
161209
715526
1,307
9775
10110710832
14914
101
455.8
6, 849821
10.2666
117
1871,766
2, 43446436
163206
7226
241,308
10010510810711132
10513
101
460.1
6,847798
9.7367
127
2002,630
_;
r Revised. 1 Number of carriers filing complete reports for 1964.2 Data cover 5 weeks; other periods, 4 weeks. 3 Revised total; quarterly revisions are
not available. * Preliminary estimate by Association of American Railroads.*New series. The monthly motor carrier index (ATA) is based on a sample of carriers
that represents approximately one-third of the class I and II common carriers of generalfreight; monthly data back to 1955 are available. Railroad revenue ton-miles are compiledby Interstate Commerce Commission,
§Effective 1st qtr. 1965, carriers reporting both intercity and local and suburban schedulesare classified as intercity if intercity revenues equal or exceed 50 percent of revenues fromboth operations.
9 Includes data not shown separately.cf Radio-telegraph and cable carriers.
Digitized for FRASER http://fraser.stlouisfed.org/ Federal Reserve Bank of St. Louis

June 1966 SURVEY OF CUREENT BUSINESS S-25
Unless otherwise stated, statistics through 1964and descriptive notes are shown in the 1965edition of BUSINESS STATISTICS
1964 1965
Annual
1965
Apr. May June July Aug. Sept. Get. Nov. Dec.
1966
Jan. Feb. Mar. Apr. May
CHEMICALS AND ALLIED PRODUCTS
CHEMICALS
Inorganic chemicals, production:Acetylene - - mil. cu. ft__Ammonia, synthetic anhydrous (commercial)
thous. sh. tons__Carbon dioxide liquid, gas, and solid- do__ _Chlorine, gas (100% Cl2) - -do __Hydrochloric acid (100% HC1) do__Nitric acid (100% HNOs) -_ - -do _Oxygen (high purity) -_- mil. cu. ft _Phosphoric acid (100% P2O5)— -thous. sh. tons___Sodium carbonate (soda ash), synthetic (58%
Na2O) -_ _- thous. sh. tons.Sodium bichromate and chromate. __ __doSodium hydroxide (100% NaOH) _ _ . . - _ _ _._do _ _Sodium silicate (soluble silicate glass), anhydrous
thous. sh. tons__Sodium sulfates (anhydrous, refined; Glauber's
salt* crude saltcake) __ - _ thous. sh. tonsSulfuric acid (100% HsSO4) --do
Organic chemicals, production :cfAcetic anhydride _ _ _ mil. IbAcetylsalicylic acid (aspirin)- _ do__ _Creosote oil mil. gal
DDT 'mil. Ib—Ethyl acetate (85%) doFormaldehyde (37% HCHO) _ _ do. _Glycerin, refined, all grades:
Production doStocks, end of period _ do
Methanol, synthetic and natural.. mil. gal_.Phthalic anhydride mil Ib
ALCOHOL
Ethyl alcohol and spirits:Production _ _ _ _ _ _ _mil. tax gal--Stocks, end of period - - - do_ _Use for denaturation _do__Taxable withdrawals do
Denatured alcohol:Production - _mil. wine gal__Consumption (withdrawals) do_Stocks, end of period _ _ do
FERTILIZERS
Exports, total 9 thous. sh. tonsNitrogenous materials - doPhosphate materials do__ _Potash materials do
Imports, total semimanufactures 9 _ _ _ d o _ _ _Ammonium nitrate doAmmonium sulfate _ _ _ _ _ do-Potassium chloride doSodium nitrate - _ do
Potash deliveries (K^O) doSuperphosphate and other phosphatic fertilizers
(100%P205):Production. __ _ _ thous. sh. tonsStocks, end of period _ __do
MISCELLANEOUS PRODUCTS
Explosives (industrial), shipments, quarterly:Black blasting powder _ mil. IbHigh explosives. - _ _ _ _ do,
Paints, varnish, and lacquer, factory shipments:Total shipments mil $
Trade products doIndustrial finishes do
Sulfur, native (Frasch) and recovered:Production thous. Ig. tons__Stocks (producers') end of period do
PLASTICS AND RESIN MATERIALS
Production:Cellulose plastic materials mil IbThermosetting resins:
Alkyd resins __ doCoumarone-indene and petroleum polymer
resins mil IbPolyester resins doPhenolic and other tar acid resins doUrea and melamine resins do
Thermoplastic resins:Styrene-type plastic materials (polystyrene)
mil. lb-Vinyl resins (resin content basis) doPolyethylene _ _ _ _ _ _ do
15, 964
7, 634. 31, 119. 65,945.21,264.24, 732. 5153,3873,283.0
4,947.9137.9
16,389.0
564.6
1,315.622, 923. 5
11,399.2128.2
U13.3
1 123. 71117.7
J2, 839.9
320.127.6
1 397. 7i 555. 5
684.5192.9551.068.0
296.8296.6
3.4
9,578799
7,1451,026
2,799200176
1, 195363
3,088
3,465431
.91, 281. 6
2, 002. 21, 173. 4
828. 8
6,2504,227
1161.3
i 593. 6
1354.3i 316. 6i 832. 5i 570. 3
11,728.9i 2,066.8i 2,613.4
16, 548
8,607.41,173.86. 438. 91,310.04,860.0182, 4043, 845. 1
4,931.0138. 2
6, 723. 5
589.8
1.392.424,822.0
1,533.929.0
2 108. 4
144.6107.3
3,085.5
353.224.7
433.3579.1
710. 1200.5586.269.0
315.9315. 2
5.4
310.8103 1. 1963 8, 1043 1,053
177181
1,780398
3,342
3,831469
.81, 459. 4
2,169.31, 246. 7
922.6
7,3043, 425
169.6
585. 6
324.9388.0919.9595.8
2,002.52,282.03,047.4
1,425
717.694.3
533.0106.2415.1
15, 603324. 0
415.911.2
557.8
46.8
112.42, 101. 2
117.0' 2,410.0
12.88.1
256. 7
25.127.636.248.6
54.0187.052.25.6
28.026.86.0
1, 07712582668
1728
20472
459
353224
191. 9110. 381.6
5944,156
14.2
51.1
28.734.576.444.2
165.4190.8237.8
1,420
721.5107.7544. 7107.4351.5
15, 314338.1
406.812.4
569.4
46.6
119.62,116.3
116. 52.3
10. 4
13.710.1
250.3
31.430. 137.551.3
58.9190.450.85.3
27.227.55.8
83510765057
1711
13332
301
343220
201. 8121.979.9
6254,096
14.4
50.0
26.133.771.846.9
167.8181.6256. 9
1,401
707.9111.7524. 5106.2291.4
15, 057350. 9
398.511.6
549.7
45.7
105.32, Oil. 0
134. 01.99.3
13.48.7
263.0
31.625.537.346.3
55.5190.950.56.1
27.127.95.1
1,02678
82877
128
7142
116
305348
. 2387.1
216.9129.687.3
6114,002
15.8
54.5
25.435.572.948.2
168.9181.4256.4
1,385
698.2114. 2540. 0105. 8350.2
15, 064306.9
411. 89.5
572.0
45.4
108. 12, 001. 6
128.42.3
10.7
13.28.7
253.2
25.728.637.349.1
56.9191.151. 04.9
27.427.05.6
1,005126703116
16107626
199
275450
200. 6124.376.3
6273,881
11.8
47.7
28.732.166.940.0
150. 4169.9254. 3
1, 358
707.4112.6535.2102.9386.7
15, 571330.3
409.210.6
558. 4
50.3
122.02,120:9
128.02.39.0
13.58.7
252.3
30.328.236.048.1
54.9196.345.45.3
24.324.75.2
1,03997
803101
196
19122
357
304459
195. 7122.073.7
6283,825
12. 6
51.6
26.632.176.146.3
168.2185. 9262.3
1,139
701.4104.2517. 2108.9400. 714,426313.7
398.512.0
530. 1
50.8
123.12, 088. 8
156.52.68.7
11.313.2
274.1
27.929.834.147. 7
60.6196. 946.16.1
24.825.24.7
935157624120
1414
17917
234
302411
2396.3
188. 0112.675.4
5313,670
15.6
51.8
27.431.684.355.8
179.2197.5264. 7
1,399
737. 697.5
559.6116. 8448.6
15,409343.6
414.611.8
580.6
55.2
125.92, 175. 8
134.43.07. 9
9.610.9
252.8
33.732.635.147.5
74.0197.846.96.7
25.324.65.5
1,119151805129
147
2278
307
338425
178.199.778.4
6453,710
21. 4
49.1
28.330.386.160.0
171.7206.6278.8
1,380
762.187.9
542.0113.4441.0
14, 753333.5
422.711.7
563.0
52.3
121.32,060.8
128.82.68. 1
10.09.9
263.4
30.528.436. 147.1
62. 7200.345.87.5
26.327.24.4
94413567497
2110
13650
208
334463
167.990.577.4
6213,611
14.0
43.6
26.534.382.958.4
172.0203. 2267.6
1,523
816.688.5
583.2120.6465.7
15,543343. 3
431.312.2
604.1
49.6
120.32,211.7
139.82.67.9
13. 97.8
290.5
28.324.742.153.1
62.3200.5
47.65.2
25.625.55.4
89510666696
1510
18347
250
348469
.2396.8
146.873.473.4
6373,425
13.5
45.0
27.136.784.862.2
180. 7218.7282.2
1,411
846.684. 4
561.5119.5471.0
16,603361.1
411.612.4
584.5
38. 7
128.12, 168. 0
123. 12.77.5
13.46.4
278.4
28.830.339.455.0
54.8208.4
50.64.9
27.229.23.4
1,06026572558
918
18118
335
349505
164.685. 379. 3
6703,346
13.1
47.7
25.035.780.652.6
179.0215.7279.9
'1,278
' 832. 9'87.0' 517. 1' 110. 1' 437. 4
••16,065' 352. 7
386.411.4
••573.4
'44.7
111.6'2,091.5
130.62.77.6
12.38.0
269.9
28.628.636.049. 0
49. 5211.946.45. 1
24.924.34.0
1, 27230185282
1119
13917
238
363' 548
165. 187.377.8
6113,281
14. 5
'48.8
'25.7'36.3'80.1
52. 7
177.4' 214. 7260.1
1,533
918.480.8
593.5126.3449.6
18, 274373.4
439. 312.6
680.3
65.4
129.42, 260. 2
135.23.1
10.5
12.08.3
309.7
'29.830.0' 39. 6
57.3
54.6211.552.06.5
28.028.13.8
1,15027274747
1526
29044
401396
.2371.4
6733,213
17.0
59.0
28.040.587. 856. 3
191. 5221. 6291.1
129.02.88.6
14.211.9
290. 1
30.111.7
'39.154.9
1,00210378674
2020
28438
15. 9
55.9
29.238.583. 853.1
197.7221.4274.6
' Revised. i Revised annual total; revisions are not distributed to the monthly data.2 Beginning Jan. 1965, data exclude creosote in coal-tar solutions (formerly included); these
averaged 927,000gallons per month in 1964. 3 gee note "Q" for p. S-21
cfData are reported on the basis of 100 percent content of the specified material unlessotherwise indicated. 9 Includes data not shown separately.
Digitized for FRASER http://fraser.stlouisfed.org/ Federal Reserve Bank of St. Louis

S-26 SURVEY OF CURRENT BUSINESS June 1966
Unless otherwise stated, statistics through 1964and descriptive notes are shown in the 1965edition of BUSINESS STATISTICS
1964 1965
Annual
1965
Apr. May
ELECTRIC
June July Aug. Sept. Oct. Nov. Dec.
1966
Jan. Feb. Mar. Apr. May
POWER AND GAS
ELECTRIC POWER
Production (utility and industrial), total Jmil. kw.-hr__
Electric utilities, total _ _ _ doBy fuels _ _ _ _• - - do.By waterpower do
Privately and municipally owned util do _Other producers (publicly owned).. do
Industrial establishments, total. do. _By fuels doBy waterpower _ do
Sales to ultimate customers, total (EEI) _doCommercial and industrial:
Small light and power§ __do_ _Large light and power § do
Railways and railroads . _. do. _Residential or domestic _ __doStreet and highway lighting _ doOther public authorities .__ -doInterdepartmental _ _ . __do_ _
Revenue from sales to ultimate customers (EdisonElectric Institute) mil. $
GAS
Manufactured and mixed gas:Customers, end of period, total 9 thous..
Residential doIndustrial and commercial _ _ do
Sales to consumers, total 9 mil. thermsResidential ___ _ do _Industrial and commercial- _ _ d o _ _
Revenue from sales to consumers, total 9 -mil. $__Residential _ _ _ _ _ do _Industrial and commercial do
Natural gas:Customers, end of period, total 9 thous
Residential _ _ _ _ _ d oIndustrial and commercial do.
Sales to consumers, total 9 _ mil. thermsResidential doIndustrial and commercial do
Revenue from sales to consumers, total 9 —mil. $__Residential doIndustrial and commercial do
1,083,741
983, 990806, 917177, 073
806, 446177, 544
99, 75196, 5233,228
890, 356
183, 539409, 356
4, 721262, 010
8,29020, 6511,789
14,408.5
798745
52
1,541976552
165.2117.346. 9
36, 29833, 3502,908
114,34037, 69971, 293
6, 960. 23, 772. 32, 998. 1
1,156,929
1,054,790861,342193, 448
855, 632199, 158
102, 13998, 9883,151
953,441
202,128433, 342
4, 653280, 999
8,78321, 6751,859
15, 158. 8
69865542
1, 370818544
129.786.742.4
37, 13034, 1012,987
117, 90038, 76475, 434
7, 231. 73, 911. 63, 195. 9
90, 336
81, 85264, 99716, 856
67,03614, 816
8, 4848,173
311
76, 693
15,17035, 677
39322, 882
6601,771
140
1, 215. 6
93, 320
84, 74568, 13416, 610
68, 95915, 786
8,5758,257
319
75, 598
15, 51736, 336
36520,808
6551,768
149
1, 205. 1
96, 142
87, 76172, 02315, 738 ,
71, 91615, 845
8,3818,126
255
78, 238
17, 57136, 641
35721,046
6311,822
170
U243.2
70366042
300171126
29.119.19.7
36, 30833, 3962,872
27, 8058,529
18, 181
1, 676. 5884.9753.6
101, 631
93, 10277, 17815, 924
76,06217,040
8,5308,298
232
80, 576
18, 74535, 851
35723, 023
6441,775
181
1, 287. 0
103, 858
95, 24079, 57115, 670
77, 92517, 316
8,6178,407
211
83, 922
19, 53637, 269
35324,100
6751,797
192
1, 325. 8
97,081
88,87773, 87515, 002
69, Oil19, 866
8,2048,001
203
83, 712
19, 02137,183
35324, 474
7221,791
167
1,332.2
69064941
16867
100
16.59.07.4
36, 29033, 4142,836
21, 8203,351
17, 216
1, 126. 9448.8640.1
95, 722
86, 98571, 67515,310
70, 99815, 987
8,7378, 497
240
80,488
17,77036, 824
36722, 759
7731,825
169
1, 284. 0
95, 299
86, 72371, 26015, 463
70, 60616, 117
8,5768,323
252
78, 551
16, 60336,707
38122, 075
8161,811
158
1, 242. 2
102, 182
93, 48076, 96316, 517
75, 69917,781
8,7028,438
263
81,969
16, 69937,043
40824, 866
8631,971
120
1, 288. 4
69865542
349213132
32.722.110.4
37, 13034, 1012,987
29, 4769,307
18, 815
1 803.8957.8797.8
105,254
96, 46879, 89616, 571
77,84418,624
8,7868,520
266
84, 755
17, 00536, 836
40127, 589
8661,923
135
1, 326. 4
94, 962
86, 86571, 57715, 288
70, 17216, 692
8,0977,835
262
84, 418
16, 98836, 183
40627, 961
7971,944
125
1, 324. 6
101, 899
93, 05774, 89018, 167
75, 35417, 703
8,8418,527
315
84, 035
17, 03437, 711
41026, 024
7761,928
151
1, 304. 7
96, 667
88, 07971,75916, 321
71, 69416, 385
8,5878,269
318
FOOD AND KINDRED PRODUCTS; TOBACCO
ALCOHOLIC BEVERAGESBeer:
Production _ _ mil. bblTaxable withdrawals doStocks, end of period _ _ _ do
Distilled spirits (total) :Production .mil. tax gal__Consumption, apparent, for beverage purposes
mil. wine gal__Taxable withdrawals mil. tax galStocks, end of period doImports mil. proof gal--
Whisky:Production mil. tax gal. _Taxable withdrawals doStocks, end of period __doImports mil proof gal
Rectified spirits and wines, production, totalmil. proof gal__
Whisky doWines and distilling materials:
Effervescent wines:Production _ mil wine galTaxable withdrawals doStocks, end of period doImports • do
Still wines:Production... ._ doTaxable withdrawals. _ _ _ doStocks, end of period doImports... _ do
Distilling materials produced at wineries. _ _ dor Revised.{Monthly revisions for 1964 appear on p. 44 of the
all periods shown here include Alaska and Hawaii.
105. 9098.649.99
162. 94
275. 86133. 17862. 4250.60
112. 8789.44
832. 1840.81
92.2465.60
5.825.352.661.19
193. 28164. 72231. 2414.54
369.35
June 1966
108. 21100. 4110.30
185. 06
292. 99138. 52872. 9058.04
126. 8890.06
835. 8551. 10
94.0064.80
7.296.253.101.45
232. 26167. 25262. 2814.91
468. 58
SURVEY;
9.228.43
12.08
15.72
22.6310.95
870. 394.66
11.506.84
840. 214.10
7.425.06
.54
.413.47.10
3.7314.20
179. 741. 35
2.39
produc
10.059.24
12.24
14.44
22.4911.30
871.053.96
10.056.92
840. 973.43
7.244.88
.57
.443.56.12
3.2512.22
170. 521.27
3.79
,ion data
11.2110.2112.50
14.01
24.0711.95
870. 654.58
9.086.94
841. 103.93
8.105.46
.66
.513.62.10
2.5313.59
157. 011.27
3.42
for
10.429.85
12. 38
8.32
22.189.85
866. 203.41
3.765.65
836. 603.00
6.314.38
.32
.313.60.07
1.489.91
146. 16.86
3.42
§Daclassif
9Ii
9.669.61
11.68
13.04
21.7610.65
865. 424.33
9.366.62
836. 203.82
7.545.09
.52
.413.66.08
3.9213.57
137. 141.01
17.60
ta are nication ticludes d
9.088.49
11.58
15. 84
24.0211.84
865. 735.26
10.917.94
836. 224.68
8.265.78
.52
.583.54.09
49.8015.33
171. 611.19
128. 60
ot whollD anotheilata not s
7.817.50
11.28
19.11
26.6216.26
865. 316.31
11.8511.12
833. 245.64
10.968.11
.59
.733.31.20
112. 9015.85
266. 871.37
200. 11
y compa
hown se
7.717.60
10.83
20.02
30.8615. 05
865. 827.31
13.1610.47
832. 116.53
10.847.82
.77
.913.14.21
35.7216.25
279. 141.82
66.74
rable on
parately.
8.138.03
10.30
19.65
36.1510.06
872. 906.73
12.926.58
835. 855.95
6.974.50
.93
.863.10.22
9.5015.05
262. 282.01
29.91
a year
7.766.69
10.88
17.32
19. 159.40
877. 943.34
13.286.20
840. 162.94
6.403.93
.76
.403.40.11
7.3712.00
254. 721.51
11.33
to year I
7.396.66
11.07
17.02
20.5910.58
881. 603.83
12.497.50
842. 553.31
6.984.83
.79
.353.78.11
2.5812. 42
239. 59.95
4.50
asis bees
10.318.73
11.83
19.82
25.7512.07
886. 205.14
15.067.87
846. 874.49
8.505.81
.88
.484.14.12
2.5917. 62'
225. 261.38
2.82
wise of c
98.28.54
12.34
4.52
4.00
.10
1.16
hanges from one
Digitized for FRASER http://fraser.stlouisfed.org/ Federal Reserve Bank of St. Louis

June 1966 SUKVEY OF CUEEENT BUSINESS S-27
Unless otherwise stated, statistics through 1964and descriptive notes are shown in the 1965edition of BUSINESS STATISTICS
1964 1965
Annual
1965
Apr. May June July Aug. Sept. Oct. Nov. Dec.
1966
Jan. Feb. Mar. Apr. May
FOOD AND KINDRED PRODUCTS; TOBACCO—Continued
DAIRY PRODUCTS
Butter, creamery:Production (factory) __ _ mil. lb_Stocks, cold storage, end of period _ doPrice, wholesale, 92-score (N.Y.) $perlb__
Cheese:Production (factory) total mil Ib
American, whole milk do_ _
Stocks, cold storage, end of period doAmerican, whole milk do.
Imports doPrice, wholesale, American, single daisies (Chi-
cago) $ per lb__Condensed and evaporated milk:
Production, case goods:Condensed (sweetened) mil. lb__Evaporated (unsweetened) do
Stocks, manufacturers', case goods, end of period:Condensed (sweetened) mil. IbEvaporated (unsweetened) do
Exports:Condensed (sweetened) doEvaporated (unsweetened) do
Price, manufacturers' average selling:Evaporated (unsweetened) $ per case..
Fluid milk:Production on farms _ _ _ _ _ _ mil. IbUtilization in mfd. dairy products. do ...Price, wholesale, U.S. average _$ per 100 lb__
Dry milk:Production:
Dry whole milk mil. IbNonfat dry milk (human food) _ . _ do
Stocks, manufacturers', end of period:Dry whole milk doNonfat dry milk (human food) .. do
Exports:Dry whole milk doNonfat dry milk (human food) _ _ _ do
Price, manufacturers' average selling, nonfat drymilk (human food) $ per lb__
GRAIN AND GRAIN PRODUCTS
Exports (barley, corn, oats rye, wheat) mil bu
Barley:Production (crop estimate) doStocks (domestic), end of period do
On farms doOff farms _ do
Exports, including malt § _ _ _ _ _ doPrices, wholesale (Minneapolis):
No. 2, malting $ per bu__No. 3, straight do
Corn:Production (crop estimate, grain only) mil buGrindings, wet process do. _
Stocks (domestic), end of period, total. _mil. bu._On farms doOff farms do
Exports, including meal and flour doPrices, wholesale:
No. 3, yellow (Chicago) .__$ per bu__Weighted avg., 5 markets, all grades. do
Oats:Production (crop estimate) mil. buStocks (domestic), end of period total do
On farms __ _ doOff farms do
Exports, including oatmeal doPrice, wholesale, No. 2, white (Chicago)
$ per bu__
Rice:Production (crop estimate) mil bags 9California mills:
Receipts, domestic, rough mil IbShipments from mills, milled rice doStocks, rough and cleaned (cleaned basis), end
of period mil IbSouthern States mills (Ark., La., Tenn., Tex.):
Receipts, rough, from producers mil. lb__Shipments from mills, milled rice doStocks, domestic, rough and cleaned (cleaned
basis), end of period mil. lb__Exports... doPrice, wholesale, Nato, No. 2 (N.O.) $ per lb__
Rye:Production (crop estimate) mil buStocks (domestic), end of period doPrice, wholesale, No. 2 (Minneapolis) _.$ per bu__r Revised. * Preliminary. 1 See note "O" f
year. 3 old crop only; new crop not reported unbarley, oats, rye, and wheat; Oct. for corn).
1, 442. 466.5.599
1, 726. 51, 157. 4
326. 0283.678.0
.434
94.61, 888. 1
6.9185.3
62.837.3
5.99
127, 00062, 883'4.17
87.62, 176. 8
7.0108.8
13.9838.6
.146
1, 385. 8
2 402. 9309.9190. 1119.974.4
1.211.13
2 3, 584193.6
3,9562,8181, 137481. 6
1.231.23
288071062288
4.6
.70
2 73. 1
1,5231,025
185
5,5753,665
1,6702,933.086
233.321.31.28
or p. S-2til beginn
1, 337. 152.1.610
1,743.21, 155. 3
308.6271.079.3
.450
97.01, 690. 5
5.9134.8
165.3124.7
6.09
125. 06160, 577••4.26
84.81, 999. 0
5.058.2
120.0i 438. 4
.147
11,385.4
2 411. 9311.5195.2116.3165.9
1.331.27
24,171204.9
4.0993,142'9.56
i 598. 9
1.281.25
2959783680103
124.3
•74
276.9
1.4911,033
207
5,7114,020
1,641i 3. 049
.083
233.328.81.15
1. 2 orng of ne-fl
140.2132.1.595
162.1110.8
310.9271.6
8.0
.441
10.1149.4
7.0113.6
7.01.4
6.09
11, 3055,942'4.03
8.5217.3
8.8122.7
1.851.0
.145
114.8
.3.7
1.331.23
16.8
42.1
1.331.31
(4)
.77
158151
150
102341
945161
.084
146.4165.8.598
179.3129.2
342. 1299.3
7.0
.439
9.4183. 7
7.7165.9
6.31.7
6.07
12,2066,435'3.90
7.6244.6
7.7154.0
2.730.3
.145
120. 4
7.8
1.391.32
17.3
46.3
1.361.31
.5
.77
125134
91
62275
718392
.084
135.8207.9.599
179.8128.8
378.7333. 2
6.3
.439
5.4180.8
7.9199.0
3.52.0
6.07
11, 7426,354'3.87
7.7224.9
7.8154.2
1.244.4
.145
127.3
3101.8340.73 61. 1
9.3
1.39.1.27
17.1
1 9341,283
65057.5
1.341.28
32833220
3 63
.7
.74
8245
98
66M22
374247
.084
3 19 Q
1. 14 1. 16 1. il
op estimate for theT crop year (July for
106.6219. 5.602
161.3113.0
402.0354.7
4.2
.439
9.1159.2
9.1224.9
4.42.7
6.07
10, 8565,554'4.03
5.6169.8
7.6136.4
1.153.0
.146
127.5
5.2
1.341.23
16.8
51.6
1.331.26
2.3
.72
7976
70
238220
334322
.084
85.9192.5.620
142.596.7
415.0364.3
4.2
.441
8.5152. 7
8.5235.6
6.92.4
6.08
10, 0464,800'4.20
4.7131.2
6.8109.8
3.163.3
.147
120.3
5.0
1.281.26
' 18.5
48.8-
1.281.21
2.9
.72
6528
87
907244
70997
.082
74.6161.1.627
127.982.1
386. 6340.6
5.3
.449
5.6136.0
7.3228.2
2.62.3
6.11
9,4044,055'4.43
5.4100.6
6.074.0
1.169.2
.148
124. 3
400.7257.2143.5
6.8
1.271.25
17.3
31,17036043 56643.3
1.281.23
944806139
4.3
.71
5946
72
1,547385
1,356151
.082
afi n
78.8124.8.636
126.877.3
351.9310.5
6.4
.457
7.5123.0
7.5200.6
5.52.5
6.13
9,4463,866'4.56
6.2102.0
4.965.4
1.864.6
.148
134. 8
8.5
1.311.28
17.9
52.9
1.191.19
5.6
.70
17337
122
1,403442
1,859245
.080
78.283.0.641
119.470.0
335.3297.2
9.3
.470
9.0110. 1
7.5166.4
3.01.8
6.11
9,1063,722'4.64
7.3105.2
4.359.2
1.821.5
.149
144.2
8.3
1.381.36
17.4
73.6
1.141.14
6.9
.72
11277
180
482408
1,787440
.082
90.352.1.646
130.076.1
308. 6271.0
11.4
.490
10.5119.5
5.9134.8
10.02.7
6.12
9, 5564,070'4.62
7.6130.7
5.058.2
1.214.0
.150
132.4
311.5195.2116. 3
5.1
1.341.33
15.8
4,0993,142'95666.7
1.211.19
783680103
1.1
.77
13385
207
337400
1,641292
.082
9.R 8
100. 233.7.601
131.880.9
301.1262.9
11.4
.492
9.5117.0
5.2103.2
8.72.1
6.14
9,8654,3624.54
8.4129.8
5.059.6
1.216.9
.151
112.0
4.2
1.371.35
16.0
48.9
1.291.27
.3
.78
121137
158
332360
1,527335
.082
92.526.6.627
127.778.6
277.6238.3
7.2
.501
9.2119. 4
5.461.9
2.02.2
6.33
9, 2544, 215
4. 55
7.3124.0
6.253.8
.1.76.4
.152
127.9
6.3
1. 401.38
15.2
51.5
1.291.24
.6
.78
8049
162
195316
1,350207
.082
1. 16 1.13 1.15 1.17 1.13 1.18 1.25 1.224 Less than 50, 000 bu. 5 Beginning June 1965, data include ship§ Excludes oearl barley.9 Bags of 100 Ib.
103.225.5.643
157.6100.3
270.7230.411.1
.524
9.2148. 9
6.640.2
9.73.1
6.46
10, 6455,0354.54
6.8144.8
5.947. 5
2.016.2
.156
161.3
199.3105 493 94.5
1.361.35
18.0
2,8992,160
74065.7
1.251.22
54846187
.8
.77
126105
143
133291
1,170233
.083
24.71.16
>ments tc
107.5'34.3
.632
164. 6112.7
'296.9' 252. 9
7.8
.507
9.3166.0
5.873.6
4.73.4
6.55
10,8745,2894.45
8.2170.5
6.778.1
1.028.8
.169
160.6
7.9
1.321.29
17.0
64.6
1. 281.24
3.4
.75
9559
191
108253
1,002205
p. 083
1.17
> Gov't. a
53.4.641
314. 8268.9
.500
11, 707
4.33
1.331.30
16.8
1.281.26
.74
1.14
igencies.
Digitized for FRASER http://fraser.stlouisfed.org/ Federal Reserve Bank of St. Louis

S-28 SURVEY OF CUKKENT BUSINESS June 1966
Unless otherwise stated, statistics through 1964and descriptive notes are shown in the 1965edition of BUSINESS STATISTICS
1964 1965
Annual
1965
Apr. May June July Aug. Sept. Oct. Nov. Dec.
1966
Jan. Feb. Mar. Apr. May
FOOD AND KINDRED PRODUCTS; TOBACCO—Continued
GRAIN AND GRAIN PRODUCTS— Con.
Wheat:Production (crop estimate), total mil. bu__
Spring wheat doWinter wheat do
Distribution do
Stocks (domestic), end of period, total doOn farms doOff farms do
Exports total, including flour doWheat only do
Prices, wholesale:No. 1, dark northern spring (Minneapolis)
$ per bu__No. 2, hd. and dk. hd. winter (Kans. City)_doWeighted avg., 6 markets, all grades do
Wheat flour:Production:
Flour thous sacks (100 Ib )Operations, percent of capacityOffal thous sh tons
Grindings of wheat thous buStocks held by mills, end of period
thous. sacks (100 Ib.)--Exports doPrices, wholesale:
Spring, standard patent (Minneapolis)$per!001b__
Winter hard 95% patent (Kans City) do
LIVESTOCK
Cattle and calves:Slaughter (federally inspected) :
Calves thous animalsCattle do
Receipts at 26 public markets doShipments, feeder, to 8 corn-belt States doPrices, wholesale:
Beef steers (Chicago) $ per 100 lb__Steers, stocker and feeder (Kansas City)__do ..Calves, vealers (Natl. Stockyards, 111.) _ _ d o _ _ _ _
Hogs:Slaughter (federally inspected) ___thous. animals. _Receipts at 26 public markets _ doPrices:
Wholesale, average, all grades (Chicago)$per!001b__
Hog- corn price ratio (bu. of corn equal in valueto 100 Ib. live hog)
Sheep and lambs:Slaughter (federally inspected) __ -thous. animals. _Receipts at 26 public markets doShipments, feeder, to 8 corn-belt States doPrices, wholesale:
Lambs, average (Chicago) _ SperlOOlb
MEATS AND LARD
Total meats:Production (carcass weight, leaf lard in) , inspected
slaughter mil IbStocks (excluding lard), cold storage, end of
period _ __ __ _ _ mil. IbExports (meat and meat preparations) doImports (meat and meat preparations) do
Beef and veal:Production, inspected slaughter doStocks, cold storage, end of period... _ _doExports doImports doPrice, wholesale, beef, fresh, steer carcasses, choice
(600-700 Ibs.) (New Y o r k ) _ _ _ _ _ _ _ _ _ _ _ _ _ $ per lb__Lamb and mutton:
Production, inspected slaughter mil IbStocks, cold storage, end of period do
Pork (including lard), production, inspectedslaughter mil Ib
Pork (excluding lard):Production, inspected slaughter doStocks, cold storage, end of period __doExports doImports doPrices, wholesale:
Hams smoked composite $ per IbFresh loins, 8-12 Ib. average (New York) . -do.
Lard:Production, inspected slaughter mil IbStocks, dry and cold storage, end of period— doExports doPrinp. whnlpsalp rpfinpri fnhinaorA <fc npr 1V>
1 1, 2911266
i 1, 0251,458
1, 449390
1,060
819.5746.2
2.061.861.92
265, 62193.5
4, 941602, 209
5,06831, 475
5. 6525. 390
4,82025,13314, 7797,096
22.8619.7926.21
71, 667- 19,114
14.89
13.2
12, 9474,4362,547
21.93
29, 676
702665
1,088
15, 653328
57841
.398
62413
13,399
10, 445284133210
.458
.443
2,15312768213R
* 1, 3271303
i 1, 0241,438
1,339408931
3694.03 646. 3
1.831.581.70
254, 58490.9
4,693575,874
4,3143 20, 464
5.7845.464
5,07626, 61413, 9947,230
25. 8122.5027.17
63, 70815, 386
20.98
18.1
11, 7103,4502,157
24. 29
28,336
4843537
1,012
15, 995269345718
.433
57612
11,766
9,330152353262
.542
.532
1,77262
3251i «
,
68.862.3
1.811.541.67
20,12883.3373
45, 511
2,792
5.5855.280
4112,021
911354
25.0122.0429.50
5,8021,274
17.26
'14.0
989199136
23.25
2,352
6754472
1,235235
439
.418
4911
1,067
849335
528
.485
.453
15914738
1KR
65.462.6
1.811.521.65
19, 65689.5364
44, 331
1,195
5.5735.260
3402,043
995359
26.4022.6827.00
4,7191,199
19.86
16.0
918229115
26.50
2,165
6104487
1,239216
262
.446
4511
881
692292
319
.498
.512'
13810720
iAn
32828182 1332 685
59.756.1
1.811.461.61
23, 50097.1433
53, 188
4,8461,554
5.7405.360
3782,2191,152
328
27.4423.8827.50
4, 7171,260
22.26
18.1
966294136
26.00
2,288
4933781
1,330182
254
.462
4510
894
698224
422
.531
.587
1449814
144
68.264.9
1.861.501.64
18, 68980.9346
42, 328
1,403
6.0135.653
3872, 2381,045
338
26.7123.2225. 50
4,4301,090
23. 09
18.9
976278113
24.75
2,194
4423793
1,323177
266
.446
4610
824
656176
321
.563
.571
1228229
ifii
63.658.3
1.791.591.70
22, 16991.6408
50, 275
2, 277
5.9385.610
4282,3371,254
533
27.0122.9723.50
4,7501,166
23.88
20.2
973334191
23.75
2, 283
3994598
1,370186
287
.450
4610
867
699135
421
.572
.564
1226913
1K1
436
1, 708563
1 146
69.464.2
1.841.611.76
23,307101.8
43152,838
4,1362,250
5.8755.577
4782, 4061,304
906
26.9322.9225.00
5, 4751,228
22. 49
18.7
1,106382342
23.00
2,459
40050
102
1,413201
371
.450
5310
993
795126
423
.542
.557
1446219
ifia
67.260.6
1.841.631.72
23,399102.1
42852, 816
2,826
5.9755.600
4922,3901,4121,261
26.5822.8825.00
5,4211,231
23.19
21.6
1,032384392
23. 50
2,462
41156
104
1,410211
272
.439
5013
1,002
802128
623
.575
.576
1465916
IRK
55.251.0
1.881.651.76
21,29693.0388
48, 105
1, 775
5.9885.617
4702,3341,4971,403
26.3323.0227.00
5, 5031, 357
24. 07
23.7
943359187
23.75
2,465
4535593
1,383244
665
.435
4712
1,035
817141
621
.622
.585
1586610
IK»
369
1,339408931
59.555.0
1.871.641.75
21, 54385. 5392
48, 642
4,3141,924
5.9635.617
4332,3141,128
710
26.4124.1229. 50
5,0101, 263
26.85
24.8
910271161
25.88
2,386
4845099
1,397269
361
.441
4612
943
751152
430
.702
.616
1396221
IKR
58.556. 3
1.861.661.75
20, 16987.7368
45, 735
955
5.9885.617
3822, 3041, 110
484
26.6524. 6432.00
4,7191,161
27.26
23.9
907254107
27.88
2,348
4874292
1,413262
558
. 449
4710
888
711158
226
.675
.643
129706
IRQ
69.567.9
1.891.651.77
'19,621••89.6
35744, 294
711
5.9885.567
3762,037
943389
27.5526. 3837.50
4,6501,091
.27. 15
23.7
78520680
28.25
2, 143
50935
101
1,244256
264
.453
4111
858
701186
427
.657
.639
1146915
171
438
901257644
9U.487.7
1.871.641.74
' 23, 013'90.7'416
'51,811
4,0861, 155
5.913'5.540
4592, 232
4.1,110513
28.9627. 6236.00
5, 80641,316
24. 00
21.4
1, 0334314
120
26.75
2,500
5284394
1,367236
350
.469
5413
1, 078
878217
431
. 625
.568
1447718
IRQ
83. 677. 7
1.841.651.72
20, 79689.7376
46, 833
2, 532
p 5. 901v5. 540
3702,103
932466
27.7326. 74
^35.00
5,3031, 291
21.72
19.1
972279172
25.75
2,349
58532
107
1,291'225
265
.460
5018
1,008
804'372
329
p . 537.533
149935
p. 150
1.871.741.78
961
26.5426.31
1,245
22.25
18.7
315
27.12
560
210
.442
19
265
.562
r Revised. » Preliminary.1 Crop estimate for the year.
2 Old crop only; new grain not reported until beginning of new crop year (July for wheat).3 See note "O" for p. S-21. 4 Beginning March 1966, data are for receipts at 28 markets.
Digitized for FRASER http://fraser.stlouisfed.org/ Federal Reserve Bank of St. Louis

June 1066 SURVEY OF CURRENT BUSINESS S-29
Unless otherwise stated, statistics through 1964and descriptive notes are shown in the 1965edition of BUSINESS STATISTICS
1964 1965
Annual
1965
Apr. May June July Aug. Sept. Oct. Nov. Dec.
1966
Jan. Feb. Mar. Apr. May
FOOD AND KINDRED PRODUCTS; TOBACCO—Continued
POULTRY AND EGGSPoultry:
Slaughter (commercial production) mil. lb__Stocks, cold storage (frozen), end of period, total
mil. lb__Turkeys do
Price, in G~eorgia producing area, live broilers$ per lb._
Eggs:Production on farms mil. cases OStocks , cold storage, end of period:
Shell thous. cases 0Frozen _ mil. Ib _
Price, wholesale, extras, large (delivered; Chicago)$perdoz._
MISCELLANEOUS FOOD PRODUCTS
Cocoa (cacao) beans:Imports (incl shells) thous. Ig. tonsPrice, wholesale, Accra (New York).___$ per lb._
C off ee (green):Inventories (roasters', importers', dealers'), end
of period - - - thous. bagscf _Roastings (green weight) do
Imports total doFrom Brazil do
Price, wholesale, Santos, No. 4 (New York)$perlb__
Confectionery, manufacturers' sales mil. $
Fish:Stocks, cold storage, end of period— _ mil. lb__
Cuban stocks, raw, end of periodthous. Spanish tons__
United States:Deliveries and supply (raw basis) :§
Production and receipts:Production thous. sh. tonsEntries from off-shore, total 9 do. _
Hawaii and Puerto Rico do
Deliveries, total 9 _ _ do _ _For domestic consumption do
Stocks raw and ref., end of period - do
Exports raw and refined sh tonsImports:
Raw sugar, total 9 _ _ _ __thous. sh. tons_From the Philippines do
Refined sugar, total do _
Prices (New York) :Raw, wholesale -- $perlb_.Refined1.
Retail (incl N E New Jersey) $per51bWholesale (excl excise tax) $ per Ib
Tea imports thous. Ib
Baking or frying fats (incl. shortening) :Production mil. IbStocks (producers' and warehouse), end of period
mil IbSalad or cooking oils:
Production -- doStocks (producers' and warehouse), end of period
mil IbMargarine:
Production doStocks (producers' and warehouse) , end of period
mil IbPrice, wholesale (colored; mfr. to wholesaler or
FATS, OILS, AND RELATED PRODUCTS
Animal and fish fats:ATallow, edible:
Consumption in end products doStocks (factory and warehouse) , end of period
mil IbTallow and grease (except wool) , inedible:
Production (Quantities rendered) doConsumption in end products doStocks (factory and warehouse) , end of period
mil IbFish and marine mammal oils:
Production doConsumption in end products doStocks (factory and warehouse) , end of period
mil IK
7,546
357207
.137
178.9
6258
.331
268. 4.234
4,47022, 374
22, 8237,212
.4791,395
215
198
4,4085, 5051, 903
9.7069, 6712,700
4, 222
3,5061,171
84
.069
.657100
133, 592
2,664.1
121 1
2, 846. 1
118 8
1, 857. 4
48 0
241
553 2464 0
41 7
4 565 72 301. 4
366 4
180.280.9
12Q Q
7, 998
315200
.145
179. 4
8551
. 328
354. 4.172
' 3, 14321, 680
21, 2905, 742
.451' 1, 415
230
973
4,1535,7961,966
10,15110, 0212, 647
i 2, 359
3, 7831,055
82
.068
. 595095
130, 358
2, 792. 5
116 6
2, 773. 1
85.9
1,904,4
41 6
261
530 1434 5
31 1
4 302 52 158 0
418 5
190 279.8
185 2
541
215'106
.145
15. 5
5356
.308
25.5.164
1 659333
.458109
137
' 3, 288
1081, 502
250
775756
2,490
403
333138
6
. 066
.588093
15 994
210.8
115 8
213.7
170 0
154.3
51 5
263
39 937 5
35 0
350 7172 5
418 9
9.96.5
i i f l n
563
17782
'.153
16 0
32167
.273
40.2.159
1 554386
.45384
152
' 3, 598
145245240
855846
2,420
196
373829
.068
. 591093
10, 463
224.2
122 3
242.6
156 1
142.0
51 5
263
45 335 8
34 9
351 0179 6
371 7
22 35.7
19fi 4
645
15970
' . 153
15.0
52584
.294
37.7.134
2,6125,330
1 831457
.46094
166
3,525
83253239
883876
2,170
71
368724
.068
.595095
11, 028
219. 9
122 9
270. 6
149 0
145. 1
47 0
263
39 634 8
29 8
352 2181.6
353 5
40.16.8
148 1
683
17788
'.151
15 0
52198
.298
26.0. 118
1 206278
.45575
192
3,055
65401198
957950
1,928
290
188696
.067
. 592095
6,372
204. 2
106 4
229.4
125 7
142.9
48 5
263
40 630 4
27 6
325 1149.5
354 5
40.66.4
ififi i
773
239147
'.149
14 6
423100
.341
36 2.161
1 556411
. 455104
210
2,823
98317191
1, 006996
1, 658
166
362156
2
.068
.591095
9,173
240.2
103 2
226.4
85 5
148.6
44 5
261
43 139 7
23 9
343 9195 0
320 4
37.77.6
9fU 4
847
343244
'.137
14 1
32195
.384
48 5.171
2,6675 112
1 812551
.445162
228
2, 133
120355141
1,0231,0071,291
121
41213710
.068
.594095
14 543
274.6
97 6
218.4
65 9
164.9
41 9
261
45 547 5
21 5
368 7187 7
351 3
17.87.1
1Q9 1
877
470363
'.134
14 6
23481
. 391
32 4.171
2 666802
.438152
231
1,598
612316114
826815
1,552
106
444717
.069
.596096
9, 123
281.6
105 7
213.5
62 2
161.6
47 2
261
45 145.3
22 6
355.8184.5
368 3
9.16.8
177 R
819
391280
' . 141
14 4
12664
.410
27 2.184
2 549736
.438145
232
1,098
96115085
786777
2,166
137
350852
.068
.604
.096
13, 724
270. 4
113.1
231.3
80.3
168.7
45 3
261
48 936 5
26 0
364.7190 1
391 5
8.27.5
901 4
695
315200
.140
15 0
8551
.411
25 2.213
3, 1435,837
2 254846
.440129
230
973
9338339
874863
2,647
321
430108
8
.067
.606
.096
12, 504
255.4
116 6
257. 7
85 9
175.4
41 6
261
44 629 6
31 1
376 4179.2
418 5
3.07.3
185 3
589
284181
.155
15 0
7638
.375
41 9.239
1 829488
.440120
210
1,000
4811,831
132
682673
2,738
76
15938
(2)
.068
.605
.096
10, 447
266. 2
114 2
254.5
98 9
185.5
44 0
261
47 735! 4
36 8
366. 7196.7
435 2
.55.4
168.1
522
249156
.155
13 7
2028
.412
57 7.221
2 013545
.425127
175
1, 570
221294196
783777
2,600
62
260106
1
.069
.611098
9,352
266.3
118 8
238. 1
87 9
172.7
48 4
261
47 644.7
36 6
346.1190. 5
446 5
.3'7.0
158.8
554
201122
.165
15 6
2824
.423
46 6.233
3, 1735 657
2 382'529
.420131
162
2,480
194331203
831817
' 2, 519
1 765
313149
4
.068
.615098
14,677
265. 2
118 4
'271.8
'79 0
188. 5
'58 5
261
'45 436.5
'40 8
'370.6'208. 2
'440 2
.5'7.0
' 137. 4
605
' 16992
.150
15 4
4233
. 385
29 2.259
1 965597
.423
162
2,990
134231235
750739
'2,514
155
303117
(2)
.069
.616P. 095
13, 778
242.5
132 1
241. 0
96.3
164.0
55 8
v 261
41 434.6
40.9
335.4188.1
413 9
5.16.4
135. 1
15069
.160
15 8
7443
.319
.244
.413
163
2,675
258260
p 2, 313
.069
r Revised. * Preliminary. ! See note "O" for p. S-21.O Cases of 30 dozen. d" Bags of 132.276 Ib.
2 Less than 500 short tons. § Monthly data reflect cumulative revisions for prior periods. 9 Includes data notshown separately; see also note "§". A For data on lard, see p. S-28.
Digitized for FRASER http://fraser.stlouisfed.org/ Federal Reserve Bank of St. Louis

S-30 SURVEY OF CUKEENT BUSINESS June 1966
Unless otherwise stated, statistics through 1964and descriptive notes are shown in the 1965edition of BUSINESS STATISTICS
1964 | 1965
Annual
1965
Apr. May June July Aug. Sept. Oct. Nov. Dec.
1966
Jan. Feb. Mar. Apr. May
FOOD AND KINDRED PRODUCTS; TOBACCO—Continued
FATS, OILS, AND RELATEDPRODUCTS- Continued
Vegetable oils and related products:Coconut oil:
Production:Crude _ _ _ mil. IbRefined . do _ _
Consumption in end products doStocks, crude and refined (factory and ware-
house) , end of period™ mil. lb_Imports do
Corn oil:Production:
Crude doRefined - do
Consumption in end products _ _ _ doStocks, crude and refined (factory and ware-
house) , end of period - - mil. Ib
Cottonseed cake and meal:Production thous. sh. tonsStocks (at oil mills) , end of period do__ _
Cottonseed oil:Production:
Crude mil. IbRefined do
Consumption in end products doStocks, crude and refined (factory and ware-
house) , end of period mil. IbExports (crude and refined) doPrice wholesale (drums; N.Y ) $ per Ib
Linseed oil:Production crude (raw) mil. IbConsumption in end products doStocks, crude and refined (factory and ware-
house) , end of period mil IbPrice, wholesale (Minneapolis) $ per lb_.
Soybean cake and meal:Production thous. sh. tonsStocks (at oil mills) , end of period -- do _
Soybean oil:Production:
Crude - mil. IbRefined do
Consumption in end products doStocks, crude and refined (factory and ware-
house) end of period mil IbExports (crude and refined). doPrice, wholesale (refined; N.Y.) $ per lb_.
TOBACCOLeaf:
Production (crop estimate) mil IbStocks, dealers' and manufacturers' end of period t
mil IbExports incl scrap and stems thous IbImports incl scrap and stems do
Manufactured:
Consumption (withdrawals):Cigarettes (small):
Tax-exempt millionsTaxable do
Cigars (large), taxable doManufactured tobacco, taxable thous. lb__
Exports cigarettes millions
327.6506.0765. 4
154.0397.1
413.9393.1412.2
40.1
2, 705. 7126.8
1, 932. 81, 600. 01, 410. 0
506.3603.5.141
443.6377.2
185.5.134
10, 635. 2102.6
4, 943. 84, 591. 84, 423. 6
544.21, 273. 2
.123
r 2 2, 228
5, 664514, 514179, 651
180, 082
42, 643497, 446
8,106175, 80825, 144
365.4488. 1723.5
154.4383.6
446.1412.8421.5
26.1
2, 755. 580.9
1,974.21, 668. 81, 471. 7
300.1501.3i .149
410. 1239. 4
213.5.134
11, 179. 174.6
5, 235. 54, 547. 34, 423. 3
374.81, 026. 7
.134
' 2 1, 855
' 5, 582468, 075243, 347
166, 617
45, 046511, 463
7,577160, 62423, 052
27.540.860.3
169.747.3
36.032.230.0
41.5
222.7220.7
164.6135. 5110.8
583.434.1.164
28.520.5
212.3.139
882.0194.0
415.9367.1340.8
578.491.7.145
42, 51938, 749
14, 213
4,01443, 483
63313, 7182,094
32.547.163.7
181.338.8
36.134.335.8
38.4
181.9238.5
135. 0119.6106.8
560.026.9.146
22.322.3
205.0.139
944.1239.5
448.0373.5368.3
573.385.1.129
35, 73715, 163
13,143
3,91940, 841
71413, 2282,795
23.542.163.2
156.022.7
38.231.834.1
39.6
126.1207.6
93.098.9
121. 5
492.550.3.138
31.323.4
198.2.137
856.2205.3
406.0390.9397.5
522.178.2.121
' 5, 23136, 11616, 687
15, 141
3,84647, 063
65914, 9062,109
24.925.644.5
137.80
36.431.135.8
39.3
98.9168.5
72.692.1
105. 8
420.641.5.137
15.721.5
184.6.134
846.4163.7
403.2340.2362.6
499.061.0.121
36, 13714, 210
12, 112
3,67239, 727
60712, 6361,831
30.641.463.2
123.57.1
38.837.935.3
38.5
71.9110.8
50.080.3
113. 0
292.554.6.135
37.221.0
180.7.133
856.5133.9
408.2375.8373.8
423.099.3.132
32, 55416, 181
15, 032
4,90746, 647
69714, 5531,984
19.735.659.6
114.924.8
40.734.836.6
35.4
191.077.7
132.795.3
133.4
236.230.6.135
48.720.4
184.7.128
697.274.2
329.5357.6385.3
297.489.9.138
'5,32350,42515, 382
14, 847
4,02144, 084
65814, 0241,948
28.742.360.8
106.834.4
40.139.038.5
32.0
297.991.0
212.1149.0145.9
243.618.1
45.918.8
188.2'.128
999.797.2
474.8353.2366.2
373.028.5.132
44, 05113, 061
14,956
3,74741,771
67014, 5051,920
38.239.957.1
127. 018.7
36.537.337.6
28.6
338.496.1
236.5176.5130.1
281.137.9.155
33.517.1
199.9.128
1, 125. 6104.3
510.1423.2399.9
401.136.6.137
71, 27314,937
13, 666
3,69443,446
69612, 6511,701
36.838.560.3
154.411.1
36.035.336.6
26.1
332.880. 9
230.9193.5130.0
300.148.8.153
40.916.3
213.5.127
1,135.274.6
519.8445.2429.1
374.8168.7.132
' 5, 58262, 28811, 527
11, 799
4,05337, 720
4459,9582,290
27.647.865.6
131.7109.5
35.430.330.0
30.3
334.494.6
232.6181.4131.0
335.649.8.164
37.517.3
216.9. 128
1,163.8105.0
533.2468.6453.5
414. 844.6.142
31.97015, 245
4,08839, 348
571
1,515
21.243.759.1
146.343.7
34.331.232.2
29.6
305.4115.0
214.7166.4125.4
366.330.0.168
38.116.8
225.6.128
1,042.7113.7
478.4416.5415. 8
444.242.1.144
29, 52514, 495
3,52442, 985
525
2,019
24.7'52.5'70.7
' 176. 587.2
' 40. 534.731.7
34.8
' 287. 6' 156. 7
' 202. 4' 204. 2' 132. 0
r 396. 037.7
'.171
43.1'21.3
' 225. 9.128
'1,142.8' 121. 6
' 526. 3' 476. 4' 466. 5
' 485. 045.6
'.136
' 5, 48239,28513, 523
4,57747, 053
630
2,190
(d)46.061.3
155.310.4
38.238.931.9
42.5
197.4189.6
139. 2147.7112. 2
508.610.8
v .178
41.920.0
246.9p . 128
'1,010. 1'115.4
480.4417. 3406.1
522.833.2
p .139
23, 19116, 413
4,04039, 582
571
2,414
158.5213.0
1, 165. 2152.5
LEATHER AND PRODUCTS
HIDES AND SKINSExports:
Value, total 9 thous $Calf and kip skins thous skins
Imports:Value total 9 thous $
Goat and kid skins doPrices, wholesale (f.o.b. shipping point):
Hides steer heavy native over 53 Ib do
LEATHERProduction:
Calf and whole kip. _ .thous. skins. _Cattle hide and side kip thous. hides and kips_ _Goat and kid - - -- thous. skins.Sheep and lamb do_ _
Exports:Glove and garment leather thous. sq. ftUpper and lining leather do
Prices, wholesale:Sole, bends, light, f.o.b. tannery $ per lb__Upper, chrome calf, B and C grades, f.o.b. tan-
nery _ $persq. f t _ _
92, 6932 391
n efl4.
81 879on AKZ
12 882
A-IA
106
6,53522, 83412, 87431, 548
46, 49642, 582
.662
1.200
106, 2532 458
i q qi 1
80 263qi oen14, 411
KA-I
143
' 6, 263'23, 43614, 557
'30,316
p 69, 953
.725
1.244
10, 244226
1 994.
9 330A OCO
1,893
eon
116
5062,0221,248
'2,515
6, 577
.700
1.243
11, 809210
1 496
7,3539 7QQ
1,409
550139
532'1,938
1,162' 2, 656
6,804
.710
1.252
10, 023218
1 219
6 2981 8251,430
525134
574'1,987
1,317' 2, 647
5,207
.710
1.248
9,720186
1 147
7,6643 763
820
coc
156
397' 1, 569
1,071' 1, 922
4,836
.710
1.238
8,131190928
5,5451 9991,282
550194
496' 1, 982
973' 2, 763
.790
1.238
7,737190841
6,7722 6071,225
550.174
464' 1, 958
1,066' 2, 600
.765
1.230
10, 513161
1 339
6, 0832 271
966
575.166
468' 2, 038
1,296' 2, 511
.735
1.247
9,655253
1 036
4,9681 382
968
575.159
542' 2, 071
1,434' 2, 756
.750
1.253
12, 703311
1 277
5,7511 7321,391
625.164
'528'2,065
1, 523' 2, 697
fi G1 ft
.750
1.271
9,645241935
5,1951 2311,130
625.174
5001,9651,3712, 550
fi Q7/1
.770
1.280
13, 782295
1 236
6,7872 841
794
700.194
4451,9271,255
6 346
1.300
15, 623330
1 320
11, 0525 5481,142
775.174
4642, 1491,423
7 164
'.940
' 1. 293
11, 797183927
9,5004,541
856
p .675P .184
5 741
p .900
p 1. 333
' Revised. p Preliminary. d Data withheld to avoid disclosure of operations ofindividual firms.
1 Average of months shown.2 Crop estimate for the year.
3 Effective Jan. 1965. data are for all leather, except sole and rough; see note "O" for p. S-21.JRevisions for 2d qtf. 1963-4th qtr. 1964 (mil. Ib.): 4,692; 4,791; 5,287; 5,355; 4,961; 5,069; 5,664.
9 Includes data for items not shown separately.
Digitized for FRASER http://fraser.stlouisfed.org/ Federal Reserve Bank of St. Louis

June 1966 SURVEY OF CURRENT BUSINESS S-31
Unless otherwise stated, statistics through 1964and descriptive notes are shown in the 1965edition of BUSINESS STATISTICS
1964 | 1965
Annual
1965
Apr. May June July Aug. Sept. Oct. Nov. Dec.
1966
Jan. Feb. Mar. Apr. May
LEATHER AND PRODUCTS—Continued
LEATHER MANUFACTURES
Shoes and slippers: JProduction, total thous. pairs
Shoes, sandals, and play shoes, except athleticthous. pairs. _
Slippers _ _ - -- -- --do_ _Athletic doOther footwear do
Exports - - do _
Prices, wholesale, f.o.b. factory:Men's and boys' oxfords, dress, elk or side
upper Goodyear welt 1957-59=100Women's oxfords, elk side upper, Goodyear
welt - 1957-59=100-.Women's pumps, low-medium quality. —do
612, 789
516, 12479, 2677,116
10, 282
1, 912
105.9
106.5111.0
••630,012
••535,311' 85, 938'6,712r 2, 351
i 2, 533
111 0
107.3113. 0
52, 365
44, 8376,699
629200
247
109 6
106.5111.2
49, 436
41, 5577,097
580202
171
109 6
106.5111.3
51, 145
43, 0847,241
587233
115
109 6
106. 5111.2
46, 268
39, 7825,974
353159
191
109 6
106.5112.8
57, 105
48, 1848,185
549187
231
110 1
106.5112.4
53, 859
44,3588,714
571216
237
110 1
106.5112.4
51, 760
41, 7959,224
503238
285
116 5 •
109.7117.3
50, 270
40, 9698,566
544191
255
116 5
109. 7116.6
'52 673
'45,440r 6 554
'506r 173
221
116 5
109 7117.0
52 718
46, 6335 356
521208
186
116 5
109 7118.3
167
116 5
109 7119.3
274
116 5
109 7119.3
260
120 3
111 4121.2
LUMBER AND PRODUCTS
LUMBER—ALL TYPES
National Forest Products Association: cfProduction, total mil. bd. ft
Hardwoods . . . _ _ do. _Softwoods do
Shipments, total _ _ _ _ ..doHardwoods doSoftwoods do
Stocks (gross) , mill, end of period, total doHardwoods doSoftwoods _ _ . do. _
Exports, total sawmill products _ doImports, total sawmill products do_ .
SOFTWOODDouglas fir:
Orders, new ..mil. bd. ft ._Orders, unfilled, end of period . _ _ .-..do .
Production . doShipments _ _ _ _ _ .. .doStocks (gross) , mill, end of period .do __
Exports, total sawmill products. doSawed timber doBoards, planks, scantlings, etc do
Prices, wholesale:Dimension, construction, dried, 2" x 4", R. L.
$per M bd. ft_.Flooring, C and better, F. G., I" x 4", R. L.
IperMbd. ft..Southern pine:
Orders new mil bd ftOrders, unfilled, end of period do
Production _ _ _ __doShipments doStocks (gross) , mill and concentration yards, end
of period mil bd ftExports, total sawmill products M bd ft
Sawed timber doBoards, planks, scantlings, etc do _
Prices, wholesale, (indexes):Boards, No. 2 and better, 1" x 6",, R. L.
1957-59—100Flooring, B and better, F. G., 1" x 4", S. L.
1957-59—100Western pine:
Orders new mil bd ftOrders, unfilled end of period do
Production doShipments _ _ _ _ doStocks (gross) , mill, end of period doPrice, wholesale, Ponderosa, boards, No. 3, 1" x
12" R L (6' and over) $ per M bd ft
HARDWOOD FLOORING
Maple, beech, and birch:Orders new mil bd ftOrders unfilled end of period doProduction _ _ doShipments.. doStocks (gross) mill end of oeriod do
Oak: ' 'Orders, new do
Production doShipments doStocks (gross) , mill end of period do
35 4085 891
29 517
35 5876 290
29 297
6 4341 5364 898
9575 240
8 916607
8 9678 8451 075
369136233
81 14
153 07
6 346281
6 3466 321
1 362102 68411 70990, 975
92 7
95 3
10 565463
10 57910 4491 809
65 49
O1 Q
m l
28 531 2
4. fl
819 6OK p.
842 2824 2
54 5
36 1586 129
30 029
36 6806 465
30 215
5 7281 1514 577
i 9625 163
9 289620
9 2569 2771 079
i 445i ini 334
82 16
156 85
6 864366
6 5046 779
1 087HOO 581
94 3
97 1
11 057535
10 87510 9511 732
67 42
31 211 129 030.23 1
818 464 3
778 7783 335 4
2 981470
2 511
3 088528
2 560
6 1061 ?504 856
76394
814684
820806
1 215
321121
81 69
158 19
582381
560572
1 34810 932
92 3
96 0
889511
848901
1 613
70 70
0 A.
11 82 62 4K fl
71 2M e
64 966 256 7
2 980533
2 447
3 11?557
2 555
5 9741 2244 750
81411
782682
742785
1 172
351124
81.22
158 19
618380
519589
1 27812 380
92 0
96 0
906505
923912
1 624
70 33
9 4.H e
2 52 6A Q
72 2fil Q
61 769 651 8
3 111'539
2 572
3 299539
2 690
5 8641 2944 640
70532
814624
804872
1 104
287
21
80 01
157 10
579374
540585
1 2339 126
92 5
96 3
947532
938921
1 641
68 28
O 1
11 82 93 2A, 4
69 5cc 9
65 170 046 7
2 969518
2 451
3 193515
2 Q7g
5 6451 2264 419
86500
838673
712788
1 021
381523
80.84
157 10
605387
562592
1 2038 136
93 4
96 8
1 064590
9171 0051 553
66 65
•> A
11 92 43 0q o
73 2Pf) 9
63 567 242 9
3 262559
2 710
3 316548
2 768
5 5661 2294 337
85513
773654
788792998
327
25
83 34
155 79
615388
543614
1 1328 762
95 0
97 3
1 025526
1 0681 0551 566
66 34
1 911 42 22.93 1
83 370 068 972 537 7
3 349507
o 040
3 208537
2 671
5 6981 1964 502
77449
719550
832823
1 007
349
25
83.46
155 79
591373
582606
1 1086 212
96 0
98 2
935507
1 124954
1 736
67 53
2 611 42 62.73 0
71 670 270 771 437 0
3 128539
2 539
3 163568
2 595
5 6761 1614 515
87429
739518
772771
1 043
401229
82 27
155 79
572367
548578
1 0788 694
96 2
98 8
943491
969959
1 746
- 67 07
2 611 12.32.53 1
64 069 264.666 434.9
2 970539
2 431
2 888550
2 333
5 7331 1474 586
67412
752523
777747
1 073
265
22
82 14
15643
534349
541552
1 0679 466
98 0
99 1
774456
839809
1,776
65 55
2 911 82.02.12 8
62 069 863.961 435.8
2 927504
2 423
2 912496
2 416
5 7281 1514 577
131444
848620
758752
1 079
876
80
82 25
156 44
542366
545525
1 0877 451
98 7
100 1
995535
872916
1,732
63 91
2 o11 12.62.43 1
64.264 365.965.035.4
2 691476
2 215
2 860507
2 353
5 6181 1204 498
70345
723738
732840
1 063
311021
83.56
157. 63
564418
504512
1 07910 106
99 8
100 8
940627
708769
1,671
63.45
3 012 02.32.23 1
78.080 561.461.735.0
2 909553
2 356
3 040675
2 365
5 5261 0614 465
77415
691728
751701
1 113
271115
83.69
158 64
508420
507506
1 0807 885
101 2
102 5
875596
815907
1,579
65 83
9 613 12.11.73 4
60.785 357.056.034.4
3 410652
2 758
3 472685
2 787
5 4921 0614 431
74514
1 038923
843843
1 113
329
23
' 88. 16
••161.61
761503
625678
1 02711,244
r 102. 2
102.7
1 096730
982962
1,599
' 68. 19
3 214 12.32.43 5
77.291 665.566.131.7
3 211660
2 551
3 462689
2 773
5 3231 0554 268
99462
817906
782835
1,084
461135
v 92. 65
p 166.84
578469
568612
9836, 927
106.2
108.2
973682
9101,0211,488
v 71. 48
3.915.81.92.33.0
59.089.360.663.530.5
T Revised. » Preliminary.1 See note "O" for p. S-21.
I Revisions for Jan.-Oct. 1964 are shown in Bu. of the Census report M31A(64)-13.(/'Formerly National Lumber Manufacturers Association.
Digitized for FRASER http://fraser.stlouisfed.org/ Federal Reserve Bank of St. Louis

S-32 SURVEY OF CURKENT BUSINESS June 1966
Unless otherwise stated, statistics through 1964and descriptive notes are shown in the 1965edition of BUSINESS STATISTICS
1964 1965
Annual
1965
Apr. May June July Aug. Sept. Oct. Nov. Dec.
1966
Jan. Feb. Mar. Apr. May
METALS AND MANUFACTURES
IRON AND STEELExports:
Steel mill products _ _ _ thous. sh. tonsScrap doPig iron do
Imports:Steel mill products doScrap doPig iron do
Iron and Steel Scrap
Scrap for consumption, total thous sh tonsHome scrap produced doPurchased scrap received (net) do
Consumption total doStocks, consumers', end of period _ _ _ • doPrices, steel scrap, No. 1 heavy melting:
Composite (5 markets) $ per Ig tonPittsburgh district do
Ore
Iron ore (operations in all U.S. districts):Mine production thous Ig tonsShipments from mines doImports - do
U.S. and foreign ores and ore agglomerates:Receipts at iron and steel plants doConsumption at iron and steel plants doExports doStocks total end of period do
At mines doAt furnace yards doAt U S docks do
Manganese (mn content) general imports do
Pig Iron and Iron ProductsPig iron:
Production (excluding production of ferroalloys)thous. sh. tons__
Consumption doStocks (consumers' and suppliers'), end of period
thous sh tonsPrices:
Composite— ------ _$perlg. ton__Basic (furnace) doFoundry No 2 Northern do
Castings, gray iron:Orders, unfilled, for sale, end of period
Shipments total doFor sale do
Castings^ malleable iron:Orders, unfilled, for sale, end of period
Shipments total doFor sale do
Steel, Crude, Semifinished, and Finished
Steel ingots and steel for castings:Production thous. sh. tons
Index __ _ _ -daily average 1957-59=100Steel castings:
Orders, unfilled, for sale, end of periodthous. sh. tons__
Shipments, total doFor sale total do
Steel forgings (for sale) :Orders unfilled end of period do
Closed die (drop upset press) do
Steel products, net shipments:Total (all grades) do
Semifinished products doStructural shapes (heavy) steel piling doPlates doRails and accessories do
Bars and tool steel, total doBars: Hot rolled (incl. light shapes) do
Reinforcing doCold finished do
Pipe and tubing doWire and wire products doTin mill products _ __• - _ _ _ d oSheets and strip (incl. electrical), total. _ _ do
Sheets* Hot rolled doCold rolled do
Steel mill products, inventories, end of period:Consumers' (manufacturers only)__mil. sh. tons__
Receipts during period '__ _doConsumption during period _ do
Service centers (warehouses) doProducing mills:
In process (ingots, semifinished, etc.) doFinished (sheets, plates, bars, pipe, etc.) _do _ _ _
3,4357, 881
176
6,440299751
84,09352, 26231, 83184, 6267, 413
32.7734.70
3 84, 8363 85, 184
42,417
118, 325122, 197
6,96371, 67710, 75257, 1843,741
1,032
85,60186, 382
2,461
62.7563.0063. 50
85514, 3168,129
1221,001
589
127, 076130.5
3371,8351, 471
45931,73431, 334
84, 9454, 2296,0858,4911, 395
13, 1998,4013,2291,4678,1373,1056,083
34, 2229,948
15, 699
11.262.460.54.1
9.18.7
neQ7
1 2, 49616,170
128
10,383235916
90, 53455, 21435, 32090, 3607,638
33.3635.00
87, 42085,80145, 105
121,964125, 14317,08568,78112, 29053,9972,494
1,272
88,17388,945
2,329
62.7563.0063.50
88215,7139,173
1741,136
648
3131, 462135.3
4361,9621,569
5892,0271,578
92, 6664, 5286, 7989,7641,523
14.4889.3443, 1501,8778.6893,4846, 659
36, 73310,63016, 571
12.968.767.04.5
8.57.9
noo7
230597
5
9082168
8,3005,0023,2988,2486,960
35.5237.50
5,4694,6223,489
7,08111, 162
51652,56918, 39332, 3421,834
122
7,9518,030
2,300
62.7563.0063.50
9401, 404
816
13910056
11, 966149.9
362173137
484173135
10, 101489648881166
1,5341,041
279203
1,040420
1, 0263,8961,1821,747
15.17.46.04.2
7.86.7
nQQ7
200623
2
1,0141799
8,1114,8903,2218,0437,027
35.6638. 50
9,14410, 9134,120
14, 08211, 682
92953, 07916, 62434,7501,705
97
8,1958,165
2,402
62.7563.0063.50
9601,376
822
1529653
12, 012145.6
355164131
512162127
7,874395569811148
1,266827285145778306317
3,286960
1,489
15.56.25.84.2
8.17.1
ftC97
177472
1
1,1922880
8, 0834,8633,2208,0217,066
33.8835.00
10, 10211,3335,106
15,25611,083
95055, 90915, 39238, 9231,594
109
7,8497,864
2,508
62.7563.0063.50
••9171,454
869
••14410560
11, 593145.2
357178143
510172134
7,887394577808132
1,282814305152734298419
3, 244942
1,485
15.86.25.94.2
8.27.3
ACQ7
188711
1
1,0941767
7,5694,7282,8407,5827,051
33.8435. 00
10, 50812,4814,505
15, 92911, 1331,037
58, 93113, 42043, 7101,801
74
7,7807,836
2,505
62.7563.0063.50
9251,282
771
1658144
11, 551140.0
368134105
544152114
7,699379590833101
1,211767298138744268521
3,052893
1,409
16.35.55.04.4
8.47.5
f\CQ7
195561
2
1,0612296
7,6084,7312, 8777,5157,184
32.7335.00
10,85111, 6995,128
15, 36710, 8971,033
62, 67512, 57248, 1811,922
115
7,6617,762
2, 416
62.7563.0063.50
8921,302
815
1718150
11,324137.3
389152120
568154114
8,634403606856101
1,328836315167877323733
3,4061,0091, 538
17.26.05.14.6
8.27.0
naQ7
204550
2
78615
114
7, 0344,4342,6007,0097,213
30.6731.00
10,28210,3663,894
13, 2249,764
54466,35712,48651,6412, 230
105
6,6906,794
2, 446
62.7563.0063. 50
8811,322
777
1769054
9,949124.6
393171138
569172134
6,69833351682796
1, 083644291139588248275
2,733797
1,178
17.05.25.44.6
8.27.3
nc*37
254334
1
89218
101
6,9574,1992,7586,7417,432
29.3032.00
8,8929,9554, 093'
12,9298,976
77869,46611,42455,5942,448
125
6,3106,378
2,460
62.7563. 0063. 50
8761,273
732
1729554
9, 296112.7
404160128
573178139
6, 237265523833
99
1,036626264137566228360
2,327662985
15.64.25.64.6
8.37.4
n«Q7
218509
1
9392096
6,5663,8352,7326,4987,502
29.5831. 50
4,5436,2944,131
10,0508,213
33170, 71810, 73257,4302,556
98
5,8805,930
2, 450
62. 7563.0063.50
8421,178
689
1749352
8,822110.5
428157128
580187145
6,200323512777111
972592237132534226631
2,116600880
14.34.45.74.5
8.37.3
nsss
274417
6
67124
106
7,1094, 1532,9567,0017, 638
31.2533.00
4,1642, 6433,123
5,2668,699
43768,78112, 29053, 9972,494
154
6,3276,502
2,329
62.7563.0063.50
8821,255
696
17410159
9,627116.7
436175145
589190148
6,061313529698143
964587233134592240302
2,280656997
12.94.45.84.5
8.57.9
f!S2Q
175347
1
6682138
32.3633.50
4,7121,8821,898
3,0699,595
27565, 17015, 12047,5622,488
117
6,910
62.7563.0063,50
9161,227
661
1769856
10, 577128. 2
443175145
6,602335536675146
1,013649207147604256382
2,655751
1,243
12.04.95.84.6
9.17.8
n«3Q
158419
(2)
5381562
32.8936.00
4,4971,7511,489
3,2329,499
39661,46617, 86641, 2952,305
92
6,834
62.7563.0063. 50
' 977' 1, 229
'671
1749755
10, 249137.5
••452r 168'137
6, 734301490684140
1,041681208143712239390
2, 737790
1,263
11.34.95.6
9.58.1
0839
159342
2
7769132
r 33. 3236. 50
5,0382,0572,219
3,97611, 127
40856, 88120,84734, 1441,890
76
7,937
62.7563. 0063.50
9671, 470
818
18711268
12, 083146.5
521200165
8,282349609838165
1,284818281173887318527
3,305948
1,513
'10.9'5.9'6.3
'9.28.3
.0839
143440
1
71414688
v 30. 01"33.50
3,432
8,84110, 897
593
32, 0881,744
83
7,853
62.75p 63. 00P 63. 50
11, 569144.9
8,174324600819155
1,279797297175874327535
3,260919
1,494
10.85.85.9
9.18.2
.0839
12, 187147.7
'Revised. * Preliminary. 1 See note "O" for p. S-21. 2 Less than 500 tons.3 Revised total; monthly revisions are not available.^Beginning Jan. 1964, the composite reflects substantial changes in products and weights
used and is not comparable with earlier periods. The new composite price is based on AISI
net shipments of carbon steel and is the average price of all finished carbon steel products(except rails and wire products) weighted by tonnage. Prices used are base prices at Pitts-burgh; the average includes an additional 25% for "extra" charges but does not include freight.
Digitized for FRASER http://fraser.stlouisfed.org/ Federal Reserve Bank of St. Louis
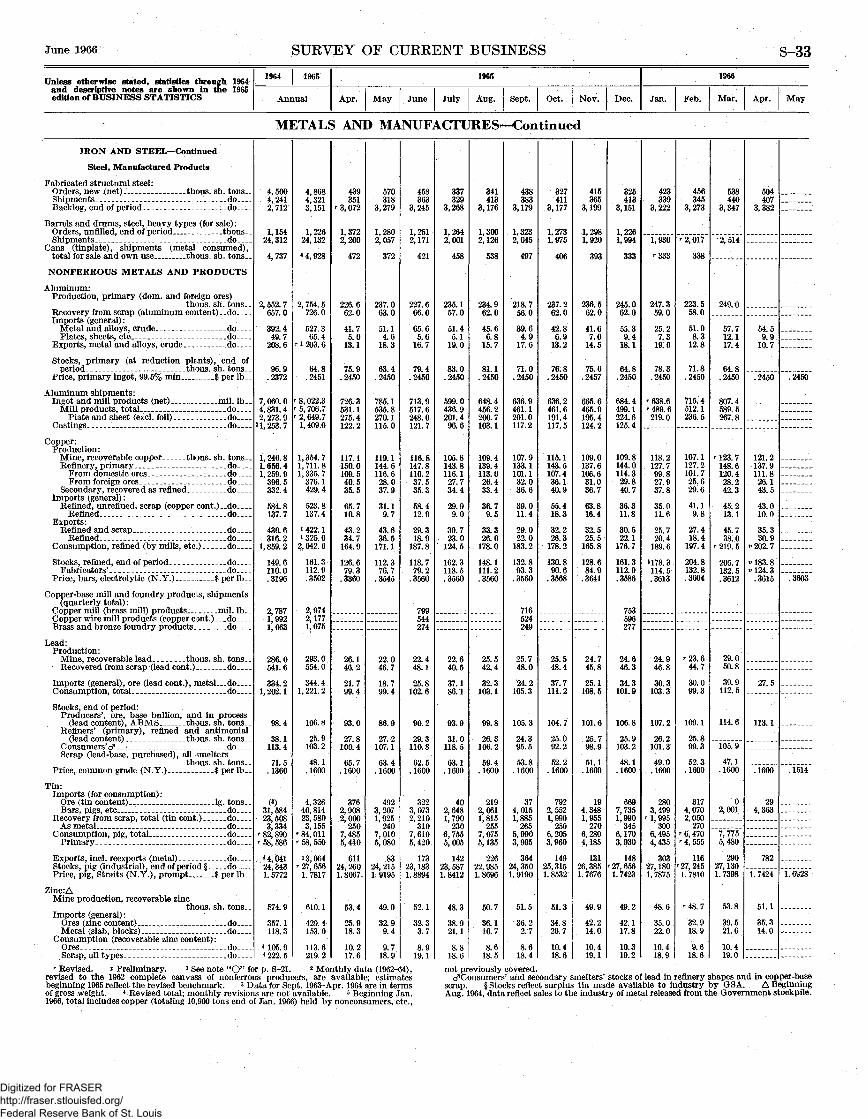
June 1966 SURVEY OF CURRENT BUSINESS S-33
Unless otherwise stated, statistics through 1964and descriptive notes are shown in the 1965edition of BUSINESS STATISTICS
1964 1965
Annual
1965
Apr. May June July Aug. Sept. Oct. Nov. Dec.
1066
Jan. Feb. Mar. Apr. May
METALS AND MANUFACTURES—Continued
IRON AND STEEL— Continued
Steel, Manufactured Products
Fabricated structural steel:Orders, new (net) _ _ thous. sh. tonsShipments.- _ _ _ _ . __ __' do_ _Backlog, end of period do
Barrels and drums, steel, heavy types (for sale) :Orders, unfilled, end of period thousShipments _ _ do
Cans (tinplate), shipments (metal consumed),total for sale and own use thous. sh. tons
NONFERROUS METALS AND PRODUCTS
Aluminum:Production, primary (dom. and foreign ores)
thous. sh. tons_Recovery from scrap (aluminum content).. do _ _ _Imports (general):
Metal and alloys, crude. _ do _Plates, sheets, etc. _ _ _ do_
Exports, metal and alloys, crude do
Stocks, primary (at reduction plants), end ofperiod thous sh tons
Price, primary ingot, 99.5% min _ _ _ _ $ p e r l b _ _
Aluminum shipments:Ingot and mill products (net) mil. Ib
Mill products, total doPlate and sheet (excl. foil) do
Castings do
Copper:Production:
Mine, recoverable copper thous. sh. tonsRefinery, primary _ _ _ _ _ d o
From domestic ores doFrom foreign ores _ _ _ do_ .
Secondary, recovered as refined doImports (general):
Refined/ unrefined, scrap (copper cont.)__doRefined do
Exports:Refined and scrap do
Refined .. doConsumption, refined (by mills, etc.) _ _do_ _
Stocks, refined, end of period doFabricators' do
Price, bars, electrolytic (N.Y.) $per lb__
Copper-base mill and foundry products, shipments(quarterly total) :
Copper mill (brass mill) products mil. IbCopper wire mill products (copper cont.) doBrass and bronze foundry products do
Lead:Production:
Mine recoverable lead thous. sh tonsRecovered from scrap (lead cont.) do
Imports (general), ore (lead cont.), metal doConsumption, total . do
Stocks, end of period:Producers', ore, base bullion, and in process
(lead content) ABMS thous. sh. tonsRefiners' (primary), refined and antimonial
(lead content) thous. sh. tonsConsumers' cf - doScrap (lead-base, purchased), all smelters
thous sh tonsPrice, common grade (N.Y.) _ _ _ $ perlb__
Tin:Imports (for consumption) :
Ore (tin content) Ig tonsBars, pigs, etc do
Recovery from scrap, total (tin cont ) doAs metal do
Consumption pig total doPrimary do
Exports incl reexports (metal) doStocks, pig (industrial) , end of period § doPrice, pig, Straits (N.Y.), prompt. .$perlb_-
Zinc: AMine production, recoverable zinc
thous sh tonsImports (general):
Ores (zinc content) doMetal (slab blocks) do
Consumption (recoverable zinc content):Ores doScrap, all tvDes--. __ _ _ _ _ do__
4 5004,2412 712
1 15424, 312
4 737
2, 552. 7657.0
392.449.7
208.6
96 9.2372
7 060 04 831 42,273 9
21 253 7
1 246.81, 656. 41 259 9
396 5332 4
584. 8137 7
430 6316 2
1, 859. 2
149 6110 0.3196
2 7871*9921 063
286 0541 6
334 21,202 1
98 4
38 1113. 4
71 5.1360
(3)31 58423 5083 334
r 82 890r 58 586
4 4 04124 3431. 5772
574 9
357 1118 3
4 105 94 222. 5
4 8684, 3213 151
1 22624, 132
4 4, 928
2, 754. 5726.0
527.365.4
r * 203. 6
64 8.2451
r 8, 022.3r 5, 706.7r 2, 649.7
1, 409.0
1,354.71,711.81 335. 7
376.1429 4
523.8137. 4
i 422. 1i 325. 0
2, 042. 6
161. 3112 9.3502
2 9742,1771,075
293.0554.0
344.41,221.2
106.8
25.9103.2
48.1.1600
4 32640 81423 5803, 155
' 84 Oilr 58, 550
1.3 064* 27 656
1. 7817
610 1
429 4153 0
113 6219^2
439351
r 3 072
1 3722 200
472
226.662.0
41.75.0
13 1
75 9.2450
726., 3531 1275 4122 2
117 1150. 0109 540 535 5
65.710 8
43 234 7
164. 9
126 679 3
.3360
26 146 2
21 799.4
93 0
27 8100.4
65 7.1600
3762 9082 000
2507 4855 440
61124 2601. 8067
53 4
25 918 3
10 217. 6
570318
3 279
1 2802 057
372
237.063.0
51.14.6
18 3
63 4.2450
785 1535 8270.1115 0
119 1144.6116 628.037 9
31.19 7
43 636 5
171.1
112 376 7
.3545
22 046 7
18 799.4
86 9
27 2107.1
63 4.1600
4923 2071 925
2407 0105 080
8324 2151.9195
49 0
32 99 4
9 718.9
458363
3 245
1 2512,171
421
227.666.0
65.65.6
16 7
79 4.2450
713 9517 6248 0121 7
116 8147.8110 237.535 3
58.412 9
29 318 9
187.8
118 779 2
.3560
799544274
22 448 1
25 8102.6
90 2
29 3110.8
62 5.1600
3223 0732 210
3107 6105 420
17323 1831. 8894
52 1
32 33 7
8 919.1
337329
3 268
1 2642,001
458
235.157.0
51.45.1
19.0
83 0.2450
599 0436 9201.496 6
105.8143.8116.127.734 4
29.99 0
30 723 0
124.5
162 3118 5. 3560
22 640 5
37 186.1
93 9
31 0118.5
63 1.1600
402 6481 790
2306 7555' 005
14223 5871. 8412
48 3
38 921 1
8 818.6
341413
3 176
1 3002,126
538
234.962.0
45.66.8
15.7
81 1.2450
648 4456 2200.7103 1
109 4139.4113 026. 433 4
36.79 5
33 326.0
178.0
148. 1111 2.3560
25 542 4
32.3103.1
99 8
26 3106.2
59 4.1600
2192 0611 815
2557 0755 135
22622 9851. 8696
50 7
36 110 7
8 618.5
438383
3,179
1,3232,045
497
218.756 0
39.64.9
17.6
71 0.2450
636 9461.1201.0117 2
107.9133. 1101.132.036 6
39.011.4
29 022.0
183.2
132.893.3
.3560
716524249
25 748.0
24.2105.3
105 3
24 395.5
53.8.1600
374,0151 885
2655 9903 995
36424 3501. 9190
51 5
36 22 7
8 618.4
327411
3 177
1,2731, 975
406
237. 262.0
42.86.9
13.2
76 8.2450
636 2461 6191.4117 5
115.1143.5107.436.140.9
55.418.3
32.226.3
178.2
130.890 6
.3568
25 548.4
37.7111.2
104.7
25.092.2
52.2.1600
7922,5521 990
2506 2053,960
14925, 3151.8532
51 3
34 820 7
10 418.6
415365
3,199
1, 2981,920
393
236.562.0
41.67.0
14.5
75 0.2457
665 6465 9195.4124 2
109.0137.6106.631.036 7
63.816.4
32.525.5
165.8
128.684 9
.3641
24 745 8
25.1108.5
101.6
25 798.9
51 1.1600
194,3481 955
2706 2804 185
13126 3851. 7676
49 9
42 214.0
10 419.1
325413
3 151
1 2261,994
333
245.062.0
55.39.4
18 1
64 8.2450
684 4499.1224.6125.4
109.8144. 0114.329. 840 7
36.311.8
30.522.1
176.7
161. 3112 9.3586
753596277
24 646.3
34 3101.9
106 8
25.9103.2
48 1.1600
6697 7351 990
3456 1703,930
148r 27, 6561. 7423
49 2
42 117 8
10 319.2
423339
3,222
1,930
'333
247.359.0
25 27.3
19 0
78 3.2450
r638 6••489 6219.0
118.2127 799 827 937 8
35.011 6
25 720 4
189 65 178 3114 5.3613
24 946.8
30 3103. 3
107 2
26 2101.3
49 0.1600
2803 499
r 1 995300
6 4954 435
30327, 1801. 7875
48 6
35 022 0
10 418.9
456345
3,273
r 2, 017
338
223.558.0
51.98.3
12.8
71.8.2450
715. 4512.1236.5
107.1127.2101. 725.629.6
41.19.8
27.418.4
197.4
204.8132.8.3604
'23.644.7
30.099.3
109.1
25.899.3
52.3.1600
3174,0702,050
270r 6, 470T 4, 555
116r 27, 2451. 7810
r 48 7
32 918.9
9 618.6
538440
3 347
2, 514
249.0
57.712.117 4
64 8.2450
807 4589 5267.8
«• 123. 7148.6120 428.242 3
45.213 1
45 738 0
r 219 5
205 7132 5.3612
29.050.8
39.9112.5
114.6
105.9
47.1. 1600
02,001
7,7755,480
29027, 1301. 7398
53.8
39.521.6
10 419.0
504407
3 382
54 59.9
10 7
.2450
121.2137.9111 826.143 5
43.010 0
35 330.9
P202.7
v 183. 8pl24 3
.3615
27.5
113 1
. 1600
294,363
782
1.7424
51.1
35 314.0
.2450
.3603
.1514
1. 6928
•• Revised. » Preliminary. 1 See note "O" for p. S-21. 2 Monthly data (1962-64),revised to the 1962 complete canvass of nonferrous producers, are available; estimatesbeginning 1965 reflect the revised benchmark. 3 Data for Sept. 1963-Apr. 1964 are in termsof gross weight. 4 Revised total; monthly revisions are not available. 5 Beginning Jan.1966, total includes copper (totaling 10,900 tons end of Jan. 1966) held by nonconsumers, etc.,
not previously covered.cf Consumers' and secondary smelters' stocks of lead in refinery shapes and in copper-base
scrap. § Stocks reflect surplus tin made available to industry by QSA. A BeginningAug. 1964, data reflect sales to the industry of metal released from the Government stockpile.
Digitized for FRASER http://fraser.stlouisfed.org/ Federal Reserve Bank of St. Louis

S-34 SUEVEY OF CURRENT BUSINESS June 1966
Unless otherwise stated, statistics through 1964and descriptive notes are shown in the 1965edition of BUSINESS STATISTICS
1964 1965
Annual
1965
Apr. May June July Aug. Sept. Oct. Nov. Dec.
1966
Jan. Feb. Mar, Apr. May
METALS AND MANUFACTURES—Continued
NONFERROUS METALS AND PROD.— Con.
Zinc— C ontinuedSlab zinc: A
Production (primary smelter), from domesticand foreign ores thous. sh. tons
Secondary (redistilled) production doConsumption, fabricators' doExports doStocks, end of period:
Producers', at smelter (AZI)c?1 doConsumers' do
Price, prime Western (East St. Louis) - $ per lb—
HEATING EQUIPMENT, EXC. ELECTRIC
Radiators and con vectors, shipments:Cast-iron mil sq ft radiationNonferrous do
Oil burners:Shipments thousStocks end of period do
Ranges, gas, domestic cooking (incl. free-standing,set-in, high-oven ranges, and built-in ovenbroilers) thous
Top burner sections (4-burner equiv) ship do
Stoves domestic heating shipments total doGas do
Warm-air furnaces (forced-air and gravity air-flow),shipments, total thous
Gas doWater heaters gas shipments do
MACHINERY AND APPARATUS
Fans, blowers, and unit heaters, qtrly. :Fans and blowers, new orders _mil. $Unit-heater group new orders do
Foundry equipment (new), new orders, netmo. avg. shipments 1957-59=100 •_
Furnaces (industrial) and ovens, etc., new orders(domestic), net _ _ mil. $__
Electric processing _ _ _ _ _ _ _do_ _Fuel-fired (exc for hot rolling steel) do
Material handling equipment (industrial) :Orders (new), index, seas, adj 0 1957-59=100-
Industrial trucks (electric), shipments:Hand (motorized) numberRider-type do
Industrial trucks and tractors (internal combustionengines) shipments number
Machine tools:Metal cutting tools:
Orders new (net), total mil. $Domestic do
Shipments total doDomestic do
Estimated backlog, end of period months—
Metal forming tools:Orders new (net), total mil. $
Domestic doShipments total do
Domestic doEstimated backlog, end of period- months. _
Other machinery and equip., qtrly. shipments:Construction machinery (selected types), total 9
mil. $__Tractors tracklaying total doTractors, wheel (con off-highway) doTractor shovel loaders (integral units only),
wheel and tracklaying types mil $Tractors, wheel (excl. garden and contractors'
off-highway types) mil $Farm machines and equipment (selected types),
excl. tractors _ mil. $ELECTRICAL EQUIPMENT
Batteries (auto, replacement), s hi pmentst— thous _ _Household electrical appliances:
Ranges (incl built-ins) sales total doRefrigerators and home freezers, output
1957-59=100-Vacuum cleaners sales billed thousW^ashers sales (dom and export) doDriers (gas and electric), sales (domestic and
export) thous
Radio sets, production§-_ _ _ doTelevision sets (incl. combination), prod.§.-.doElectron tubes and semiconductors (excl. receiving,
power and spec purpose tubes) sales mil $Motors and generators:
Neiv orders index qtrly 1947-49 ~~ 100New orders (gross) :
Polyphase induction motors, 1-200 hp mil. $__D.C. motors and generators. 1-200 ho _ — do_ _
i 954. 1171.6
11,207.326.5
31.2107.5.1357
10.5113.2
568.042.6
2, 170. 6342.6
1, 810. 81,227.2
1, 426. 01, 162. 12, 680. 1
182.374.9
218.6
114.913.757.5
152. 0
6, 8917,129
36, 171
976. 50808. 90791. 80636. 75
6.3
388. 70353. 30228. 20200. 85
10.9
1 1, 523. 7i 392. 6
128.7
i 352. 9
i 679. 2
954.0
30, 627
1, 965. 0
140.84, 506. 74, 189. 6
1 1, 826. 4
19, 1769,570
653.0
178
183.236.3
1,005.273.1
1,343.85.9
30.1145.4.1450
9.2115.3
585.535.7
2, 244. 5304.8
1,647.21, 107. 9
1,389.41, 127. 52, 616. 4
208.666.9
322.5
152.821.675.2
186.3
8, 2029,994
41,746
1, 176. 001, 054. 40
958.60830. 55
7.6
319. 30297. 75287. 85259. 80
9.9
1 739 8439.7151.3
408.2
828.1
1, 057. 0
30, 528
2, 065. 0
147.8i 5, 106. 91 4, 347. 1
1 2, 098. 4
24, 11811,028
757.0
215
210.144.6
82.86.5
109.81.2
20.277.6
' . 1450
.78.0
39. 851.6
179.525.4
94.056.2
87.372.5
215.9
374.1
9.4
4.6
172.6
540663
2,604
96.0585.7077.7568.20
6.6
20.1517.7521.2519.40
9.5
1,800
161.7
162.0397.8298.0
91.9
1,782757
59.4
19.53.2
86.96.8
113. 3.4
25.2102.4.1450
.56.4
42.148.6
170.025.6
82.357.3
97.482.3
192.1
192.9
11.3
5.3
170. 3
557820
3,242
74.7567.1082.4571.75
6.4
24.0522.5527.9024.80
9.0
1,735
144.1
160.5329.6315.0
83.3
1,793751
57.5
17.6. 3.7
82.66.5
115.5.3
23.3102.3.1450
.78.4
46.347.9
199.231.4
110.377.5
107.388.7
205.0
53 619 0
274.6
9.7
5.1
191.2
765848
3,625
93.6587.1083.7571.15
6.5
40.8539. 7026.0023.55
9.4
521.7120.551 9
114.9
209 5
295.5
2,015
176.3
159.8367.9388.7
109.0
3 2, 1713946
63.3
228
19.43.8
85.15.4
96.9.5
26.9110.6.1450
.611.4
43.444.6
153.919.7
158.8106.4
116.696.0
214.0
280.6
18.3
6.7
171.4
742842
3,497
95.6084.7569. 4560.70
6.8
26.7026.0520.2017.75
9.4
2,145
148.5
125.1329.2356.1
127.7
1,757596
52.3
16.24.4
84.96.4
113.9.4
29.2128.2.1450
1.011.6
58.841.2
191.527.1
186.5120. 3
140.4112.2206.2
387.0
10.5
6.0
192. 6
558695
3,378
106.8095. 4057.5550.10
7.3
24.5522.9520.3518.85
9.7
2,531
163.4
87.6376.6398.6
213.3
1,764819
63.4
15.53.6
84.05.3
117.0.2
27.3129.3.1450
1.013.1
64.836.1
226.631.7
227.6141.8
174.4136.1226.4
53.516.0
316.9
12.62.07.2
183.0
745899
3,729
99.8587.0080.8070.90
7.6
25.6024.0021.2018.95
9.8
407.798.439 9
91.3
161.5
244.4
3,512
186.0
145.3497.7430.6
274.2
3 2, 2143 1, 230
72.4
212
19.23.2
87.56.0
117.8.2
30.3130.8.1450
.912.4
68.435.9
212.726.1
259.0185.5
169.0132.5234.2
295.0
11.41.36.8
211.0
8101,015
3,910
99.2593.0091.0575.60
7.6
35. 2033.4524.3021.9010.3
3,686
174.0
160.1534.4397. 2
279.1
2,3121,086
70.0
15.94.2
84.26.0
116.5
27.2124.5.1450
.911.0
53.732.8
190.022.1
144.1105.6
118.695.3
208.2
339.5
13.82.07.7
205.6
837983
4,144
110. 50100. 2577.9567.25
7.7
27. 1525.0522.9519.5510.4
3,387
184. 1
147.5543.5370.4
234.3
2,0741,044
68.9
18.13.1
89.15.2
113.2.8
30.1145.4.1450
.79.0
40.235.7
196.523.9
82.957.3
111.291.8
246.7
55.217.6
371. 8
14.22.67.9
231. 8
8831,228
4,052
128. 50116. 50109. 1098.15
7.6
27.6023.9530.3027.55
9.9
393.5105.727.6
106.6
236.9
225.4
3,085
198. 3
159.7431.4357.1
238. 8
32,4173 1, 208
73.8
217
18.74.7
89.96.0
112.5
32.2158.1.1450
.88.7
45.135.4
162.518.2
61.144.6
89.572.6
225.3
267.2
16.31.6
'10.7
209.7
722965
3,531
126. 50115. 5079.3070.20
8.2
29.7526.1023.3522.2510.0
2 37. 0
277.3
2,654
176.8
170.3434.5317.4
186.7
1,874915
'71.3
58.2'4.2
79.95.7
116.1.1
29.7' 156. 0
.1450
.77.1
'42.1'36.7
180.719.6
'82.6'47.8
'86.3'71.3207.4
198. 2
13.71.86.1
210.1
749776
3,619
135. 45121. 1083.0073.55
8.7
30. 5029.4028.7026.1510.2
238.6
283.8
2,918
182.8
176.2517.0364.7
193.2
1,862924
68.9
510.0'5.2
85. 46.2
127.0.1
28.8166.3.1450
.67.7
46.742.3
227.223.6
88.352.7
88.573.9
236.6
274.0
16.11.79.9
9201,087
4,159
'155. 85'137. 45'105. 05' 94. 25
'9.1
'31.25' 28. 65' 30. 45' 28. 75'10.0
246.7
2 107. 9
' 2, 042
' 177. 4
151.6549.6397.7
180.2
32,26031, 239
81.1
248
511.25.5
.1
33.2
.1450
244.6
25.63.5
16.4
907932
3,980
133.75117. 7584.3076.60
9.6
22.9021.4526.9025.40
9.5
1,771
201.0
192.6429.0351. 6
128.0
'1,824'907
69.14.8
39.9
.1450
* 1,786p 891
' Revised. » Preliminary. * Revised total; monthly revisions are not available.2 For month shown. 3 Data cover 5 weeks: other months, 4 weeks. 4 Less than 50
tons. s Excludes new orders for motors 1-20 hp.; in Mar. and Apr. 1966, domestic sales ofthis class totaled $10,800,000 and $10,700,000, respectively. ASee similar note, p. S-33.
cfProducers' stocks elsewhere, end of May 1966, 9,600. 0Revised back to 1963 to in-
corporate new seasonal factors. 9 Includes data not shown.J Data reflect adjustment to the 1963 Census of Manufactures; revisions back to 1963 are
available.§ Radio production comprises table, portable battery, auto and clock models; television
sets cover monochrome and color units.
Digitized for FRASER http://fraser.stlouisfed.org/ Federal Reserve Bank of St. Louis

June 1966 SURVEY OF CURRENT BUSINESS S-35
Unless otherwise stated, statistics through 1964and descriptive notes are shown in the 1965edition of BUSINESS STATISTICS
1964 | 1965
Annual
1965
Apr. May June July Aug. Sept. Oct. Nov. Dec.
1966
Jan. Feb. Mar. Apr. May
PETROLEUM, COAL, AND PRODUCTS
COALAnthracite:
Production thous. sh. tonsExports doPrice, wholesale, chestnut, f.o.b. car at mine
$ per sh. ton..Bituminous:
Production thous. sh. tons
Industrial consumption and retail deliveries,total 9 thous. sh. tons
Electric power utilities _ d o _ _ _Mfg. and mining industries, total _do_ _
Coke plants (oven and beehive) do
Retail deliveries to other consumers. _ do__ _
Stocks, industrial and retail dealers' , end of period,total 9 thous. sh. tons
Electric power utilities _ _doMfg. and mining industries, total do
Oven-coke plants do
Retail dealers do
Exports do
Prices, wholesale:Screenings, indust. use, f.o.b. mine
$ per sh. ton__Domestic, large sizes, f.o.b. mine do
COKEProduction:
Beehive thous. sh. tons__Oven (byproduct) _ _ __.. doPetroleum coke§ do
Stocks, end of period:Oven-coke plants, total do
A t furnace plants _ _ _ _ _ _ _ _ _ d oAt merchant plants. _ do_ __
Petroleum coke doExports.- do
PETROLEUM AND PRODUCTS
Crude petroleum:Oil wells completed ___ number.Price at wells (Okla.-Kansas) $ per bblRuns to stills t--_ _- mil. bbl _Refinery operating ratio % of capacity.
All oils, supply, demand, and stocks : JNew supply, total mil. bbl._
Production:Crude petroleum. _ _ _ _ _ _ doNatural-gas liquids, benzol, etc... _ _ _ d o _ .
Imports:Crude petroleum do. .Refined products _. .. do _ _ .
Change in stocks, all oils (decrease,—) do
Demand, total __ _. _ _ _ _ _ _ doExports:
Crude petroleum .do —Refined products do
Domestic demand, total 9 _ _ _ d o _ _Gasoline doKerosene do
Distillate fuel oil doResidual fuel oil doJet fuel ___ _ do
Lubricants.. _ __ _ _ _ _ _ doAsphalt doLiquefied gases do_
Stocks, end of period, total _ _ _ d o _Crude petroleum doNatural-gas liquids. _ _ _ _ _ doRefined products .. do_ _
Refined petroleum products: }Gasoline (incl. aviation) :
Production doExports _ doStocks, end of period.... do
Prices (excl. aviation) :Wholesale, ref. (Okla., group 3 ) _ _ $ per galRetail (regular grade, excl. taxes), 55 cities
(1st of following mo.) $ oer eal_
17, 1841,575
13. 895
486, 998
431, 116223, 032187, 75888, 757
19, 615
75, 34252, 66122, 30510, 081
376
47, 969
4.7986.895
1,23660, 90816, 865
1,9711,708
2621, 359
524
20, 6202.92
3, 223. 387
4, 036. 1
2, 786. 8422.5
438.6388.1
3.7
4, 032. 4
1.472.5
3, 958. 51, 685. 5
178.4
750.4554.6118.6
45.8120.2247.9
839.2230.135.7
573. 5
1 687 48.0
199.5
.102
.200
15, 4441851
12. 979
510, 000
458, 969242, 729196, 53494, 620
19, 048
77, 39353, 43723, 60310, 506
353
i 50, 181
4,7946.926
1,54264, 92417, 208
2, 6992,445
2541,4781834
18,7612.92
3,300.887
4, 190. 8
2, 848. 5441. 6
452.0448.7-2.9
4, 193. 7
1.166.8
4, 125. 92 1, 720. 2
297.6
776.0586.4
2 220. 6
47.0127.6260.8
836.3220.335.9
580. 2
2 1 704 42 4.9
2 183. 1
.113
.208
1 17145
12. 005
41, 686
35, 86618, 32316, 4798,144
1,019
65, 48944, 97320, 3499,576
167
4 268
4.8046.582
1505,5691 332
1 2251,095
1301,539
59
1,4782.92
262.385
353.2
236.836.7
38.141.612.2
341.0
.26.3
334.5140.9
6.3
61.054.917.6
3.87 7
18.5
802.9251.429.7
521.8
133 44
217.4
.113
.208
1,31373
12. 005
41, 903
35, 41718, 63216, 1748,430
528
68, 69247, 71320, 7639, 749
216
4 707
4.8066. 551
1365,7811,390
1 136993143
1,56460
1,3542.92
272.985
346.8
238.336.8
39.032.923.9
323.0
05.8
317.2149 6
4.3
45.839.619.7
4.212 316.9
826.7255. 135.0
536.7
137 95
205 6
.113
.208
1 62693
12. 005
43, 068
35 58419,29215, 7628,119
442
71, 41849, 85721,3119,970
250
5 069
4.7996.595
1645,5661 407
1 118982136
1,54869
1,5832.92
273.187
340.9
232.435.2
39.933.313.3
327 5
.16.2
321.2155 2
4.5
41.838.618.2
4.315 717.1
840.1253.638.7
547.8
141 67
192.6
.113
.213
1 25682
12. 495
34, 042
36 13520,01815, 4818,161
564
66, 14947, 48218, 4077,744
260
4 231
4.7996.645
1495,5981 475
1 1771 017
1601,511
63
1,5212.92
288.789
345. 5
237.636. 6
40.730.613.2
332 3
.45 7
326.2156 7
4.9
44.337.818 6
4.117 217 1
853.2242 143.6
567.6
148 53
185 1
.113
.209
1 29288
12. 495
46, 228
37 54521, 05115, 5628,120
840
69 30849,24419, 7688,484
296
5 086
4.7866.833
1545,5491 489
1 2711, 085
1811,460
99
1,7842.92
286.189
347.4
240.236.5
40.829.910.9
336.5
05.7
330.8154.4
5.9
47.936.820.0
4 017 817 9
864.1236 446.7
581.0
150 44
181 8
.113
.211
1 364129
12.495
43, 344
36, 19819, 93614, 9107,504
1,266
70, 41850, 41119, 7158,253
292
5 160
4,7907.017
855,2081,443
1,4841,278
2061,418
73
1,8442.92
270.286
329.1
222.535.0
43.228.44.3
324. 8
05.2
319.6142.5
6.0
49.837.519 6
4.015 519.0
868.4231.146.9
590 4
140 53
180 3
.113
.210
1 269108
12. 985
46 596
38, 13620, 06616, 2377,457
1,748
73,00052, 01720, 6919 107
292
5 560
4.7957.144
725,1581 358
1 9181 690
2271,414
65
1,3752.92
281.787
357.4
244 137 9
39 136.212.1
345 3
.25 1
340.0147 0
7 7
56 945 818 2
3 814 721 9
880.5231 845.9
602 8
142 43
176 6
.113
.209
1,25569
12. 985
46 356
39 13220, 55216,4237,074
2,078
75 22653 12521, 7369 743
365
4 627
4.7947.203
644,9291 412
2 3412 103
2391,411
77
1,6062 92
276.088
345.0
239 638.0
32.035.4-7.6
352 6
.15 5
347.0140 1
9.4
71.746.818 6
3 89 4
24.0
873.0
42.5603 7
142 54
179 2
.113
.213
1 28666
12. 985
46 585
42 85122, 64617, 5567, 397
2,625
77 39353 43723, 60310 506
353
3 542
4.7947.228
755,1021 553
2 6992 445
2541 478
78
1, 6852 92
287.289
369.6
253 639 2
27 949 0
—36.6
406 2
(3)
5 3400. 9149 012 7
92 965 919 4
3 75 4
33 1
836.3220 335 9
580 2
151 41
183 1
.113
.210
89556
13.580
42 090
45 15724 06317 9047,538
3,189
71 88949 77921 83310 137
277
2 854
4. 7947.247
945 1841 558
2 7892 548
2421 550
64
1 0502 92
290.690
378.3
250 538 9
42 046 9
—16.6
394 9
15 1
389.7132 614 1
96 165 918 6
4 13 7
34 8
819.8221 428 9
569 5
152 52
203 5
.113
213
99984
13 580
40 200
40 56421 26316 3547,200
2,947
69 05547 19721 6309 870
228
3 166
4.8047.247
944 8951 352
2 6962 504
1921 546
67
1,3942 92
261.390
346.8
231 736 0
34 744 5
—23.1
370 0
o5 6
364.4126 012 1
88 464 717 6
3 63 5
30 5
796.6225 424 7
546 4
133 82
212 2
113
.210
1 08249
13. 580
r48 200
41 02121 63117 5218,171
1,865
73 52648 97324 36211 318
191
3 512
r 4. 798'7.005
1085 5981 478
2 6272 442
1851 584
68
1 5172 92
285.388
389.5
258 139 5
38 853.19.4
380 1
.16 2
373.8145 4
8 7
76 565 919 9
4 66 1
27 2
806.0236 326 4
543 4
146 32
214 2
.105
211
1 28950
pl2 250
30 545
38 02820 32416 5587 818
1 102
68 12146 91920 9998 646
203
3 937
f 4. 798*>6 704
1005 402
2 3452 172' 173
118
p 2 92
\
j> .113
212
1 230
45 255
.218
* Revised. * Preliminary. 1 See note "O" for p. S-21.2 Beginning Jan. 1965, gasoline excludes special naphthas; aviation gasoline represents
finished grades only (alkylate excluded); commercial jet fuel (formerly included with kerosene)is included with jet fuel.
3 Less than 50,000 bbls.9 Includes data not shown separately.§ Includes nonmarketable catalyst coke.I Revisions for Jan.-Oct. 1964 will be shown later.
Digitized for FRASER http://fraser.stlouisfed.org/ Federal Reserve Bank of St. Louis
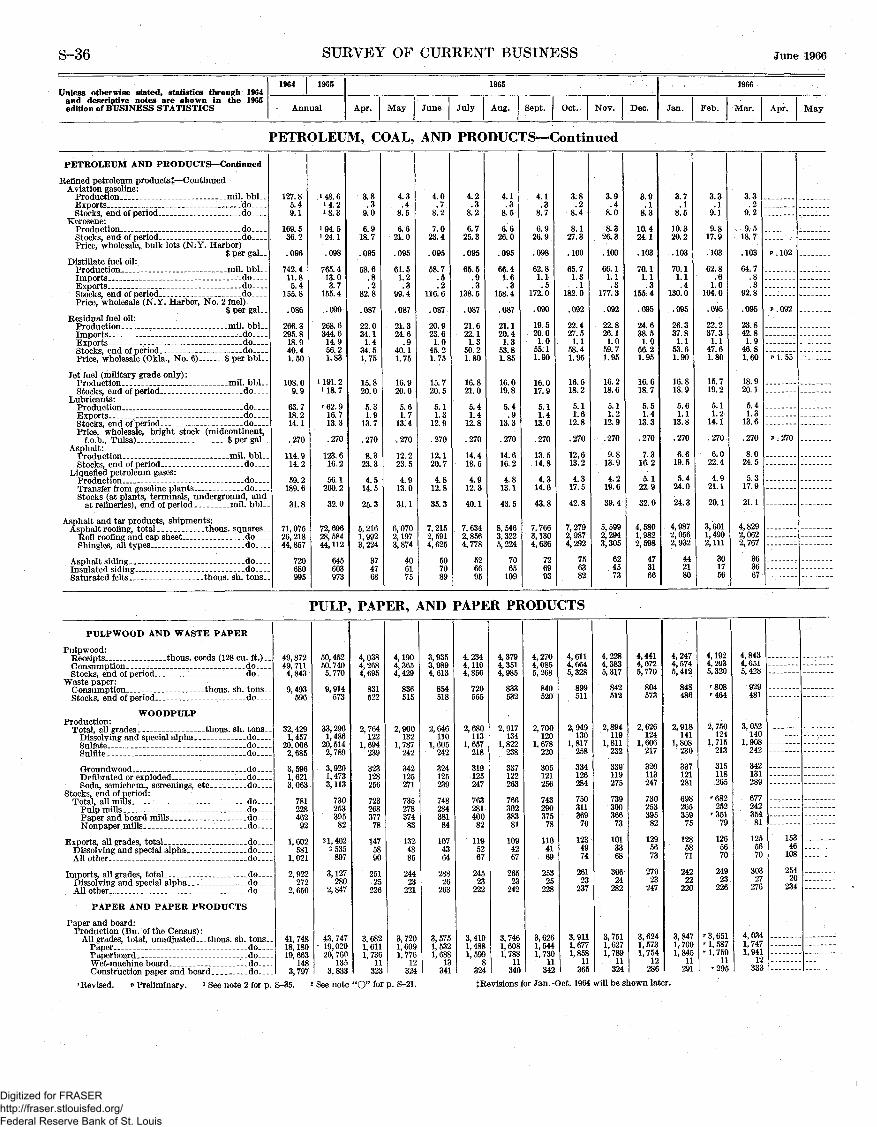
S-36 SURVEY OF CURRENT BUSINESS June 1966
Unless otherwise stated, statistics through 1964and descriptive notes are shown in the 1965edition of BUSINESS STATISTICS
1964 1965
Annual
1965
Apr. May June July Aug. Sept. Oct. Nov. Dec.
1966
Jan. Feb. Mar. Apr. May
PETROLEUM, COAL, AND PRODUCTS—Continued
PETROLEUM AND PRODUCTS— Continued
Refined petroleum products:}:— ContinuedAviation gasoline:
Production mil. bblExports do _Stocks end of period do
Kerosene:Production __ do __Stocks end of period doPrice, wholesale, bulk lots (N.Y. Harbor)
$pergal__Distillate fuel oil:
Production mil bblImports do _Exports doStocks end of period doPrice, wholesale (N.Y. Harbor, No. 2 fuel)
$ per gal-Residual fuel oil:
Production mil. bblImports doExports doStocks end of period doPrice wholesale (Okla No 6) $ per bbl
Jet fuel (military grade only) :Production mil. bblStocks end of period do
Lubricants:Production doExports doStocks end of period doPrice, 'wholesale, bright stock (midcontinent,
f o b Tulsa) $ per galAsphalt:
Production mil bblStocks end of period do
Liquefied petroleum gases :
ip „/? _ frnrn crQcnlinp nlant<> do
Stocks (at plants, terminals, underground, and
Asphalt and tar products, shipments:T? YI rotumg, t _ _ uu&. vl
Shinsles all tvpes do
Asphalt siding... ,___ ._doInsulated siding _ _ _ do _
127.85.49.1
169. 536.2
.096
742.411. 85.4
155.8
.086
266. 8295.818.940.41.50
108.09.9
63.718.214.1
.270
114. 914.2
59.2189. 6
31.8
71, 07526, 21844, 857
720680995
148.614.21-8.3
194.5i 24. 1
.098
765.413.03.7
155.4
.090
268.6344. 614.956.21.83
i 191. 2118.7
r 62. 916.713.3
.270
123.616. 2
56.1200.2
32.0
72, 69628, 58444, 112
645603973
3.8.3
9.0
6.918.7
.095
58.6.8.2
82.8
.087
22.034.11.4
34.51. 75
15.820.0
5.31.9
13.7
.270
8.323.3
4.514.5
25.3
5,2161,9923,224
374768
4.3. .4
8.5
6.621. 0
.095
61.51.2.3
99.4
.087
21.324.6
.940.11.75
16.920.0
5.61.7
13.4
.270
12.223.5
4.913.0
31.1
6,0702,1973,874
406175
4.0.7
8.2
7.023.4
.095
58.7.5.2
116.6
.087
20.923.61.0
45.21.75
15.720.5
5.11.3
12.9
.270
12.120.7
4.812.8
35.3
7,2152,5914,625
507089
4.2.3
8.2
6.725.3
.095
65.5.9.3
138.5
.087
21.622.11.3
50.21.80
16.821.0
5.41.4
12.8
.270
14.418. 5
4.912.3
40.1
7,6342,8564,778
526695
4.1.3
8,5
6.626.0
.095
66.41.6.3
158. 4
.087
21.120.41.3
53.81.85
16.019.8
5.4.9
13.3
.270
14.616.2
4.813.1
43.5
8,5463,3225,224
7065
109
4.1.3
8.7
6.926.9
.098
62.81.1.5
172.0
.090
19.520.01.0
55.11.90
16.017.9
5.11.4
13,0
.270
13.514.8
4.314.6
43.8
7,7663,1304,636
726993
3.8.2
8.4
8.127.3
.100
65.71.3.1
182.0
.092
22.427.51.1
58.41.95
16.518.2
5.11.6
12.8
.270
12.613.2
4.317.5
42.8
7,2792,9874,292
756382
3.9.4
8.0
8.326.3
.100
66.11.1.3
177.3
.092
22.826.11.0
59. 71.95
16.218.6
5.11.2
12.9
.270
9.813.9
4.219.6
39.4
5,5992,2943,305
624573
3.9.1
8.3
10.424.1
.103
70.11.1.3
155. 4
.095
24.638.51.0
56.21.95
16.618.7
5.51.4
13.3
.270
7.316.2
5.122.9
32.0
4,5801,9822,598
473166
3.7.1
8.5
10.320.2
.103
70.11.1.4
130.0
.095
26.337.81.1
53.61.90
16.818.9
5.61.1
13.8
.270
6.619.5
5.424.0
24.3
, 4,9872,0562,932
442180
3.3.1
9.1
9.817.9
.103
62.8.6
1.0104.0
.095
22.237.31.1
47.61.80
15.719.2
5.11.2
14.1
\270
6.022.4
4.921.1
20.1
3,6011,4902,111
301756
3.3.2
9.2
9.518.7
.103
64.7.8.3
92.8
.095
23.842.81.9
46.81.60
18. 920.1
5.41.3
13.6
.270
8.024.5
5.31.7.9
21.1
4,8292,0622,767
363667
p. 102
p. 092
v 1. 55
P . 270
PULP, PAPER, AND PAPER PRODUCTS
PULP WOOD AND WASTE PAPER
Pulpwood:
Consumption. _ _ _ doStocks, end of period. _ do
Waste paper:Consumption.. _ _ _ _ thous. sh. tons.Stocks, end of period. _ _ _ _ do
WOODPULPProduction:
Total, all grades - thous. sh. tons _Dissolving and special alpha _ do _ -Sulfate. __- doSulfite do
Groundwood _ __do
Soda, semichem., screenings, e t c _ _ _ _ . _ do_Stocks, end of period:
Total all mills doPulp mills. ' _ _ _ • _ _ _ _ do -_Paper and board mills _. _ _ do. _Nonpaper mills _ _ __ do_ _
Exports, all grades, total • _ _ _ _ _ _ _ _ _ _ _ d oDissolving and special alpha _ _ doAll other. _ _ _ _ _ _ ._ . _ _ _ _ _do _ _
Imports all grades total doDissolving and special alpha. _ _ _ _ do_All other. _ _ _ _ __do _ _
PAPER AND PAPER PRODUCTS
Paper and board:Production (Bu. of the Census) :
All grades, total, unadjusted.- -thous. sh. tons_.Paper doPaperboard.. doWet-machine board. . _ _ _ _ doConstruction paper and board do_ _
49, 87249,711
4, 843
9,493596
32, 4291,457
20, 0062,685
3, 5961,6213, 063
78122846292
1,602581
1, 021
2,922272
2,650
41, 74818, 18019,663
1483,797
50,45250, 7405, 770
9,914573
33, 2961,486
20, 5142,789
3,9201,4733,113
73025339582
21,4022535
897
3, 127280
2,847
43,74719,02020,760
1353,833
4,0384,2684,695
831522
2,764122
1,694239
323128256
72326837778
1475890
25125
226
3,6821,6111,736
11323
4,1904,3654,429
836515
2,900132
1,787242
342125271
73527837483
1324885
24423
221
3,7201,6091,776
12324
3,9353,9894,613
854518
2,646110
1,605242
324125239
74828438184
1074364
28826
263
3,5751,5321,688
13341
4,2344,1104,856
720555
2, 680113
1,657218
319125247
76328140082
1195267
24523
222
3,4191,4881,599
8324
4,3794,3514,985
833532
2,917134
1,822238
337122263
76630238381
1094267
26523
242
3,7461,6081,788
11340
4,2704,0855,268
840520
2,700120
1,678220
305121256
74329037578
1104169
25325
228
3,6261,5441,730
11342
4,6114,6645,328
899511
2,949130
1,817258
334126284
75031136970
1234974
26123
237
3,9111,677,858
365
4,2284,3835, 317
842512
2,894119
1,811232
339119275
73930036673
1013368
30624
282
3,7511,6271,789
11324
4,4414,0725,770
804573
2,626124
1, 606217
320113247
73025339582
1295673
27023
247
3,6241,5731,754
12286
4,2474,5745,412
848486
2,918141
1,808230
337121281
69826535975
1285871
24222
220
3,8471,7001,845
11291
4,1924,2935,320
'808M64
2,750124
1,715213
315118265
'682252
'35179
1265670
24923
226
r 3, 651r 1, 587' 1, 759
11'295
4, 8434,6515, 428
929481
3,052140
1, 908242
342131289
67724235481
1255670
30327
276
4,0341,7471, 941
12333
15346
108
25420
234
'Revised. * Preliminary. 1 See note 2 for p. S-35. 2 See note "O" for p. S-21. JRevisions for Jan.-Oct. 1964 will be shown later.
Digitized for FRASER http://fraser.stlouisfed.org/ Federal Reserve Bank of St. Louis
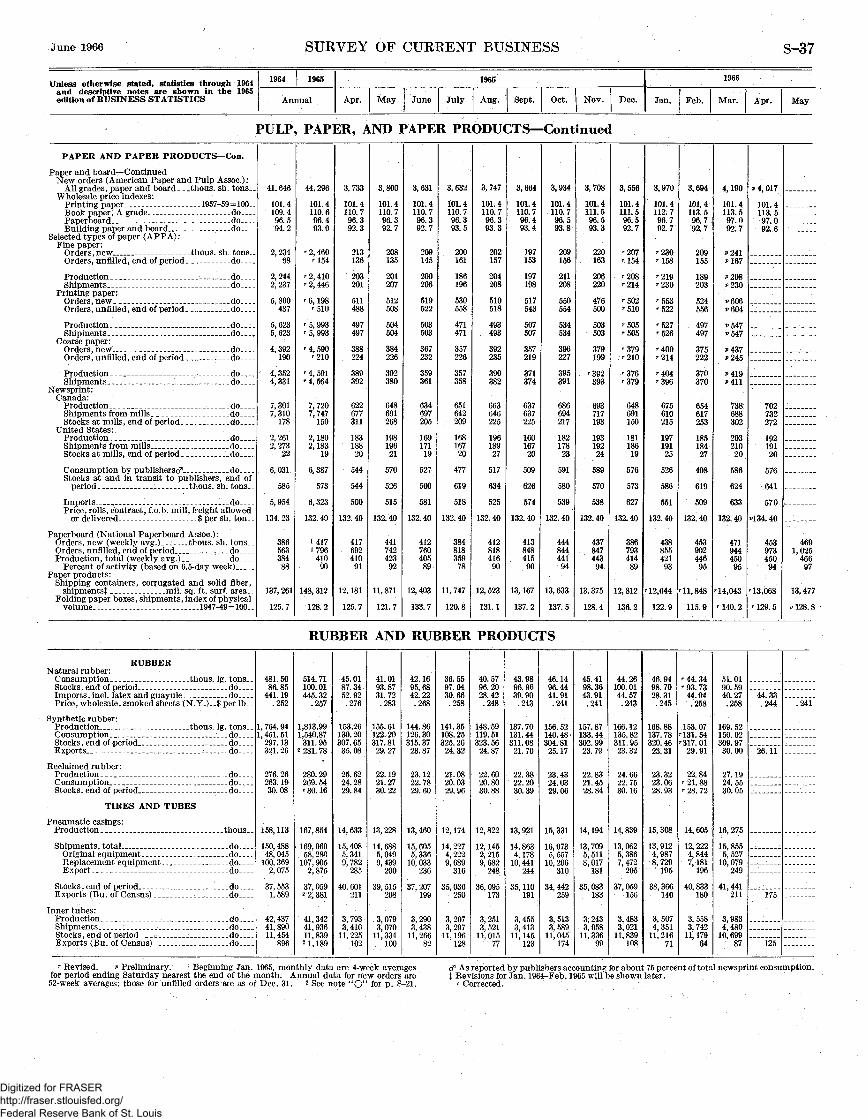
June 1966 SUKVEY OF CUERENT BUSINESS S-37
Unless otherwise stated, statistics through 1964and descriptive notes are shown in the 1965edition of BUSINESS STATISTICS
1964 1965
Annual
1965
Apr. May June July Aug. Sept. Oct. Nov. Dec.
1966
Jan. Feb. Mar. Apr. May
PULP, PAPER, AND PAPER PRODUCTS—Continued
PAPER AND PAPER PRODUCTS— Con.
Paper and board— ContinuedNew orders (American Paper and Pulp Assoc.) :
All grades, paper and board thous. sh. tonsWholesale price indexes:
Printing paper _ _ 1957-59 = 100. _Book paper, A grade - doPaperboard __ _ _ _ _ • _ _ _ . doBuilding paper and board do
Selected types of paper (APPA):Fine paper:
Orders, new _ thous. sh. tons-Orders , unfilled , end of period do _ _ _
Production _ _ _ _ _ • _ ___ doShipments.- __ __ _ -_do. _
Printing paper:Orders, n e w _ _ _ _ _ _ _ _ d oOrders, unfilled, end of period do
Production __ __ _ _ do_ __Shipments do
Coarse paper:Orders, new. . _ _ _. __ __ _do_ .Orders, unfilled, end of period do
'Production _ _ __ . _do ___Shipments do
Newsprint:Canada:
Production _ doShipments from mills _ _ . doStocks at mills, end of period do
United States:Production^ _ _ _ _ _ _ _ _ _ _ _ d oShipments from mills doStocks at mills, end of period _ _ -—do __
Consumption by publisherscf __ __ doStocks at and in transit to publishers, end of
period _ _ _ thous. sh. tons
Imports doPrice, rolls, contract, f.o.b. mill, freight allowed
or delivered $ per sh ton
Paperboard (National Paperboard Assoc.) :Orders, new (weekly a vg.) thous. sh. tonsOrders, unfilled, end of period - _ doProduction, total (weekly avg.) _ _ do
Percent of activity (based on 6.5-day week)Paper products:
Shipping containers, corrugated and solid fiber,shipments J mil. sq. ft. surf, area
Folding paper boxes, shipments, index of physicalvolume 1947-49=100
41, 646
101.4109.496.594.2
2,23498
2, 2442,237
5,800437
5,6235,623
4,392190
4,3524,331
7,3017,310
178
2,2612, 273
22
6,031
585
5, 954
134. 23
38656338488
137, 261
125.7
44, 296
101.4110.696.493.0
' 2, 460"164
'•2, 410' 2, 446
' 6, 198'510
' 5, 993' 5, 993
' 4, 590'210
' 4, 591' 4, 564
7,7207,747
150
2, 1802,183
19
6,387
573
6,323
132. 40
14171796
41090
148, 312
128. 2
3,733
101.4110.796.392.3
213136
203201
511488
497497
388224
389392
622677311
18318820
544
544
500
132. 40
41769241091
12, 181
125.7
3,800
101.4110.796.392.7
208135
201207
512508
504504
384226
392380
648691268
19819621
570
526
515
132.40
44174242392
11. 871
121.7
3,631
101. 4110.796.392.7
209145
200206
519522
503503
367232
359361
634697205
16917119
527
560
581
132. 40
41276040589
12, 403
133.7
3,632
101. 4110. 796.393.5
200161
186196
530558
471471
357226
357358
651642209
16816720
477
619
518
132. 40
384818359
78
11, 747
120. 8
3, 747
101. 4110.796.393.3
202157
204208
510518
493493
392235
390382
663646225
19618927
517
634
525
132. 40
41281841690
12, 523
131.1
3,664
101.4110.796.493.4
197153
197198
517543
507507
357219
371374
637637225
16016720
509
626
574
132.40
41384841590
13, 167
137. 2
3,934
101.4110. 796.593.8
209156
211208
550554
534534
396227
395391
686694217
18217823
591
580
539
132. 40
44484444194
13,633
137.5
3,708
101.4111.596.593.3
220163
206220
476500
503503
379199
'392393
693717193
19319224
589
570
538
132.40
43784744394
13, 375
128.4
3, 556
101.4111.596.592.7
'207'154
'208'214
'502'510
'505'505
'379'210
'376'379
648691150
18118619
576
573
627
132. 40
38679341489
12, 812
136.2
3,970
101.4112.796.792.7
'230'158
'219'230
'553'522
'527'526
'400'214
'404'396
675610215
19719125
526
586
551
132. 40
43885542193
'12,044
122.9
3,694
101.4113.596.792.7
209155
189203
524556
497497
375222
370370
654617253
18518427
498
619
509
132.40
45390244695
'11,848
115. 9
4,190
101.4113.597.092.7
*241*167
P208P230
*606P604
P547"547
*>437P245
P419Mil
738688302
20321020
586
624
633
132. 40
47194445095
'14,043
' 140. 2
» 4, 017
101.4113.597.092.6
702732272
19219120
576
641
570
P134. 40
45397345094
'13,068
' 129. 5
4691, 025
46697
13, 477
r> 128. 8
RUBBER AND RUBBER PRODUCTS
RUBBERNatural rubber:
Consumption thous. Ig. tonsStocks, end of period- do _Imports , incl. latex and guayule _ _ _ _ _ do _Price/wholesale, smoked sheets (N.Y.)__$ per lb__
Synthetic rubber:Production. _ thous. Ig. tonsConsumption doStocks , end of period _ _ _ do_ _Exports do
Reclaimed rubber:Production . _ _ _ . do __Consumption doStocks, end of period do
TIRES AND TUBES
Pneumatic casings:Production _ _ _ ___ __ ___thous_
Shipments, total ._ _ doOriginal equipment doReplacement equipment doExport _ do
Stocks , end of period doExports (Bu of Census) do
Inner tubes:Production. __ _ . . _ _ . _ _ _ •_ _ _ _ _ do__Shipments . . d oStocks, end of period doExports (Bu. of Census) _ do
481. 5086.85
441. 19.252
1, 764. 941, 451. 51
297. 13321. 26
276. 26263. 1930.08
158, 113
150, 48848 045
100, 3692,075
37, 5531 589
42, 43741 89011,454
896
514. 71100. 01445.32
.257
1,813.991,540.87311. 95
2 281. 78
280. 29269. 54'30 16
167, 854
* 169, 06058 280
107, 9052,875
37 0592 2 381
41,34241 93611 839
2 1, 189
45.0187. 3452.92.276
153.26130. 20307. 6535.08
25.6224.2829 84
14, 633
15, 4085 3419 782
285
40 601211
3, 7933 410
11 225102
41.0193.8731.72.283
155. 61122.20317. 81
29.27
22.1921.2730 22
13,228
14 6885 0499 439
200
39 515208
3,0793 070
11 334100
42. 1695,6842.22.268
144. 86126. 30315. 3723.87
23. 12-22.7829 60
13,460
15 6055 336
10 033236
37 207199
3,2903 438
11 26682
36. 5597.0430.66.258
141. 35108. 25325. 2624.32
21.0820.0329 96
12, 174
14 2274 2229 689
316
35 036250
3 2073 297
11 196128
40.5796. 2028.42.248
148. 59119.51323.5624.87
22.6020.8030 88
12, 822
12 1452 2159 682
248
36 095173
3,2513 521
11 01577
43.9896.9639. 90.243
137. 70131. 44311. 08
21 70
22.3822.2030 39
13, 921
14 8634 178
10 441244
35 110191
3 4553 413
11 145123
46.1496.4441.91.241
156. 52140. 48304.81
25 17
23.4324 0329 06
15, 331
16 0735 557
10 206310
34 442259
3,5133 589
11 045174
45. 4198.3643.91.241
157. 87133. 44302. 9923.79
22.8321.4528 84
14, 194
13,7095 5118 017
181
35 083183
3, 2433 058
11 33699
44.26100.0144.57.243
166.12135. 82311.9523.32
24.6622. 7530 16
14, 839
13, 0625 3867,472
205
37, 059156
3,4833 021
11 839108
46.9498.7028.31.245
168. 88137. 78320. 4623 31
23.3223.0628 93
15, 308
13, 9124,9878,729
195
38 366140
3, 5074 351
11,21671
' 44. 34'93.73
44.94.258
153. 07'131.54'317.01
29.91
22.84' 21. 88'28 72
14, 605
12, 2224 8447 181
196
40 833180
3,, 5583 742
11 17964
51.0190.5940.27.258
169. 52150. 02309. 9730 00
27.1924. 5530 05
16, 275
15,8555, 527
10, 079249
41, 441211
3,9834 480
10, 69987
44.33.244
26 11
175
125
.241
r Revised. » Preliminary. 1 Beginning Jan. 1965, monthly data are 4-week averagesfor period ending Saturday nearest the end of the month. Annual data for new orders are52-week averages: those for unfilled orders aie as of Dec. 31. 2 See note "O" for p. S-21.
ef As reported by publishers accounting for about 75 percent of total newsprint consumption.I Revisions for Jan. 1964-Feb, 1965 will be shown later,
c Corrected.
Digitized for FRASER http://fraser.stlouisfed.org/ Federal Reserve Bank of St. Louis
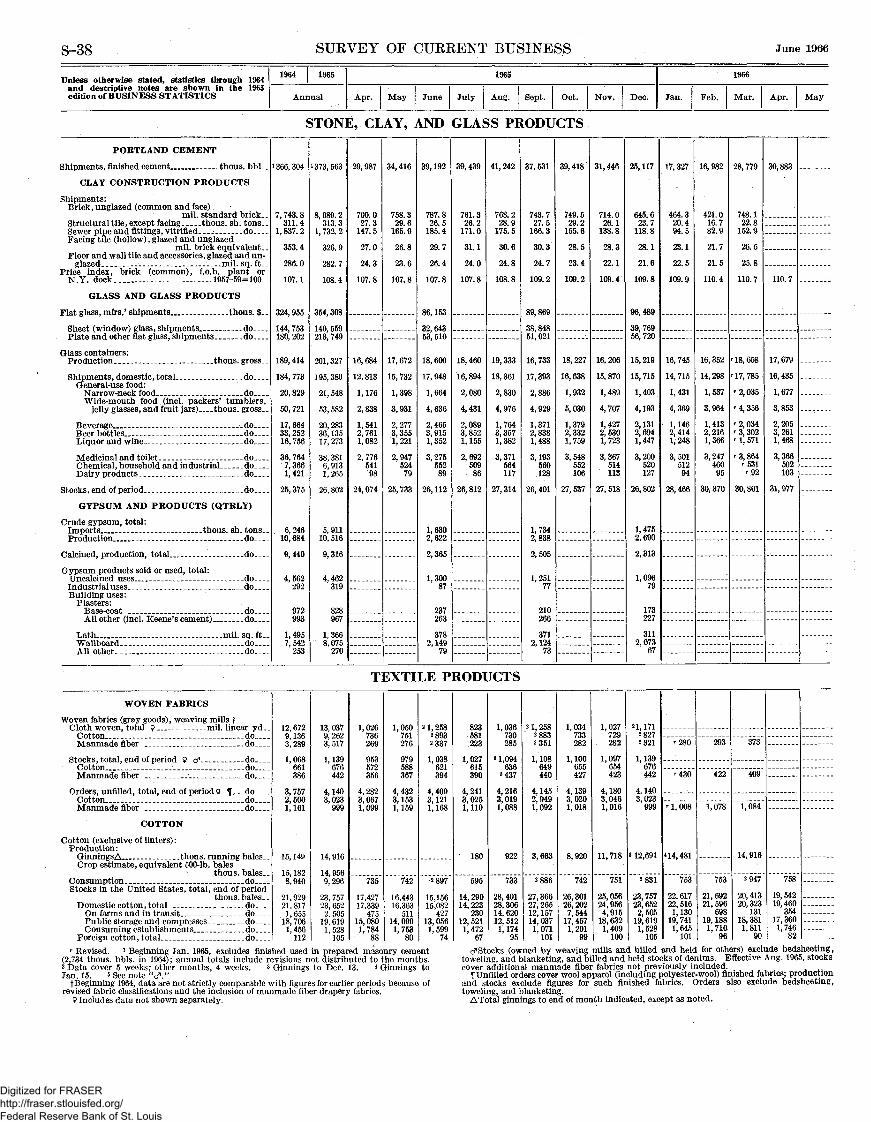
S-38 SURVEY OF CUREENT BUSINESS June 1966
Unless otherwise stated, statistics through 1964and descriptive notes are shown in the 1965edition of BUSINESS STATISTICS
1964 1965
Annual
1965
Apr. May June July Aug. Sept. Oct. Nov. Dec.
1966
Jan. Feb. Mar. Apr. May
STONE,. CLAY, AND GLASS PRODUCTS
PORTLAND CEMENT
Shipments, finished cement ._ . thous. bbl
CLAY CONSTRUCTION PRODUCTS
Shipments:Brick, unglazed (common and face)
mil. standard brickStructural tile , except facing thous sh tonsSewer pipe and fittings, vitrified • doFacing tile (hollow) , glazed and unglazed
mil brick equivalentFloor and wall tile and accessories, glazed and un-
glazed mil so ftPrice index, brick (common), f.o.b. plant or
N Y. dock 1957-59=100
GLASS AND GLASS PRODUCTS
Flat glass, mfrs.' shipments thous. $
Sheet (window) glass, shipments doPlate and other flat glass shipments do
Glass containers:Production thous gross
Shipments, domestic, total doGeneral-use food:
Narrow-neck food doWide-mouth food (incl. packers' tumblers,
lellv classes and fruit iars) thous gross
Beverage doBeer bottles _ doLiquor and wine do
Medicinal and toilet doChemical household and industrial doDairy products do
Stocks, end of period do
GYPSUM AND PRODUCTS (QTRLY)
Crude gypsum, total:Imports thous sh tonsProduction do
Calcined production total do
Gypsum products sold or used, total:Uncalcined uses doIndustrial uses doBuilding uses:
Plasters:Base-coat doAll other (incl Keene's cement) do
Lath mil sq ftWallboard doAll other do
!366 304
7, 743. 8311 4
1, 837. 2
353 4
286 0
107.1
324 955
144 753180 202
189 414
184, 773
20 829
50 721
17, 66433, 25216, 756
36 7647, 3661,421
25, 375
6 24610, 684
9 440
4,562292
972993
1 4957 542
253
*373 563
8 089.2313 3
1 732 2
326 9
282 7
108 4
354 308
140 559213 749
201 327
195 380
21 548
53 582
20 28336 13517 273
38 3816 9131 265
26 802
5 91110, 516
9 316
4,462319
828967
1 3668, 075
270
29, 987
700.027 3
147.5
27 0
24 3
107.8
16 684
12, 813
1 176
2 838
1,5412,7611,082
2 77654198
24, 074
34, 416
758.329 6
165.9
26 8
23 6
107.8
' 17 672
15 732
1,398
3 931
2,2773,3551,221
2 94752479
25, 733
39, 192
787.826.5
185.4
29.7
26 4
107.8
86 153
32 64353 510
18 600
17, 948
1 664
4 636
2,4653,9151,352
3 27555289
26, 112
1,6302,622
2,365
1,30087
237263
3782,149
79
39, 439
761.326.2
171.0
31 1
24 0
107.8
18 460
16, 894
2,080
4 431
2,0893,8521,155
2,69250986
26, 812
41, 242
768.228.9
175.5
30.6
24 8
108.8
19 333
18, 361
2,830
4 976
1,7643,3571,382
3,371564117
27, 314
37, 531
743.727.5
166.3
30.3
24.7
109.2
89, 869
38 84851 021
16 733
17 393
2 886
4 929
1,3712,8381,488
3 193560128
26, 401
1,7342,838
2,505
1,25177
210266
3712,124
73
39, 418
749. 529.2
155.6
28.5
23.4
109.2
18, 227
16, 638
1, 932
5 030
1,3792,3321,759
3, 548552106
27, 537
31,446
714.026 1
138.8
28 3
22.1
109.4
16, 206
15, 870
1,489
4 707
1, 4272,5301, 723
3,367514113
27, 518
25, 117
645.623 7
118.8
28.1
21.6
109.8
96, 489
39,76956 720
15, 219
15, 715
1,403
4 193
2,1312,6941,447
3,200520127
26, 802
1,4752,690
2,313
1,09679
173227
3112,073
67
17 327
464. 320.494.5
23.1
22 5
109.9
16, 745
14, 715
1,431
4 369
1,1462,4141, 248
3,50151294
28, 466
16, 982
421.016.782.9
21.7
21.5
110.4
16, 352
14,298
1,537
3 964
1,4132,2161,366
3,24746095
30, 370
28, 779
748.122.8
152.9
26.5
25.8
110.7
'18,658r 17, 785
r 2, 035
»-4 356
' 2, 034' 3, 302' 1, 571
' 3, 864"531r92
30, 801
30, 883
110.7
17, 679
16, 435
1,677
3 853
2,2053,2611,468
3,366502103
31, 977
TEXTILE PRODUCTS
WOVEN FABRICS
Woven fabrics (gray goods), weaving mills fCloth woven total Q mil linear yd
Cotton doManmade fiber do
Cotton doManmade fiber do
Orders unfilled total end of period Q H doCotton doIVCanmade fiber do
COTTON
Cotton (exclusive of linters) :Production:
GinningsA thous running balesCrop estimate, equivalent 500-lb. bales
thous balesConsumption doStocks in the United States, total, end of period
Domestic cotton , total doOn farms and in transit doPublic storage and compresses doConsuming establishments do
Foreign cotton, total do.__
12 6729 1363 289
1 068661386
3 7572 5001 161
15 140
15 1828 940
91 QOQ
21 8171 655
18 7061 456
112
13 0379' 2623' 517
1 139676442
4 1403 023
999
14 916
14 9569 296
90 7^723 6522 505
19 6191 528'105
1 026736269
953572356
4 2823 0671 099
735
17 42717 339
47515 0801 784
88
1 050751276
979588367
4 4323 1531 159
742
ic 440
16363511
14 0991 753
80
2 1 25828932337
1 038621394
4 4093 1211 168
•2897
1 C I KR
15 082427
13 0561 599
74
823581905
1 027615390
4 2413 0251 110
180
595
14 29014, 223
23012, 5211 472
67
1 036730285
5 1 094636
5 437
4 2163 0191 088
922
733
28 40128, 30614, 62012, 5121 174
95
2 1 25828832351
1 108649440
4 1452 9491 092
3,663
2886
27 36627,26512, 15714, 0371 071
101
1 034733282
1 100655427
4 1393 0201 018
8,920
742
26 30126, 2027 544
17, 4571 201
99
1 027729282
1 097'654423
4 1803 0461,016
11, 718
751
25 05624, 9564,915
18, 6321,409
100
21 17128272321
1 139676442
4 1403 023
999
3 12,691
2831
23 75723, 6522,505
19, 6191,528
105
'280
'430
r 1, 008
4 14, 481
753
22 61722, 5161,130
19, 7411,645
101
293
422
1,078
753
21 69221, 596
69819, 1881, 710
96
373
409
1,084
14, 916
2947
20, 41320,323
13118, 3811,811
90
758
19,54219,460
35417, 3601, 746
82r Revised. 1 Beginning Jan. 1965, excludes finished used in prepared masonry cement
(2,734 thous. bbls. in 1964); annual totals include revisions not distributed to the months.2 Data cover 5 weeks; other months, 4 weeks. 3 Ginnings to Dec. 13. 4 Ginnings toJan. 15. 5 See note "cf."
f Beginning 1964, data are not strictly comparable with figures for earlier periods because ofrevised fabric classifications and the inclusion of manmade fiber drapery fabrics.
9 Includes data not shown separately.
d" Stocks (owned by weaving mills and billed and held for others) exclude bedsheeting,toweling, and blanketing, and billed and held stocks of denims. Effective Aug. 1965, stockscover additional manmade fiber fabrics not previously included.
^Unfilled orders cover wool apparel (including polyester-wool) finished fabrics; productionand stocks exclude figures for such finished fabrics. Orders also exclude bedsheeting,toweling, and blanketing.
ATotal ginnings to end of month indicated, except as noted.
Digitized for FRASER http://fraser.stlouisfed.org/ Federal Reserve Bank of St. Louis

June 1966 SURVEY OF CURRENT BUSINESS S-39
Unless otherwise stated, statistics through 1964and descriptive notes are shown in the 1965edition of BUSINESS STATISTICS
1964 1965
Annual
1965
Apr. May June July Aug. Sept. Oct. Nov. Dec.
1966
Jan. Feb. Mar. Apr. May
TEXTILE PRODUCTS—Continued
COTTON— Continued
Cotton (exclusive of linters)— ContinuedExports thous. balesImports _ _ _ doPrices (farm), American upland cents per IbPrices, middling 1", avg. 15 markets do
Cotton linters :Consumption thous. balesProduction doStocks, end of period do
COTTON MANUFACTURESSpindle activity (cotton system spindles) :
Active spindles, last working day, total _ milConsuming 100 percent cotton do
Spindle hours operated, all fibers, total bilAverage per working day. do
Consuming 100 percent cotton tioCotton yarn, natural stock, on cones or tubes:
Prices, f.o.b. mill:20/2, carded, weaving. _ $ per lb__36/2, combed, knitting§ .do
Cotton cloth:Cotton broad woven goods over 12" in width:
Production (qtrly ) mil lin ydOrders, unfilled, end of period, as compared with
avg. weekly production _ No. weeks' prodInventories, end of period, as compared with
avg weekly production No weeks' prodRatio of stocks to unfilled orders (at cotton
mills) end of period seasonally adjustedMill margins _ _ _ cents per lb_Prices, wholesale:
Denim, mill finished cents per ydPrint cloth, 39 inch, 68 x 72 do .Sheeting, class B, 40-inch, 48 x 44-48 do
MANMADE FIBERS AND MANUFACTURESFiber production qtrly total mil Ib
Filament varn (rayon and acetate) doStaple incl tow (rayon) doNoncellulosic, except textile glass:
Yarn and monofilaments* doStaple incl tow* do
Textile glass fiber doExports:
Yarns and monofilaments thous IbStaple, tow, and tops do
Imports:Yarns and monofilaments _ _ doStaple tow, and tops do
Stocks, producers', end of period:Filament yarn (rayon and acetate) mil IbStaple, incl. tow (rayon) _ _ _ doNoncellulosic fiber, except textile glass:
Yarn and monofilaments* doStaple incl tow* do
Textile glass fiber doPrices, manmade fibers, f.o.b. producing plant:
Staple' Rayon (viscose) 1 5 denier $perlbPolyester 1 5 denier* do
Yarn* Rayon (viscose), 150 denier doManmade fiber and silk broad woven fabrics:
Production (qtrly ) total 9 mil lin ydFilament yarn (100%) fabrics 9 do
Chiefly rayon and/or acetate fabrics doChiefly nylon fabrics do
. Spun yarn (100%) fabrics (except blanketing) 9
Rayon and/or acetate fabrics and blendsdo
Polyester blends with cotton doCombinations of filament and spun yarn fabrics
mil lin ydExports piece goods fhous so yd
WOOLWool consumption, mill (clean basis) :
Apparel class mil IbCarpet class do
Wool imports, clean yield* doDuty-free (carpet class)* do
Wool prices, raw, clean basis, Boston:Good French combing and staple:
Graded territory, fine $ per lb_.Graded fleece, % blood __do _ _
Australian, 64s, 70s, good topmaking do
WOOL MANUFACTURESKnitting yarn, worsted, 2/20s-50s/56s, American
system wholesale price 1957-59 ~~ 100Woolen and worsted woven goods, exc. felts:
Production (qtrly ) mil lin ydSuiting, price (wholesale), flannel, men's and
boys', f.o.b. mill 1957-59=100..
5, 241118
i 29.6i 30.7
1 3961 572
709
18.715.3
124 6.471
103 6
.630
.892
8 966
18.2
5.2
.303 29. 49
36.64 16. 5
17.4
3 018 0777 5594 3
847 6559 1239 5
116 47356 411
9,202133 695
32 651.3
76. 957 536.8
28.98.78
3 545 41,583.1
852.2283 1
1 260 4
665 6456 8
472 4185 263
233.9122 7212.3113. 9
1.3971.2861.389
107 9
255 2
95.9
3 79599
1 4061 635
735
18.914.7
128 0.493
102.9
.629
.891
9 238
20.3
4 5
2337.51
34.918.617.5
'3, 532. 2825 0648 0
r997 7r779 2r 282. 3
6 99 9236 50 763
15, 690130 108
59 855.8
r 109. 3r96 7
32 2
2885
.80
3 926 21, 640. 6
855.8303 9
1 534 6
643 3713 5
519 46 167 083
274 7112 3271 6108 9
1. 2491.1921.156
107 8
267 3
100. 2
4074
29 230.8
112132800
18.715.19.9
.4978.1
.622
.878
19.1
3.9
.2036. 49
34.918.517.5
11 0417 492
1,0878 892
32 952.4
28.84.78
18 797
22.58 7
30.211.0
1.1951. 1301.075
105 7
96.8
2514
29 930.8
112105768
18.815.210.1.5068.2
.622
.878
19.1
3.9
.1937.30
34.918.817.5
7 5594 686
9709,781
33 555.5
28.84.78
14 660
22.18 7
20.67.8
1.1951.1451. 075
106.2
101. 1
3982
30.130.9
213371
715
18.715.0
212.3.492
2 9. 8
.627
.885
2,374
19.5
4.1
.2037.49
34.918.817.5
»• 880. 5207 9164.2
r 246 8191.969.7
10, 0714,976
1, 5649,505
34 560.6
'89.857.033.7
28.84.78
981.1416.7219.677 2
374 4
162.0171.9
131 313 494
2 27.32 10 8
23.010.5
1.1951. 1551.075
106 7
73 4
101.7
2663
30.030.7
8653
671
18.815.08.3
.4176.7
.632
.889
24.2
5.1
.2137.97
34.918.817.5
8,0812, 840
1,0239,689
40 169.6
.28
.84
.80
11 148
19.56 5
22.511.7
1.2181, 1721.100
107.1
101.7
11753
28.930.0
10644
605
18.915.110.1.5068.1
.632
.898
18.8
4.0
.213 38. 31
34.918.817.5
8,1893,336
1,11413,412
46 373.0
.28
.84
.80
11 910
23.28.7
25.511.1
1.2651.2201.225
109.0
101.7
2263
29.529.7
2 138123572
19.015.0
212.3.49329.8
.637
.900
2 189
18.6
4.1
.2138.57
34.918.817.5
' 905. 0210.5162.0
r 251. 7209. 771.1
8,2824,034
1,31312, 670
52.971.1
r 109. 173.837.0
.28
.84
.80
960.6398.4209. 174 0
379 1
152.4179 7
127 313 869
227.12 10.9
25.910.3
1.2751.2531.225
109. 0
66 8
102.4
3046
29.429.7
119188641
19.015.010.3.5178.2
.637
.903
18.7
4.0
.2238.62
34.918.817. 5
7,5163,058
1,19812, 507
55.368.5
.28
.84
.80
14 839
22.69.4
23.812.0
1.2751.2551.225
109.0
102. 4
3701
29.029.6
110200680
19.115.010.4.5228.3
.642
.910
19.0
4.1
.2338.58
34.918.817.5
8,8213,404
1,61012, 537
55 660.3
.28
.84
.80
14, 953
21.19.3
21.16.8
1.2791.2351.225
109.0
102.4
44715
27.929.5
2 131190735
18.914.7
2 11.8.47029.3
.642
.916
2 310
20.3
4.5
.2338.77
34.918.817.5
910.7203 3156 4
'260 5••214 4'76. 1
8 9034,856
1,98913, 859
59 855.8
' 109. 3r96 732.2
28.84.80
1 Oil 5408.3205.576 0
419 6
154.5210 7
123 815 798
225.6210.121.17.4
1.2801.2351.225
108.4
61.2
102.4
27816
26.629.5
118193777
18.914.710.4.5228.2
.647
.926
38.78
34.918.817.5
7 7374,173
1,42118, 130
61 658.7
28.84.80
12 912
23.49 0
28.19.1
1.2801.2351.225
109.6
102.4
2546
26 629.5
116179811
18.814.610.5.5258.2
.652
.934
38. 77
34.918.817. 6
9 1144 204
81010, 700
61 156.7
28.84.80
13 711
r 23. 3•-9.124.07.0
1.2911.2291.225
109.6
102.7
2366
27.929.5
r 2 143168
r833
19.214.7
213.0.518
210.0
.652r.938
38.58
34.918.818.0
938. 2201 7167 0
271 4220 277.9
10 0296 181
1,09416, 247
r60 153.9
112. 989 924 5
2884
.80
16 413
2 29. 22 11.3
33.010.8
1.3251. 2251.235
110.2
102.7
1776
28.529.5
123113839
19.214.710.5.5258 0
P. 657P. 940
38.71
P35.6P18.8p 18.0
5 66 85 55 0
8 5094 902
1,13221 488
58 052.8
v 28p. 84P. 80
14 600
26.99.5
1. 3501.2251.275
110.2
102.7
28.529.6
38.72
1.3751.2251.275
r Revised. p Preliminary. ! Season average. 2 por 5 weeks; other months, 4 weeks.3 Margins reflect equalization payments to domestic users (Aug. 1964-July 1965, 6.5 cents;beginning Aug. 1965, 5.75 cents per pound). 4 For 11 months; price not available for Sept.1964. s For month shown. « See "Q," p. S-21.
§Data beginning Aug. 1965 are not strictly comparable with earlier prices.
9 Includes data not shown separately.*New series. Sources: Polyester staple price, U.S. Dept. Labor; wool imports, U.S. Dept.
Agriculture from Bureau of the Census records (such imports exclude animal hairs). Dataare available as follows: Price, back to 1955; noncellulosic yarn and staple—production, to1951; stocks, to 1953; wool imports, to 1948.
Digitized for FRASER http://fraser.stlouisfed.org/ Federal Reserve Bank of St. Louis
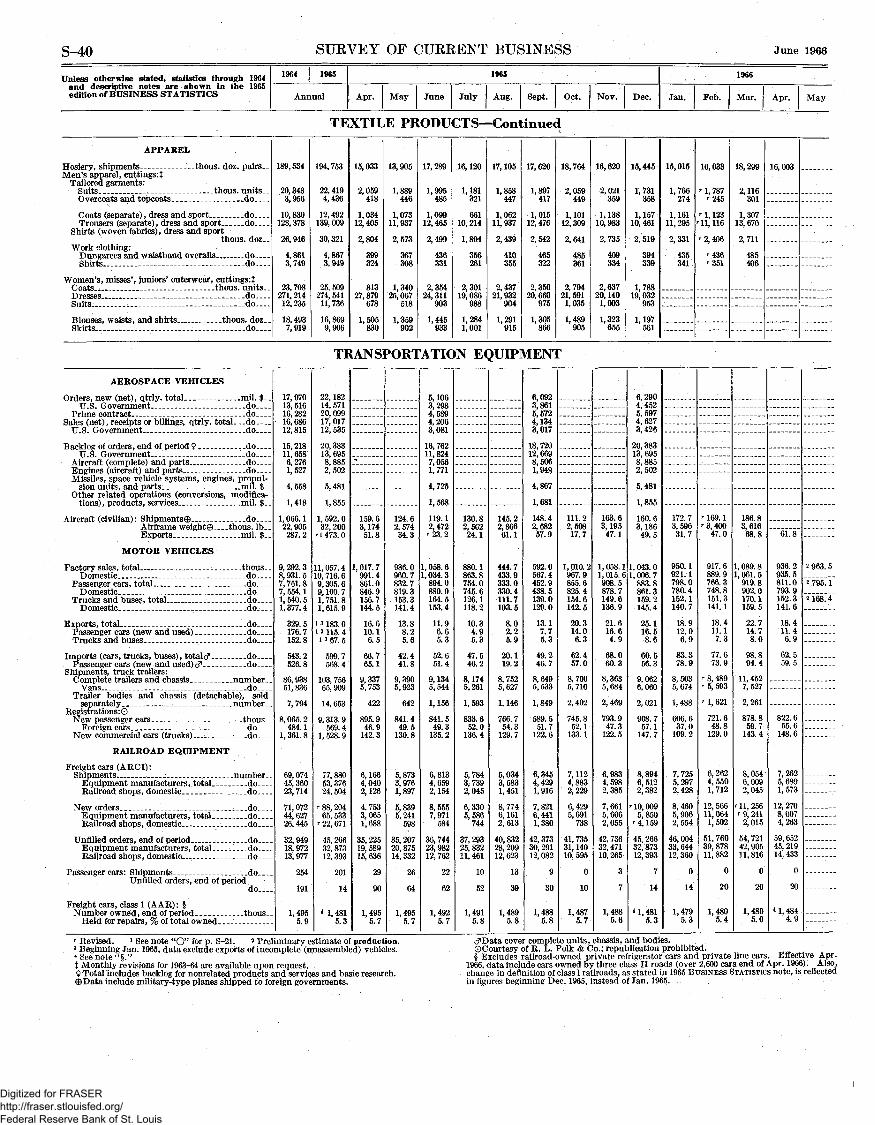
S-40 SURVEY OF CURRENT BUSINESS June 1966
Unless otherwise stated, statistics through 1964and descriptive notes are shown in the 1965edition of BUSINESS STATISTICS
1964 1965
Annual
1965
Apr. May June July Aug. Sept. Oct. Nov. Dec.
1966
Jan. Feb. Mar. Apr. May
TEXTILE PRODUCTS—Continued
APPAREL
Hosiery, shipments _ _ _ thous. doz. pairs-Men's apparel , cuttings: J
Tailored garments:Suits _ _._thous. units _Overcoats and topcoats __do
Coats (separate) , dress and sport doTrousers (separate) , dress and sport. . d o
Shirts (woven fabrics), dress and sportthous. doz
Work clothing:Dungarees and waistband overalls doShirts - do
Women's, misses', juniors' outerwear, cuttings: JCoats thous. unitsDresses _ _ _ _ - __doSuits - do
Blouses, waists, and shirts thous. dozSkirts do
189,534
20,3433,956
10, 830128, 378
26, 946
4,8613,749
23, 708271, 21412. 235
18. 4937, 919
194. 753
22, 4194,436
12, 492139, 009
30, 321
4,8673,949
25, 509274, 54111, 736
16, 8699,906
15, 033
2, 059418
1 03412, 405
2 804
399324
81327, 879
678
1 505830
13, 905
1,889446
1,07311, 937
2 573
367308
1,34025, 067
518
1 359902
17, 289
1, 995485
1,09912, 465
2, 499
436331
2,35424, 311
903
1,445933
16, 120
1,181321
66110, 214
1,894
356261
2,30119, 086
988
1,2841,001
17, 105
1,858447
1, 06211, 937
2,439
410355
2, 43721, 932
904
1,291915
17, 620
1,897417
1, 01512,476
2,542
465322
2,35020, 660
975
1,305866
18,764
2.059449
1 10112. 309
2 641
485361
2,79421, 5911,035
1,489905
16,620
2,021359
1,13810, 983
2,735
409334
2, 63720, 1401,003
1,323655
15, 445
1, 731358
1,15710, 461
2,519
394339
1, 78819, 032
953
1 197561
15,015
1,766274
1,16111, 295
2 331
435341
16, 033
r 1, 787••245
rl 123r 11, 116
' 2, 406
••436''351.
18, 299
2, 116301
1,30713, 670
2,711
485406
16, 003
TRANSPORTATION EQUIPMENT
AEROSPACE VEHICLES
Orders new (net), qtrly. total mil. $U S. Government _do
Prime contract doSales (net) receipts or billings, qtrly. total do
U S. Government do
Backlog of orders, end of period 9 doTJ S Government do
Aircraft (complete) and parts doEngines (aircraft) and parts doMissiles, space vehicle systems, engines, propul-
sion units, and parts mil $Other related operations (conversions, modifica-
tions) products, services mil $
Aircraft (civilian)' Shipments© doAirframe weight 0 thous IbExports mil $
MOTOR VEHICLES
Factory sales, total _thous__Domestic do
Passenger cars, total— _doDomestic do
Trucks and buses, total doDomestic d^o
Exports, total doPassenger cars (new and used) doTrucks and buses do
Imports (cars, trucks, buses) , totalcf doPassenger cars (new and used) c? do
Shipments, truck trailers:C omplete trailers and chassis number
Vans doTrailer bodies and chassis (detachable), sold
separately numberRegistrations:©
New passenger cars thousForeign cars do
New commercial cars (trucks) do
RAILROAD EQUIPMENT
Freight cars (ARCI):Shipments number
Equipment manufacturers, total doRailroad shops, domestic... do
New orders doEquipment manufacturers total doRailroad shops, domestic _ _ _ - — _ _ _ - — - d o _ - —
Unfilled orders, end of period doEquipment manufacturers total doRailroad shops, domestic.. do___.
Passenger cars: Shipments doUnfilled orders, end of period
do.___
Freight cars, class 1 (AAR): §Number owned , end of period _. _thous_ _
Held for repairs, % of total owned
17, 97013, 51616,28216, 68612,815
15, 21811, 6586,2761,527
4,558
1,41.8
1,066.122, 905287.2
9,292.38,931.57,751.87, 554. 11, 540. 51, 377. 4
329.5176.7152.8
543,2526. 8
86,93851,836
7, 794
8, 065. 2484.1
1,361.8
69, 07445, 36023, 714
71,07244, 62726, 445
32, 94918,97213, 977
254
191
1,4955.9
22, 18214, 57120, 09917,01712, 535
20,38313, 6958,8852,502
5, 481
1, 855
1, 592. 032,200
r 1473.0
11, 057. 410. 716. 69.305.69,100.71. 751. 81. 615. 9
1 3 183. 01 3 115. 4
1 3 67. 5
599.7568. 4
103, 75665,909
14, 653
9.313.9569.4
1, 528. 9
77, 88053,37624, 504
' 88, 20465, 533
' 22, 671
45, 26632, 87312. 393
201
14
* 1,4815.3
>*
159.63,17451.8
1, 017. 7991.4861.0846. 9156.7144.5
16.610.16.5
66.765.1
9,3375,753
422
895.946.9
142.3
6,1664,0402,126
4.7533,0651,688
35,22519, 58915,636
29
90
1,4955.7
124.62,57434.3
986.0960.7832.7819.3153. 3141.4
13.88.25.6
42.441.8
9, 3905,923
642
841.449.5
130.8
5, 8733,9761,897
5,8395,241
598
35, 20720, 87514, 332
26
64
1,4955.7
5,1063,2984,5894,2063,081
16, 76211, 8247,0561,771
4,725
1 568
119. 12,472'23.2
1, 058. 61, 034. 3
894.0880. 9164.5153. 4
11.96.65.3
52.651.4
9,1345,544
1,156
841.549.3
135.2
6,8134,6592,154
8,5557,971
584
36, 74423, 98212, 762
22
62
1,4925.7
130.82,56224.1
880.1863.8754.0745.6126.1118.2
10.34.95.3
47.546.2
8,1745,261
1, 593
833.652.0
136.4
5,7843,7392,045
6,3305,586
744
37, 29325, 83211, 461
10
52
1,4915.8
145.22,86661.1
444.7433.9333.0330.4111.7103. 5
8.02.25.9
20.119.2
8,7525,627
1,146
766.754.3
129.7
5,0343,5831,451
8,7746,1612,613
40, 83228, 20912,623
13
39
1,4895.8
6,0923, 8615,5724,1343,017
18,72012,6698,5061,948
4,867
1,681
148.42,68257.9
592.0567.4452.9438.5139. 0129.0
13.17.75.3
49.246.7
8,6495,533
1,849
589. 551.7
122.6
6,3454,4291,916
7,8216,4411,380
42,37330, 29112, 082
9
30
1,4885.8
111.22,50817.7
1, 010. 2967.9855.6825.4154.6142.5
20.314.06.3
62.457.0
8,7605,716
2,402
745. 852.1
133. 1
7, 1124,8832,229
6,4295,691
738
41, 73531, 14010,595
0
10
1,4875.7
163.63,19547. 1
1, 058. 11,015.6908.5878.7149.6136. 9
21.616.64.9
68.060.3
8,3635,684
2, 469
793.947.3
122. 5
6,9834, 5982, 385
7,6615,6062,055
42, 73632, 47110,265
3
7
1,4885.6
6,2904,4525, 5974,6273,426
20,38313, 6958,8852, 502
5,481
1, 855
160.63,18649.5
1, 043. 01, 006. 7
883.8861.3159.2145. 4
25.116.58.6
60.556. 3
9,0626,060
2, 021
908.757. 1
147.7
8,8946,5122,382
' 10, 0095,850
' 4, 159
45, 26632,87312, 393
7
14
4 1. 4815.3
172. 73,59631.7
950.1921.1798.0780.4152.1140.7
18.912. 06.9
83.378.9
8, 5035,674
1, 488
606. 637. 0
109.2
7,7255,2972,428
8,4605,9062,554
46, 00433, 64412, 360
0
14
1,4795.3
' 169. 1r3,400
47.0
917.6889.9766. 3748.8151.3141.1
18.411.17.3
77.673.9
' 8, 489' 5, 593
' 1, 621
721. 648.8
129.0
6,2624,5501,712
12,56611,0641,502
51,76039, 87811,882
0
20
1,4805.4
186.83,61668.8
1, 089. 81, 061. 5
919.8902.0170.1159. 5
22.714.78.0
98.894.4
11, 4527, 527
2, 261
878. 859. 7
143.4
8, 0546,0092,045
'11,256' 9, 241
2,015
54, 72142,90511,816
0
20
1,4805.0
61.8
936.2935.5811.0793. 9152.3141.6
18.411.46.9
62.559.5
822.655.6
148.6
7,2625,6891,573
12, 2708,0074,263
59,65245, 21914, 433
0
20
4 1,4844.9
2 963. 5
2795.1
2 168. 4
r Revised. * See note "O" for p. S-21. 2 Preliminary estimate of production.3 Beginning Jan. 1965, data exclude exports of incomplete'(unassembled) vehicles.4 See note "§."$ Monthly revisions for 1963-64 are available upon request.9 Total includes backlog for nonrelated products and services and basic research.®Data include military-type planes shipped to foreign governments.
cTData cover complete units, chassis, and bodies.©Courtesy of R. L. Polk & Co.; republication prohibited.§ Excludes railroad-owned private refrigerator cars and private line cars. Effective Apr.
1966, data include cars owned by three class II roads (over 2,600 cars end of Apr. 1966). Also,change in definition of class I railroads, as stated in 1965 BUSINESS STATISTICS note, is reflectedin figures beginning Dec. 1965, instead of Jan. 1965.
Digitized for FRASER http://fraser.stlouisfed.org/ Federal Reserve Bank of St. Louis
TO
GeneralsBusiness indicators, . . . V, ,"; . ; . . » • , , . , . , * . , . . . « ' . , ' , „ 1-7Commodity prices. . , , , , . , . f . • . , . » , , < , . , . / . , . /« 7,8Construction and real e s t a t e . . , , , . , , , . . , , . 9,10Domestic trade, , » . . , , , . . . ' . . . , . . . . , , ' , \ , , . , r 10-12
Employment and population, . , , , . > , , , . . . , . . . . 12-16Finance. , . , , , . .v\ , , , J ; . . . 16-21Foreign trade of the United Sta tes , , . . , ;« , , ; . . 21-23Transportation and communications. .• , , . , . , ; . , ' , 23,24
Industry sChemicals and allied products. . , » ; . . * . . » ^ , . . . 25Electric power and gas , 26Food and kindred products; tobacco 26-30Leather and products, , 30,31
Lumber and products , ,'. • 31Metals and manufactures. , . . . „ , , , , , . _ , . 32-34Petroleum, coal, and products.,,,' , . . 35,36Pulp, paper, and paper products , ' . . . . ; . . , 36,37
Rubber and rubber products. , „ . . , , ' - . , , . . —'.. 37Stone, clay, and glass products. , , » ) . , ' 38Textile products , - , . . » . . . . . . . . 38-40Transportation equipment. — -., 40
INDIVIDUAL SERIESAdvertising.... . . . . . . . ' . , . . . . . ' , . . . . 10,11,16Aerospace vehicles . , , , . . , . » , , , . , . , , » 40Agricultural loans ' . . . ; , . , , . , , • . , . » 16Air carrier operations , . . . , , , , „ . , ' . , . . . 23Aircraft and parts. , , , , , , » • . . . . . , . , , , . . , , 3,6,13-15,40Alcohol, denatured and ethyl ,.,,,, 25Alcoholic beverages. , , ; . , , . . . . , . . . 0,10,26Aluminum . '.. '.,;... '..:.,. 23,33Apparel ;.... 1,3,4,7,8,10-15,40Asphalt and tar products » » , . ' , , , . . , . , 35,36Automobiles* etc . . . . 1,3-8,10,11,13-15,19,22,40
Balance of international payments ' . ' . . . , „ , :Banking. . . . »Barley.Barrels and drums. . . . . . . . . . , - . . , . . . . . : .Battery shipments. . . , . » . , , . . , . . . . . .Beef and veal . . . . , . . „ , , , , . . • , . . . > . . , , .Beverages . . , . . . . » » , 4,8,Blast furnaces, steel works etc. 5,6,Bonds, outstanding, issued, prices, sales, yields.»..Brass and bronze,'•.,..; —Brick. . . . . . . . . . . ' . , . . . . ; , . , : . . . ; . . . .V . ; .Broker's balances,....«: ^ , , , , . 3 , , , . , » , . . . .Building and construction materials 8,10,31,Building costsBuilding permits. . . . , , , » . . . . . . , , . . . ,Business incorporations (new), failures.»...Business sales and inventories.B u t t e r . , . , , ; . , , ,
16,1727333428
10,2613-1518-20
333820
36,389,10
91
4,527
Cans (tinplate),., 33Carloadings. ,,..,.. 24Cattle and calves, ,., 28Cement and concrete products 8-10, $8Cereal and bakery products, ',. 8Chain-store sales, firms with 4 or more and 11 or
more stores*.... ^ . . . . . . . . . l , , , . . , . . . > . . . . . . 12Cheese ,. i.....,,,....,....,.....;.,..... 27Chemicals . , , , . , . . , , , , . . . . . . , , 4-6,8,13-15,19,22* 25Cigarettes and cigars. ; . . /;; . . . » * • 8, 30Civilian employees, Federal. '.'..:. 14Clay products.. ; . . ,' ; „ . 8, 38Coal, . . . . . v , . , . ; . 4<8,13-15,22,24,35Cocoa. . . . . . . . . . . . . . . . . . . . . . . . . . . . . . . . . . . . . , . 23,29Coffee 1 . . , , . , , , , V. . . . . I , , , , , , . . , . , . , . . . 23,29Coke..,.,, ' . . . .,:.:,. i- 24,35Communications. . . , . . . . . . . . . , , , . , ; . .2,13-15,20,24Confectionery, s a l e s . . . . . . . . . . . . .,'; . — 29Construction:
Contracts.,.,,»,,..• . , . . , . . ; . 9Costs. ...;...:..-,'.. / , . . , . . . . . , , 9,10,Employment hours, earnings, wages,, ^ . . . . . . . . 13- 16Fixed investment, structures, . « ,'„ , „ . . . . ; 1Highways and r o a d s , . , : , . . . . . . ; . . . . . 9» 10Housing starts.. ; , 9New construction put in place. • „ , . , , . , 9
Consumer credit...... — • . ; , , . . . . . . . . . . . . . . . . . 17,18Consumer expenditures.. . . . . . . .», i . . , . , . , . , . . . 1Consumer goods output, index. I . , , . . . . . , 3,4Consumer price I n d e x . , ' , , . . . , . 7Copper..., . , . . . . . . / , , . . . , . . . . . . . . . . . . 23,33Corn.- .; • , / , . , . , , , „ . , . . , , . . ,,..:. 27Cost of living (see Consumer price iridex),....... 7Cotton, raw and manufactures.;...,;./, 7, g, 22,38,39Cottonseed cak£ and meal and oil;. ',.»,.......; 30Credit, short- arid intermediate-term.,», 17,18Crops...... ; , , , , . . 3,7,27,28,30,38Crude oil and natural gas,..... 1 . « , , : , , . . . 4,13-15,35:Cutrencyiin circulation.,:.......... ' .,,;,.,.,;>,;, 19
Dairy p r o d u c t s , « , , , , » . . . / . ; . . . . . . . . . . . . . . . . 3,7,27Debits, bank,. . . . , J . , . . . / . . . . ; . i . , . < : , , , . 16Debt, U.S. Government. . . . . / , : . . . . ; . . . . . . 18Department stores.,.'. ., ' ; . . ' . . . . . 11,12,17Deposits, bank., , , . . . . , . . . . . . . , , . ; . . , ; . . . ; ; . 16,17,19Disputes, industrial, * „ » , . , . . . . . , . . . . . . , , , , . . , . . 16Distilled spirits.!, , . . ; . . , , ; . , . , ; . . . ; . , . . . . , , , ^ 26Dividend payments, ratet, and yields; . . 2,3*10-21Drug stores, sales,... ; , . . . , . . . . 4 , , _ . ; ; . . . . . . . 11,12
Earnings, weekly and hourly. 14-16Eating and drinking places 11,12Eggs and poultry, ,,... .... 3,7,29Electric power. . , . . . . . . . . , . . . . . , , , . . 4,8,26Electrical machinery and equipment.. 3,
5,6,8,13-15,19,22,34Employment estimates, 12-14Employment Service activities 16Expenditures, U.S. Government.. 18Explosives ,.,,. 25Exports (see also individual commodities).... 1,2,21-23Express operations, 23
Failures, industrial and commercial. . . . . . . . . . . . . 7Fans and blowers , , , . . , . . , , , , . , . 34Farm income, marketings, and prices. , 2,3,7Farm wages ......;.., 16Fats and oils..., 8,22,29,30Federal Government finance 18Federal Reserve banks, condition of. 16Federal Reserve member banks 17Fertilizers..;.. . . . . . ' . , , , 8,25Fire losses. . . . . . , 10Fish oils and fish,.....,..... 1 ; 29Flooring, hardwood.,.,.•,- 31Flour, wheat... . . , . . , . ^ , 28Food products.... 1,4~«UO, 11,13-15,19,22,23,27-30Foreclosures, real estate. . , . , ; . . . . . . . , , . 10Foreign trade (see also individual commod.)..... 21-23Foundry equipment, 34Freight earloadings, ; . . . . . . . . . 24Freight cars (equipment) 4,40Fruits and vegetables 7,8,22Fuel oil. , , 35,36Fuels , 4,8,35,36Furnaces., , » . , . . . , , , . , . « , . , 34Furniture,.,,.., , . . . . . , , , , 3,4,8,11-15,17Furs. , . . . 23
Gas, output, prices, sales, revenues 4,8,26Gasoline , , , , . . . . . 1,35,36Glass and products. , 38Glycerin. . , , . . , , 25Gold , , , . , . . , . . . , 19Grains and products 7,8,22,24,27,28Grocery stores. 11, 12Gross national product , 1Gross private domestic investment. , , . 1Gypsum and products,,......, ; . . , . , , 8,38
Hardware stores. 11Heating equipment. 8,34Hides and skins , . , , , . . 8, 30Highways and roads. 9,10Hogs,..,... . ' . . . v. , 28Home Loan banks, outstanding advances.. . , , .», 10Home mortgages, . . » . , , , , , . , . , . , . , 10Hosiery . . . . . . . . , , . , , 40H o t e l s . . . . . , , . . . . , , . . . , . . , , . 14,15,24Hours of work per week. 14Housefurnishings,,, 1,4,7,8,10-12Household appliances and r a d i o s . . , , , . . , . , , 4,8,11,34Housing starts and permits. » , 9
Imports (see also individual commodities)., , , , 1,22,23Income, personal 2,3Income arid employment tax rece ipt s , . , . , , , , . . , , 18Iridustrial production indexes;
By industry........ ; . . : , . . . , . . . 3,4By market grouping. 3,4
Installment credit,, , 12,17,18Installment sales, department stores » ,, 12Instruments and related products.......... 3,5,13-15Insurance, life,... , . . ; . . ; . . , . . » , 18,19Interest and money ra tes . . , , . , . . . . . . . . , . . . . , . , -.. 17Inventories, manufacturers* and trade,. . . . . . 4-6,11,12Inventory-sales ratios. , , ; , . . » . . . , . . . . . . . . . . 5Iron arid steel...... 3,5,4 8,10,13-15,19,22,23,32,33
Labor advertising index, disputes, turnover.Labor force. , . , , . . . . .Lamb and mutton. . . . . . , ,Lard...,.,.,,,..;;;..., v . . , . lLead.
1612282833
Leather and products. . . . . . . 1 . , . , . . 3,8,13-15,30,31Life insurance.,. , , , , , . . , . , 18,19Linseed oil. 30Livestock...,,,,,,. , 3,7,8,24,28Loans, real estate, agricultural, bank, brokers*
(see also Consumer credit). , 10,16,17,20Lubricants...,,,,., /. , , . , . . , . . . . . . . . 35,36Lumber and products. . ' . . . , ' . . ; . . . . . . 3,8,10-15,19, 31
Machine toools. 34Machinery.... . . , , , . . . . . . , . , 3,5,6,8,13-15,19,22,34Mail order houses, sales. , . . . , , . , . . . . ...... 11Manmade fibers and manufactures. 8,39Manufacturers* sales (or shipments)^ inventories,- orders - . . , , , . , - , . , . . , . , , , . . . • . . , ' 4-6Manufacturing employment, production workers,
payrolls, hours, earnings. , . , , , , . . . . . . ,» , 13-15Manufacturing production indexes, 3,4Margarine^ 1 . , . . . . , , . v , . 29Meat animals and meats.. , , , . . ; . . . * 3,7,8,22,28Medical and personal care, <. , , , . . . . . . . \. 7Metals. 3-6,'8,13-15,19,22,23,32-34Milk.;../ ;,,;.;,;.,,,;.......-.,.,..,. 27Mining and minerals...:,.,...... -. 2-4,8,13-15,19, 20Monetary statistics, 19Money supply,............ . , , , , . „ , . 19Mortgage applications, loans,Crates,......... 10,16,17Motor carriers. . . , . , . . , . . . . , , 1 1..... 23,24Motor vehicles, '. 1,3-8,10,11,13-15,19,22,40Motors and generators, , , 34
National defense expenditures...... f , . » . . . . . . , . 1,18National income and product* /* , . . . . . . . . lt 2National parks, visits., . / .».. v . , . , . . . . . . . . / ; . . 24Newsprint.; -. .*,; . . . . \ , V . . ' . . ' ; V , ; , . . . ' . > , , ' . . V , ' . -23r37New York Stock Exchange, selected data, . . . .„'„ ?. 20,21Nonferrous metals ,'. „ 3* 8,19,23,33, 34Noninstallnient credit . , . , . . . . , ; " . . . « „ . . . . . . 17,18
Oats., , . , » , - . „ . , . , ; . . /,, , . , , , . , • , . . . . ; . . . . « '27'Qil burners, . . , , . , , , . . . . . /.. , . , . , . , , . , , , . , , , 34Oils and fats . . . . . . . . , . . . . , . , . , . , ; , . . 8,22, 29,30Orders, new and unfilled, manufactures' , ; 6Ordnance. . , , , . . . . . . . ,„ . . . . . . , . , . . . . . . . , ; 13-15
Paint and paint materials. . L . , » . . . , . . . ; , . , , . . . . 8,25Panama Canal traffic . , » „ . < ; , . . . , , , , , . , , . . . . , , 24Paper and products and pulp. . . . . . . . . . . . . . . . . . 3,
5,6,8,13-15,19,23,36,37Parity ratio. , . . , * / . . . . , ; . . . , < . . : , , , , , . . . , 7Passports issued. , . . . . , , , 24Payrolls, i n d e x e s . . » . . . . . , . , , « 14Personal consumption expenditures . .» . . , . . . . . . , , 1Personal income. * . . ' . , . , , . , , . , . , , . . , , , , . , , 2,3Personal o u t l a y s . . . . . . . , . . . . . . , . , , . , « 2Petroleum and products, „-.... 4-6,
8,11,13-15,19,24 23,35,36Pig iron 32Plant and equipment expenditures , . . . , , . . , , . . . , 2,20Plastics and resin m a t e r i a l s . . . . . . . . . . . . . . . . . . . . 25Population,.«„• , . . . , , . . , 12Pork, , , , , , . . . . , . . . . . . , . . . , . . . , . . , , 28Postal savings.... .. , 17Poultry and e g g s . , . . . . , . . . . , . . . . . , , , , . .3,7,29Prices (see also individual commodities)......... 7,8Printing and publishing. . , . . , , . . . . . . 4,13-15Profits, corporate;, 2,19Public utilities.,. ,, 2-4,7-9,13-15,18-21Pullman Company,, , 24Pulp and pulp w o o d . . . , . . . ; , . , » » 36Purchasing power of the dollar , , . . . , 8
Radiators and convectors.. , , . 34Radio and t e l ev i s ion . , ' . . . . . , , , . , . . , . . . , 4,8,10,11, 34Railroads, 2,13,14,16,18,20,21,24,40Railways (local) and bus l ines , . . . . . .» , , , , . , . 13—15,23Rayon and acetate , , . . . . , . , . 39Real estate. . , . , . . , 10,17,18Receipts, U.S, Government. » , . » , . . ; , , , , 18Recreation,. ^ . . . . . . . . . . . r . ; . . , . . . . . , , . . . . . . . . 7Refrigerators and home freezers 34Rent ( h o u s i n g ) . . . . . : , - , ' , , . , ' ' . , « . , . . , . . ' . . . , . . . « , 7Retail trade 4,5,7,11-15,17,18Rice. , . / , ; , . , , , , . 27Roofing and siding, asphalt. , . , , , . . . . < . . . ; . . . . , 36Rubber and products (incl. plastics),.... . . . 4-6,
8,13-15,23,37
Saving, personal, .L ,, 2Savings deposits 17Securities issued . . , , . . . . / . , . 19,20Security markets , 20,21Services. . . . . , , , . , , , , . . . , , . ; 1,7,13-15Sheep and lambs.... , .,,..;......... 28Shoes and other footwear....... . . . . . . 8,11,12,31Silver. . . , . , . . . ; . . 19Soybean cake; and meal and oil , , » 30Spindle activity, c o t t o n . . , , . . . . . , ; , , , . . : , . . , , , 39Steel ingots and steel manufactures.. .: , , , ^2,33Steel scrap. . . . . , . , . , . . , . ., 32Stock prices, earnings, sales, etc. « ;; , . 20,21Stone, clay, glass products. . . ' . ' . . . .. 3-5,8,13-15,19,38Stoves and ranges, . . . , , , , , . . 34Sugar , . , , ; , , . . ; , , , . 23,29Sulfur . . . . . . , . . . , . . , , , . , . ; 25Sulfuric acid ,. v . . . , , . , . . . . . , . . . . . . . . » . . 25Superphosphate., 25
Tea imports. , . , ' , , , , . . ' . , . , , , , . , , , , , 29Telephone, telegraph, cable, and radiotelegraph
carriers,.,,.,,.,, , , . ; , . . . . . . , , ; . . . . .13-15,24Television and radio 4,8,10,11,34Textiles and products, '...'. 3, 5,6,8,13-15,19,22,38-40
.*Tin,v; . ; . , . , . . . , , , , • . . ; , / , : . . ; . . . i; v . , • • ; . . . . . . . 23,33Tires and inner tubes. , 8, II, 12,37Tobacco and manufactures., : 4-8,10,13-15,22,30Tractors... . . , , . . . . . , . . . . .......,.. 22,34Trade (retail and whoelsale) . , , . . . , . . . . . ; , , 4, S, 11,12Transit lines, local. . , , . . . . , . . , , , , . , , . . , 23Transportation 1,2,7,13-1$, 23,24Transportation equipment..,. , , . 3-6,13-15,19,40Travel.,.,,, , ,..,. 1 . , , . , , 23,24Truck trailers , . . , . . . . , , » . . . . . 40Trucks (industrial and other). . . , , , , . . . . 34,40
Unemployment and insurance, » . . . . . . . . . . . , - , - , , , 12,16U.S. Government bonds. 16-18* 20U.S. Government finance, . , , , . . . . . . , , : 18Utilities . . . . , , , , . . . . . . . . 2-4,9,13-15,18-21^ 26
Vacuum cleaners. . . . . . . . . . . ' , , - , , , , 34Tariety stores. . 11,12Tegetable oils , . , . , . . V , ". 30Vegetables and fruits, . » . , , , , , . . , , , , 7,8,22Vessels cleared in foreign trade. 24Veterans* benefits,.., . , . . . , , , . , , . . . . . . 16,18
Wages and salaries. ,2,3,14-16Washers and driers.. . . . . , . . . . . , / . . . ; . . . - . ' . 34Water heaters, ',.'.',"> , , ; 34Waterway trafiic. . . . , , : . : 24Wheat and wheat flour ,: , , 28Wholesale price indexes . , , . , . . . i . , . , . , * , . 8Wholesale trade, ; .4,5,7,13-15Wood pulp.. , ; . , , . . . 36Wool and wool manufactures., . . . ; . . . . . , , , , 7,8,23,39
2Snc .',,;..:....'.. 33,34
Digitized for FRASER http://fraser.stlouisfed.org/ Federal Reserve Bank of St. Louis
UNITED STATESGOVERNMENT PRINTING OFFICE
1INGTON. D.C.
POSTAGE AND FEES PAIDO . - S . GOVERNMENT PRINTING OFFICE
First-Class IV
Volume 46 Survey of Current Business Numbers 1-6
First-Half 1966 Indexol Special Articles and Features
SPECIAL ARTICLES
National Income and Product in 1965The Production Expansion in PerspectiveThe Balance of PaymentsEmployment—Prices—Finance.Federal Programs for Fiscal 1967...Growth Patterns in Employment by County,
1940-1950 and 1950-1960Business Investment and Sales Programs for
1966—Substantial Advances Anticipated.....The Balance of International Payments: Fourth
Quarter of 1965
No.11112
Page
31316194
9
16
No. Page
Total and Per Capita Personal Income, 1965—Record High in All States and Regions. . . . . . .
Recent Financial DevelopmentsA Quarterly Econometric Model of the United
States: A Progress ReportForeign Travel Payments Continue To Rise in
1965....The U.S. Balance of International Payments in
the First Quarter of 1966
78
13
15
18
FEATURES
Corporate Profits Rise.Manufacturers' Inventory and Sales Expecta-
tions for the First Half of 1966.Revised Projections of Foreign Plant and Equip-
ment Expenditures by Affiliates of U.S. Firms.First Quarter 1966 GNP
• No.3
Page3 Meat and Poultry Prices.
Residential Construction ActivityCapital Investment To Rise Throughout 1966.. .Manufacturers' Inventory and Sales Expecta-
tions—Second and Third Quarters 1966
No.566
Page538
13
LATEST SUPPLEMENT
Business Statistics—1965 Edition
Price $2
Orders may be placed with the Superintendent of Documents, U.S. Government PrintingOffice, Washington, D.C., 20402, or the nearest U.S. Department of Commerce Field Office.
Check or money order should be sent with orders.
Digitized for FRASER http://fraser.stlouisfed.org/ Federal Reserve Bank of St. Louis


