Salesforce Technovation Report 2018
16
AUGUST 17 MIT APP INVENTOR Authored by Mark Sherman, Ph.D. Assisted by Obada M. Alkhatib Technovation 2018 MIT Analysis of the 2018 Technovation student projects, sponsored by Salesforce
Transcript of Salesforce Technovation Report 2018
1
AUGUST 17
MIT APP INVENTOR Authored by Mark Sherman, Ph.D. Assisted by Obada M. Alkhatib
Technovation 2018
MIT Analysis of the 2018 Technovation student projects, sponsored by Salesforce

2
Technovation Computational Thinking 2018 Authored by Mark Sherman, Ph.D. Assisted by Obada M. Alkhatib Inquiries may be directed to Josh Sheldon ([email protected])
Introduction 3
Objectives 4
Methodology 4
Data Extraction and Cleaning 4
Data Processing 5
Analysis 5
Descriptive Statistics 5
Blocks Count per Project 5
Screens Count per Project 6
Iridescent Rubric 7
Measure 1: App Complexity Categories 7
Measure 2: Sensors and Mobile Functionality 8
Assessing Rubric Measure 1 - Block Sophistication 9
Level Achievement by Blocks 9
Level Depth by Blocks 9
Level 1: Simple Control Blocks 10
Level 2: Complex Control Blocks 10
Level 3: Local Databases or Variables 10
Level 4: External Data 10
Monotonicity of Levels 10
Breakdown of Non-monotonic Projects 10
Measure 2 - Sensors and Mobile Features 11
Interesting Observations 11
Number of Screens per Project 11
Unused Screens 12
Relationship of External Data Sources to Block Count 13
MIT ANALYSIS OF THE 2018 TECHNOVATION STUDENT PROJECTS SPONSORED BY SALESFORCE

3
Conclusion 14
Data Tables 15
T0-Identity-Table 15
T1-Rubric-Level-Depth-BlocksOnly 15
T2-Rubric-Level-Achievement-ComponentsOnly 15
T3-Rubric-Level-Achievement-BlocksAndComponents 15
T4-FeatureCounts 15
T5-All-Feature-Grid 15
T6-Screen-Block-Stats 15
T6-Level1, T6-Level2, T6-Level3, T6-Level4 16
Contributors 16
Cover image of the MIT Stata Center © 2014 Robin Stevens, used under Creative Commons 2.0
Introduction The Technovation Challenge is the largest technological entrepreneurship program for young women in the world. The program is run by Iridescent, who has already collected evidence that the challenge increases the rate of majoring in computer science by the girls in their program. This is especially important, and women are consistently underrepresented in computing careers. Technovation requires a mobile app prototype, and around 80% of apps submitted this year were built with MIT App Inventor. In this analysis, a team from MIT App Inventor took a closer look at half of those projects. The MIT team broke down the projects into a number of features and metrics, provided interpretation for the data patterns that were found, and provided abstracted data representing these features so that Iridescent may conduct further inquiry. This analysis was conducted under an agreement between Iridescent and MIT App Inventor. The mechanism of data collection, extraction, and analysis follows in the methodology.

4
Objectives ● Investigate the content of submitted Technovation projects for signs of computational
thinking and programmatic complexity. ● Generate extracted data tables for future analysis with spreadsheet tools. ● Provide discussion on observations of the data, and provide hypotheses where
possible.
Methodology Data Extraction and Cleaning Iridescent provided a list of project names and corresponding user names to analyze. These projects were made using the MIT App Inventor service, so their data was directly accessible given this information. This initial list of project names was assembled by self-report of the Technovation participants, and did not completely match with platform data. The data was obtained through a two-part process. The first part was extraction from the MIT App Inventor systems. These systems were constrained in what queries they allowed, so a protocol was designed to maximize the match rate against the list from Iridescent. In this protocol, first the usernames were matched, and then every project from those accounts were extracted. That set of projects was then “cleaned,” which reduced the set to the Technovation-related projects. Cleaning was done offline, where the matching processes were more flexible. Extraction from the MIT App Inventor systems was done by user names. The list provided by Iridescent contained 1491 unique user account names. Of those user names, 1355 matched accounts found in the App Inventor systems, using case-insensitive matching. If there were spelling or punctuation variations in the list from the actual account name, this process did not detect those accounts- this was the core limitation of the extraction system. All projects belonging to those users were extracted. This resulted in extraction of 9888 projects, with the understanding that only a fraction of those were the target Technovation projects. This method was chosen to allow for sophisticated project-name matching to be used in the data cleaning phase, which facilitated a higher match rate with the original project list. Cleaning used a more generous matching algorithm than extraction. Project names were “fuzzy matched” between the list provided by Iridescent and the project names found in the data set. The fuzziness allowed us to match names that had misspellings, varied in spacing or punctuation, or contained other small discrepancies. The fuzzy matching protocol looked at all projects from a given user, and tried to find the closest match to the name in the original list from Iridescent. If exactly one project was the

5
closest match, it was selected. If there were multiple projects that matched at the same degree, the entire project was discarded from the data set, as we could not be sure which was the “final” version. Only 60 projects were removed this way. If there were no close matches, the project was discarded from the data set, which removed 236 additional projects. At this point, we had identified all of the projects with valid extracted data. Of these extracted projects, 18 were corrupt, and were subsequently discarded. We corrected one duplicate project, and removed one corrupt project. This completed the data cleaning procedure. The number of projects on the initial list from Iridescent was 1525. We extracted 9888 projects from MIT App Inventor, matching 1355 distinct users. The total number of clean projects that were analyzed was 1066.
Data Processing Processing was conducted on the 1066 projects from the cleaning step, bringing those projects into the analysis system, and performing feature extractions, supplying the abstract form on which to execute analysis. Each project was assigned a persistent code name, in the form “Project0000,” so that projects from disparate analysis operations may always be aligned. Each project was abstracted into a data structure that allowed for interactive interrogation of its screens, components, blocks, and other properties. These structures were processed in aggregate to create the feature sets discussed below.
Analysis Descriptive Statistics Total number of projects analyzed: 1066
Blocks Count per Project
Min: 0 Max: 10,464 Mean: 451 Median: 250 Q1: 112 Q2 (median): 250 Q3: 544 Modes (6 occurrences each): 21, 49, 60, 72, 75, 138

6
Min Max Median Mean
0 10,464 250 451
Q1: 112 Q2: 250 Q3: 544 There were 3 projects that contained zero blocks. There were 110 projects with more than 1000 blocks. There were 29 projects that had 2,000 blocks or more. This, with consideration of the quartiles, indicates the distribution is strongly right-tailed, where the majority of projects 100-500 blocks, which is a reasonable number for App Inventor, and reflects the Q1-Q3 interquartile range of these data. A small minority of extremely high-block count projects pushed the average higher (<3% of projects with more than 2000 blocks, <10% of projects with more than 1000 blocks). The mode in this instance is a weak measure of central tendency, as there are 6 equal modes, with each only appearing 6 times. Five of those modes occur in the first quartile.
Screens Count per Project
Min: 1 Max: 109
7
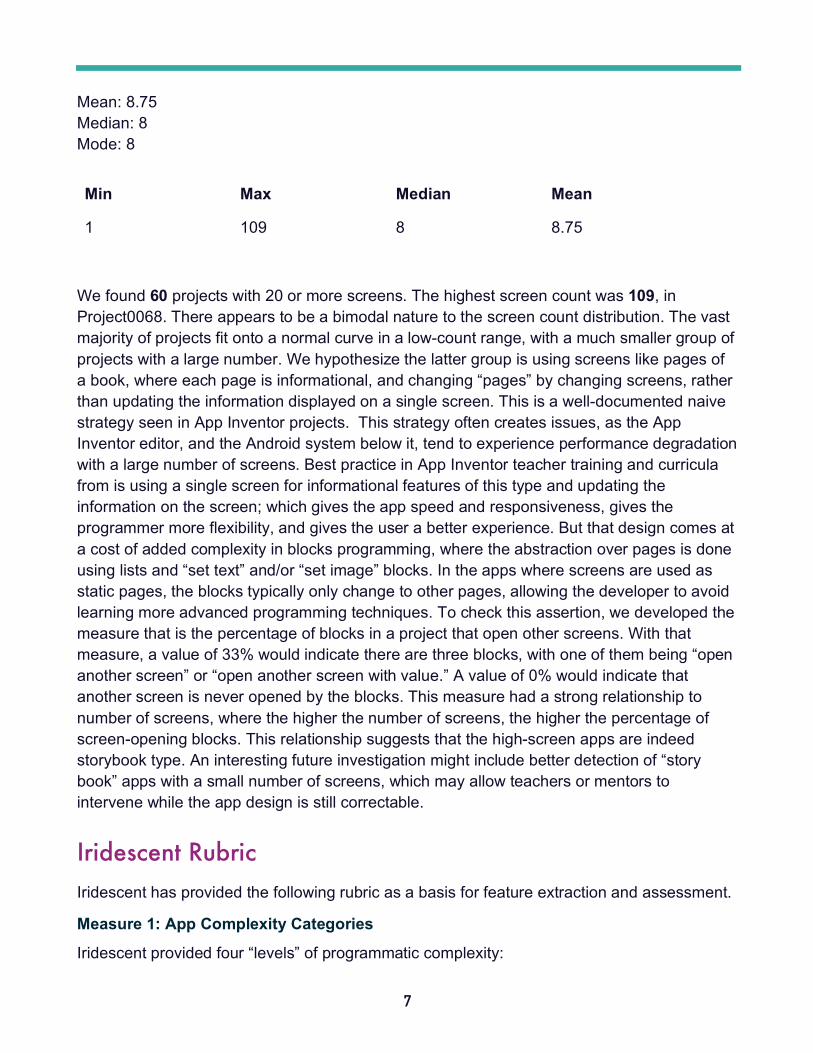
Mean: 8.75 Median: 8 Mode: 8
Min Max Median Mean
1 109 8 8.75 We found 60 projects with 20 or more screens. The highest screen count was 109, in Project0068. There appears to be a bimodal nature to the screen count distribution. The vast majority of projects fit onto a normal curve in a low-count range, with a much smaller group of projects with a large number. We hypothesize the latter group is using screens like pages of a book, where each page is informational, and changing “pages” by changing screens, rather than updating the information displayed on a single screen. This is a well-documented naive strategy seen in App Inventor projects. This strategy often creates issues, as the App Inventor editor, and the Android system below it, tend to experience performance degradation with a large number of screens. Best practice in App Inventor teacher training and curricula from is using a single screen for informational features of this type and updating the information on the screen; which gives the app speed and responsiveness, gives the programmer more flexibility, and gives the user a better experience. But that design comes at a cost of added complexity in blocks programming, where the abstraction over pages is done using lists and “set text” and/or “set image” blocks. In the apps where screens are used as static pages, the blocks typically only change to other pages, allowing the developer to avoid learning more advanced programming techniques. To check this assertion, we developed the measure that is the percentage of blocks in a project that open other screens. With that measure, a value of 33% would indicate there are three blocks, with one of them being “open another screen” or “open another screen with value.” A value of 0% would indicate that another screen is never opened by the blocks. This measure had a strong relationship to number of screens, where the higher the number of screens, the higher the percentage of screen-opening blocks. This relationship suggests that the high-screen apps are indeed storybook type. An interesting future investigation might include better detection of “story book” apps with a small number of screens, which may allow teachers or mentors to intervene while the app design is still correctable.
Iridescent Rubric Iridescent has provided the following rubric as a basis for feature extraction and assessment.
Measure 1: App Complexity Categories
Iridescent provided four “levels” of programmatic complexity:
8
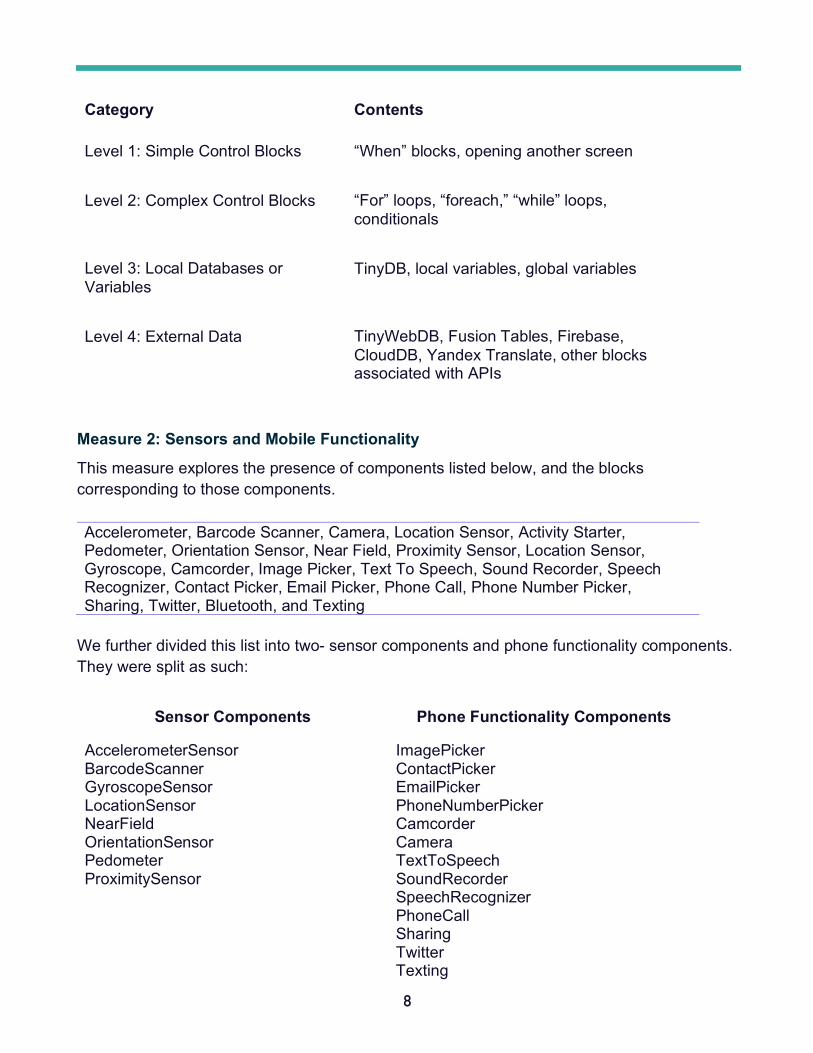
Category Contents
Level 1: Simple Control Blocks “When” blocks, opening another screen
Level 2: Complex Control Blocks “For” loops, “foreach,” “while” loops, conditionals
Level 3: Local Databases or Variables
TinyDB, local variables, global variables
Level 4: External Data TinyWebDB, Fusion Tables, Firebase, CloudDB, Yandex Translate, other blocks associated with APIs
Measure 2: Sensors and Mobile Functionality
This measure explores the presence of components listed below, and the blocks corresponding to those components. Accelerometer, Barcode Scanner, Camera, Location Sensor, Activity Starter, Pedometer, Orientation Sensor, Near Field, Proximity Sensor, Location Sensor, Gyroscope, Camcorder, Image Picker, Text To Speech, Sound Recorder, Speech Recognizer, Contact Picker, Email Picker, Phone Call, Phone Number Picker, Sharing, Twitter, Bluetooth, and Texting
We further divided this list into two- sensor components and phone functionality components. They were split as such:
Sensor Components Phone Functionality Components
AccelerometerSensor BarcodeScanner GyroscopeSensor LocationSensor NearField OrientationSensor Pedometer ProximitySensor
ImagePicker ContactPicker EmailPicker PhoneNumberPicker Camcorder Camera TextToSpeech SoundRecorder SpeechRecognizer PhoneCall Sharing Twitter Texting
9
BluetoothClient BluetoothServer ActivityStarter
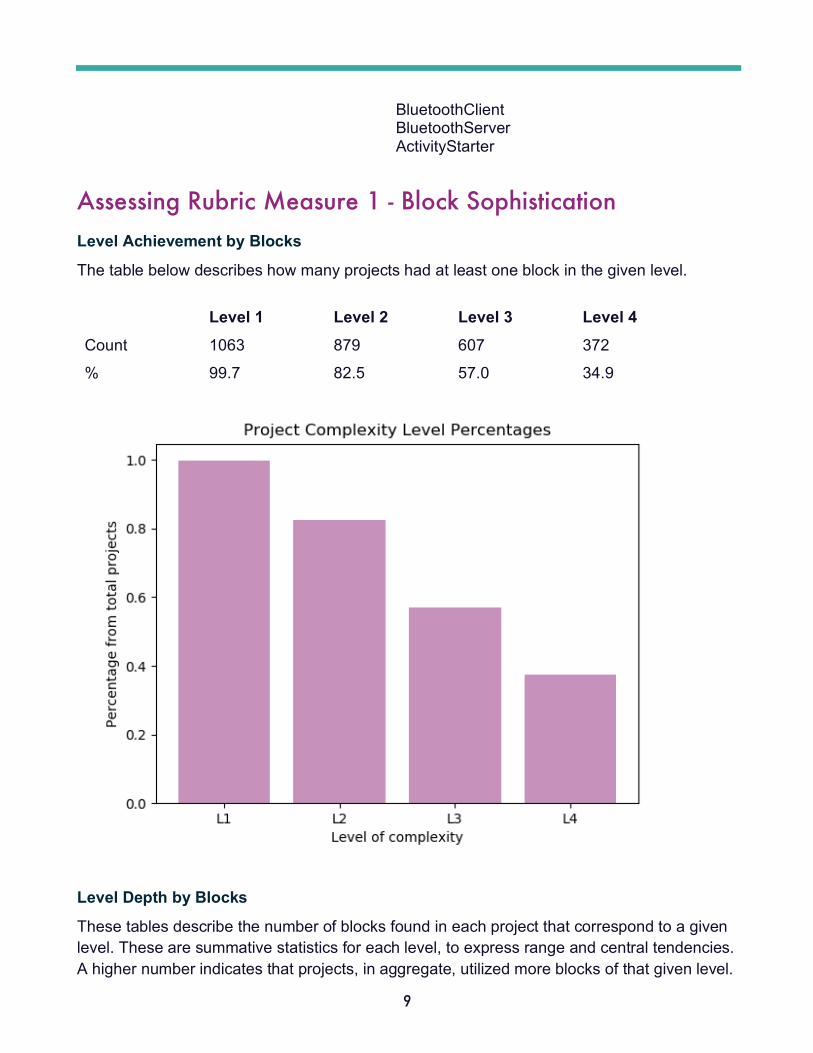
Assessing Rubric Measure 1 - Block Sophistication Level Achievement by Blocks
The table below describes how many projects had at least one block in the given level. Level 1 Level 2 Level 3 Level 4 Count 1063 879 607 372
% 99.7 82.5 57.0 34.9
Level Depth by Blocks
These tables describe the number of blocks found in each project that correspond to a given level. These are summative statistics for each level, to express range and central tendencies. A higher number indicates that projects, in aggregate, utilized more blocks of that given level.

10
Level 1: Simple Control Blocks
Min Max Median Mean
0 713 42 55.73
Level 2: Complex Control Blocks
Min Max Median Mean
0 567 6 15.45
Level 3: Local Databases or Variables
Min Max Median Mean
0 338 5 16.88
Level 4: External Data
Min Max Median Mean
0 463 0 5.82
Monotonicity of Levels
The levels provided in the Iridescent rubric were not always monotonic. Some projects demonstrated a certain level without passing through the previous level. Number of monotonic projects: 868 Number of non-monotonic projects: 198
Breakdown of Non-monotonic Projects
Skipped complexity levels L2 Complex Control Blocks
L3 Local DBs and Variables
Counts of skipped levels 52 155

11
Measure 2 - Sensors and Mobile Features Designated feature components are listed in the table below, in descending order of popularity within the data set. Interestingly, 316 projects used none of the below components. That group of projects is the second-largest in the below table.
Component Count % Component Count %
ActivityStarter 322 30.21% SpeechRecognizer 19 1.78%
LocationSensor 215 20.17% BarcodeScanner 19 1.78%
PhoneCall 168 15.76% Pedometer 17 1.58%
Camera 164 15.38 Camcorder 15 1.41%
ImagePicker 138 12.95% SoundRecorder 14 1.31%
Texting 133 12.48% OrientationSensor 13 1.22%
Sharing 101 9.47% Twitter 10 0.94%
TextToSpeech 91 8.54% BluetoothClient 9 0.84%
Accelerometer 48 4.50% NearField (NFC) 6 0.56%
PhoneNumberPicker 43 4.03% ProximitySensor 3 0.28%
EmailPicker 40 3.75% BluetoothServer 2 0.19%
ContactPicker 25 2.35% GyroscopeSensor 1 0.09%
None of the Above 316 29.64%
Interesting Observations Number of Screens per Project The number of screens in a project can indicate what that project may contain. In particular, a less advanced app design is a “story book,” where each page is implemented as a separate screen, and each screen does nothing beyond display static information and move on to the next screen. The “best practice” for this kind of informational app is to not have repeated screens, but rather to use a single screen where the format is static, and manipulate the text and/or images on that single screen to “turn the pages.” This is more computationally efficient for the device and allows easier modification and extension of the app, but a higher degree of

12
abstraction is necessary. The content must be abstracted from the page itself, and this makes for more complicated code. The multiple-page story book app is tractable when the number of pages is small, which often deceives the programmer into thinking that there is no cost per screen. Many Android and App Inventor apps will not successfully build if they have an excessive number of screens. The exact number varies, but MIT has added a warning to App Inventor when the user creates their tenth screen, as projects at that size and beyond become less likely to work. In this data set, the screen count distribution was aggressively right-tailed. The interesting observation here is that the central tendency is around eight screens. Few projects were single-screen, and even fewer were two-screened, as seen in the histogram below. Most Technovation projects used three screens or more. The troubling observation is the long right-tail, which is truncated in the below histogram into a 20+ bin. There is a sharp fall-off beginning after 10 screens, but there are a similar number of projects containing 10 or more screens than there are two or fewer.
Unused Screens All projects have a number of screens, and a total number of blocks. But looking at these numbers alone may create a misleading image of the nature of the project. If a project has extra screens that are unused or underused, the average number of blocks per screen overall

13
will drop, and that may create a misinterpretation that the project has a number of low-complexity screens, while it is possible that it has one complex screen and multiple unused screens. To assess this, we studied the median value of blocks/screen. We hypothesized that a project that has multiple screens, non-trivial block count, but a low median value (or a median of 0) is likely to have extra screens that are not being used. If it has extra/unused screens, the average blocks per screen value will be driven lower than is accurate for the screens being used. This is difficult to interpret with average of blocks/screen alone. To test this hypothesis, we analyzed all the projects with a median blocks/screen value of 0, and they all had some number of screens with zero blocks. This data can be found in T6. As an example, Project 260 had 7 screens, 21 blocks total, which gave it an average blocks/screen of 3. But the median value of blocks/screen was 0, and indicated that there were unused screens. We inspected this project manually, and found four of the seven screens had zero blocks. If we only count the screens that had blocks, the average blocks/screen was 7, which indicates a more complex project. But in reality, one screen had over half of the blocks- we found one complex screen, two low-complexity screens, and three empty screens. Based on inspection of this data set, this pattern is a reasonable interpretation whenever the blocks/screen median value is zero. The table below summarizes the block counts for each of the screens of Project 260. Additionally, the screens’ names used the auto-generated numbering scheme, but with many numbers missing. This may indicate that the student created many screens, deleted some, and didn’t delete others. We cannot hypothesize why this may have happened without further data.
Screen Number of blocks Screen Number of blocks
Screen1 3 Screen10 0
Screen2 12 Screen11 0
Screen6 6 Screen14 0
Screen9 0
Relationship of External Data Sources to Block Count A question was posed, do projects that involve external work or external data sources use fewer blocks than other projects? Iridescent hypothesized they would use fewer blocks, and we hypothesized they would not use fewer blocks. We first reworded the question to “do projects that represent Rubric Level 4 use more blocks than projects that do not represent

14
Level 4?”, as Rubric Level 4 indicates use of external sources and/or utilization of external work. To investigate, we isolated all the projects that had blocks pertaining to Level 4 (n=400), and all the projects that had no blocks from Level 4 (n’=666). We counted the blocks per project for all projects in those sets, and found the averages and medians of those values, shown in the table below.
Average Blocks/Project Median Blocks/Project
Level 4 570 346
Not Level 4 380 180 We found that Level 4 projects had a higher average number of blocks and a higher median number of blocks, indicating that the entire curve was higher. We used a T-test to validate the statistical significance of the difference between these populations, and found the difference was statistically significant, though the t-value was low, indicating that the groups were somewhat similar (t=4.436, p<.001). This leads us to reject the hypothesis that an app leveraging external work would use fewer blocks, as there is strong evidence that the Level 4 apps used significantly more blocks than those of the non-Level 4 projects. However, there is a threat to validity here, in that “Not Level 4” may include a large number of trivial or incomplete projects, which do not make a fair comparison against the likely-to-be-sophisticated apps that inhabit Level 4. This threat to validity would also help explain the suspiciously small p-value from the T-test.
Conclusion These analyses shed light on some unseen patterns in Technovation projects, which can inform curricular design. There is a high likelihood that many projects were “storybook” apps, that rely on number of screens and avoid more elegant, sophisticated programming techniques. The second-largest phone or sensor feature utilized was no features at all, which indicates there is room for curricular growth to encourage students to better utilize the App Inventor platform. Additionally, we found patterns that may inform future tools to detect known bad practices and request mentor intervention, such as a high ratio of “open another screen” blocks relative to overall blocks. Many other subtle insights may seed future work, both in academic research at MIT and other institutions, and in direct pedagogical feedback for Iridescent.

15
Data Tables T0-Identity-Table
This file contains identifiable information linking the code names of the data set to real-world identities. This file contains identifiable information and must be protected. It contains the email address, the project name as given by the team (tagged “project”), the project name as matched to the database (tagged “valid project”), the code name given to the project, and the App Inventor internal project ID number. This file is the real-world identity key to the other files.
T1-Rubric-Level-Depth-BlocksOnly
This file counts how many blocks of a given complexity level were found in each project. Each project is a separate row, and each column depicts the complexity level from the rubric, with one addition- Level 3, which is broken out as separate categories. L3-tdb counts TinyDB, L3-var counts local and global variables, and L3 combines them both.
T2-Rubric-Level-Achievement-ComponentsOnly
This file indicates which projects have at least one component of the given complexity level. This count does not include blocks. In short, “True” indicates that a project did achieve the given level, at least trivially, by having a component present. However, a component’s presence may not be enough to claim that it is utilized. For utilization, see T3, below.
T3-Rubric-Level-Achievement-BlocksAndComponents
This file is similar to T2, above, but looks at the use of both components and blocks. A value of “True” indicates that components of the given level were found, as well as blocks that exercise those components. This is subtly different than the above table, and provides a stronger indication of whether the user has mastery of the level.
T4-FeatureCounts
This file counts the presence of feature categories for each project. There are two groups of features- Sensors and Phone Functionality, as described above. This file counts the components and blocks found for each, for each project. The columns are Sensor Components, Sensor Blocks, Phone Function Components, Phone Function Blocks.
T5-All-Feature-Grid
This file contains a grid of identified phone functionality and sensor features, indicating whether a particular project uses those elements.
T6-Screen-Block-Stats
This file counts the total number of screens and blocks for each project. It also provides the mean of blocks per screen, and the median of blocks per screen. Both of these statistics are included to provide insight into how many screens are being used. A project that has multiple

16
screens, non-trivial block count, and a low median value (or a median of 0) likely has extra/unused screens. If it does, the average blocks per screen value is driven lower than is strictly accurate for the screens being used.
T6-Level1, T6-Level2, T6-Level3, T6-Level4
These files contain the same information as T6-Screen-Block-Stats, but broken up by rubric level blocks. File T6-Leveln contains all of the projects that had at least one block for rubric level n. A project may appear in multiple of these files, if it represented multiple levels.
Contributors Mark Sherman, Ph.D., author and analyst Obada M. Alkhatib, analysis programming and reporting Jeff Schiller, data extraction and preparation Drew H. Nichols, copy editing Josh Sheldon, program oversight, co-director MIT App Inventor Mike Tissenbaum, Ph.D., research direction Prof. Hal Abelson, director, MIT App Inventor