RESEARCH Open Access Fibroblast growth factor-2 (FGF2) and ...
17
RESEARCH Open Access Fibroblast growth factor-2 (FGF2) and syndecan-1 (SDC1) are potential biomarkers for putative circulating CD15+/CD30+ cells in poor outcome Hodgkin lymphoma patients Rajendra Gharbaran 1 , Andre Goy 1 , Takemi Tanaka 2 , Jongwhan Park 1 , Chris Kim 1 , Nafis Hasan 2 , Swathi Vemulapalli 1 , Sreeja Sarojini 1 , Madalina Tuluc 2 , Kip Nalley 3 , Pritish Bhattacharyya 1 , Andrew Pecora 1 and K Stephen Suh 1* Abstract Background: High risk, unfavorable classical Hodgkin lymphoma (cHL) includes those patients with primary refractory or early relapse, and progressive disease. To improve the availability of biomarkers for this group of patients, we investigated both tumor biopsies and peripheral blood leukocytes (PBL) of untreated (chemo-naïve, CN) Nodular Sclerosis Classic Hodgkin Lymphoma (NS-cHL) patients for consistent biomarkers that can predict the outcome prior to frontline treatment. Methods and materials: Bioinformatics data mining was used to generate 151 candidate biomarkers, which were screened against a library of 10 HL cell lines. Expression of FGF2 and SDC1 by CD30+ cells from HL patient samples representing good and poor outcomes were analyzed by qRT-PCR, immunohistochemical (IHC), and immunofluorescence analyses. Results: To identify predictive HL-specific biomarkers, potential marker genes selected using bioinformatics approaches were screened against HL cell lines and HL patient samples. Fibroblast Growth Factor-2 (FGF2) and Syndecan-1 (SDC1) were overexpressed in all HL cell lines, and the overexpression was HL-specific when compared to 116 non-Hodgkin lymphoma tissues. In the analysis of stratified NS-cHL patient samples, expression of FGF2 and SDC1 were 245 fold and 91 fold higher, respectively, in the poor outcome (PO) group than in the good outcome (GO) group. The PO group exhibited higher expression of the HL marker CD30, the macrophage marker CD68, and metastatic markers TGFβ1 and MMP9 compared to the GO group. This expression signature was confirmed by qualitative immunohistochemical and immunofluorescent data. A Kaplan-Meier analysis indicated that samples in which the CD30+ cells carried an FGF2+/SDC1+ immunophenotype showed shortened survival. Analysis of chemo-naive HL blood samples suggested that in the PO group a subset of CD30+ HL cells had entered the circulation. These cells significantly overexpressed FGF2 and SDC1 compared to the GO group. The PO group showed significant down-regulation of markers for monocytes, T-cells, and B-cells. These expression signatures were eliminated in heavily pretreated patients. Conclusion: The results suggest that small subsets of circulating CD30+/CD15+ cells expressing FGF2 and SDC1 represent biomarkers that identify NS-cHL patients who will experience a poor outcome (primary refractory and early relapsing). Keywords: Hodgkin lymphoma, Predictive biomarkers, Relapse, Refractory, Circulating tumor cells, Clinical outcome * Correspondence: [email protected] 1 John Theurer Cancer Center, Hackensack University Medical Center, D. Jurist Research Building, 40 Prospect Avenue, Hackensack, NJ 07601, USA Full list of author information is available at the end of the article JOURNAL OF HEMATOLOGY & ONCOLOGY © 2013 Gharbaran et al.; licensee BioMed Central Ltd. This is an Open Access article distributed under the terms of the Creative Commons Attribution License (http://creativecommons.org/licenses/by/2.0), which permits unrestricted use, distribution, and reproduction in any medium, provided the original work is properly cited. Gharbaran et al. Journal of Hematology & Oncology 2013, 6:62 http://www.jhoonline.org/content/6/1/62
Transcript of RESEARCH Open Access Fibroblast growth factor-2 (FGF2) and ...
JOURNAL OF HEMATOLOGY& ONCOLOGY
Gharbaran et al. Journal of Hematology & Oncology 2013, 6:62http://www.jhoonline.org/content/6/1/62
RESEARCH Open Access
Fibroblast growth factor-2 (FGF2) and syndecan-1(SDC1) are potential biomarkers for putativecirculating CD15+/CD30+ cells in poor outcomeHodgkin lymphoma patientsRajendra Gharbaran1, Andre Goy1, Takemi Tanaka2, Jongwhan Park1, Chris Kim1, Nafis Hasan2, Swathi Vemulapalli1,Sreeja Sarojini1, Madalina Tuluc2, Kip Nalley3, Pritish Bhattacharyya1, Andrew Pecora1 and K Stephen Suh1*
Abstract
Background: High risk, unfavorable classical Hodgkin lymphoma (cHL) includes those patients with primaryrefractory or early relapse, and progressive disease. To improve the availability of biomarkers for this group ofpatients, we investigated both tumor biopsies and peripheral blood leukocytes (PBL) of untreated (chemo-naïve,CN) Nodular Sclerosis Classic Hodgkin Lymphoma (NS-cHL) patients for consistent biomarkers that can predict theoutcome prior to frontline treatment.
Methods and materials: Bioinformatics data mining was used to generate 151 candidate biomarkers, which werescreened against a library of 10 HL cell lines. Expression of FGF2 and SDC1 by CD30+ cells from HL patient samplesrepresenting good and poor outcomes were analyzed by qRT-PCR, immunohistochemical (IHC), andimmunofluorescence analyses.
Results: To identify predictive HL-specific biomarkers, potential marker genes selected using bioinformaticsapproaches were screened against HL cell lines and HL patient samples. Fibroblast Growth Factor-2 (FGF2) andSyndecan-1 (SDC1) were overexpressed in all HL cell lines, and the overexpression was HL-specific when comparedto 116 non-Hodgkin lymphoma tissues. In the analysis of stratified NS-cHL patient samples, expression of FGF2 andSDC1 were 245 fold and 91 fold higher, respectively, in the poor outcome (PO) group than in the good outcome(GO) group. The PO group exhibited higher expression of the HL marker CD30, the macrophage marker CD68, andmetastatic markers TGFβ1 and MMP9 compared to the GO group. This expression signature was confirmed byqualitative immunohistochemical and immunofluorescent data. A Kaplan-Meier analysis indicated that samples inwhich the CD30+ cells carried an FGF2+/SDC1+ immunophenotype showed shortened survival. Analysis ofchemo-naive HL blood samples suggested that in the PO group a subset of CD30+ HL cells had entered thecirculation. These cells significantly overexpressed FGF2 and SDC1 compared to the GO group. The PO groupshowed significant down-regulation of markers for monocytes, T-cells, and B-cells. These expression signatures wereeliminated in heavily pretreated patients.
Conclusion: The results suggest that small subsets of circulating CD30+/CD15+ cells expressing FGF2 and SDC1represent biomarkers that identify NS-cHL patients who will experience a poor outcome (primary refractory andearly relapsing).
Keywords: Hodgkin lymphoma, Predictive biomarkers, Relapse, Refractory, Circulating tumor cells, Clinical outcome
* Correspondence: [email protected] Theurer Cancer Center, Hackensack University Medical Center, D. JuristResearch Building, 40 Prospect Avenue, Hackensack, NJ 07601, USAFull list of author information is available at the end of the article
© 2013 Gharbaran et al.; licensee BioMed CenCreative Commons Attribution License (http:/distribution, and reproduction in any medium
tral Ltd. This is an Open Access article distributed under the terms of the/creativecommons.org/licenses/by/2.0), which permits unrestricted use,, provided the original work is properly cited.
Gharbaran et al. Journal of Hematology & Oncology 2013, 6:62 Page 2 of 17http://www.jhoonline.org/content/6/1/62
BackgroundUp to 20% of Hodgkin lymphoma (HL) patients areeither refractory to treatment (primary refractory) or ex-perience relapse within four years (early relapse) ofachieving complete remission (CR), and includes pa-tients who experience progressive disease and patientswith a particularly poor prognosis for other reasons [1].Only half of HL patients survive for two years iffront line therapy fails, and autologous hematopoieticstem-cell transplant (ASCT) is only 50% curative [2].Although the International Prognostic Score was intro-duced to improve the risk stratification of patients [3],its applicability is limited for predicting high risk cHLpatients, regardless of clinical stage. While patients inthis group may benefit from analysis of the tumor-associated macrophage marker CD68, which can beused to predict adverse outcomes of cHL [4], the pre-diction is controversial [5]. The antibody conjugate drugbrentuximab vedotin targets CD30. In clinical trials,brentuximab vedotin therapy improved clinical outcomesfor relapsing and refractory classical HL (RR-cHL) patientsby producing survival times that were 6 months longerthan for patients on the conventional treatment arm [6].This increased survival could perhaps be due to in-creased chemoresistance that can result from heavy pre-treatment. Therefore, the availability of biomarkers thatidentify patients who will have a poor outcome to con-ventional frontline therapy will permit more aggressivetreatment of these patients, improving their prognosis.Classical HL is a monoclonal lymphoid neoplasm that
in almost all instances appears to be derived from(post-) germinal center B cells [7-9]. The immunohisto-chemical (IHC) hallmark of HL tumor cells is CD30antigen expression [10]. The morphological phenotypeof cHL comprises an unusually small number (<2%) ofmononuclear Hodgkin (H) cells and multinucleatedReed-Sternberg (RS) cells residing in an extensiveinflammatory background, which is mostly composed ofT cells, histocytes, eosinophils, plasma cells, and macro-phages [10]. This inflammatory background in the tumormicroenvironment is maintained by Hodgkin’s andReed-Sternberg cell (HRS)-derived chemokines and cyto-kines that recruit the tumor microenvironment cellularcomponents [11-14]. The composition of the tumormicroenvironment or the molecular phenotype of theHRS cells, or both, is thought to determine the relativeaggressiveness of cHL at an individual level [10].At presentation, about 10–15% of cHL cases have
extranodal involvement [15], which is a negative prognos-tic factor even for patients with limited stage disease [16].Extranodal involvement, whether primary or secondary,indicates lymphatic and hematogenous spread of thedisease [15]. Therefore, neoplastic HRS cells could rea-sonably be assumed to occur in peripheral blood, albeit at
levels not detectable by present diagnostic techniques,thus resulting in circulating tumor cell (CTC) involvementin HL. CTCs are frequently associated with poor clinicaloutcomes for solid [17] and liquid tumors [18]. Despitethe limited number of cases (about a dozen over the past100 years) of CTCs in the peripheral blood of HL patients,most were associated with either primary refractory or re-lapsing disease. In addition, well-established cell lines thathave contributed tremendously to the understanding ofHL were derived from primary HL tumor cells isolatedfrom extranodal sites: peripheral blood [19], bone marrow[20], or pleural fluid [21] of refractory or relapsingpatients. These findings suggest that primary HL tumorcells can escape the physical barrier of the tumor micro-environment into the circulation to access extra-nodaldestinations. The limited evidence indicating the presenceof HRS cells among peripheral blood leukocytes (PBL)may be a consequence of their low proliferative index, theterminally differentiated status of the RS cells and theirlack of mobility, or the propensity of these malignant cellsto form a solid tumor mass [22]. These characteristicshave hampered investigations aimed at identifying HRS-derived biomarkers in peripheral blood for high risk, pooroutcome, primary refractory, and early relapsing cHLpatients.
ResultsCharacteristics of clinical samplesThe characteristics for clinical samples for PBL are listedin Table 1. Retrospective clinical samples of PBL collectedfrom 25 NS-cHL patients (average age: 34.48 years, range:20–79, 13 females and 12 males) were categorized intothree groups mainly on the basis of their response tofrontline therapy: 1) good outcome pre-therapy: chemo-naïve relapse free/progression-free survival > 4 years (GO,n=12); 2) poor outcome pre-therapy: chemo-naïve pri-mary refractory or early relapsing (PO(CN), n=6; 3) pooroutcome post-therapy: chemo-exposed, multiple relapsewithin 4 years (PO(CE), n=7). Among the pre-therapy,chemo-naïve patients (n=18), 68% were diagnosed duringearly disease stages (I and II), 10% (n=2) at stage III, and15% (n=3) at stage IV. Of the early stage diagnoses (I andII, n=13), more than 30% (n=4) were either primaryrefractory or developed early relapses shortly after front-line therapy. The remaining PO(CN) samples were fromadvanced stages (III & IV). Also, 56% (n=14) of thepatients were younger than the average age (34.48 years)at diagnosis.
Bioinformatics and data mining for potential biomarkersTo enhance the specificity of potential poor outcomebiomarkers, a bioinformatics based approach was used.Potential biomarkers for HL were selected from theCancer Gene Index and screened using a library of HL
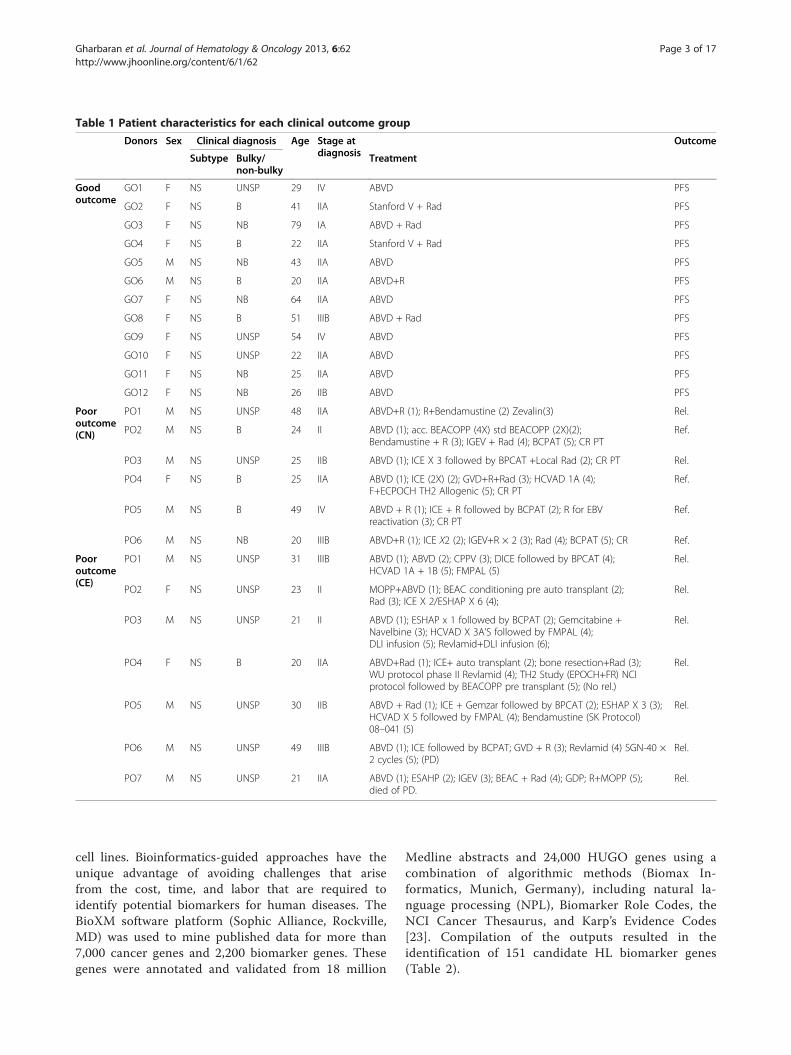
Table 1 Patient characteristics for each clinical outcome group
Donors Sex Clinical diagnosis Age Stage atdiagnosis
Outcome
Subtype Bulky/non-bulky
Treatment
Goodoutcome
GO1 F NS UNSP 29 IV ABVD PFS
GO2 F NS B 41 IIA Stanford V + Rad PFS
GO3 F NS NB 79 IA ABVD + Rad PFS
GO4 F NS B 22 IIA Stanford V + Rad PFS
GO5 M NS NB 43 IIA ABVD PFS
GO6 M NS B 20 IIA ABVD+R PFS
GO7 F NS NB 64 IIA ABVD PFS
GO8 F NS B 51 IIIB ABVD + Rad PFS
GO9 F NS UNSP 54 IV ABVD PFS
GO10 F NS UNSP 22 IIA ABVD PFS
GO11 F NS NB 25 IIA ABVD PFS
GO12 F NS NB 26 IIB ABVD PFS
Pooroutcome(CN)
PO1 M NS UNSP 48 IIA ABVD+R (1); R+Bendamustine (2) Zevalin(3) Rel.
PO2 M NS B 24 II ABVD (1); acc. BEACOPP (4X) std BEACOPP (2X)(2);Bendamustine + R (3); IGEV + Rad (4); BCPAT (5); CR PT
Ref.
PO3 M NS UNSP 25 IIB ABVD (1); ICE X 3 followed by BPCAT +Local Rad (2); CR PT Rel.
PO4 F NS B 25 IIA ABVD (1); ICE (2X) (2); GVD+R+Rad (3); HCVAD 1A (4);F+ECPOCH TH2 Allogenic (5); CR PT
Ref.
PO5 M NS B 49 IV ABVD + R (1); ICE + R followed by BCPAT (2); R for EBVreactivation (3); CR PT
Ref.
PO6 M NS NB 20 IIIB ABVD+R (1); ICE X2 (2); IGEV+R × 2 (3); Rad (4); BCPAT (5); CR Ref.
Pooroutcome(CE)
PO1 M NS UNSP 31 IIIB ABVD (1); ABVD (2); CPPV (3); DICE followed by BPCAT (4);HCVAD 1A + 1B (5); FMPAL (5)
Rel.
PO2 F NS UNSP 23 II MOPP+ABVD (1); BEAC conditioning pre auto transplant (2);Rad (3); ICE X 2/ESHAP X 6 (4);
Rel.
PO3 M NS UNSP 21 II ABVD (1); ESHAP x 1 followed by BCPAT (2); Gemcitabine +Navelbine (3); HCVAD X 3A’S followed by FMPAL (4);DLI infusion (5); Revlamid+DLI infusion (6);
Rel.
PO4 F NS B 20 IIA ABVD+Rad (1); ICE+ auto transplant (2); bone resection+Rad (3);WU protocol phase II Revlamid (4); TH2 Study (EPOCH+FR) NCIprotocol followed by BEACOPP pre transplant (5); (No rel.)
Rel.
PO5 M NS UNSP 30 IIB ABVD + Rad (1); ICE + Gemzar followed by BPCAT (2); ESHAP X 3 (3);HCVAD X 5 followed by FMPAL (4); Bendamustine (SK Protocol)08–041 (5)
Rel.
PO6 M NS UNSP 49 IIIB ABVD (1); ICE followed by BCPAT; GVD + R (3); Revlamid (4) SGN-40 ×2 cycles (5); (PD)
Rel.
PO7 M NS UNSP 21 IIA ABVD (1); ESAHP (2); IGEV (3); BEAC + Rad (4); GDP; R+MOPP (5);died of PD.
Rel.
Gharbaran et al. Journal of Hematology & Oncology 2013, 6:62 Page 3 of 17http://www.jhoonline.org/content/6/1/62
cell lines. Bioinformatics-guided approaches have theunique advantage of avoiding challenges that arisefrom the cost, time, and labor that are required toidentify potential biomarkers for human diseases. TheBioXM software platform (Sophic Alliance, Rockville,MD) was used to mine published data for more than7,000 cancer genes and 2,200 biomarker genes. Thesegenes were annotated and validated from 18 million
Medline abstracts and 24,000 HUGO genes using acombination of algorithmic methods (Biomax In-formatics, Munich, Germany), including natural la-nguage processing (NPL), Biomarker Role Codes, theNCI Cancer Thesaurus, and Karp’s Evidence Codes[23]. Compilation of the outputs resulted in theidentification of 151 candidate HL biomarker genes(Table 2).
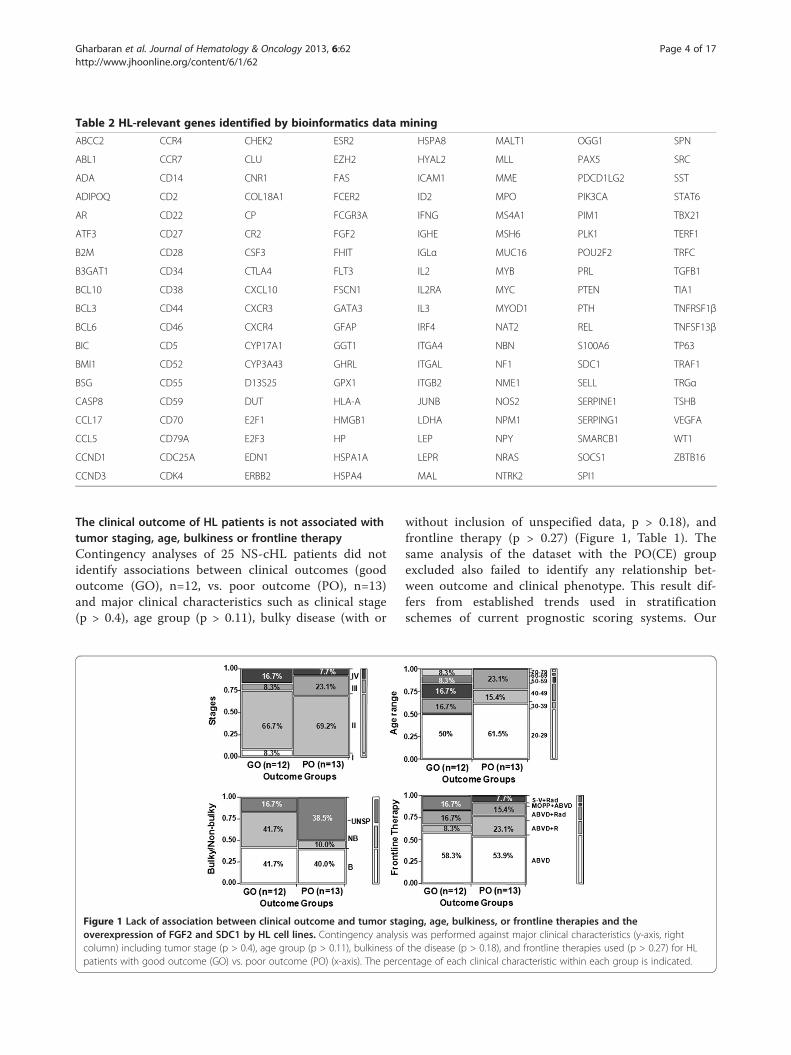
Table 2 HL-relevant genes identified by bioinformatics data mining
ABCC2 CCR4 CHEK2 ESR2 HSPA8 MALT1 OGG1 SPN
ABL1 CCR7 CLU EZH2 HYAL2 MLL PAX5 SRC
ADA CD14 CNR1 FAS ICAM1 MME PDCD1LG2 SST
ADIPOQ CD2 COL18A1 FCER2 ID2 MPO PIK3CA STAT6
AR CD22 CP FCGR3A IFNG MS4A1 PIM1 TBX21
ATF3 CD27 CR2 FGF2 IGHE MSH6 PLK1 TERF1
B2M CD28 CSF3 FHIT IGLα MUC16 POU2F2 TRFC
B3GAT1 CD34 CTLA4 FLT3 IL2 MYB PRL TGFB1
BCL10 CD38 CXCL10 FSCN1 IL2RA MYC PTEN TIA1
BCL3 CD44 CXCR3 GATA3 IL3 MYOD1 PTH TNFRSF1β
BCL6 CD46 CXCR4 GFAP IRF4 NAT2 REL TNFSF13β
BIC CD5 CYP17A1 GGT1 ITGA4 NBN S100A6 TP63
BMI1 CD52 CYP3A43 GHRL ITGAL NF1 SDC1 TRAF1
BSG CD55 D13S25 GPX1 ITGB2 NME1 SELL TRGα
CASP8 CD59 DUT HLA-A JUNB NOS2 SERPINE1 TSHB
CCL17 CD70 E2F1 HMGB1 LDHA NPM1 SERPING1 VEGFA
CCL5 CD79A E2F3 HP LEP NPY SMARCB1 WT1
CCND1 CDC25A EDN1 HSPA1A LEPR NRAS SOCS1 ZBTB16
CCND3 CDK4 ERBB2 HSPA4 MAL NTRK2 SPI1
Gharbaran et al. Journal of Hematology & Oncology 2013, 6:62 Page 4 of 17http://www.jhoonline.org/content/6/1/62
The clinical outcome of HL patients is not associated withtumor staging, age, bulkiness or frontline therapyContingency analyses of 25 NS-cHL patients did notidentify associations between clinical outcomes (goodoutcome (GO), n=12, vs. poor outcome (PO), n=13)and major clinical characteristics such as clinical stage(p > 0.4), age group (p > 0.11), bulky disease (with or
Figure 1 Lack of association between clinical outcome and tumor staoverexpression of FGF2 and SDC1 by HL cell lines. Contingency analyscolumn) including tumor stage (p > 0.4), age group (p > 0.11), bulkiness ofpatients with good outcome (GO) vs. poor outcome (PO) (x-axis). The perc
without inclusion of unspecified data, p > 0.18), andfrontline therapy (p > 0.27) (Figure 1, Table 1). Thesame analysis of the dataset with the PO(CE) groupexcluded also failed to identify any relationship bet-ween outcome and clinical phenotype. This result dif-fers from established trends used in stratificationschemes of current prognostic scoring systems. Our
ging, age, bulkiness, or frontline therapies and theis was performed against major clinical characteristics (y-axis, rightthe disease (p > 0.18), and frontline therapies used (p > 0.27) for HLentage of each clinical characteristic within each group is indicated.
Gharbaran et al. Journal of Hematology & Oncology 2013, 6:62 Page 5 of 17http://www.jhoonline.org/content/6/1/62
results suggest that alteration of specific molecularsignaling may contribute to clinical outcome.
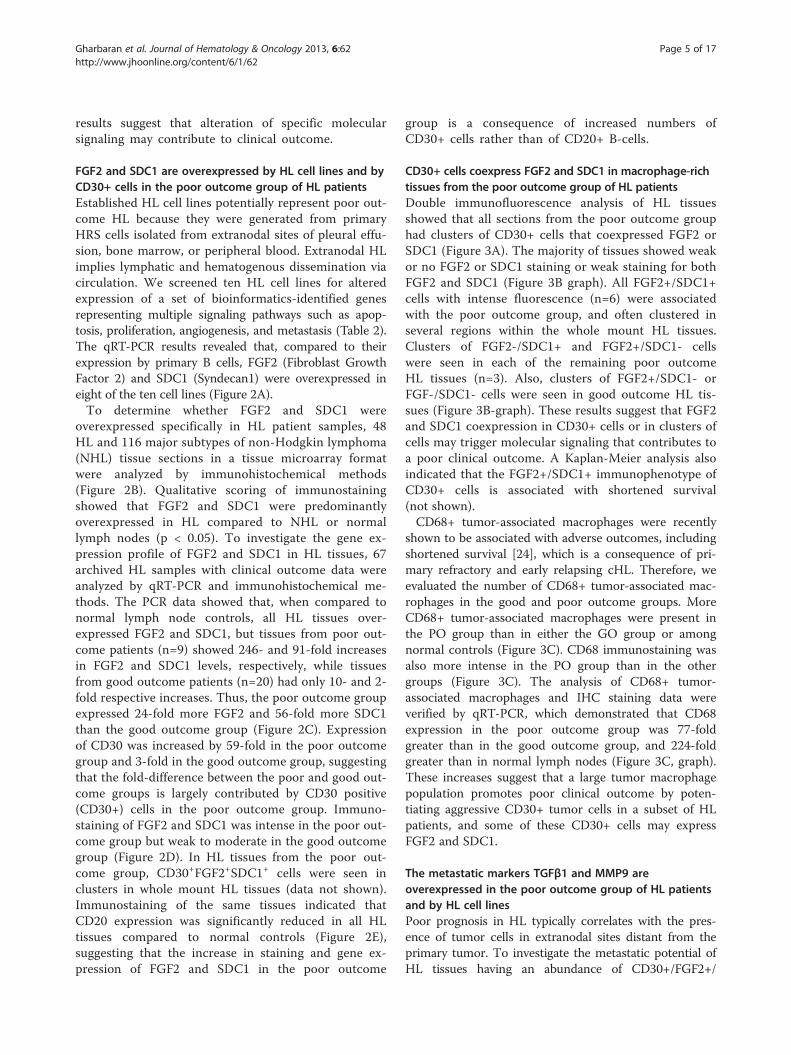
FGF2 and SDC1 are overexpressed by HL cell lines and byCD30+ cells in the poor outcome group of HL patientsEstablished HL cell lines potentially represent poor out-come HL because they were generated from primaryHRS cells isolated from extranodal sites of pleural effu-sion, bone marrow, or peripheral blood. Extranodal HLimplies lymphatic and hematogenous dissemination viacirculation. We screened ten HL cell lines for alteredexpression of a set of bioinformatics-identified genesrepresenting multiple signaling pathways such as apop-tosis, proliferation, angiogenesis, and metastasis (Table 2).The qRT-PCR results revealed that, compared to theirexpression by primary B cells, FGF2 (Fibroblast GrowthFactor 2) and SDC1 (Syndecan1) were overexpressed ineight of the ten cell lines (Figure 2A).To determine whether FGF2 and SDC1 were
overexpressed specifically in HL patient samples, 48HL and 116 major subtypes of non-Hodgkin lymphoma(NHL) tissue sections in a tissue microarray formatwere analyzed by immunohistochemical methods(Figure 2B). Qualitative scoring of immunostainingshowed that FGF2 and SDC1 were predominantlyoverexpressed in HL compared to NHL or normallymph nodes (p < 0.05). To investigate the gene ex-pression profile of FGF2 and SDC1 in HL tissues, 67archived HL samples with clinical outcome data wereanalyzed by qRT-PCR and immunohistochemical me-thods. The PCR data showed that, when compared tonormal lymph node controls, all HL tissues over-expressed FGF2 and SDC1, but tissues from poor out-come patients (n=9) showed 246- and 91-fold increasesin FGF2 and SDC1 levels, respectively, while tissuesfrom good outcome patients (n=20) had only 10- and 2-fold respective increases. Thus, the poor outcome groupexpressed 24-fold more FGF2 and 56-fold more SDC1than the good outcome group (Figure 2C). Expressionof CD30 was increased by 59-fold in the poor outcomegroup and 3-fold in the good outcome group, suggestingthat the fold-difference between the poor and good out-come groups is largely contributed by CD30 positive(CD30+) cells in the poor outcome group. Immuno-staining of FGF2 and SDC1 was intense in the poor out-come group but weak to moderate in the good outcomegroup (Figure 2D). In HL tissues from the poor out-come group, CD30+FGF2+SDC1+ cells were seen inclusters in whole mount HL tissues (data not shown).Immunostaining of the same tissues indicated thatCD20 expression was significantly reduced in all HLtissues compared to normal controls (Figure 2E),suggesting that the increase in staining and gene ex-pression of FGF2 and SDC1 in the poor outcome
group is a consequence of increased numbers ofCD30+ cells rather than of CD20+ B-cells.
CD30+ cells coexpress FGF2 and SDC1 in macrophage-richtissues from the poor outcome group of HL patientsDouble immunofluorescence analysis of HL tissuesshowed that all sections from the poor outcome grouphad clusters of CD30+ cells that coexpressed FGF2 orSDC1 (Figure 3A). The majority of tissues showed weakor no FGF2 or SDC1 staining or weak staining for bothFGF2 and SDC1 (Figure 3B graph). All FGF2+/SDC1+cells with intense fluorescence (n=6) were associatedwith the poor outcome group, and often clustered inseveral regions within the whole mount HL tissues.Clusters of FGF2-/SDC1+ and FGF2+/SDC1- cellswere seen in each of the remaining poor outcomeHL tissues (n=3). Also, clusters of FGF2+/SDC1- orFGF-/SDC1- cells were seen in good outcome HL tis-sues (Figure 3B-graph). These results suggest that FGF2and SDC1 coexpression in CD30+ cells or in clusters ofcells may trigger molecular signaling that contributes toa poor clinical outcome. A Kaplan-Meier analysis alsoindicated that the FGF2+/SDC1+ immunophenotype ofCD30+ cells is associated with shortened survival(not shown).CD68+ tumor-associated macrophages were recently
shown to be associated with adverse outcomes, includingshortened survival [24], which is a consequence of pri-mary refractory and early relapsing cHL. Therefore, weevaluated the number of CD68+ tumor-associated mac-rophages in the good and poor outcome groups. MoreCD68+ tumor-associated macrophages were present inthe PO group than in either the GO group or amongnormal controls (Figure 3C). CD68 immunostaining wasalso more intense in the PO group than in the othergroups (Figure 3C). The analysis of CD68+ tumor-associated macrophages and IHC staining data wereverified by qRT-PCR, which demonstrated that CD68expression in the poor outcome group was 77-foldgreater than in the good outcome group, and 224-foldgreater than in normal lymph nodes (Figure 3C, graph).These increases suggest that a large tumor macrophagepopulation promotes poor clinical outcome by poten-tiating aggressive CD30+ tumor cells in a subset of HLpatients, and some of these CD30+ cells may expressFGF2 and SDC1.
The metastatic markers TGFβ1 and MMP9 areoverexpressed in the poor outcome group of HL patientsand by HL cell linesPoor prognosis in HL typically correlates with the pres-ence of tumor cells in extranodal sites distant from theprimary tumor. To investigate the metastatic potential ofHL tissues having an abundance of CD30+/FGF2+/
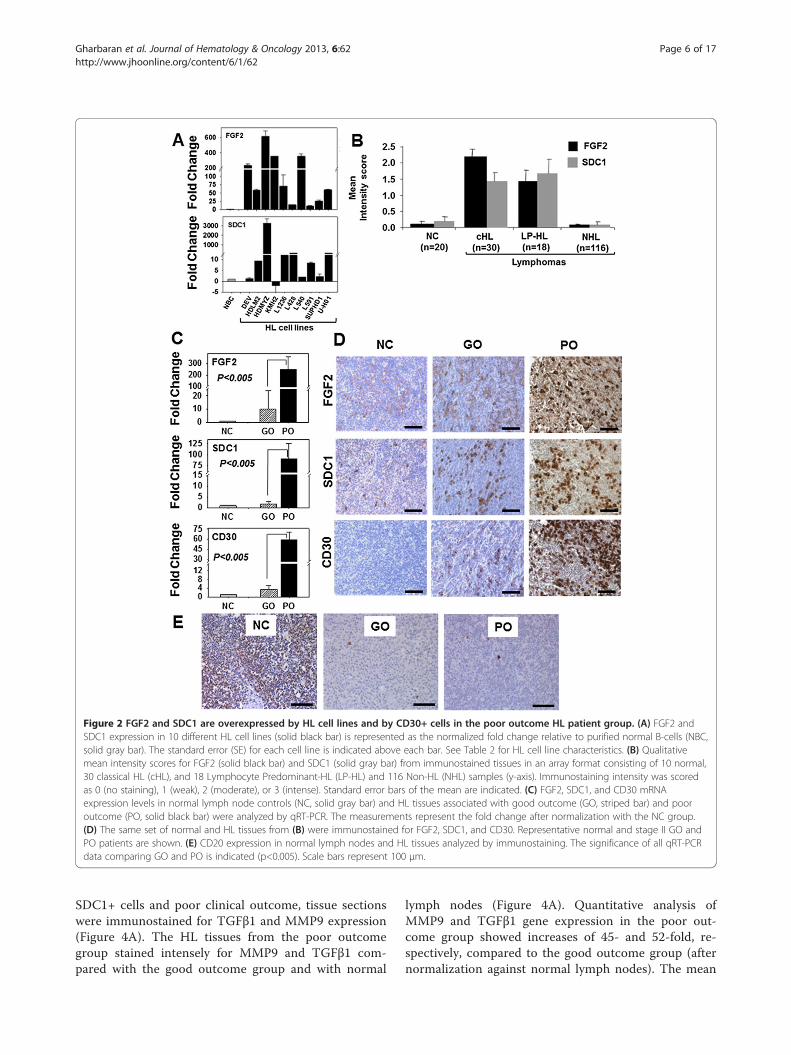
Figure 2 FGF2 and SDC1 are overexpressed by HL cell lines and by CD30+ cells in the poor outcome HL patient group. (A) FGF2 andSDC1 expression in 10 different HL cell lines (solid black bar) is represented as the normalized fold change relative to purified normal B-cells (NBC,solid gray bar). The standard error (SE) for each cell line is indicated above each bar. See Table 2 for HL cell line characteristics. (B) Qualitativemean intensity scores for FGF2 (solid black bar) and SDC1 (solid gray bar) from immunostained tissues in an array format consisting of 10 normal,30 classical HL (cHL), and 18 Lymphocyte Predominant-HL (LP-HL) and 116 Non-HL (NHL) samples (y-axis). Immunostaining intensity was scoredas 0 (no staining), 1 (weak), 2 (moderate), or 3 (intense). Standard error bars of the mean are indicated. (C) FGF2, SDC1, and CD30 mRNAexpression levels in normal lymph node controls (NC, solid gray bar) and HL tissues associated with good outcome (GO, striped bar) and pooroutcome (PO, solid black bar) were analyzed by qRT-PCR. The measurements represent the fold change after normalization with the NC group.(D) The same set of normal and HL tissues from (B) were immunostained for FGF2, SDC1, and CD30. Representative normal and stage II GO andPO patients are shown. (E) CD20 expression in normal lymph nodes and HL tissues analyzed by immunostaining. The significance of all qRT-PCRdata comparing GO and PO is indicated (p<0.005). Scale bars represent 100 μm.
Gharbaran et al. Journal of Hematology & Oncology 2013, 6:62 Page 6 of 17http://www.jhoonline.org/content/6/1/62
SDC1+ cells and poor clinical outcome, tissue sectionswere immunostained for TGFβ1 and MMP9 expression(Figure 4A). The HL tissues from the poor outcomegroup stained intensely for MMP9 and TGFβ1 com-pared with the good outcome group and with normal
lymph nodes (Figure 4A). Quantitative analysis ofMMP9 and TGFβ1 gene expression in the poor out-come group showed increases of 45- and 52-fold, re-spectively, compared to the good outcome group (afternormalization against normal lymph nodes). The mean
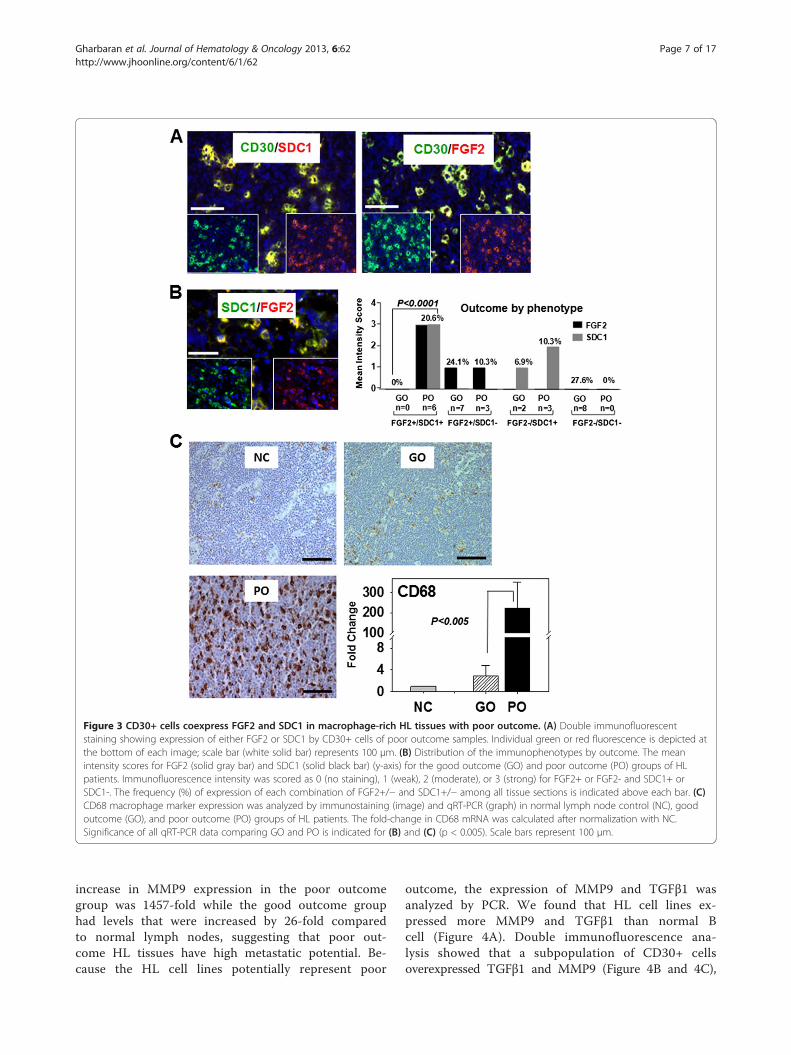
Figure 3 CD30+ cells coexpress FGF2 and SDC1 in macrophage-rich HL tissues with poor outcome. (A) Double immunofluorescentstaining showing expression of either FGF2 or SDC1 by CD30+ cells of poor outcome samples. Individual green or red fluorescence is depicted atthe bottom of each image; scale bar (white solid bar) represents 100 μm. (B) Distribution of the immunophenotypes by outcome. The meanintensity scores for FGF2 (solid gray bar) and SDC1 (solid black bar) (y-axis) for the good outcome (GO) and poor outcome (PO) groups of HLpatients. Immunofluorescence intensity was scored as 0 (no staining), 1 (weak), 2 (moderate), or 3 (strong) for FGF2+ or FGF2- and SDC1+ orSDC1-. The frequency (%) of expression of each combination of FGF2+/− and SDC1+/− among all tissue sections is indicated above each bar. (C)CD68 macrophage marker expression was analyzed by immunostaining (image) and qRT-PCR (graph) in normal lymph node control (NC), goodoutcome (GO), and poor outcome (PO) groups of HL patients. The fold-change in CD68 mRNA was calculated after normalization with NC.Significance of all qRT-PCR data comparing GO and PO is indicated for (B) and (C) (p < 0.005). Scale bars represent 100 μm.
Gharbaran et al. Journal of Hematology & Oncology 2013, 6:62 Page 7 of 17http://www.jhoonline.org/content/6/1/62
increase in MMP9 expression in the poor outcomegroup was 1457-fold while the good outcome grouphad levels that were increased by 26-fold comparedto normal lymph nodes, suggesting that poor out-come HL tissues have high metastatic potential. Be-cause the HL cell lines potentially represent poor
outcome, the expression of MMP9 and TGFβ1 wasanalyzed by PCR. We found that HL cell lines ex-pressed more MMP9 and TGFβ1 than normal Bcell (Figure 4A). Double immunofluorescence ana-lysis showed that a subpopulation of CD30+ cellsoverexpressed TGFβ1 and MMP9 (Figure 4B and 4C),
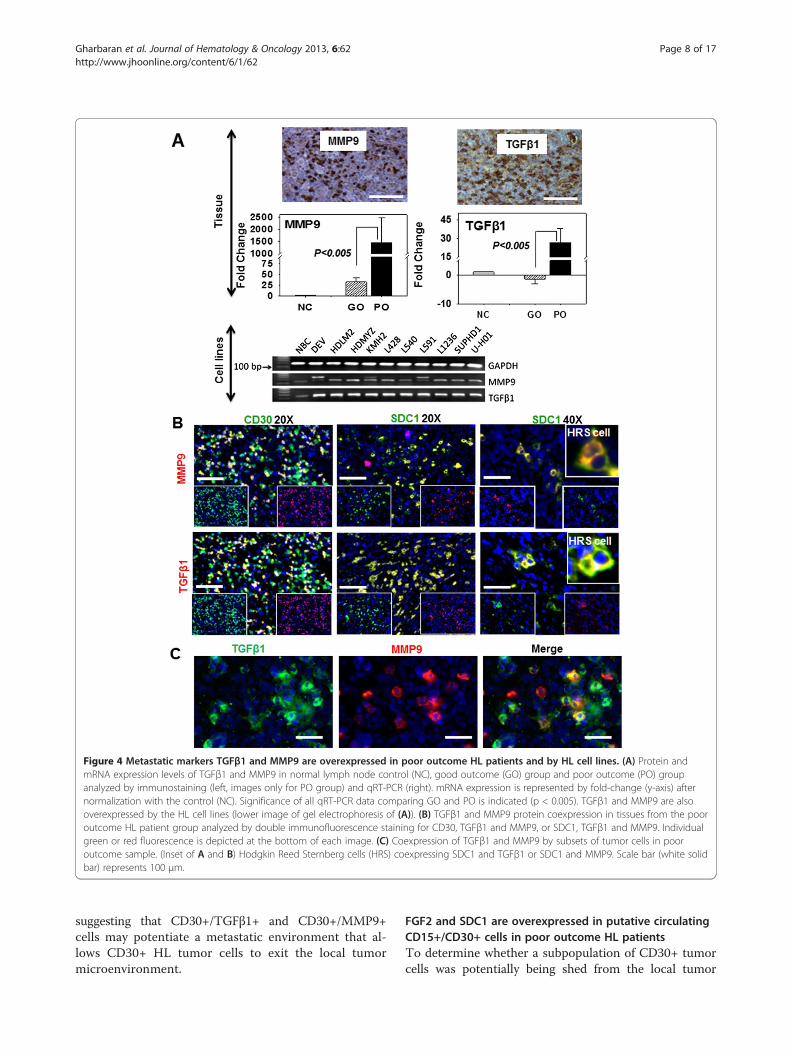
Figure 4 Metastatic markers TGFβ1 and MMP9 are overexpressed in poor outcome HL patients and by HL cell lines. (A) Protein andmRNA expression levels of TGFβ1 and MMP9 in normal lymph node control (NC), good outcome (GO) group and poor outcome (PO) groupanalyzed by immunostaining (left, images only for PO group) and qRT-PCR (right). mRNA expression is represented by fold-change (y-axis) afternormalization with the control (NC). Significance of all qRT-PCR data comparing GO and PO is indicated (p < 0.005). TGFβ1 and MMP9 are alsooverexpressed by the HL cell lines (lower image of gel electrophoresis of (A)). (B) TGFβ1 and MMP9 protein coexpression in tissues from the pooroutcome HL patient group analyzed by double immunofluorescence staining for CD30, TGFβ1 and MMP9, or SDC1, TGFβ1 and MMP9. Individualgreen or red fluorescence is depicted at the bottom of each image. (C) Coexpression of TGFβ1 and MMP9 by subsets of tumor cells in pooroutcome sample. (Inset of A and B) Hodgkin Reed Sternberg cells (HRS) coexpressing SDC1 and TGFβ1 or SDC1 and MMP9. Scale bar (white solidbar) represents 100 μm.
Gharbaran et al. Journal of Hematology & Oncology 2013, 6:62 Page 8 of 17http://www.jhoonline.org/content/6/1/62
suggesting that CD30+/TGFβ1+ and CD30+/MMP9+cells may potentiate a metastatic environment that al-lows CD30+ HL tumor cells to exit the local tumormicroenvironment.
FGF2 and SDC1 are overexpressed in putative circulatingCD15+/CD30+ cells in poor outcome HL patientsTo determine whether a subpopulation of CD30+ tumorcells was potentially being shed from the local tumor
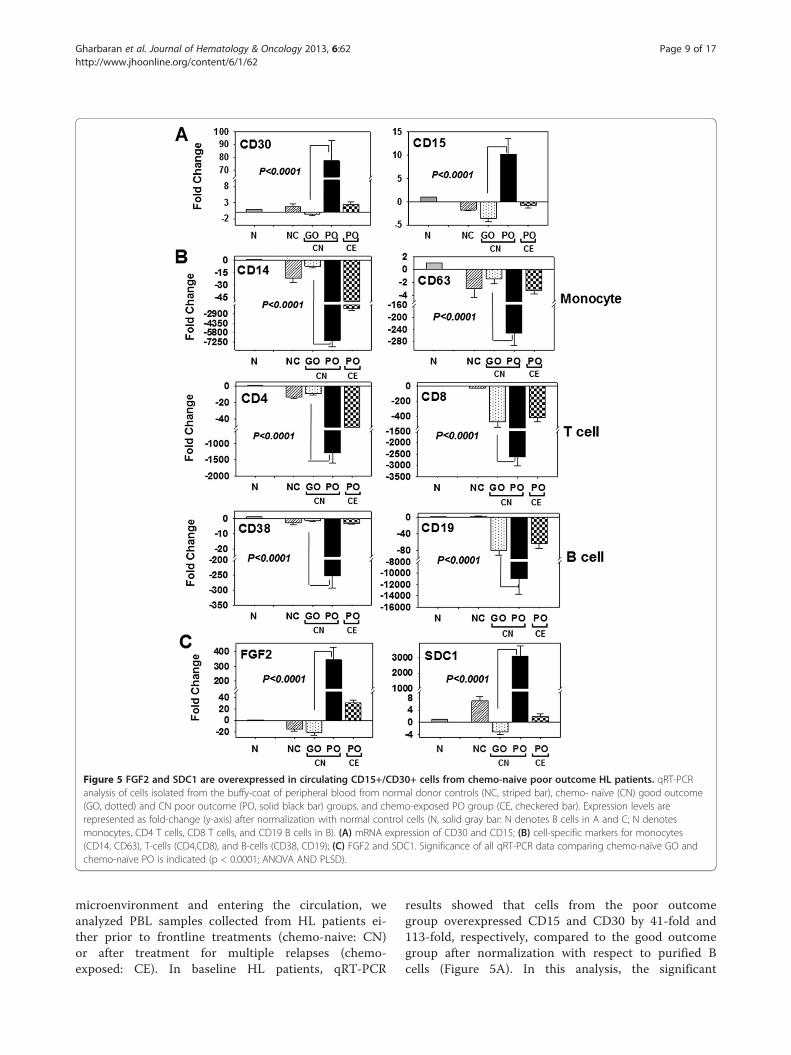
Figure 5 FGF2 and SDC1 are overexpressed in circulating CD15+/CD30+ cells from chemo-naive poor outcome HL patients. qRT-PCRanalysis of cells isolated from the buffy-coat of peripheral blood from normal donor controls (NC, striped bar), chemo- naïve (CN) good outcome(GO, dotted) and CN poor outcome (PO, solid black bar) groups, and chemo-exposed PO group (CE, checkered bar). Expression levels arerepresented as fold-change (y-axis) after normalization with normal control cells (N, solid gray bar: N denotes B cells in A and C; N denotesmonocytes, CD4 T cells, CD8 T cells, and CD19 B cells in B). (A) mRNA expression of CD30 and CD15; (B) cell-specific markers for monocytes(CD14, CD63), T-cells (CD4,CD8), and B-cells (CD38, CD19); (C) FGF2 and SDC1. Significance of all qRT-PCR data comparing chemo-naïve GO andchemo-naïve PO is indicated (p < 0.0001; ANOVA AND PLSD).
Gharbaran et al. Journal of Hematology & Oncology 2013, 6:62 Page 9 of 17http://www.jhoonline.org/content/6/1/62
microenvironment and entering the circulation, weanalyzed PBL samples collected from HL patients ei-ther prior to frontline treatments (chemo-naive: CN)or after treatment for multiple relapses (chemo-exposed: CE). In baseline HL patients, qRT-PCR
results showed that cells from the poor outcomegroup overexpressed CD15 and CD30 by 41-fold and113-fold, respectively, compared to the good outcomegroup after normalization with respect to purified Bcells (Figure 5A). In this analysis, the significant
Gharbaran et al. Journal of Hematology & Oncology 2013, 6:62 Page 10 of 17http://www.jhoonline.org/content/6/1/62
increase in marker expression seen for the poor out-come groups was eliminated in the chemo-exposedpoor outcome group (Figure 5A), suggesting thatCD15+/CD30+ cells in the circulation were killed bychemotherapy treatments. A moderate difference inmarker expression between the CN good outcomegroup and the normal control group (n=10) wasobserved. To determine if the circulating cells over-expressing CD15+/CD30+ originated from other celltypes in the blood, the expression levels of establishedcell-specific markers, including CD14 (monocytes,macrophages, neutrophils, granulocytes, and dendriticcells), CD63 (basophil activation), CD4 (helper T-cells),CD8 (cytotoxic T cells), CD38 and CD19 (B cells) wereanalyzed (Figure 5B). Among CN HL patients, com-pared to the good outcome group, a significant down-regulation of CD14 (−7150-fold), CD63 (−966-fold),CD4 (−1287-fold), CD8 (−2625-fold), CD38 (−253-fold)and CD19 (−10954-fold) expression was seen for thepoor outcome group (Figure 5B). In these analyses, theexpression levels of CD8, CD38, and CD19 in chemo-exposed HL patients were similar to levels in the goodoutcome group of CN patients, although the down-regulation of CD8 and CD19 expression was sig-nificantly lower (−125-fold for CD8 and −19085-foldfor CD19) than that in normal samples. Although thedown-regulation of CD14, CD63, CD4, and CD38among the CN good outcome group of HL patients wassimilar to normal controls, CD8 and CD19 were signi-ficantly down-regulated (CD8 by −125-fold and CD19by −19085-fold) in the good outcome CN patients com-pared to normal samples (Figure 5B). The down-regulation signatures of the cell markers in the CNpoor outcome group were directly opposite that of theCD15+/CD30+ upregulation signature, suggesting thatCD15+/CD30+ cells in the CN poor outcome groupwere potentially derived from circulating HL tumorcells (Figure 5A and 5B). In these circulating cells,FGF2 and SDC1 genes were overexpressed by 17- and9764-fold, respectively, compared to the good outcomegroup (Figure 5C). This fold-difference was reduced inrelapsing HL patients in CE group relative to the CNgood outcome group, indicating that FGF2 and SDC1are robust baseline biomarkers for predicting clinicaloutcomes for CN HL patients.
DiscussionThe survival time for high risk, unfavorable cHL (earlyrelapse, progressive disease, primary refractory) rangesfrom 0 to less than 4 years [1,25], a very poor prognosisindeed, considering the high cure rate enjoyed by HLpatients with current standard therapy. Second linetreatments which include ASCT, and chemotherapy plusradiation do not significantly improve the prognosis of
this group of patients. Therefore, it is essential to iden-tify biomarkers that can help predict, prior to treatmentwhich cHL patients belong in the high risk group so thatappropriate treatment options with potentially betteroutcome can be implemented. The results presentedhere suggest that coexpression of FGF2 and SDC1 byCD30+ cells identify this group of patients.Previous studies showed advanced stage, advanced age,
and bulky disease as important risk factors for poor out-come [16]. However, a contingency analysis performedon the HL database from the Tissue Repository of theHackensack University Medical Center showed no asso-ciation of any of these risk factors, including treatmenthistory (all p > 0.1) with patient outcome. These datasuggest that there may be undetermined molecular path-ways that are altered in subsets of NS-cHL patients whoare predisposed to be primary refractory or experiencemultiple relapses shortly after frontline treatments. Toimprove the specificity of potential biomarkers that mayassist in pre-selecting poor outcome patients prior totreatment, we used bioinformatic data mining to derivea list of over 150 genes that represent pathways formetastasis, apoptosis, cell proliferation, tumorigenesisand angiogenesis. Expression screening data for thesegenes showed a consistent and robust overexpression ofFGF2 and SDC1 in HL cell lines that were originallyderived from primary HRS cells isolated from extranodalsites of refractory or relapsing HL patients. Qualitativescoring by IHC on lymphoma tissue arrays showed thatFGF2 and SDC1 expression were indeed specific to theHL tumor microenvironment. Further analyses by qRT-PCR showed overexpression of either gene in pooroutcome samples, while additional IHC on the poor out-come samples showed regions of CD30+ cells whereFGF2 and SDC1 were strongly expressed. Doubleimmunofluorescence staining of samples from poor out-come biopsies showed large subsets of CD30+ cells thatexpressed either FGF2 or SDC1. qRT-PCR and IHCevaluation of CD68 expression confirmed the clinicalstatus of the biospecimens (poor outcome). The meta-static markers MMP9 and TGFβ1 were shown to beoverexpressed in poor outcome patient samples, inclu-ding their overexpression by subsets of CD30+ cells,suggesting metastasis by these HRS cell subsets. qRT-PCR analyses of PBL showed that CD30 and CD15 (thegene which encodes the protein that transfers fucose toN-acetyllactosamine polysaccharides to generate fuco-sylated carbohydrate structures) were transcriptionallyupregulated in the untreated, poor outcome group com-pared to other clinical groups. Concurrently, markersrepresenting circulating T cells (CD4 and CD8), B cells(CD19 and CD38), and monocytes (CD14 and CD63)were significantly downregulated in the untreated, pooroutcome group, indicating that CD30 and CD15
Gharbaran et al. Journal of Hematology & Oncology 2013, 6:62 Page 11 of 17http://www.jhoonline.org/content/6/1/62
upregulation was not a consequence of their expressionby other common circulating lymphocytes. In the un-treated, poor outcome group, transcription of FGF2 andSDC1 was upregulated, most likely by CD30+/CD15+cells. Taken together, these data indicate that in un-treated, poor outcome patients, a subset of CD30+ cellsthat express high levels of FGF2 and SDC1 transcripts,perhaps HRS cells, made their way into the circula-tion, and may be responsible for the poor outcomegenerated in primary refractory and early relapsingNS-cHL patients.The expression of either FGF2 or SDC1 seen in our
study is only partially consistent with previous reports.A previous immunoblot analysis showed no expressionof FGF2 by HL cell lines KM-H2 and L428, although thesame study did detect FGF2 expression in primary HRScells from HL tumor biopsy samples [26]. In contrast,our qRT-PCR data showed that FGF2 is transcriptionallyupregulated in both KM-H2 and L428 cell lines. In HL,it appears as though FGF2 transcript translation in HRScells is only induced in vivo. Although perhaps not com-pletely relevant to HL, elevated FGF2 mRNA is thoughtto be involved in tumor development and progression,as was demonstrated in acoustic neuromas [27]. Also,there is discordance among studies of SDC1 expressionby HRS cells. Studies have reported that the percentageof SDC1-positive HRS cells varies from 0 to 50% amongcHL cases [28-31], which is consistent for a post-germinal center origin. These differences may be due tovariations in the fixation techniques and SDC1 antibodyclones used; for example, some investigators contendthat a much higher percentage of SDC-1 positive cells isseen in frozen material compared to formalin fixed par-affin embedded material. Our double immunofluores-cence staining on fresh frozen sections from PO grouppatients showed large subsets of HRS cells that costainedwith anti-CD30 (clone Ber-H2) and anti-SDC1 (cloneBB4 and a polyclonal antibody from Sigma-Aldrich).The upregulation of FGF2 and SDC1 by putative
CD30+ cells observed in our study may be the result ofunregulated, uncontrolled expression of these genes inHRS cells from PO patients. Dysregulation of eitherFGF2 or SDC1 signaling alone or together has beenassociated with a variety of malignancies, including thoseassociated with poor prognosis. Disruption of FGF2expression results in elevated serum FGF2 levels, whichis an independent poor prognostic factor for lymphoma,lung cancer, and sarcoma patients [32-35]. In addition,elevated levels of FGF2 in serum have been reported fornon-Hodgkin lymphoma (NHL) patients with poorprognosis [36], shortened survival, and higher risk formortality [35]. Also in lymphoma, FGF2 overexpressionin diseased tissue biopsy samples is associated withchemoresistance and inferior progression free and
overall survival [37]. Kowalska et al. (2007) showed thatelevated FGF2 serum levels correlated with the erythro-cyte sedimentation rate, which is a poor prognostic fac-tor in HL [16,38]. At a molecular level, FGF2 binds tomultiple membrane bound receptors in human cancers,including SDC1 [39], and this receptor binding cantrigger multiple signaling pathways, including thoseinvolved in cell proliferation and survival [40,41]. Al-though FGF2 may not always mediate SDC1 expressionin cancers, SDC1 overexpression, at either a tissue orserum level, has been reported for multiple tumor typesincluding solid tumors [42-44], lymphomas, and in anumber of lymphoproliferative disorders [29,30,45-47].In some instances, SDC1 overexpression is an adverseindicator for both solid and hematological malignancies[43,44,48-50]. High levels of FGF2 and SDC1 in thesame patient have important clinical implications. Mul-tiple myeloma patients and small cell lung cancer pa-tients with high serum levels of soluble SDC1 and FGF2have poor prognosis and shortened survival [51]; highserum levels of soluble SDC1 and FGF2 are also impor-tant clinical features of high risk, primary refractory,early relapsing cHL, and untreated poor outcome pa-tients in our study. However, the clinical significance ofco-upregulation of SDC1 and FGF2 in serum of HLpatients has yet to be explored.Our results also revealed that a large number of
CD68+ tumor-associated macrophages were present inthe tumor microenvironment of poor outcome tissuesamples in which the CD30+ cells overexpressed bothSDC1 and FGF2. A number of previous reports showedthat CD68+ tumor-associated macrophages are a pooroutcome marker of cHL [52-54]. Therefore, simul-taneous overexpression of FGF2 and SDC1 by CD30+cells can be used as a molecular signature to identifyhigh risk, poor outcome cHL patients.The downregulation of markers representing circu-
lating T cells, B cells and monocytes in the PBL of un-treated poor outcome patients in our study is consistentwith lymphocytopenia, a negative prognostic factor inmultiple cancer types [55]. However, lymphocytopeniaalone may not adequately predict poor prognosis, and assuch better biomarkers are needed. Two recent reportsindicated that the ratio of the absolute lymphocyte countto the absolute monocyte count (ALC/AMC) is an inde-pendent prognostic marker that can be used for stra-tifying high vs. low risk cHL [56-58]. Although notdemonstrated in hematological malignancies, lympho-cytopenia implies a depleted immune system that lacksadequate immune surveillance, which could play an im-portant role in aggressive tumor metastasis. Indeed, bothlymphocytopenia and circulating tumor cells wereshown to be independent prognostic factors in the me-tastasis of breast cancer, carcinomas, sarcomas, and
Gharbaran et al. Journal of Hematology & Oncology 2013, 6:62 Page 12 of 17http://www.jhoonline.org/content/6/1/62
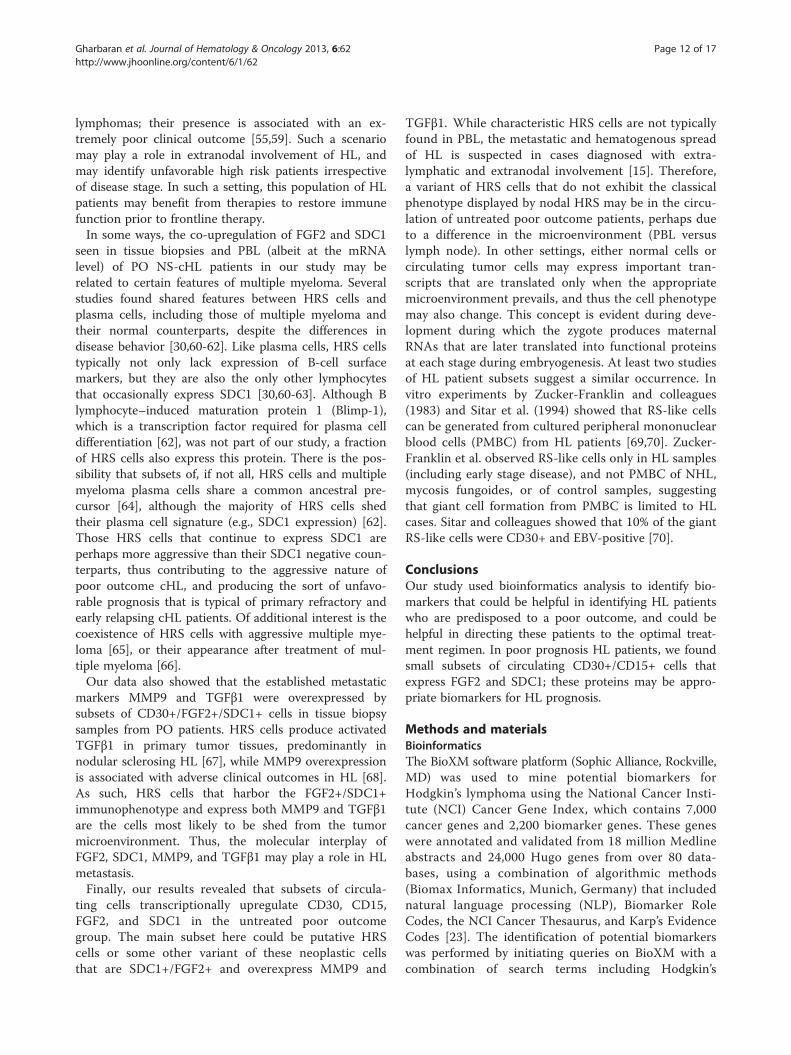
lymphomas; their presence is associated with an ex-tremely poor clinical outcome [55,59]. Such a scenariomay play a role in extranodal involvement of HL, andmay identify unfavorable high risk patients irrespectiveof disease stage. In such a setting, this population of HLpatients may benefit from therapies to restore immunefunction prior to frontline therapy.In some ways, the co-upregulation of FGF2 and SDC1
seen in tissue biopsies and PBL (albeit at the mRNAlevel) of PO NS-cHL patients in our study may berelated to certain features of multiple myeloma. Severalstudies found shared features between HRS cells andplasma cells, including those of multiple myeloma andtheir normal counterparts, despite the differences indisease behavior [30,60-62]. Like plasma cells, HRS cellstypically not only lack expression of B-cell surfacemarkers, but they are also the only other lymphocytesthat occasionally express SDC1 [30,60-63]. Although Blymphocyte–induced maturation protein 1 (Blimp-1),which is a transcription factor required for plasma celldifferentiation [62], was not part of our study, a fractionof HRS cells also express this protein. There is the pos-sibility that subsets of, if not all, HRS cells and multiplemyeloma plasma cells share a common ancestral pre-cursor [64], although the majority of HRS cells shedtheir plasma cell signature (e.g., SDC1 expression) [62].Those HRS cells that continue to express SDC1 areperhaps more aggressive than their SDC1 negative coun-terparts, thus contributing to the aggressive nature ofpoor outcome cHL, and producing the sort of unfavo-rable prognosis that is typical of primary refractory andearly relapsing cHL patients. Of additional interest is thecoexistence of HRS cells with aggressive multiple mye-loma [65], or their appearance after treatment of mul-tiple myeloma [66].Our data also showed that the established metastatic
markers MMP9 and TGFβ1 were overexpressed bysubsets of CD30+/FGF2+/SDC1+ cells in tissue biopsysamples from PO patients. HRS cells produce activatedTGFβ1 in primary tumor tissues, predominantly innodular sclerosing HL [67], while MMP9 overexpressionis associated with adverse clinical outcomes in HL [68].As such, HRS cells that harbor the FGF2+/SDC1+immunophenotype and express both MMP9 and TGFβ1are the cells most likely to be shed from the tumormicroenvironment. Thus, the molecular interplay ofFGF2, SDC1, MMP9, and TGFβ1 may play a role in HLmetastasis.Finally, our results revealed that subsets of circula-
ting cells transcriptionally upregulate CD30, CD15,FGF2, and SDC1 in the untreated poor outcomegroup. The main subset here could be putative HRScells or some other variant of these neoplastic cellsthat are SDC1+/FGF2+ and overexpress MMP9 and
TGFβ1. While characteristic HRS cells are not typicallyfound in PBL, the metastatic and hematogenous spreadof HL is suspected in cases diagnosed with extra-lymphatic and extranodal involvement [15]. Therefore,a variant of HRS cells that do not exhibit the classicalphenotype displayed by nodal HRS may be in the circu-lation of untreated poor outcome patients, perhaps dueto a difference in the microenvironment (PBL versuslymph node). In other settings, either normal cells orcirculating tumor cells may express important tran-scripts that are translated only when the appropriatemicroenvironment prevails, and thus the cell phenotypemay also change. This concept is evident during deve-lopment during which the zygote produces maternalRNAs that are later translated into functional proteinsat each stage during embryogenesis. At least two studiesof HL patient subsets suggest a similar occurrence. Invitro experiments by Zucker-Franklin and colleagues(1983) and Sitar et al. (1994) showed that RS-like cellscan be generated from cultured peripheral mononuclearblood cells (PMBC) from HL patients [69,70]. Zucker-Franklin et al. observed RS-like cells only in HL samples(including early stage disease), and not PMBC of NHL,mycosis fungoides, or of control samples, suggestingthat giant cell formation from PMBC is limited to HLcases. Sitar and colleagues showed that 10% of the giantRS-like cells were CD30+ and EBV-positive [70].
ConclusionsOur study used bioinformatics analysis to identify bio-markers that could be helpful in identifying HL patientswho are predisposed to a poor outcome, and could behelpful in directing these patients to the optimal treat-ment regimen. In poor prognosis HL patients, we foundsmall subsets of circulating CD30+/CD15+ cells thatexpress FGF2 and SDC1; these proteins may be appro-priate biomarkers for HL prognosis.
Methods and materialsBioinformaticsThe BioXM software platform (Sophic Alliance, Rockville,MD) was used to mine potential biomarkers forHodgkin’s lymphoma using the National Cancer Insti-tute (NCI) Cancer Gene Index, which contains 7,000cancer genes and 2,200 biomarker genes. These geneswere annotated and validated from 18 million Medlineabstracts and 24,000 Hugo genes from over 80 data-bases, using a combination of algorithmic methods(Biomax Informatics, Munich, Germany) that includednatural language processing (NLP), Biomarker RoleCodes, the NCI Cancer Thesaurus, and Karp’s EvidenceCodes [23]. The identification of potential biomarkerswas performed by initiating queries on BioXM with acombination of search terms including Hodgkin’s
Gharbaran et al. Journal of Hematology & Oncology 2013, 6:62 Page 13 of 17http://www.jhoonline.org/content/6/1/62
disease, lymphoma, cancer, biomarker, overexpression,up-regulation or down-regulation, and differentially-expressed. The bioinformatics-guided search generated151 potential HL biomarkers (Table 2).
Cell lines and cell cultureThe Hodgkin’s lymphoma cell lines KM-H2, HD-MY-Z,HDLM-2, L-591, and SUP-HD1 were obtained from theGerman Collection of Microorganisms and Cell Cultures(Braunschweig, Germany). L-428, L-1236, and L-540cells were generous gifts provided by Dr. Volker Diehl(University of Cologne, Germany). U-H01 and DEV cellswere kind gifts from Dr. S. Brüderlein (UniversityHospital Ulm, Germany) and Dr. Debora De Jong(Netherlands), respectively. KM-H2, L-428, HD-MY-Z,and L-1236 cells were cultured in 90% RPMI 1640supplemented with 10% fetal bovine serum (FBS). SUP-HD1 cells were grown in 80% McCoy’s 5A mediumcontaining 20% FBS. HDLM-2, L-540, and L-591 cellswere grown in 80% RPMI 1640 supplemented with 20%FBS. U-H01 cells were grown in Iscove’s MDM andRPMI 1640 (4:1) supplemented with 20% FBS. Allculture media contained 2 mM L-glutamine, penicillin(100 U/ml), and streptomycin (0.1 mg/ml). Cultureswere maintained at 37°C with 5% CO2. The clinicalcharacteristics of each cell line were previously docu-mented and are presented in Table 3. DEV, KM-H2, andSUP-HD1 cells were derived from relapsing cases.HD-MY-Z, L1236, L428, and U-H01 cells were fromrefractory patients.
RNA isolation and cDNA synthesisTotal RNA from cell lines and peripheral blood (PBL)of HL patients was isolated using Trizol (Invitrogen,Carlsbad, CA). RNA from archived FFPE tissue sections
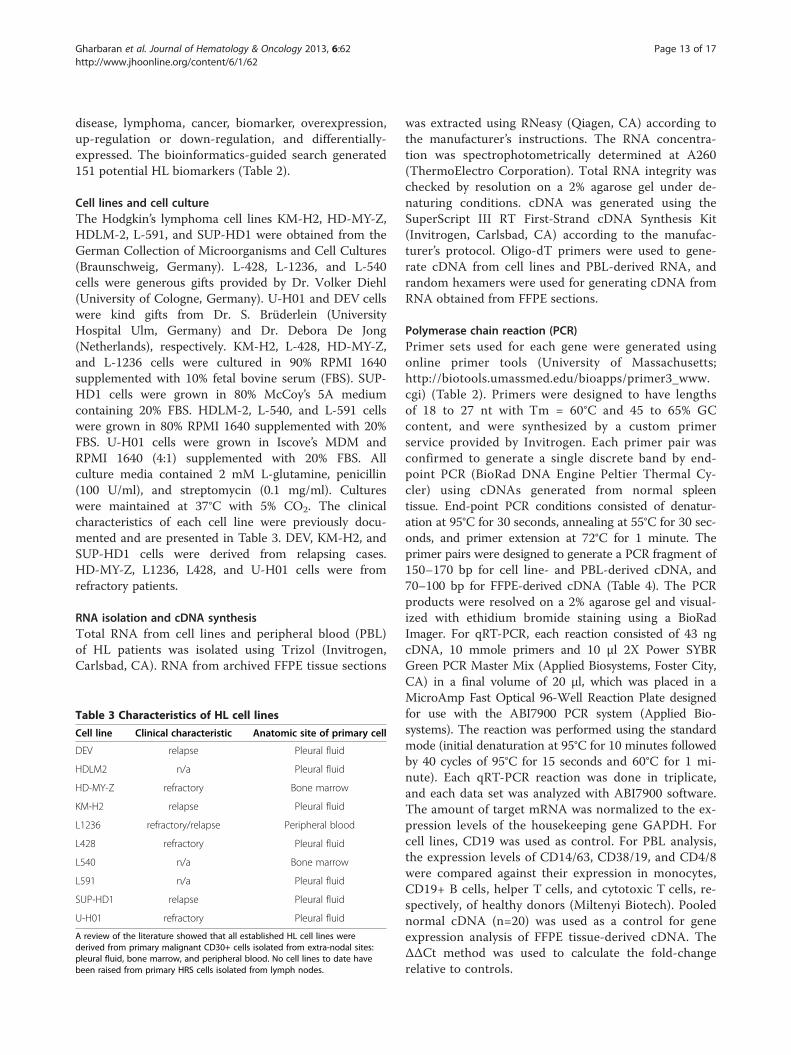
Table 3 Characteristics of HL cell lines
Cell line Clinical characteristic Anatomic site of primary cell
DEV relapse Pleural fluid
HDLM2 n/a Pleural fluid
HD-MY-Z refractory Bone marrow
KM-H2 relapse Pleural fluid
L1236 refractory/relapse Peripheral blood
L428 refractory Pleural fluid
L540 n/a Bone marrow
L591 n/a Pleural fluid
SUP-HD1 relapse Pleural fluid
U-H01 refractory Pleural fluid
A review of the literature showed that all established HL cell lines werederived from primary malignant CD30+ cells isolated from extra-nodal sites:pleural fluid, bone marrow, and peripheral blood. No cell lines to date havebeen raised from primary HRS cells isolated from lymph nodes.
was extracted using RNeasy (Qiagen, CA) according tothe manufacturer’s instructions. The RNA concentra-tion was spectrophotometrically determined at A260(ThermoElectro Corporation). Total RNA integrity waschecked by resolution on a 2% agarose gel under de-naturing conditions. cDNA was generated using theSuperScript III RT First-Strand cDNA Synthesis Kit(Invitrogen, Carlsbad, CA) according to the manufac-turer’s protocol. Oligo-dT primers were used to gene-rate cDNA from cell lines and PBL-derived RNA, andrandom hexamers were used for generating cDNA fromRNA obtained from FFPE sections.
Polymerase chain reaction (PCR)Primer sets used for each gene were generated usingonline primer tools (University of Massachusetts;http://biotools.umassmed.edu/bioapps/primer3_www.cgi) (Table 2). Primers were designed to have lengthsof 18 to 27 nt with Tm = 60°C and 45 to 65% GCcontent, and were synthesized by a custom primerservice provided by Invitrogen. Each primer pair wasconfirmed to generate a single discrete band by end-point PCR (BioRad DNA Engine Peltier Thermal Cy-cler) using cDNAs generated from normal spleentissue. End-point PCR conditions consisted of denatur-ation at 95°C for 30 seconds, annealing at 55°C for 30 sec-onds, and primer extension at 72°C for 1 minute. Theprimer pairs were designed to generate a PCR fragment of150–170 bp for cell line- and PBL-derived cDNA, and70–100 bp for FFPE-derived cDNA (Table 4). The PCRproducts were resolved on a 2% agarose gel and visual-ized with ethidium bromide staining using a BioRadImager. For qRT-PCR, each reaction consisted of 43 ngcDNA, 10 mmole primers and 10 μl 2X Power SYBRGreen PCR Master Mix (Applied Biosystems, Foster City,CA) in a final volume of 20 μl, which was placed in aMicroAmp Fast Optical 96-Well Reaction Plate designedfor use with the ABI7900 PCR system (Applied Bio-systems). The reaction was performed using the standardmode (initial denaturation at 95°C for 10 minutes followedby 40 cycles of 95°C for 15 seconds and 60°C for 1 mi-nute). Each qRT-PCR reaction was done in triplicate,and each data set was analyzed with ABI7900 software.The amount of target mRNA was normalized to the ex-pression levels of the housekeeping gene GAPDH. Forcell lines, CD19 was used as control. For PBL analysis,the expression levels of CD14/63, CD38/19, and CD4/8were compared against their expression in monocytes,CD19+ B cells, helper T cells, and cytotoxic T cells, re-spectively, of healthy donors (Miltenyi Biotech). Poolednormal cDNA (n=20) was used as a control for geneexpression analysis of FFPE tissue-derived cDNA. TheΔΔCt method was used to calculate the fold-changerelative to controls.
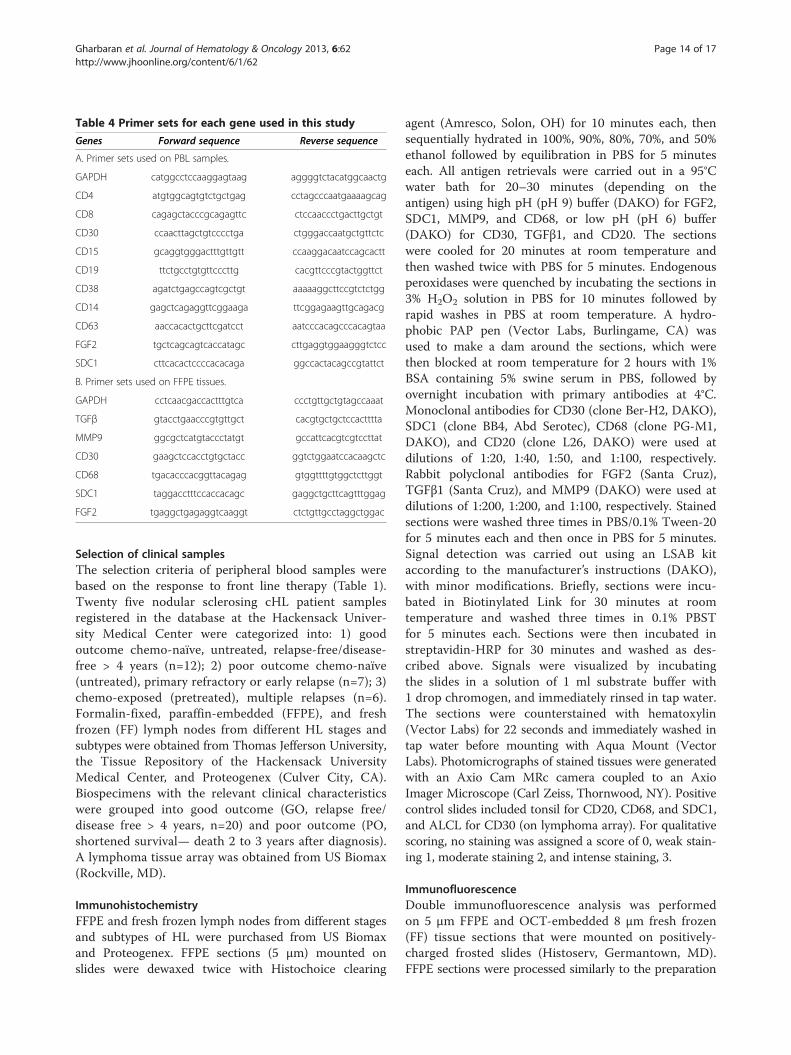
Table 4 Primer sets for each gene used in this study
Genes Forward sequence Reverse sequence
A. Primer sets used on PBL samples.
GAPDH catggcctccaaggagtaag aggggtctacatggcaactg
CD4 atgtggcagtgtctgctgag cctagcccaatgaaaagcag
CD8 cagagctacccgcagagttc ctccaaccctgacttgctgt
CD30 ccaacttagctgtcccctga ctgggaccaatgctgttctc
CD15 gcaggtgggactttgttgtt ccaaggacaatccagcactt
CD19 ttctgcctgtgttcccttg cacgttcccgtactggttct
CD38 agatctgagccagtcgctgt aaaaaggcttccgtctctgg
CD14 gagctcagaggttcggaaga ttcggagaagttgcagacg
CD63 aaccacactgcttcgatcct aatcccacagcccacagtaa
FGF2 tgctcagcagtcaccatagc cttgaggtggaagggtctcc
SDC1 cttcacactccccacacaga ggccactacagccgtattct
B. Primer sets used on FFPE tissues.
GAPDH cctcaacgaccactttgtca ccctgttgctgtagccaaat
TGFβ gtacctgaacccgtgttgct cacgtgctgctccactttta
MMP9 ggcgctcatgtaccctatgt gccattcacgtcgtccttat
CD30 gaagctccacctgtgctacc ggtctggaatccacaagctc
CD68 tgacacccacggttacagag gtggttttgtggctcttggt
SDC1 taggacctttccaccacagc gaggctgcttcagtttggag
FGF2 tgaggctgagaggtcaaggt ctctgttgcctaggctggac
Gharbaran et al. Journal of Hematology & Oncology 2013, 6:62 Page 14 of 17http://www.jhoonline.org/content/6/1/62
Selection of clinical samplesThe selection criteria of peripheral blood samples werebased on the response to front line therapy (Table 1).Twenty five nodular sclerosing cHL patient samplesregistered in the database at the Hackensack Univer-sity Medical Center were categorized into: 1) goodoutcome chemo-naïve, untreated, relapse-free/disease-free > 4 years (n=12); 2) poor outcome chemo-naïve(untreated), primary refractory or early relapse (n=7); 3)chemo-exposed (pretreated), multiple relapses (n=6).Formalin-fixed, paraffin-embedded (FFPE), and freshfrozen (FF) lymph nodes from different HL stages andsubtypes were obtained from Thomas Jefferson University,the Tissue Repository of the Hackensack UniversityMedical Center, and Proteogenex (Culver City, CA).Biospecimens with the relevant clinical characteristicswere grouped into good outcome (GO, relapse free/disease free > 4 years, n=20) and poor outcome (PO,shortened survival— death 2 to 3 years after diagnosis).A lymphoma tissue array was obtained from US Biomax(Rockville, MD).
ImmunohistochemistryFFPE and fresh frozen lymph nodes from different stagesand subtypes of HL were purchased from US Biomaxand Proteogenex. FFPE sections (5 μm) mounted onslides were dewaxed twice with Histochoice clearing
agent (Amresco, Solon, OH) for 10 minutes each, thensequentially hydrated in 100%, 90%, 80%, 70%, and 50%ethanol followed by equilibration in PBS for 5 minuteseach. All antigen retrievals were carried out in a 95°Cwater bath for 20–30 minutes (depending on theantigen) using high pH (pH 9) buffer (DAKO) for FGF2,SDC1, MMP9, and CD68, or low pH (pH 6) buffer(DAKO) for CD30, TGFβ1, and CD20. The sectionswere cooled for 20 minutes at room temperature andthen washed twice with PBS for 5 minutes. Endogenousperoxidases were quenched by incubating the sections in3% H2O2 solution in PBS for 10 minutes followed byrapid washes in PBS at room temperature. A hydro-phobic PAP pen (Vector Labs, Burlingame, CA) wasused to make a dam around the sections, which werethen blocked at room temperature for 2 hours with 1%BSA containing 5% swine serum in PBS, followed byovernight incubation with primary antibodies at 4°C.Monoclonal antibodies for CD30 (clone Ber-H2, DAKO),SDC1 (clone BB4, Abd Serotec), CD68 (clone PG-M1,DAKO), and CD20 (clone L26, DAKO) were used atdilutions of 1:20, 1:40, 1:50, and 1:100, respectively.Rabbit polyclonal antibodies for FGF2 (Santa Cruz),TGFβ1 (Santa Cruz), and MMP9 (DAKO) were used atdilutions of 1:200, 1:200, and 1:100, respectively. Stainedsections were washed three times in PBS/0.1% Tween-20for 5 minutes each and then once in PBS for 5 minutes.Signal detection was carried out using an LSAB kitaccording to the manufacturer’s instructions (DAKO),with minor modifications. Briefly, sections were incu-bated in Biotinylated Link for 30 minutes at roomtemperature and washed three times in 0.1% PBSTfor 5 minutes each. Sections were then incubated instreptavidin-HRP for 30 minutes and washed as des-cribed above. Signals were visualized by incubatingthe slides in a solution of 1 ml substrate buffer with1 drop chromogen, and immediately rinsed in tap water.The sections were counterstained with hematoxylin(Vector Labs) for 22 seconds and immediately washed intap water before mounting with Aqua Mount (VectorLabs). Photomicrographs of stained tissues were generatedwith an Axio Cam MRc camera coupled to an AxioImager Microscope (Carl Zeiss, Thornwood, NY). Positivecontrol slides included tonsil for CD20, CD68, and SDC1,and ALCL for CD30 (on lymphoma array). For qualitativescoring, no staining was assigned a score of 0, weak stain-ing 1, moderate staining 2, and intense staining, 3.
ImmunofluorescenceDouble immunofluorescence analysis was performedon 5 μm FFPE and OCT-embedded 8 μm fresh frozen(FF) tissue sections that were mounted on positively-charged frosted slides (Histoserv, Germantown, MD).FFPE sections were processed similarly to the preparation
Gharbaran et al. Journal of Hematology & Oncology 2013, 6:62 Page 15 of 17http://www.jhoonline.org/content/6/1/62
used for IHC. OCT-embedded FF sections were thawedat room temperature for 20 minutes, rinsed briefly inPBS, and then fixed in 3.7% formaldehyde (ElectronMicroscopy Sciences, PA) for 20 minutes at roomtemperature. The remaining steps for immunofluores-cence signal detection were carried out using a TSADetection system (Invitrogen) according to the manu-facturer’s instructions. Monoclonal and polyclonal sig-nals were detected with Alexa Fluor 488 and AlexaFluor 546, respectively. The antibodies used were thesame as for IHC, except that a SDC1 rabbit polyclonalantibody (Sigma-Aldrich) was used for CD30-SDC1double staining. Slides were counterstained with Hoechst33342, visualized with a Leica DMI 6000B invertedmicroscope, and analyzed using Leica MM AF software,version 1.5 (Leica Microsystems). Slides were indepen-dently reviewed and verified by two pathologists.
StatisticsData analyses were performed using SAS 9.1.3, StatView5, or JMP 4. Contingency and likelihood ratio analyseswere used to determine the independence of stagingand prognosis. The mean fold-change for each samplewas determined from triplicates of the qRT-PCR data.Analysis of variance (ANOVA) and F statistics wereused to determine differences between the means of thepoor outcome group and other outcome groups. Fisher’sprotected least significant difference (PLSD) was usedto determine pair-wise significant differences betweengroup means.
KeypointsFGF2 and SDC1 overexpression by circulating CD15+/CD30+ cells is associated with poor outcome in HodgkinLymphoma.
AbbreviationsABVD: Adriamycin bleomycin, vinblastine, dacarbazine acc., accelerated;BCPAT: BEAM conditioning pre-auto transplant; CR: Complete remission;CE: Chemo-exposed; CN: Chemo-naive; BEACOPP: Bleomycin etoposide,adriamycin, cyclophosphamide, vincristine, procarbazine, prednisone;CPPV: Chlorambucil procarbazine, prednisone, Vinblastine;DICE: Dexamethasone ifosfamide, cisplatin, etoposide; EPOCH: Etoposidevincristine, and doxorubicin with bolus cyclophosphamide; ESHAP: Etoposidemethylprednisolone, Ara-C, and cisplatin; FMPAL: Fludarabine melphalan,pre-allo transplant; GVD: Gemcitabine vinorelbine, liposomal vincristine;HCVAD: Hyper cyclophosphamide vincristine, adriamycin, anddexamethasone; ICE: Ifosfamide carboplatin, etoposide; IGEV: Ifosfamidegemcitabine, and vinorelbine; PT: Post transplant; Rel: Relapse; Ref: Refractory;R: Rituximab; Rad: Radiation; SK: Sloan kettering; Std: Standard;WU: Washington University.
Competing interestsThe authors have no conflict of interest to declare.
Authors’ contributionsRG and KSS designed the study and wrote the manuscript. RG, JP, CK, SS,NH, and SV performed the experiments; TT and MT provided clinical samplesand performed experiments; KN provided bioinformatics software andanalyses; RG, AG, PB and KSS analyzed the data; AG and AP reviewed the
paper and provided advice. All authors read and approved the finalmanuscript.
AcknowledgmentThis research was supported by funding from the Lisa B. FishmanFoundation and the John Theurer Cancer Center of the HackensackUniversity Medical Center.
Author details1John Theurer Cancer Center, Hackensack University Medical Center, D. JuristResearch Building, 40 Prospect Avenue, Hackensack, NJ 07601, USA. 2ThomasJefferson University, Philadelphia, PA 19107, USA. 3Sophic Systems Alliance,Falmouth, MA 02540, USA.
Received: 23 April 2013 Accepted: 19 August 2013Published: 29 August 2013
References1. Josting A, Rueffer U, Franklin J, Sieber M, Diehl V, Engert A: Prognostic
factors and treatment outcome in primary progressive Hodgkinlymphoma: a report from the German Hodgkin lymphoma study group.Blood 2000, 96(4):1280–1286.
2. Majhail NS, Ness KK, Burns LJ, Sun CL, Carter A, Francisco L, Forman SJ,Bhatia S, Baker KS: Late effects in survivors of Hodgkin and non-Hodgkinlymphoma treated with autologous hematopoietic cell transplantation: areport from the bone marrow transplant survivor study. Biol BloodMarrow Transplant 2007, 13(10):1153–1159.
3. Hasenclever D, Diehl V: A prognostic score for advanced Hodgkin’sdisease. International prognostic factors project on advanced Hodgkin’sdisease. N Engl J Med 1998, 339(21):1506–1514.
4. Steidl C, Farinha P, Gascoyne RD: Macrophages predict treatmentoutcome in Hodgkin’s lymphoma. Haematologica 2011, 96(2):186–189.
5. Azambuja D, Natkunam Y, Biasoli I, Lossos IS, Anderson MW, Morais JC,Spector N: Lack of association of tumor-associated macrophages withclinical outcome in patients with classical Hodgkin’s lymphoma.Ann Oncol J Eur Soc Med Oncol/ESMO 2012, 23(3):736–742.
6. Younes A, Bartlett NL, Leonard JP, Kennedy DA, Lynch CM, Sievers EL,Forero-Torres A: Brentuximab vedotin (SGN-35) for relapsedCD30-positive lymphomas. N Engl J Med 2010, 363(19):1812–1821.
7. Tamaru J, Hummel M, Mikata A, Stein H: [Hodgkin’s disease: the origin ofHRS (Hodgkin and Reed-Sternberg) cells]. [Rinsho ketsueki] Japan J ClinHematol 1996, 37(5):426–429.
8. Seitz V, Hummel M, Marafioti T, Anagnostopoulos I, Assaf C, Stein H:Detection of clonal T-cell receptor gamma-chain gene rearrangementsin reed-Sternberg cells of classic Hodgkin disease. Blood 2000,95(10):3020–3024.
9. Kuppers R: Identifying the precursors of Hodgkin and reed-Sternbergcells in Hodgkin’s disease: role of the germinal center in B-celllymphomagenesis. J Acquir Immune Defic Syndr 1999, 21(Suppl 1):S74–S79.
10. Steidl C, Connors JM, Gascoyne RD: Molecular pathogenesis of Hodgkin’slymphoma: increasing evidence of the importance of themicroenvironment. J Clin Oncol 2011, 29(14):1812–1826.
11. Schreck S, Friebel D, Buettner M, Distel L, Grabenbauer G, Young LS,Niedobitek G: Prognostic impact of tumour-infiltrating Th2 andregulatory T cells in classical Hodgkin lymphoma. Hematol Oncol 2009,27(1):31–39.
12. Skinnider BF, Mak TW: The role of cytokines in classical Hodgkinlymphoma. Blood 2002, 99(12):4283–4297.
13. Aldinucci D, Lorenzon D, Cattaruzza L, Pinto A, Gloghini A, Carbone A,Colombatti A: Expression of CCR5 receptors on Reed-Sternberg cells andHodgkin lymphoma cell lines: involvement of CCL5/Rantes in tumor cellgrowth and microenvironmental interactions. Int J Cancer J Int Du Cancer2008, 122(4):769–776.
14. Niens M, Visser L, Nolte IM, van der Steege G, Diepstra A, Cordano P,Jarrett RF, Te Meerman GJ, Poppema S, van den Berg A: Serum chemokinelevels in Hodgkin lymphoma patients: highly increased levels of CCL17and CCL22. Br J Haematol 2008, 140(5):527–536.
15. Guermazi A, Brice P, de Kerviler EE, Ferme C, Hennequin C, Meignin V,Frija J: Extranodal Hodgkin disease: spectrum of disease. RadiographicsRev Public Radiol Soc N Am Inc 2001, 21(1):161–179.
Gharbaran et al. Journal of Hematology & Oncology 2013, 6:62 Page 16 of 17http://www.jhoonline.org/content/6/1/62
16. Noordijk EM, Carde P, Dupouy N, Hagenbeek A, Krol AD, Kluin-Nelemans JC,Tirelli U, Monconduit M, Thomas J, Eghbali H, et al: Combined-modalitytherapy for clinical stage I or II Hodgkin’s lymphoma: long-term resultsof the European organisation for research and treatment of cancer H7randomized controlled trials. J Clin Oncol J Am Soc Clin Oncol 2006,24(19):3128–3135.
17. Wulfing P, Borchard J, Buerger H, Heidl S, Zanker KS, Kiesel L, Brandt B:HER2-positive circulating tumor cells indicate poor clinical outcome instage I to III breast cancer patients. Cli Cancer Res J Am Assoc Cancer Res2006, 12(6):1715–1720.
18. Hoshimoto S, Shingai T, Morton DL, Kuo C, Faries MB, Chong K, Elashoff D,Wang HJ, Elashoff RM, Hoon DS: Association between circulating tumorcells and prognosis in patients with stage III melanoma with sentinellymph node metastasis in a phase III international multicenter trial.J Clin Oncol J Am Soc Clin Oncol 2012, 30(31):3819–3826.
19. Wolf J, Kapp U, Bohlen H, Kornacker M, Schoch C, Stahl B, Mucke S,von Kalle C, Fonatsch C, Schaefer HE, et al: Peripheral blood mononuclearcells of a patient with advanced Hodgkin’s lymphoma give rise topermanently growing Hodgkin-Reed Sternberg cells. Blood 1996,87(8):3418–3428.
20. Diehl V, Kirchner HH, Schaadt M, Fonatsch C, Stein H, Gerdes J, Boie C:Hodgkin’s disease: establishment and characterization of four in vitrocell lies. J Cancer Res Clin Oncol 1981, 101(1):111–124.
21. Mader A, Bruderlein S, Wegener S, Melzner I, Popov S, Muller-Hermelink HK,Barth TF, Viardot A, Moller P: U-HO1, a new cell line derived from aprimary refractory classical Hodgkin lymphoma. Cytogenet Genome Res2007, 119(3–4):204–210.
22. Hsu SM, Zhao X, Chakraborty S, Liu YF, Whang-Peng J, Lok MS, Fukuhara S:Reed-Sternberg cells in Hodgkin’s cell lines HDLM, L-428, and KM-H2 arenot actively replicating: lack of bromodeoxyuridine uptake bymultinuclear cells in culture. Blood 1988, 71(5):1382–1389.
23. Karp PD, Paley S, Krieger CJ, Zhang P: An evidence ontology for use inpathway/genome databases. In Pacif Sympo Biocomp; 2004:190–201.
24. Steidl C, Lee T, Shah SP, Farinha P, Han G, Nayar T, Delaney A, Jones SJ,Iqbal J, Weisenburger DD, et al: Tumor-associated macrophages andsurvival in classic Hodgkin’s lymphoma. N Engl J Med 2010,362(10):875–885.
25. Josting A, Wolf J, Diehl V: Hodgkin disease: prognostic factors andtreatment strategies. Curr Opin Oncol 2000, 12(5):403–411.
26. Khnykin D, Troen G, Berner JM, Delabie J: The expression of fibroblastgrowth factors and their receptors in Hodgkin’s lymphoma. J Pathol 2006,208(3):431–438.
27. Murphy PR, Myal Y, Sato Y, Sato R, West M, Friesen HG: Elevated expressionof basic fibroblast growth factor messenger ribonucleic acid in acousticneuromas. Mol Endocrinol 1989, 3(2):225–231.
28. Tzankov A, Zimpfer A, Pehrs AC, Lugli A, Went P, Maurer R, Pileri S,Dirnhofer S: Expression of B-cell markers in classical hodgkin lymphoma:a tissue microarray analysis of 330 cases. Modern Pathol J US Can AcadPathol Inc 2003, 16(11):1141–1147.
29. O’Connell FP, Pinkus JL, Pinkus GS: CD138 (syndecan-1), a plasma cellmarker immunohistochemical profile in hematopoietic andnonhematopoietic neoplasms. Am J Clin Pathol 2004, 121(2):254–263.
30. Carbone A, Gloghini A, Gattei V, Degan M, Improta S, Aldinucci D,Canzonieri V, Perin T, Volpe R, Gaidano G, et al: Reed-Sternberg cells ofclassical Hodgkin’s disease react with the plasma cell-specificmonoclonal antibody B-B4 and express human syndecan-1. Blood 1997,89(10):3787–3794.
31. Costes V, Magen V, Legouffe E, Durand L, Baldet P, Rossi JF, Klein B,Brochier J: The Mi15 monoclonal antibody (anti-syndecan-1) is a reliablemarker for quantifying plasma cells in paraffin-embedded bone marrowbiopsy specimens. Hum Pathol 1999, 30(12):1405–1411.
32. Ruotsalainen T, Joensuu H, Mattson K, Salven P: High pretreatment serumconcentration of basic fibroblast growth factor is a predictor of poorprognosis in small cell lung cancer. Cancer Epidemiol Biomark Prev Pub AmAssoc Cancer Res Cosponsored Am Soc Prev Oncol 2002, 11(11):1492–1495.
33. Ueno K, Inoue Y, Kawaguchi T, Hosoe S, Kawahara M: Increased serumlevels of basic fibroblast growth factor in lung cancer patients: relevanceto response of therapy and prognosis. Lung Cancer 2001,31(2–3):213–219.
34. Salven P, Teerenhovi L, Joensuu H: A high pretreatment serum basicfibroblast growth factor concentration is an independent predictor of
poor prognosis in non-Hodgkin’s lymphoma. Blood 1999,94(10):3334–3339.
35. Salven P, Orpana A, Teerenhovi L, Joensuu H: Simultaneous elevation inthe serum concentrations of the angiogenic growth factors VEGF andbFGF is an independent predictor of poor prognosis in non-Hodgkinlymphoma: a single-institution study of 200 patients. Blood 2000,96(12):3712–3718.
36. Bertolini F, Paolucci M, Peccatori F, Cinieri S, Agazzi A, Ferrucci PF,Cocorocchio E, Goldhirsch A, Martinelli G: Angiogenic growth factors andendostatin in non-Hodgkin’s lymphoma. Br J Haematol 1999,106(2):504–509.
37. Pazgal I, Zimra Y, Tzabar C, Okon E, Rabizadeh E, Shaklai M, Bairey O:Expression of basic fibroblast growth factor is associated with pooroutcome in non-Hodgkin’s lymphoma. Br J Cancer 2002, 86(11):1770–1775.
38. Kowalska M, Janina K, Małgorzata F, Beata K, Alicja S, Joanna T, Jan W:Serum VEGF and bFGF levels in patients with Hodgkin’s lymphoma.NOWOTWORY J Oncol 2007, 57(4):179e–182e.
39. Salmivirta M, Heino J, Jalkanen M: Basic fibroblast growth factor-syndecancomplex at cell surface or immobilized to matrix promotes cell growth.J Biol Chem 1992, 267(25):17606–17610.
40. Su G, Blaine SA, Qiao D, Friedl A: Shedding of syndecan-1 by stromalfibroblasts stimulates human breast cancer cell proliferation via FGF2activation. J Biol Chem 2007, 282(20):14906–14915.
41. Fitzgerald ML, Wang Z, Park PW, Murphy G, Bernfield M: Shedding ofsyndecan-1 and −4 ectodomains is regulated by multiple signalingpathways and mediated by a TIMP-3-sensitive metalloproteinase.J Cell Biol 2000, 148(4):811–824.
42. Zellweger T, Ninck C, Mirlacher M, Annefeld M, Glass AG, Gasser TC,Mihatsch MJ, Gelmann EP, Bubendorf L: Tissue microarray analysis revealsprognostic significance of syndecan-1 expression in prostate cancer.Prostate 2003, 55(1):20–29.
43. Juuti A, Nordling S, Lundin J, Louhimo J, Haglund C: Syndecan-1expression–a novel prognostic marker in pancreatic cancer.Oncology 2005, 68(2–3):97–106.
44. Barbareschi M, Maisonneuve P, Aldovini D, Cangi MG, Pecciarini L,Angelo Mauri F, Veronese S, Caffo O, Lucenti A, Palma PD, et al: Highsyndecan-1 expression in breast carcinoma is related to an aggressivephenotype and to poorer prognosis. Cancer 2003, 98(3):474–483.
45. Vassilakopoulos TP, Kyrtsonis MC, Papadogiannis A, Nadali G,Angelopoulou MK, Tzenou T, Dimopoulou MN, Siakantaris MP,Kontopidou FN, Kalpadakis C, et al: Serum levels of soluble syndecan-1 inHodgkin’s lymphoma. Anticancer Res 2005, 25(6C):4743–4746.
46. Sebestyen A, Berczi L, Mihalik R, Paku S, Matolcsy A, Kopper L: Syndecan-1(CD138) expression in human non-Hodgkin lymphomas. Br J Haematol1999, 104(2):412–419.
47. Kyrtsonis MC, Vassilakopoulos TP, Siakantaris MP, Kokoris SI, Gribabis DA,Dimopoulou MN, Angelopoulou MK, Pangalis GA: Serum syndecan-1, basicfibroblast growth factor and osteoprotegerin in myeloma patients atdiagnosis and during the course of the disease. Eur J Haematol 2004,72(4):252–258.
48. Leivonen M, Lundin J, Nordling S, von Boguslawski K, Haglund C:Prognostic value of syndecan-1 expression in breast cancer. Oncology2004, 67(1):11–18.
49. Molica S, Vitelli G, Mirabelli R, Digiesu G, Giannarelli D, Cuneo A,Ribatti D, Vacca A: Serum levels of syndecan-1 in B-cell chroniclymphocytic leukemia: correlation with the extent of angiogenesis anddisease-progression risk in early disease. Leuk Lymphoma 2006,47(6):1034–1040.
50. Aref S, Goda T, El-Sherbiny M: Syndecan-1 in multiple myeloma:relationship to conventional prognostic factors. Hematology 2003,8(4):221–228.
51. Joensuu H, Anttonen A, Eriksson M, Makitaro R, Alfthan H, Kinnula V,Leppa S: Soluble syndecan-1 and serum basic fibroblast growth factorare new prognostic factors in lung cancer. Cancer Res 2002,62(18):5210–5217.
52. Thygesen K, Alpert JS, Jaffe AS, Simoons ML, Chaitman BR, White HD, JointESCAAHAWHFTFfUDoMI, Authors/Task Force Members C, Thygesen K, AlpertJS et al.: Third universal definition of myocardial infarction. J Am CollCardiol 2012, 60(16):1581–1598.
53. Thygesen K, Alpert JS, Jaffe AS, Simoons ML, Chaitman BR, White HD, JointESCAAHAWHFTFftUDoMI, Katus HA, Lindahl B, Morrow DA et al.: Third
Gharbaran et al. Journal of Hematology & Oncology 2013, 6:62 Page 17 of 17http://www.jhoonline.org/content/6/1/62
universal definition of myocardial infarction. Circulation 2012,126(16):2020–2035.
54. Thygesen K, Alpert JS, Jaffe AS, Simoons ML, Chaitman BR, White HD: JointESCAAHAWHFTFftUDoM: Third universal definition of myocardialinfarction. Eur Heart J 2012, 33(20):2551–2567.
55. Ray-Coquard I, Cropet C, Van Glabbeke M, Sebban C, Le Cesne A, Judson I,Tredan O, Verweij J, Biron P, Labidi I, et al: Lymphopenia as a prognosticfactor for overall survival in advanced carcinomas, sarcomas, andlymphomas. Cancer Res 2009, 69(13):5383–5391.
56. Porrata LF, Ristow K, Habermann TM, Ozsan N, Dogan A, Macon W,Colgan JP, Witzig TE, Inwards DJ, Ansell SM, et al: Absolute monocyte/lymphocyte count prognostic score is independent ofimmunohistochemically determined cell of origin in predicting survivalin diffuse large B-cell lymphoma. Leuk Lymphoma 2012, 53(11):2159–2165.
57. Koh YW, Kang HJ, Park C, Yoon DH, Kim S, Suh C, Kim JE, Kim CW, Huh J:Prognostic significance of the ratio of absolute neutrophil count toabsolute lymphocyte count in classic Hodgkin lymphoma. Am J ClinPathol 2012, 138(6):846–854.
58. Koh YW, Kang HJ, Park C, Yoon DH, Kim S, Suh C, Go H, Kim JE, Kim CW,Huh J: The ratio of the absolute lymphocyte count to the absolutemonocyte count is associated with prognosis in Hodgkin’s lymphoma:correlation with tumor-associated macrophages. Oncologist 2012,17(6):871–880.
59. De Giorgi U, Mego M, Scarpi E, Giuliano M, Giordano A, Reuben JM, ValeroV, Ueno NT, Hortobagyi GN, Cristofanilli M: Relationship betweenlymphocytopenia and circulating tumor cells as prognostic factors foroverall survival in metastatic breast cancer. Clin Breast Cancer 2012,12(4):264–269.
60. Watanabe K, Yamashita Y, Nakayama A, Hasegawa Y, Kojima H, Nagasawa T,Mori N: Varied B-cell immunophenotypes of Hodgkin/reed-Sternbergcells in classic Hodgkin’s disease. Histopathol 2000, 36(4):353–361.
61. Carbone A, Gloghini A, Gaidano G, Franceschi S, Capello D, Drexler HG,Falini B, Dalla-Favera R: Expression status of BCL-6 and syndecan-1identifies distinct histogenetic subtypes of Hodgkin’s disease. Blood 1998,92(7):2220–2228.
62. Buettner M, Greiner A, Avramidou A, Jack HM, Niedobitek G: Evidence ofabortive plasma cell differentiation in Hodgkin and reed-Sternberg cellsof classical Hodgkin lymphoma. Hematol Oncol 2005, 23(3–4):127–132.
63. Bai M, Panoulas V, Papoudou-Bai A, Horianopoulos N, Kitsoulis P, Stefanaki K,Rontogianni D, Agnantis NJ, Kanavaros P: B-cell differentiationimmunophenotypes in classical Hodgkin lymphomas. Leuk Lymphoma2006, 47(3):495–501.
64. Jones RJ, Gocke CD, Kasamon YL, Miller CB, Perkins B, Barber JP, Vala MS,Gerber JM, Gellert LL, Siedner M, et al: Circulating clonotypic B cells inclassic Hodgkin lymphoma. Blood 2009, 113(23):5920–5926.
65. Ibarrola De Andres C, Toscano R, Lahuerta JJ, Martinez-Gonzalez MA:Simultaneous occurrence of Hodgkin’s disease, nodal Langerhans’ cellhistiocytosis and multiple myeloma IgA(kappa). Virchows Archiv Int JPathol 1999, 434(3):259–262.
66. Fujii H, Iwai T, Ueda Y, Nakagawa H: [Development of Hodgkin’s diseasefour years after autologous peripheral blood stem cell transplantationfor multiple myeloma]. [Rinsho ketsueki] Japan J Clin Hematol 2000,41(12):1267–1272.
67. Newcom SR, Gu L: Transforming growth factor beta 1 messenger RNA inreed-Sternberg cells in nodular sclerosing Hodgkin’s disease. J Clin Pathol1995, 48(2):160–163.
68. Kuittinen O, Soini Y, Turpeenniemi-Hujanen T: Diverse role of MMP-2 andMMP-9 in the clinicopathological behavior of Hodgkin’s lymphoma.Eur J Haematol 2002, 69(4):205–212.
69. Zucker-Franklin D, Grusky G, Baez L: Reed-Sternberg cells cultured frommorphologically unidentifiable precursors in the blood of patients withHodgkin’s disease. Hematol Oncol 1983, 1(2):127–138.
70. Sitar G, Bianchi Santamaria A, Rosti V, Shaskin P, Blago R, Santamaria L,Ascari E: Giant cell formation in Hodgkin’s disease. Res Immunol 1994,145(7):499–515.
doi:10.1186/1756-8722-6-62Cite this article as: Gharbaran et al.: Fibroblast growth factor-2 (FGF2)and syndecan-1 (SDC1) are potential biomarkers for putative circulatingCD15+/CD30+ cells in poor outcome Hodgkin lymphoma patients.Journal of Hematology & Oncology 2013 6:62.
Submit your next manuscript to BioMed Centraland take full advantage of:
• Convenient online submission
• Thorough peer review
• No space constraints or color figure charges
• Immediate publication on acceptance
• Inclusion in PubMed, CAS, Scopus and Google Scholar
• Research which is freely available for redistribution
Submit your manuscript at www.biomedcentral.com/submit