REMEDIAL INVESTIGATION WORK PLAN · Remedial Investigation Work Plan Anacostia River Sediments...
290
45610 Woodland Road, Suite 400, Sterling, VA 20166 (703) 444-7000 FINAL REMEDIAL INVESTIGATION WORK PLAN Anacostia River Sediment Project, Washington, DC Prepared for District Department of the Environment Government of the District of Columbia June 2014 Prepared by
Transcript of REMEDIAL INVESTIGATION WORK PLAN · Remedial Investigation Work Plan Anacostia River Sediments...

45610 Woodland Road, Suite 400, Sterling, VA 20166 (703) 444-7000
FINAL
REMEDIAL INVESTIGATION
WORK PLAN Anacostia River Sediment Project, Washington, DC
Prepared for
District Department of the Environment Government of the District of Columbia
June 2014
Prepared by

Remedial Investigation Work Plan Anacostia River Sediments Project
District Department of the Environment
Document Approval
The following District Department of the Environment staff certify that they approve this Remedial Investigation Work Plan for the Anacostia River Sediment Project located in Washington, DC:
Dev Murali, P.G. Remedial Project Manager
Richard Jackson Associate Director

Remedial Investigation Work Plan Anacostia River Sediments Project
Document Approval Page (Tetra Tech, Inc.)
The following Tetra Tech professionals certify that they approve this Remedial Investigation Work Plan for the Anacostia River Sediment Project located in Washington, DC:
Mark Shupe, P.G. Principal Hydrogeologist
James Wescott, P.E. Principal Engineer
Steven DelHomme, P.E. Engineering Director
Jeremy B. Travis, CHMM Program Manager

Remedial Investigation Work Plan Anacostia River Sediments Project
i
CONTENTS Abbreviations and Acronyms ........................................................................................................................ v 1.0 INTRODUCTION ................................................................................................................................ 1
1.1 Objective ............................................................................................................................. 2 1.2 Regulatory Background ....................................................................................................... 2 1.3 Natural Resources Damage Assessment Strategy .............................................................. 3 1.4 Scope ................................................................................................................................... 3 1.5 Community Relations .......................................................................................................... 4 1.6 Work Plan Organization ...................................................................................................... 4
2.0 SITE BACKGROUND AND PHYSICAL SETTING ................................................................................... 6 2.1 Site Location and Description ............................................................................................. 6 2.2 Site Dredging History .......................................................................................................... 6 2.3 Geologic Setting .................................................................................................................. 8 2.4 Hydrogeology and Hydrology ............................................................................................. 9 2.5 Sediment Transport Regimes ............................................................................................ 10 2.6 Previous Environmental Investigations and Ongoing Activities ....................................... 11
2.6.1 Site-wide Investigations ....................................................................................... 11 2.6.2 Site-Specific Investigations .................................................................................. 13
2.7 Data Usability .................................................................................................................... 24 2.8 Regulatory Compliance ..................................................................................................... 26
2.8.1 ARARs ................................................................................................................... 26 2.8.2 Permits and Other Access Agreements ............................................................... 30
3.0 PRELIMINARY CONCEPTUAL SITE MODEL ...................................................................................... 31 3.1 Physical Conceptual Site Model ........................................................................................ 31
3.1.1 Constituents of Concern ...................................................................................... 31 3.1.2 Sources ................................................................................................................. 32 3.1.3 Release Mechanisms............................................................................................ 38 3.1.4 Exposure Media ................................................................................................... 40 3.1.5 Transport Media and Mechanisms ...................................................................... 40 3.1.6 Watershed Modeling ........................................................................................... 41
3.2 Ecological Conceptual Site Model ..................................................................................... 42 3.2.1 Previous Screening Level Ecological Risk Assessment ......................................... 42 3.2.2 Potential Ecological Receptors............................................................................. 42 3.2.3 Potential Exposure Pathways .............................................................................. 43
3.3 Human Health Conceptual Site Model ............................................................................. 44 3.3.1 Previous Human Health Risk Screening ............................................................... 44 3.3.2 Potential Human Receptors ................................................................................. 44 3.3.3 Potential Exposure Pathways .............................................................................. 45
Remedial Investigation Work Plan Anacostia River Sediments Project
ii
4.0 WORK PLAN RATIONALE ................................................................................................................ 46 4.1 Data Quality Objectives .................................................................................................... 46
4.1.1 Data Quality Objective Statement ....................................................................... 46 4.1.2 Data Quality Objective Development Process ..................................................... 47
4.2 Nature and Extent of Contamination ............................................................................... 51 4.2.1 Surface Sediment ................................................................................................. 52 4.2.2 Subsurface Sediment ........................................................................................... 55 4.2.3 Pore Water and Surface Water ............................................................................ 58 4.2.4 Groundwater ........................................................................................................ 60 4.2.5 Invertebrate and Fish Studies .............................................................................. 60 4.2.6 Bathymetric Data ................................................................................................. 63 4.2.7 Data Gap Assessment for Environmental Media ................................................. 64
4.3 Sources, Pathways, and Source Control ........................................................................... 67 4.3.1 Potential Sources ................................................................................................. 67 4.3.2 Institutional and Source Control Efforts .............................................................. 67 4.3.3 Data Gap Assessment for Contaminant Sources ................................................. 68
4.4 Define Sediment Management Areas ............................................................................... 68
5.0 REMEDIAL INVESTIGATION ............................................................................................................ 69 5.1 Sediment Characterization ............................................................................................... 69
5.1.1 Bathymetric Survey .............................................................................................. 70 5.1.2 Physical and Chemical Sediment Sampling .......................................................... 70 5.1.3 Sediment Pore Water Sampling ........................................................................... 72 5.1.4 Sediment Sampling for Benthic Invertebrate Toxicity Tests ................................ 72 5.1.5 Sampling for Benthic and Epibenthic Invertebrates ............................................ 73 5.1.6 Approach to Estimating Background and Ambient Concentrations in Sediment 74
5.2 Surface Water Sampling ................................................................................................... 74 5.3 Fish, Turtle, and Crayfish Tissue Sampling and Analysis ................................................... 75
6.0 DATA EVALUATION AND REPORTING ............................................................................................ 77 6.1 Data Evaluation ................................................................................................................. 77 6.2 RI Summary Report ........................................................................................................... 78 6.3 Watershed Model Update and Revision ........................................................................... 79
7.0 ECOLOGICAL RISK ASSESSMENT .................................................................................................... 80 7.1 SLERA ................................................................................................................................ 80
7.1.1 Problem Formulation ........................................................................................... 81 7.1.2 Measurement Endpoint ....................................................................................... 82 7.1.3 SLERA Exposure Estimates and Risk Calculations ................................................ 84 7.1.4 SLERA Summary and Conclusions ........................................................................ 85
7.2 BERA .................................................................................................................................. 85 7.2.1 Problem Formulation – Refinement .................................................................... 85 7.2.2 Measurement Endpoints and Study Design ........................................................ 86

Remedial Investigation Work Plan Anacostia River Sediments Project
iii
7.2.3 Risk Characterization ........................................................................................... 87 7.2.4 Uncertainty Analysis ............................................................................................ 88 7.2.5 BERA Summary and Conclusions ......................................................................... 88
8.0 HUMAN HEALTH RISK ASSESSMENT .............................................................................................. 89 8.1 Data Evaluation and Identification of COCs ...................................................................... 90 8.2 Exposure Assessment ....................................................................................................... 91
8.2.1 Exposure Setting Characterization ....................................................................... 91 8.2.2 Exposure Pathway Identification ......................................................................... 91 8.2.3 Exposure Quantification ...................................................................................... 93
8.3 Toxicity Assessment .......................................................................................................... 94 8.4 Risk Characterization ........................................................................................................ 95
8.4.1 Characterization of Cancer Risk ........................................................................... 95 8.4.2 Hazard .................................................................................................................. 95 8.4.3 Lead ...................................................................................................................... 96
8.5 Uncertainty Assessment ................................................................................................... 96
9.0 NATURAL RESOURCE DAMAGE ASSESSMENT PROCESS ................................................................ 97 10.0 SCHEDULE ...................................................................................................................................... 99 11.0 REFERENCES ................................................................................................................................. 100
FIGURES Figure 1.1 Site Location Map Figure 2.1 Sediment Sampling Locations by Source Database Figure 3.1 Anacostia River Sediments Project Conceptual Site Model Figure 3.2 Location of Outfalls in the Anacostia River Study Area Figure 4.1 Locations of River Reaches Figure 4.2 Summary Analytical Results for LPAH in Surface Sediment Figure 4.3 Summary Analytical Results for Total PAH in Surface Sediment Figure 4.4 Summary Analytical Results for HPAH in Surface Sediment Figure 4.5 Summary Analytical Results for Total PCBs in Surface Sediment Figure 4.6 Summary Analytical Results for Chlordane in Surface Sediment Figure 4.7 Summary Analytical Results for Aluminum in Surface Sediment Figure 4.8 Summary Analytical Results for Arsenic in Surface Sediment Figure 4.9 Summary Analytical Results for Cadmium in Surface Sediment Figure 4.10 Summary Analytical Results for Chromium in Surface Sediment Figure 4.11 Summary Analytical Results for Copper in Surface Sediment Figure 4.12 Summary Analytical Results for Lead in Surface Sediment Figure 4.13 Summary Analytical Results for Mercury in Surface Sediment Figure 4.14 Summary Analytical Results for Nickel in Surface Sediment Figure 4.15 Summary Analytical Results for Selenium in Surface Sediment

Remedial Investigation Work Plan Anacostia River Sediments Project
iv
Figure 4.16 Summary Analytical Results for Zinc in Surface Sediment Figure 4.17 Previous Subsurface Sediment Sampling Locations Figure 5.1 Proposed Sediment Sampling Locations Figure 5.2 Proposed Benthic Invertebrate and Pore Water Sampling Locations Figure 5.3 Proposed Fish Tissue, Pore Water, and Surface Water Sampling Locations
TABLES
Table 1.1 Statement of Work Elements Addressed by this Work Plan Table 2.1 Geologic and Hydrostratigraphic Units Present in the Study Area Table 2.2 Previous Studies Included in the Project Database and Number of Samples (by Media) in
the Tidal Anacostia River Table 2.3 Summary of Ft. McNair and Joint Base Anacostia-Bolling LUST Sites Table 2.4 Comparison of Sediment Analytical Methods Table 2.5 Project Screening Levels for Sediments, Soil, and Groundwater Table 2.6 Human Health Screening Levels for Sediments, Surface Water, and Fish Tissue Table 3.1 Priority Pollutant List Table 3.2 Summary of Reported Constituents Associated with the Environmental Cleanup Sites Table 3.3 Summary of Combined Sewer and Sanitary Sewer Outfalls Located in the Anacostia River
Study Area Table 3.4 Summary of Storm Sewer Outfalls Located in the Anacostia River Study Area Table 3.5 Summary of Anacostia River Study Area Tidal Tributary Confluences Table 4.1 Data Quality Objectives Table 4.2 Field-Measured Surface Water Quality Parameters, Washington Navy Yard Table 5.1 Summary of Planned Sampling Activities for the RI Table 5.2 Proposed Sediment Sampling Locations and Rationale Table 5.3 Proposed Benthic Invertebrate and Pore Water Sampling Locations Table 5.4 Proposed Fish Tissue and Surface Water Sampling Locations and Rationale Table 5.5 Proposed Benthic Invertebrate and Porewater Sampling Locations Table 5.6 Proposed Fish, Turtle, and Crayfish Tissue and Surface Water Sampling Locations and
Rationale Table 10.1 Summary of Deliverables for the Anacostia River Sediments Project
APPENDICES
A December 9, 2013 Anacostia River Bathymetric Survey 2013, Technical Memorandum B January 8, 2014 Geomorphic Analysis Technical Memorandum

Remedial Investigation Work Plan Anacostia River Sediments Project
v
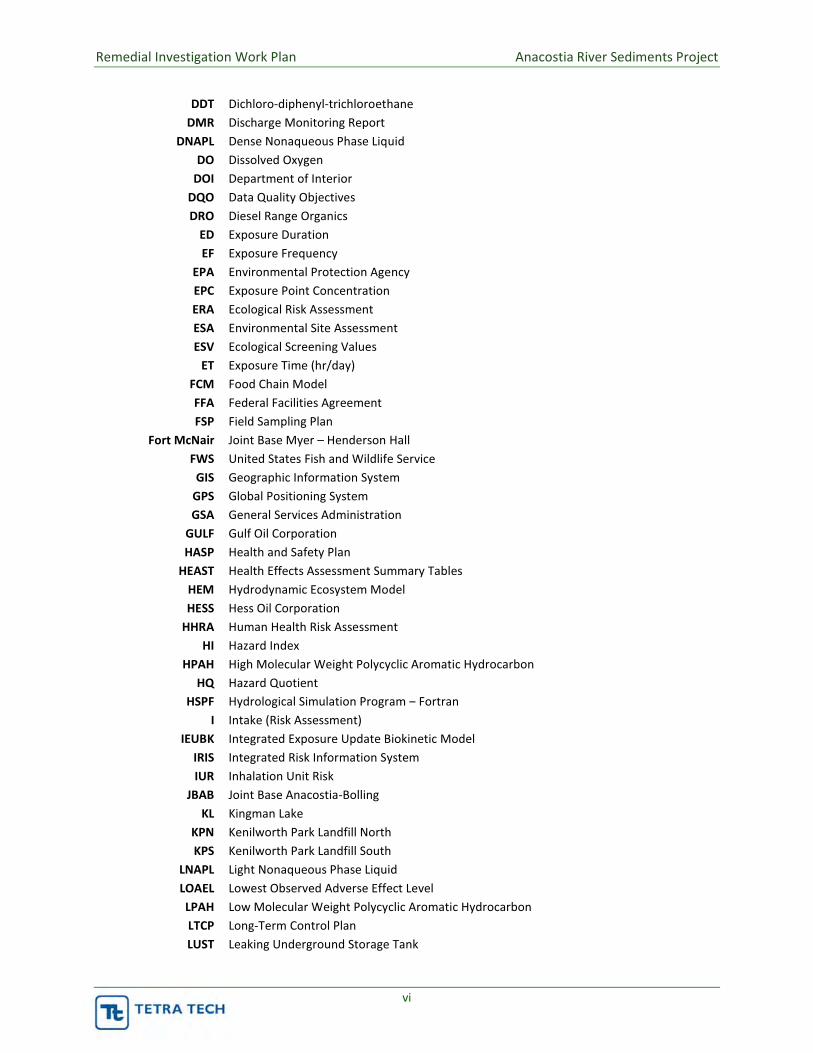
ABBREVIATIONS AND ACRONYMS AECOM AECOM Technology Corporation
AFB Air Force Base ALM Adult Lead Model ANS Academy of Natural Sciences AOC Area of Concern AOI Areas of Influence
ARAR Applicable or Relevant and Appropriate Requirements ARD Assessment and Restoration Division
ASTM American Society for Testing and Materials AT Averaging Time
ATSDR Agency for Toxic Substances and Disease Registry AVS Acid Volatile Sulfides
AWTA Anacostia Watershed Toxics Alliance BAF Bioaccumulation Factors BaP Benzo(a)pyrene
BERA Baseline Ecological Risk Assessment B-IBI Benthic Index of Biotic Integrity BOD Biological Oxygen Demand
BSAF Biota-Sediment Accumulation FactorBTAG Biological Technical Assistance Group BTEX Benzene, Toluene, Ethylbenzene, and Xylenes
BW Adult Body Weight (kg) CalEPA California Environmental Protection Agency
CC Chain of Custody CERCLA Comprehensive Environmental Response, Compensation, and Liability Act
CIP Community Involvement PlanCLP Contract Laboratory Program
COC Constituents of ConcernCOPEC Chemical of Potential Ecological Concern
CPAH Carcinogenic Polycyclic Aromatic HydrocarbonCPRD Coastal Protection and Restoration Division
CR Contact Rate CSM Conceptual Site Model CSO Combined Sewer Outfall CSS Combined Sewer System CSX CSX Transportation CTE Central Tendency Exposure
CWA Clean Water Act DC District of Columbia
DC Water District of Columbia Water and Sewer Authority DDD Dichloro-diphenyl-dichloroethane DDE Dichloro-diphenyl-dichloroethylene
DDOE District Department of the Environment
Remedial Investigation Work Plan Anacostia River Sediments Project
vi
DDT Dichloro-diphenyl-trichloroethane DMR Discharge Monitoring Report
DNAPL Dense Nonaqueous Phase Liquid DO Dissolved Oxygen
DOI Department of Interior DQO Data Quality Objectives DRO Diesel Range Organics
ED Exposure Duration EF Exposure Frequency
EPA Environmental Protection Agency EPC Exposure Point Concentration ERA Ecological Risk Assessment ESA Environmental Site Assessment ESV Ecological Screening Values
ET Exposure Time (hr/day) FCM Food Chain ModelFFA Federal Facilities Agreement FSP Field Sampling Plan
Fort McNair Joint Base Myer – Henderson Hall FWS United States Fish and Wildlife Service
GIS Geographic Information System GPS Global Positioning System GSA General Services Administration
GULF Gulf Oil Corporation HASP Health and Safety Plan
HEAST Health Effects Assessment Summary Tables HEM Hydrodynamic Ecosystem Model HESS Hess Oil Corporation
HHRA Human Health Risk Assessment HI Hazard Index
HPAH High Molecular Weight Polycyclic Aromatic Hydrocarbon HQ Hazard Quotient
HSPF ����������� �������������������������� I Intake (Risk Assessment)
IEUBK Integrated Exposure Update Biokinetic Model IRIS Integrated Risk Information System IUR Inhalation Unit Risk
JBAB Joint Base Anacostia-Bolling KL Kingman Lake
KPN Kenilworth Park Landfill North KPS Kenilworth Park Landfill South
LNAPL Light Nonaqueous Phase LiquidLOAEL Lowest Observed Adverse Effect Level LPAH Low Molecular Weight Polycyclic Aromatic Hydrocarbon LTCP Long-Term Control Plan LUST Leaking Underground Storage Tank

Remedial Investigation Work Plan Anacostia River Sediments Project
vii
MCL Maximum Contaminant Level MDE Maryland Department of the Environment MGP Manufactured Gas Plant MRL Minimal Risk Level MS4 Municipal Separate Storm Sewer System
MTBE Methyl Tertiary Butyl Ether NAPL Non-Aqueous Phase Liquid
NAVFAC Navy Facilities Engineering CommandNAVY Depart of the Navy
NCP National Oil and Hazardous Substances Contingency Plan NFRAP No Further Response Action Planned NOAA National Oceanic and Atmospheric Administration
NOAEL No Observed Adverse Effect Level NPDES National Pollutant Discharge Elimination System
NPS National Park Service NRD Naval Resource Damages
NRDA Natural Resources Damage Assessment NSFA Naval Support Facility Anacostia
OCP Organochlorine Pesticide OERR Office of Emergency and Remedial Response
OPA Oil Pollution Act ORD Office of Research and Development ORP Oxidation and Reduction Potential
OSWER Office of Solid Waste and Emergency Response OU Operable Unit PA Preliminary Assessment
PA/SI Preliminary Assessment/Site Investigation PAH Polycyclic Aromatic Hydrocarbon
PARCC Precision, Accuracy, Representativeness, Completeness, and Comparability PBDE Polybrominated Diphenyl Ethers
PCB Polychlorinated Biphenyl PCDD Polychlorinated Dibenzo-p-dioxins PCDF Polychlorinated Dibenzofurans
PDMS Polydimethylsiloxane PEC Probable Effect Concentration PID Photoionization Detector
PMP Project Management Plan PP Priority Pollutant
PPRTV Provisional Peer-Reviewed Toxicity Values PRG Preliminary Remedial Goals
QAPP Quality Assurance Project Plan RAGS Risk Assessment Guidance
RAS Routine Analytical Services RBC Risk-Based Concentrations
RD/RA Remedial Design/Remedial Action REC Recognized Environmental Condition

Remedial Investigation Work Plan Anacostia River Sediments Project
viii
Region 3 U.S. Environmental Protection Agency Region 3 RfC Reference Concentration RfD Reference Dose RFI RCRA Facility Investigation
RHA Rivers and Harbors Act RI/FS Remedial Investigation/Feasibility Study RME Reasonable Maximum Exposure ROD Record of Decision
RP Responsible Party RSL Regional Screening Level SAP Sampling and Analysis Plan
SEFC Southeast Federal Center SEM Sequentially Extracted Medals
SF Slope FactorSGT Silica Gel Treated
SLERA Screening Level Ecological Risk Assessment SOW Scope of Work
SPAWAR Space and Naval Warfare Systems Center, San Diego SQuiRTs NOAA Screening Quick Reference Tables
SSC Site Screaming Levels SUF Site Use Factor (Unitless)
SPMD Semi-Permeable Membrane Devices SVOC Semivolatile Organic Compounds
2,3,7,8-TCDD 2,3,7,8-Tetrachlorodibenzo-p-Dioxin TAL Target Analyte List
TAM Tidal Anacostia Model TBC To Be Considered TCL Target Compound List TDS Total Dissolved Solids
TMDL Total Maximum Daily Load TOC Total Organic Carbon TPH Total Petroleum Hydrocarbons TRV Toxicity Reference Values TSS Total Suspended Solids UCL Upper Confidence Limit URS URS Corporation
USACE United States Army Core of Engineers USACHPPM U.S. Army Center for Health Promotion and Preventative Medicine
USEPA United States Environmental Protection Agency USGS United States Geological Survey VDEQ Virginia Department of Environmental Quality
VOC Volatile Organic CompoundsWASP Water Quality Analysis Simulation Program
WASP5 EUTRO Water Quality Analysis Simulation Program Eutrophication Model WC Washington Channel
WGL Washington Gas Light Company

Remedial Investigation Work Plan Anacostia River Sediments Project
ix
WNY Washington Navy YardWP Work Plan XRF X-Ray Fluorescence
Remedial Investigation Work Plan Anacostia River Sediments Project
1
1.0 INTRODUCTION
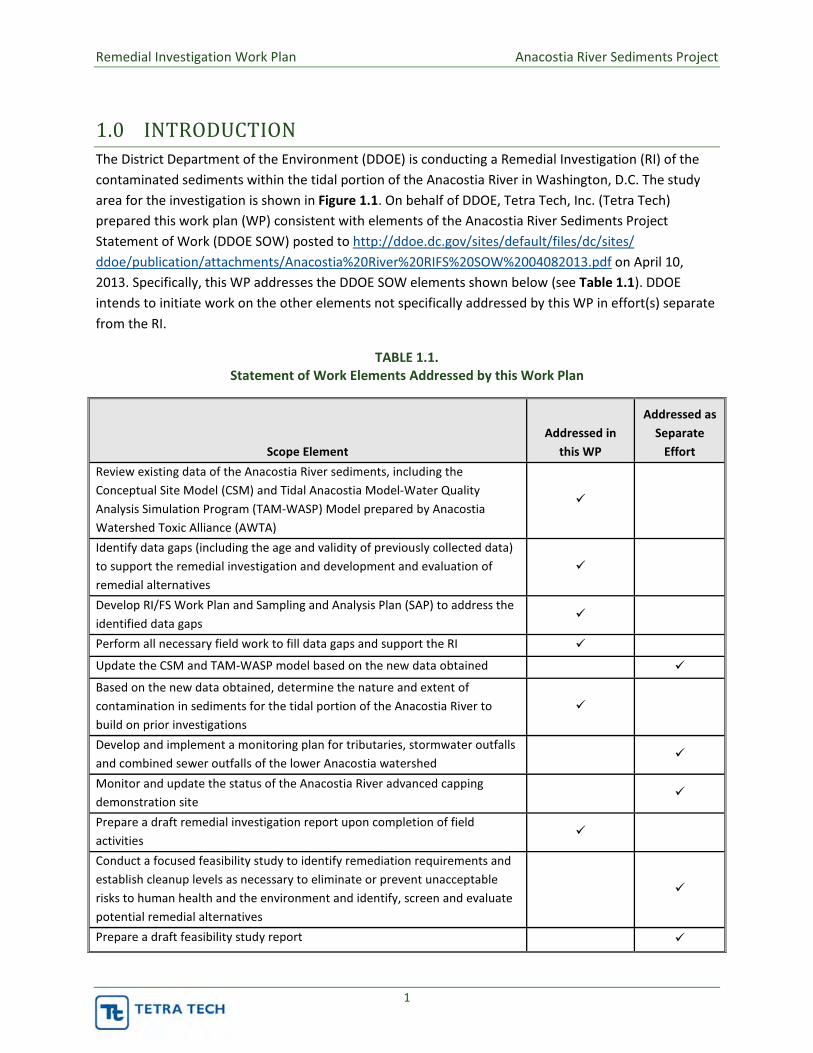
The District Department of the Environment (DDOE) is conducting a Remedial Investigation (RI) of the contaminated sediments within the tidal portion of the Anacostia River in Washington, D.C. The study area for the investigation is shown in Figure 1.1. On behalf of DDOE, Tetra Tech, Inc. (Tetra Tech) prepared this work plan (WP) consistent with elements of the Anacostia River Sediments Project Statement of Work (DDOE SOW) posted to http://ddoe.dc.gov/sites/default/files/dc/sites/ddoe/publication/attachments/Anacostia%20River%20RIFS%20SOW%2004082013.pdf on April 10, 2013. Specifically, this WP addresses the DDOE SOW elements shown below (see Table 1.1). DDOE intends to initiate work on the other elements not specifically addressed by this WP in effort(s) separate from the RI.
TABLE 1.1. Statement of Work Elements Addressed by this Work Plan
Scope Element Addressed in
this WP
Addressed as Separate
Effort Review existing data of the Anacostia River sediments, including the Conceptual Site Model (CSM) and Tidal Anacostia Model-Water Quality Analysis Simulation Program (TAM-WASP) Model prepared by Anacostia Watershed Toxic Alliance (AWTA)
�
Identify data gaps (including the age and validity of previously collected data) to support the remedial investigation and development and evaluation of remedial alternatives
�
Develop RI/FS Work Plan and Sampling and Analysis Plan (SAP) to address the identified data gaps �
Perform all necessary field work to fill data gaps and support the RI � Update the CSM and TAM-WASP model based on the new data obtained � Based on the new data obtained, determine the nature and extent of contamination in sediments for the tidal portion of the Anacostia River to build on prior investigations
�
Develop and implement a monitoring plan for tributaries, stormwater outfalls and combined sewer outfalls of the lower Anacostia watershed �
Monitor and update the status of the Anacostia River advanced capping demonstration site �
Prepare a draft remedial investigation report upon completion of field activities
�
Conduct a focused feasibility study to identify remediation requirements and establish cleanup levels as necessary to eliminate or prevent unacceptable risks to human health and the environment and identify, screen and evaluate potential remedial alternatives
�
Prepare a draft feasibility study report �

Remedial Investigation Work Plan Anacostia River Sediments Project
2
This WP serves as the primary planning document governing characterization of river surface water, biota, and sediments (including the potential effects of groundwater seepage) for the purpose of completing the RI. Other planning documents associated with this WP prepared under separate cover include a field sampling plan (FSP), quality assurance project plan (QAPP), community involvement plan (CIP), project management plan (PMP), and health and safety plan (HASP). As requested by DDOE, the WP also addresses the environmental media characterization requirements associated with preparing a Natural Resources Damage Assessment (NRDA) for the river.
1.1 Objective Consistent with the RI and NRDA processes, the objectives of this WP include the following:
� Determine the nature and extent of contaminated environmental media (surface water, sediment, groundwater seepage, and biota) in a manner consistent with the National Oil and Hazardous Substances Contingency Plan (NCP) 40 C.F.R. Part 300 and all applicable guidance and assess the associated risk to human health and the environment.
� Reduce overall costs for NRDA and RI field characterization by coordinating the NRDA and RI characterization sampling efforts to the extent practicable at this stage of the investigation.
� Collect site data to characterize general site conditions to support the completion of the feasibility study (FS) if needed to address unacceptable risk to human health and the environment.
1.2 Regulatory Background As required by the DDOE SOW, this WP was prepared consistent with the RI process established in accordance with the Comprehensive Environmental Response, Compensation, and Liability Act (CERCLA) as amended and the implementing regulations in the NCP, and Section 401(a)(2) of the District of Columbia Brownfield Revitalization Act of 2000. The United States Environmental Protection Agency (EPA) guidance document, Guidance for Conducting Remedial Investigations and Feasibility Studies under CERCLA (EPA 1988) served as the primary resource for this effort.
A NRDA process is used to determine whether natural resources have been injured and to calculate damages needed to restore or compensate the public for the injured resources. As defined in the CERCLA statute, NRDA is separate from the RI process in that it focuses on injury and restoration of public resources. However, careful planning prior to sampling can integrate data collection so that much of the data collected during an RI can be used to support the NRDA process.
In addition to the above noted regulatory citation, the other relevant regulatory citations for the CERCLA and NRDA processes include 42 U.S.C. §§ 9601-9675, Executive Order 12580 and NRDA Regulations at 43 C.F.R. 11, Code § 8-632.01(b)(4) (allowing the District to recover for injury to, destruction of, or loss of natural resources, including the reasonable cost of assessing the injury, destruction, or loss resulting from the release of the hazardous substance), and 43 C.F.R. §§ 300.600 to 300.615 (trustees for natural resources).

Remedial Investigation Work Plan Anacostia River Sediments Project
3
1.3 Natural Resources Damage Assessment Strategy Tetra Tech will integrate initial data collection for the NRDA with sampling and analysis for the RI, especially the ecological and human health risk assessments. Specifically, DDOE will attempt to collect data that will be useable once the NRDA is performed at a later date. Concurrent planning and sampling for the RI and NRDA saves time and money by eliminating multiple mobilizations and duplicate sampling. For example, fish, turtle, and invertebrate tissue concentrations and sediment toxicity data are used in both risk assessment and NRDA. Although Tetra Tech will optimize data collection for the NRDA during the RI field activity, the formal NRDA will be conducted at a later date pursuant to a separate work plan. Additional discussion regarding the NRDA process is provided in Section 9.0.
1.4 Scope The current focus of the RI and NRDA is the tidal Anacostia River from its confluence with the Potomac River to its upper tidal limit at the confluence of Northeast Branch and Northwest Branch (Figure 1.1). By definition, the upper tidal limit is the upstream limit of tidal influence in the river. As a result of initial colonial era settlement and subsequent urbanization, the shoreline and channel have been significantly altered from predevelopment conditions. For the purposes of this WP, the scope includes the tidal river from bank to bank and excludes adjacent wetlands and floodplain surface soil. In addition, the surface soils on Kingman and Heritage Islands, mid-channel manmade islands located approximately 3.5 miles from the mouth, are considered to be similar to the floodplain soil and are, therefore, also excluded from this WP. The final boundaries of the study area will be based on the findings of the RI, and will be documented by DDOE in a record of decision (ROD) when the final remedy is selected. It should be noted that, based on the results of the tidal river investigation, additional future investigations, not covered by this work plan, may be performed in the river wetlands and floodplain.
Environmental investigation and cleanup work is completed, underway, or contemplated at multiple environmental cleanup sites bordering the tidal Anacostia River (Figure 1.1). From upstream to downstream, these sites include the following:
� Kenilworth Park Landfill � Pepco Benning Road Facility � CSX Benning Yard � Steuart Petroleum Company Terminal Adjacent to the Washington Gas Light Company (WGL)
East Station Site � WGL East Station � Washington Navy Yard � Active Capping Pilot Study Site at O Street Combined Sewer Outfall (CSO) � General Services Administration (GSA) Southeast Federal Center (SEFC) � Former Steuart Petroleum Company/Hess Oil Corporation(Hess)/Gulf Oil Corporation (Gulf)
Former Petroleum Terminals � Joint Base Myer – Henderson Hall (Fort McNair) � Joint Base Anacostia – Bolling � Firth – Sterling Steel Company

Remedial Investigation Work Plan Anacostia River Sediments Project
4
If a Responsible Party (RP) is engaged in site cleanup activity at one of these sites, it is anticipated that the RP will also address sediment contamination in the adjacent impacted segment of the river channel, as warranted. The sampling approach for this WP incorporates the work already completed or planned at the known environmental cleanup sites. As such, although the sampling locations presented in this WP are defined broadly throughout the study area, some locations are also identified adjacent to the environmental cleanup sites (see Figure 1.1).
Figure 1.1 shows the portions (or Areas of Influence [AOI])of the tidal Anacostia River that could potentially be impacted by any contamination present on these sites. The AOIs are based on the contamination Areas of Concern (AOCs) identified by the AWTA in the “Charting a Course for the Cleanup of the Anacostia River” document (AWTA 2002). The AOCs were adjusted using the hotspots defined in the 2009 “White Paper” document also prepared by AWTA (AWTA 2009). If more detailed information was unavailable from the AWTA documents regarding the areas of sediment contamination, as a default AOI for these sites, AOI boundaries were extended to include the near shore sediments adjacent to the riverside boundary of each site.
1.5 Community Relations DDOE is committed to public participation at every phase of the Anacostia River cleanup through an open process that encourages affected communities and interested organizations to provide input on the critical issues related to the site cleanup. DDOE has prepared a CIP (Tetra Tech 2013a) for the Anacostia contaminated sediments project. As noted above, the CIP is a companion document to this WP. The CIP describes the process the District and Tetra Tech will use to engage in dialogue and collaborate with communities and other key stakeholders. Overall, the goals for the community involvement program are as follows:
� Provide the public with accurate, timely, and understandable information and/or access to the information needed to understand the project as it moves forward;
� Provide the public with the opportunity to give informed and meaningful input; � Ensure adequate time and opportunity for the public to provide input to be considered; � Respect and give full consideration to the community input; � Assist the public in understanding the project decision-making process during the project design
and cleanup and the community’s role in that process; and � Provide consistency with CERCLA and the National Contingency Plan (NCP).
1.6 Work Plan Organization In addition to this introduction, the WP includes ten sections. Tables and figures cited in each section are provided at the end of the section. A brief description of each is provided below.
Section 1.0 – Introduction. This section discusses the study objectives, regulatory context, project scope, and community involvement strategy for the Anacostia River Sediments RI.
Remedial Investigation Work Plan Anacostia River Sediments Project
5
Section 2.0 – Site Background and Physical Setting. This section provides information regarding site location, history, geology, hydrogeology, and sediment transport regimes. In addition, Section 2.0 summarizes the key previous investigations and assesses data usability.
Section 3.0 – Preliminary Conceptual Model. The preliminary CSM discussion in this section includes an assessment of the constituents of concern (COC) in the investigation and describes contaminant sources, migration pathways, and potential human health and ecological receptors.
Section 4.0 – Work Plan Rationale. This section presents the data quality objectives (DQO) for the sediment investigation. In addition, the results of evaluations of the existing sediment (shallow and deep), surface water, fish tissue, and benthic community condition data are presented along with the results of a review of contaminant sources to the tidal Anacostia River. This section identifies the key remaining data gaps that will be addressed during the field phase of the RI.
Section 5.0 – Remedial Investigation. This section discusses the proposed sampling for the field investigation to fill identified data gaps (those identified in Section 4.0) for the RI and NRDA. Maps showing the proposed sampling locations are provided and discussed.
Section 6.0 – Data Evaluation and Reporting. Section 6 discusses the approach for managing, validating, evaluating, and reporting the data collected.
Section 7.0 – Ecological Risk Assessment. The process used to perform screening level and baseline ecological risk assessments (ERA) is discussed.
Section 8.0 – Human Health Risk Assessment. The process used to perform a human health risk assessment (HHRA) is discussed.
Section 9.0 – Natural Resources Damage Assessment Process. An overview of the NRDA process is provided in this section.
Section 10.0 – Schedule. Section 10 presents the schedule for the investigation and major deliverables associated with the RI.
Section 11.0 – References. A listing of the documents cited.

%2%2
PEPCO
Poplar Point
Kenilworth Park Landfill North
Washington Navy YardSoutheast
Federal Center
Kenilworth ParkLandfill South
Washington Gas
CSX
CSX
Former Hess Oil Corporation and
Gulf Oil CorporationBulk Oil Facilities
Steuart Petroleum
Firth-SterlingSteel
JBABJBABJBABJoint BaseAnacostia-Bolling
Fort McNair
Piney Run
Watts Branch
Nash Ru n
Dueling Creek
Pope Branch
Hickey Run
Fort Dupont Creek
Northwest Branch Anacostia River
Northeast B
ranch Anacostia
Rive
r
Lower Beaverdam Creek
Legend%2 O Street Outfall
SEDIMENT STUDY AREA
CLEANUP SITE BOUNDARY(LAND BASED PORTION)
CLEANUP SITEAREA OF INFLUENCE
WASHINGTON DC BOUNDARY
WASHINGTON SHIP CHANNEL
WETLANDS ®0 1,500 3,000
FeetSOURCE: MODIFIED FROM CH2MHILL, 2011,DCGIS, 2012, AND USFWS, 2012.
FIGURE 1.1SITE LOCATION MAP
Dat
e Sa
ved:
5/1
5/20
14 9
:34:
45 A
M U
ser:
joel
.pet
ers
Pat
h: S
:\CA
DD
\S\2
592\
mxd
\Wor
kPla
n\Fi
gure
_01_
01_A
naco
stia
_11x
17_S
ITE_
LOC
ATIO
N.m
xd
ANACOSTIA RIVERSEDIMENTS PROJECT
M A R Y L A N D
M A R Y L A N D
V I R G
I N I A
11th Street Bridge
PennsylvaniaAvenue SE Bridge
CSXBridge
East CapitolStreet Bridge
Benning RoadBridge
New York Ave/Amtrak Bridge
South CapitolStreet Bridge
KingmanLake
Anacostia RiverNortheast Branch
Anacostia RiverNorthwest Branch
LowerBeaverdamCreek
HeritageIsland
POTOMAC RIVER
ANACOSTIA RIV ER
DuelingCreek
DRAFT
KingmanIsland
WashingtonShip Channel
HickeyRun
Note: The Cleanup Site Boundaries (Land Based Portion) for the Washington Navy Yard are reflective of its historic extent.
PineyRun
WattsBranch
NashRun
Fort ChaplainTributary
Fort DupontCreek
PopesBranch
Fort DavisTributary
Texas AvenueTributary
Fort StantonTributary
StickfootCreek

Remedial Investigation Work Plan Anacostia River Sediments Project
6
2.0 SITE BACKGROUND AND PHYSICAL SETTING
This section provides background information and discusses the physical setting of the tidal Anacostia River study area. Following a general description of the site and location in Section 2.1, Sections 2.2 through 2.5 discuss site history, geologic setting, hydrogeology and hydrology, and sediment transport regimes. Section 2.6 summarizes the key previous and ongoing investigations in the study area. The usability of the data generated in the previous site investigations is assessed in Section 2.7.
2.1 Site Location and Description The Anacostia River drains an area of approximately 176 square miles (456 square kilometers) in Montgomery and Prince George’s Counties in Maryland and Washington, DC. The study area for this investigation (Figure 1.1) includes the approximately nine mile tidal portion of the river which begins at the confluence of Northwest Branch and Northeast Branch near Bladensburg Marina in Prince George’s County and extends downstream to the confluence of the Anacostia and Potomac rivers. The study area also includes the Washington Channel, an approximately 2.0 mile long channel extending northward from the mouth of the Anacostia at its confluence with the Potomac River. Haines Point separates the Washington Channel from the Potomac River. The upstream terminus of the Washington Channel is at the Tidal Basin, adjacent to the National Mall.
Section 303(d) of the federal Clean Water Act requires states to identify waters that fail to comply with water quality standards. A total maximum daily load (TMDL) is required for each exceeding substance. For the tidal Anacostia River, TMDLs have been established for polychlorinated biphenyls (PCBs), biochemical oxygen demand (BOD), bacteria, organics, metals, sediment, oil and grease, and trash (www.mde.state.md.us/programs/Water/TMDL/ApprovedFinalTMDLs/Pages/Programs/WaterPrograms/TMDL/approvedfinaltmdl/tmdl_final_anacostia_nutrients.aspx). The currently established 303(d) listing of TMDLs for several toxic constituents (PCBs, Polycyclic Aromatic Hydrocarbons [PAHs], and Organic Chlorine Pesticides [OCPs]) is based on limited data (Tetra Tech 2013c). As such, EPA and DDOE are currently conducting additional sampling of several Anacostia tributaries and will use the sampling results to support review and revision of the established TMDLs.
2.2 Site Dredging History Elevated sedimentation rates have characterized the tidal Anacostia since colonial times. Beginning in the early 1600s, the dense hardwood forests originally present in the watershed were cleared for tobacco farming, leading to increasing erosion in the upland watershed and sedimentation in the estuary. In 1742 a port was established in Bladensburg to support the tobacco industry. By 1830, however, the port had become unusable because of channel siltation (United States Army Corps of Engineers (USACE) 1993). Several dredging events of the port were completed by the late 1800s.
Dredging of the Anacostia River has been ongoing with the destruction and reconstruction of wetlands during urbanization of the river over the past 100 years. USACE has been responsible for the dredging of the tidal Anacostia from the Potomac River in Washington DC to Bladensburg Maryland since the late 1890s (United States Geological Survey [USGS] 2009). Dredging is reported to be performed once every

Remedial Investigation Work Plan Anacostia River Sediments Project
7
two years (AWTA 2002). Expanded dredging operations occurred between 1910 and 1920 in response to concerns regarding mosquito-borne disease in communities near the mudflats that had formed upstream from the CSX railroad bridge. During this dredging campaign, the spoils generated were used to build Kingman Island and Heritage Island and form Kingman Lake.
Also during the 1916 timeframe, stone seawalls were constructed along the banks of the river with the area behind the seawall backfilled with dredge spoils. The construction of the seawalls eliminated almost all the tidal wetlands on the river with the exception of wetlands at the Kenilworth Park and Aquatic Gardens (USGS 2009). The area along the seawall bordering the eastern bank of the river was designated Anacostia Park (National Park Service (NPS) 2014). The seawall, particularly in upper reaches, has failed or is failing resulting in tidal influx through the resulting breaches and localized, limited reestablishment of wetlands.
Urbanization in the District and in neighboring Prince George’s and Montgomery Counties accelerated in the 1940s and is ongoing. As discussed in more detail in Section 2.5, elevated sedimentation rates persist through the present time (USACE 1993).
In 1955 Congress approved reclamation and development work on the Anacostia including dredging Kingman Lake, dredging the river channel to Bladensburg, building seawalls, filling in low-lying areas with dredge material, and installing tidal gates (USACE 2011) on outfalls. In 1959 channel dredging and other improvements were completed.
Beginning in the early 1990s, some dredging was performed in association with wetlands restoration efforts focused on the reestablishment of the tidal freshwater marsh habitat that historically bordered the Anacostia River (USGS 2009). The USACE estimates that approximately 2,500 acres of tidal emergent wetlands have been destroyed in the Anacostia River between Bladensburg and the confluence with the Potomac River. This represents a 90 percent reduction from pre-urbanization conditions. Less than 100 acres of tidal emergent wetlands currently exist, including the restored Kenilworth Marsh. USACE completed several freshwater tidal wetland reconstructions on the Anacostia River between the early 1990s and the early 2000s. The restorations included the expansion of Kenilworth Marsh by 32 acres, the restoration of 42 acres of Kingman Marsh, and the restoration of six acres of Lower Kingman Island Fringe Wetlands. The wetlands were established through the placement of dredge sediment material from the Anacostia River, through hydraulic dredging, to increase elevations to support emergent vegetation (USGS 2009).
Dredged Anacostia River sediment that was used to restore Kenilworth Marsh was sampled shortly after placement at the marsh in 1993, and both sediment solids and sediment pore water exhibited evaluated concentrations of trace metals and various toxic contaminants. A 1998 document prepared by the U.S. Fish and Wildlife Service (Murphy et al. 1998) reports elevated levels of chromium, copper, lead, nickel, total PCBs, total dichloro-diphenyl-trichloroethane (DDT), and total chlordane in sediments, killifish tissue, and cattails in Kenilworth Marsh. Concentrations in these media were elevated relative to a regional reference location and to national averages. The report attributed the contamination to the use of dredged Anacostia River sediments that were used to restore the marsh and recommended that

Remedial Investigation Work Plan Anacostia River Sediments Project
8
in the future, dredge spoils from the Anacostia should be sampled and the results evaluated prior to their use for wetlands reclamation (Murphy et al. 1998).
Other dredging activity in the lower portion of the Anacostia (south of the CSX railroad bridge) included periodic dredging of the Washington Ship Channel. The following summary regarding Washington Ship Channel and Washington Navy Yard dredging is taken from the Washington Navy Yard RI report (CH2M Hill 2011a). The Washington Ship Channel was constructed to provide larger vessel access upstream to the foot of 15th Street Southeast, just downstream from the Pennsylvania Avenue Bridge. The channel width ranges from 800 to 400 feet and the depth ranges from 16 to 22 feet. The earliest dredging of the Washington Ship Channel occurred in the late 1800s. The most recent dredging of the channel occurred in 1985 and up to six feet of sedimentation has occurred in some portions of the dredged channel since that time. The area adjacent to the Washington Navy Yard piers was dredged in approximately 1965 to a depth of 24 to 26 feet below water surface (CH2M Hill 2011).
The maintenance of Washington Ship Channel and the lower reach of the Anacostia River, by USACE has been ongoing since 1935. The channel includes turning basins opposite the Washington Navy Yard (800 feet wide and 2400 feet long) and near the mouth of the Anacostia River (400 square feet).
2.3 Geologic Setting The Washington, DC area straddles the Fall Line, a northeast-trending physiographic boundary separating the Piedmont province to the west from the Coastal Plain province to the east. The Piedmont is underlain by deeply weathered metamorphic and igneous rocks dipping to the southeast at about 125 feet per mile (Johnston 1964). In the study area, these units are overlain by an eastward thickening wedge of unconsolidated Coastal Plain deposits (Johnston 1964). The study area encompassing the tidal Anacostia River and Washington Channel is entirely underlain by Coastal Plain deposits.
Table 2.1 shows the geologic column for the study area. The Coastal Plain formations range in age from Cretaceous to Recent (Cooke 1952). From youngest to oldest, these units consist of fill material, Quaternary sediments, and Cretaceous age formations belonging to the Potomac Group. The Potomac Group is underlain by Paleozoic age metamorphic and igneous rocks collectively known as basement rock. In the study area, basement rock is encountered at a depth of approximately 400 feet below ground surface (Johnston 1964). The Quaternary deposits include natural river channel and over bank deposits consisting of sand, silt, and clay which generally coarsen toward the upstream limit of the tidal channel and where outfalls and tributaries enter the main stem. In addition to these deposits, dredge spoils (as noted above) and random fill have been used to extend upland areas into the river and adjacent wetlands. Random fill typically consists of building rubble, heterogeneous soils, and other miscellaneous materials.
Underlying the fill and recent deposits are the formations that collectively comprise the clay and silt facies of the Potomac Group. This facies includes the Arundel Clay and the Patapsco Formation which are undifferentiated in the District (D.C. Water Resources Research Center [DCWRRC] 1993). The clay and silt facies is underlain by the sand and gravel facies of the Potomac Group. The thickness of the both Potomac Group facies in tidal Anacostia River vicinity is approximately 350 feet (Koterba, Dieter, and
Remedial Investigation Work Plan Anacostia River Sediments Project
9
Miller 2010). The clay and silt facies is described as silty clay with interbedded irregular sand and gravel lenses (DCWRRC 1993). Where the Potomac Group attains greater thickness to the east and northeast of the District, this facies is differentiated into an upper, coarser grained unit (Patapsco Formation) and an underlying finer grained unit (Arundel Clay). The sand and gravel facies consists of gravel, sand, and arkosic sediments with occasional sandy clay lenses. This unit correlates with the Potomac Group Patuxent Formation (DCWRRC 1993).
2.4 Hydrogeology and Hydrology This section provides a brief summary of the hydrogeology of the study area and the hydrology of the tidal Anacostia River.
Hydrogeology. The hydrostratigraphic units in the study area include, with increasing depth, perched groundwater units, the water table aquifer, the Potomac Group confining unit, and the Patuxent aquifer (Table 2.1). In the study area, perched groundwater may occur as isolated shallow saturated zones occurring within a depth of six feet below ground surface (DCWRRC 1993). The water table aquifer occurs in the saturated portions of the various permeable units present adjacent to and, in some cases, extending beneath the river channel. Depending on location, the geologic units that comprise the water table aquifer include the random fill units, Quaternary deposits, and Patapsco Formation sediments. The Potomac confining unit, corresponding to the Potomac Group clay and silt facies, is a confining unit separating the water table aquifer and the deeper Patuxent aquifer. As reported by Ecology and Environment, Inc. (2008), the Patuxent aquifer is confined in the study area vicinity. At a National Arboretum aquifer test well located approximately 0.5 miles northeast of the site, the static water level was 12 feet higher than the ambient water table elevation at the Kenilworth Park South Landfill site, an environmental cleanup site located nearby and adjacent to the river (Ecology and Environment 2008).
A review of the site characterization results from three cleanup sites located along the tidal Anacostia reveal general characteristics regarding the hydrogeology of the water table aquifer in the immediate vicinity of the Anacostia River. The three sites include the Kenilworth Park South Landfill (Ecology and Environment 2008), CSX Benning Yard (EnviroScience 2013), and the Washington Navy Yard (CH2M Hill 2011a). At each site, the lithology of the water table aquifer is quite diverse, ranging laterally and vertically from fill material unique to the each site to alluvium/dredge spoil to coarse grained Quaternary deposits. Interbedded lower conductivity units, primarily consisting of alluvium or alluvium-derived dredge spoil result in the presence of perched or confined groundwater of local extent. At each site, groundwater discharges to the Anacostia River. Tidal influence on water table aquifer groundwater level fluctuations is muted and restricted to wells in close proximity to the river.
Hydrology. Tidal influences in the Anacostia River extend throughout the study area and into the Northeast Branch and Northwest Branch for approximately one mile beyond the upstream limit of the study area. The average variation of the river’s water surface over a tidal cycle is three feet (Behm et al. 2003). Tidal level changes occur as a standing wave (AWTA 2002), meaning that tidal changes occur nearly simultaneously throughout the estuary. The entire estuary, however, is freshwater (Behm et al. 2003). The following physical description of the river is excerpted from the document “TAM/WASP Toxics Screening Level Model for the Tidal Portion of the Anacostia River” (Behm et al. 2003):

Remedial Investigation Work Plan Anacostia River Sediments Project
10
From an analysis by the National Oceanographic and Atmospheric Administration (NOAA) of sounding data taken by the US Army Corps of Engineers prior to a 1999 dredging project combined with additional bathymetry data taken by the Navy in the summer of 2000, the volume of the tidal portion of the river at mean tide is approximately 10,000,000,000 liters (2,642,000,000 gallons), with a surface area of approximately 3,300,000 square meters (m2) (35,521,000 ft2). The width of the river varies from approximately 60 meters (m) (196 ft) in some upstream reaches to approximately 500 m (1,640 ft) near the confluence with the Potomac, and average depths across channel transects vary from approximately 1.2 m (3.9 ft) upstream of Bladensburg to about 5.6 m (18.3 ft) just downstream of the South Capitol Street Bridge. The average daily combined discharge of the Northeast and Northwest Branches into the tidal river is approximately 370,000,000 liter/day. During non-storm conditions, measured flow velocities during the tidal cycle have been in the range of 0 to 0.3 m/sec (0 – 1 ft/sec) (Katz et al. 2000; Schultz and Velinsky 2001).
The Northeast Branch and Northwest Branch account for approximately 77 percent (Warner et al. 1997) of the total discharge of the Anacostia River with the balance of the flow originating from tidal tributaries, storm sewer outfalls, combined sewer system (CSS) outfalls, overland flow, groundwater seepage, and precipitation. River current velocities and mixing are also discussed by Behm et al. (2003). An investigation by the Space and Naval Warfare Systems Center, San Diego (SPAWAR) (Katz et al. 2001) found that current velocities were primarily directed along the axis of the channel, were relatively homogeneous throughout the water column, and were relatively low. The maximum observed velocity over a tidal cycle (30 cm/sec [1.0 ft/sec]) was measured in the vicinity of the CSX railroad bridge located approximately 3.5 miles upstream from the mouth. The lowest velocity (10 cm/sec [0.33 ft/sec]) was measured downstream from the South Capitol Street Bridge, 1.5 miles from the mouth. Currents were directed primarily along the axis of the channel and homogeneous throughout the water column; cross-channel currents were negligible. AWTA (2002) estimates that the flushing time for the tidal channel averages 23 to 28 days.
2.5 Sediment Transport Regimes The major physical processes that determine sediment contaminant fate and transport are bed load transport and deposition, sediment burial, and sediment resuspension in the water column. AWTA (2002) provides a general assessment of how these processes interrelate along the tidal Anacostia River and the following discussion summarizes this evaluation. The bulk of sediment transported to the estuary enters where Northeast Branch and Northwest Branch join to form the tidal Anacostia River. Scatena (1986) estimates the sediment contribution from these two tributaries to be 85 percent of the total load delivered to the estuary. Below the Northeast Branch – Northwest Branch confluence, the current is too slow to transport the coarser grain size fractions so these materials deposit in an accretion zone just downstream of the confluence. Finer silt and clay size material, however, remain suspended and continue downstream.

Remedial Investigation Work Plan Anacostia River Sediments Project
11
For the approximately 5.5 mile stretch of channel from Bladensburg south to the CSX Railroad Bridge, AWTA characterizes the sediment transport regime as akin to a “conveyor belt” in which fine sediments move downstream in suspension without net deposition or erosion. Localized deltas of coarser grained sediments occur where outfalls and tributary streams discharge to the main channel. Between the CSX Railroad Bridge and the 11th Street Bridge, the sediment transport regime is transitional from general equilibrium transport to total deposition. Here, transport or deposition may dominate depending on local variations in current speed. Below the 11th Street Bridge, the river channel widens and deepens and, as a result of decreased flow velocity, the sediment regime is dominated by total deposition.
Hydrodynamic and sediment contaminant transport modeling suggests that 90 percent of the sediment delivered to the tidal Anacostia River is trapped and deposited (AWTA 2002). A study of cores taken offshore from the Poplar Point environmental site estimates that the deposition rate in this portion of the river ranges between 3.0 and 7.0 centimeters per year (cm/yr) (Velinsky et al. 2011).
2.6 Previous Environmental Investigations and Ongoing Activities The Anacostia River has been the subject of numerous previous investigations dating back to the 1980s. This section summarizes the previous specific investigations considered in the development of this WP. In general, each investigation focused on a particular medium, including surface sediment, subsurface sediment, surface water, fish tissue, or bioaccumulation by benthic invertebrates. Some previous sediment sampling investigations covered the entire study area while others focused on a limited area such the portion of the channel bordering one of the upland environmental sites noted in Section 1.4. Site-wide investigations of effects on fishes and benthic organisms have also been conducted (McGee et al. 2009; Pinkney et al. 2003; Pinkney 2009, 2013).
2.6.1 Site-wide Investigations As a result of general concern regarding the poor quality of the Anacostia Watershed and to coordinate an overall strategy for cleanup, the EPA Office of Solid Waste and Emergency Response (OSWER) convened in 1999 the AWTA, a public and private consortium of government agencies, institutions, and private stakeholders. As stated on the AWTA website http://mapping.orr.noaa.gov/website/test/anacostia/guide/home/awta.html, AWTA’s mission is “to work together in good faith as partners to evaluate the presence, sources, and impacts of chemical contaminants on the Anacostia River with all stakeholders, both public and private, plus other parties, and to evaluate and take actions to enhance the restoration of the river to its beneficial use to the community and ecosystem as a whole.” AWTA is currently disbanded. As a member institution of the AWTA, the NOAA Assessment and Restoration Division (ARD) developed the Anacostia River Watershed Database and Mapping Project (NOAA database).
The NOAA database serves as a publicly accessible, geospatially-referenced data repository for the environmental data generated during key environmental investigations, past and present, conducted in the Anacostia Watershed. The NOAA database was used as the starting point for the development of a project database to support the development of this WP. The database was updated with the sampling results from two recently completed investigations including the work completed at the Washington
Remedial Investigation Work Plan Anacostia River Sediments Project
12
Navy Yard and CSX Benning Yard. Available fish tissue concentrations and benthic invertebrate condition data were also added to the project database.
Table 2.2 lists the previous investigations for which data are available in the project study area for the various environmental media. In addition, Table 2.2 indicates the 11 previous investigation datasets that are included in the project database. Figure 2.1 shows the spatial distribution of the surface sediment data for each of the previous investigations considered. Specific reference information for each investigation is shown in the table if this information was attainable. The table also shows the numbers of samples by environmental medium available from each study. The key investigations included in the review are summarized below. Data usability for the data retained for WP development is discussed in Section 2.7.
Academy of Natural Sciences (ANS), 2000 (Velinsky and Ashley 2001). A total of 134 surface sediment samples were collected providing reasonably good spatial coverage for the entire tidal Anacostia River and the Washington Channel. Samples were analyzed for PCB congeners, pesticides, semivolatile organic compounds (SVOCs) including priority pollutant (PP) PAHs, and selected metals.
Phelps, H. L., 2001 (and other studies). Asiatic clams were translocated from a presumably clean site in the Potomac River to Bladensburg Marina and the O Street CSS outfall near the Southeast Federal Center. The objective of the study was to use Asiatic clams as a surrogate to evaluate the bioavailability of sediment contaminants in benthic organisms. Details regarding this investigation are available in Section 4.2.5.1.
U.S. Fish and Wildlife Service (Pinkney et al., 2001 and Pinkney 2009). Fish tissue (fillets) sampling was conducted in two reaches of the Anacostia River designated as upper (north of the CSX Railroad Bridge) and lower (south of the CSX Railroad Bridge). This investigation focused on evaluating contaminant levels in the tissues of fish species typically caught and consumed by anglers. A description of this investigation is provided in Section 4.2.5.2.
DDOE, Ongoing. As a requirement of the District of Columbia Municipal Separate Storm Sewer System (MS4) National Pollutant Discharge Elimination System (NPDES) permit issued by EPA, DDOE historically conducted routine wet and dry weather sampling of nine stations in the Anacostia River watershed (Hawkins 2009). Under the latest MS4 Permit (issued October 2011), sampling is occurring at two stations in the Anacostia watershed on an interim basis. DDOE is in the process of developing a revised monitoring framework which is scheduled to be completed by May 2015. According to sampling protocol, storm water samples are to be collected during the first two hours of a storm event. The water is analyzed for BOD, total dissolved solids (TDS), total suspended solids (TSS), various inorganics, 13 metals, hardness, 2,3,7,8-tetrachlorodibenzo-p-dioxin (2,3,7,8-TCDD), and bacteria (fecal coliform and fecal streptococcus).
DDOE Division of Fisheries and Wildlife conducts fish tissue surveys (with United States Fish and Wildlife Service [FWS]) about every five years to evaluate the need for fish consumption advisories, which have been in place on the Anacostia River since the late 1980s. Consumption advisories are in place because concentrations of PCBs and pesticides in fish tissue warrant institutional controls to protect human
Remedial Investigation Work Plan Anacostia River Sediments Project
13
health (Pinkney 2009). Fish tissue concentrations in samples collected in 2013 to update the consumption advisory will be incorporated into the HHRA. No additional fish samples will be collected under the RI to support the HHRA.
U.S. Environmental Protection Agency, Ongoing. In partnership with DDOE, EPA is conducting a review of TMDL determinations in the Anacostia River, Potomac River, Rock Creek, and selected tributaries to these streams (Tetra Tech 2013). The investigation involved a review of previously collected water, sediment, and fish tissue data from these waterbodies. This review has been completed as of the date of this work plan. Based on the results of this review, EPA is conducting, beginning in the third quarter of 2013, monitoring of 29 locations to assess the TMDL for the COCs. Fourteen of the locations are sited along the Anacostia River or one of its tributaries. Sampling will occur during one dry and two wet periods for the Anacostia River and tributaries and during one dry period for the Potomac River tributaries and Rock Creek tributaries. Sampling locations with any parameters above the applicable water quality criteria will be evaluated during TMDL development for the waterbody.
2.6.2 Site-Specific Investigations As noted in Section 1, investigations are completed, ongoing, or contemplated at 13 environmental sites that border the river. The current regulatory status of each site, as presented in the DDOE SOW is summarized below. In addition, the available sediment characterization data are summarized. For sites with pending investigations, the planned sampling activities are discussed. Unless otherwise noted, with regard to PAH compound chemical analysis of environmental samples, the number of reported PAH compounds reported is assumed to be the 16 PP PAHs (see Section 3.1.1). Additional details regarding specific contamination issues at each site are provided in Section 3.
Kenilworth Park Landfill (The Johnson Company 2012). The Kenilworth Park landfill is a 130 acre site owned by the U.S. government and managed by the NPS, the lead agency carrying out CERCLA actions for the site. The site is located within Kenilworth Park and Aquatic Gardens, which is part of Anacostia Park. The site comprises two geographic areas divided by Watts Branch (a tributary of the Anacostia River), Kenilworth Park Landfill North (KPN) and Kenilworth Park Landfill South (KPS). Kenilworth Landfill was used as a dump from 1942 to 1968. During a portion of this period the landfill extended into the Anacostia River and no barriers were constructed to prevent migration of wastes mixed with soil into the water.
Between 1998 and 2009, a number of environmental investigations were undertaken to determine the nature and extent of contamination at the Kenilworth site, including Preliminary Assessment/Site Inspections (PA/SIs), Remedial Investigations (RIs), and supplemental data collection and associated reporting. The site has been divided into two operable units (OUs): OU1 comprises surface and subsurface soils, including the waste material disposed of within the landfill; OU2 is the shallow groundwater underlying OU1. In April 2012, NPS prepared a FS Report recommending a soil cap for OU1. On March 1, 2013, the Proposed Plan for Cleanup of the Kenilworth Park landfill site (OU1) was released for 60-day public comment period. However, as noted on the project website (www.nps.gov/nace/parkmgmt/kplspm.htm), NPS has decided to postpone selecting a final remedy for the landfill until more groundwater data are available. To ensure that contaminants are not being

Remedial Investigation Work Plan Anacostia River Sediments Project
14
transported from the landfill to the adjacent water bodies, NPS will collect additional groundwater data in 2014. The additional data will be used to supplement existing data in order to reevaluate whether the Anacostia River and adjacent surface water bodies may be at risk from contaminants originating from the wastes disposed in the landfill. The additional groundwater data also will be used to further inform the selection of the remedy for the landfill.
During the PA/SI conducted in 1998 by Ecology and Environment, Inc. (Ecology and Environment) (2008), 19 sediment samples were collected from the Anacostia River, 11 of which were located adjacent to the site. All samples were collected near the shoreline. The sampling occurred in two rounds. Samples from the first round were analyzed for PAHs, pesticides, PCB Aroclors, and metals while samples from the second round were analyzed for only PAHs, PCBs, and metals. EPA SW846 methods were used for all analyses with PAH, pesticide, PCB Aroclors, and metals analyzed via methods 8270C, 8081A, 8082, and 6010B, respectively.
The Kenilworth Landfill FS report (The Johnson Company 2012) summarizes the sediment sampling results from the Anacostia River in the vicinity of the site. The highest PAH concentrations observed in river sediments (13,780 and 12,900 ug/kg ) were from samples collected across from the site along the eastern bank of Kingman Island. The FS reported a variable distribution of PCB Aroclor concentrations in the Anacostia River with the maximum concentration (1,334 ug/kg, total Aroclors) observed in a sample collected near the east bank of the river downstream from the site. Other total Aroclor concentrations measured in river sediments near the site ranged from 15.5 to 499 ug/kg. Lead concentrations in river sediments adjacent to the site ranged from less than 40,000 to 177,000 ug/kg . The data indicated a slight upward trend from upstream to downstream (The Johnson Company 2012).
Pepco Benning Road (AECOM Technology Corporation [AECOM] 2012). The Pepco Benning Road facility is located at 3400 Benning Road NE, Washington DC. Pepco currently uses the 77 acre site to manage operations and maintain equipment associated with their electrical distribution system. Several PCB, petroleum, and metals releases to the environment occurred between 1987 and 2003 resulting from spills of contaminated oil or leaking equipment. Pepco performed cleanup activities in response to each of these releases in accordance with applicable legal requirements. Pepco prepared an RI/FS work plan pursuant to a consent decree that was entered by the U.S. District Court for the District of Columbia on December 1, 2011. After an extensive review and comment period, the work plan was approved by DDOE on December 28, 2012. Field work associated with the RI/FS was initiated in January 2013. Analytical results from this investigation were unavailable as of the release date of the WP for public comment (January 2014).
The sediments portion of the investigation will characterize sediment quality horizontally and vertically in the vicinity of the Pepco site. The investigation will cover an area of approximately 10 to 15 acres which will extend approximately 1,500 feet south and 1,000 feet north of the site. A total of 45 surface sediment samples will be collected near the site with 10 additional surface sediment samples collected for background characterization purposes. Surface sediment samples will be analyzed for PCB Aroclors, metals, PAHs, and acid volatile sulfides (AVS)/simultaneously extracted metals (SEM). Selected surface sediment samples (up to 20) will be analyzed for volatile organic compounds (VOCs), SVOCs, pesticides,

Remedial Investigation Work Plan Anacostia River Sediments Project
15
and polychlorinated dibenzo-p-dioxins (PCDDs) and polychlorinated dibenzofurans (PCDFs). In addition, up to eight samples will be analyzed for PCB homologs and/or congeners and PAH fingerprinting analyses.
Subsurface samples will be collected at three depths based on visual inspection at all 55 surface sediment sampling locations. Subsurface sediment will be accessed to a depth of eight to 10 feet via the vibracore drilling method. All subsurface samples will be analyzed for PCB Aroclors and PAHs. A subset of up to seven of the subsurface samples will also be analyzed for PCB homologs and/or congeners. Subsurface samples will also be analyzed for total organic carbon (TOC) and grain size.
Surface water samples will be collected at 20 locations from a depth of approximately one foot above the sediment surface. In addition to the measurement of field parameters (temperature, dissolved oxygen, pH, turbidity, and specific conductivity), samples will be laboratory-analyzed for PCBs, PAHs, hardness, and total and dissolved metals.
CSX Benning Yard (EnviroScience 2013). CSX Transportation (CSX) owns and operates Benning Yard located at 225 33rd Street, SE, Washington, DC. Benning Yard is an active railroad switching yard. Historically, a portion of Benning Yard was used to store and dispense diesel fuel to locomotives. In the 2004 timeframe, a new office building and parking facility were constructed in the area where fueling operations had previously been conducted. Subsurface hydrocarbon contamination was observed during this construction and, subsequently, it was determined that hydrocarbon-impacted groundwater was seeping into adjacent Fort Dupont Creek, a tributary to the tidal Anacostia River. Further investigations revealed the presence of a light nonaqueous phase liquid (LNAPL) plume in the water table aquifer and, on occasion, the presence of a petroleum sheen on Fort Dupont Creek. CSX submitted a corrective action plan to DDOE for cleaning up spill-contaminated soil and groundwater in April 2013.
A sediment investigation including Fort Dupont Creek and the Anacostia River was conducted in 2011. Surface sediment grab samples were collected at 18 locations on Fort Dupont Creek and 35 locations on the Anacostia River. Sediment core samples were collected at 18 of the surface sampling locations. All samples were analyzed for total petroleum hydrocarbons (TPH) diesel range organics (DRO) (Method 8015), VOCs (Method 8260), SVOCs (Method 8270), metals (Method 6020), pesticides (Method 8081), PCB Aroclors (Method 8082), TOC (Method 9060), oil and grease hexane extractable material, and TPH hexane extractable material silica gel treated (SGT). Anacostia River samples were also analyzed for 209 PCB congeners (EPA Method 1668) and PAH fingerprinting analyses. The total PAH analyses reported concentration results for 51 PAH compounds. Surface sediment and subsurface sediment samples were collected. Subsurface samples were collected from the depths of 0.5 to 1.0 foot, 1.0 to 2.0 feet, and 2.0 to 3.0 feet below the river bottom.
Sediment samples collected in the Anacostia River in close proximity to the Fort Dupont Creek Outfall were generally coarser in grain size and exhibited lower measured constituent concentrations. Within 150 feet of the outfall, total PAH concentrations in surface sediments range from less than 600 to more than 14,000 μg/kg. Concentrations away from the outfall generally exceed 12,000 μg/kg. Similarly, total PCB concentrations (sum of all congeners) were generally less than 100 μg/kg within 150 feet of the

Remedial Investigation Work Plan Anacostia River Sediments Project
16
outfall, while total PCB concentrations in the 300 to 800 μg/kg range were more typical out in the river channel and away from the outfall.
WGL Company Site (Hydro - Terra 1999). The WGL Company site covers an area of approximately 18 acres formerly containing the East Station manufactured gas plant. On September 26, 2012, WGL entered into a Consent Decree with the District of Columbia, Department of the Interior (DOI) NPS, and EPA to conduct additional landside and sediment studies. The 2012 Statement of Work (SOW) addresses the impacts to surface soil and subsurface soil (Operating Unit 1 [OU1]) as well as to groundwater, surface water, and river sediments (OU2). A draft Remedial Design/Remedial Action (RD/RA) Work plan for OU1 and a draft Remedial Investigation/Feasibility Study (RI/FS) Work plan for (Operating Unit 2 [OU2]) are under review by NPS and the DDOE.
Surface sediment samples were collected from the Anacostia River at seven locations adjacent to the WGL East Station site in 1996 (NOAA database). VOC concentrations ranged from 150 to 430 and averaged 260 μg/kg (EPA 1999). For total PAHs, concentrations ranged from 3,940 to 226,700 ug/kg. Total PAHs averaged 129,000 μg/kg (EPA 1999).
In accordance with the above noted 2012 scope of work that includes the OU2 RD/RA, WGL will conduct additional characterization of the nature and extent of site contamination in groundwater discharging to Anacostia River surface water and sediments (National Capital Parks – East 2011). Groundwater contamination and NAPL characterization will focus on the seawall portion of the site for the purpose of assessing preferential migration pathways to surface water and sediments.
WGL will also conduct a sediment investigation that will include a review of all existing data to identify data gaps, a bathymetric survey, a benthic organism study, the collection of pore water samples, and the delineation of the area and depth of contaminated sediment. Sediment sample analysis will include fingerprinting/forensic analysis of PAHs.
Poplar Point (Ridolfi Engineers 2003). The Poplar Point site is bordered to the north by the Anacostia River. Roadways, ramps and medians for the 11th Street Bridge form the northeast border of the site while roadways and medians for the South Capitol Street Bridge form the northwest edge of the site. The site is bordered to the south by Howard Road. The Poplar Point site encompasses an area of approximately 96 acres. The site includes former tree and plant nurseries that operated from 1927 to 1993. In addition, a separate portion of the site was used by the Navy as the Naval Receiving Station from 1942 through the 1960s (Ridolfi 2003a). In 1980, the Navy completed the decommissioning of this facility with the demolition or transferal of the remaining buildings to the NPS (Dolf 2001). Currently, the NPS is in the process of reviewing the draft RI/FS work plan. Following the approval of the WP, field activities will commence.
Anacostia River surface and subsurface sediments were sampled in the Poplar Point vicinity by Velinsky and others (2011). Sampling was conducted via vibracore to depths ranging from 13 to 16 feet below the sediment surface. Each coring location was from the undredged portion of the channel. Cores were subsampled at an interval of approximately one sample per each 1.3 – 1.5 feet and analyzed for metals,

Remedial Investigation Work Plan Anacostia River Sediments Project
17
PAHs, 100 PCB congeners, pesticides, grain size, and TOC. Cores were also sampled for lead and cesium isotopes for age dating purposes.
Results of the sampling showed that surface concentrations of total PAHs and total PCBs are lower than historical levels. The total PAH analyses reported concentration results for 41 PAH compounds. Surface sediment total PAH and total PCB concentrations were approximately 10,000 μg/kg and 200 μg/kg, respectively. Maximum total PAH concentrations ranged from 10,000 to 30,000 μg/kg with the peak occurring at depths ranging from 3.2 to 8.2 feet below the sediment surface. Maximum total PCB concentrations ranged from 1,700 to 3,000 μg/kg. Peak total PCB concentrations were observed at depths ranging from 3.2 to 13 feet below the sediment surface. Based on the age dating results, calculated sedimentation rates from the core data ranged from 3.0 to 7.0 cm/year.
Washington Navy Yard (CH2M Hill 2011a). This site is located on M street SE, near the 11th Street Bridge in southeast Washington, D.C. The southern side of Washington Navy Yard (WNY) is bounded by the Anacostia River. The WNY waterfront has historically consisted of piers, quay walls, slips, and dry dock facilities. A “Notification of Hazardous Waste Activity” was submitted to EPA by WNY in 1985. In 1998, the WNY was placed on the US EPA National Priorities List because of the contamination that was detected in the adjacent Anacostia River as well as on-site sediment and soil. In 1999, the Near-shore Sediment RCRA Facility Investigation (RFI) included the collection of surface sediment samples from 26 locations. The remedial investigation activities of the near-shore sediments (OU2) are documented in a Draft RI Report (CH2M Hill 2011a) and were conducted in the years 2006 and 2009 in accordance with the Federal Facilities Agreement (FFA). The Draft RI Report is under discussion between DDOE, EPA, and the Navy. The RI data have been uploaded to the NOAA Anacostia Watershed Database.
For the 2009 sampling phase documented in the 2011 RI Report, The Washington Navy Yard investigation included the collection of 20 samples to help characterize the surface sediments in and around OU2, to fill existing data gaps, to characterize the sediments near the Navy and D.C.-owned outfall locations, and to complement existing surface sediment results for the previous surface sediment investigation. OU2 includes the entire 2,400 foot site waterfront and extends the length of the facility’s piers (approximately 200 feet) into the Anacostia River. In addition, subsurface sediment sampling was conducted at 34 locations within and near the pier area to depths ranging from 10 to 12 feet (middle depth) to approximately 20 feet (deep depth) below the river bottom. The historical dredge depth at the Washington Navy Yard is 22 feet below mean sea level. The middle depth and deep depth samples correspond to the interval above the typical dredging depth versus the deeper interval representing fluvial sediments. Sediment samples were analyzed for Target Analyte List metals (Method 6010B), cyanide (Method 9012B), PCB Aroclors (Method 8082), and PAHs (Method 8270_SIM), TOC, and grain size. Selected samples were also analyzed for VOCs (Method 8260), target compound list (TCL) pesticides (Method 8081A), 129 PCB Congeners (EPA Method 1668A), PCDD/PCDF (Method 8290), and AVS/SEM. The total PAH analyses reported concentration results for 31 PAH compounds.
For surface sediment, the highest constituent concentrations are consistently found at the western end of OU2, in the area of former Pier 5 and D.C. Combined Sewer Outfall 14, D.C. Storm Sewer 01, and Washington Navy Yard Outfall 9. Relatively higher constituent concentrations are also found near some

Remedial Investigation Work Plan Anacostia River Sediments Project
18
of the other Navy Yard outfalls. Total PAH concentrations in this area range up to 77,690 μg/kg. The average total PAH concentration for OU2 was 15,319 μg/kg. Gamma chlordane was the most frequently detected pesticide. Average and maximum gamma chlordane concentrations for OUs were 15.1 and 41 μg/kg, respectively. Total PCB Aroclor concentrations in OU2 surface sediments ranged from 96 to 830 �������������������������������������!"������#�
In addition, the RI included a comparison of sediment sampling results from the same locations sampled in 1999 and again in 2009. The results indicate that for most constituents, concentrations from the two years are comparable suggesting the absence of a pronounced trend upward or downward. Concentrations of PAHs and PCBs were more variable than concentrations of metals, but in general, there were no systematic increases or decreases in concentrations over time. The Navy is planning to conduct additional, near shore sediment sampling at the Washington Navy Yard to support the FS. The sampling is planned for the 2014 – 2015 timeframe.
Fish tissue samples were collected and analyzed to generate contaminant residue data for use in both the Baseline Ecological Risk Assessment (BERA) and HHRA at WNY. For the BERA, composite samples of whole-body mid-water (bluegill, pumpkinseed, and longear sunfish) and pelagic (blueback herring) forage species were analyzed for organochlorine pesticides, PCBs (Aroclors and congeners), and bioaccumulative metals (arsenic, cadmium, chromium, copper, lead, mercury, nickel, selenium, silver, and zinc). For the HHRA, composite samples of fillets of largemouth bass and several species of catfish were analyzed for PCB congeners and bioaccumulative metals. PCBs and arsenic in HHRA indicated unacceptable carcinogenic and noncarcinogenic risks to humans consuming fish from locations adjacent to WNY (CH2MHill 2011).
Active Capping Pilot Study (Horne Engineering 2003). A pilot project was initiated in 2004 to evaluate the performance of active capping technology as an approach to manage contaminated sediments. The project was undertaken at Area of Concern 1 (AOC1) defined by AWTA (2002). AOC1 is an area of elevated PAHs and PCBs located near the O Street Outfall, Southeast Federal Center, and the Washington Navy Yard. The demonstration project was implemented by a team led by Dr. Danny Reible and consisting of AWTA, the DC Department of Health, EPA organizations, and various universities (Reible et al. 2006). Three materials were tested including a bentonite material with a granular core, coke, and apatite. The granular core material physically entraps migrating sediments, coke sequesters organic constituents, and apatite removes metals through mineral deposition. Each material was installed in a pilot-scale, experimental cap specific for that material. After placement, early monitoring indicated that all cap materials were effectively isolating contaminants (Reible et al. 2006). For each of the experimental caps, Lampert et al. (2013) evaluated PAH monitoring data for concentrations in bulk solids, simultaneous bioaccumulation and pore water concentrations, and pore water concentration profiles. In general, data were collected six, 18, 30, 44, 54, and 66 months after placement of the caps. As determined through the profiling of cap pore water, concentrations in all of the caps approached near equilibrium within a few years as a result of surface recontamination and tidal pumping forces (Lampert et al. 2013). However, observed concentrations of seven PAHs in each of the caps were lower than those in the uncapped areas (Lampert et al. 2013).

Remedial Investigation Work Plan Anacostia River Sediments Project
19
Prior to placement of the caps, Horne Engineering (2003) characterized the river bottom near O Street Outfall where the caps were to be installed. The characterization included the performance of bathymetric, side-scan sonar, and benthic community surveys. In addition, the investigation included the collection of surface water, pore water, and surface and subsurface sediment samples. Surface sediment samples were collected via gravity corer at eight locations and via Ponar sampler at 60 locations. Subsurface samples were collected from the intervals 0.5 to 1.0 foot, and 1.0 to 3.0 feet from the eight gravity cores. Deep sediment samples were also collected from two locations. At each location, the sampled depths were 10.5 to 12.5 feet, 15.5 to 17.5, and 20 to 22 feet below the sediment surface.
Surface sediment PCB Aroclor concentrations ranged from 25 to 2,400 μg/kg with 1248 and 1254 two of the dominant Aroclors. Total PAH concentrations (16 PPs) ranged from 470 to 82,360 μg/kg with higher values occurring near the outfall. Some metals concentrations were highest at the outfall discharge point and decreased away from that maximum. This pattern was observed (maximum concentration shown) for antimony (5.0 mg/kg), chromium (94.8 mg/kg), lead (726 mg/kg), nickel (69.8 mg/kg), selenium (1.9 mg/kg), silver (22.5 mg/kg), thallium (2 mg/kg), and zinc (892 mg/kg).
Subsurface gravity core sediment PCB Aroclor concentrations ranged from 9,100 μg/kg (0.5 to 1.0 foot) to 400 μg/kg (1.0 to 3.0 foot). PCB congener concentrations in the subsurface gravity core samples are based on 22 congeners defined by EPA Region 2 (EPA 1992a) and ranged from 6,528 to 689 μg/kg. The maximum and minimum PCB congener sample results correspond to two samples in which the maximum and minimum Aroclor concentrations were observed. Total PAHs for the subsurface gravity cores range from 42,580 to 5,160 ug/kg and from 45,300 to 5,110 μg/kg measured at the depths of 0.5 to 1.0 and 1.0 to 2.0 feet, respectively.
With regard to the deep sediment samples, PCB Aroclors and total PAH were not detected at depths greater than seven feet below the sediment surface. For the interval from approximately five to seven feet, PCB Aroclor concentrations ranged from 29 to 2,390 μg/kg and total PAHs ranged from 929 to 10,600 μg/kg.
Southeast Federal Center (URS Group 2000). Southeast Federal Center (SEFC) is a 55.3-acre site located adjacent to and down-river from the Washington Navy Yard. The site was originally a portion of the Navy Yard and was used for manufacturing of naval ordnance, specifically medium and large caliber naval guns. The ordnance production and manufacturing ceased in 1962. The site was transferred to the General Services Administration in 1963. The site has housed a variety of government activities and clients, including administrative offices, warehouses and storage space, laboratories, and light industrial operations. As part of a 1998 consent decree, the Navy and GSA agreed to sample and analyze near shore river sediment along the SEFC waterfront.
On behalf of GSA, URS Corporation (URS) collected surface sediment samples at 11 locations and analyzed the samples for TAL metals, TCL VOCs, TCL SVOCs, TCL PCBs, and PAHs. The total PAH analyses reported concentration results for 17 PAH compounds. At three locations, PCDDs/PCDFs, Appendix IX VOCs, Appendix IX SVOCs, and PCB congeners (209 congeners) were also analyzed. The field work for the investigation was conducted in August 1999.

Remedial Investigation Work Plan Anacostia River Sediments Project
20
PCB Aroclors were detected in eight of the 11 samples. Aroclor 1254 and 1260 were the only species detected with concentrations ranging from 100 to 310 μg/kg for 1254 and from 98 to 510 μg/kg for 1260. For the three PCB congener analyses locations, total PCBs expressed as the sum of the detected congeners ranged from 1,018 to 2,894 μg/kg. One or more PAHs from each sample exceeded EPA Region 3 BTAG screening levels and the group of detected PAH compounds was consistent across all samples. Based on concentration data for SEFC site in the project database, high molecular weight polycyclic aromatic hydrocarbons (HPAH) concentrations ranged from approximately 2,800 to 52,300 μg/kg while low molecular weight polycyclic aromatic hydrocarbons (LPAH) concentrations ranged from 1,100 to 25,300 μg/kg.
Fort McNair. Fort McNair is a 108 acre Army facility situated adjacent to the mouth of the tidal Anacostia River. Fort McNair is part of Joint Base Myer-Henderson Hall command. The facility occupies the eastern portion of Buzzard Point, the peninsula separating the Anacostia River from the Washington Channel. Initially established in 1794 as an arsenal for defending the Capitol, the facility has since included a federal penitentiary, a general hospital (predecessor to Walter Reed Army Medical Center), and an Army education and training facility (www.jbmhh.army.mil/web/jbmhh/AboutJBMHH/FortMcNairHistory.html). Fort McNair is home to the National Defense University and various army ceremonial units including the Army’s official escort to the President and the U.S. Army Band (DDOE 2012). A web search for potential environmental issues at Fort McNair suggests the absence of any significant current or historical environmental issues at the facility. However, the search revealed that several current and former leaking underground petroleum storage tank (LUST) sites exist at Fort McNair (Table 2.3). The records show that nine LUST cases involving petroleum products were identified between 1989 and 1996 (DDOE UST Branch 2012a). Specific information regarding the nature and extent of contamination and the various environmental media impacted by these subsurface spills is unavailable. The substances leaked included gasoline, waste/used oil, heating fuel oil, and kerosene. Contamination of soil and/or soil and groundwater resulted from these spills. Seven of the nine cases have been resolved and two remain open as of time of this report (June 2014) (DDOE UST Brach 2012b).
Joint Base Anacostia-Bolling (JBAB). This 905-acre site is located between the Potomac and Anacostia rivers and Interstate 295. JBAB comprises the former Naval Support Facility Anacostia (NSFA), the former Bolling Air Force Base (AFB), and the Bellevue Housing Area. Operations began on the southern portion of JBAB when the facility was formerly known as the Anacostia Naval Air Station, which originally operated as part of the U.S. Army’s Bolling Air Field during World War I. When Bolling Air Field was relocated to its present-day location in 1935, the land it previously occupied was transferred to the U.S. Navy, which increased the size of the Anacostia Naval Air Station. Since 1961, the primary mission of the air station has evolved from testing airplanes and training naval reservists to conducting administrative activities. In October 1996, the Navy formally decommissioned the air station and renamed the facility NSFA. JBAB was established on October 1, 2010, in accordance with congressional legislation implementing the recommendations of the 2005 Base Realignment and Closure Commission.
Beginning in 1918, the NSFA served as a military airfield and was designated as the first headquarters of the United States Air Force in 1941. To ease airspace congestion in the vicinity of National Airport, all fixed wing aircraft operations at the facility ceased in 1962. The facility is currently primarily used by the

Remedial Investigation Work Plan Anacostia River Sediments Project
21
Navy for administrative purposes. In addition, it is home to organizations such as the Defense Intelligence Agency and the Naval Imaging Command (DDOE 2012). A web search for potential environmental issues at NSFA revealed several leaking underground storage tank (LUST) sites and several AOCs which are discussed further below. The search indicated that 17 former leaking LUST sites (Table 2.3) existed at NSFA between 1989 and 1997. Specific information regarding the nature and extent of contamination and the various environmental media impacted by these subsurface spills is unavailable. The substances leaked included gasoline, waste/used oil, heating fuel oil, and kerosene. Contamination of soil and/or soil and groundwater resulted from these spills. All 17 cases were resolved by 2003 (DDOE UST Branch 2012b).
In addition to the LUST sites, environmental investigations were conducted at four sites:
� AOC 1 (former incinerator and solid waste disposal area, � Site 2 (two landfill areas), � Site 3 Athletic Fields (petroleum discharge), and � Site 1 (Building 168 crawlspace).
The environmental issues, sampling, and status of each of these sites are summarized below.
In 2011, CH2M Hill performed a site investigation of AOC 1 which was divided into two areas, each of which is a former location of an incinerator and solid waste disposal area. The investigation was performed for Naval Facilities Engineering Command (NAVFAC) Washington and Naval District Washington under the Comprehensive Long-Term Environmental Action, Navy III, Contract Number N62470-02-D-3052, Contract Task Order 70. The objective of the AOC 1 investigation was to determine whether past waste management and incinerator operating practices resulted in the release of hazardous constituents that may pose unacceptable risks to human health and ecological receptors. Six soil and six groundwater samples were collected during this investigation. CH2M Hill concluded barium, iron, manganese, and dioxins/furans in groundwater at AOC 1 may pose potentially unacceptable risks to aquatic organisms in the Anacostia River adjacent to AOC 1. The current status for AOC1 is No Further Response Action Planned (NFRAP). The NFRAP Decision Document was developed by the Department of the Navy (Navy), as lead agency, with input solicited from U.S. Environmental Protection Agency Region 3 (Region 3) (CH2M Hill 2011b).
In 2011, CH2M Hill performed a RI for the Navy at Site 2, comprised of two landfill areas. The objective of the RI was to determine the nature and extent of potential contamination at Site 2, its effects on groundwater quality, whether potential groundwater contamination is reaching the Anacostia River, and to collect sufficient data to prepare baseline human health and ecological risk assessments for the entire site. Eleven groundwater samples, 24 surface soil samples and 17 subsurface soil samples were collected during this investigation. The primary constituents detected in Site 2 media are SVOCs, metals, and to a lesser extent dioxins. Only barium, iron, and manganese were identified as posing a potential risk to water column receptors in the Anacostia River. CH2M Hill concluded that considering the conservativeness for this assessment and the low-level screening value exceedances, any associated

Remedial Investigation Work Plan Anacostia River Sediments Project
22
ecological risks were within an acceptable range. CH2M Hill has recommended NFRAP status for Site 2 to the Navy; no further details were available regarding site status (CH2M Hill 2011c).
During a Preliminary Assessment (PA) of Site 3 Athletic Fields in 1991, petroleum was observed in surface depressions with an associated petroleum-type odor. In 2012, CH2M Hill submitted a Draft No Action Decision Document for this site. In 1992 an investigation was conducted consisting of the collection of 12 surface soil samples, 15 soil gas samples, 7 subsurface soil samples, and 3 groundwater samples. VOCs, pesticides, and PCBs were not detected in groundwater at concentrations exceeding the tap water RSLs. Two SVOCs (bis(2-ethylhexyl)phthalate and naphthalene) were detected in groundwater samples at concentrations exceeding the corresponding RSL. However, they were detected in background at similar concentrations. Dissolved metals (copper, iron, and manganese) and total metals (barium, chromium, iron, and manganese) were detected at concentrations exceeding the human health RSLs. The concentrations were generally similar to background, with background concentrations also exceeding the screening values. The analytical results presented in the SI report for soil gas, surface soil, subsurface soil, and groundwater samples were considered to be below or at the site-specific background levels, and were not likely to pose any unacceptable risks to the human health and ecological receptors. Based on these results, CH2M Hill prepared a No Action Decision Closure Document for the Navy (NAVFAC 2012).
In 2012, CH2M Hill submitted a Draft NFRAP Decision Document regarding Site 1 Building 168 Crawlspace with Region 3 and DDOE providing input to this decision. Building 168 was constructed in the 1940s and utilized as a photographic laboratory. Several areas within Building 168 where hazardous substances were stored included darkrooms, copying rooms, color labs, and associated material storage rooms. Hazardous substances that were identified include developing chemicals, bleach, fixers, replenishers, alcohol, oils, acids, cements, buffer solutions, and cleaning compounds. Six existing shallow groundwater monitoring wells were sampled as part of the Site 1 investigation. The detected constituents that were present in groundwater were limited to VOCs, one SVOC, and metals. Only metals were present at concentrations exceeding screening criteria. The maximum concentrations of the detected metals in filtered groundwater samples were as follows: arsenic $!!#"����&'��*�����$+<+����&'��������$=#>+����&'������$?@�+==����&'���������\��$<�!==����&'��������� (6.�����&'��������������$!#!����&). CH2M Hill stated contamination specifically related to the crawlspace of Building 168 appears to be primarily inorganic and is distributed throughout the crawlspace without patterns or trends, confirming that the contamination is likely from localized leakage within the crawlspace and is not the result of a wide-spread or large-scale releases within Building 168 (CH2M Hill 2012).
Former Steuart Petroleum Company Adjacent to WGL East Station (CH2M Hill 2007 and NOAA 1992a). Steuart Petroleum operated a former bulk oil distribution facility at 1333 M Street SE, adjacent to WGL East Station. The facility consisted of ASTs and truck loading racks and was active from approximately 1966 through 1982. Support Terminal Services (site tenant) used underground and aboveground pipelines to transfer petroleum fuels from an offloading pier in Anacostia River to the storage and distribution facility. The three USTs (one 2,000-gallon diesel tank, one 5,000-gallon gasoline tank, and one 550-gallon used-oil tank) were installed and in operation on the property from 1966 through 1982 and were subsequently removed in 1987.
Remedial Investigation Work Plan Anacostia River Sediments Project
23
In January 1992, as a result of a valve failure, approximately 51,000 gallons of #4 fuel oil spilled from a 3.2 million gallon AST to the facility’s containment area (NOAA 1992a). As a result of this spill, approximately 2,000 gallons of product drained into a storm drain that flowed into the Anacostia River. The oil entered the Anacostia River between the Phillip J. Sousa and 11th Street bridges. Emergency responders used boom in collection areas to collect oil that escaped into the river (NOAA 1992b).
A 1992 environmental investigation of the property included the installation of eight soil borings which were each converted to monitoring wells. Soil and groundwater samples collected from these borings and wells were analyzed for TPH, benzene, toluene, ethylbenzene, and xylenes (BTEX), methyl tertiary butyl ether (MTBE), and naphthalene. Results of this sampling indicated that the central portion of the property was contaminated by a release from a former UST, and the western portion of the property impacted by a release from an abandoned petroleum pipeline. Free-phase hydrocarbons were not detected in any of the groundwater monitoring wells. However, because of the leaking former UST, a LUST case was opened at the UST site in April 1993 (CH2M Hill, 2007).
Quarterly sampling of the groundwater was conducted at the UST site between February 1993 and October 1996. Concentrations of dissolved-phase hydrocarbons at the wells, on and adjacent to the UST site, exhibited a decreasing trend over time. In 1997, a technical review of the UST site was conducted, and it was determined that no further investigation or monitoring was warranted. The conclusion was based on the minimal concentrations of petroleum compounds detected in groundwater, the industrial use of the area and surrounding properties, and the use of municipally supplied potable water in the District and surrounding counties (CH2M Hill, 2007).
In 1998, the District of Columbia Pesticides, Hazardous Waste and UST Management Division issued a conditional case closure pursuant to the District’s UST Management Act of 1990 and UST regulations. The case closure letter stated that the UST site did not pose a present threat to human health and the environment. The letter also stipulated that the District would require an approved work plan for any future excavation work at the site (CH2M Hill, 2007).
Steuart Petroleum Company/Hess/Gulf Former Petroleum Terminals (CH2M Hill 2007, NOAA 1992b and 1992c). Hess Petroleum Corporation (Hess) operated a former bulk oil facility located at 1620 South Capitol Street SW and adjacent to the South Capitol Street Bridge and Anacostia River. The facility was reportedly active from approximately 1920 through 1985 that included multiple large capacity ASTs with associated aboveground and sub-grade piping and several USTs. Several environmental investigations have occurred in relation to the property dating to at least 2004 that indicated soil and groundwater concentrations were above reportable conditions for metals, BTEX, TPH, and PAH. Remediation was recommended for soil and groundwater at the facility; however, no remediation has occurred at this site as of 2005 (MACTEC 2005).
Gulf Petroleum Corporation (Gulf) formerly operated a bulk gasoline and fuel oil terminal at the addresses of 1721 and 1724 South Capital Street SW on property located adjacent to above-noted Hess facility. The facility was active from approximately 1930 through 1969. Steuart Petroleum Company/Steuart Investment Company (Steuart) purchased the facility from Gulf in 1969 and operated

Remedial Investigation Work Plan Anacostia River Sediments Project
24
it until approximately 1989 after which Steuart ceased operations. When in service, Steuart used the property as a terminal for kerosene and fuel oils and reportedly operated a 1.2 million gallon AST, 20,000 gallon AST, and 14 4,000-gallon USTs. In addition, PEPCO operated a bulk gasoline and fuel oil storage facility to the west of the Steuart Investment Company for use in a former electric power generating station. During site investigations conducted during the 1990s and 2000s, non-aqueous phase liquid (NAPL) was observed on both sites and NAPL recovery efforts were implemented. Soil was also excavated from the properties based on BTEX, TPH, and PAH contamination observed from sampling efforts. LUST case documents indicate that the combined site’s pump and treat groundwater remediation recovered 2,171 gallons of NAPL as of April 2005 (MACTEC, 2005).
Firth-Sterling Steel (www.washingtonpost.com/wp-dyn/content/article/2007/07/28/AR2007072801087.html). As reported in the Washington Post (July 29, 2007), on what is now a portion of JBAB, a former steel plant operated on 360 acres near Giesboro Point, on the eastern shore of the Anacostia River at its confluence with the Potomac River (Figure 1.1). Manufacturing operations occurred on 10 acres of the property and consisted of the manufacture of armor piercing projectiles for the U.S. Navy and coastal defenses. Also known as the Washington Steel and Ordnance Company, the plant was built in 1907 and operated until 1922 by the Firth-Sterling Steel Company of McKeesport, Pennsylvania. In 1922 the plant was closed and later demolished (Kelly 2007). No information could be located regarding potential environmental issues associated with this facility.
2.7 Data Usability The data collected during previous investigations were screened to determine the usability of the data in the assessment of data gaps and for potential future use in FS and NRDA analyses. As discussed in Section 6, in addition to screening the data for the purpose of sample design, additional evaluation of the existing data will occur during the data evaluation phase of the RI. The usability assessment included the following elements.
Sampling Period. Environmental data from as early as 1990 were available for use in the development of this WP. To leverage the extensive spatial coverage of the ANS 2000 data set, data collected post-year 2000 were selected for use in the data gap assessment. Exceptions to the 2000 cutoff are inclusion of the sediment data from two investigations from 1998 and 1999, respectively. Both were included to enhance spatial coverage. The 1998 investigation included the collection of Anacostia River sediment samples in association with an ambient sediment toxicity investigation in the Chesapeake Bay watershed. The 1999 investigation consisted of surface sampling results for the SEFC sampling discussed above. As shown by Table 2.2, the data for 11 previous investigations were evaluated for this WP.
An assumption inherent in using data collected from up to 15 years ago is that sediment concentrations from these sampling events will reasonably approximate present day concentrations. In support of this assumption, the above-noted Washington Navy Yard RI data indicate that for most of the data set, systematic differences do not exist between the concentrations measured in 2009 and those measured in in the 2000 event at the same locations. A representative number of the 2000 locations will also be re-sampled for this investigation (approximately 20 percent of new sampling locations) to assess general usability of the earlier data.

Remedial Investigation Work Plan Anacostia River Sediments Project
25
Analytical Methods. Consistency of the analytical methods across the previous investigations included in the project database was assessed. Table 2.4 shows the analytical methods for the five more significant investigations for which data are available. For the “Washington Navy Yard Sed/TSS,” “GSA SE Federal Center,” “CSX,” and “Active Capping Site Char Rpt” data sources, analytical methods are generally consistent for SVOCs, PAHs, metals, pesticides, and PCB Aroclors. In most cases, the typical SW-846 method was used. PCB congener analysis methods, however, vary somewhat among the investigations as do the numbers of congeners analyzed. The “CSX” and “GSA SE Federal Center” investigations both analyzed for the full suite of 209 PCB congeners while 127, 81, and 57 congeners were measured in the “Washington Navy Yard Sed/TSS,” “ANS 2000,” and “Active Capping Site Char Rpt datasets,” respectively. The various methods listed in Table 2.4 for each group of analytes, including those used for the “ANS 2000” dataset, are generally comparable. Any discrepancies result from variation in method sensitivities as will be reflected in the associated method detection limits.
Ecological and Human Health Benchmarks Levels. Screening levels were identified for preliminary screening of sediment, soil, surface water, and groundwater sampling results in the preparation of this WP. In the discussions of existing sampling results for these media, concentrations are characterized as “elevated” if screening levels are exceeded. Sediment concentration data are compared to the EPA Region 3 Biological Technical Assistance Group Freshwater Screening Benchmarks (Table 2.5). These screening levels provide conservative reference levels for initial, preliminary evaluation of sediment quality data and will be re-evaluated as the RI/FS progresses. With regard to human health screening benchmarks, sediment, surface water, and fish tissue concentration results are compared to EPA Regional Screening Levels (RSLs) for industrial soil, residential tap water, and fish tissue respectively (Table 2.6).
Deep Sediments. In this investigation, deep sediments are defined as sediments that occur at a depth of 0.5 feet or more below the bottom of the river. The year 2000 cutoff for retaining investigations for the WP database applies to all environmental media with the exception of deep sediments. Because they are buried below the horizon where surface sediment transport processes are active, deep sediment data collected in non-dredged areas reflect current conditions at the time of deposition even if they are from investigations conducted many years ago. However, for some pre-2000 investigations, the NOAA Database provided insufficient documentation regarding sampling depths, either because specific depth information was absent or the units for depth measurement were unavailable. Only deep sediment data for which accurate depth information were available, which included only the post-2000 investigations were included in the WP database. During the performance of the RI, the WP database will be updated as deep sediment data from sediment investigations for the other sites in the study area becomes available.
Data Validation. Data from the Washington Navy Yard investigation were subjected to Region 3 data validation at an acceptance level sufficient for risk assessment. The CSX data underwent a Stage 2A data validation, a verification and validation process that assesses completeness and compliance checks of sample receipt conditions and only sample-related quality control results. Although data validation within the CERCLA framework was apparently not performed on the FWS fish tissue data, the Phelps

Remedial Investigation Work Plan Anacostia River Sediments Project
26
(2001) benthic invertebrate data, or other data sourced to the NOAA database, in most cases the sampling was or likely was performed with appropriate quality control.
Usability Determination. Review of the 11 selected investigations (Table 2.2) resulted in the determination that all are of sufficient quality for use in WP development without qualification with two exceptions. Two clam translocation studies (Phelps 2001 2002) showed that clams accumulated pesticides and PCBs when placed in the Anacostia River for several weeks. However, these studies did not attempt to distinguish between dissolved and particulate constituents as the source of contaminants. Nor were sediment concentrations at the reference and test locations measured. Concentrations of contaminants in overlying water were not measured or discussed. These and other features of the studies limit the usability of the results.
2.8 Regulatory Compliance This section provides a preliminary screening of Applicable or Relevant and Appropriate Requirements (ARARs) as well as a summary of the regulatory permit requirements for conducting the field sample collection. At this stage of the investigation, ARARs will only be identified to the extent that they impact the collection of RI data during the planned field investigation or if they impact data quality objectives. Further consideration of ARARs will be given during the FS stage where ARARs are considered for the screening of potential remedial actions. Because the RI field work involves collection of data from both the State of Maryland and the District of Columbia, both jurisdictions are considered for the identification of ARARs and for permitting requirements.
2.8.1 ARARs The identification of Federal and State ARARs is performed pursuant to CERCLA Section 121(d), which states that a remedial action selected for a CERCLA site shall attain a degree of cleanup which assures protection of human health and the environment, and attains “legally applicable or relevant and appropriate standard(s), requirement(s), criteria, or limitation(s).” United States Environmental Protection Agency (USEPA) regulations and guidance require that ARARs and criteria To Be Considered (TBC) be identified and defined during the FS and then met during the implementation of remedies. Therefore, more extensive consideration of ARARs and criteria TBC guidance will be given as part of the FS. Once identified, the ARARs and TBCs will be evaluated to identify those that may be technically impracticable to achieve and for which waivers may be required.
The NCP and relevant CERCLA guidance specify that ARARs may be grouped into three categories: chemical-specific, location-specific, or action-specific [40 CFR § 300.400(g)(1)]. Chemical-specific ARARs are considered primarily to establish data quality objectives such as detection limits and sample analytical methods so that analytical results that will be usable for further chemical-specific ARAR comparisons during the remedy selection process. Location- and action-specific ARARs more directly impact RI activities and frequently result in the need to obtain permits and permissions to conduct work in waters of the U.S. or within the boundaries of National Parks. Included in this section is a discussion of the regulatory authority to collect data for the purpose of documenting Natural Resource Damages (NRD).

Remedial Investigation Work Plan Anacostia River Sediments Project
27
The list of ARARs below describes the regulatory authority and the applicability or relevance to the remedial investigation.
Federal
• Clean Water Act (CWA), Ambient Water Quality Criteria (33 USC §§ 1251 et seq.; 40 CFR Part 131). Applicable: Surface water criteria established for the protection of human health and/or aquatic organisms.
• Clean Water Act and Rivers and Harbors Act (RHA), Dredge and Fill Standards (33 USC §§ 320-330 and 1344(b)(1); 40 CFR Part 230; Executive Order No. 11990). Applicable: Regulates the discharge of dredged or fill material into waters of the U.S. Includes protection of wetlands.
• Safe Drinking Water Act, National Primary Drinking Water Regulations Maximum Contaminant Levels (MCLs) (42 U.S.C. §§ 300f et seq.; 40 C.F.R. Part 141). Relevant and Appropriate: Human health-based standards, MCLs for public water systems. Although the Anacostia River is not used as drinking water, the river and groundwater recharged by the river are potential future drinking water sources.
• Resource Conservation and Recovery Act, Subtitle C (40 CFR Part 261). Applicable: If any CERCLA action constitutes treatment, storage, transport, or disposal of a RCRA hazardous waste.
• Toxic Substances Control Act (15 U.S.C. 2601; 40 CFR 761.60-761.79 (PCBs); 40 CFR 775.180-775.197(TCDD)). Applicable: Storage or disposal of waste material containing PCBs or TCDD.
• OSHA HAZWOPR (29 CFR 1910.120). Applicable: Requirements for workers engaged in response or other hazardous waste operations.
• Endangered Species Act (16 USC §§ 1531–1544; 50 CFR Part 402). Applicable: Establishes requirements for the protection of federally listed threatened and endangered species and their habitat. RI sampling could affect threatened or endangered species or their habitat.
• Fish and Wildlife Coordination Act (16 USC §§ 661 et seq.). Applicable: Requires consideration of impacts to wildlife resources resulting from the modification of waterways. RI will involve minimal sediment disturbance.
• National Historic Preservation Act (16 U.S.C. 470; 43 CFR Part 7, 7.4). Relevant and Appropriate: Protection of Archaeological Resources.
• Archaeological and Historic Preservation Act (16 USC §§ 469 et seq.; 16 USC §§ 470aa–ii, et seq.; 43 CFR §§ 7-1 et seq.). Applicable: Provides for the protection and preservation of archeological and historical resources that may be destroyed through the alteration of terrain as a result of federal construction projects. RI activities will avoid historic features, but could result in the discovery of archeological or historical resources.
• National Park Service Organic Act (16 USC § 1 et seq.). Applicable: Parts of the tidal Anacostia River to be sampled (sediment disturbance and aquatic organism sampling) are within National Parks managed lands. The Organic Act requires that national parks be managed in order to conserve the scenery, natural and historic objects, and wildlife in such a manner as to leave them unimpaired for the enjoyment of future generations.
• Solid Waste Disposal in National Parks (16 USC § 460l-22(c), 36 CFR Part 6). Applicable: Disposal of investigation derived waste; temporary activity. Prohibits the creation of new solid waste

Remedial Investigation Work Plan Anacostia River Sediments Project
28
disposal units and the operation of existing solid waste disposal units within park boundaries, except as specifically provided for in the regulations.
• National Park Resource Protection, Public Use and Recreation (36 CFR Part 2). Relevant and Appropriate: This regulation prescribes and regulates various activities in National Parks, such as the prohibition of possessing, destroying, injuring, defacing, removing, digging, or disturbing from its natural state: (i) . . . wildlife or fish. . . . (ii) Plants or the parts or products thereof. . . . feeding, touching, teasing, frightening or intentional disturbing of wildlife nesting, breeding or other activities. It also prohibits disposing of refuse in other than refuse receptacles. . . . (6) polluting or contaminating park area waters or water courses. Permits will be issued by NPS to address these prohibitions during RI sampling activities.
• NPS Management Policies 2006 (Available at: www.nps.gov/policy/mp2006.pdf). Criteria TBC: Provides policies and guidance for the management of natural and cultural resources by the NPS, including revegetation of disturbed land.
• Executive Order 13423. Consolidates and strengthens sustainability practices for Federal, Energy, and Transportation Management by advancing energy security and environmental protection with defined program goals. Applicable to achieve environmental protection and DDOE’s Sustainability Program requirements.
State
• Clean Water Act, Water Quality Certification (CWA §§ 301, 302, 303, 306, and 307). District of Columbia. Applicable: Any applicant for a Federal license or permit to conduct an operation that may result in any discharge to navigable waters (§ 404), shall provide to the licensing/permitting agency a certification from the State that the discharge will comply with applicable provisions.
• Water Quality Standards for Surface Water (D.C. Code §§8-103 et seq. DCMR1 Title 21 Chapter 11). District of Columbia. Applicable: Discharges or impacts to surface waters that may exceed water quality standards for the Anacostia River including draft TMDLs for oil and grease, organics and metals in the River.
• Hazardous Waste Regulations (DCMR Title 20, Chapters 40-47). District of Columbia. Applicable: Sets forth criteria for classification and disposal of hazardous waste such as investigation derived waste.
• District of Columbia Historic Preservation (DCMR Title 10, Chapter 25). District of Columbia. Applicable: Requires the consideration of the existence and location of historic and prehistoric sites, buildings, objects, and properties of historical and archaeological significance when evaluating remedial alternatives. RI sampling activities are not likely to impact historical or archeological features, but may uncover artifacts of significance.
• District of Columbia Harbor Regulations-Throwing or Depositing Matter in Potomac River (D.C. Official Code § 22-4402). District of Columbia. Applicable: Prohibits the deposit of any stone, gravel, sand, ballast, dirt, oyster shells, or ashes in the water in any part of the Potomac River or its tributaries in the District of Columbia, or on the shores of the river below the high water mark. Further prohibiting the deposit of “filth of any kind whatsoever” in the Potomac River or its tributaries in the District of Columbia. However, Section 22-4402(c) states: “Nothing in this

Remedial Investigation Work Plan Anacostia River Sediments Project
29
section shall be construed to interfere with the work of improvement in or along the said river and harbor under the supervision of the United States government.”
• Storage, treatment or disposal, and transportation of hazardous waste regulations (COMAR 26.13.02&.04; Annotated Code of Maryland, Environmental Article, Title 7, Hazardous Materials, and Hazardous Substances). State of Maryland. Applicable: Regulations and procedures for the identifications, listing, transportation, treatment, storage and disposal of hazardous wastes must be met. Any hazardous waste generated during sampling activities will be disposed of according to regulations. Any residues or by-products from sampling which are hazardous will be disposed of properly.
• Dredging and upland disposal of dredged material regulations (COMAR 26.24.03). State of Maryland. Applicable: Regulations require the preparation and implementation of a plan to perform dredging in State or private tidal wetlands and upland disposal of dredged material.
• Fish and fisheries management regulations (Annotated Code of Maryland, Natural Resource Article, Title 4 - Fish and Fisheries). State of Maryland. Applicable: Requirements to conserve species of fish for human enjoyment, for scientific purposes and to ensure their perpetuation as viable components of their ecosystems. The RI will impact some fish species in the Anacostia River within Maryland.
• Wildlife management regulations (Annotated Code of Maryland, Natural Resource Article, Title 10 – Wildlife). State of Maryland. Applicable: Requirements to conserve species of wildlife for human enjoyment, for scientific purposes and to ensure their perpetuation as viable components of their ecosystems. The RI will impact some wildlife species in the Anacostia River within Maryland.
• Chesapeake Bay Area Critical Protection Program (Annotated Code of Maryland, Natural Resource Article, Title 8 - Waters, Subtitle 18 - Chesapeake Bay Area Critical Protection Program). State of Maryland. Relevant and Appropriate: The Anacostia River is within the Chesapeake Bay Critical Area and, as such, sediment disturbing activities are guided by specific provisions in the adopted critical area criteria and local critical area program.
• State Tidal Wetland Regulations (COMAR 26.24; Annotated Code of Maryland, Environmental Article Title 5 - Water Resources; Annotated Code of Maryland, Environmental Article Title 16 - Wetlands and Riparian Rights). State of Maryland. Applicable: Provides that activities such as dredging, filling, removing, constructing, reconstruction, or activities otherwise altering tidal wetlands must be permitted by the State.
• State Water Quality Criteria (COMAR 26.08, Chapters 01-07). State of Maryland. Applicable: Sets criteria and standards for discharges limitations and policy for antidegradation of the State's surface water.
Natural Resource Damages
In addition to the ARARs described above, this RI addresses data gaps related to the District of Columbia’s ongoing NRD considerations as a trustee for natural resources in and along the Anacostia River under CERCLA. CERCLA states that a "natural resource" is a resource "belonging to, managed by, held in trust by, appertaining to, or otherwise controlled by" the United States, any State, an Indian

Remedial Investigation Work Plan Anacostia River Sediments Project
30
Tribe, a local government, or a foreign government [CERCLA §101(16)]. NRD are for injury to, destruction of, or loss of natural resources, including the reasonable costs of a damage assessment [CERCLA §§101(6); 107(a)(4)(C)]. The measure of damages is the cost of restoring injured resources to their baseline condition, compensation for the interim loss of injured resources pending recovery, and the reasonable cost of a damage assessment (43 CFR Part 11; 15 CFR Part 990). Section 990.24(b) of the CFR states that trustees must ensure compliance with any applicable consultation, permitting, or review requirements, including but not limited to: the Endangered Species Act of 1973 (16 U.S.C. 1531 et seq.); the Coastal Zone Management Act of 1972 (16 U.S.C. 1451 et seq.); the Migratory Bird Treaty Act (16 U.S.C. 703 et seq.); the National Marine Sanctuaries Act (16 U.S.C. 1431 et seq.); the National Historic Preservation Act (12 U.S.C. 470 et seq.); the Marine Mammal Protection Act (16 U.S.C. 1361 et seq.); and the Archaeological Resources Protection Act (16 U.S.C. 470 et seq.).
2.8.2 Permits and Other Access Agreements The field work associated with sample collection will require limited disturbance of Anacostia River sediments, surface water and benthic and pelagic aquatic organisms. To comply with many of the ARARs noted in the section above, certain permits, permissions and access agreements are required. Below is a list of the permits, permissions and other access agreements that will be obtained prior to Anacostia River RI sampling activities to comply with the ARARs:
• CWA Section 402/404 and RHA Section 10 Permit. Nationwide Permit #6 for Survey Activities and General Permit issued by the Baltimore District of the U.S. Army Corps of Engineers. Purpose: to address sediment disturbance in a water of the U.S.
• CWA Section 401 Water Quality Certifications. District of Columbia Department of the Environment, Water Division and the Maryland Department of the Environment (MDE). Purpose: to provide State-specific CWA water quality considerations that go further than federal requirements are addressed.
• Maryland Wetland License. Maryland Department of the Environment. Purpose: obtain a General License from the Maryland Board of Public Works to conduct sampling in the Anacostia River within Maryland (authority delegated to MDE).
• Maryland Scientific Collection Permit. Maryland Department of Natural Resources. Purpose: to collect fish, turtles, and benthic organism tissue samples for scientific study.
• NPS Research and Collection Permit. Issued by the National Park Service since the Anacostia River is partially on National Park Service managed lands. Purpose: address NPS considerations regarding sample collection and river access on NPS lands.
Notification letters announcing and describing the sampling activities will be sent to the following governmental agencies to ensure that others with responsibilities involving the Anacostia River will be aware of the mobilization of equipment on the river:
� U. S. Coast Guard � U.S. Navy � Capital Police
� DC Police � PG County Police � PG County Parks and Recreation

!!!!!!!!!!!!!!!!!!!!!!!!!!!!!!!!!!!!!!!!!!!!!!!!!!!!!!!!!!!!!!!!!!!!!!!!!!!!!!!!!!!!!!!!!!!!!!!!!!!!!!!!!!!!!!!!!!!!!!!!!!!!!!!!!!!!!!!!!!!!!!!!!!!!!!!!!!!!!!!!!!!!!!!!!!!!!!!!!!!!!!!!!!!!!!!!!!!!!!!!!!!!!!!!!!!!!!!!!!!!!!!!!!!!!!!!!!!!!!!!!!!!!!!!!!!!!!!!!!!!!!!!!!!!!!!!!!!!!!!!!!!!!!!!!!!!!!!!!!!!!!!!!!!!!!!!!!!!!!!!!!!!!!!!!!!!!!!!!!!!!!!!!!!!!!!!!!!!!!!!!!!!!!!!!!!!!!!!!!!!!!!!!!!!!!!!!!!!!!!!!!!!!!!!!!!!!!!!!!!!!!!!!!!!!!!!!!!!!!!!!!!!!!!!!!!!!!!!!!!!!!!!!!!!!!!!!!!!!!!!!!!!!!!!!!!!!!!!!!!!!!!!!!!!!!!!!!!!!!!!!!!!!!!!!!!!!!!!!!!!!!!!!!!!!!!!!!!!!!!!!!!!!!!!!!!!!!!!!!!!!!!!!!!!!!!!!!!!!!!!!!!!!!!!!!!!!!!!!!!!!!!!!!!!!!!!!!!!!!!!!!!!!!!!!!!!!!!!!!!!!!!!!!!!!!!!!!!!!!!!!!!!!!!!!!!!!!!!!!!!!!!!!!!!!!!!!!!!!!!!!!!!!!!!!!!!!!!!!!!!!!!!!!!!!!!!!!!!!!!!!!!!!!!!!!!!!!!!!!!!!!!!!!!!!!!!!!!!!!!!!!!!!!!!!!!!!!!!!!!!!!!!!!!!!!!!!!!!!!!!!!!!!!!!!!!!!!!!!!!!!!!!!!!!!!!!!!!!!!!!!!!!!!!!!!!!!!!!!!!!!!!!!!!!!!!!!!!!!!!!!!!!!!!!!!!!!!!!!!!!!!!!!!!!!!!!!!!!!!!!!!!!!!!!!!!!!!!!!!!!!!!!!!!!!!!!!!!!!!!!!!!!!!!!!!!!!!!!!!!!!!!!!!!!!!!!!!!!!!!!!!!!!!!!!!!!!!!!!!!!!!!!!!!!!!!!!!!!!!!!!!!!!!!!!!!!!!!!!!!!!!!!!!!!!!!!!!!!!!!!!!!!!!!!!!!!!!!!!!!!!!!!!!!!!!!!!!!!!!!!!!!!!!!!!!!!!!!!!!!!!!!!!!!!!!!!!!!!!!!!!!!!!!!!!!!!!!!!!!!!!!!!!!!!!!!!!!!!!!!!!!!!!!!!!!!!!!!!!!!!!!!!!!!!!!!!!!!!!!!!!!!!!!!!!!!!!!!!!!!!!!!!!!!!!!!!!!!!!!!!!!!!!!!!!!!!!!!!!!!!!!!!!!!!!!!!!!!!!!!!!!!!!!!!!!!!!!!!!!!!!!!!!!!!!!!!!!!!!!!!!!!!!!!!!!!!!!!!!!!!!!!!!!!!!!!!!!!!!!!!!!!!!!!!!!!!!!!!!!!!!!!!!!!!!!!!!!!!!!!!!!!!!!!!!!!!!!!!!!!!!!!!!!!!!!!!!!!!!!!!!!!!!!!!!!!!!!!!!!!!!!!!!!!!!!!!!!!!!!!!!!!!!!!!!!!!!!!!!!!!!!!!!!!!!!!!!!!!!!!!!!!!!!!!!!!!!!!!!!!!!!!!!!!!!!!!!!!!!!!!!!!!!!!!!!!!!!!!!!!!!!!!!!!!!!!!!!!!!!!!!!!!!!!!!!!!!!!!!!!!!!!!!!!!!!!!!!!!!!!!!!!!!!!!!!!!!!!!!!!!!!!!!!!!!!!!!!!!!!!!!!!!!!!!!!!!!!!!!!!!!!!!!!!!!!!!!!!!!!!!!!!!!!!!!!!!!!!!!!!!!!!!!!!!!!!!!!!!!!!!!!!!!!!!!!!!!!!!!!!!!!!!!!!!!!!!!!!!!!!!!!!!!!!!!!!!!!!!!!!!!!!!!!!!!!!!!!!!!!!!!!!!!!!!!!!!!!!!!!!!!!!!!!!!!!!!!!!!!!!!!!!!!!!!!!!!!!!!!!!!!!!!!!!!!!!!!!!!!!!!!!!!!!!!!!!!!!!!!!!!!!!!!!!!!!!!!!!!!!!!!!!!!!!!!!!!!!!!!!!!!!!!!!!!!!!!!!!!!!!!!!!!!!!!!!!!!!!!!!!!!!!!!!!!!!!!!!!!!!!!!!!!!!!!!!!!!!!!!!!!!!!!!!!!!!!!!!!!!!!!!!!!!!!!!!!!!!!!!!!!!!!!!!!!!!!!!!!!!!!!!!!!!!!!!!!!!!!!!!!!!!!!!!!!!!!!!!!!!!!!!!!!!!!!!!!!!!!!!!!!!!!!!!!!!!!!!!!!!!!!!!!!!!!!!!!!!!!!!!!!!!!!!!!!!!!!!!!!!!!!!!!!!!!!!!!!!!!!!!!!!!!!!!!!!!!!!!!!!!!!!!!!!!!!!!!!!!!!!!!!!!!!!!!!!!!!!!!!!!!!!!!!!!!!!!!!!!!!!!!!!!!!!!!!!!!!!!!!!!!!!!!!!!!!!!!!!!!!!!!!!!!!!!!!!!!!!!!!!!!!!!!!!!!!!!!!!!!!!!!!!!!!!!!!!!!!!!!!!!!!!!!!!!!!!!!!!!!!!!!!!!!!!!!!!!!!!!!!!!!!!!!!!!!!!!!!!!!!!!!!!!!!!!!!!!!!!!!!!!!!!!!!!!!!!!!!!!!!!!!!!!!!!!!!!!!!!!!!!!!!!!!!!!!!!!!!!!!!!!!!!!!!!!!!!!!!!!!!!!!!!!!!!!!!!!!!!!!!!!!!!!!!!!!!!!!!!!!!!!!!!!!!!!!!!!!!!!!!!!!!!!!!!!!!!!!!!!!!!!!!!!!!!!!!!!!!!!!!!!!!!!!!!!!!!!!!!!!!!!!!!!!!!!!!!!!!!!!!!!!!!!!!!!!!!!!!!!!!!!!!!!!!!!!!!!!!!!!!!!!!!!!!!!!!!!!!!!!!!!!!!!!!!!!!!!!!!!!!!!!!!!!!!!!!!!!!!!!!!!!!!!!!!!!!!!!!!!!!!!!!!!!!!!!!!!!!!!!!!!!!!!!!!!!!!!!!!!!!!!!!!!!!!!!!!!!!!!!!!!!!!!!!!!!!!!!!!!!!!!!!!!!!!!!!!!!!!!!!!!!!!!!!!!!!!!!!!!!!!!!!!!!!!!!!!!!!!!!!!!!!!!!!!!!!!!!!!!!!!!!!!!!!!!!!!!!!!!!!!!!
!!!!!!!!!!!!!!!!!!!!!!!!!!!!!!!!!!!!!!!!!!!!!!!!!!!!!!!!!!!!!!!!!!!!!!!!!!!!!!!!!!!!!!!!!!!!!!!!!!!!!!!!!!!!!!!!!!!!!!!!!!!!!!!!!!!!!!!!!!!!!!!!!!!!!!!!!!!!!!!!!!!!!!!!!!!!!!!!!!!!!!!!!!!!!!!!!!!!!!!!!!!!!!!!!!!!!!!!!!!!!!!!!!!!!!!!!!!!!!!!!!!!!!!!!!!!!!!!!!!!!!!!!!!!!!!!!!!!!!!!!!!!!!!!!!!!!!!!!!!!!!!!!!!!!!!!!!!!!!!!!!!!!!!!!!!!!!!!!!!!!!!!!!!!!!!!!!!!!!!!!!!!!!!!!!!!!!!!!!!!!!!!!!!!!!!!!!!!!!!!!!!!!!!!!!!!!!!!!!!!!!!!!!!!!!!!!!!!!!!!!!!!!!!!!!!!!!!!!!!!!!!!!!!!!!!!!!!!!!!!!!!!!!!!!!!!!!!!!!!!!!!!!!!!!!!!!!!!!!!!!!!!!!!!!!!!!!!!!!!!!!!!!!!!!!!!!!!!!!!!!!!!!!!!!!!!!!!!!!!!!!!!!!!!!!!!!!!!!!!!!!!!!!!!!!!!!!!!!!!!!!!!!!!!!!!!!!!!!!!!!!!!!!!!!!!!!!!!!!!!!!!!!!!!!!!!!!!!!!!!!!!!!!!!!!!!!!!!!!!!!!!!!!!!!!!!!!!!!!!!!!!!!!!!!!!!!!!!!!!!!!!!!!!!!!!!!!!!!!!!!!!!!!!!!!!!!!!!!!!!!!!!!!!!!!!!!!!!!!!!!!!!!
!!!!!!!!!!!!!!!!!!!!!!!!!!!!!!!!!!!!!!!!!!!!!!!!!!!!!!!!!!!!!!!!!!!!!!!!!!!!!!!!!!!!!!!!!!!!!!!!!!!!!!!!!!!!!!!!!!!!!!!!!!!!!!!!!!!!!!!!!!!!!!!!!!!!!!!!!!!!!!!!!!!!!!!!!!!!!!!!!!!!!!!!!!!!!!!!!!!!!!!!!!!!!!!!!!!!!!!!!!!!!!!!!!!!!!!!!!!!!!!!!!!!!!!!!!!!!!!!!!!!!!!!!!!!!!!!!!!!!!!!!!!!!!!!!!!!!!!!!!!!!!!!!!!!!!!!!!!!!!!!!!!!!!!!!!!!!!!!!!!!!!!!!!!!!!!!!!!!!!!!!!!!!!!!!!!!!!!!!!!!!!!!!!!!!!!!!!!!!!!!!!!!!!!!!!!!!!!!!!!!!!!!!!!!!!!!!!!!!!!!!!!!!!!
!!!!!!!!!!!!!!!!!!!!!!!!!!!!!!!!!!!!!!!!!!!!!!!!!!!!!!!!!!!!!!!!!!!!!!!!!!!!!!!!!!!!!!!!!!!!!!!!!!!!!!!!!!!!!!!!!!!!!!!!!!!!!!!!!!!!!!!!!!!!!!!!!!!!!!!!!!!!!!!!!!!!!!!!!!!!!!!!!!!!!!!!!!!!!!!!!!!!!!!!!!!!!!!!!!!!!!!!!!!!!!!!!!!!!!!!!!!!!!!!!!!!!!!!!!!!!!!!!!!!!!!!!!!!!!!!!!!!!!!!!!!!!!!!!!!!!!!!!!!!!!!!!!!!!!!!!!!!!!!!!!!!!!!!!!!!!!!!!!!!!!!!!!!!!!!!!!!!!!!!!!!!!!!!!!!!!!!!!!!!!!!!!!!!!!!!!!!!!!!!!!!!!!!!!!!!!!!!!!!!!!!!!!!!!!!!!!!!!!!!!!!!!!!!!!!!!!!!!!!!!!!!!!!!!!!!!!!!!!!!!!!!!!!!!!!!!!!!!!!!!!!!!!!!!!!!!!!!!!!!!!!!!!!!!!!!!!!!!!!!!!!!!!!!!!!!!!!!!!!!!!!!!!!!!!!!!!!!!!!!!!!!!!!!!!!!!!!!!!!!!!!!!!!!!!!!!!!!!!!!!!!!!!!!!!!!!!!!!!!!!!!!!!!!!!!!!!!!
!!!!!!!!
!!!!!!!!!!!!!!!!!!!!!!!!!!!!!!!!!!!!!!!!!!!!!!!!!!!!!!!!!!!!!!!!!!!!!!!!!!!!!!!!!!!!!!!!!!!!!!!!!!!!!!!!!!!!!!!!!!!!!!!!!!!!!!!!!!!!!!!!!!!!!!!!!!!!!!!!!!!!!!!!!!!!!!!!!!!!!!!!!!!!!!!!!!!!!!!!!!!!!!!!!!!!!!!!!!!!!!!!!!!!!!!!!!!!!!!!!!!!!!!!!!!!!!!!!!!!!!!!!!!!!!!!!!!!!!!!!!!!!!!!!!!!!!!!!!!!!!!!!!!!!!!!!!!!!!!!!!!!!!!!!!!!!!!!!!!!!!!!!!!!!!!!!!!!!!!!!!!!!!!!!!!!!!!!!!!!!!!!!!!!!!!!!!!!!!!!!!!!!!!!!!!!!!!!!!!!!!!!!!!!!!!!!!!!!!!!!!!!!!!!!!!!!!!!!!!!!!!!!!!!!!!!!!!!!!!!!!!!!!!!!!!!!!!!!!!!!!!!!!!!!!!!!!
!
!!!!!!!!!!!!!!!!!!!!!!!!!!!!!!!!!!!!!!!!!!!!!!!!!!!!!!!!!!!!!!!!!!!!!!!!!!!!!!!!
!
!!!!!!!!!!!!!!!!!!!!!!!!!!!!!!!!!!!!!!!!!!!!!!!!!!!!!!!!!!!!!!!!!!!!!
!!!!!!!!!!!!!!!!!!!!!!!!!!!!!!!!!!!!!!!!!!!!
!!!
!!!!!!!!!!!!!!!!!!!!!!!!!!!!!!!!!!!!!!!!!!!!!!!!!!!!!!!!!!!!!!!!!!!!!!!!!!!!!!!!!!!!!!!!!!!!!!!!!!!!!!!!!
!!!!
!!!!!!!!!!!!!!!!!!!!!!!!!!!!!!!!!!!!!!!!!!!!!!!!!!!!!!!!!!!!!!!!!!!!!!!!!!!!!!!!!!!!!!!!!!!!!!!!!!!!!!!!!!!!!!!!!!!!!!!!!!!!!!!!!!!!!!!!!!!!!!!!!!!
!!!!!!!!!!!!!!!!!!!!!!!!!!!!!!!!!!!!!!!!!!!!!!!!!!!!!!!!!!!!!!!!!!!!!!!!!!!!!!!!!!!!
!!!
!!!!!!!!!!!!!!!!!!!!!!!!!!!!!!!!!!!!!!!!!!!!!!!!!!!!!!!!!!!!!!!!!
!!!!!!!!!!!!!!!!!!!!!!!!!!!!!!!!!!!!!!!!!!!!!!!!!!!!!!!!!!!!!!!!!!!!!!!!!!!!!!!!!!!!!!!!!!!!!!!!!!!!!!!!!!!!!!!!!!!!!!!!!!!!!!!!!!!!!!!!!!!!!!!!!!!!!!!!!!!!!!!!!!!!!!!!!!!!!!!!!!!!!!!!!!!!!!!!!!!!!!!!!!!!!!!!!!!!!!!!!!!!!!!!!!!!!!!!!!!!!!!!!!!!!!!!!!!!!!!!!!!!!!!!!!!!!!!!!!!!!!!!!!!!!!!!!!!!!!!!!!!!!!!
!!!
!!!!!!!!!!!!!!!!!!!!!!!!!!!!!!!!!!!!!!!!!!!!!!!!!!!!!!!!!!!!!!!!!!!!!!!!!!!!!!!!!!!!!!!!!!!!!!!!!!!!!!!!!!!!!!!!!!!!!!!!!!!!!!!!!!!!!!!!!!!!!!!!!!!!!!!!!!!!!!!!!!!!!!!!!!!!!!!!!!!!!!!!!!!!!!!!!!!!!!!!!!!
!!!!!!!!!!!!!!!!!!!!!!!!!!!!!!!!!!!!!!!!!!!!!!!!!!!!!!!!!!!!!!!!!!!!!!!!!!!!!!!!!!!!!!!!!!!!!!!!!!!!!!!!!!!!!!!!!!!!!!!!!!!!!!!!!!!!!!!!!!!!!!!!!!!!!!!!!!!!!!!!!!!!!!!!!!!!!!!!!!!!!!!!!!!!!!!!!!!!!!!!!!!!!!!!!!!!!!!!!!!!!!!!!!!!!!!!!!!!!!!!!!!!!!!!!!!!!!!!!!!!!!!!!!!!!!!!!!!!!!!!!!!!!!!!!!!!!!!!!!!!!!!!!!!!!!!!!!!!!!!!!!!!!!!!!!!!!!!!!!!!!!!!!!!!!!!!!!!!!!!!!!!!!!!!!!!!!!!!!!!!!!!!!!!!!!!!!!!!!!!
!!!
!!!!!!!!!!!!!!!!!!!!!!!!!!!!!!!!!!!!!!!!!!!!!!!!!!!!!!!!!!!!!!!!!!!!!!!!!!!!!!!!!!!!!!!!!!!!!!!!!!!!!!!!!!!
!!!!!!!!!!!!!!
!!!!!!!!!!!!!!!!!!!!!!!!!!!!!!!!!!!!!!!!!!!!!!!!!!!!!!!!!!!!!!!!!!!!!!!!!!!!!!!!!!!!!!!!!!!!!!!!!!!!!!!!!!!!!!!!!!!!!!!!!!!!!!!!!!!!!!!!!!!!!!!!!!!!!
!!!!!!!!!!!!!!!!!!!!!!!!!!!!!!!!!!!!!!!!!!!!!!!!!!!!!!!!!!!!!!!!!!!!!!!!!!!!!!!!!!!!!!!!!!!!!!!!!!!!!!!!!!!!!!!!!!!!!!!!!!!!!!!!!!!!!!!!!!!!!!!!!!!!!!!!!!!!!!!
!!!!!!!!!!!!!!!!!!!!!!!!!!!!!!!!!!!!!!!!!!!!!!!!!!!!!!!!!!!!!!!!!!!!!!!!!!!!!!!!!!!!!!!!!!!!!!!!!!!!!!!!!!!!!!!!!!!!!!!!!!!!!!!!!!!!!!!!!!!!!!!!!!!!!!!!!!!!!!!!!!!!!!!!!!!!!!!!!!!!!!!!!!!!!!!!!!!!!!!!!!!!!!!!!!!!!!!!!!!!!!!!!!!!!!!!!!!!!!!!!!!!!!!!!!!!!!!!!!!!!!!!!!!!!!!!!!!!!!!!!!!!
!!!!!!!!!!!!!!!!!!!!!!!!!!!!!!!!!!!!!!!!!!!!!!!!!!!!!!!!!!!!!!!!!!!!!!!!!!!!!!!!!!!!!!!!!!!!!!!!!!!!!!!!!!
!!!!!!!!!!!!!!!!!!!!!!!!!!!
!!
!!!!!!!!!!!
!!!!!!!!!
!!!!!!!!!
!!!!!!!!!
!!!!!!!!!!!!!!!!
!!!!!!!!!
!!!!!!!!!
!!!!!!!!!
!!!!!!!!!!!!!!!!!!
"""""""""""""""""""""""""""""""""""""""""""""""""""""""""""""""
"""""""""
""""""""""""""""""
""""""""""""
""""""""""""""""""""""""""""""""""""""""""""""""""""""""""""""""""
"""""""""""""""""""""""""""""""" """"""""""""""""""""""""""""""""""""""""""""""""""""""""""""""""""""""""""""""""""""""""""""""""""""""""""""""""""""""""""""""
""""""""""""""""""""""""""""""""""""""""""
"""""""""""""""""""""""""""""""""""""""""""""""""""""""""""""""""""""""""
"""""""""""""""""""""
"""""""""""""""""""""
"""""""""""""
""""""""
"""""""" """""""""""""""""""""
"""""""""""""""""""""
"""""""""""""""""""""""""""""""""""""""""""""""""""""""""""
"""""""""""""""""""""""""""""""""""
"""""""""""""""""
"""""""""""""""""""""""""""""""""""""""""""""""""""""""""""""""
"""""""""""""""""""""""""""""""""""""""""""""""""""""""""""""""""""""""""""""""""""""""""""""""""""""""""""""""""""""""""""""""""""""
"""""""
"""""""""""""""""""""""""""""""""""
""""""""""""""
""""""""""""""
""""""""""""""
"""""""""""""""""""""""""""""""""""""""
"""""""""""""""""""""""""""""""""""""""
"""""""""""""""""""""
"""""""
"""""""
""""""" """""""
"""""""
""""""""""""""""""""""""""""
"""""""""""""""""""""
""""""""""""""""""""""""""""""""""""""""""""""""""""""""
"""""""""""""""""""""""""""""""""""
""""""""""""""""""""""""""""""""""""""""""""""""""""""""""""""""""""""""""""""""""""""""""""""""""""""""""""""""""""
""""""""""""""""""""""""""""""""""""""""""""""""""""""""""""""""""""""""""""""""
""""""""""""" """"""""""""""""""""""""""""""""""""""""""""""""""""""""""""""""""""""""""""""""""""""""""""""""""""""""" """"""""""""""""""""""""""""""""""""""""""""""""""""""""""""""""""""""
"""""""""""""""""""""""""""""""""""""""""""""""""""""""""""""""""""""""""""""""""""""""""""""""""""""""""""""""""""""""""""""""""""""""""""""""""""""""""""""""""""""""""""""""""""""""""
"""""""""""""""
"""""""""""""""""""""""""""""""""""
""""""""""""""""""""""""""
" """"""""""""""
"""""""""""""""""""""""""""""""""""""""""""""""""""
"""""""""""""""""""""""""""""""""""
"""""""""""""""""""""""""""""""""""
"""""""""""""""""""""""""""""""""" """"""
""""""""""""""""""""""
""""""""""""""
"""""""""""""""""""""""" """"""""""""""""""""""""""""""""""""""""""""""""""""""""""""""""""""""""""""""""""""""""""""""""""""""""""""""""""
"""""""""""""""""""""""""""""""""""""""""""""""""""""""""""""""""""""""""""""""""""""""""""""""""""""""""
""""""""""""""""""""""""""""""""""""""""""""""""""""""""""""""""""""""""""""""""""""""""""""""""""""""""""""""""""""""""""""""""""""""""""""""""""""""""""""""""""""""""""""""""""""""""""""""""""""""""""""""""""""""""""""""""""""""""""""""""""""""""""""""""""""""""""""""""" """""""""""""""
"""""""""""""""""""""""""""""""""""""""""""""""""""""""""""""""""""""""""""""""""""""""""""""""""""
""""""""""" """"""""""""""""""""""""""""""""""""""""""""""""""""""""""""""""""""""""""""""""""""""""""""""""""""""""""""""""""""""""""""""""""""""""""""""""""""""""""""""""""""""""""""""""""""""""""""""""""""""""""""""""""""""""""""""""""""""""""""
"""""""""""""
"""""""""""""""""""""""""""""" """""""""""""""""""""""""""""""""""""""""""""""""""""""""""""""""""""""""""""""""""""""""""""""""""""""""""""""""""""""""""""""""""""""""""""""""""""""""""""""""""""""""""""""""""""""""""""""""""""""""""""""""""""""""""""""""""""""""""""""""""""
""""""""""""""""""""""""""""""""""""""""""""""""""""""""""""""""""""""""""""""""""""""""""""""""""""""""""""""""""""""""""""""""""""""""""""""""""""""""""""""""""""""""""""""""""""""""""""""""""""""""""""""""""""""""""""""""""""""""""""""""""""""""""""""""""""""""""""""""""""""""""""""""""""""""""""""""""""""""""""""""""""""""""""""""""""""""""""""""""""""""""""""""""""""""""""""""""""""""""""""""""""""""""""""""""""""""""""""""""""""""""""
""""""""""""""""""""""""""""""""""""""""""""""""""""""""""""""""""""""""""""""""""""""
"""""""""""""""""""""""""""""""""""""""""""""""""""""""""""""""""""""""""""""""""""""""""""""""""""
""""""""""""""""""""""""""""""""""""""""""""""""""""""""""""""""""" """""""""""""""""""""""""""""""""""""""""""""
""""""""""""""""""""""""""""""""""""""""""""""""""""""
""""""""""""""""""""""""""""""""""""""""""""""""""""""""""""""""""""""""""""""""""""""""""""""""""""""""""""""""""""""""""""""""""""""""""""""""""""""""""""""""""""""""""""""""""""""""""""""""""""""""""""""""""""""""""""""""""""""""""""""""""""""""""""""""""""""""""""""""""""""""""""""""""""""""""""""""""
""""" """ ""
"""""""""""""""""""""""""""""""""""""
"""
"
"
"" ""
"""""""""""""""""""""""""""""""""""""""""""""""""""""""""""""""""""""""""""
"
"""""""
""
"
"
"
" "
"
""""
""""""""""""""""""""""""""""""""""""""""""""""""""""""
""""""""""""""""""""""""""""""""""""""""
""""""""""""""""""""""""""""""""""""""""""""""""""""""""""""
"""""""""""""""""""""""""""""""""""""""""""""""""" """""""""""""""""""""""""""""" """"""""""""""""""""
""""""""""
""""""""""""""""""""""""""""""""""""""""""""""""""""""""""""
""""""""""""""""""""
"""""""""""""""""""" """"""""""
""""""""""""""""""""""""""""""""""""""""
""""""""""""""""""""
""""""""""
"""""""""" """"""""""
"
""""""
"""""
"""""""""
"
"
" "
"
""""
"""
""""""""
"
"
" "
"
"""
"""
""""""""
"
""""""""""""""""""""""""""""""""
"""""""""""""""""""""""""""""""""""""""""""""
"""""""""""""""""""""""""""""""""""""""""""""""""""""""""""""
""""""""
"""""""""""""""""
""""""""""""""""
""""""""""""""""""""""""""
""""""""
""""""""
"""""""" "
"
"""""""""""
"""
"
""""""
"""""
"""""""""
"
"
" "
"
""""
"""
""""""""
"""""""""""""""""""""""""""""""""""""""""""""""""""""""""""""""""" """""""""""""""""""""""""""""""""""""""""""""""""""""""""""""""" """"""""""""""""""""""
""""""""""""""""""""""
""""""""""""""""""""""""""""""""""""""""""
"""""""""""""""""""""""""""""""""""""""""""
""""""""""""""""""""""""""""""""""""""""""""""""""""""""""""""""""""""""""""""""""""""""""""""""""""""""""""""""""""""""""""""""""""""""""""""""""""""""""""""""""""""""""""""""""""""""""""""""""""""
"""""""""""""""""""""
"""""""""""""""""""""
"""""""""""""""""""""" """""""""""""""""""""
"""""""""""""""""""""
""""""""""""""""""""""""""""""""""""""""""""""""""""""""""""""""""""""""""""""""""""""
""""""""""""""""""""""""""""""""""""""""""""""""""""""""""""""""
"""""""""""""""""""""""""""""""""""""""""""""""""""""""""""""""""""""""""""""""""""""""""""""""""""""""""""""""""""""""""""""""""""""""""""""""""""""""""""""""""""""""""""
"""
""
"
"
"
"
""
""
"""""
"""""""""""""""""""""
"""""""
"""""""
""""""""""""""""""""
"
""""""
"""""
"""""""""
"
"
" "
"
""""
"""
""""""""
"
"
""""""
"""""
"""""""""
"
"
" "
"
""""
"""
""""""""
"""
"
""""""
"""""
""""""
"
"
" "
"
""""
"""
""""""""
""
"
""""""""""""""""""""
"""""""""""
"""""""""""
"""""""""""""""""""""""""""""""""""""""""""""""""""""""""""""""""""""""""""""""""""""""""""""""""""""""""""""""""""""""""""""""""""""""""""""""""""
""""""
""""""""""""
"""""""""""""""""""""
"""""
""""""""""""""""""""" """""""""""
""""""
"""""""""""""""""""""""""""""""""""""""""""""""""""""""""""""""""""""""""""""""""""""""""""""""""""""""""""
"
"""""""""""""""""""""""""""""""""""""""""""""""""""""""""""""""""""""""""""""""""""
"
" """"""
"""""""""
"
"""""""""""""""""""
"
""""""""""""""
""""""""""""""""""""""""""""""""""""""""""""""""""
""""""
"""""""""""""""""""""""""""""""""
"""""""""""""
"""""""""""
""""""""""""""""""
""""""
"
""""""
"
""""""
""""""""""""
"
""""
"""""""""""""""""""""""""""""""""""""""""""""""""""""""""""""""""""""""""""""""""""""""""""""""""""""""""""
""""""""" """"""""""""""""""""""""""
"""""""""""""""""""""""""""""""""""""""""""""""""""""""""""""""""""""""""""""""""""""""""""""""""""""""""""
"""""""""""""""""""""
"""
"
"
"""""""
""
"""""""""""
"""""""""
""""""
"
"""""""""""""""""""""""""""""""""""""""""""""""""""""""""""""""""""""""""""""""""""""""""""""""""""""""""""
""""""""""""""""""""""""""""""""""""""""""""""""""
""""
"
"
"""""""""""
"""""""""""""""""""""""""""""""""""""""""""""""""""""""""""""""""""""""""""""""""""""""""""""""""""""""""""
"
""""""""""""""""""""""""
""""""""""""""""""""""
""""""""""""""
"
"""""""""""
"
"""""""""""
""""""
"
""""""""""""""""""""""""""""""""""""""""""""
"""""""""""""
"""""""""""
""""""""""""""""""""""""""""""""""""""""""""""""""
"
"
"""""""""""
"""""""""""
""""""
"""""""""""""""""""""""""""""""""""""""""""""""""""""""""""""""""""""""""""""""""""""""""""""""""""""""""""
""""""""""""""""""""""""""""""""""""""""""""""""""
"
"""
"
"""""""""""""""""""""""""""""""""""""""""""""""""""""""""""""""""""""""""""""""""""""""""""""""""""""""""""
""""""""""""
""""""
"""""""""""
"
""""""
""""""""""""
"""
"
"""""""""""
""""""""" """""""""""
""""""""""""""""""""""""""""""""""""""""""""""""""""""""""""""""""""""""""""""""""""""""""""""""""""""""""""
"
"
""""""""""""""""""""""""
"
""""""
"""""""""""""""""""""""""""""""""""""""""""""""""""""""""""""""""""""""""""""""""""""""""""""""""""""""""""
""""""""""""
"
"""""
"
""""""""""
"
""""""""""""""""""""""""""""""""""""""""""""""""""""""""""""""""""
"""""""""""""""""""""""""""""""""""""""""""""""""""
""""""""""""""""""""
"
""""""""""""
"
"
""""""""""""""""""" """"""""
"""""""""""""""""""""""""""""""""""""""""""""""""""""""""""""""""""""""""""""""""""""""""""""""""""""""""""
"
"""
"""""""""""
" """
""""""
"
"
"""""""""""
""""""""""""
""""""
"""""""""""""""""""""""""""""""""""""""""""""""""""""""""""""""""""""""""""""""""""""""""""""""""""""""""""
"""""""""""""""""
"""""""""""""""""""""""""""""""""""""""""""""""
""""""""""""""""""""""""""""""""""""""""""""""""""
""""""
"
""""""""""
"""""""""""""""""""""""""""""""""""""""""""""""""""""""""""""""""""""""""""""""""""""""""""""""""""""""""""
""""""
""""""""""""""""""""""""""""""""""
"""""""""""""
"
""""""""""""""""""""""""""""""""""""""""""""""""""
"
"
"""""""""""""""""""""""""""""""""""""""""""""""""""""""""""""""
"""""""""""""""""""""""""""""""""""""""""""""""""""""""""""""""
"
"
"""""""""""""""""""""""""""""""""""""""""""""""""""""""""""""""""""""""""""""""""""""""""""""""
" """"""""""""""""""""""""
"""""""""""""""""""""""""""""""""""""""""""""""""""""""""""""""""""""""""""""""""""""""""""""""""""""""""""
"""""""""""""""""""""
""""""""""""""""""
""""""""""""""""""""""""""""""""""""""""""""""""""
""""""""""""""
"
""""""""""""
"""""""""""""""""""""""""""""""""""""""""""""""""""""""""""""""""""""""""""""""""""""""""""""""""""""""""""
"
"
""""""""""""""""""""""""""""""""""""""""""""""""""""""""""""
"""""""""
"""""""""""""""""""""""""""""""""""""""""""""""""""""
"""
"""""""""""
"
""""""""""""""""""""""""""""""""""""""""""""""""""""""""""""
"""""""""""""""""""""""""""""""""""""""""""""""
"""
"
""""""
"
"""
""
""""""""""""""""""
"
"""
"""""""""""""""""""""""""""""""
""""""
""""""
"""""""""""""""""""""
"""
"
""""""""""""""""""""""""""""""""""""""""""""""""""
""""""""""""""""""""""""""""""""""""""
"""""""""""
"""""""""""
""""""""""""""""""""""""""""""""""""""""""""""""""""""""""""""""""""""""""""""""""""""""""
"""""""""""""""""""""""""""""""""""""""""""""""""""""""""""""""""""""""""""""""""""""""""""""""""""""""""""
""""""""""""""""""""
"""""""""""""""""""""""""""""""""""""""""""""""""""""""""""""""""""""""""""""""""""""""""""""""""""""""""""
"""
""""""""""""""""""""""""""""""""""""""
"
""""""""""""""""""""""""""""""""""""""""""""""""""""""""" "
""""""
"""
"
"
""""""""""""""""""""""""""""""""""""""""""""""""""
"""
""""""""""""""""""""""""""""""""""""""
""""""""""""""""""""""""""""""""""""""""""""""""""
"
""""""
"
""""""
""""""""""""""""""""""""""""""""""""""""""""""""""
"
""""""""""""
"
""""""""""""""
"""""""""""
"""
"""
"""""""""""""""""""""
""""""""""""""""""""""""""""""""""""""""""""""""""
"""""""""""""""""""""
"""""""""""""""""""""""""""""""""""""""""""""""""""""""""""""""""""""""""""""""""""""""""""""""""""""""""""
"""""""
"""""""""""
"
""""""""""""""
"""
"""""""""""""""""""""""""""""""""""""""""""""""""""""""""""""""""""""
"""""""""""""""""""""""""""""""""""""""""""""""""""""""""""""""""""""""""""""""""""""""""""""""""""""""""""
"""""""""""""""""""""
"""""""""""""""""
"
"""""""""""
"""""""""""""""""""""""""""""""""""""""""""""""""""""""""""""""""""""""""""""""""""""""""""""""""""""""""""
""""""""""""""""""
"
"""""""""""""""""""""
"
"""""""""""
""""""""
"""""""""""""""""""""""""""""""""""""""""""""""""""""""""""""""""""""""""""""""""""""""""""""""""""""""""""
""""""""""""""""""
"
"
""""""
""""""""""""""""""""""""""""""
"""""""""""""""""""
"""""""""""""""""""""""""""""""""""""""""""""""""""""""""""""""""""""""""""""""""""""""""""""""""""""""""""
"""""""""""""""""
""""""
"""""""""""" """""""""""""""""""""""""""""""""""""""""""""""""""""""""""""""""""""""""""""""""""""""""""""""""""""""""""
"
"
"""""""""""
"""""""""""
""""""""""""""""""""""""""""""""""""""""""""""""""
"""
""""""""""""""""""""""""""""""""""""""""""""""""""""
"""""""""""
"
"""""""""""""""""""""""""""""""""""""""""
"""
"
"
"
""""""""""""""""""
"
"""
""""""""""""""
" """"""""""""""""""""""""
"""""""""""""""""
"""""""""""""""""""""""""""""""""""""""""""""""""""""""""""""""""""""""""""""""""""""""""""""""""""""""""""
""""""""""""""""""""""
"""""""""""""""""""""""""""""""""""""""""""""""""""""""""""""""""""""""""""""""""""""""""""""""""""""""""""
"
"""""""""""""""""""""""""""""""""""""""""""""""""""""""""""""""""""""""""""""""""""""""""""""""""""""""""""
"""""""""""""""""""""""""""""""""""""""""""""""""""""""""""""""""""""""""""""""""""""""""""""""""""""""""""
""""""""""""""""""""""""""""""""""""""""""""""""""
"""""""""""""""""""""""""""""""""""""""""""""""""""""""""""""""""""""""""""""""""""""""""""""""""""""""""""
""""""
"
"
"
""""""""""""""""""""
""""""""""""""""""""""""""""""""""""""""""""""""""
"""""""
"""""""""""""""""""""""""""""""""""""""""""""""""""""""""""""""""""""""""""""""""""
""""""""""""""""""""""""""""""""""
"""""""""""""""""""""
""""""
"
""""""
""""""""""""""""""""""""""""""""""""""""""""""""""
""""""""""""""""""""""""""""""
"
"
"""""""""""""""""""""""""""""""""""""""""""""""""""""""""""""""""""""""""""""""""""""""""""""""""""""""""""
"""""""""""
"""""""""""""""""""
"""""""""
""""""""""""""""""""""""
""""""""""""""""""""""""
""""""
"
"""""""""""""""""""""""""""""""""""""""
""
"""""""""""""""""""""""""""""""""""""""""""""""""""""""""""""""""""""""""""""""""""""""""""""""""""""""""""
""""""""""""""""""""""""""""""""""""""""""
"""
""""""""""""""""""""""
"
"""""""""""""""""""""""""""""""""""""""""""""""""""""""""""""""""""""""""""""""""""""""""""""""""""""""""""
"""""
"""""""""""""""""""""""""""""""""""""""""""""""""""""""""""""""""""""""""""""""""""""""""""""""""""""""""""
"""""""""""
"""""""""""""""""""""""""""""""""""""""""""""""""""""""""""""""""""""""""""""""""""""""""""""""""""""""""""
"""
""""""""""""""""""""""""""""""""
""""""""""""""""""""""""""""""
"""""""""""
""""""
""
"
"""""""""""""""""""""
"
""""""""""""""""""""
""
"" """"""""""""""""""""""""
""""""""""""""""""""""
""""""""""""""""""""""""""""""""""""""""""""""""
"""
""""""""""
""""""""""""""""""""""""""""""""""""""""""""""""""
""""""""""""
""""""""""""
"""""""""""""""""""""""""""""""""""""""
"""""""""""""""""""""""""""""""""""""""""""""""""""""""""""""""""""""""""""""""""""""""""""""""""""""""""""
"""""""""""
"
""""""""""""""""""""""
"
"
"
"
"""""""""""""""""""""""""
"
"
"""""""""""""""""""""""""""""""""""""""""""""""""""""""""""""""""""""""""""""""""""
""""
"
""
"
"""
""""""""""""
""""""""""""""""""""""""""""""""""""""""""""""""
"""""""""
"""""""""""""""""""""""""""""""""""""""""""""""""""""""""""""""""""""""""""""""""""""""""""""""""""""""""""
""""""""""""""""""""
" """""""""""""""""""
""""""""""""""""""""""""""""""""""""""""""""""""""
""""""""""""""""""""""""""""""""""""""""""""""""""
""""""""""""""""""""""""
"
"""""""""""
""""""""""""""""""""""""
"
""""""""""""""""""
"
"
"""""""""""""""""""""""
"""
""""""""""""""""""" """"""""""""""""""""""""""""""""""""""""""""""""""""""""""""""""""""""""""""""""""""""""""""""""""""""""""""
""""""
""""
"
""""""""""""""""""""""""""""""""""""""""""""""""""""
"
" """"""""
""" "
""""""
""""""""""""""""""""""""""""""""""""""""""""""""""""""""""""""""""""""""""""""""""""""""""""""""""""""""""""
"""""""""""""""""""""""""""""""""""""""""""""""""""""""""""
"
""""""""""""""""""""""""""""""""""""""""""""""""""
"
"
""""""""""""""""""""""""""""""""""""""""""""""""""
""""""""""""""""""""""""""""""""""""""""""""""""""
""
"""
"
""""""""""""""""""""""""""""""""""""""""""""
"
"""""""""""""""""""""""""""""""""""""""""""""""""""""""""""""""""""""""""""""""""""""""""""""""""""""""""""
"""""""""""""""""""""""""""""""""
"
""""""""" """""""""""""""""""""
""""""""""""""""""""""""""""""""""""""""""""""""""""""""""""""""""""""""""""""""""""""""""""""""""""""""""""
"""""""""""""""""""""""""""""""""""""""""""""""""""""""""""""""""""""""
"""""""""""""""""""""""""""""" """""""""""""""""""""""""""""""""""""""""""
"
"
""""""""""""""""""""""""""""""""""""""""""""""""""
"
"""""""""""
"""""""""""""""""""""""""""""""""""""""""""""""""""""""""""""""
"
"""""""""""""""""""""
"""""""""""
"""""""
"
"""""""""""
"
""""""""""""""
""""""
""""""""""""""""""""""""""""""""""""""""""""""""""
""""""""""""""""""""""""""""""""""""""""""""""""""""
"""""""""""
""""""""""""""""""""""""""""""""""""""""""""""""""""""""
"""""""""""
""""""""""""""""""""""
""""""""""""""""""""""""""""""""""""""
"""""""""""
"
""""""""""""""""""""""""""""""""""""""""""""""""""
"
"""""""""""""""
"""""""""""""""""""""""""""""""""""""""""""""""""""""""""""""""""""""""""""""""""""""""""""""""""""""""""""
""""""
"""""""""""""""""""""""""""""""""""""""""""""""""""""""""""""""""""""""""""""""""""""""""""""""""""""""""""""""""""""""
"""""""""""
""""""""""""""""""""""""
""""""
"""""""""""""""""""""""""
"""""""""""
"""""""""""
"""
""""""""""""""""""""""""""""""""""""""""""""""""""
"""
"
"""
""""""""""""""""""""""
"""""""""""""""""""""""""""""""""""""""""""""""""""""""""""""""""""""""""""""""""""""""""""""""""""""""""""
"
""""""""""""""
""""""""""""""""
""""""""""""""""""
"
""""""""""""""""""""" """""""""""""""""""
"""""""""""
"
"""""""""
"""""""""""""""""""""""""""""""""""""""""""""""""""""""""""""""""""""""""""""""""""""""""""""""""""""""""""
"""""""""""""""""""
"""
"""""""""""
"""""""""""""""""""
"
""""
"
"""""""""""""""""""""""""""""""""""""""""""""""""""""""""""""""""""""""""""""""""""""""""""""""""""""""""""
""""""""""""""""""" """"
"""""""""""
"""
"""""""""
"
"
"
"""""""""""""""""""""""""""""""""""""""""""""""""""""""""""""""""""""""""""""""""""""""""""""""""""""""""""
"""""""""""
""""""""""""""""
"
""""""""""""""""""""""""""""""""""""""""""""""""""""""""""""""""""""""""""
"
"
"""""""""""""""""
"""""""""""
""""""""""""
"
""""""""""""""""""""""""""""""""""""""""""""""""""
"""""""""""""""""""""""""""""
"""
"""""""""
"""""""""""
"""
"
"""""""""""""""
""""""
"""""""""""
""""
"""""""""""
"""""""""""""""""""" """""""""""""""""""""""
"
"""""""""
"""""""""""""
""""""""""""""
"
"""""""""
""""""""""""""""""""""""""""""""""""""""" """""""""""""""""""" """"""""""""""""""""""
"""""""""""""""""""""""""""""""""""""""""""""""""""""""""""""""""""""""""""""""""""""""""""""""""""""""""""
""""""""""""""""""""""""""""""""""""""""""""""""""
"
"""
"
"""
"""
""""""""""""""""""""""
"
"
"
""""""
"""
""""""""""""""""""" "
"""
""""""""""""""""""""""""""""""""""""""""" "" """"""""""""
"""""""
"""""""""
"""
"""""""""""""""""""""""""""""""""""""""""""""""""""""""""""""""""""""""""""""""""""""""""""""""""""""""""""""""""""""""""""""""
"""
"""""""""""""""""""
"""""""""""
""""""""""""""""""""""""""""""""""""""""""""""""""
"
"""
""""""""""""""
"""""""""""""""""""""""""""
""""""
""""""""""""""""""""""""""""""""""""""""""""""""""""""""""""""""""""""""""""""""""""""""""""""""""""""""""""""""""""""""""""""""""""""""""""""""""""""""""""""""""""""""""""""""""""""""""""""""""""""""""""""""""
"""
""""""""""""""""""""""""""""""""""""""""""""""""""""""""""""""""""""""""
""""""""""""""""
"
"""""""""""""""""""""""""""""""""""""""""""""""""""""""""""""""""""""""""""""""""""""""""""""""""""""""""""
"
"
"
""""""""""""""""""""""""""""""""""""""""""""""""""""""""
""""""
"""""""""""""""""""""""""""""""
"""""""""""
" """""""""""
"""""""""""
"""""""""""""""""""
"
""""""""""" """""""""""""""""""""""""""""""""""""""""""""""""""""""""""""""""""""""""""""""""""""""""""""""""""""""""""
"""""""""
"
"
""""""""""""""""""""""""""""""""""""""""""""""""""
"
""""""""""""""""""" "
"""
"""""""""""""""""""""""""""""""""""""""""""""""""""""""""""""""""""""""""""""""""""""""""""""""""""""""""""
""""""""""""""""""""""
""""""""""""""""""""""""""""""""""""""""""""""""""
"
""""""""""""""""""""""""""""""""""""""""""""""""""
"
"""""""""""""""""""""""""""""""""""""""""""""""""""""""""""""""""""""""""""""""""""""""""""""""""""""""""""
""""""
"""""""""""""""""""
""""""
"""""""""""""""""""""""""""""""""""""""""""""""""""""""""""""""""""""""""""""""""""""""""""""""""""""""""""
"
"
""""""""""""""""""""""""""""""""""""""""""""""""""
""""""""""""""""""""""
"""""""""""""""""""""""""""""""""""""""
"
"
"""""""""""""""""""""""""""""""""""""""""""""""""""""""""""""""""""""""""""""""""""""""""""""""""""""""""""
""""""""""
"""""
""
"""""""""""""""""""""
"""""""""
""""""""""""""""""""""""""""""""""""""""""""""""""
"""""""
"
""""""""""""""""""""""""""""""""""""""""""""""""""""""""""""""""
"
"""""""""""
"
"""
"
"""""""""""""""""""""""""""""""""""""""""""""""""""""""""""""""""""""""""""""""""""""""""""""""""""""""""""
""""""
"""""""""""
""""""""""""""""""""""""
"""""""""""
""""""""""""""
""""""""""""""""""""""""""""""""""""""""""""""""""
"""
""""""""""""""""""""""""""""""""""""""""""""""""""
"""""""""""""""""""
"""""""""""
""""""
"""""""""""""""""""""""""""""""""""""""""""""""
"
""""""
"""""""""""""""""""""""""""""""""""""""""""""""""""""""""""""""""""""""""""""""""""""""""""""""""""""""""""
""""""""""""""""""""""""""""""
""""""""""""""""""""""
""""""""""""""""""""""""""""""""""""""""""""""""""
"""
"
"""""""""""
"
""
""""""""""""""""""""""""""""""""""""""""""""""""""
""""""""""""""""""""""""""""""""""""""""""""""""""""""""""""""""""""""""""""""""""""""""""""""""""""""""""""""""""""""""""""""""""""""""""""""""""""""""""""""""""""""""""""""""""""""""""""""""""""""""""""""""""""""""""
""""""""""
"""""""""""""""""""""""""""""""""""""""""""""""""""""""""""""""""""""""""""""""""""""""""""""""""""""""""""""""""""""""""""""""
""""""""
"
""
""""""""""""""""""""""""""""""""""""""""""""""""""
"""""""""""
"
""""
"""
"""""""""""""""""""""""""""""
"""""""""""
"
""""""""""""""""""""""""""""""""""""""""""""""""""
"
""""""""""""""""""
""""""""""""""""""""""""""""""""""""""""""""""""""
"""""""""
""""""
""""""""""""
"""""""""""""""""""""""""""""""""""""""""""""""""""""""""""""""""""""""""""""""""""""""""""""""""""""""""""
"""""""""
"""""""""""
"
""""""
"""""""""""""""""""""""""""""""""""""""""""""""""""""""""""""""""""""""""""""""""""""""""""""""""""""""""""
"""""""""""""""""""""""""""""""""""
"
"""""""""""""""""""
"""""""""""""""""""
"""""""""""""""""""""""""""""""""""""""""""""""""""""""""""""""""""""""""""""""""""""""""""""""""""""""""""
"
"""""""""""
"""""""""""""""""""""""""""""" """"""""""""""
"""""""""""""""""""""""""""""""""""""""""""""""""""""""""""""""""""""""""""""""""""""""""""""""""""""""""""
""""""""""""""""""""""""""""""""""""""""""""""""""""""""""""
"
"""
""""""""""""
"
"
""""""""
""""""""""""
""""""""""""""""""""""""""""""""""""""""
"""""""""""""""""""""""""""""""""
""""""
""""""""
"
"""""""""
"""""""""""""""""""""""""""""""""""""""""""""""""""""""""""""""""""""""""""""""""""""""""""""""""""""""""""
""""""""""""""""""""""""""""""""""""""""
""""""""""""""""""""
"""""""""""""""""""""""""""""""""""""""""""""""""""""""""""""""""""""""""""""""""""""""""""""""""""""""""""
"" """
"
"
"""
""""""""""""""""""""" """""""""""""""""""""""""""""""""""""""
""""""
"
"""""""""" """"""""""""""
"""""""""""
""""
""""""
""""""""""""""""""""""""""""""""""""""""""""""""""
"""""""""""
"
"""""""""""""""""""""""""""""""""
"
""""""""""""""""""""""""""""""""""""""""""""""""""
"""
"""""""""""""""""""""
"
"""""""""""""""""""""
"
"
""
""""""""""""""""""""""""""""""""""""""""""""""""""
"""""""""""""""""""""""""
"""""""""""""""""""""""""
""""""
"""""""""""
""
"""""""""""""""""""""""""""""""""
""""""
"""""""""
"""""""""""""""""""""""""""""""""""""""""""""""""""""""""""""""""""""""""""""""""""""""""""""""""""""""""""
"
"""""""""""""""""""
""""""""""""""""""""""
""""""""""""""""""""""""""""""""""""""""""""""""""
"
""""""""""""""""""
"""
""""""""""""""
"""""""""""
"""""""""""""""""""""
"""""""""""""""""""""""""""""""""""""""""""""""""""""""""""""""""""""""""""""""""""""""""""""""""""""""""""
""""""""""""""""""""""
""""""""""""""""""""""""""""""""""""""""""""""""""
""
""""""
"
"
""""""
"
"""""""""""""""""""""""""""""""""""""""""""""""""""""""""""""""""""""""""""""""""""""""""""""""""""""""""""
"
""""""""""""""""""""""""""
""""""""""
""""""""""""""""""""""""""""""""""""""""""""""""""""""""""""""""""""""""""""""""""""""""""""""""""""""""""""""""""""""""""""""""
"""""""""""
"""""""""
""""""
""""""""
"
"""""""""""""""""""""""""""""""""""""""""""""""""""""""""""""""""""""""""""""""""""""""""""""""""""""""""""
"""""""""""""""""""
""""""""""""""""""""""""""""""""""""""""""""""""""
"
"""
""""""""""""""""""""""""""""""""""""""""""""""""""""""""""""""""""""""""""""""""""""""""""""""""""""""""""""""""""""""""""""""""
"
""""""
""""""""""
"
"""""""""""""""""""""""""""""""""""""""""""""""""""""""""""""""""""""""""""""""""""""""""""""""""""""""""""
""""""""""""""""""
"""""""""""
"""""""""""""""""""""
"""""""""""""""""""""""""""""""""""""""""""""""""""""""""""""""""""""""""""""""""""""""""""""""""""""""""""
""""""""""""""""""""
"
"
""""""
"""""""""
"""""""""""
"""""
""""""
""
"""""""""""
"""""""""""
"""""""""""""""""""""""""""""""""""""""""""""""""""""""""""""""""""""""""""""""""""""""""""""""""""""""""""
"
""""""""""""""""""
""""""
"""""
""""""""""""""""""""""""""""""""""""""""""""""""""
""""""""""
""
"""""""""""""""""""""""""""""""""""""""""""""""""""""""""""""""""""""""""""""""""""""""""""""""""""""""""""
"
""""""""""""""""""""
"""""""""
"
"""""""""" """""""""""""""""""""""""""""""""""""""""""""""""""""""""""""""""""""""""""""""""""""""""""""""""""""""""""""""""""""""
""""""""""""""
""""""""""""""""""""""""""""""""""""""""""""""""""
"
"""""""""
"
"""
"
"""""""""""""""""""""""""""""""""""""
"""""""""""""""""""""
""""""""""""""""""""""""""""""""""""""""""""
"""""""""
"
"""""""""""""""""""
""""""""" ""
""""""""""""""""""""""""""""""""""""""""""""""""""
""""""""""""""
"""""""""""""""""""""""""""""""""""""" """""""""""""" """"""""""
""""""""""""""""""""""""""""""""""""""""""""""""""
"""
"""""""""""
""""""""""""""""""""""""""""""""""""""""""""""""""
"""""""""""""""""""""""""""""""""""""""""""""""""""""""""""""""""""""""""""""""""""""""""""""""""""""""""""
"
""""""
"""""""""""""""""""
"""""""""""""""""""""""""""""""""""""""""""""""""""""""""""""""""""""""""""""""""""""""""""""""""""""""""""
"
"""""""""""""""""""""""""""""""""""""""""""""""""""""""""""""""""""""""""""""""""""
""""""""""""""""""""""""""""""""""""""""""""""""""
"""""""
"""""" "
""""""
""""""""""""""""""""""""""""""""""""""""""""""""""
""""""
"""
"
""""""""""""""""""""""""""""""""""""""""""""""""""
"""
"""""""""""
""""""""""""""""""
""""""
"""""""""""""""""""""""""""""""""""""""""""""""""""""""""""""""""""""""""""""""""""""""""""""""""""""""""""
""""""
"""
"""""""""""
"""""""
"
"
""""""""""""""""""""
"""""""""""""""""
"""""""""""
"
"""
""""""""""""""""""""""""""""""""""""""""""""""""""
"
"""""""""""
""""""
"
"""""""""""""""""""
""""""""""""""""""""""""""""""""""""""""""""""""""
"""""""""""""""""""""""""""""""
""""""""""""""""""""""""""""""""""""""""""""""""""
"""
""""""""
"""""""""
"
"
"
"""""""""""""""""""""""""""""""""""""""""""""""""""""""""""""""""""""""""""""""""""""""""""""""""""""""""""
""""""
"
"
"
"""""""""""""
"
""""""""""""""""""""""""""""""""""""""""""""""""""
"""""""""""""""""""""""""""""""""""""""""""" "
""""""
"""""""""
"""
"
"""
""""""""""""""""""""" """""""""""""""""""""
""
"""""""""""""""""""""""""""""""""""""""""""""""""""""""""""""""""""""""""""""""""""""""""""""""""""""""""""""""""""
"""""""""""""""""""""""""""""""""""""""""""""
"
""""""""""""""""""""""""""""""""
"""
""""""""" """""""""""""""""""""""""""""""""
"""""""""""""""""""""""""""""""""""""""""""""""""""""""""""""""""""""""""""""""""""""""""""""""""""""""""""
"""""""""""
"
"""""""""""""""""""""""
""""""""""""""""""""""""""""""""
""""""""""""
"
"""""""""""""""""""""""""""""""""""""""""""""""""""""""""""""""""""""""""""""""""""""""""""""""""""""""""""""""""""""""""""""""""""""""""""""""""""""""""""""""""""""""""""""""""""""""""""""""""""""""""""""""""""""""""""""""""""""""""
"""
""""""
"""""""""""""
"""
"""""""""""""""""""""""" """"
"""""""""""""""""
"""""
"""""""""""""
"
"""""""""""
""""""""""""""""""""""""""""""""""""""""""""""""""
"""""""""""""""
"
"
"
"""
"
"
"""""""""
""""""""""""""""""""""""""""""""""""""""""""""""""""""""""""""""""""""""""""""""""""""""""""""""""""""""""""""""""""""""""""""""""""""""""""""""""""""""""""""
"""""""""""""""""""""""""""""""""""""""""""""""""""""""""""""""""""""""""""""""""""""""""""""""""""""""""""""""
"""""""""""""""""""""""""""""""""""""""""""""""""""""""""""""""""""""""""""""""""""""""""""""""""""""""""""""""""""""""""""""""
"""""""""""""""""""""""""""""""""""""""""""""""""""""""""""""""""""""""""""""""""""""""""""""""""""""""""""
""""""""""
"""""""""""
""""""
""""""""""""""""""""""
""""""
""""""""""""""""""""""
"""""""""""""""""""""""""""""""""""""""""""""""""""""""""""""""""""""""""""""""""""""""""""""""""""""""""""
"
"""""""""""""""""""""""""""""""""""""""""""""""""""""""""""""""""""""""""""""""""""""""""""""""""""""""""""
""""
"
"""""""
""""""""""""""""""""""""""""""""""""""""""""
"""
"""""""""""""""""""""
""""""""""""""""""""""""""""""""""""""""""""""""""""" """"""""""""""""""""""""""""""""""""""""
"""""""""""
"""""""""""
"""""""""""""""""""""""""""""""""""""""""""""""""""""""""""""""""""""
""""""""""""" "
"""""""""""""""""""""""""""""""""""""""""""""""""""""""""""""""""""""""""""""""""""""""""""""""""""""""""""""""""""""""""""""""""""""""""""""""""""""""""""""""""""""""""""""""""""""""""""""""""""""""""""""""""""
""""""""""""""""""""""
"
"""""""""""""""""""""""""""""""
""""""
""""""""""""""""""""
"""""""
""""""""""""""""""""""""""""""""""""""""""""""""""""""""""""""""""""""""""""""""""""""""""""""""""""""""""""
"""""""""""""""""""""""""""""""""""""""""""""""""""""""""""""""""""""""""""""""""""""""""""""""""""""""""""
"
"
"
""""""""""""""""""""""""""""""""""""""""""""""""""""""""""""""""""""""
"""
"
"""""""""
"
""""""""""""" """"
"
"""""
"
"""""""""""""""""""""""""""
"""""""""""
""
"""""""""""""""""""""""""""""""""""""""""""""""""""""""""""""""""""""""""""""""""""""""""""""""""""""""""""
""""""""""""""""""" """"""""""""""
"""
""""""""""""""
"""""""""""""""""""""""""""""""""""""""""""""""""""""""""""""""""""""""""""""""""""""""""""""""""""""""""""
"""
"""""""""""""""""""
"
"
""""""""""""""""""""""""""
"""
"
"""""""""""""""""""
"
"""""""""""""""""""""
""""""
"""""""""""""""""""""""""""""""""""""""""""""""""""""""""""""""""""""""""""""""""""""""""""""""""""""""""""
" """""""""""""""""""""""""""""""""""""""""""""""""""""""""""""""""""
""""""
"
"
""""""""""""""""""""""""""""""""""""""""""""""""""
"
"
"""""""""""""""""""""""""
"
"""
"
""""""""""""""""""""""""""""""""""""""""""""""""""
""""""""""""""""""""""""""""""""""""""""""""""""""
"""""""""""""""""""""""""""""""""""""""""""""""""""
""""""
"
""""""""""""""""""""""""""""""""""""""""""""""""""""""""
""
""
""""""""""""
"""
"""""""""""""""""""""""""""""""""""""""""""""""""""""""""""""""""""""""""""""""""""""""""""""""""""""""""""
""""""
"""""""""""""""""
"""""""""""""""""""""""""""""""""""""""""""""""""""""""""""""""""""""""""""""""""""""""""""""""""""""""""""""
"
""""""""""""""""""""""""""""""""""""""""""""""""""
"
""""""
""""""
"""""""""""""""""""""""""""""""""""""""""""""""""""""""""""""""""""""""""""""""""""
""""""""""""""""""""""""""""""""""""""""""""""""
""""""""""""
""""""""""""""""""""""
""""""" ""
""""""""""""""""""""""""""""""""""""""""""""""""""
"
""""""""
""""""""
"""""""""""
"
"
"""""""""""""""""""""""""""""""""
""""""
""""""""""""""""""""""""""""""""""""""""""""""""""
"
"""
""""""""""""""""""""""""""""""""""""""""""""""""""
""""
"""""""""""
"
"""""""""""""""""""""""""""""""""""""""""""""""""""""""""""""""""""""""""""""""""""""""""""""""""""""""""""
"""""""
""""""""""""""""""""""""""""""""""""
"""""""""""""""""""""""
"""""""""""""""""""""""""""""""""""""""""""""""""""""""""""""""""""""""""""""""""""""""""""""""""""""""""""
""""""""""
"""""""""""
"""""""""""""""""""""""""""""""""""""""""""""""""""""""""""""
"""
""""""""""""""""""
""""""""""""" """ """""""""""""""""""""""""""""
" "
""""""
"""
"
""""""""""""""""""""""""""""""""""""""""""""""""""
"""""""""""""""""
"""""""""
"
"""
"
"
"""""""""""""""""""""""""""""""""""""""""""""""""""""""""""""""""""""""""""""""""""""""""""""""""""""""""""
"
"
""""""""""""""""""""""""""""""""""""""""""""""""""
"""""""""""""""""""""""""""""""""""""""""""""""""""""""""""""""""""""""""""""""""""""""""""""""""""""""""""
"""""""
"
"
""""""
"""""""""""""""""""""""""""
"""""""""""""""""""""""""""""""""""""""""""""""""""""""""""""""""""""""""""""""""""""""""""""""""""""""""""
""""""""""""""""""""""""""""""""""""""""""""""""""""""
"""""""""""""
"
"""""""""""""""""""""""""""""""""""""""""""""""""""""""""""""""""""""""""""""""""""""""""""""""""""""""""""
"""""""""""
"""""""""""
"""""""""""""""""""""""""""""""""""""""""""""""""""""""""""""""""""""""""""""""""""""""""""""""""""""""""""
"""
"
"""""""""""""""""""""""""""""""""""""""""""""""""""""""""""""""""""""""""""""""""""""""""""""""""""""""""""""""""""""""""""""""""""""""""""""""""""""""""""""
"
"""""""""""""""""""
""""""
"
""""""""""""
"
""""""""""""""""""""""""""""""""""""""""""""""""""
"""""""""
""
""""""""""""""""
"""""""""""""""""""""""""""""""""""""""""""""""""""""""""""""""""""""""""""""""""""
""""""""" """""""""""""""""""""
"""""""
"""
"""""""""""
"
"""""""""""""""""" """"""""""""""""""""""""""""""""""""""""""""""""""""""""""""""""""""""""""""""""""""""""""""""""""""""""""""""""""""""
""""""""""""""""""""""""""""""""""""""""""""""""""
""
"""""""""""""
"
"
"""""""""""""""""""""""""" """"""""""""""""""""""""""""""""""""""""""""""""""""""""""""""""""""""""""""""""""""""""""""""""""""""""""
"""""""""""
"
"""""""""""""""""""
"
""""""""""""""""""""""""""""""""""""""""""""""""""
"
""""
"
"
""""""""""""""""""""""""""""""""""""""""""""""""""
""""""""""""""
""""""
"""""""""""""""""
"""""""""""""""""""""""""
"""""""""""""""
"""""""""""""""""""""""""""""""""""""""""""""""""""""""""""""""""""""""""""""""""""""""""""""""""""""""""""
"""
"""""""""""
""
""""""""""""""""""""
""""""""""""""""""""""""""""""""""""""""""""""""""""""""""""""""""""""""""""""""""""""""""""""""""""""""""""
"""""""""
"""""""""""""""""""
" """""""""""""""""
""""""
"
"
""""""""""""""""""""" """""""""""
"
"""""""""""""""""""
""""""""""""""""""""""""""""""""""""""""""""""""""
"""""""""""""""""""""""""""""""""""""""""
"
"""""""""""
"
""""""""""""""""""""""""""""""""""""""""""""""""""
""""""""""""""""""""""""""""""""""""""""""""""""""
"""""""""""""""""""""""""""""""
"
"""""""""""""""""""
""""""""""""""""""""""""""""""""""""""""""""""""""
"
"
""""""""""""
"""
"
"
"
"
""""""""""""""""""""""""""""""""""""""""""""""""""
"""
"""
"""""""""""
"""""""""""""""""""""""""""""""""""""""""""""""""""""""""""""""""""""""""""""""""""""""""""""""""""""""""""
" """"""""""
"
"""""""""""""""""""""""""""""""""
"""
"""""""""""""""""""""""""""""""""""""""""""""""""""""""""""""""""""""""""""""""""""""""""""""""""""""""""""
""""""""""""""""""""""""""""""""""""""
"""
"""""""""""""""""""" "
""
""""""
"""""""
"
"
"""""""""""
"""""""""""""""""""" "
""""""""""""""""""""""""""""""""""""""""""""""""""
"""
"""""""""""""""""""""""""""""""""
"
"""""""""""""
"
"
"""""""""""
"""""""""""""""""""""""""""""""""""""""""""""""""""""""""""""""""""""""""""""""""""""""""""""""""""""""""""
"
"""""""""""""""""""""""""""""""""""""""""""""""""""""""""""""""""""""""""""""""""""""""""""""""""""""""""""
"
"
""
""""""""""""""""""""""""""""""""""""""""""""""""""
"""""""""""
"""""""""""""""""""""""""""""""""""""""""""""""""""""""""""""""""""""""""""""""""""
"""
"
"
""""""""""""""""""""""""""""""""""""""""""""""""""
" "
"
"""""""""""
""""""
""""""""""""""""""""""""""""""""""""""""""""""""""
""""
"""""""""""""""""""""""""""""""""""""""""""""""""""""""""""""""""""""""""""""""""""""""""""""""""""""""""""
"""""""""""
""""""""
"
""""""""""""""""""""""""""""""""""""""""""""""""""""""""""""
""""""
"
""""""
""""""""""
"""
""""""""""""
""""""""""""""""""""""""""""""""""""""""""""""""""""""""""
""""""
"
""
"
""""""""""""""""""""""""""""""""""""""""""""""""""
""""""""""""""""""""
""""""""""""""""""""""""""""""""""""""""""""""""""
""""""""""""
"""
"
""""""
""""""
"
"
"""
""""""""""""""""""""""""""""""""""""""""""""""""""
"""
""""""
"""""""""""
"
"
""""""
"""
"
"
"
"""""""""""
"""""""""""""""""""
"
"""""""""""""""""""""""""""""""""""""""""""""""""""""""""""""""""""""""""""""""""""
"""
"
"
" ""
"
"
" """""""""""""""""""""""""""""""""""""""""""""""""""
""""""
""""""
"""""""""""""""""""""
"
""""""""""""""""""""""""""""""""""""""""""""""""""""""""""""""""""""""""""""""""""""""""""""""""""""""""""""
"
"""""""""""""""""""""""""""""""""""""""""""""""""""""""""""""""""""""""""""""""""""""""""""""""""""""""""""
"
"""""""""""""""""""""""""""""""""""""""""""""""""""""""""""""""""""""
""""""" """"""""""""""""""""""
"
""""""""""""""""""""""""""""""""""""""""""""""""""
"
"""""""""""
""""""""
"
""""""""""""""""""""""""""""" """"""""""""""""""""""""""""""""""""""""""""""""""""""""""""""""""""
"""""""""""
""""""""""""""""""
""""""""""""""""""""""""""""""""""""""""""""""""""
"""""""""" """""""""""""""""""""""""""""""""
""""""""""""""""""""""""""""""""""""""""""""""""""
"
"""""""""""""""""""""""""""""""""""""""""""""""""""""""""""""""""""""""""""""""""""""""""""""""""""""""""""
"""""""""
"
"""""""
""""""""""""""""""""""""""""""""""""""""""""""""""
"""""""""""""""""""
""""""
"""""""""""""""""
"""""""""""""""""""""""""""""""""""
""
"
"
"
""""""
""""""""
""""""
"
"""
"""""""""""""""""""""""""""""""""""""""""""""""""""""""""""""""""""""""""""""""""""""""""""""""""""""""""""""""""""
"
""""""""""""""""""""""""""""""""""""""""""""""""""
""""""""""""""""""""""""""""""""""""""
""""""""""""""""""""""""""""""""""""""""""""
"
""
"""""""""""""""""""""""""""""""""""""""""""""""""""""""""""""""""""""""""""""""""""""""""""""""""""""""""""
""""""""""""""""""
"""""""
"""
""
"""
""""""
""""""""""""""""""""""""""""""""""""""""""""""""""""""""
"""
"
"""""""""""""""""""""
"""
"""""""""
"
""""""""
"
"""
""
"""""""""""""""""""""""""""""""""""""""""""""""""""""""""""""""""""""""""""""""""""""""""""""""""""""""""""
"""""""""""""""""""
"
""""""""""""""""""""""""""""""""""""""""
"""""""""""""""""""""""""""""""""""""""""""""""""""""""""""""""""""""""""""""""""""""""""""""""""""""""""""
""""""""
""
"
""""""""""""""""""""""""""""""""""""""""""""""""""
"""""""""""""""""""
""""""
""""""""""""
"
"
"""""
"""""""""
"
"
"
"
""""""
"
"
"""
""""""
""""""""" """"""""""""""""""""""""""""""""""""""""""""""""""""""
""""""""""""""""""""""""""""""""""""""""""""""""""
"""
"""
"" """""""
""""
"""""""""""
"""""""""""""""""""""""""""""""""""""""""""""""
"""""""""""
"""""""""""""""""""
"""""""""""""
"
""""""""""""""""""""""""""""""""""""""""""""""""""
######################
############################################################################################################################################################################################################################################################################################################################################################################################################################################################################################################################################################################################################################################################################################################################################################################
##################################################################################################################################################################################################################################################################################################################################################
#######################################################
##########################################
############################################################################################################################################################################################
############################################################################################################################################################################################
########################################################################################################################################################################################
########################################################################################################################################################################################
##################################################################################################################################################################
########################################################################################################################################################################################
########################################################################################################################################################################################
#################################################################################################################################
########################################################################################################################################################################################################################################################################################################################### ###############################################################################################################################################################################################################################################################################################################################################################################################################################################################################################################################################################################################################################################################################################################################################################################################################################################################################################################################################################################################################
########################################################################################################################################################################################
##############################################################################
PEPCO
Poplar Point
Kenilworth Park Landfill North
Washington Navy YardSoutheast
Federal Center
Kenilworth ParkLandfill South
Washington Gas
CSX
CSX
Former Hess Oil Corporation and
Gulf Oil CorporationBulk Oil Facilities
Steuart Petroleum
Firth-SterlingSteel
JBABJBABJBABJoint BaseAnacostia-Bolling
Fort McNair
!
!
!
!
!
!
!
!
!
!
!
!
!
!
!
!
!!
!
!
Piney Run
Watts Branch
Nash Ru n
Dueling Creek
Pope Branch
Hickey Run
Fort Dupont Creek
Northwest Branch Anacostia River
Northeast B
ranch Anacostia
Rive
r
Lower Beaverdam Creek
LegendNIRIS DATABASE
" 1999 GSA SE Federal Center (12)
" 2000 ANS/USFWS Triad Study (112)
" 2000 Ambient Tox Chesapeake Bay (5)
" 2000 USFWS Bioavailability (4)
" 2003 Active Capping Site Char Rpt (77)
" 2003 Poplar Point Cores (8)
" 2006, 2009 Washington Navy Yard Sed/Tiss (66)
NOAA DATABASE
# 2000 ANS/USFWS Triad Study (22)
# 2000 Ambient Tox Chesapeake Bay (1)
CSX DATABASE
! 2011 CSX Sediment Study (28)
BENTHIC SAMPLING LOCATIONS
! 2000 ANS/USFWS Triad Study (20)
CLEANUP SITE BOUNDARY(LAND BASED PORTION)
SEDIMENT STUDY AREA
CLEANUP SITEAREA OF INFLUENCE
WASHINGTON DC BOUNDARY
®0 1,500 3,000
FeetSOURCE: MODIFIED FROM CH2MHILL, 2011, GEOSYNTEC, 2012,DCGIS, 2012, NOAA, 2013, AND DEPARTMENT OF THE NAVY, 2013.
FIGURE 2.1SEDIMENT SAMPLING LOCATIONS
BY SOURCE DATABASE
Dat
e Sa
ved:
5/1
4/20
14 1
:12:
31 P
M U
ser:
joel
.pet
ers
Pat
h: S
:\CA
DD
\S\2
592\
mxd
\Wor
kPla
n\Fi
gure
_02_
01_A
naco
stia
_11x
17_S
OU
RC
E_SE
DIM
EN
T.m
xd
DRAFTNote: The Cleanup Site Boundaries (Land Based Portion) for the Washington Navy Yard are reflective of its historic extent.
O Street Combined
Sewer System
Outfall
ANACOSTIA RIVERSEDIMENTS PROJECT
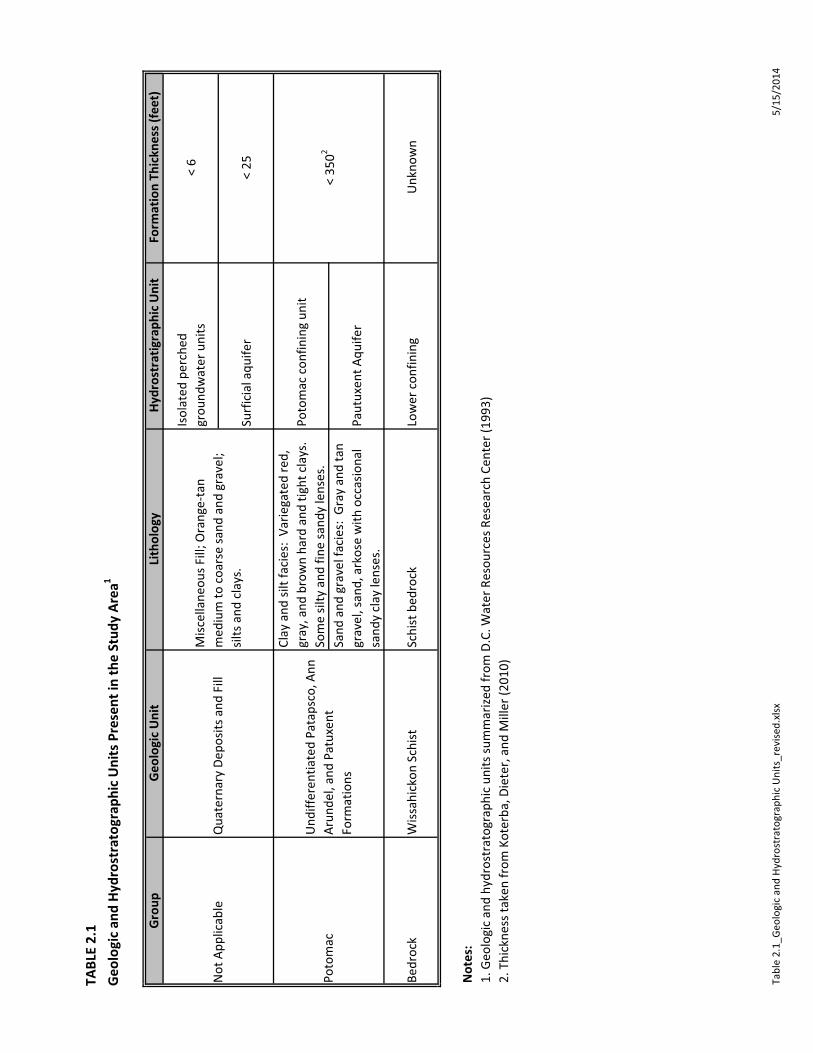
TABL
E 2.
1G
eolo
gic
and
Hydr
ostr
atog
raph
ic U
nits
Pre
sent
in th
e St
udy
Area
1
Tabl
e 2.
1_Ge
olog
ic a
nd H
ydro
stra
togr
aphi
c U
nits
_rev
ised.
xlsx
5/15
/201
4
Gro
upG
eolo
gic
Uni
tLi
thol
ogy
Hydr
ostr
atig
raph
ic U
nit
Form
atio
n Th
ickn
ess (
feet
)
Isol
ated
per
ched
gr
ound
wat
er u
nits
< 6
Surf
icia
l aqu
ifer
< 25
Clay
and
silt
faci
es:
Varie
gate
d re
d,
gray
, and
bro
wn
hard
and
tigh
t cla
ys.
Som
e sil
ty a
nd fi
ne sa
ndy
lens
es.
Poto
mac
con
finin
g un
it
Sand
and
gra
vel f
acie
s: G
ray
and
tan
grav
el, s
and,
ark
ose
with
occ
asio
nal
sand
y cl
ay le
nses
.Pa
utux
ent A
quife
r
Bedr
ock
Wiss
ahic
kon
Schi
stSc
hist
bed
rock
Low
er c
onfin
ing
Unk
now
n
Not
es:
1. G
eolo
gic
and
hydr
ostr
atog
raph
ic u
nits
sum
mar
ized
from
D.C
. Wat
er R
esou
rces
Res
earc
h Ce
nter
(199
3)2.
Thi
ckne
ss ta
ken
from
Kot
erba
, Die
ter,
and
Mill
er (2
010)
< 35
02
Qua
tern
ary
Depo
sits a
nd F
illN
ot A
pplic
able
Misc
ella
neou
s Fill
; Ora
nge-
tan
med
ium
to c
oars
e sa
nd a
nd g
rave
l; sil
ts a
nd c
lays
.
Poto
mac
Und
iffer
entia
ted
Pata
psco
, Ann
Ar
unde
l, an
d Pa
tuxe
nt
Form
atio
ns

TABL
E 2.
2Pr
evio
us S
tudi
es In
clud
ed in
the
Proj
ect D
atab
ase
and
Num
ber o
f Sam
ples
(By
Med
ia) i
n th
e Ti
dal A
naco
stia
Riv
er
Tabl
e 2.
2 Pr
evio
us S
tudi
es In
clud
ed in
the
Proj
ect D
atab
ase_
DRAF
T_JP
0719
13.x
lsx5/
15/2
014
Surf
ace
Sedi
men
tSu
bsur
face
Se
dim
ent
Fish
Tis
sue
Bent
hic
Tiss
ueIC
PRB/
Lim
no-T
ech
Sedi
men
t Sur
vey
NO
AA d
atab
ase
1989
120
00
WA
Gas L
ight
Eas
t Sta
tion
Prop
erty
NO
AA d
atab
ase
1988
012
00
EMAP
-Che
sape
ake
Bay
NO
AA d
atab
ase
1990
10
00
FWS
Org
anoc
hlor
ine
Resi
d/Hi
stop
ath
NO
AA d
atab
ase
1987
00
30
Bolli
ng A
FB -
SW C
orne
r Lan
dfill
NO
AA d
atab
ase
1992
60
00
DC F
ish T
issue
HHR
NO
AA d
atab
ase
1989
-199
20
02
0Po
tom
ac &
Ana
cost
ia S
edim
ent S
tud y
NO
AA d
atab
ase
1991
220
00
Wild
Fish
Tiss
ueN
OAA
dat
abas
e19
93-1
995
00
20
PEPC
ON
OAA
dat
abas
e19
95, 1
997
31
00
Was
hing
ton
Nav
y Ya
rdCl
ark
and
Crut
chle
y (1
995)
1995
70
00
FWS
PAH/
PCB
- Mas
on N
eck
NO
AA d
atab
ase
1995
30
20
WA
Gas -
Eas
t Sta
tion
Proj
ect
NO
AA d
atab
ase
1996
70
00
DC S
edim
ent C
ore
Anal
ysis
NO
AA d
atab
ase
1995
77
00
USA
CE F
eder
al N
av C
hann
elN
OAA
dat
abas
e19
984
40
0W
A N
avy
Yard
RI
CH2M
Hill
(201
1)19
9934
00
0GS
A SE
Fed
eral
Cen
ter
URS
Gro
up (2
000)
N
IRIS
2 (12)
1999
120
00
Ambi
ent T
ox C
hesa
peak
e Ba
yN
OAA
dat
abas
e N
OAA
3 (1) N
IRIS
(5)
1998
60
00
ANS
2000
(AN
S/U
SFW
S Tr
iad
Stud
y)4
NO
AA d
atab
ase
Velin
sky
and
Ashl
ey (2
001)
N
OAA
(22)
NIR
IS (1
12)
2000
134
00
0
DDO
E Fi
sh T
issue
Stu
dyPi
nkne
y (2
001)
Not
in d
atab
ase
Larv
al F
ish T
oxic
ityPi
nkne
y et
al.
(200
2)N
ot in
dat
abas
eU
SFW
S Bi
oava
ilabi
lity
Pink
ney
et a
l. (2
003)
NIR
IS (4
)20
004
00
0Ri
sk-b
ased
Mon
itorin
g, K
ingm
anPi
nkne
y et
al.
(200
6)N
ot in
dat
abas
eIn
vert
ebra
tePh
elps
(200
1)N
/A (7
)20
00, 2
001
00
07
WA
Nav
y Ya
rd P
ier N
o. 5
CH2M
Hill
(201
1)N
IRIS
(16)
2002
016
00
Popl
ar P
oint
Cor
esN
IRIS
dat
abas
eN
IRIS
(8)
2003
80
00
Activ
e Ca
ppin
g Si
te C
har R
ptHo
rne
Engi
neer
ing
Serv
s., I
nc. (
2003
)N
OAA
(8) N
IRIS
(77)
2003
778
00
Was
hing
ton
Nav
y Ya
rd S
ed/T
issCH
2M H
ill (2
011)
NIR
IS (6
6, 7
0, 4
6)20
06, 2
009
6670
460
USF
WS
Fish
Tiss
uePi
nkne
y (2
009)
N/A
(2)
2007
00
20
CSX
Envi
roSc
ienc
e (2
013)
CSX
(28,
38)
2011
2838
00
1. I
f the
orig
inal
refe
renc
e fo
r a g
iven
stud
y w
as n
ot a
vaila
ble,
the
Anac
ostia
Riv
er d
atab
ase
mai
ntai
ned
by N
OAA
is re
fere
nced
.2.
NIR
IS-N
avy
Inst
alla
tion
Rest
orat
ion
Info
rmat
ion
Solu
tion
Data
base
Yes
Num
ber o
f Sam
ples
*
Stud
y N
ame
In W
P Da
taba
seRe
fere
nce1
Year
of S
ampl
e Co
llect
ion
Dat
a U
sed
for
WP
Deve
lopm
ent
Data
base
Sou
rce
(# o
f Sam
ples
in S
tudy
Ar
ea)
No
N/A
(Sam
ple
tota
ls sh
own
at ri
ght a
re fr
om N
OAA
da
taba
se o
nly)
TABL
E 2.
2Pr
evio
us S
tudi
es In
clud
ed in
the
Proj
ect D
atab
ase
and
Num
ber o
f Sam
ples
(By
Med
ia) i
n th
e Ti
dal A
naco
stia
Riv
er
Tabl
e 2.
2 Pr
evio
us S
tudi
es In
clud
ed in
the
Proj
ect D
atab
ase_
DRAF
T_JP
0719
13.x
lsx5/
15/2
014
3. N
OAA
-Nat
iona
l Oce
anic
and
Atm
osph
eric
Ass
ocia
tion
Que
ry M
anag
er D
atab
ase.
4. R
efer
red
to in
the
text
as A
NS
2000
; NO
AA d
atab
ase
refe
renc
e is
"AN
S/U
SFW
S Tr
iad
Stud
y."
* T
otal
s inc
lude
dup
licat
e sa
mpl
ing
loca
tions

TABL
E 2.
3Su
mm
ary
of F
t. M
cNai
r and
Join
t Bas
e An
acos
tia-B
ollin
g LU
ST S
ites1
Tabl
e 2.
3 - F
t McN
air C
lose
d U
ST S
ites.
xlsx
5/16
/201
4
Faci
lity
Cont
amin
ant T
ypes
Site
s with
onl
y So
il Co
ntam
inat
ion
Site
s wth
bot
h So
il an
d G
roun
dwat
erSt
atus
43
Clos
ed0
2O
pen
314
Clos
ed0
0O
pen
1. S
ourc
e: D
DOE
web
site
http
://d
doe.
dc.g
ov/p
ublic
atio
n/pu
blic
-rec
ords
-rel
ated
-und
ergr
ound
-sto
rage
-tan
k-us
t-sy
stem
s
Fort
McN
air
Nav
al S
uppo
rt F
acili
ty A
naco
stia
Petr
oleu
m -
Mot
or fu
els,
w
aste
/use
d oi
l, he
atin
g oi
l

TABL
E 2.
4Co
mpa
rison
of S
edim
ent A
naly
tical
Met
hods
Tabl
e 2.
4_An
alyt
ical
Met
hod
Com
paris
on_r
evise
d.xl
s5/
15/2
014
Met
hod
Num
ber
Met
hod
Num
ber
Was
hing
ton
Nav
y Ya
rd S
ed/T
SSN
A6N
A682
70_S
IM4,
831
NA6
6010
B480
81A4
8290
480
824
1668
A712
9
GSA
SE
Fede
ral C
ente
rN
A6CL
P1 SVO
Cs83
104
17CL
P1 VO
CsCL
P2N
A682
904
CLP
PCBs
8082
320
9CS
X80
154
8270
482
704
5182
604
6020
480
814
NA6
8082
416
687
209
Activ
e Ca
ppin
g Si
te C
har R
pt80
15B4
NA6
8270
C416
NA6
6010
480
814
NA6
8082
435
40C5 8
0824
57
Popl
ar P
oint
Cor
esN
A6N
A6So
xhle
t Ex
trac
tion/
G
C-M
S941
NA6
Cold
Vap
or IC
P M
S13 (H
g)
Acid
dig
estio
n (a
ll m
etal
s but
Hg)
Gra
phite
Fur
nace
AA
S14 (A
g, C
d)FA
A15 (C
u, F
e,
Mn,
Ni,
Pb, Z
n)IC
P-M
S13 (A
l, Cr
)Hy
drid
e AA
S14
(As)
Soxh
let
Extr
actio
n/
Ni E
CD15
NA6
NA6
Soxh
let
Extr
actio
n/
Ni E
CD10
0
ANS
2000
NA6
NA6
Solv
ent
Extr
actio
n/
GC-
MS9
16N
A6HF
-HN
O312
Tot
al
Dige
st/I
CP O
ES10
Solv
ent
Extr
actio
n/
GC-
ECD11
NA6
NA6
Solv
ent
Extr
actio
n/ G
C-EC
D1681
Not
es:
1. E
PA C
LP S
OW
OLM
03.2
10. I
CP O
ES:
Indu
ctiv
ely
coup
led
plas
ma
optic
al e
miss
ion
spec
tros
copy
2. E
PA C
LP S
OW
ILM
04.0
- (C
LP)
11.
GC
- ECD
: G
as c
hrom
atog
raph
y - e
lect
ron
capt
ure
dete
ctor
3. S
W-8
46 8
082/
NEA
Com
preh
ensiv
e Q
uant
itativ
e Co
ngen
er S
peci
fic M
etho
d12
. HF
- HN
O3:
Hyd
roflu
oric
- ni
tric
aci
d4.
SW
-846
Met
hod
13.
ICP
MS:
Ind
uctiv
ely
coup
led
plas
ma
mas
s spe
crto
met
ry5.
SW
-846
Met
hod
3540
C So
xhle
t Ext
ract
ion
14.
AAS:
Ato
mic
ads
orpt
ion
spec
trom
etry
6. N
A: n
ot a
naly
zed
15.
FAA:
Fla
me
atom
ic a
dsor
ptio
n7.
EPA
Met
hod
16. N
i ECD
: N
i Ele
ctro
n ca
ptur
e de
tect
or8.
SIM
: Se
lect
ive
ion
mon
itorin
g17
. G
C-EC
D: G
as c
hrom
atog
raph
- el
ectr
on c
aptu
re d
etec
tor
9. G
C-M
S: G
as c
hrom
atog
raph
y - m
ass s
pect
rom
etry
Pest
icid
esPC
B Ar
oclo
rsPC
B Co
ngen
ers
PCD
D/P
CDF
Dat
abas
eTP
HSV
OC
VOC
PAH
Met
als

TABL
E 2.
5 Pr
ojec
t Scr
eeni
ng L
evel
s, fo
r Sed
imen
ts, S
oil a
nd S
urfa
ce W
ater
, Pag
e 1
of 5
Tabl
e 2.
5 Pr
ojec
t Scr
eeni
ng L
evel
s, fo
r Sed
imen
ts, S
oil a
nd S
urfa
ce W
ater
05-
12-1
4.xl
sx5/
16/2
014
Anal
yte
CAS
Gro
up
Sedi
men
tBT
AGSc
reen
ing
Leve
l(m
g/kg
) S
edim
ent F
W T
EL1
(mg/
kg)
Sed
imen
t FW
PEL
1
(mg/
kg)
Sedi
men
t FW
SEL
1
(mg/
kg)
Surf
ace
Wat
er
Acut
e3 FW
(μg/
L)
Surf
ace
Wat
er
Chro
nic3 F
W (μ
g/L)
Cyan
ide
5712
5Cy
ano
0.1
NSL
NSL
NSL
225.
22,
3,7,
8-TC
DD
1746
016
Diox
in0.
0000
0085
0.00
0000
850.
0000
22N
SL0.
010
0.00
0010
Antim
ony
7440
360
Met
al2
NSL
NS
NSL
8830
Arse
nic
7440
382
Met
al9.
85.
917
3334
015
0Be
rylli
um
7440
417
Met
alN
SLN
SLN
SLN
SL35
0.66
Cadm
ium
74
4043
9M
etal
0.99
0.60
3.5
102.
00.
25Ch
rom
ium
(III)
16
0658
31M
etal
NSL
37.3
090
110
570
74Ch
rom
ium
(VI)
1854
0299
Met
alN
SLN
SLN
SLN
SL16
11Co
pper
74
4050
8M
etal
31.6
3619
711
013
6.0
Lead
74
3992
1M
etal
35.8
3591
250
652.
5M
ercu
ry
7439
976
Met
al0.
180.
170.
492.
01.
40.
77N
icke
l 74
4002
0M
etal
22.7
1836
7547
052
Sele
nium
77
8249
2M
etal
2N
SLN
SLN
SL13
5.0
Silv
er
7440
224
Met
al1
NSL
NSL
NSL
1.6
0.36
Thal
lium
74
4028
0M
etal
NSL
NSL
NSL
NSL
110
0.03
0Zi
nc
7440
666
Met
al12
112
331
582
012
012
0Ac
enap
hthe
ne
8332
9PA
H0.
0067
0.00
670.
089
NSL
1,70
05.
8Ac
enap
hthy
lene
20
8968
PAH
0.00
590.
0059
0.13
NSL
NS
4,84
0An
thra
cene
12
0127
PAH
0.05
720.
047
0.25
3.7
130.
73Be
nzo(
a)An
thra
cene
56
553
PAH
0.10
80.
032
0.39
150.
490.
027
Benz
o(a)
Pyre
ne
5032
8PA
H0.
150.
032
0.78
140.
240.
014
Benz
o(b)
Fluo
rant
hene
20
5992
PAH
NSL
NSL
NSL
NSL
NS
9.1
Benz
o(gh
i)Per
ylen
e 19
1242
PAH
0.17
NSL
NSL
3.2
NS
7.6
Benz
o(k)
Fluo
rant
hene
20
7089
PAH
0.24
NSL
NSL
13N
SN
SCh
ryse
ne
2180
19PA
H0.
166
0.05
70.
864.
6N
SN
SDi
benz
o(a,
h)An
thra
cene
53
703
PAH
0.03
30.
0062
0.14
1.3
NS
NS
Fluo
rant
hene
20
6440
PAH
0.42
30.
112.
410
3,98
00.
040
Fluo
rene
86
737
PAH
0.07
740.
021
0.14
1.6
703.
9In
deno
(1,2
,3-c
d)Py
rene
19
3395
PAH
0.01
7N
SLN
SL3.
2N
S4.
3N
apht
hale
ne
9120
3PA
H0.
176
0.03
50.
39N
SL19
01.
1Ph
enan
thre
ne
8501
8PA
H0.
204
0.04
20.
5210
306.
3Py
rene
12
9000
PAH
0.19
50.
053
0.88
8.5
NS
0.02
5To
tal H
MW
PAH
s--
PAH
NSL
NSL
NSL
NSL
NSL
NSL
Tota
l LM
W P
AHs
--PA
HN
SLN
SLN
SLN
SLN
SLN
SLPC
B-10
16
1267
4112
PCB
NSL
NSL
NSL
NSL
NSL
NSL

TABL
E 2.
5 Pr
ojec
t Scr
eeni
ng L
evel
s, fo
r Sed
imen
ts, S
oil a
nd S
urfa
ce W
ater
, Pag
e 2
of 5
Tabl
e 2.
5 Pr
ojec
t Scr
eeni
ng L
evel
s, fo
r Sed
imen
ts, S
oil a
nd S
urfa
ce W
ater
05-
12-1
4.xl
sx5/
16/2
014
Anal
yte
CAS
Gro
up
Sedi
men
tBT
AGSc
reen
ing
Leve
l(m
g/kg
) S
edim
ent F
W T
EL1
(mg/
kg)
Sed
imen
t FW
PEL
1
(mg/
kg)
Sedi
men
t FW
SEL
1
(mg/
kg)
Surf
ace
Wat
er
Acut
e3 FW
(μg/
L)
Surf
ace
Wat
er
Chro
nic3 F
W (μ
g/L)
PCB-
1221
11
1042
82PC
BN
SLN
SLN
SLN
SLN
SLN
SLPC
B-12
32
1114
1165
PCB
NSL
NSL
NSL
NSL
NSL
NSL
PCB-
1242
53
4692
19PC
BN
SLN
SLN
SLN
SLN
SLN
SLPC
B-12
48
1267
2296
PCB
NSL
NSL
NSL
NSL
NSL
NSL
PCB-
1254
11
0976
91PC
BN
SL0.
060
0.34
0.34
NSL
NSL
PCB-
1260
11
0968
25PC
BN
SLN
SLN
SLN
SLN
SLN
SLTo
tal P
CBs
--PC
B0.
0598
0.03
410.
277
5.3
0.6
0.01
44,
4’-D
DD
7254
8Pe
stic
ide
0.00
488
0.00
350.
0085
0.06
00.
190.
011
4,4’
-DDE
72
559
Pest
icid
e0.
0031
60.
0014
0.00
680.
191,
050
105
4,4’
-DDT
50
293
Pest
icid
eN
SL0.
0012
0.00
480.
710.
550.
0005
0Al
drin
30
9002
Pest
icid
e0.
002
NSL
NSL
0.08
01.
50.
017
alph
a-BH
C 31
9846
Pest
icid
e0.
006
NSL
NSL
0.10
392.
2al
pha-
Endo
sulfa
n 95
9988
Pest
icid
e0.
0029
NSL
NSL
NSL
NSL
NSL
beta
-BHC
31
9857
Pest
icid
e0.
005
NSL
NSL
0.21
39N
Sbe
ta-E
ndos
ulfa
n 33
2136
59Pe
stic
ide
0.01
4N
SLN
SLN
SN
SLN
SLCh
lord
ane
5774
9Pe
stic
ide
0.00
324
0.00
450.
010.
060
1.2
0.00
22de
lta-B
HC
3198
68Pe
stic
ide
6.4
NSL
NSL
NSL
392.
2Di
eldr
in
6057
1Pe
stic
ide
0.00
190.
0029
0.01
0.91
0.24
0.05
6En
dosu
lfan
Sulfa
te
1031
078
Pest
icid
e0.
0054
NSL
NSL
NSL
NS
2.2
Endr
in
7220
8Pe
stic
ide
0.00
222
0.00
270.
061.
300.
086
0.03
6En
drin
Ald
ehyd
e 74
2193
4Pe
stic
ide
NSL
NSL
NSL
NSL
NS
0.15
gam
ma-
BHC
5889
9Pe
stic
ide
0.00
237
0.00
094
0.00
140.
010
1.0
0.08
0He
ptac
hlor
76
448
Pest
icid
e0.
068
NSL
NSL
NSL
0.26
0.00
19He
ptac
hlor
Epo
xide
10
2457
3Pe
stic
ide
0.00
247
0.00
060
0.00
270.
050
0.26
0.00
19To
xaph
ene
8001
352
Pest
icid
e0.
0001
0.00
010
NSL
NSL
0.73
0.00
020
1,2,
4-Tr
ichl
orob
enze
ne
1208
21SV
OC
2.1
NSL
NSL
NSL
700
241,
2-Di
chlo
robe
nzen
e 95
501
SVO
C0.
0165
NSL
NSL
NSL
260
0.70
1,2-
Diph
enyl
hydr
azin
e 12
2667
SVO
CN
SLN
SLN
SLN
SL27
027
1,3-
Dich
loro
benz
ene
5417
31SV
OC
4.43
NSL
NSL
NSL
630
713
1,4-
Dich
loro
benz
ene
1064
67SV
OC
0.59
9N
SLN
SLN
SL18
060
2,4,
6-Tr
ichl
orop
heno
l 88
062
SVO
C0.
213
NSL
NSL
NS
NS
202,
4-Di
chlo
roph
enol
12
0832
SVO
C0.
117
NSL
NSL
NS
2,02
016
02,
4-Di
met
hylp
heno
l 10
5679
SVO
C0.
029
NSL
NSL
NS
2,12
010
02,
4-Di
nitr
ophe
nol
5128
5SV
OC
NSL
NSL
NSL
NSL
230
452,
4-Di
nitr
otol
uene
12
1142
SVO
C0.
0416
NSL
NSL
NSL
330
645
2,6-
Dini
trot
olue
ne
6062
02SV
OC
NSL
NSL
NSL
NSL
NS
NS
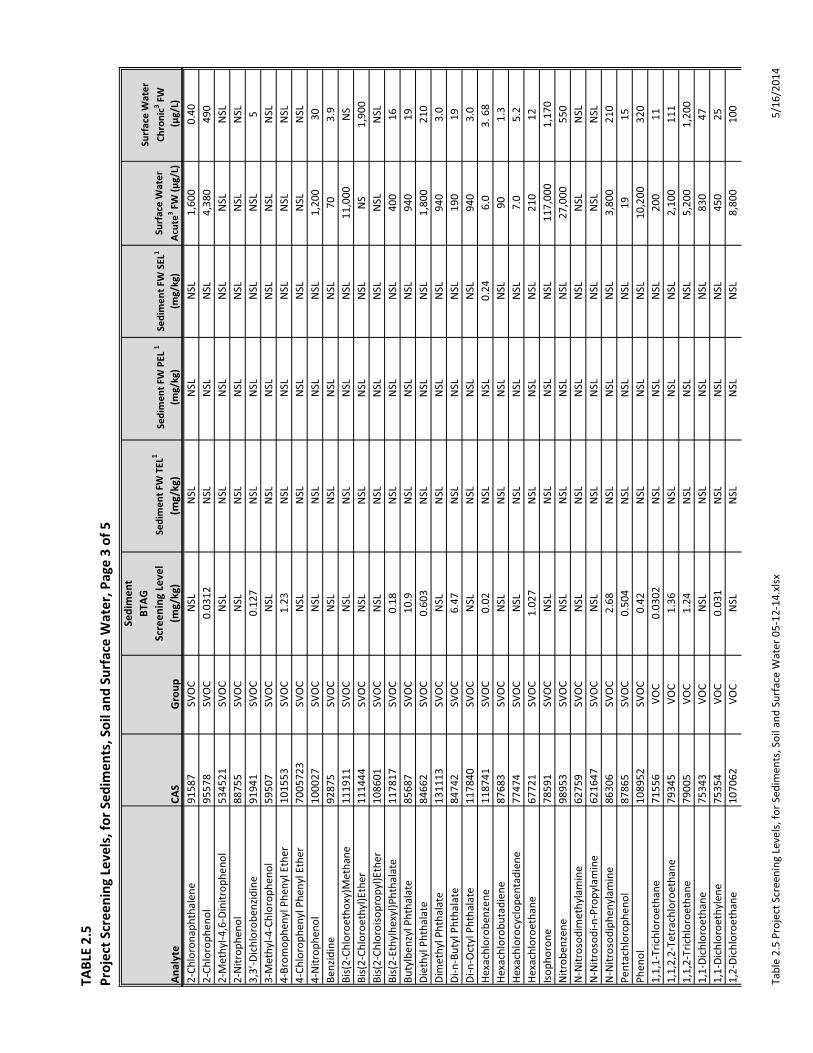
TABL
E 2.
5 Pr
ojec
t Scr
eeni
ng L
evel
s, fo
r Sed
imen
ts, S
oil a
nd S
urfa
ce W
ater
, Pag
e 3
of 5
Tabl
e 2.
5 Pr
ojec
t Scr
eeni
ng L
evel
s, fo
r Sed
imen
ts, S
oil a
nd S
urfa
ce W
ater
05-
12-1
4.xl
sx5/
16/2
014
Anal
yte
CAS
Gro
up
Sedi
men
tBT
AGSc
reen
ing
Leve
l(m
g/kg
) S
edim
ent F
W T
EL1
(mg/
kg)
Sed
imen
t FW
PEL
1
(mg/
kg)
Sedi
men
t FW
SEL
1
(mg/
kg)
Surf
ace
Wat
er
Acut
e3 FW
(μg/
L)
Surf
ace
Wat
er
Chro
nic3 F
W (μ
g/L)
2-Ch
loro
naph
thal
ene
9158
7SV
OC
NSL
NSL
NSL
NSL
1,60
00.
402-
Chlo
roph
enol
95
578
SVO
C0.
0312
NSL
NSL
NSL
4,38
049
02-
Met
hyl-4
,6-D
initr
ophe
nol
5345
21SV
OC
NSL
NSL
NSL
NSL
NSL
NSL
2-N
itrop
heno
l 88
755
SVO
CN
SLN
SLN
SLN
SLN
SLN
SL3,
3’-D
ichl
orob
enzid
ine
9194
1SV
OC
0.12
7N
SLN
SLN
SLN
SL5
3-M
ethy
l-4-C
hlor
ophe
nol
5950
7SV
OC
NSL
NSL
NSL
NSL
NSL
NSL
4-Br
omop
heny
l Phe
nyl E
ther
10
1553
SVO
C1.
23N
SLN
SLN
SLN
SLN
SL4-
Chlo
roph
enyl
Phe
nyl E
ther
70
0572
3SV
OC
NSL
NSL
NSL
NSL
NSL
NSL
4-N
itrop
heno
l 10
0027
SVO
CN
SLN
SLN
SLN
SL1,
200
30Be
nzid
ine
9287
5SV
OC
NSL
NSL
NSL
NSL
703.
9Bi
s(2-
Chlo
roet
hoxy
)Met
hane
11
1911
SVO
CN
SLN
SLN
SLN
SL11
,000
NS
Bis(
2-Ch
loro
ethy
l)Eth
er
1114
44SV
OC
NSL
NSL
NSL
NSL
NS
1,90
0Bi
s(2-
Chlo
roiso
prop
yl)E
ther
10
8601
SVO
CN
SLN
SLN
SLN
SLN
SLN
SLBi
s(2-
Ethy
lhex
yl)P
htha
late
11
7817
SVO
C0.
18N
SLN
SLN
SL40
016
Buty
lben
zyl P
htha
late
85
687
SVO
C10
.9N
SLN
SLN
SL94
019
Diet
hyl P
htha
late
84
662
SVO
C0.
603
NSL
NSL
NSL
1,80
021
0Di
met
hyl P
htha
late
13
1113
SVO
CN
SLN
SLN
SLN
SL94
03.
0Di
-n-B
utyl
Pht
hala
te
8474
2SV
OC
6.47
NSL
NSL
NSL
190
19Di
-n-O
ctyl
Pht
hala
te
1178
40SV
OC
NSL
NSL
NSL
NSL
940
3.0
Hexa
chlo
robe
nzen
e 11
8741
SVO
C0.
02N
SLN
SL0.
246.
03.
68
Hexa
chlo
robu
tadi
ene
8768
3SV
OC
NSL
NSL
NSL
NSL
901.
3He
xach
loro
cycl
open
tadi
ene
7747
4SV
OC
NSL
NSL
NSL
NSL
7.0
5.2
Hexa
chlo
roet
hane
67
721
SVO
C1.
027
NSL
NSL
NSL
210
12Is
opho
rone
78
591
SVO
CN
SLN
SLN
SLN
SL11
7,00
01,
170
Nitr
oben
zene
98
953
SVO
CN
SLN
SLN
SLN
SL27
,000
550
N-N
itros
odim
ethy
lam
ine
6275
9SV
OC
NSL
NSL
NSL
NSL
NSL
NSL
N-N
itros
odi-n
-Pro
pyla
min
e 62
1647
SVO
CN
SLN
SLN
SLN
SLN
SLN
SLN
-Nitr
osod
iphe
nyla
min
e 86
306
SVO
C2.
68N
SLN
SLN
SL3,
800
210
Pent
achl
orop
heno
l 87
865
SVO
C0.
504
NSL
NSL
NSL
1915
Phen
ol
1089
52SV
OC
0.42
NSL
NSL
NSL
10,2
0032
01,
1,1-
Tric
hlor
oeth
ane
7155
6VO
C0.
0302
NSL
NSL
NSL
200
111,
1,2,
2-Te
trac
hlor
oeth
ane
7934
5VO
C1.
36N
SLN
SLN
SL2,
100
111
1,1,
2-Tr
ichl
oroe
than
e 79
005
VOC
1.24
NSL
NSL
NSL
5,20
01,
200
1,1-
Dich
loro
etha
ne
7534
3VO
CN
SLN
SLN
SLN
SL83
047
1,1-
Dich
loro
ethy
lene
75
354
VOC
0.03
1N
SLN
SLN
SL45
025
1,2-
Dich
loro
etha
ne
1070
62VO
CN
SLN
SLN
SLN
SL8,
800
100
TABL
E 2.
5 Pr
ojec
t Scr
eeni
ng L
evel
s, fo
r Sed
imen
ts, S
oil a
nd S
urfa
ce W
ater
, Pag
e 4
of 5
Tabl
e 2.
5 Pr
ojec
t Scr
eeni
ng L
evel
s, fo
r Sed
imen
ts, S
oil a
nd S
urfa
ce W
ater
05-
12-1
4.xl
sx5/
16/2
014
Anal
yte
CAS
Gro
up
Sedi
men
tBT
AGSc
reen
ing
Leve
l(m
g/kg
) S
edim
ent F
W T
EL1
(mg/
kg)
Sed
imen
t FW
PEL
1
(mg/
kg)
Sedi
men
t FW
SEL
1
(mg/
kg)
Surf
ace
Wat
er
Acut
e3 FW
(μg/
L)
Surf
ace
Wat
er
Chro
nic3 F
W (μ
g/L)
1,2-
Dich
loro
prop
ane
7887
5VO
CN
SLN
SLN
SLN
SLN
SLN
SL1,
2-Tr
aNSL
-Dic
hlor
oeth
ylen
e 15
6605
VOC
1.05
NSL
NSL
NSL
11,6
001,
160
1,3-
Dich
loro
prop
ylen
e 54
2756
VOC
0.00
0050
9N
SLN
SLN
SLN
SLN
SL2-
Chlo
roet
hylv
inyl
Eth
er
1107
58VO
CN
SLN
SLN
SLN
SLN
SLN
SLAc
role
in
1070
28VO
CN
SLN
SLN
SLN
SL68
0.01
Acry
loni
trile
10
7131
VOC
NSL
NSL
NSL
NSL
7,55
02,
600
Benz
ene
7143
2VO
CN
SLN
SLN
SLN
SL2,
300
46Br
omof
orm
75
252
VOC
0.65
4N
SLN
SLN
SL2,
300
320
Carb
on T
etra
chlo
ride
5623
5VO
C0.
0642
NSL
NSL
NSL
NS
10Ch
loro
benz
ene
1089
07VO
C0.
0084
2N
SLN
SLN
SL1,
100
1.3
Chlo
rodi
brom
omet
hane
12
4481
VOC
NSL
NSL
NSL
NSL
11,0
00N
SLCh
loro
etha
ne
7500
3VO
CN
SLN
SLN
SLN
SLN
SLN
SLCh
loro
form
67
663
VOC
NSL
NSL
NSL
NSL
490
2Di
chlo
robr
omom
etha
ne
7527
4VO
CN
SLN
SLN
SLN
SL11
,000
NSL
Ethy
lben
zene
10
0414
VOC
1.1
NS
NS
NS
130
NSL

TABL
E 2.
5 Pr
ojec
t Scr
eeni
ng L
evel
s, fo
r Sed
imen
ts, S
oil a
nd S
urfa
ce W
ater
, Pag
e 5
of 5
Tabl
e 2.
5 Pr
ojec
t Scr
eeni
ng L
evel
s, fo
r Sed
imen
ts, S
oil a
nd S
urfa
ce W
ater
05-
12-1
4.xl
sx5/
16/2
014
Anal
yte
CAS
Gro
up
Sedi
men
tBT
AGSc
reen
ing
Leve
l(m
g/kg
) S
edim
ent F
W T
EL1
(mg/
kg)
Sed
imen
t FW
PEL
1
(mg/
kg)
Sedi
men
t FW
SEL
1
(mg/
kg)
Surf
ace
Wat
er
Acut
e3 FW
(μg/
L)
Surf
ace
Wat
er
Chro
nic3 F
W (μ
g/L)
Met
hyl B
rom
ide
7483
9VO
CN
SLN
SLN
SLN
SLN
SL16
Met
hyl C
hlor
ide
7487
3VO
CN
SLN
SLN
SLN
SLN
SLN
SLM
ethy
lene
Chl
orid
e 75
092
VOC
NSL
NSL
NSL
NSL
NSL
NSL
Tetr
achl
oroe
thyl
ene
1271
84VO
C0.
468
NSL
NSL
NSL
830
98To
luen
e 10
8883
VOC
NSL
NSL
NSL
NSL
120
10Tr
ichl
oroe
thyl
ene
7901
6VO
C0.
0969
NSL
NSL
NSL
440
21Vi
nyl C
hlor
ide
7501
4VO
CN
SLN
SLN
SLN
SLN
S93
0
Not
es
mg/
kgm
icro
gram
s per
kilo
gram
SEL
Seve
re e
ffect
s lev
elN
SLN
o sc
reen
ing
leve
l ava
ilabl
eSV
OC
Sem
ivol
atile
org
anic
com
poun
dPA
HPo
lycy
clic
aro
mat
ic h
ydro
carb
onTE
LTh
resh
old
effe
cts l
evel
PCB
Poly
chlo
rinat
ed b
iphe
nyl
VOC
Vola
tile
orga
nic
com
poun
dPE
LPr
obab
le e
ffect
s lev
elμg
/Lm
icro
gram
s per
lite
r
1. F
resh
wat
er S
edim
ent T
ELs a
nd P
ELs a
re d
eriv
ed fr
om C
anad
ian
Sedi
men
t Qua
lity
Guid
elin
es fo
r the
pro
tect
ion
of a
quat
ic li
fe; a
nd S
ELs a
re d
eriv
ed fr
om G
uide
lines
for t
he
prot
ectio
n an
d m
anag
emen
t of a
quat
ic se
dim
ent q
ualit
y in
Ont
ario
Aug
199
3- re
fere
ncin
g Sc
reen
ing
Qui
ck R
efer
ence
Tab
les a
vaila
ble
at:
http
://a
rchi
ve.o
rr.n
oaa.
gov/
book
_she
lf/12
2_N
EW-S
Qui
RTs.
2. A
quat
ic C
riter
ia -
the
prim
ary
sour
ce is
US
Ambi
ent W
ater
Qua
lity
Crite
ria, f
ollo
wed
by
the
low
est o
f Tie
r II s
econ
dary
acu
te v
alue
s- r
efer
enci
ng S
cree
ning
Qui
ck R
efer
ence
Ta
bles
ava
ilabl
e at
: htt
p://
arch
ive.
orr.n
oaa.
gov/
book
_she
lf/12
2_N
EW-S
Qui
RTs.

TABL
E 2.
6H
uman
Hea
lth P
roje
ct S
cree
ning
Lev
els f
or S
edim
ents
, Sur
face
Wat
er, a
nd F
ish
Tiss
ue -
Pag
e 1
of 4
Tabl
e 2.
6_Sc
reen
ing
Leve
ls fo
r Sed
imen
ts, S
urfa
ce W
ater
, and
Fish
Tiss
ue 0
5-12
-14.
xlsx
5/15
/201
4
Indu
stria
lSo
il1E
-06
Carc
inog
enic
Scre
enin
g Le
vel
( mg/
kg)
Indu
stria
lSo
ilH
I 0.1
Non
carc
inog
enic
Scre
enin
g Le
vel
( mg/
kg)
Resi
dent
ial
Tapw
ater
1E-0
6Ca
rcin
ogen
icSc
reen
ing
Leve
l( u
g/L)
Resi
dent
ial
Tapw
ater
HI 0
.1N
onca
rcin
ogen
icSc
reen
ing
Leve
l(u
g/L)
Fish
Tis
sue
Carc
inog
enic
Sc
reen
ing
Leve
l(m
g/kg
)
Fish
Tis
sue
Non
carin
ogen
ic
Scre
enin
g Le
vel
(mg/
kg)
Cyan
ide
5712
5Cy
ano
NSL
14N
SL0.
14N
SL0.
8120
02,
3,7,
8-TC
DD
1746
016
Diox
in0.
0000
180.
0000
60.
0000
0052
0.00
0001
10.
0000
0002
40.
0000
0095
0.00
003
Antim
ony
7440
360
Met
alN
SL41
NSL
0.6
NSL
0.54
6Ar
seni
c 74
4038
2M
etal
2.4
380.
045
0.47
0.00
210.
4110
Bery
llium
74
4041
7M
etal
6900
200
NSL
1.6
NSL
2.7
4Ca
dmiu
m
7440
439
Met
al93
0080
NSL
0.69
NSL
1.4
5Ch
rom
ium
(III)
16
0658
31M
etal
NSL
1500
00N
SL16
00N
SL20
00N
SLCh
rom
ium
(VI)
1854
0299
Met
al5.
631
00.
031
3.1
0.00
634.
1N
SLCo
pper
74
4050
8M
etal
NSL
4100
NSL
62N
SL54
1300
Lead
74
3992
1M
etal
NSL
800
NSL
NSL
NSL
NSL
15M
ercu
ry
7439
976
Met
alN
SL4.
3N
SL0.
063
NSL
NSL
2N
icke
l 74
4002
0M
etal
6400
020
00N
SL30
NSL
NSL
NSL
Sele
nium
77
8249
2M
etal
NSL
510
NSL
7.8
NSL
6.8
50Si
lver
74
4022
4M
etal
NSL
510
NSL
7.1
NSL
6.8
NSL
Thal
lium
74
4028
0M
etal
NSL
1N
SL0.
016
NSL
0.01
42
Zinc
74
4066
6M
etal
NSL
3100
0N
SL47
0N
SL41
0N
SLAc
enap
hthe
ne
8332
9PA
HN
SL33
00N
SL40
NSL
81N
SLAc
enap
hthy
lene
20
8968
PAH
NSL
NSL
NSL
NSL
NSL
NSL
NSL
Anth
race
ne
1201
27PA
HN
SL17
000
NSL
130
NSL
410
NSL
Benz
o(a)
Anth
race
ne
5655
3PA
H2.
1N
SL0.
029
NSL
0.00
43N
SLN
SLBe
nzo(
a)Py
rene
50
328
PAH
0.21
NSL
0.00
29N
SL0.
0004
3N
SL0.
2Be
nzo(
b)Fl
uora
nthe
ne
2059
92PA
H2.
1N
SL0.
029
NSL
0.00
43N
SLN
SLBe
nzo(
ghi)P
eryl
ene
1912
42PA
HN
SLN
SLN
SLN
SLN
SLN
SLN
SLBe
nzo(
k)Fl
uora
nthe
ne
2070
89PA
H21
NSL
0.29
NSL
0.04
3N
SLN
SLCh
ryse
ne
2180
19PA
H21
0N
SL2.
9N
SL0.
43N
SLN
SLDi
benz
o(a,
h)An
thra
cene
53
703
PAH
0.21
NSL
0.00
29N
SL0.
0004
3N
SLN
SLFl
uora
nthe
ne
2064
40PA
HN
SL22
00N
SL63
NSL
54N
SLFl
uore
ne
8673
7PA
HN
SL22
00N
SL22
NSL
54N
SLIn
deno
(1,2
,3-c
d)Py
rene
19
3395
PAH
2.1
NSL
0.02
9N
SL0.
0043
NSL
NSL
Nap
htha
lene
91
203
PAH
1862
0.14
0.61
NSL
27N
SLPh
enan
thre
ne
8501
8PA
HN
SLN
SLN
SLN
SLN
SLN
SLN
SLPy
rene
12
9000
PAH
NSL
1700
NSL
8.7
NSL
41N
SLPC
B-10
16
1267
4112
PCB
213.
70.
960.
110.
045
0.09
5N
SLPC
B-12
21
1110
4282
PCB
0.54
NSL
0.00
4N
SL0.
0016
NSL
NSL
PCB-
1232
11
1411
65PC
B0.
54N
SL0.
004
NSL
0.00
16N
SLN
SLPC
B-12
42
5346
9219
PCB
0.74
NSL
0.03
4N
SL0.
0016
NSL
NSL
PCB-
1248
12
6722
96PC
B0.
74N
SL0.
034
NSL
0.00
16N
SLN
SLPC
B-12
54
1109
7691
PCB
0.74
1.1
0.03
40.
031
0.00
160.
027
NSL
PCB-
1260
11
0968
25PC
B0.
74N
SL0.
034
NSL
0.00
16N
SLN
SL4,
4’-D
DD
7254
8Pe
stic
ide
7.2
NSL
0.02
7N
SL0.
013
NSL
NSL
Max
imum
Cont
amin
ant
Leve
l(u
g/L)
Anal
yte
CAS
Gro
up
EPA
Regi
onal
Scr
eeni
ng L
evel
s2

TABL
E 2.
6H
uman
Hea
lth P
roje
ct S
cree
ning
Lev
els f
or S
edim
ents
, Sur
face
Wat
er, a
nd F
ish
Tiss
ue -
Pag
e 2
of 4
Tabl
e 2.
6_Sc
reen
ing
Leve
ls fo
r Sed
imen
ts, S
urfa
ce W
ater
, and
Fish
Tiss
ue 0
5-12
-14.
xlsx
5/15
/201
4
Indu
stria
lSo
il1E
-06
Carc
inog
enic
Scre
enin
g Le
vel
( mg/
kg)
Indu
stria
lSo
ilH
I 0.1
Non
carc
inog
enic
Scre
enin
g Le
vel
( mg/
kg)
Resi
dent
ial
Tapw
ater
1E-0
6Ca
rcin
ogen
icSc
reen
ing
Leve
l( u
g/L)
Resi
dent
ial
Tapw
ater
HI 0
.1N
onca
rcin
ogen
icSc
reen
ing
Leve
l(u
g/L)
Fish
Tis
sue
Carc
inog
enic
Sc
reen
ing
Leve
l(m
g/kg
)
Fish
Tis
sue
Non
carin
ogen
ic
Scre
enin
g Le
vel
(mg/
kg)
Max
imum
Cont
amin
ant
Leve
l(u
g/L)
Anal
yte
CAS
Gro
up
EPA
Regi
onal
Scr
eeni
ng L
evel
s2
4,4’
-DDE
72
559
Pest
icid
e5.
1N
SL0.
2N
SL0.
0093
NSL
NSL
4,4’
-DDT
50
293
Pest
icid
e7
430.
20.
780.
0093
0.68
NSL
Aldr
in
3090
02Pe
stic
ide
0.1
1.8
0.00
40.
047
0.00
019
0.04
1N
SLal
pha-
BHC
3198
46Pe
stic
ide
0.27
490
0.00
627.
30.
0005
11N
SLal
pha-
Endo
sulfa
n 95
9988
Pest
icid
eN
SLN
SLN
SLN
SLN
SLN
SLN
SLbe
ta-B
HC
3198
57Pe
stic
ide
0.96
NSL
0.02
2N
SL0.
0018
NSL
NSL
beta
-End
osul
fan
3321
3659
Pest
icid
eN
SLN
SLN
SLN
SLN
SlN
SLN
SLCh
lord
ane
1278
9036
Pest
icid
eN
SLN
SLN
SLN
SL0.
009
0.68
NSL
delta
-BHC
31
9868
Pest
icid
eN
SLN
SLN
SLN
SLN
SLN
SLN
SLDi
eldr
in
6057
1Pe
stic
ide
0.11
3.1
0.00
150.
028
0.00
020.
068
NSL
Endo
sulfa
n Su
lfate
10
3107
8Pe
stic
ide
NSL
NSL
NSL
NSL
NSL
NSL
NSL
Endr
in
7220
8Pe
stic
ide
NSL
18N
SL0.
17N
SL0.
412
Endr
in A
ldeh
yde
7421
934
Pest
icid
eN
SLN
SLN
SLN
SLN
SLN
SLN
SLga
mm
a-BH
C 58
899
Pest
icid
e2.
124
0.03
60.
270.
0029
0.41
0.2
Hept
achl
or
7644
8Pe
stic
ide
0.38
310.
0018
0.09
20.
0007
0.68
0.4
Hept
achl
or E
poxi
de
1024
573
Pest
icid
e0.
190.
80.
0033
0.00
920.
0003
50.
018
0.2
Toxa
phen
e 80
0135
2Pe
stic
ide
1.6
NSL
0.01
3N
SL0.
0029
NSL
31,
2,4-
Tric
hlor
oben
zene
12
0821
SVO
C99
270.
990.
390.
1114
701,
2-Di
chlo
robe
nzen
e 95
501
SVO
CN
SL98
0N
SL28
NSL
120
600
1,2-
Diph
enyl
hydr
azin
e 12
2667
SVO
C2.
2N
SL0.
067
NSL
0.00
39N
SLN
SL1,
3-Di
chlo
robe
nzen
e 54
1731
SVO
CN
SLN
SLN
SLN
SLN
SLN
SLN
SL1,
4-Di
chlo
robe
nzen
e 10
6467
SVO
C12
2500
0.42
470.
5895
752,
4,6-
Tric
hlor
ophe
nol
8806
2SV
OC
160
623.
50.
90.
291.
4N
SL2,
4-Di
chlo
roph
enol
12
0832
SVO
CN
SL18
0N
SL3.
5N
SL4.
1N
SL2,
4-Di
met
hylp
heno
l 10
5679
SVO
CN
SL12
00N
SL27
NSL
27N
SL2,
4-Di
nitr
ophe
nol
5128
5SV
OC
NSL
120
NSL
3N
SL2.
7N
SL2,
4-Di
nitr
otol
uene
12
1142
SVO
C5.
512
00.
23
0.01
2.7
NSL
2,6-
Dini
trot
olue
ne
6062
02SV
OC
1.2
190.
042
0.44
0.00
210.
41N
SL2-
Chlo
rona
phth
alen
e 91
587
SVO
CN
SL82
00N
SL55
NSL
110
NSL
2-Ch
loro
phen
ol
9557
8SV
OC
NSL
510
NSL
7.1
NSL
6.8
NSL
2-M
ethy
l-4,6
-Din
itrop
heno
l 53
4521
SVO
CN
SL4.
9N
SL0.
12N
SL0.
11N
SL2-
Nitr
ophe
nol
8875
5SV
OC
NSL
NSL
NSL
NSL
NSL
NSL
NSL
3,3’
-Dic
hlor
oben
zidin
e 91
941
SVO
C3.
8N
SL0.
11N
SL0.
007
NSL
NSL
3-M
ethy
l-4-C
hlor
ophe
nol
5950
7SV
OC
NSL
6200
NSL
110
NSL
140
NSL
4-Br
omop
heny
l Phe
nyl E
ther
10
1553
SVO
CN
SLN
SLN
SLN
SLN
SLN
SLN
SL4-
Chlo
roph
enyl
Phe
nyl E
ther
70
0572
3SV
OC
NSL
NSL
NSL
NSL
NSL
NSL
NSL
4-N
itrop
heno
l 10
0027
SVO
CN
SLN
SLN
SLN
SLN
SLN
SLN
SLBe
nzid
ine
9287
5SV
OC
0.00
7518
00.
0000
924.
60.
0000
144.
1N
SLBi
s(2-
Chlo
roet
hoxy
)Met
hane
11
1911
SVO
CN
SL18
0N
SL4.
6N
SL4.
1N
SL

TABL
E 2.
6H
uman
Hea
lth P
roje
ct S
cree
ning
Lev
els f
or S
edim
ents
, Sur
face
Wat
er, a
nd F
ish
Tiss
ue -
Pag
e 3
of 4
Tabl
e 2.
6_Sc
reen
ing
Leve
ls fo
r Sed
imen
ts, S
urfa
ce W
ater
, and
Fish
Tiss
ue 0
5-12
-14.
xlsx
5/15
/201
4
Indu
stria
lSo
il1E
-06
Carc
inog
enic
Scre
enin
g Le
vel
( mg/
kg)
Indu
stria
lSo
ilH
I 0.1
Non
carc
inog
enic
Scre
enin
g Le
vel
( mg/
kg)
Resi
dent
ial
Tapw
ater
1E-0
6Ca
rcin
ogen
icSc
reen
ing
Leve
l( u
g/L)
Resi
dent
ial
Tapw
ater
HI 0
.1N
onca
rcin
ogen
icSc
reen
ing
Leve
l(u
g/L)
Fish
Tis
sue
Carc
inog
enic
Sc
reen
ing
Leve
l(m
g/kg
)
Fish
Tis
sue
Non
carin
ogen
ic
Scre
enin
g Le
vel
(mg/
kg)
Max
imum
Cont
amin
ant
Leve
l(u
g/L)
Anal
yte
CAS
Gro
up
EPA
Regi
onal
Scr
eeni
ng L
evel
s2
Bis(
2-Ch
loro
ethy
l)Eth
er
1114
44SV
OC
1N
SL0.
012
NSL
0.00
29
NSL
Bis(
2-Ch
loro
isopr
opyl
)Eth
er
1086
01SV
OC
2241
000.
3155
0.04
554
NSL
Bis(
2-Et
hylh
exyl
)Pht
hala
te
1178
17SV
OC
120
1200
4.8
310.
2327
6Bu
tylb
enzy
l Pht
hala
te
8568
7SV
OC
910
1200
014
120
1.7
270
NSL
Diet
hyl P
htha
late
84
662
SVO
CN
SL49
000
NSL
1100
NSL
1100
NSL
Dim
ethy
l Pht
hala
te
1311
13SV
OC
NSL
NSL
NSL
NSL
NSL
NSL
NSL
Di-n
-But
yl P
htha
late
84
742
SVO
CN
SL62
00N
SL67
NSL
140
NSL
Di-n
-Oct
yl P
htha
late
11
7840
SVO
CN
SL62
0N
SL16
NSL
14N
SLHe
xach
loro
benz
ene
1187
41SV
OC
1.1
490.
042
1.3
0.00
21.
11
Hexa
chlo
robu
tadi
ene
8786
3SV
OC
NSL
NSL
NSL
NSL
NSL
NSL
NSL
Hexa
chlo
rocy
clop
enta
dien
e 77
474
SVO
CN
SL37
0N
SL2.
2N
SL8.
150
Hexa
chlo
roet
hane
67
721
SVO
C43
430.
790.
510.
079
0.95
NSL
Isop
horo
ne
7859
1SV
OC
1800
1200
067
300
3.3
270
NSL
Nitr
oben
zene
98
953
SVO
C24
120
0.12
1.1
NSL
2.7
NSL
N-N
itros
odim
ethy
lam
ine
6275
9SV
OC
0.03
40.
490.
0004
20.
012
0.00
0062
0.01
1N
SLN
-Nitr
osod
i-n-P
ropy
lam
ine
6216
47SV
OC
0.25
NSL
0.00
93N
SL0.
0004
5N
SLN
SLN
-Nitr
osod
iphe
nyla
min
e 86
306
SVO
C35
0N
SL10
NSL
0.64
NSL
NSL
Pent
achl
orop
heno
l 87
865
SVO
C2.
719
00.
035
1.6
0.00
796.
81
Phen
ol
1089
52SV
OC
NSL
1800
0N
SL45
0N
SL41
0N
SL1,
1,1-
Tric
hlor
oeth
ane
7155
6VO
CN
SL3
3800
NSL
750
NSL
2700
200
1,1,
2,2-
Tetr
achl
oroe
than
e 79
345
VOC
2.8
2000
0.06
628
0.01
627
NSL
1,12
-Tric
hlor
oeth
ane
7900
5VO
C5.
30.
680.
240.
041
0.05
55.
45
1,1-
Dich
loro
etha
ne
7534
3VO
C17
2000
02.
429
00.
5527
0N
SL1,
1-Di
chlo
roet
hyle
ne
7535
4VO
CN
SL11
0N
SL26
NSL
687
1,2-
Dich
loro
etha
ne
1070
62VO
C2.
215
0.15
1.3
0.03
58.
15
1,2-
Dich
loro
prop
ane
7887
5VO
C4.
77.
10.
380.
830.
088
120
51,
2-Tr
ans-
Dich
loro
ethy
lene
15
6605
VOC
NSL
69N
SL8.
6N
SL27
100
1,3-
Dich
loro
prop
ylen
e 54
2756
VOC
8.3
330.
413.
80.
032
41N
SL2-
Chlo
roet
hylv
inyl
Eth
er
1107
58VO
CN
SLN
SLN
SLN
SLN
SLN
SLN
SLAc
role
in
1070
28VO
CN
SL0.
065
NSL
0.00
41N
SL0.
68N
SLAc
rylo
nitr
ile
1071
31VO
C1.
27.
20.
045
0.41
0.00
5854
NSL
Benz
ene
7143
2VO
C5.
445
0.39
2.9
0.05
75.
45
Brom
ofor
m
7525
2VO
C22
012
007.
929
0.4
27N
SLCa
rbon
Tet
rach
lorid
e 56
235
VOC
360
0.39
40.
045
5.4
5Ch
loro
benz
ene
1089
07VO
CN
SL14
0N
SL7.
2N
SL27
100
Chlo
rodi
brom
omet
hane
12
4481
VOC
3.3
1200
0.15
290.
038
27N
SLCh
loro
etha
ne
7500
3VO
CN
SL61
00N
SL21
00N
SLN
SLN
SLCh
loro
form
67
663
VOC
1.5
110
0.19
8.4
0.1
14N
SLDi
chlo
robr
omom
etha
ne
7527
4VO
C1.
420
000.
1229
0.05
127
NSL

TABL
E 2.
6H
uman
Hea
lth P
roje
ct S
cree
ning
Lev
els f
or S
edim
ents
, Sur
face
Wat
er, a
nd F
ish
Tiss
ue -
Pag
e 4
of 4
Tabl
e 2.
6_Sc
reen
ing
Leve
ls fo
r Sed
imen
ts, S
urfa
ce W
ater
, and
Fish
Tiss
ue 0
5-12
-14.
xlsx
5/15
/201
4
Indu
stria
lSo
il1E
-06
Carc
inog
enic
Scre
enin
g Le
vel
( mg/
kg)
Indu
stria
lSo
ilH
I 0.1
Non
carc
inog
enic
Scre
enin
g Le
vel
( mg/
kg)
Resi
dent
ial
Tapw
ater
1E-0
6Ca
rcin
ogen
icSc
reen
ing
Leve
l( u
g/L)
Resi
dent
ial
Tapw
ater
HI 0
.1N
onca
rcin
ogen
icSc
reen
ing
Leve
l(u
g/L)
Fish
Tis
sue
Carc
inog
enic
Sc
reen
ing
Leve
l(m
g/kg
)
Fish
Tis
sue
Non
carin
ogen
ic
Scre
enin
g Le
vel
(mg/
kg)
Max
imum
Cont
amin
ant
Leve
l(u
g/L)
Anal
yte
CAS
Gro
up
EPA
Regi
onal
Scr
eeni
ng L
evel
s2
Ethy
lben
zene
10
0414
VOC
2721
001.
367
0.29
140
700
Met
hyl B
rom
ide
7483
9VO
CN
SL3.
2N
SL0.
7N
SL1.
9N
SLM
ethy
l Chl
orid
e 74
873
VOC
NSL
50N
SL19
NSL
NSL
NSL
Met
hyle
ne C
hlor
ide
7509
2VO
C96
031
09.
98.
41.
68.
15
Tetr
achl
oroe
thyl
ene
1271
84VO
C11
041
9.7
3.5
1.5
8.1
5To
luen
e 10
8883
VOC
NSL
4500
NSL
86N
SL11
010
00Tr
ichl
oroe
thyl
ene
7901
6VO
C6.
42
0.44
0.26
0.06
90.
685
Viny
l Chl
orid
e 75
014
VOC
1.7
390.
015
3.6
0.00
444.
12
1. U
S EP
A Re
gion
III B
iolo
gica
l Tec
hnic
al A
ssist
ance
Gro
up F
resh
wat
er S
edim
ent S
cree
ning
Ben
chm
arks
(Aug
ust 2
006)
2. U
S EP
A Re
gion
al S
cree
ning
Lev
el T
able
, May
201
3 ve
rsio
n3.
NSL
: N
o sc
reen
ing
leve
l is d
efin
ed fo
r the
ana
lyte

Remedial Investigation Work Plan Anacostia River Sediments Project
31
3.0 PRELIMINARY CONCEPTUAL SITE MODEL
This section discusses the preliminary CSM for contaminated sediment in the tidal Anacostia River. A CSM is a functional description of what is known about an area of concern and the contamination known or suspected to be present. The CSM incorporates the available geologic, hydrogeologic, hydrologic, contaminant concentration, and environmental receptor data into an integrated understanding of site conditions. The CSM serves as the primary tool to identify data gaps and is updated as new data become available.
Figure 3.1 shows the general CSM for the sourcing and transport of hazardous constituents in the tidal Anacostia River and potential receptor exposure to these constituents. Contaminants enter the river via tributary inflow, sediment loading, groundwater seepage, and tidal mixing. Contaminants can also enter through direct spillage or wastewater discharges associated with former practices. Contaminants associated with suspended sediment may remain in suspended transport, desorb to surface water, or become deposited on the channel bottom. Deposited sediment may become re-suspended through biological process, erosion during storm flow conditions, and through dredging activities. Surface sediment contamination may contribute to low benthic species diversity and abundance. Benthic organisms that do survive may bioaccumulate hazardous chemicals. Consumption of contaminated benthic fauna by lower tier forage fish could result in further bioaccumulation in both lower tier forage fish and upper tier predatory species. Exposure to carcinogens in sediments and through the food chain results in an elevated prevalence of liver tumors in some bottom dwelling fish species. Human exposure can result from contact with contaminated sediment and surface water and from the consumption of contaminated fish, turtles, and invertebrates.
Section 3.1 discusses the physical elements of the CSM. Sections 3.2 and 3.3 present the ecological and human health-specific CSM elements, respectively.
3.1 Physical Conceptual Site Model The physical CSM describes the physical processes through which contaminants enter each of the environmental media of concern, the fate and transport processes affecting the distribution of these contaminants, and the potential pathways for exposure to human and ecologic receptors. Section 3.1.1 discusses the constituents of concern in the investigation. Sections 3.1.2, 3.1.3, 3.1.4, and 3.1.5 discuss contaminant sources, release mechanisms, exposure media, and transport media, respectively. Watershed modeling that has been performed for the tidal Anacostia is discussed in Section 3.1.6.
3.1.1 Constituents of Concern The COCs for this investigation consist of all VOC, SVOC, metals, pesticide, cyanide, and PCB Aroclor constituents included on the EPA PP List (Table 3.1). PCDDs/PCDFs will also be sampled but on a more limited basis. In addition to the analysis of PCB Aroclors, the full list of 209 PCB congeners will also be analyzed either for all samples or selectively, depending on the medium as discussed in detail in Section 5.0. The EPA PP List is comprised of 126 constituents including 28 VOCs, 57 SVOCs, 18 pesticides, 14 metals, seven PCB Aroclors, total cyanide, and 2,3,7,8-tetrachlorodibenzo-p-dioxin (2,3,7,8-TCDD). The

Remedial Investigation Work Plan Anacostia River Sediments Project
32
57 SVOCs include 16 PAHs which are further classified as being of low or high molecular weight (LPAHs and HPAHs, respectively). HPAHs are the 10 PAHs with four or more aromatic rings and include the carcinogenic PAHs (CPAHs). As noted above for PCBs, alkylated PAHs will also be analyzed either in all samples or selectively, depending on the medium; Section 5.0 provides additional details.
A significant amount of sampling has already been conducted for many of the PP list constituents as reflected by the relatively extensive project database (Section 2.6). As will be discussed in the data gap identification portion of Section 4, however, additional sampling for PPs is necessary to address uncertainties in the existing characterization. Concentration data are available for surface sediment, deep sediment, and fish tissue. Previous sediment investigations in the Anacostia have shown that the primary contaminants that make the river unsafe for fishing or swimming are PCBs, PAHs, and selected metals and pesticides.
The PP list includes all the hazardous constituents whose presence in the river result in its Section 303(d) listing as an impaired water body. As discussed in Section 2.1, TMDLs have been established for PCBs, BOD, bacteria, organics, metals, sediment, oil and grease, and trash.
3.1.2 Sources Sources of hazardous constituents to the tidal river include surface water inflow, seepage of groundwater from contaminated sites that border the river, groundwater discharge via seepage into the sewer system, and the loading of contaminated sediments. The predominant sources for contaminated groundwater are likely the environmental cleanup sites that border the river and have documented or potential groundwater contamination issues (Section 3.1.2.1). Primary surface water and sediment sources include tributary streams, CSS outfalls, and storm sewer outfalls (Section 3.2.2.2). Once contaminants enter the river, they may be redistributed by floods, storms, and other physical disturbances.
Groundwater seepage is a potential source for the observed contamination in Anacostia River sediments. A groundwater modeling investigation of the Anacostia River watershed by Logan (1999) puts into context the potential contaminant contributions from groundwater. The model indicates that average groundwater seepage through the river bottom and from adjacent wetlands is small compared to tributary inflow. Northeast Branch and Northwest Branch are the two largest tributary streams to the tidal Anacostia River. According to Logan (1999) the estimated groundwater discharge to the Anacostia River was approximately 3.8 x 105 ft3/day or two percent of the combined average discharge of Northeast Branch and Northwest Branch of 1.9 x 107 ft3/day (average for the period 1938 – 2000 [Miller et al. 2007]). The small groundwater seepage contribution to the river’s discharge is a result of the low hydraulic conductivity of the clayey deposits that predominantly comprise the river bottom and adjacent floodplain. It should be noted, however, that groundwater preferential discharge pathways will exist where coarse grained materials intersect the river bottom. Based on existing site information, coarse grained material at or in close proximity to the river bottom likely is most commonly encountered near the confluence of Northeast Branch and Northwest Branch. Downstream from this area, however, deposition is dominated more by silt and clay size materials.
Remedial Investigation Work Plan Anacostia River Sediments Project
33
3.1.2.1 Environmental Cleanup Sites
Contaminants may enter the Anacostia River from the contaminated sites that border the river. Contaminant entry pathways include erosion and transport of contaminated soil, contaminated runoff, and seepage of contaminated groundwater. Table 3.2 lists the environmental cleanup sites for which documentation exists regarding monitored constituents and the reported constituents at each site for surface soil, subsurface soil, groundwater, sediments, and surface water. Each of these media could serve as a primary or secondary source of contamination for site constituents. A brief summary for each site follows. Background information including a summary of the sediment sampling results from previous investigations is provided for each site in Section 2.6.2.
Kenilworth Park Landfill. In comparison to the screening levels discussed in Section 2.7, surface and subsurface soils at this 130 acre site contain elevated concentrations of PAHs, PCBs and various pesticides and metals. Portions of the fill area directly contact the river or are within 100 feet of the riverbank. In general, the water table occurs in the landfilled wastes. Groundwater migrating through the wastes is contaminated by dissolution of constituents from the wastes and by downward migrating leachate from the overlying unsaturated wastes. Groundwater constituents include metals and various VOCs. Groundwater from the site discharges directly to the river (Ecology and Environment 2007a). A supplemental groundwater investigation was started at this site in 2013.
Pepco Benning Road Facility. The 77-acre Pepco Benning Road facility contains several areas of known soil contamination. According to AECOM (2012), six petroleum USTs were either removed or closed in place. The potential exists that residual petroleum hydrocarbon contamination is present at these sites. In addition, excavation of PCB contaminated soil was conducted at several locations. Relative to the screening levels discussed in Section 2.7, residual elevated PCB levels may persist in soil at each location. In addition, elevated PAHs, PCBs, and metals have also been detected in a former sludge dewatering area. As a result of these issues, constituents of concern in soil, groundwater, sediment, and surface water at the Benning Road facility include VOCs, PAHs, PCBs, and metals.
CSX Benning Yard. The primary source of contamination at the CSX Benning Yard is groundwater contamination resulting from a subsurface diesel spill. Based on data provided in Geosyntec (2013a), a NAPL plume with an approximate area of 1.3 acres has resulted in discharge of contaminated groundwater to Fort Dupont Creek and, on occasion, the appearance of a petroleum hydrocarbon sheen in the creek. Downstream from Benning Yard, Fort Dupont Creek flows a distance of 806 feet through a 72-inch diameter reinforced concrete pipe (EnviroScience2013) to an outfall in the tidal Anacostia River. Site constituents of concern in soil include VOCs (BTEX) and TPH DRO. TPH DRO includes the range of LPAH and HPAH PP compounds. Sediment sampling was conducted in Fort Dupont Creek and in the river near the Fort Dupont Creek outfall. Sediment (downstream from the spill area) and groundwater constituents include metals and PAHs, TPH DRO; SVOCs are also a concern in groundwater.
WGL East Station. The WGL East Station site is a 18 acre site with contamination typical for manufactured gas plant (MGP) sites. An RI including near-shore sediments is ongoing. NAPL has been observed in the fill materials underlying the site. In addition, NAPL recovery is ongoing through the use of a pump and treat system. The extent to which groundwater discharge to the adjacent Anacostia River
Remedial Investigation Work Plan Anacostia River Sediments Project
34
is controlled hydraulically by a pump and treat system will be evaluated during the WGL OU2 RI. COCs include a range of metals, selected VOCs, PAHs, and complex cyanides.
Poplar Point. A Phase I environmental site assessment (ESA) completed by Ridolfi Engineers (Ridolfi) (2003b) identified a number of recognized environmental conditions (RECs) at the Poplar Point Site. Ridolfi also completed site characterization sampling at the site in 2002 (Ridolfi 2003a). Sampling included soil, sediments, groundwater, and surface water. Soil samples were screened using the lowest screening level obtained from reviewing EPA Region 3 BTAGs, DC Risk-Based Screening Levels (residential and industrial), EPA Region 3 Risk-Based Concentrations (RBCs) (residential and industrial), and EPA Region 3 Site Screening Levels (SSLs) for Soil to Groundwater Migration (dilution attenuation factors 1 and 20). Sediment sampling results were compared to Region 3 BTAGs and NOAA Screening Quick Reference Tables (SQuiRTs) sediments screening levels (threshold and probable effects levels). Groundwater samples were screened against EPA MCLs, DC Groundwater Criteria, DC Risk-Based Screening Levels for Groundwater (residential and industrial), and EPA Region 3 RBCs for tap water.
Benzo(a)pyrene (BaP), 4,4’-DDT, arsenic, and diesel constituents where significantly elevated in some site soil samples. The elevated BaP concentrations were observed in portions of the site formerly used as a tree nursery while the pesticides exceedances primarily occurred near wetland areas. Several soil samples exceeded the total PCB (Aroclors) screening level including one taken adjacent to a wetland and another collected adjacent to a former garage. In addition, groundwater samples from a former burn pit and various former petroleum storage areas exhibited elevated concentrations of benzene, toluene, ethylbenzene, xylene, and methyl tert-butyl ether. Other groundwater contaminants detected above screening levels included metals, pesticides, PCBs, VOCs, and SVOCs. In addition to environmental investigation activities, abandoned drums and inactive underground and above ground storage tanks have been removed during previous site actions.
Washington Navy Yard. The Washington Navy Yard encompasses 63 acres and is located adjacent to the WGL East Station. Residual sediment present in since-renovated sewer lines at the site contained, in comparison to Section 2.7 screening levels, elevated PCBs, PAHs, and metals. PCB contamination exists in several areas including the former power plant. Soil containing elevated lead concentrations originating from lead-based paint has been removed during cleanup of site soils. In addition, mercury contaminated soil was remediated at one location. Elevated arsenic and lead concentrations are widespread in site groundwater. Low-level chlorinated VOC plumes have been identified at various locations. Trichloroethene, cis-dichloroethene, trans-dichloroethene, and vinyl chloride concentrations are typically below or slightly above the respective drinking water MCL for each compound (Section 2.7). COCs in soils include VOCs, PAHs, non-PAH SVOCs, PCBs, pesticides, and metals. Metals and chlorinated VOCs are of concern in groundwater. Sediment constituents include metals, PCBs, and PAHs. Polychlorinated dibenzo-p-dioxins/polychlorinated dibenzofurans (PCDD/PCDFs) were detected in site sediments but were not determined to be drivers of human health or ecological risk (CH2M Hill 2011a).
Joint Base Anacostia-Bolling. JBAB comprises 905-acres located between the Potomac and Anacostia rivers and Interstate 295. A web search revealed that 17 former leaking underground petroleum storage tank (LUST) sites existed at JBAB, identified between 1989 and 1997. The substances leaked included

Remedial Investigation Work Plan Anacostia River Sediments Project
35
gasoline, waste/used oil, heating fuel oil, and kerosene. Documented contamination of soil and/or soil and groundwater resulted from LUST sites and all 17 cases were resolved by 2003. Several localized investigations have been conducted at specific sites within JBAB associated with incinerator waste disposal areas (AOC 1), fill areas (Site 2), a petroleum-contaminated area (Site 3), and a hazardous materials storage and usage site (Building 168). Barium, iron, manganese, and dioxins/furans in groundwater at AOC 1 may pose potentially unacceptable risks to aquatic organisms in the Anacostia River adjacent to AOC 1. Barium, iron, and manganese were identified as posing a potential risk to water column receptors in the Anacostia River, adjacent to Site 2. Detected concentrations of SVOCs and metals at Site 3 were similar to background concentrations and were considered not likely to pose any unacceptable risks to the human health and ecological receptors. Six monitoring wells in the vicinity of Building 168 were sampled and only metals were present at concentrations exceeding screening criteria. Maximum concentrations of filtered groundwater samples collected from these six wells were as follows: arsenic $!!#"����&'��*�����$+<+����&'��������$=#>+����&'������$?@�+==����&'���������\��$<�!==����&'��������� (6.�����&'��������������$!#!����&).
Former Steaurt Petroleum Company Adjacent to the East of WGL East Station. The Former Steuart Petroleum Company property adjacent to the WGL East Station was formerly used as a bulk petroleum facility. Soil and groundwater were formerly contaminated with TPH, BTEX, MTBE, and naphthalene in the vicinity of former USTs and a release of #4 fuel oil (Section 2.7). The facility has achieved closure status in the District UST program.
Hess /Gulf Former Petroleum Terminals. Two former petroleum terminals conducted operations between the 1920s and 1980s adjacent to western terminus of the South Capital Street Bridge. Environmental investigations conducted in the 1990s and 2000s indicate that soil and groundwater at the site is contaminated with BTEX, TPH, PAHs, and NAPL (Section 2.7). Environmental remediation was ongoing at these facilities dating to at least 2005 including a groundwater pump and treat system.
3.1.2.2 Outfalls and Tributary Streams
With the exception of some isolated woodland areas which are mostly associated with parkland, the Anacostia watershed has been developed resulting in the covering of a high proportion of the land area with impervious surfaces (e.g., pavement in roads and parking lots, sidewalks, and residential/ commercial/industrial structures). As a result of reduced infiltration, surface water discharge from the outfalls and tributary streams to the Anacostia River is characterized by high sediment content and rapid velocities, particularly during storm events (AWTA 2002). Many tributaries receive large portions of their flow from storm sewers.
A large proportion of the contaminants contained in outfall and tributary discharge are associated with non-point source, low level “urban background” contamination levels present throughout the watershed. CSS outfalls, storm sewer outfalls, and tributary streams are all sources for this contamination.
PAHs, PCBs, pesticides, and metals are typical contaminants characteristic of urban background. PAHs are present in petroleum based fuels, lubricants, asphalt and combustion particles (soot) and are

Remedial Investigation Work Plan Anacostia River Sediments Project
36
characteristic of the runoff from roads and other urban surfaces. Although widespread use of PCBs in electrical equipment and various other products was banned in 1976, these compounds persist as surface water and sediment contaminants. Pesticide contaminants originate from current and previous citywide pest management campaigns and from general household use of these compounds. Metals are present in native soils and can originate from other diverse sources. For example, historical use of leaded gasoline has caused elevated lead levels in surface soil in urban areas. DDOE is in the preliminary planning stages of a study to characterize tributary loading to the tidal Anacostia River. This effort is being conducted external to the RI.
Combined Sewer System Outfalls. Significant sources of contaminated surface water and sediment to the tidal Anacostia River are the CSS outfalls operated by the District of Columbia Water and Sewer Authority (DC Water). Based on information obtained from the DC Water database, up to 16 CSS outfalls discharge or have discharged to the tidal river (Figure 3.2). Most of these outfalls are located in the lower Anacostia River, downstream from the CSX railroad bridge. DC Water indicates that 15 CSS outfalls currently discharge to the Anacostia River (DC Water 2012). Table 3.3 summarizes the information available for each outfall included in the DC Water database. Each CSS outfall is permitted by EPA through the NPDES.
CSS outfalls discharge a mixture of sewage and storm water to surface water during high runoff periods such as a storm event. Under normal precipitation conditions, sewer capacity is sufficient to convey wastewater and runoff discharge volumes to a treatment facility (Blue Plains Advanced Wastewater Treatment Plant for the DC Water system). To avert flooding during a storm when the combined wastewater and storm water flows exceed the wastewater system capacity, CSS outfalls divert a mixture of raw sewage and storm water directly to the receiving surface water body, an event termed a CSS overflow. For the CSS outfalls that discharge to the tidal Anacostia River, sanitary flow capacity is exceeded even after moderate storm events. Combined discharge to the river occurs for precipitation events as low as 0.27 inches over a 24 hour period (AWTA 2002). For 2013, DC Water reported a total of 92 CSO releases and 1.8 billion gallons for the total CSO overflow volume (www.dcwater.com/wastewater_collection/css/css_reports.cfm).
As shown on Table 3.3, drainage area data are available for some of the Anacostia CSS outfalls. Over 93 percent of the CSS outfall flow volume was contributed by two CSS outfalls: the Main and O Streets (NPDES 12) CSS outfall near the Washington Navy Yard and the Northeast Boundary Facility “Swirl Concentrator” CSS outfall (NPDES 019) (AWTA 2002). The drainage areas for these two CSS outfalls are 1,153.83 and 4,242.39 acres, respectively. For the 10 other CSS outfalls for which data are available, drainage areas range from 13.56 to 259.91 acres and average 94.89 acres.
In addition to the contaminant loading common for all outfalls and tributaries in the Anacostia watershed, CSS outfall discharges also degrade water quality by causing elevated levels of pathogenic bacteria and increased BOD. Elevated BOD can result in oxygen-depleted zones unable to support aquatic life.
Remedial Investigation Work Plan Anacostia River Sediments Project
37
In accordance with a four-party 2005 consent decree signed by the Assistant U.S. Attorney General, the U.S. EPA Regional Administrator, the DC Water General Manager, and the DC City Administrator, DC Water has developed a comprehensive plan called the Long Term Control Plan (LTCP). As part of this plan, DC Water initiated construction in 2011 on a tunnel and pumping system that will substantially reduce CSS outfall discharges (DC Water originally predicted a 98 percent reduction) by collecting and storing excess storm water flows for treatment at the Blue Plains facility (DC Water 2012). The 2005 consent decree has been the subject of recent discussion between EPA, DC Water, and the District, as the feasibility of modifying the consent decree to incorporate aggressive implementation of green infrastructure is under evaluation. Pending court-approved modification of the consent decree, the reductions and implementation schedule originally specified in the LTCP may change.
Storm Sewer Outfalls. Storm sewer outfalls (referred to herein as MS4 outfalls) solely discharge storm water runoff without contributions from the sanitary sewer system. Together with the CSS outfalls, the MS4 outfalls, drain the surrounding urbanized area that, prior to development, was drained by native streams. Figure 3.2 shows the 60 MS4 outfalls that the DC Water database lists as tributary to the tidal Anacostia River. Also shown are 13 Prince George’s County MS4 outfalls (labeled for the purposes of this report as “PG-TMP-#”) preliminarily identified from available data. MS4 outfalls are present mostly south of Benning Road and are most numerous in the Anacostia River from South Capitol Street to the river mouth and in the Washington Channel. Table 3.4 lists the MS4 outfalls that discharge to the tidal Anacostia River. The drainage areas for the MS4 outfalls are undefined in the DC Water database and in the available data for the Prince George’s County outfalls. As shown in this table, several outfalls originate as surface streams including Stickfoot Creek, Fort Davis Creek, Texas Avenue Tributary, Fort Dupont Creek, and Fort Chaplin Creek.
Tributaries. Table 3.5 lists the 14 streams that are tributary to the tidal Anacostia River within the study area. The three largest tributaries are Northwest Branch, Northeast Branch, and Lower Beaverdam Creek which account for 45, 32, and 17 percent, respectively of the total flow of the river (Warner et al. 1997).
A number of investigations have been conducted to assess the relative contributions of contaminants from the tributaries to the tidal river. The results from a 1997 study of Northwest Branch and Northeast Branch indicated that Northeast Branch total and dissolved concentrations of trace metals were consistently higher than those observed in Northwest Branch (AWTA 2002). Miller et al. (2007) evaluated total and dissolved trace metal concentrations for Northwest Branch and Northeast Branch for the period 2003 through 2005. Results of this study indicated that similar metals concentrations were measured in each stream and that concentrations in both streams were similar to the Susquehanna River and other rivers in the U.S. Total arsenic, cadmium, and lead concentrations from Miller et al. (2007) are compared to the SQuiRTs chronic freshwater screening levels of 150, 0.25, and 2.5 μg/L, respectively (http://archive.orr.noaa.gov/book_shelf/122_NEW-SQuiRTs.pdf). Arsenic and cadmium average total concentrations are less than the screening level for both Northeast Branch and Northwest Branch. Average total concentrations for lead from both streams exceed the screening level. Average concentrations for arsenic, cadmium, and lead (total) for Northwest Branch were 1.4, 0.16, and
Remedial Investigation Work Plan Anacostia River Sediments Project
38
20 μg/L, respectively. Average concentrations for arsenic, cadmium, and lead in the Northeast Branch were 1.4, 0.16, and 14 μg/L, respectively.
Foster et al. performed a study on surface water samples taken from the Northeast and Northwest Branches of the Anacostia River to determine the baseline concentrations of PAHs, PCBs and OCP. Samples were taken between September 1995 and September 1996 and included measurements during six base flow periods and four storm flow periods. A Fultz submersible pump using ultra-clean collection techniques was used to collect the samples which were taken above the head of tide near two USGS stream gauging stations.
Samples were analyzed for both the dissolved and particle phases of PCBs (85 congeners), PAHs (18 homologues) and OCPs. Particulates accounted for the majority of the contaminants in transport for all three organic contaminants groups, (88% and 91% of total-PAHS and t-PCBs respectively and the majority of the OCPs). Total fluxes in both the Northeast and Northwest branches of the Anacostia for PAHs and t-PCBs equaled 760 kg per year and 3.3 kg per year respectively. The greatest fluxes for OCPs were the chlordanes (including alpha- and gamma-chlordane, trans-nonachlor, heptachlor expoxide, and oxy-chlordane) which parallels the frequent pesticides detection in fish in the tidal Anacostia River. Data within Foster et al., 2000 suggests that organic contaminants are traveling from the watershed to the tidal river, predominantly in the particulate phase during high flow events.
Hwang and Foster (2008) monitored total and dissolved PCB concentrations in Lower Beaverdam Creek, Watts Branch, and Hickey Run for the period April 2002 through August 2002. Eighty-five PCB congeners were monitored in this study. Their results indicated that total PCBs (dissolved and particle-bound) were up to 80 times higher for storm flow in comparison to base flow concentrations and that more than 90 percent of the total PCB loading is associated with sediment particle transport. Dissolved phase concentrations were more enriched in the less chlorinated PCBs (e.g., PCB 28) relative to more chlorinated congeners (e.g., PCB 180). In addition, their results suggest that Lower Beaverdam Creek is a much more significant source of PCB contamination than are Northwest Branch and Northeast Branch. Compared to the SQuiRT surface water chronic screening level (0.014 μg/L), Lower Beaverdam Creek total PCB concentrations were lower for base flow (0.0118 μg/L) and elevated for storm flow (0.211 μg/L).
3.1.3 Release Mechanisms Release mechanisms and the fate and transport of the various constituents of concern depend on the chemical properties of respective constituents.
The principal constituents of concern, PCBs, PAHs, pesticides, and metals, enter the Anacostia River primarily via the loading of contaminated sediments. These constituents, particularly metals, may also be present to some extent in the dissolved phase. As a result of the relatively low current velocity in the tidal Anacostia River, sediments delivered by outfalls and tributaries are size-differentiated with the coarser grained fractions forming bars and deltas at the entry point and the finer grained fractions remaining in suspension for continued transport. Fine suspended particles have a greater sorptive capacity than do coarse grained sediments because finer particles have greater surface area compared

Remedial Investigation Work Plan Anacostia River Sediments Project
39
with their weight and volume. The greater surface area coupled with the organic carbon fraction present in the sediment (as discussed further in Section 3.1.5) provides for more sorptive capacity, i.e., the ability to gather contaminants through absorption and/or adsorption. PCBs, PAHs, and pesticides are hydrophobic and tend to sorb to fine sediments. Metals also sorb to varying degrees depending on the metal and ambient geochemical conditions (pH, oxidation potential [Eh], solubilities of associated ions, etc.). Hydrophobic compounds and metals are thus transported downstream with the suspended sediment. These constituents are then removed from the water phase either by deposition in the lower portion of the Anacostia River or exit with discharging surface water to the Potomac River, although, as suggested by the modeling discussed in Section 2.5, most suspended sediment is trapped in the Anacostia and deposited. Deposited sediments may also become remobilized through biological processes such as borrowing and through physical processes such as erosion under storm flow conditions.
VOCs and LPAHs are also potential constituents of concern. These constituents have greater solubilities, are more volatile, and may be more vulnerable to degradation processes. VOCs and LPAHs may be released to the river via contaminated groundwater seepage from one of the environmental sites that border the river. Once exposed to the atmosphere or oxygenated surface water, the concentrations for VOCs and some LPAHs would be expected to decrease in the river system through volatilization or degrade through other processes.
Sediment chemistry changes can reflect the effects of sedimentation. McGee et al. (2009) compared surface sediment samples on the Anacostia River in 2000 to samples taken in 1992 (Schlekat et al. 1994) and concluded that contaminant concentrations had decreased since 1992. The statement was based on a comparison of seven stations between the East Capitol Street Bridge and the confluence of the Anacostia River to the Potomac River. Sediment organic carbon and grain size were compared between the two years. Sediment organic carbon content was similar, with an average increase of 15 percent, and, on average, there was 60 percent less fine grain sediment. Concentrations of total PCBs decreased by an average of 74 percent at all stations but one, the location at the confluence of the Anacostia River and the Potomac River which had an increase of 75 percent. Total DDT compounds in the upper river decreased by 43 percent and total-chlordane decreased by 40 percent with a similar trend to the total PCB concentrations in that the values increased at the two lower stations. Total PAHs concentrations at all stations increased by 84 percent. Similar trends were observed when organic contaminant concentrations were normalized to organic carbon (an increase in total PAHs and general decrease for total PCBs, total DDT and t-chlordane).
The comparison of metal concentrations exhibited a similar trend to the organic concentrations in that metal concentrations in the upper river were lower in 2000 when compared to 1992 and slightly higher concentrations were observed in the lower river. Average concentrations of cadmium, copper and mercury were eight, 14 and 31 percent higher (respectively) in 2000 when compared to 1992. Average concentrations of chromium, lead and zinc were 18, 21 and eight percent lower (respectively) in 2000. Because of the large difference of grain size between 1992 and 2000, the data were normalized to the amount of fine grained sediment. Four of the stations had higher concentrations of trace metals by a
Remedial Investigation Work Plan Anacostia River Sediments Project
40
factor of two for all metals and higher bulk and normalized metal concentrations were evident at lower river locations when compared to the upper locations.
3.1.4 Exposure Media Contaminated media within the Anacostia River study area consist of surface water, surface sediment, deep sediment, and fish tissue. Contaminated suspended sediments are likely an important medium for exposures of ecologic and human health receptors to PCBs, PAHs, pesticides, and metals.
PCBs, PAHs, pesticides, and metals can also be present as dissolved constituents in the surface water (Gruessner et al. 1997). For example, Paul and Ghosh (2010) measured total PCB concentrations ranging up to 0.008 μg/L in Lower Beaverdam Creek. Total detected PCB congeners (57 measured) in Anacostia River water samples collected from mid water column near the O Street Outfall (adjacent to the Southeast Federal Center) averaged 0.005 μg/L (Horne Engineering 2003). Exposure, therefore, can occur through contact or ingestion of dissolved phase contaminants. An additional concern for surface water in the Anacostia River is human and ecologic exposure to pathogenic bacteria (which will not be evaluated in the RI).
3.1.5 Transport Media and Mechanisms The dominant transport medium for the constituents of concern is the downstream migration of contaminants sorbed to suspended sediment. Coarse grained sediments are typically deposited in close proximity to release points. The transport of hydrophobic organic chemicals such as PCBs, PAHs, and pesticides is likely controlled by the amount of organic matter present in the sediment. Greater organic concentrations (or organic carbon fraction [foc]) result in a greater capacity to accumulate hydrophobic compounds through sorption. Champ (1979) measured dissolved and particulate average yearly organic carbon concentrations of 2.81 and 5.02 mg/L near the South Capitol Street Bridge. Velinsky et al. (1999) observed that particulate organic carbon concentrations in the water column increased in the vicinity of Kenilworth Aquatic Center and the CSX Railroad Bridge and declined downstream from these areas. In a 2011 sampling of Anacostia River surface sediments from near the Fort Dupont Creek outfall, the most recent event for which data are available, EnviroScience (2013) measured the organic carbon fraction (foc) in 28 samples. The foc in these samples ranged from 0.13 to 70 and averaged 7.8 percent. Foster et al. (2000) measured foc concentrations in storm water particulates from the upper Anacostia River that ranged from three to 10 percent. Behm et al. (2003) assumed an foc value of nine percent for the purposes of sediment fate and transport modeling.
A number of environmental conditions including pH, biochemical controls, and redox state affect the partitioning of trace metals between sorbed and dissolved phases. Prestegaard et al. (2010) investigated lead, zinc, cadmium, and copper mobilization and deposition in the Anacostia watershed. Results of this investigation indicated that the upper tributaries receive sediments from both surface and stream bank erosion and that metals are transported in both the sorbed and dissolved phases. Sediment contamination with trace metals is highest at the river’s mouth where most metals are present as sorbed species. Dissolved concentrations are low in the lower Anacostia River likely as a result of the high pH (7-9) of urban runoff conveyed in cement-lined channels to the lower watershed (Prestegaard et al. 2010).
Remedial Investigation Work Plan Anacostia River Sediments Project
41
3.1.6 Watershed Modeling The Anacostia watershed has been the subject of several modeling studies dating back to the 1980s (Mandel and Schultz 2000). The TAM was developed for the Metropolitan Washington Council of Governments in the late 1980s to evaluate CSS outfall abatement options and water quality management strategies for the watershed. The model included a hydrodynamic component for simulating flow velocities and tide heights and a water quality component for simulating dissolved oxygen dynamics and eutrophication. The TAM was based on the Hydrodynamic Ecosystem Model (HEM) developed by the Virginia Institute of Marine Science (Mandel and Schultz 2000). HEM is a one-dimensional hydrodynamic and water quality model developed to simulate small tidal embayments.
In 2000, EPA’s Water Quality Analysis Simulation Program (WASP5) EUTRO model was incorporated into the TAM framework to simulate dissolved oxygen and eutrophication. The TAM/WASP Toxics Screening Level Model (TAM/WASP model) was completed in 2003 and included greater hydrodynamic resolution and the capability to simulate sediment quality and velocity-dependent deposition and resuspension of sediments. The model simulates daily changes in sediment concentrations in both the water column and the bed sediment by simulating the processes of advective transport, dispersive transport, deposition, and erosion. The TAM/WASP model was used to simulate loading, fate, and transport of zinc, lead, copper, arsenic, PCBs, PAHs, chlordane, heptachlor epoxide, dieldrin, and DDT in the tidal portion of the Anacostia River (Behm et al. 2003). In addition, the TAM WASP model was used to support District TMDL determinations for water quality parameters in the Anacostia River (DC Department of Health 2003).
Subsequent to the 2003 calibration, Kim et al. (2007) conducted an additional TAM/WASP assessment in support of Anacostia River watershed TMDL determinations for the Maryland Department of the Environment. They used the Hydrological Simulation Program – Fortran (HSPF) to simulate upland tributary sediment loading and updated the TAM/WASP model calibration using data from the three year period 1995 – 1997.
The TAM/WASP model results are summarized below for the modeling discussed in Schultz (2003) and Behm et al. (2003). The calibration period for the model was January 1, 1988 through December 31, 1990. In addition, this modeling considered the comprehensive sediment quality data set generated by the surface sediment sampling event conducted by the Academy of Natural Sciences in 2000.
Hydrodynamic Modeling and Simulation of Contaminant Loading. Consistent with the low flow velocities observed in the tidal Anacostia River, the model represents the estuary as a primarily depositional environment (Schultz 2003). For the calibration period, the modeled flow velocities are generally less than 0.1 m/sec in the portions of the channel near the head and mouth of the estuary. Flow velocities are moderately higher in the four mile channel reach beginning two miles downstream from the upper tidal limit (Schultz 2003). The model estimates that approximately 90 percent of the sediment entering the tidal river is deposited. Predicted accumulation rates are highest in the upper and lower portions of the river. The sedimentation rates are predicted to range from 0.6 to 3 cm/year for the upper portion of the estuary and 0.6 to 1.3 cm/year from 11th Street Bridge to the mouth of the river. As discussed in Section 2.5, sediment core analyses suggest that the estimated sedimentation rate in the

Remedial Investigation Work Plan Anacostia River Sediments Project
42
Poplar Point vicinity (just upstream from the 11th Street Bridge ranges from 3 to 7 cm/year. In comparison to this result, the model estimate appears biased low.
Sediment transport model loading for the constituents of concern is required for the TAM/WASP model. Daily sediment load was specified in the model using measured or estimated flows and estimated sediment concentrations. Depending on the source, sediment loads were obtained from direct monitoring results, from streams with available data, or from modeling results. For PCBs, PAHs, and pesticide loading, concentrations were estimated from data collected for Northwest Branch and Northeast Branch. Data that were more outfall or tributary-specific were available for metals (Schultz 2003).
Contaminant Fate and Transport. The TAM/WASP model simulated spatial trends for metals and organic contaminants. A general increase in concentration of most constituents is predicted with distance traveled downriver. Overlaying this pattern are locally elevated areas that typically appear to correspond to an outfall or tributary entry point.
The TAM/WASP model indicated that the upstream tributaries are the predominant sources for metals found in the tidal river bed sediments (Behm et al. 2003). In addition, the model indicates that Lower Beaverdam Creek contributes a disproportionately high metals load to the tidal river.
The model estimates that two-thirds of the metals and PCBs that enter the tidal Anacostia River are deposited in the bed sediments. With regard to PAHs, the model predicts that approximately half of the inbound mass is deposited; for chlordane and heptachlor epoxide, the deposited amounts are 56 and 27 percent of the mass loadings, respectively (Behm et al. 2003).
3.2 Ecological Conceptual Site ModelThe ecological CSM describes the processes that link contamination sources to ecological receptors through complete exposure routes in the study area. The ecological CSM for the current investigation is summarized in the following sections.
3.2.1 Previous Screening Level Ecological Risk Assessment A SLERA of the tidal Anacostia River conducted by Syracuse Research Corporation et al. (2000) serves as a starting point for the current analysis. The SLERA indicated that concentrations of chromium, lead, mercury, nickel, zinc, PAHs, PCBs, and several pesticides are sufficiently elevated in sediments in some reaches of the river to be harmful to benthic invertebrates. In addition, the 2000 SLERA indicated that elevated PAH concentrations posed a risk to fish. This SLERA and other published reports (McGee et al. 2009; Galli et al. 2010) provided a framework for the preliminary CSM for this RI.
3.2.2 Potential Ecological Receptors Although the Anacostia River is a highly impacted urban river, a variety of ecological receptors exist within the project area. The tidal estuary is habitat for benthic and epibenthic invertebrates; pelagic, midwater, and benthic fish; amphibians; freshwater turtles, piscivorous and omnivorous birds; and carnivorous and omnivorous mammals. The distribution of these species within the project area is influenced by food supply, water depth and quality, current, shoreline habitat, and other factors.

Remedial Investigation Work Plan Anacostia River Sediments Project
43
The primary exposure pathways for aquatic receptors are (1) ingestion of contaminated surface water, sediments, and food items and (2) direct contact with surface water and sediments. Benthic and epibenthic invertebrates and fish likely experience the greatest exposure as they are in near constant direct contact with sediment and water and tend to ingest contaminated food from a limited area. Higher trophic level receptors such as omnivorous and carnivorous birds and mammals are exposed principally through ingestion of contaminated plants and prey, sediment, and water. Contaminants may bioaccumulate in higher trophic level animals that consume prey that have ingested contaminants.
Fishes in the Anacostia River include typical mid-Atlantic freshwater resident fish species (such as killifishes, sunfishes, catfishes, and American eel) , as well as anadromous runs of white perch, blueback herring, and alewife (Pinkney 2009; NOAA CPRD http://mapping.orr.noaa.gov/website/test/anacostia/guide/aboutar/fish.html). Omnivorous and carnivorous birds that forage in the river include herons, egrets, gulls, double-crested cormorant, osprey, bald eagles, and kingfisher (Rattner et al. 2004; NOAA CPRD http://mapping.orr.noaa.gov/website/test/anacostia/guide/aboutar/birds.html). Mammals known to forage in or near the river include beaver, river muskrat, otter, mink, fox, and raccoon (NOAA CPRD http://mapping.orr.noaa.gov/website/test/anacostia/guide/aboutar/mammals.html). Receptors vary in their sensitivity to various chemicals. The ERA will review available literature and develop toxicity profiles suitable for the receptors expected to occur in the Anacostia River. Sources such as the ATSDR toxicity profiles (ATSDR 2014) and the Contaminant Hazard Review series by Eisler (www.pwrc.usgs.gov/eisler/reviews.cfm).
Epibenthic invertebrates that likely contribute to contaminant transport from sediment to vertebrate predators include native and introduced crayfishes. Native and introduced freshwater clams as well as mussels likely occur in the river. The benthic community reflects the degraded water quality of the river from decades of industrial and urban activities, with low diversity, low abundance, and dominance by pollution-tolerant invertebrates (AWTA and AWRC 2002; McGee et al. 2009). Ecological receptors are discussed further in Section 7.0.
3.2.3 Potential Exposure Pathways Benthic and epibenthic invertebrates and fish are potentially exposed to chemicals in the sediments through direct contact and ingestion. Important exposure routes for filter-feeding and particulate feeding bivalve invertebrates include ingestion of sediment and contaminated food particles, as well as direct contact with sediment, surface water, and pore water. Epibenthic invertebrates such as crayfish ingest sediment as well as prey that are closely associated with sediment. Like crayfish, benthic fish (such as carp and catfishes) are exposed to chemicals through direct contact with sediments, incidental ingestion of sediment during feeding, and consumption of contaminated prey. High incidence of liver tumors in brown bullhead (catfish) in the Anacostia River and neighboring waterbodies have been attributed to exposure to PAHs (Pinkney et al. 2013).
Pelagic fishes include both planktivorous species like the blueback herring (which is exposed predominately to water and the sediment and plankton suspended in it) and carnivorous species like the largemouth bass that consumes fish and crayfish. Carnivorous birds and mammals are exposed to

Remedial Investigation Work Plan Anacostia River Sediments Project
44
bioaccumulative chemicals in the tissues of contaminated prey, such as fish and crayfish. See Section 7.0 for discussion of complete exposure pathways.
3.3 Human Health Conceptual Site Model The human health risk assessment CSM describes the inputs of hazardous constituents to the river, the physical and chemical fate and transport processes for these constituents, and the human receptors and relevant exposure pathways. The human health CSM for the current investigation is summarized in the following sections. Sections 3.3.1, 3.3.2, and 3.3.3 discuss a previously completed human health screening assessment, potential human receptors, and exposure pathways, respectively.
3.3.1 Previous Human Health Risk Screening In addition to the SLERA, Syracuse Research Corporation et al. (2000) performed a human health risk screening of sediment, surface water, and fish tissue from the tidal Anacostia River. The Syracuse screening served as a starting point for the current analysis. Based on conservative assumptions, the screening identified dioxins and furans, pesticides, PCBs, arsenic, cadmium, lead, and mercury as COC for human consumption of fish tissue. COCs for direct contact with sediment were arsenic, PCBs, and PAHs; COCs for surface water (direct contact and incidental ingestion) were arsenic, PCBs, and various pesticides. The HHRA at WNY also identified PCBs and arsenic as human health risk drivers (CH2MHill 2011a).
Since 1989, the District of Columbia has published and posted advisories regarding human consumption of fish caught in the Anacostia River. These advisories were issued because of the presence of toxic and bioaccumulative contaminants in the tissue of edible fish species in the river. A recent survey of anglers fishing in the Anacostia River was completed by OpinionWorks in 2012 (OpinionWorks, 2012). This study concluded that, based on the assumption that five percent of the lower Anacostia River watershed population consumes fish from the river; approximately 17,000 community residents may be exposed to the toxic chemicals through the consumption of contaminated fish
3.3.2 Potential Human Receptors The Anacostia River flows through a heavily-populated section of the District and Maryland. Potential human health risks associated with the river include ingestion of fish, turtles, clams, and crayfish and direct contact with and incidental ingestion of sediment, surface water, and surface water-contaminated soil exposed along the river banks. Although warning signs are posted along the Anacostia River, subsistence fishing and human contact (related to various recreational activities) with media in and along the river is well documented.
Since the late 1980s, a fish consumption advisory has been in effect for the Anacostia to protect people from ingesting fish contaminated with PCBs and pesticides. This is evidence that elevated levels of toxics are present in the river environment and are entering the food chain (AWTA 2002).
In addition to subsistence anglers and recreational receptors, construction and utility workers may also be exposed. Specifically, workers engaged in construction and utility-related activities may be exposed to contaminated sediment, surface water, and soil. Workers engaged in environmental restoration and research may also be exposed to contamination in these media.
Remedial Investigation Work Plan Anacostia River Sediments Project
45
3.3.3 Potential Exposure Pathways The principal exposure pathway is recreational angling for mid-level and top-level predator fish such as largemouth bass and channel catfish. Some people may catch and eat freshwater turtles, especially the common snapping turtle (Shin 2000). Several species of native and introduced crayfish are likely to occur in the river (Kilian et al 2010) and may be harvested and consumed by people in the area. Although clams and other mollusks are known to inhabit the river, collection of these species for human consumption is not believed to be extensive.
Additional exposure pathways include direct contact with and incidental ingestion of contaminated sediment and surface water near the river’s banks, as well as to soil that has been contaminated due to river flooding. Much of the existing shoreline on the Anacostia River is a public access park or other land used primarily for recreational purposes. This exposure could be in conjunction with fishing activity, or independent recreational activity. Construction and utility workers may be exposed while engaged in construction and utility installation and repair activities that require exposure to sediment, surface water, and soil within the banks of the Anacostia River.

NO
TE:
FIG
UR
E 3
.1 W
AS
MO
DIF
IED
FR
OM
FIG
UR
E 2
OF
THE
UN
DAT
ED
AN
AC
OS
TIA
WAT
ER
SH
ED
TO
XIC
S A
LLIA
NC
E R
EP
OR
T E
NTI
TLE
D “C
HA
RTI
NG
A C
OU
RS
E T
OW
AR
D
RE
STO
RAT
ION
: A
TOX
IC C
HE
MIC
AL
MA
NA
GE
ME
NT
STR
ATE
GY
FOR
TH
E A
NA
CO
STI
A R
IVE
R.”
AN
ACO
STIA
RIV
ER S
EDIM
ENTS
PRO
JEC
T RE
MED
IAL
INVE
STIG
ATIO
N W
ORK
PLA
N
FIG
URE
3.1
. AN
ACO
STIA
RIV
ER S
EDIM
ENTS
PR
OJE
CT
CON
CEPT
UA
L SI
TE M
OD
EL
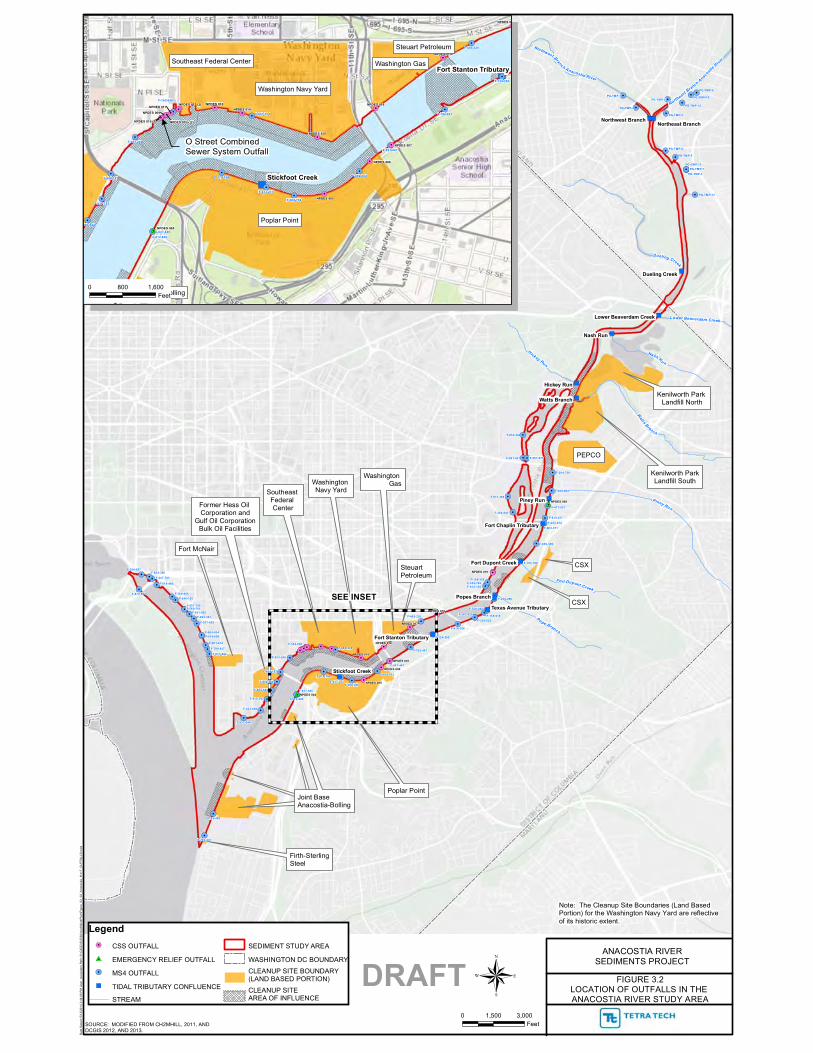
!.
!.
!.
!.
!.
!.
!.
!.
!.
!.
!.
!.
!.
!.
!.
!.!.
!.!.!.
!.
!.
!.
!.
!.
!.!.
!.
!.
!.
!.!.!.
!.
!.
!.
!.
!.!.
!.!.!.
!.
!.
!.!.
!.
!.!.
!.
!.
!.
!.
!.
!.!.
!.
!.!.
!.
!.
!.
!.!.
!.
!.
!.
!.
!.
!.!.!.
!.
%2
%2
%2%2%2%2%2
%2
%2%2%2
%2 %2%2%2%2
#0
%2%2%2
%2
#0
")")
")
")
")
")
")
")
")
")
")
")
")
")
")
PEPCO
Poplar Point
Kenilworth Park Landfill North
Washington Navy YardSoutheast
Federal Center
Kenilworth ParkLandfill South
Washington Gas
CSX
CSX
Former Hess Oil Corporation and
Gulf Oil CorporationBulk Oil Facilities
Steuart Petroleum
Firth-SterlingSteel
JBABJBABJBABJoint BaseAnacostia-Bolling
Fort McNair
F-743-331
F-348-769F-109-350
F-238-290
F-656-309
F-903-371
F-193-790
F-819-217
F-447-703
F-518-460
F-093-544
F-052-384
F-812-800
F-882-366F-290-057
F-892-361
F-936-752F-008-706
F-128-495
F-933-249
F-494-187
F-837-845
F-879-104
F-162-656F-683-324
F-597-447
F-802-012
F-417-217
F-405-220
F-124-260
F-336-622F-159-618
F-758-282
F-367-629
F-818-706
F-433-609
F-969-934
F-307-629
F-018-809
F-561-414
F-073-094
F-418-242
F-937-544
F-611-365
F-567-976F-991-021
F-294-739
F-284-041
F-090-064
F-477-827
F-025-074
F-241-055F-569-761F-551-780
F-768-655F-246-155
F-879-832
F-792-447
F-012-192
F-799-817
NPDES 008
NPDES 016
NPDES 019
NPDES 004
NPDES 015
NPDES 007
NPDES 006
NPDES 005
NPDES 017
NPDES 018
PG-TMP-9
PG-TMP-8
PG-TMP-7
PG-TMP-6
PG-TMP-5
PG-TMP-4
PG-TMP-3
PG-TMP-2
PG-TMP-1
PG-TMP-13
PG-TMP-12
PG-TMP-11
PG-TMP-10
Piney Run
Watts Branch
Nash Ru n
Dueling Creek
Pope Branch
H ickey Run
Northwest Branch Anacostia River
Fort Dupont Creek
Northeas
t Branch A
nacosti
a Rive
r
Lower Beaverdam Creek
Nash Run
Piney Run
Hickey Run
Popes Branch
Watts Branch
Dueling Creek
Stickfoot Creek
Northwest Branch
Fort Dupont Creek
Lower Beaverdam Creek
Fort Stanton Tributary
Texas Avenue Tributary
Fort Chaplin Tributary
Northeast Branch
Legend%2 CSS OUTFALL
#0 EMERGENCY RELIEF OUTFALL
!. MS4 OUTFALL
") TIDAL TRIBUTARY CONFLUENCE
STREAM
SEDIMENT STUDY AREA
WASHINGTON DC BOUNDARY
CLEANUP SITE BOUNDARY(LAND BASED PORTION)
CLEANUP SITEAREA OF INFLUENCE ®
0 1,500 3,000Feet
FIGURE 3.2LOCATION OF OUTFALLS IN THE ANACOSTIA RIVER STUDY AREA
Dat
e S
aved
: 5/1
3/20
14 3
:44:
08 P
M U
ser:
joel
.pet
ers
Path
: S:\C
AD
D\S
\259
2\m
xd\W
orkP
lan\
Figu
re_0
3_02
_Ana
cost
ia_1
1x17
_OU
TFAL
LS.m
xd
SOURCE: MODIFIED FROM CH2MHILL, 2011, ANDDCGIS 2012, AND 2013.
DRAFT
")
")
!.
!.
!.
!.
!.
!.
!.!.
!.
!.
!.
!.
!.!.
!.
!.
%2
%2
%2%2%2%2%2
%2
%2
%2%2
%2%2%2
%2%2
#0
%2NPDES 016
NPDES 004
NPDES 012 (2)NPDES 014
NPDES 013
NPDES 015
NPDES 007
NPDES 006
NPDES 005
NPDES 010 (2)
NPDES 009
NPDES 017
NPDES 0
NPDES 011
NPDES 011a (2)
093-544
F-812-800
F-936-752F-008-706
F-933-249
F-494-187
F-837-845
F-879-104
F-683-324
F-597-447
F-802-012
F-417-217
F-405-220
F-124-260
F-792-447
F-162-656
Stickfoot Creek
Fort Stanton Tributary
Poplar Point
Washington Navy Yard
Southeast Federal Center Washington Gas
Joint Base Anacostia-Bolling
Steuart Petroleum
SEE INSET
0 800 1,600Feet
Note: The Cleanup Site Boundaries (Land Based Portion) for the Washington Navy Yard are reflective of its historic extent.
O Street CombinedSewer System Outfall
ANACOSTIA RIVERSEDIMENTS PROJECT

TABL
E 3.
1Pr
iorit
y Po
lluta
nt L
ist
Tabl
e 3.
1 Pr
iorit
y Po
lluta
nt L
ist.x
lsx5/
15/2
014
Cons
titue
ntG
roup
Cons
titue
ntG
roup
Cons
titue
ntG
roup
Cons
titue
ntG
roup
Cons
titue
ntG
roup
1,1,
1-tr
ichl
oreo
than
eVO
C1,
2,4-
tric
hlor
oben
zene
SVO
CBi
s(2-
chlo
roet
hoxy
) met
hane
SVO
C4,
4-DD
DPe
stic
ide
Antim
ony
Met
al1,
1,2,
2-te
trac
hlor
oeth
ane
VOC
1,2-
dich
loro
benz
ene
SVO
CBi
s(2-
chlo
roet
hyl)
ethe
rSV
OC
4,4-
DDE
Pest
icid
eAr
seni
cM
etal
1,1,
2-tr
ichl
oroe
than
eVO
C1,
2-di
phen
ylhy
draz
ine
SVO
CBi
s(2-
chlo
roiso
prop
yl) e
ther
SVO
C4,
4-DD
TPe
stic
ide
Asbe
stos
Met
al1,
1-di
chlo
roet
hane
VOC
1,3-
dich
loro
benz
ene
SVO
CBi
s(2-
ethy
lhex
yl) p
htha
late
SVO
CAl
drin
Pest
icid
eBe
rylli
umM
etal
1,1-
dich
loro
ethy
lene
VOC
1,4-
dich
loro
benz
ene
SVO
CBu
tyl b
enzy
l pht
hala
teSV
OC
Alph
a-BH
CPe
stic
ide
Cadm
ium
Met
al1,
2-di
chlo
roet
hane
VOC
2,4,
6-tr
ichl
orop
heno
lSV
OC
Chry
sene
SVO
CAl
pha-
endo
sulfa
nPe
stic
ide
Chro
miu
mM
etal
1,2-
dich
loro
prop
ane
VOC
2,4-
dich
loro
phen
olSV
OC
Dibe
nzo(
,h) a
nthr
acen
eSV
OC
Beta
-BHC
Pest
icid
eCo
pper
Met
al1,
2-di
chlo
ropr
opyl
ene
VOC
2,4-
dim
ethy
lphe
nol
SVO
CDi
ethy
l Pht
hala
teSV
OC
Beta
-end
osul
fan
Pest
icid
eLe
adM
etal
1,2-
tran
s-di
chlo
roet
hyle
neVO
C2,
4-di
nitr
ophe
nol
SVO
CDi
met
hyl p
htha
late
SVO
CCh
lord
ane
Pest
icid
eM
ercu
ryM
etal
2-ch
loro
ethy
l vin
yl e
ther
sVO
C2,
4-di
nitr
otol
uene
SVO
CDi
-N-B
utyl
Pht
hala
teSV
OC
Delta
-BHC
Pest
icid
eN
icke
lM
etal
Acro
lein
VOC
2,6-
dini
trot
olue
neSV
OC
Di-n
-oct
yl p
htha
late
SVO
CDi
eldr
inPe
stic
ide
Sele
nium
Met
alAc
rylo
nitr
ileVO
C2-
chlo
rona
phth
alen
eSV
OC
Fluo
rant
hene
SVO
CEn
dosu
lfan
sulfa
tePe
stic
ide
Silv
erM
etal
Benz
ene
VOC
2-ch
loro
phen
olSV
OC
Fluo
rene
SVO
CEn
drin
Pest
icid
eTh
alliu
mM
etal
Brom
ofor
mVO
C2-
nitr
ophe
nol
SVO
CHe
xach
loro
benz
ene
SVO
CEn
drin
ald
ehyd
ePe
stic
ide
Zinc
Met
alCa
rbon
tetr
achl
orid
eVO
C3,
3-di
chlo
robe
nzid
ine
SVO
CHe
xach
loro
buta
dien
eSV
OC
Gam
ma-
BHC
Pest
icid
e2,
3,7,
8-TC
DD 1
Diox
in
Chlo
robe
nzen
eVO
C4,
6-di
nitr
o-o-
cres
olSV
OC
Hexa
chlo
rocy
clop
enta
dien
eSV
OC
Hept
achl
orPe
stic
ide
Cyan
ide,
Tot
alCy
ano
Chlo
rodi
brom
omet
hane
VOC
4-br
omop
heny
l phe
nyl e
ther
SVO
CHe
xach
loro
etha
neSV
OC
Hept
achl
or e
poxi
dePe
stic
ide
Chlo
roet
hane
VOC
4-ch
loro
phen
yl p
heny
l eth
erSV
OC
Inde
no (1
,2,3
-cd)
pyr
ene
SVO
CTo
xaph
ene
Pest
icid
eCh
loro
form
VOC
4-ni
trop
heno
lSV
OC
Isop
horo
neSV
OC
PCB–
1016
(Aro
chlo
r 101
6)PC
BDi
chlo
robr
omom
etha
neVO
CAc
enap
hthe
neSV
OC
Nap
htha
lene
SVO
CPC
B–12
21 (A
roch
lor 1
221)
PCB
Ethy
lben
zene
VOC
Acen
apht
hyle
neSV
OC
Nitr
oben
zene
SVO
CPC
B–12
32 (A
roch
lor 1
232)
PCB
Met
hyl b
rom
ide
VOC
Anth
race
neSV
OC
N-n
itros
odim
ethy
lam
ine
SVO
CPC
B–12
42 (A
roch
lor 1
242)
PCB
Met
hyl c
hlor
ide
VOC
Benz
idin
eSV
OC
N-n
itros
odi-n
-pro
pyla
min
eSV
OC
PCB–
1248
(Aro
chlo
r 124
8)PC
BM
ethy
lene
chl
orid
eVO
Cbe
nzo(
a) a
nthr
acen
eSV
OC
N-n
itros
odip
heny
lam
ine
SVO
CPC
B–12
54 (A
roch
lor 1
254)
PCB
Tetr
achl
oroe
thyl
ene
VOC
Benz
o(a)
pyre
neSV
OC
Para
chlo
rom
eta
cres
olSV
OC
PCB–
1260
(Aro
chlo
r 126
0)PC
BTo
luen
eVO
CBe
nzo(
b) fl
uora
nthe
neSV
OC
Pent
achl
orop
heno
lSV
OC
Tric
hlor
oeth
ylen
eVO
CBe
nzo(
ghi)
pery
lene
SVO
CPh
enan
thre
neSV
OC
Viny
l chl
orid
eVO
CBe
nzo(
k) fl
uora
nthe
neSV
OC
Phen
olSV
OC
Pyre
neSV
OC
Not
es:
1. 2
,3,7
,8-T
CDD
refe
rs to
2,3
,7,8
-Tet
rach
loro
dibe
nzo-
p-di
oxin

TABL
E 3.
2Su
mm
ary
of R
epor
ted
Cons
titue
nts A
ssoc
iate
d w
ith th
e En
viro
nmen
tal C
lean
up S
ites,
Pag
e 1
of 3
Tabl
e 3.
2 Su
mm
ary
of C
lean
up S
ite R
epor
ted
Cons
titue
nts.
xlsx
5/16
/201
4
Surf
ace
Soil
Subs
urfa
ce S
oil
Gro
undw
ater
Sedi
men
tsSu
rfac
e W
ater
CSX
Benn
ing
Yard
1
(Ref
eren
ce: G
eosy
ntec
201
3a,
Geos
ynte
c 20
13b;
Env
iroSc
ienc
e 20
13)
Prio
rity
pollu
tant
met
als,
PA
H5 , PCB
Aro
clor
s,
pest
icid
es, V
OCs
, Tot
al
petr
oleu
m h
ydro
carb
ons
dies
el-r
ange
org
anic
s (TP
H-DR
O),
Tota
l pet
role
um
hydr
ocar
bons
gas
olin
e-ra
nge
orga
nics
(GRO
-DRO
)
Prio
rity
pollu
tant
m
etal
s, P
AH, P
CB
Aroc
lors
, pes
ticid
es,
VOCs
, Tot
al p
etro
leum
hy
droc
arbo
ns d
iese
l-ra
nge
orga
nics
(TPH
-DR
O),
Tota
l pet
role
um
hydr
ocar
bons
gas
olin
e-ra
nge
orga
nics
(GRO
-DR
O)
As, B
a, C
d, C
r, Fe
, Pb
, Hg,
Se,
Ag,
Prio
rity
pollu
tant
PA
H, 4
,4'-D
DD, 4
.4'-
DDE,
4,4
'-DDT
, alp
ha
chlo
rdan
e, g
amm
a-BH
C, B
enze
ne,
Ethy
lben
zene
, To
luen
e, X
ylen
es
(tot
al),
and
sele
cted
VO
Cs, s
elec
ted
SVO
Cs
Prio
rity
pollu
tant
met
als,
PA
H, P
CB A
rocl
ors,
pes
ticid
es,
VOCs
, Tot
al p
etro
leum
hy
droc
arbo
ns d
iese
l-ran
ge
orga
nics
(TPH
-DRO
), To
tal
petr
oleu
m h
ydro
carb
ons
gaso
line-
rang
e or
gani
cs (G
RO-
DRO
)
Prio
rity
pollu
tant
met
als,
PA
H, P
CB A
rocl
ors,
pe
stic
ides
, VO
Cs, T
otal
pe
trol
eum
hyd
roca
rbon
s di
esel
-ran
ge o
rgan
ics (
TPH-
DRO
), To
tal p
etro
leum
hy
droc
arbo
ns g
asol
ine-
rang
e or
gani
cs (G
RO-D
RO)
Keni
lwor
th P
ark
Nor
th &
Sou
th
Land
fills
(Ref
eren
ce:
Ecol
ogy
and
Envi
ronm
ent,
2007
a)
Al, S
b, A
s, C
d, C
u, F
e, P
b, H
g,
Ag, T
l, V
Aroc
lor 1
254
Aroc
lor 1
260
Diel
drin
gam
ma-
Chl
orda
nePA
H
Al, S
b, A
s, C
d, C
u, F
e,
Pb, M
n, H
g, A
g, T
l, V
Aroc
lor 1
242
Aroc
lor 1
248
Diel
drin
PAH
Al, A
s, B
a, C
d, C
r, Fe
, Pb
, Sb
Benz
ene
Chlo
rofo
rm1,
4-di
chlo
robe
nzen
eM
ethy
lene
chl
orid
e
Al, A
s, F
e, T
l, V
Aroc
lor 1
254
PAH
Surf
ace
wat
er im
pact
s to
be fu
rthe
r eva
luat
ed in
co
njun
ctio
n w
ith th
e sh
allo
w g
roun
dwat
er
(OU
2) re
med
ial
inve
stig
atio
n
Pepc
o Be
nnin
g Ro
ad F
acili
ty 2
(Ref
eren
ce: A
ECO
M, 2
012)
VOCs
, TPH
, PAH
, Met
als (
Pb,
Cu, N
i, V,
Zn)
, PCB
s,
Pest
icid
es, D
ioxi
ns/F
uran
s
VOCs
, TPH
, PAH
, Sem
i-vo
latil
e or
gani
c co
mpo
unds
(SVO
Cs),
Met
als,
PCB
s,
Pest
icid
es,
Diox
ins/
Fura
ns
VOCs
, TPH
, PAH
, SV
OCs
, Met
als,
PC
Bs, P
estic
ides
, Di
oxin
s/Fu
rans
VOCs
, TPH
, PAH
, Met
als,
PC
Bs, P
estic
ides
, Di
oxin
s/Fu
rans
VOCs
, TPH
, PAH
, Met
als,
PC
Bs, P
estic
ides
Site
Site
Con
stitu
ents
Rep
orte
d

TABL
E 3.
2Su
mm
ary
of R
epor
ted
Cons
titue
nts A
ssoc
iate
d w
ith th
e En
viro
nmen
tal C
lean
up S
ites,
Pag
e 2
of 3
Tabl
e 3.
2 Su
mm
ary
of C
lean
up S
ite R
epor
ted
Cons
titue
nts.
xlsx
5/16
/201
4
Surf
ace
Soil
Subs
urfa
ce S
oil
Gro
undw
ater
Sedi
men
tsSu
rfac
e W
ater
Site
Site
Con
stitu
ents
Rep
orte
d
Popl
ar P
oint
Site
(Ref
eren
ce: R
idol
fi, 2
003)
As Benz
o(a)
pyre
ne4,
4'-D
DTTP
H-DR
O
As, P
bPA
H4,
4'-D
DETP
H-DR
OPy
rene
Tota
l PCB
s
As, M
n, P
bBe
nzen
eM
ethy
l ter
tiary
-bu
tyl e
ther
TPH-
DRO
, TPH
-Ga
solin
e ra
nge
orga
nics
(GRO
), TP
H-M
otor
Ran
ge
Org
anic
s (M
RO)
Viny
l chl
orid
e
As, C
d, N
i, Pb
PAH
4,4'
-DDD
4,4'
-DDE
4,4'
-DDT
Diel
drin
Tota
l PCB
s
Cu, M
n. Z
nBe
nzen
e
Was
hing
ton
Gas E
ast S
tatio
n 3
(Ref
eren
ce: E
colo
gy a
nd E
nviro
nmen
t, 20
06)
Tota
l PAH
, Al,
Ar, S
b, B
e, C
d,
Cr, C
u, C
o, F
e, P
b, M
n, H
g, N
i, Se
, Ag,
Th,
V, Z
nVO
C, S
VOC,
PAH
, Com
plex
cy
anid
es
Al, A
r, Sb
, Be,
Cd,
Cr,
Cu,
Co, F
e, P
b, M
n, H
g, N
i, Se
, Ag,
Th,
V, Z
n,VO
C, S
VOC,
PAH
, Co
mpl
ex c
yani
des
Al, A
r, Sb
, Be,
Cd,
Cr,
Cu, C
o, F
e, P
b, M
n,
Hg, N
i, Se
, Ag,
Th,
V,
Zn,
VOC,
SVO
C, P
AH,
Com
plex
cya
nide
s
Al, A
r, Sb
, Be,
Cd,
Cr,
Cu, C
o,
Fe, P
b, M
n, H
g, N
i, Se
, Ag,
Th,
V,
Zn,
VOC,
SVO
C, P
AH, C
ompl
ex
cyan
ides
Not
sam
pled
Was
hing
ton
Nav
y Ya
rd 4
(Ref
eren
ce: C
H2M
HILL
, 201
1)
VOCs
, SVO
Cs, P
AH, M
etal
s,
PCBs
, Pes
ticid
es,
Diox
ins/
Fura
ns, E
xplo
sives
VOCs
, SVO
Cs, P
AH,
Met
als,
PCB
s,
Pest
icid
es,
Diox
ins/
Fura
ns,
Expl
osiv
es
As, F
e, H
g,
Cis a
nd tr
ans-
dich
loro
ethe
ne,
Tric
hlor
oeth
ene,
Viny
l Chl
orid
e
As, C
r, Pb
Aroc
lor-
1260
PAH,
N
on-d
ioxi
n lik
e PC
Bs
Ag, B
a, F
e, M
n
Sout
heas
t Fed
eral
Cen
ter
Not
Sam
pled
Not
Sam
pled
Not
Sam
pled
VOCs
, SVO
Cs, P
AH, M
etal
s,
PCDD
s, P
CDFs
, PCB
Co
ngen
ers
Activ
e Ca
ppin
g Pi
lot S
tudy
Site
Not
sam
pled
Not
sam
pled
Not
sam
pled
TPH,
PAH
, Met
als,
Pes
ticid
es,
PCB
Cong
ener
sN
ot sa
mpl
ed

TABL
E 3.
2Su
mm
ary
of R
epor
ted
Cons
titue
nts A
ssoc
iate
d w
ith th
e En
viro
nmen
tal C
lean
up S
ites,
Pag
e 3
of 3
Tabl
e 3.
2 Su
mm
ary
of C
lean
up S
ite R
epor
ted
Cons
titue
nts.
xlsx
5/16
/201
4
Surf
ace
Soil
Subs
urfa
ce S
oil
Gro
undw
ater
Sedi
men
tsSu
rfac
e W
ater
Site
Site
Con
stitu
ents
Rep
orte
d
Join
t Bas
e An
acos
tia B
ollin
g (R
efer
ence
: CH2
M H
ill 2
011a
, CH2
M
Hill
2011
b, C
H2M
Hill
201
2, N
AVFA
C 20
12)
TPH,
VO
Cs, S
VOCs
, 4,4
-DDE
, 4,
4-DD
T, a
nd
alph
a-ch
lord
ane,
Dio
xins
, Ar
oclo
r 125
4, D
ield
rin,
Met
als
TPH,
VO
Cs, S
VOCs
, 4,
4-DD
E, 4
,4-D
DT,
alph
a-ch
lord
ane,
ga
mm
a-ch
lord
ane,
he
ptac
hlor
, 1,
2,3,
4,6,
7,8-
Hept
achl
orod
iben
zo-p
-di
oxin
, O
ctac
hlor
odib
enzo
-p-
diox
in, 1
,2,3
,4,6
,7,8
-he
ptac
hlor
odib
enzo
fura
n, A
rocl
or 1
254,
di
eldr
in, M
etal
s
VOCs
, SVO
Cs, 4
,4’-
DDD,
hep
tach
lor
epox
ide,
O
ctac
hlor
odib
enzo
-p-
diox
in,
Hept
achl
orod
iben
zo-
p-di
oxin
, Met
als
Not
sam
pled
Not
sam
pled
Steu
art P
etro
leum
Com
pany
(Adj
acen
t to
WGL
Site
)
TPH,
Ben
zene
, Tol
uene
, Et
hylb
enze
ne, X
ylen
es
(tot
al),
MTB
E, N
apht
hale
ne
TPH,
Ben
zene
, Tol
uene
, Et
hylb
enze
ne, X
ylen
es
(tot
al),
MTB
E,
Nap
htha
lene
TPH,
Ben
zene
, To
luen
e,
Ethy
lben
zene
, Xy
lene
s (to
tal),
M
TBE,
Nap
htha
lene
Not
sam
pled
Not
sam
pled
Steu
art P
etro
leum
Com
pany
/ Hes
s Oil
Corp
orat
ion/
Gul
f Oil
Corp
orat
ion
(Adj
acen
t to
Sout
h Ca
pita
l Str
eet
Brid
ge)
TPH,
Ben
zene
, Tol
uene
, Et
hylb
enze
ne, X
ylen
es
(tot
al),
MTB
E, P
AH
TPH,
Ben
zene
, Tol
uene
, Et
hylb
enze
ne, X
ylen
es
(tot
al),
MTB
E, P
AH
TPH,
Ben
zene
, To
luen
e,
Ethy
lben
zene
, Xy
lene
s (to
tal),
M
TBE,
PAH
Not
sam
pled
Not
sam
pled
Not
es:
P
riorit
y Po
lluta
nt P
AHs
5. P
AH:
Avai
labl
e do
cum
enta
tion
sugg
ests
that
one
or m
ore
PAHs
wer
e ev
alua
ted
thro
ugh
sam
plin
g. P
AH g
ener
ical
ly re
fers
to th
e fu
ll ra
nge
of
4. C
OCs
for s
urfa
ce so
il, su
bsur
face
soil,
and
gro
undw
ater
are
bas
ed o
n su
mm
ary
of c
onta
min
atio
n di
scus
sion
give
n in
the
refe
renc
ed d
ocum
ent.
1. L
isted
con
stitu
ents
are
thos
e te
sted
for a
s ind
icat
ed in
the
refe
renc
ed d
ocum
ents
.2.
Info
rmat
ion
obta
ined
from
the
July
201
2 Re
med
ial I
nves
tigat
ion
and
Feas
ibili
ty S
tudy
(RI/
FS) W
ork
Plan
.3.
CO
Cs fo
r eac
h m
edia
are
bas
ed u
pon
chem
ical
s ide
ntifi
ed in
Tab
les 4
and
5 o
f the
Aug
ust 2
006
Reco
rd o
f Dec
ision
.

TABL
E 3.
3Su
mm
ary
of C
ombi
ned
Sew
er a
nd S
anita
ry S
ewer
Out
falls
Loc
ated
in th
e An
acos
tia R
iver
Stu
dy A
rea
Tabl
e 3.
3_Re
vise
d O
utfa
ll Su
mm
ary.
xlsx
5/15
/201
4
Nam
eRe
ach
X-Co
ordi
nate
1Y-
Coor
dina
te1
Type
Drai
nage
Area
(Acr
es)
Loca
tion
Des
crip
tion
NPD
ES 0
04S.
Cap
ital S
t. - M
outh
1332
05.0
5439
9602
.366
Sani
tary
0Ho
war
d Rd
and
Rob
bins
Rd.
S.E
.N
PDES
005
11th
St.
- S. C
apita
l St.
1334
13.4
2840
0586
.399
Com
bine
d65
.51
Acro
ss fr
om N
avy
Yard
, alig
ned
with
Par
sons
Ave
, S.E
.
NPD
ES 0
0611
th S
t. - S
. Cap
ital S
t.13
3599
.515
4008
46.7
48Co
mbi
ned
13.5
6Go
od H
ope
Rd a
nd W
elsh
Mem
oria
l Brid
ge, S
.E.
NPD
ES 0
1511
th S
t. - S
. Cap
ital S
t.13
3737
.646
4005
46.6
66Co
mbi
ned
30.8
2O
n N
avy
Yard
pro
pert
y, a
ligne
d w
ith 9
th a
nd M
Sts
, S.E
.
NPD
ES 0
1011
th S
t. - S
. Cap
ital S
t.13
3849
.849
3996
46.5
35Co
mbi
ned
0M
ain
St./
O S
t. P.
S., S
.E.
NPD
ES 0
0911
th S
t. - S
. Cap
ital S
t.13
3859
.62
3996
65.4
95Co
mbi
ned
41.2
7M
ain
St./
O S
t. P.
S., S
.E.
NPD
ES 0
1111
th S
t. - S
. Cap
ital S
t.13
3876
.525
3997
02.3
48Co
mbi
ned
0M
ain
St./
O S
t. P.
S., S
.E.
NPD
ES 0
1411
th S
t. - S
. Cap
ital S
t.13
3876
.629
4001
13.3
44Co
mbi
ned
128.
06O
n N
avy
Yard
pro
pert
y, a
ligne
d w
ith 6
th a
nd M
Sts
, S.E
.
NPD
ES 0
1211
th S
t. - S
. Cap
ital S
t.13
3897
.86
3997
47.8
66Co
mbi
ned
1153
.83
Mai
n St
./O
St.
P.S.
, S.E
.N
PDES
013
11th
St.
- S. C
apita
l St.
1339
07.0
8739
9955
.436
Com
bine
d20
.1In
S.E
. Fed
eral
Cen
ter,
alig
ned
with
4th
Str
eet S
.E.
NPD
ES 0
07Pe
nn. A
ve. -
11t
h St
.13
3694
.349
4009
72.2
78Co
mbi
ned
188.
13Be
twee
n 11
th S
t. an
d An
acos
tia B
ridge
s, S
.E.
NPD
ES 0
16Pe
nn. A
ve. -
11t
h St
.13
3904
.223
4008
82.6
03Co
mbi
ned
152.
5812
th a
nd O
Str
eets
S.E
.N
PDES
017
Penn
. Ave
. - 1
1th
St.
1341
92.2
0640
1269
.196
Com
bine
d25
9.91
M a
nd W
ater
Sts
, S.E
.N
PDES
018
Penn
. Ave
. - 1
1th
St.
1343
76.5
740
1669
.63
Com
bine
d48
.93
Barn
ey C
ircle
and
PA
Ave.
, S.E
.N
PDES
019
E. C
apito
l St.
- CSX
1349
97.9
3440
2490
.267
Com
bine
d42
42.3
9Ad
jace
nt to
Ser
vice
Driv
e be
hind
Sw
irl fa
cilit
y an
d D.
C.
Gen
eral
NPD
ES 0
08Be
nnin
g Rd
. - E
. Cap
ital S
t.13
6008
.902
4033
10.1
48Sa
nita
ry0
Anac
ostia
and
Bla
ine,
N.E
.
1. C
oord
inat
es in
Nor
th A
mer
ican
Dat
um o
f 198
3, M
aryl
and
Stat
e Pl
ane,
feet

TABLE 3.4Summary of Storm Sewer Outfalls Located in the Anacostia River Study Area, Page 1 of 2
Table 3.4_Revised MS4 Outfalls.xlsx 5/15/2014
Name Reach X-Coordinate1 Y-Coordinate1 TributaryF-073-094 133796.18 398309.658F-799-817 133867.853 398280.685F-561-414 133926.963 398255.513F-018-809 134065.278 398198.211F-969-934 134077.656 398193.076F-307-629 134245.649 398123.103F-892-361 134317.906 398080.032F-241-055 134385.913 398013.434F-569-761 134454.928 397944.758F-551-780 134456.855 397942.835F-246-155 134591.425 397809.423F-768-655 134640.411 397760.547F-879-832 134747.344 397269.151F-518-460 134815.94 397531.58F-882-366 134905.039 397466.046F-447-703 134937.83 397421.78F-290-057 134970.651 397305.349F-743-331 131117.653 398235.236F-128-495 131436.97 398366.81F-937-544 132852.043 398816.767F-433-609 132963.956 399064.03F-418-242 133129.35 399158.92F-812-800 133194.83 399597.02F-837-845 133199.349 399599.383F-093-544 133261.07 399223.55F-936-752 133383.68 399305.13F-494-187 133528.302 399357.799F-008-706 133403.27 400412.22F-417-217 133450.869 400252.029 Stickfoot CreekF-879-104 133533.987 399996.365F-802-012 133542.22 400788.63F-933-249 133737.66 399497.153F-683-324 133859.944 400169.665F-162-656 133883.144 399716.967F-597-447 133689.571 400964.898F-792-447 133896.58 401279.96F-124-260 134085.078 401609.111F-818-706 134237.788 401975.282F-405-220 134277.25 401433F-336-622 134334.815 402224.97F-367-629 134335.66 402228.069F-758-282 134403.983 402365.714F-159-618 134438.39 402405.07 Texas Avenue TributaryF-238-290 134607.906 402509.276 Fort Davis Creek
Washington Channel
S. Capital St. - Mouth
11th St. - S. Capital St.
11th ST. CSX Bridge

TABLE 3.4Summary of Storm Sewer Outfalls Located in the Anacostia River Study Area, Page 2 of 2
Table 3.4_Revised MS4 Outfalls.xlsx 5/15/2014
Name Reach X-Coordinate1 Y-Coordinate1 TributaryF-012-192 134795.42 402382.51F-109-350 134811.38 402391.89F-348-769 134853.81 402414.87F-193-790 135166.51 402892.63 Fort Dupont CreekF-656-309 135423.69 403133.29F-819-217 135717.01 403243.18 Fort Chaplin TributaryF-903-371 135732.523 403251.299 Fort Chaplin TributaryF-025-074 135803.068 403261.969F-477-827 135979.318 403303.321F-090-064 136204.359 403359.691F-294-739 136472.252 403374.215PG-TMP-1 1326820.022 465993.0663PG-TMP-2 1328895.366 465129.5874PG-TMP-3 1329879.272 462401.0984PG-TMP-4 1327439.272 465411.5353PG-TMP-5 1329345.272 463017.7232PG-TMP-6 1330376.272 466138.9725PG-TMP-7 1329876.522 462414.6296PG-TMP-8 1328981.522 465816.3163PG-TMP-9 1328882.147 463321.2856
PG-TMP-10 1330109.459 466036.41PG-TMP-11 1329873.772 462427.7857PG-TMP-12 1329680.522 465645.0663PG-TMP-13 1330302.313 461189.1609F-567-976 136687.73 402996.71F-991-021 136690.93 402938.98F-052-384 137027.24 402937.78F-284-041 135889.347 402785.807F-611-365 136120.31 402713.5
1. Coordinates in North American Datum of 1983, Maryland State Plane, feet
Upper Tidal Limit - Benning Rd.
Prince George's County Storm Water Outfalls
Kingman Lake
E. Capital St. - CSX
Benning Rd. - E. Capital St.

TABL
E 3.
5Su
mm
ary
of A
naco
stia
Riv
er S
tudy
Are
a Ti
dal T
ribut
ary
Conf
luen
ces,
Pag
e 1
of 2
Tabl
e 3.
5 Su
mm
ary
of T
idal
Trib
utar
y Co
nflu
ence
s _re
vise
d.xl
sx5/
15/2
014
Trib
utar
y N
ame
X-Co
ordi
nate
Y-Co
ordi
nate
Appr
oxim
ate
Drai
nage
Are
a (u
nits
as s
how
n)W
ater
shed
Lan
d U
se C
hara
cter
istic
s
Nor
thw
est B
ranc
h1, 4
, 713
2810
9.41
346
4895
.715
353
sq. m
i.
Nor
thea
st B
ranc
h1, 4
, 713
2828
8.79
246
4889
.411
76 sq
. mi.
Low
er B
eave
rdam
Cre
ek1,
4, 8
1328
551.
2245
5359
.928
615
.7 sq
. mi.
Appr
oxim
atel
y 58
% re
sdie
ntia
l or c
omm
erci
al a
reas
, 32
% fo
rest
ed o
r par
k ar
eas,
5%
agr
icul
tura
l, an
d 4%
in
dust
rial
Wat
ts B
ranc
h1, 4
, 813
2456
9.76
745
1351
.552
23.
8 sq
. mi.
Appr
oxim
atel
y 80
% u
rban
resid
entia
l and
com
mer
cial
ar
eas,
15%
fore
sted
, and
5%
ligh
t ind
ustr
ial p
rope
rty.
Ap
prox
imat
ely
47%
of t
he w
ater
shed
is in
DC
with
the
rem
aind
er in
Mar
ylan
d.
Hick
ey R
un1,
4, 8
1324
569.
423
4520
79.9
505
1.8
sq. m
i.
Appr
oxim
atel
y 20
% fo
rest
or U
.S. D
epar
tmen
t of t
he
Inte
rior p
arkl
and;
rem
aind
er o
f the
wat
ersh
ed in
clud
es
resid
entia
l, co
mm
erci
al, a
nd in
dust
rial a
reas
, inc
ludi
ng
railr
oad
ease
men
ts a
nd a
larg
e bu
s par
king
and
m
aint
enan
ce y
ard
Nas
h Ru
n1, 5
, 813
2627
9.20
345
4467
.412
146
0 ac
res
Appr
oxim
atel
y 95
% u
rban
resid
entia
l and
com
mer
cial
ar
eas d
rain
ed b
y st
orm
dra
ins;
App
roxi
mat
ely
two-
third
s of t
he w
ater
shed
is lo
cate
d in
DC,
rem
aind
er is
in
Dean
woo
d Pa
rk, P
rince
Geo
rge'
s Cou
nty
Fort
Dup
ont C
reek
1, 5
, 813
2185
5.03
344
3454
.591
637
6 ac
res
Prim
ary
head
wat
er re
ceiv
es u
rban
runo
ff fr
om
resid
entia
l are
as; m
ajor
ity o
f the
stre
am is
buf
fere
d on
bo
th si
des b
y fo
rest
ed p
arkl
and
Fort
Cha
plin
Trib
utar
y1, 5
, 813
2293
7.69
144
5264
.346
427
0 ac
res
90%
Res
iden
tial /
10%
Par
klan
d; G
ener
ally
buf
fere
d by
20
0 fe
et o
f for
est o
n ea
ch si
de
Pope
s Bra
nch1,
5, 8
1320
615.
031
4418
12.3
636
249
acre
sAp
prox
imat
ely
85%
resid
entia
l and
ligh
t com
mer
cial
ar
eas a
nd 1
5% fo
rest
ed p
arkl
and;
Fed
by
head
wat
ers
from
man
y st
orm
sew
er li
nes
Nor
thea
st a
nd N
orth
wes
t Bra
nche
s com
prise
ap
prox
imat
ely
72%
of t
he to
tal d
rain
age
area
for t
he
wat
ersh
ed

TABL
E 3.
5Su
mm
ary
of A
naco
stia
Riv
er S
tudy
Are
a Ti
dal T
ribut
ary
Conf
luen
ces,
Pag
e 2
of 2
Tabl
e 3.
5 Su
mm
ary
of T
idal
Trib
utar
y Co
nflu
ence
s _re
vise
d.xl
sx5/
15/2
014
Trib
utar
y N
ame
X-Co
ordi
nate
Y-Co
ordi
nate
Appr
oxim
ate
Drai
nage
Are
a (u
nits
as s
how
n)W
ater
shed
Lan
d U
se C
hara
cter
istic
s
Fort
Sta
nton
Trib
utar
y3, 5
, 813
1717
3.09
644
0058
.977
218
0 ac
res
Appr
oxim
atel
y 50
% N
atio
nal P
ark
Serv
ice
park
land
and
50
% re
siden
tial a
nd c
omm
eric
al a
reas
Texa
s Ave
nue
Trib
utar
y1, 5
, 813
2024
5.17
344
1103
.884
411
0 ac
res
Appr
oxim
atel
y 60
% re
siden
tial a
nd li
ght c
omm
erci
al
area
s and
40%
fore
sted
par
klan
d; F
ed b
y a
netw
ork
of
stor
m w
ater
pip
es
Fort
Dav
is Tr
ibut
ary1,
5, 8
1320
564.
407
4416
61.9
341
70 a
cres
Appr
oxim
atel
y 50
% fo
rest
ed N
atio
nal P
arkl
and
and
50%
urb
an re
siden
tial
Stic
kfoo
t Cre
ek2,
6, 8
1329
646.
795
4574
91.6
026
367
acre
s30
to 7
0% im
perv
ious
Duel
ing
Cree
k213
1308
1.07
243
7874
.379
8no
dat
ano
dat
aN
otes
:1.
Coo
rdin
ates
(Wor
d Ge
ogra
phic
Sys
tem
198
4 de
cim
al d
egre
es) o
btai
ned
by u
tilizi
ng th
e Di
stric
t of C
olum
bia
Onl
ine
Map
s List
ing
web
site
(July
201
3):
h
ttp:
//oc
to.d
c.go
v/DC
/OCT
O/M
aps+
and+
Apps
/Onl
ine+
Map
ping
/All+
Onl
ine+
Map
s2.
Coo
rdin
ates
(Wor
ld G
eogr
aphi
c Sy
stem
198
4 de
cim
al d
egre
es) e
stim
ated
from
aer
ial p
hoto
grap
hy3.
Coo
rdin
ates
(Wor
ld G
eogr
aphi
c Sy
stem
198
4 de
cim
al d
egre
es) o
btai
ned
from
US
EPA
web
site
h
ttp:
//ia
spub
.epa
.gov
/tm
dl_w
ater
s10/
atta
ins_
wat
erbo
dy.c
ontr
ol?p
_list
_id=
DCTF
S01R
_00&
p_cy
cle=
2010
&p_
repo
rt_t
ype=
4. D
rain
age
area
obt
aine
d fr
om h
ttp:
//w
ww
.ana
cost
ia.n
et/s
ubw
ater
shed
.htm
l#5.
Dra
inag
e ar
ea o
btai
ned
from
DDO
E (2
012)
6. D
rain
age
area
obt
aine
d fr
om E
A En
gine
erin
g, S
cien
ce, a
nd T
echn
olog
y, In
c. (2
006)
7. W
ater
shed
land
use
cha
ract
erist
ics o
btai
ned
from
Kim
et a
l. (2
007)
8. W
ater
shed
land
use
cha
ract
erist
ics o
btai
ned
from
D.C
. Dep
t. of
Hea
lth, E
nviro
nmen
tal H
ealth
Adm
in.,
Bure
au o
f Env
ironm
enta
l Wat
er Q
ualit
y Di
visio
n (2
003)

Remedial Investigation Work Plan Anacostia River Sediments Project
46
4.0 WORK PLAN RATIONALE
This section defines and provides justification for the DQO that will govern the collection and use of data in the RI and NRDA, describes the existing information on the nature and extent of contamination in each of the environmental media of concern, and identifies data gaps for each medium and pathway. The sampling approaches for sediments, benthic invertebrates, fish, and turtles are broadly described; some aspects of sampling will be determined based on conditions encountered at each sample location. Preliminarily defined sediment management areas are also discussed in this section.
4.1 Data Quality Objectives DQOs are qualitative and quantitative statements that clarify investigation objectives, define the appropriate types of data to collect, determine the appropriate conditions from which to collect the data, and specify acceptable decision errors associated with each sampling approach. The DQOs for the RI and NRDA are defined in Section 4.1.1. The supporting DQO development process is discussed in Section 4.1.2.
The data collected will support the objectives of this WP which are to determine the nature and extent of contaminated environmental media and assess the associated risk to human health and the environment, conduct sampling that can used for an NRDA, and characterize general site conditions sufficient for the performance of the FS. Previous sampling completed in the Anacostia River included areas near environmental sites where known releases have occurred as well as broader studies encompassing the entire tidal river (Velinsky and Ashley 2001; McGee et al. 2000). Additional surface and subsurface sediment sampling is necessary to confirm current concentrations of constituents in sediment (which may or may not validate prior results); identify potential sources of COCs in sediment; and evaluate the potential for risk to human health and the environment. Additional data are also required to support the NRDA process and provide information needed to assess remedial options in a FS, including development of preliminary remedial goals (PRG).
4.1.1 Data Quality Objective Statement The following DQOs were developed for this investigation:
� Characterize environmental conditions within the study area and refine the CSM; � Update existing datasets from previous investigations in the study area so that current nature
and extent of impacts can be defined; � Identify potential site-wide or site-specific sources of COCs in sediment and surface water; � Improve characterization of the sediments at the storm drain system and tributary network
outfalls and the Anacostia River; � Generate a dataset sufficient for updating and revising the existing watershed model; � Assess the human health and ecological risks associated with elevated levels of contaminants in
surface sediment, subsurface sediment, surface water, sediment pore water, benthic invertebrate tissue, fish tissue, and turtle tissue;
� Characterize site environmental media sufficient to support a NRDA; and

Remedial Investigation Work Plan Anacostia River Sediments Project
47
� Characterize site environmental media sufficient to support development and evaluation of remedial alternatives and PRGs.
Several analytical levels of data quality available to achieve the DQOs are designated as follows:
� Level I – Field screening or analysis using portable instruments, calibrated to non-compound-specific standards,
� Level II – Field analysis using portable instruments, calibrated to specific compounds, � Level III – USEPA recommended performance based methodologies such as those outlined in
EPA SW-846, � Level IV – USEPA Contract Laboratory Program (CLP) Routine Analytical Services (RAS) methods,
and � Level V – Other internationally-recognized and/or non-standard analytical methods.
Field-screening data will be used to better understand the depth of the water column, better understand the configuration of the river bottom and identify the presence of potential utilities in the proposed investigation area.
Field screening data will be used as part of a weight-of-evidence approach in conjunction with laboratory data and geologic information to delineate impacts in the context of the CSM (see Section 3.0). Additionally, field screening and observations will be used by the field team to evaluate and adjust sampling depths and locations as needed. This approach to the field investigation is a key component of this dynamic work plan.
Field screening activities will be conducted under Level I data quality protocol. Field measurements [i.e., pH, temperature, turbidity, x-ray fluorescence (XRF)] will be completed under Level II data quality protocol. Samples submitted for fixed-base laboratory analysis and accredited on-site mobile laboratory will be analyzed, at a minimum, under Level III data quality protocol. Level IV or V could be applied for specialty methods such as high resolution PCB analysis or forensic analysis.
4.1.2 Data Quality Objective Development Process The DQOs for the study area were developed using the EPA’s DQO process, a multi-step, iterative process that ensures that the type, quantity, and quality of environmental data used in the decision making process are appropriate for its intended application. Each of the seven steps of the process is discussed in Table 4.1 (below) with respect to the development of specific DQOs for the Anacostia River contaminated sediments project. Additional details regarding the DQOs, including metric thresholds and limits, are addressed in the QAPP.
As discussed in Section 2.6, previous sediment studies in the Anacostia River were reviewed for use in the current RI. During initial scoping meetings with DDOE and a review of historical databases, Tetra Tech determined that to ensure sufficient spatial coverage of the tidal Anacostia study area, the available sediment data collected since 2000 (with some minor exceptions as noted in Section 2.7) and thus including the comprehensive ANS 2000 sampling, will be used for identifying data gaps and defining new sampling locations. Other considerations regarding data usability are discussed Section 2.7.
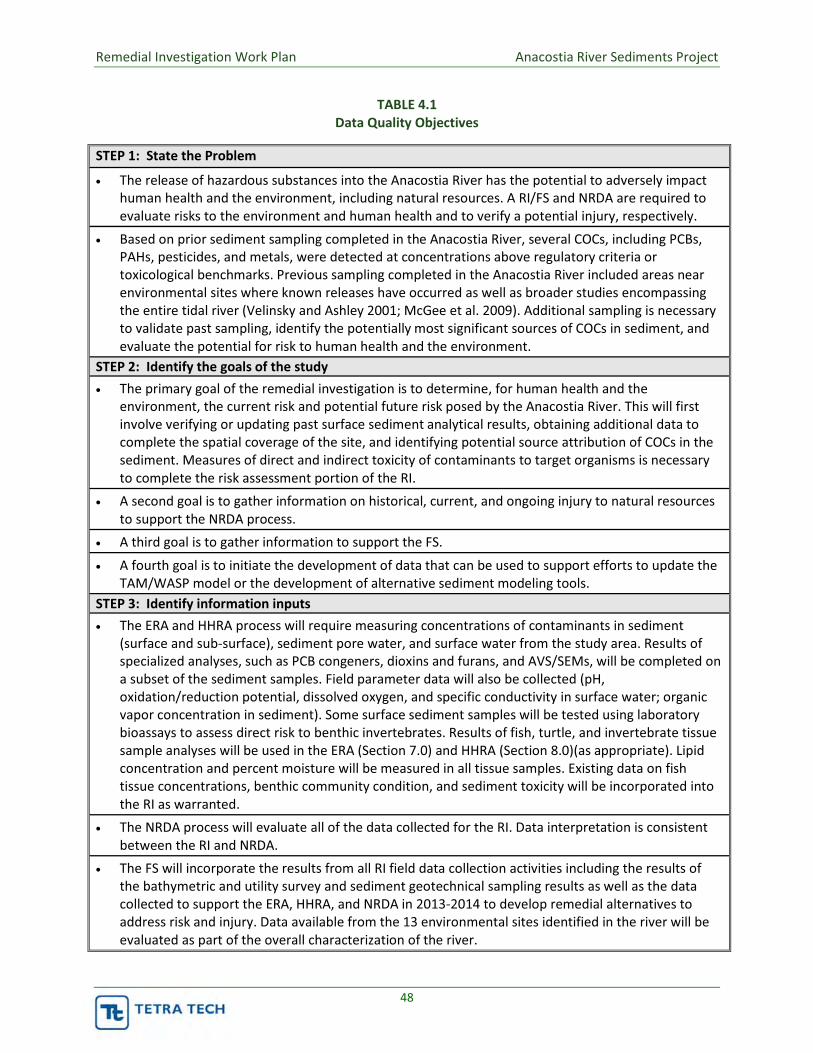
Remedial Investigation Work Plan Anacostia River Sediments Project
48
TABLE 4.1 Data Quality Objectives
STEP 1: State the Problem
• The release of hazardous substances into the Anacostia River has the potential to adversely impact human health and the environment, including natural resources. A RI/FS and NRDA are required to evaluate risks to the environment and human health and to verify a potential injury, respectively.
• Based on prior sediment sampling completed in the Anacostia River, several COCs, including PCBs, PAHs, pesticides, and metals, were detected at concentrations above regulatory criteria or toxicological benchmarks. Previous sampling completed in the Anacostia River included areas near environmental sites where known releases have occurred as well as broader studies encompassing the entire tidal river (Velinsky and Ashley 2001; McGee et al. 2009). Additional sampling is necessary to validate past sampling, identify the potentially most significant sources of COCs in sediment, and evaluate the potential for risk to human health and the environment.
STEP 2: Identify the goals of the study • The primary goal of the remedial investigation is to determine, for human health and the
environment, the current risk and potential future risk posed by the Anacostia River. This will first involve verifying or updating past surface sediment analytical results, obtaining additional data to complete the spatial coverage of the site, and identifying potential source attribution of COCs in the sediment. Measures of direct and indirect toxicity of contaminants to target organisms is necessary to complete the risk assessment portion of the RI.
• A second goal is to gather information on historical, current, and ongoing injury to natural resources to support the NRDA process.
• A third goal is to gather information to support the FS.
• A fourth goal is to initiate the development of data that can be used to support efforts to update the TAM/WASP model or the development of alternative sediment modeling tools.
STEP 3: Identify information inputs • The ERA and HHRA process will require measuring concentrations of contaminants in sediment
(surface and sub-surface), sediment pore water, and surface water from the study area. Results of specialized analyses, such as PCB congeners, dioxins and furans, and AVS/SEMs, will be completed on a subset of the sediment samples. Field parameter data will also be collected (pH, oxidation/reduction potential, dissolved oxygen, and specific conductivity in surface water; organic vapor concentration in sediment). Some surface sediment samples will be tested using laboratory bioassays to assess direct risk to benthic invertebrates. Results of fish, turtle, and invertebrate tissue sample analyses will be used in the ERA (Section 7.0) and HHRA (Section 8.0)(as appropriate). Lipid concentration and percent moisture will be measured in all tissue samples. Existing data on fish tissue concentrations, benthic community condition, and sediment toxicity will be incorporated into the RI as warranted.
• The NRDA process will evaluate all of the data collected for the RI. Data interpretation is consistent between the RI and NRDA.
• The FS will incorporate the results from all RI field data collection activities including the results of the bathymetric and utility survey and sediment geotechnical sampling results as well as the data collected to support the ERA, HHRA, and NRDA in 2013-2014 to develop remedial alternatives to address risk and injury. Data available from the 13 environmental sites identified in the river will be evaluated as part of the overall characterization of the river.

Remedial Investigation Work Plan Anacostia River Sediments Project
49
STEP 4: Define the boundaries of the study • The study area is the Anacostia River in Washington, D.C extending from the confluence with the
Potomac River to the division into the northeast and northwest branches in Prince George’s County, Maryland. The study area includes the Washington Channel (see Figure 1.1). The investigation will primarily address sediment conditions within an area of the Anacostia River approximately 700 acres in size and 9 miles in length. The project area is divided into nine sediment management units: Reaches 1-7, Reach KL (Kingman Lake) and Reach WC (Washington Channel) (Figure 4.1). Several environmental sites within the Anacostia River are being address by others (see Section 2). The results of environmental investigations conducted at these sites will be incorporated into the investigation as they become available. Deep sediments will be investigated to the depth of approximately 10 feet.
STEP 5: Develop the analytical approach
• Sediment sample results will be used to characterize the nature and vertical and lateral extent of contamination and assess risk to ecological and human health receptors. Subsurface sediment sampling horizons will be determined in the field and sediment samples from each horizon will be collected. Samples from up to three horizons within each core will be selected for immediate analyses; the remaining sample horizons will be archived for potential future analysis. Surface water chemistry data will be used to support risks posed to human health. Pore water data is needed to support the ecological risk assessment since pore water is an important pathway for contaminant uptake and can exhibit a strong relationship with tissue concentrations and toxicity. Pore water data will also be used to support FS remedy design needs and as a potential preliminary indicator of up-gradient groundwater contamination sources. Deep sediment data is needed to assess the depth of contamination and to assist in characterizing vertical variations in sediment lithology over the study area.
• Sediment, surface water, and sediment pore water data will be analyzed by EPA or equivalent methods. Samples will be analyzed for a broad range of constituents including PP VOCs, SVOCs, metals, PCB Aroclors, pesticides, and dioxins. Redox potential and TOC will be measured to support analysis of bioavailability. Selected samples will also be analyzed for PCB congeners and alkylated PAHs. The concentrations of chemicals in sediment samples will be compared to Region 3 benchmarks. Chemical concentrations in pore water samples will be compared with freshwater water quality criteria.
• Tissue concentrations in field-collected invertebrates, fish, and turtles serve dual purposes, as indicators of direct exposure and lifetime accumulation by organisms and as evidence of potential transfer of contaminants from the sediment (and water) to other organisms in the aquatic ecosystem. Fish will be collected along the river at various locations. Although fish and turtle tissue concentrations cannot be tied to a particular sediment location because these animals move throughout the area, tissue concentrations are useful in estimating ingested doses of chemicals to animals (and people) that eat fish and turtles. Fish tissue concentrations for the HHRA will be provided by a separate DDOE study conducted in 2013. Other measures of impact such as the index of benthic integrity, incidence of fish tumors, and sediment toxicity reported in the literature will be incorporated into the BERA as warranted.
• Specific locations and analytical requirements for each sample are shown in Tables 5.1 and 5.2. The ERA (Section 7.0) and HHRA (Section 8.0) will use the sediment, pore water, surface water, and tissue data to calculate risks. The data collected will also be used to develop remedial goals for the site. If new potential sources of contaminants or hotspots are identified, additional sampling may be warranted.

Remedial Investigation Work Plan Anacostia River Sediments Project
50
• Geotechnical analyses of surface and subsurface samples will contribute to the FS. Measures of grain size and other physical parameters will be used to assess the feasibility of dredging, dewatering, capping, and other potential remedies.
STEP 6: Specify performance or acceptance criteria
• The data quality indicators for screening and definitive data are defined in terms of the precision, accuracy, representativeness, completeness, and comparability (PARCC) parameters. The assessment of the data quality indicators is necessary to determine data usability and involves the evaluation of the PARCC parameters. To ensure the quality and integrity of the project data, the precision and accuracy of the analysis, the representativeness of the results, the completeness of the data, the comparability of the data to existing data will be evaluated. Data that meet the DQOs and fulfill project goals will be deemed acceptable. Data that do not meet objectives and goals will be reviewed on a case-by-case basis to ascertain usefulness. To limit errors made based upon analytical data, the reporting limits (practical quantitation limits) for target analytes will be established at a level at least one half the applicable screening level whenever technically feasible. In general, statistical analysis will not be used to determine decision error tolerance limits.
• Sediment, pore water, surface water, and tissues will be analyzed by EPA or equivalent methods. Sediment toxicity tests will follow ASTM methods. All data will be validated by a subject-matter expert and the data’s usability assessed.
• Survey information will be collected by a licensed surveyor with experience in bathymetric surveying. Survey information will be compared to previous surveys to verify that the elevations and other survey information are reasonable. Geotechnical data will be analyzed by ASTM or equivalent methods.
• The specific criteria for the PARCC parameters are specified in the QAPP. As part of the RI, historic data will be assessed against the criteria to determine usability for the various aspects of the RI (ERA, HHRA, nature and extent, updating the TAM/WASP model, and other analyses).
STEP 7: Develop the plan for obtaining data
• Sampling will be dynamic and tailored to the conditions observed in the field. A bathymetric survey was completed to provide a basis for understanding the depth of the water column and the configuration of the river bottom and was used to prepare a contour map of the top of the sediment surface in and around the investigation areas (Appendix A). Samples of environmental media will be collected from various locations within the study area. (See Figures 5-1 and 5-2). Sediment sampling locations are based on geomorphic evaluation of the bathymetric survey results. The geomorphic evaluation is summarized in an Appendix B. Sediment, surface water, and sediment pore water samples will be collected over a multi-week period.
• Various types of sampling equipment will be used to gather the required samples. Surface sediment samples will be collected for laboratory-based toxicity testing (i.e., bioassays) using the amphipod (Hyalella azteca) and midge (Chironomus dilutus). At up to half of the surface sediment sampling locations (opportunistically selected as described in Section 5.1), benthic invertebrates will be collected in the field for analysis of body burdens (bioaccumulation) if organisms are available. Fish sampling locations were selected to provide spatial coverage of all reaches of the river within the Study Area. Backwater areas were also targeted. Sample collection locations may be shifted in the field to accommodate logistical requirements of the selected sample collection methods. Data collected by others for development of fish consumption advisories and monitoring of fish health will be incorporated into the ERA and HHRA as warranted.

Remedial Investigation Work Plan Anacostia River Sediments Project
51
• Geotechnical data required for the assessment of potential remedial actions will be collected at sediment sampling locations. Grain size will be measured at every sediment sampling location. Bulk density, moisture content, and Atterberg Limits will be obtained from 20% of the sediment sampling locations. Geotechnical samples will be collected in conjunction with sediment samples collected for chemical analysis. Additional utility and debris survey information deemed relevant to the FS will be collected as needed.
Additional sampling is required to confirm current chemical concentrations in sediment, verify past surface sediment results, and update and expand tissue results to support the ERA, HHRA, and NRDA. The additional data will also provide representative spatial coverage of the site and support identification of potential sources of COCs in the sediment and biota. The additional data will also be used to support the FS and development of PRGs. An assessment of data gaps is provided in Section 4.2.7.
4.2 Nature and Extent of Contamination This section summarizes the existing information regarding the nature and extent of contamination in each environmental medium considered in this investigation. To assist in the evaluation of the existing data, the study area was subdivided into nine channel reaches (Figure 4.1). The channel reach descriptions and associated two-character identifier are listed below.
� Washington Channel (WC) � Mouth of River to South Capitol Street Bridge (R1) � South Capitol Street Bridge to 11th Street Bridge (R2) � 11th Street Bridge to CSX Bridge (R3) � CSX Bridge to East Capitol Street Bridge (R4) � East Capitol Street Bridge to Benning Road Bridge (R5) � Benning Road Bridge to Amtrak Bridge (New York Avenue) Bridge (R6) � Amtrak Bridge (New York Avenue) to Upper tidal limit (R7) � Kingman Lake (KL)
The existing data assessment consisted of spatially reviewing the distribution of sampling points for each medium by sample year and data source. In addition, the data were evaluated regarding spatial coverage. For constituents with site-wide coverage, plots were constructed to review the numbers of constituents analyzed for each of the major constituent groups including PCB congeners, LPAHs, HPAHs, pesticides, and metals. The available data for some constituent groups such as PCB Aroclors, PCDDs, and PCDFs were highly localized primarily to the Washington Navy Yard and/or the CSX environmental cleanup sites. These constituent groups, therefore, were not included in the spatial data review.
For each of the channel reaches, the available data were reviewed with regard to spatial coverage, entry points for each CSS outfall, MS4 outfall, and tributary stream, and resampling of pre-existing locations. Visually-evident patterns or trends within each reach were assessed with a focus on LPAHS, HPAHs, total PCB congeners, and trace metals. Geographic information system (GIS) shapefiles were developed to facilitate concurrent review of multiple constituents. With a site aerial photo as background, the GIS
Remedial Investigation Work Plan Anacostia River Sediments Project
52
allowed the review of the existing concentration data and the identification of channel areas with observable geomorphologic features (e.g., sediment deltas and bars).
4.2.1 Surface Sediment Although coverage is somewhat variable by constituent group, metals, PAHs, PCBs, and pesticides in surface sediment have been sampled at numerous locations throughout the tidal Anacostia River. Comparatively better coverage exists in the Anacostia River than in the Washington Channel. To provide an overview of the nature and extent of contamination in surface sediment, LPAH, total PAH, HPAH, total PCBs, and chlordane concentrations are shown on Figures 4.2 to 4.6, respectively. In addition, concentrations for aluminum, arsenic, cadmium, copper, chromium, lead, mercury, nickel, selenium, and zinc are shown on Figures 4.7 to 4.16, respectively.
As noted in Section 3.1.1, LPAH is defined as the sum of the measured concentrations for the six lower molecular weight PP PAHs (those with fewer than four rings) while HPAH consists of the sum of the remaining PP PAHs (those with four or more rings). If the full suite of PP PAHs were unavailable for any given sample, the calculation summed the concentrations for the subset for which data was available. Also, PCBs are defined as the sum of the PCB congeners analyzed for each sample.
In the following discussion, the general trend in the observed surface sediment distribution is discussed followed by an assessment of specific concentration ranges. Overall, the concentration distributions exhibited consistent trend characteristics from the upstream tidal limit to the lowermost reach from South Capitol Street Bridge downstream to the mouth. Most constituents in the lowermost reach of the Anacostia are at relatively lower concentrations, possibly related to the influence of the Potomac River (this area is referred to below as the Potomac mixing zone). Upstream from the lowermost tidal reach, constituent concentration trends in surface sediments can be grouped as follows:
� Increasing downstream: a generally increasing trend with distance down-river. Localized hotspots with much higher concentrations overlay this general trend, primarily near outfalls and adjacent upland environmental cleanup sites.
� Elevated without observable trend: concentrations are in general elevated everywhere and show no observable trends; localized hotspots exist near some outfalls and upland environmental cleanup sites.
� Data are insufficient to assess trends: the sampling distributions for several of the reviewed constituents were too sparse to assess general trends.
In addition, the term “elevated” is used where appropriate to characterize the observed concentrations. Concentrations are considered elevated if they exceed the EPA Region 3 BTAG freshwater sediment benchmarks screening levels shown in Table 2.5. However, the concentrations noted as elevated in this discussion may be below effects-based levels if other less conservative benchmarks were used. Although the BTAG levels are very conservative, they provide an appropriate initial reference for this evaluation of existing conditions prior to the performance of additional sampling for the RI. Table 2.5 also lists threshold, probable, and severe effects level benchmarks. These and potentially other benchmarks will

Remedial Investigation Work Plan Anacostia River Sediments Project
53
be considered along with the BTAG levels during RI data evaluation at which time, the definition of the term “elevated” may be refined.
� LPAHs. LPAHs concentrations are non-trending in most of the tidal Anacostia River. A general reduction in concentration is observed from the South Capitol Street Bridge to the mouth and in Washington Channel (Figure 4.2). For the sampled locations, LPAH concentrations typically range from 300 to 4,400 μg/kg. Below South Capitol Street and in the Washington Channel, concentrations range from 300 to 1,700 μg/kg. LPAH concentrations appear elevated in the vicinity of the O Street Outfall and the Washington Navy Yard. Concentrations in these areas range up to 21,000 μg/kg. Concentrations in the 1,700 to 2,600 μg/kg range are observed in the reach from the AmTrak/New York Avenue bridges to the upstream tidal limit of the study area. For comparison, Figure 4.3 shows the distribution of total PAHs within the study area.
� HPAHs. The HPAH concentration trend is similar to that described above for LPAHs –no observable trend in the river upstream from the South Capitol Street Bridge and a general reduction downstream from the South Capitol Street Bridge to the mouth and in Washington Channel (Figure 4.4). HPAH concentrations typically range from 4,400 to 13,000 μg/kg. Downstream from South Capitol Street Bridge, the concentrations range from approximately 4,400 to 8,500 μg/kg. Concentrations generally exceed 8,500 μg/kg from the Washington Navy Yard to the upper tidal limit of the study area with higher concentrations observed at the O Street Outfall (up to 52,300 μg/kg) and locally in the vicinity of some of the sewer outfalls and tributary confluences. Outfall F-819-217 and Hickey Run are examples. For comparison, Figure 4.3 shows the distribution of total PAHs within the study area.
� PCBs. Total PCBs, calculated by summing all congener concentrations measured at a given location, are shown on Figure 4.5. Since the ANS 2000 sampling is the most spatially comprehensive, most PCB sampling results available are based on the ANS 2000 list of 81 congeners. PCB concentrations are non-trending and elevated throughout the study area. Concentrations typically range from 34 to 500 μg/kg. Two sampling points from Kingman Lake yielded concentrations of 300 and 500 μg/kg. Maximum total PCBs range from 2,600 to 6,500 μg/kg and are localized to the O Street outfall and the Washington Navy Yard.
� Pesticides. Beta-chlordane is an indicator pesticide constituent that is of concern in the tidal Anacostia River. The District and the Metropolitan Washington Council of Governments issued a fish consumption advisory in part because of elevated chlordane concentrations in fish tissue (Syracuse Research Corporation 2000). Figure 4.6 shows the distribution of beta-chlordane in surface sediments. In general, beta-chlordane is elevated and non-trending (concentrations ranging from less than 0.17 to 30 μg/kg) from the upper tidal limit to the vicinity of the Washington Navy Yard and Poplar Point. In the channel reach opposite from these two sites, detected concentrations typically range from 15 to 70 μg/kg. Below the South Capitol Street Bridge beta-chlordane concentrations fall to the 10 to 15 μg/kg range. Beta-chlordane data is unavailable for the river mouth vicinity and for the Washington Channel.
� Metals. Ten metals that have been relatively widely sampled in shallow sediment from the river include aluminum, arsenic, cadmium, chromium, copper, lead, mercury, nickel, selenium, and zinc.

Remedial Investigation Work Plan Anacostia River Sediments Project
54
- Aluminum. Figure 4.7 shows the distribution of aluminum concentrations in surface sediment. From the upstream tidal limit to the Washington Navy Yard, aluminum concentrations are non-trending and range from 2,800 to 44,600 mg/kg. Maximum concentrations occur near the O Street outfall (in the range from 56,000 to 94,600 mg/kg), in the Washington Channel, in the lowermost reach of the Anacostia, and at the Washington Channel confluence.
- Arsenic. Figure 4.8 shows the distribution of arsenic concentrations in surface sediment. Arsenic was not included in the group of metals analyzed in the 2000 ANS sampling effort and consequently the arsenic sampling distribution is of insufficient density for the assessment of general trends. The maximum concentrations (25 to 90 mg/kg range) observed occur opposite from the Fort Dupont Creek outfall and at the MS4 outfall F-294-739 located south of the Benning Road Bridge. Elevated concentrations in the range of 20 to 25 mg/kg are present in the O Street outfall/Washington Navy Yard vicinity.
- Cadmium. Figure 4.9 shows the distribution of cadmium concentrations in surface sediment. Cadmium concentrations are non-trending throughout the study area, including the lowermost reach of the tidal Anacostia River and Washington Channel. Any reduction in the Potomac mixing zone is muted relative to most other metals. Concentrations generally range from 1.0 to 2.6 mg/kg. The maximum concentrations range from 2.0 to 8.0 mg/kg and occur at the O Street outfall, the eastern portion of the Navy Yard, opposite from the Fort Dupont Creek outfall, and at the MS4 outfall F-294-739 located south of the Benning Road Bridge.
- Chromium. Figure 4.10 shows the distribution of chromium concentrations in surface sediment. Chromium exhibits a general increasing trend in concentration downstream to the Potomac mixing zone. Concentrations appear elevated (87 to 114 mg/kg range) in the reach extending between the confluence with Dueling Creek downstream to the New York Avenue bridge. From New York Avenue downstream to the WGL site, concentrations are generally below the BTAG screening level (43.4 mg/kg) with the exception of several isolated samples and an exceedance cluster at the mouth of Fort Dupont Creek. From WGL to the Potomac mixing zone, concentrations are elevated ranging up to 169 mg/kg. The maximum chromium concentrations encountered are at the O Street outfall and range between 141 and 169 mg/kg.
- Copper. Figure 4.11 shows the distribution of copper concentrations in surface sediment. Copper exhibits an increasing trend in concentration downstream to the Potomac mixing zone where there is a reduction. From the upper tidal limit downstream to Benning Road, concentrations typically range from 5.0 to 30 mg/kg and increase to the range of 30 to 90 mg/kg in the reach from Benning Road to the vicinity of the WGL site. From this point south to the Potomac mixing area, concentrations range from 60 to 120 mg/kg. Localized hotspots exist at the O Street outfall (350 – 900 mg/kg) and in the small embayment/wetland area bordering Kenilworth Park South Landfill.
- Lead. Figure 4.12 shows the distribution of lead concentrations in surface sediment. Lead concentrations are elevated (ranging from 35 to 100 mg/kg) but appear non-trending from the upper tidal limit to the vicinity of the Fort Dupont Creek outfall south of the East Capitol
Remedial Investigation Work Plan Anacostia River Sediments Project
55
Street Bridge. Below Fort Dupont Creek, samples with concentrations ranging from 100 to 200 mg/kg increase in frequency. From the Washington Navy Yard south to the Potomac mixing zone, a further increase in the number of samples in the 100 to 200 mg/kg range suggest the continuation of a general increasing trend in this portion of the river. The maximum lead concentrations, in the range from 500 to 1,000 mg/kg occur adjacent to the O Street Outfall and the Washington Navy Yard.
- Mercury. Figure 4.13 shows the distribution of mercury concentrations in surface sediment. Mercury concentrations appear to increase with distance downstream from the upper tidal limit. Upstream from the Benning Road Bridge, concentrations ranged from 0.009 to 0.4 mg/kg; downstream from this point, concentrations are typically elevated and range from 0.18 to 0.4 mg/kg. Any reduction in the Potomac mixing zone is muted relative to most other metals. Maximum concentrations occur at the O Street outfall and Washington Navy Yard (3.0 to 10 mg/kg). Elevated concentrations also exist in the vicinity of the Fort Dupont Creek outfall (0.4 to 0.9 mg/kg).
- Nickel. Figure 4.14 shows the distribution of nickel concentrations in surface sediment. Nickel exhibits a general increasing trend in concentration downstream to the Potomac mixing zone. Upstream from the Kenilworth Park Landfills, concentrations range from 0.2 to 64 mg/kg. Below this point to the vicinity of the WGL site, levels increase to the 23 to 64 mg/kg range. From WGL to the Potomac mixing zone, concentrations range between 47 and 100 mg/kg. The maximum nickel concentrations encountered are at the O Street outfall and range between 100 and 149 mg/kg.
- Selenium. Figure 4.15 shows the distribution of selenium concentrations in surface sediment. Selenium was not included in the group of metals analyzed in the 2000 ANS sampling effort and consequently the sampling distribution is of insufficient density for the assessment of general trends. The maximum concentrations (5 to 12 mg/kg range) occur in the in the O Street outfall vicinity. Selenium was detected in the range of 0.3 to 1.6 mg/kg range near the Fort Dupont Creek outfall.
- Zinc. Figure 4.16 shows the distribution of zinc concentrations in surface sediment. Zinc concentrations are generally elevated and show an increasing trend from the upper tidal limit downstream to the Potomac mixing zone. Concentrations typically range from 17 to 280 mg/kg to the vicinity of the Pepco site, below which, the general range increases to between 120 and 400 mg/kg. Downstream from the Poplar Point and the Washington Navy Yard, the range increases to 280 to 400 mg/kg. The maximum zinc concentrations are in the range of 900 to 1,800 mg/kg and occur in the vicinity of the O Street outfall.
4.2.2 Subsurface Sediment Within the study area, subsurface sediment sampling is limited to three general locations (Figure 4.17), the Washington Navy Yard and in the vicinity of the Fort Dupont Creek outfall, downstream from CSX Benning Yard, and Poplar Point. Subsurface samples in these investigations were collected via vibracoring drilling methods.
Remedial Investigation Work Plan Anacostia River Sediments Project
56
Washington Navy Yard. CH2M Hill (2011a) describes the characterization of subsurface sediments at the Washington Navy Yard. Sampling was conducted at 34 locations within and near the pier area to depths ranging from 10 to 12 feet (middle depth) to approximately 20 feet (deep depth) below the river bottom. The historical dredge depth at the Washington Navy Yard is -22 feet below mean sea level. The middle depth and deep depth samples correspond to the interval above the typical dredging depth versus the interval representing older fluvial sediments.
� VOCs. VOCs were analyzed in deep sediments and were infrequently detected. Four compounds, including benzene, carbon disulfide, and cis-1,2-dichloroethene were detected at concentrations ranging from 1 and 15 μg/kg in a sample collected near DC CSS outfall 15. A concentration of 1,200 μg/kg for vinyl chloride was measured in this sample while VOCs were non-detect in a sample taken from the same depth at a lateral distance of approximately 50 feet away. The available data thus indicate that given the 34 locations sampled, elevated occurrences of VOCs, though observed, are relatively isolated.
� PAHs. Total PAHs calculated as the sum of the 16 PP PAHs in middle depth samples ranged from 1,362 to 92,280 μg/kg with a mean concentration of 20,349 μg/kg. Middle depth samples were elevated with respect to surface and deep zone samples. The most elevated concentrations were measured near the DC CSS outfall 15, near Washington Navy Yard outfalls, and immediately downstream of the neighboring WGL East Station site. Total PAH concentrations were generally lower and more often below detection levels in the deep sediments. Deep sediment total PAHs ranged from 320 to 27,719 and averaged 6,212 μg/kg. The most elevated concentrations were observed near facility outfalls.
� Pesticides. The most frequently detected pesticides included 4,4’-Dichloro-diphenyl-dichloroethane (DDD), 4,4’-Dichloro-diphenyl-dichloroethylene (DDE), alpha-chlordane, dieldrin, gamma-chlordane, and heptachlor expoxide. Gamma-chlordane, which CH2M Hill (2011a) determined to be a potentially significant contributor to risk in surface sediments, ranged from 5.2 to 58 and averaged 18.5 μg/kg in middle depth samples. Middle depth samples were generally elevated in comparison to surface and deep zone samples. In general, elevated gamma-chlordane concentrations occurred near facility outfalls and DC CSS outfall 15. More elevated gamma-chlordane concentrations (27 and 30 μg/kg) were observed at two deep sediment locations, both in close proximity to facility outfalls.
� PCBs. PCB congeners were analyzed in a subset of the deep sediment sampling locations, 10 middle-depth and eight deep-depth samples. Middle depth total PCBs were elevated with respect to surface and deep-zone samples. The average concentrations total PCB congeners (sum of the 102 congeners analyzed) was 3508 μg/kg for the middle depth and 316 μg/kg for the deep horizon. Maximums were 26,129 and 2,277, respectively. The most elevated concentrations occurred near DC CSS outfall 15 and outfalls for the facility.
� Metals. The list of 24 EPA target analyte list (TAL) metals was analyzed in all subsurface sediment samples. Most of the TAL metals were detected in all middle and deep-depth samples. Antimony, cadmium, thallium, selenium, and silver were exceptions and were detected in a subset of samples. Barium, chromium, copper, lead, and zinc were detected in all samples and indicate the general distribution of metals in the subsurface sediment samples. In comparison to

Remedial Investigation Work Plan Anacostia River Sediments Project
57
surface sediments and deep zone sediments, the most elevated occurrences of these five metals were observed in the middle-depth sediments. Barium concentrations averaged 200 mg/kg in the middle sediments and 162 mg/kg in the deep sediments. Chromium averaged 125 mg/kg in the middle zone and 34 mg/kg in the deep zone. Similarly, the average concentrations for copper, lead, and zinc were 95, 268, and 399 mg/kg, respectively for middle depth samples compared to 54, 102, and 168 mg/kg in the deep sediments.
CSX Benning Yard. Shallow subsurface samples were collected in the Anacostia River at 35 locations for the Benning Yard investigation. Twenty-two samples were collected at and in the general vicinity of the Fort Dupont Creek outfall (Figure 4.17). The remaining samples were collected to evaluate conditions in the river channel away from the Fort Dupont Creek outfall and at selected MS4 outfalls in the general vicinity upstream and downstream from Fort Dupont Creek. Samples were collected from the depths of 0.5 to 1.0 foot (upper interval), 1.0 to 2.0 feet (middle interval), and 2.0 to 3.0 feet (deep interval) below the river bottom. Sediments in the immediate vicinity of the outfall tend to contain more sand while those at distance from the outfall have larger silt and clay fractions.
� LPAH. Concentrations tend to increase with depth and are variable away from the Fort Dupont Creek outfall. Average concentrations in the upper interval were 1,384 μg/kg. For the middle and deep sample intervals, the average concentrations were 1,556 and 1,613 μg/kg. Concentrations also tended to increase with decreasing grain size. The maximum LPAH concentration (2,800 μg/kg) was observed in the shallow subsurface interval sample collected near the shoreline in close proximity to the Fort Dupont Creek outfall. The sample contained a large silt fraction. Coarser grained samples in the outfall vicinity generally exhibited lower concentrations. A mid-channel sample collected approximately 1,000 feet upstream is indicative of concentrations away from the outfall area. At this location, an LPAH concentration of approximately 1,200 μg/kg were observed in the shallow depth interval sample.
� HPAH. Concentrations exhibit a decreasing trend with depth. The averages for the sampled zones decrease from 9,547 μg/kg for the upper zone to 6,956 and 5,592 μg/kg for the middle and deep zones, respectively. As was true for LPAH, concentrations appear to be inversely correlated with grain size. The maximum HPAH concentration (21,600 μg/kg) was observed in a middle interval sample collected near the shoreline approximately 600 feet downstream from the Fort Dupont Creek outfall. Coarser grained samples in the outfall vicinity generally exhibited lower concentrations. As noted above for LPAH concentrations, the mid-channel sample collected approximately 1,000 feet upstream is indicative of concentrations away from the outfall area. At this location, an HPAH concentration of approximately 10,000 μg/kg was observed in the shallow depth-interval sample.
� PCBs. PCBs for the Benning Yard Anacostia River dataset exhibit an increasing trend with depth. Total PCBs for the Benning Yard dataset were calculated by summing the result reported for all 209 PCB congeners and, thus, are not directly comparable to the results discussed above for total PCBs for the ANS 2000 data set (summed results for 81 congeners). From an average concentration of 848 μg/kg in the upper interval, concentrations increase to 1,205 μg/kg in the middle interval and to 2,039 μg/kg in the deep interval. The maximum total PCB concentration
Remedial Investigation Work Plan Anacostia River Sediments Project
58
was observed in a deep zone sample collected near the shoreline approximately 750 feet upstream from the Dupont Creek outfall. In general, total PCB concentrations are lower in close proximity to the outfall.
� Pesticides. Chlordane is used as an indicator compound to summarize the pesticide concentrations. Chlordane was detected in 29 of 39 samples. Chlordane concentrations exhibit an increasing trend with depth. The averages for the sampled zones increase from 71 μg/kg for the upper zone to 123 and 146 for the middle and deep intervals, respectively. The maximum chlordane concentration was observed in a middle depth interval sample located near the shoreline and approximately 300 feet downstream from the Fort Dupont Creek outfall. Elevated chlordane concentrations also are present near the outfall and in some samples with a large sand size fraction.
� Metals. Arsenic, cadmium, lead, mercury, and selenium concentration distributions generated from the Benning Yard investigation were reviewed. With the exception of selenium, each of these metals were detected in essentially all of the 38 samples (one sample was non-detect for mercury) included in the dataset. Results for approximately half of the selenium analyses were below the detection level. Among the three sampling intervals, average concentrations for each metal were typically most elevated for the deep interval. Deep interval averages for arsenic and cadmium were 12.38 and 2.33 mg/kg. Lead, mercury, and selenium deep interval average concentrations were 194, 0.54, and 3.89, respectively. The maximum concentrations for arsenic, cadmium, and selenium (12, 2.7, and 1.3 (estimated) mg/kg) were in a mid-channel, deep interval sample collected 1,000 feet upstream from the Fort Dupont Creek outfall. A lead concentration of 120 mg/kg) was measured in the upper interval sampling at this location. The maximum mercury concentration (1.6 mg/kg) occurred in a sample located in mid-channel, 200 feet from the outfall. In general, mercury concentrations in the immediate vicinity (within 100 feet) of the outfall were very low (average 0.04 mg/kg) in comparison to the concentrations (average of 0.3 mg/kg) measured at more distant sampling locations (greater than 100 feet).
Poplar Point. Five sediment cores from the undredged portion of the channel in the Poplar Point vicinity were sampled by Vibracore; depths ranged from 13 to 16 feet below the sediment surface (Velinsky et al. 2011). Surface concentrations of PAHs and total PCBs were lower than deeper horizons. Maximum PAH concentrations ranged from 10,000 to 30,000 μg/kg, and were greatest at 3.2 to 8.2 feet below the sediment surface. Total PCB concentrations were greatest at 3.2 to 13 feet below the sediment surface; maximum total PCB concentrations ranged from 1,700 to 3,000 μg/kg. (See Section 2.6.2 for more details).
4.2.3 Pore Water and Surface Water Pore water data and surface water data are not available in the project database. With respect to surface water, analytical data are available from discharge monitoring reports compiled for selected tributary streams and outfalls to the tidal Anacostia River. Pinkney et al. (2002) reported on four surface water samples collected in 2000. In addition, CH2M Hill (2011a) report field parameter measurements for surface water samples collected for the Washington Navy Yard RI.
Remedial Investigation Work Plan Anacostia River Sediments Project
59
Discharge Monitoring Report (DMR) Sampling. As a requirement of the District of Columbia Municipal Separate Storm Sewer System National Pollutant Discharge Elimination System (NPDES) permit issued by EPA, DDOE conducts routine wet and dry weather sampling of nine stations located in the Anacostia River watershed (Hawkins 2009). According to sampling protocol, storm water samples are to be collected during the first two hours of a storm event. Regarding dry weather monitoring, sampling is conducted sufficient to estimate the frequency and volume of dry weather discharges. The water is analyzed for BOD, TDS, TSS, various inorganics, 13 metals and hardness, 2,3,7,8-TCDD, and bacteria (fecal coliform and fecal streptococcus). Monitoring of the Anacostia stations occurs once each three years with 2011 the last year in which monitoring was performed. Based on monitoring results from 2008, TSS ranged from 5 mg/L (Hickey Run) to 853 mg/L at the O Street NPDES Outfall located adjacent to the Washington Navy Yard. In addition, 2,3,7,8-TCDD, pesticides, and all metals with the exception of cadmium, copper, lead, and zinc were below the detection level.
Main Channel Sampling in 2001. To support a study of the toxicity of Anacostia River water on larval-stage fish, Pinkney et al. (2002) collected six surface water samples during an approximately one month period spanning May and June, 2001. Two dry and four wet period samples were collected at four locations encompassing the length of the tidal Anacostia River. Water for toxicity testing was collected concurrently with the surface water samples. The water samples were analyzed for trace metals, organochlorine pesticides, PCBs (Aroclors), and PAHs. The majority of the constituents were non-detect or the results were qualified as a result of matrix interference. PCBs were uniformly below detection levels while detections of PAHs and metals were all less then water quality criteria. Pesticides were generally also non-detect with the exception of four instances of one detection of a single pesticide for the dry period samples. The toxicity test results suggested non-toxic river water conditions during dry weather. Wet period samples, however, suggested conditions may exist for reduced survival and growth.
Washington Navy Yard. As a part of a sediment triad investigation in the tidal Anacostia River near the Washington Navy Yard, CH2M Hill (CH2M Hill 2011a) measured surface water parameters at a height of one foot above the sediment surface. This sampling was conducted in August, 2009. The samples were collected at locations adjacent to the Navy Yard piers and outfalls and in reference areas located away from the immediate area of the Navy Yard but still in the general vicinity of the facility. The maximum, minimum, and average pH, dissolved oxygen (DO), oxidation and reduction potential (ORP) and specific conductivity for the 18 locations sampled are summarized in Table 4.2, below. Additional investigation is necessary to confirm these sampling results.
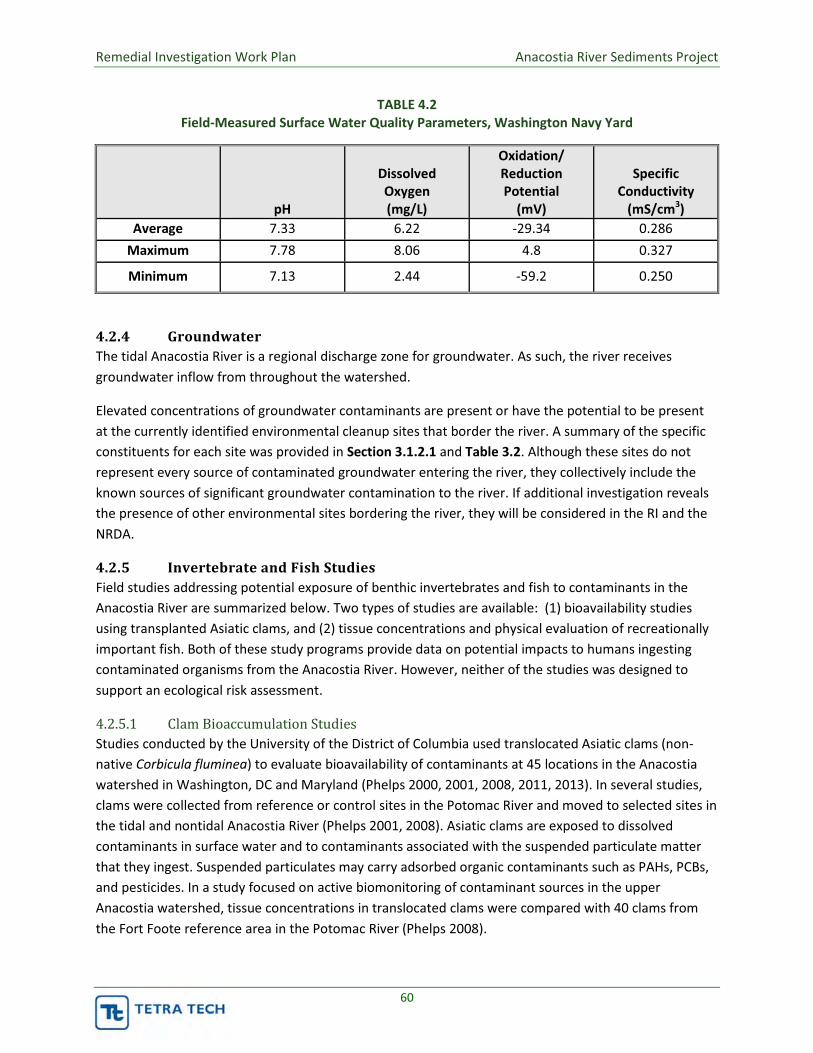
Remedial Investigation Work Plan Anacostia River Sediments Project
60
TABLE 4.2 Field-Measured Surface Water Quality Parameters, Washington Navy Yard
pH
Dissolved Oxygen (mg/L)
Oxidation/ Reduction Potential
(mV)
Specific Conductivity
(mS/cm3) Average 7.33 6.22 -29.34 0.286
Maximum 7.78 8.06 4.8 0.327
Minimum 7.13 2.44 -59.2 0.250
4.2.4 Groundwater The tidal Anacostia River is a regional discharge zone for groundwater. As such, the river receives groundwater inflow from throughout the watershed.
Elevated concentrations of groundwater contaminants are present or have the potential to be present at the currently identified environmental cleanup sites that border the river. A summary of the specific constituents for each site was provided in Section 3.1.2.1 and Table 3.2. Although these sites do not represent every source of contaminated groundwater entering the river, they collectively include the known sources of significant groundwater contamination to the river. If additional investigation reveals the presence of other environmental sites bordering the river, they will be considered in the RI and the NRDA.
4.2.5 Invertebrate and Fish Studies Field studies addressing potential exposure of benthic invertebrates and fish to contaminants in the Anacostia River are summarized below. Two types of studies are available: (1) bioavailability studies using transplanted Asiatic clams, and (2) tissue concentrations and physical evaluation of recreationally important fish. Both of these study programs provide data on potential impacts to humans ingesting contaminated organisms from the Anacostia River. However, neither of the studies was designed to support an ecological risk assessment.
4.2.5.1 Clam Bioaccumulation Studies
Studies conducted by the University of the District of Columbia used translocated Asiatic clams (non-native Corbicula fluminea) to evaluate bioavailability of contaminants at 45 locations in the Anacostia watershed in Washington, DC and Maryland (Phelps 2000, 2001, 2008, 2011, 2013). In several studies, clams were collected from reference or control sites in the Potomac River and moved to selected sites in the tidal and nontidal Anacostia River (Phelps 2001, 2008). Asiatic clams are exposed to dissolved contaminants in surface water and to contaminants associated with the suspended particulate matter that they ingest. Suspended particulates may carry adsorbed organic contaminants such as PAHs, PCBs, and pesticides. In a study focused on active biomonitoring of contaminant sources in the upper Anacostia watershed, tissue concentrations in translocated clams were compared with 40 clams from the Fort Foote reference area in the Potomac River (Phelps 2008).

Remedial Investigation Work Plan Anacostia River Sediments Project
61
In general, the clam translocation studies did not show strong correlation between sediment and tissue concentrations of most contaminants. However, it should be noted that sediment concentrations in the vicinity of the sampled clams and the level of bioaccumulated contaminants found in the clams may not necessarily correlate. The level of correlation found between sediment samples and clam tissue samples is related to several factors including the depositional environment in the vicinity of the clams, the bioavailability of the contaminants being studied, and the turbidity of the water being filtered by the clam.
The highest PCB concentrations in sediment were reported at the Bladensburg Marina site; however, concentrations of PCBs in clam tissues were highest near the Washington Navy Yard and the supposedly “clean” Potomac River locations (Phelps 2000). A clam translocation study associated with dredging and wetland creation at Kingman Island indicated that clams accumulated pesticides and PCBs following dredging. Clams at the dredging sites did not bioaccumulate metals to any substantial extent, compared with control samples in the Potomac River (Phelps 2001). This result may indicate that the metals found in sediment in the dredging sites had a low bioavailability or that low levels of metals were present in the sediment being transported.
Additional bioaccumulation studies using translocated clams at tributaries and other river locations provide similar corroborating evidence that hotspots of PAHs and chlordane may occur in the upper Anacostia River (above Bladensburg Marina) (Phelps 2011, 2013). However, these studies do not incorporate the controlled exposure scenarios necessary to support development of bioaccumulation factors usable in ERAs. (Phelps 2011, 2013).
Pinkney et al. (2003) analyzed contaminant uptake by semi-permeable membrane devices (SPMD) and Asiatic clams (Corbicula fluminea) at nine locations in the Anacostia River in 2000. The SMPDs take up dissolved but not particulate contaminants, while the clams accumulate both dissolved and particulate contaminants. PCB congeners, organochlorine pesticides, and PAHs were analyzed. Overall results suggest that constituent concentrations differed between the Northwest Branch and Northeast Branch, but that both locations tended to be elevated with respect to the Fort Foote reference stations. The magnitude and direction of the differences between the two branches varied between test type, with clams and SPMDs yielding conflicting results. Downstream sample locations were more uniform, likely due to mixing in the lower river. Median PCB, PAH, chlordane, and DDT concentrations in SPMDs in the lower river were elevated with respect to the Fort Foote reference locations.
4.2.5.2 Fish Tissue Concentrations and Physical Effects
Contaminants in fish tissue from the Anacostia River were analyzed in 2007 to support development of fish consumption advisories (Pinkney 2009). Collection efforts focused on species caught and consumed by anglers in the Anacostia and Potomac Rivers: American eel (Anguilla rostrata), bluegill (Lepomis macrochirus), pumpkinseed (Lepomis gibbosus), carp (Cyprinus carpio), channel catfish (Ictalurus punctatus), blue catfish (Ictalurus furcatus), and largemouth bass (Micropterus salmoides). Fish were collected using an electroshocking boat from two reaches in the Anacostia River (above and below the CSX Railroad bridge, respectively). Fish samples were also collected from two locations in the Potomac River (above and below the 14th street Bridge). All samples were fillets prepared for human

Remedial Investigation Work Plan Anacostia River Sediments Project
62
consumption (with or without skin, as the species was normally consumed); most samples were composites of several fish. Six samples were collected at each Anacostia River location, for a total of 12 samples.
Fish samples were analyzed for lipid and moisture content, metals, PAHs, organochlorine pesticides, total PCBs (including Aroclor analysis), 119 PCB congeners, and polybrominated diphenyl ethers (PBDE). The two measures of total PCBS yielded similar results; total PCBs measured as the sum of Aroclors were within 15 percent of totals calculated as the sum of the congeners (see Table 5 in Pinkney 2009).
Every fish sample analyzed exceeded the 0.02 ppm screening level for total PCBs. At least one sample exceeded human health screening levels for PCBs, DDTs, chlordane, dieldrin, heptachlor epoxide, hexachlorobenzene, PAHs, and mercury. Of these, total PCBs, total chlordane, total DDT, dieldrin, heptachlor epoxide, and total PAHs are considered to pose the greatest risk.
Temporal trends in fish tissue were evaluated qualitatively for PCBs and chlordane between 2000 and 2007; small sample size precluded formal statistical analysis. Median concentrations of both PCBs and chlordane increased in American eel, carp, and largemouth bass, but decreased in channel catfish. Concentrations in sunfish decreased slightly. Concentrations of PCBs and chlordane were generally higher in the Anacostia River than the Potomac River. In general, older fish tissue data are not reliably representative of current conditions (Pinkney 2009). DDOE conducts fish tissue studies about every five years to update the consumption advisories. Data collected in 2013 is currently under review and will be incorporated into the HHRA (see Section 8.0).
In a separate study focused on sediment adjacent to the Washington Navy Yard, fish tissue samples were reported to contain PCBs and arsenic concentrations above human health action levels (CH2MHill 2011a).
4.2.5.3 Human Consumption of Contaminated Fish
The Anacostia Watershed Society and other local and federal partners conducted a year-long study (2011-2012) to determine to what extent people are catching, sharing and eating fish from the Anacostia River. Both the District of Columbia and Maryland advise the public to avoid eating certain fish species (for example, carp and channel catfish) and to limit consumption of other fish species to prevent long-term health effects. The interviews revealed that anglers and other community members have limited knowledge of the consumption advisories and poor understanding of the health risks associated with eating Anacostia River fish. People generally believe that they can tell whether a fish is harmful by looking at external signs. Anglers routinely share their catch with people who would otherwise not have sufficient protein to eat. People who receive fish from anglers are often unaware of the location of the catch. The study concluded that anglers and others either are not receiving or not heeding the available consumption advisory information (OpinionWorks 2012). Additionally, the Washington City Paper reported that freshwater turtles were being collected in the Anacostia River for human consumption (Shin 2000). (Shin 2000). No data on contaminants in turtle tissues from the study Area are available. However, turtles are known to accumulate contaminants and consumption advisories include turtles in other U.S. watersheds (EPA 2000).
Remedial Investigation Work Plan Anacostia River Sediments Project
63
4.2.5.4 Tumors in Fish
The FWS surveyed the prevalence of skin and liver tumors in brown bullhead (Ameiurus nebulosus) in the Anacostia River in 2009, 2010, and 2011 (Pinkney et al. 2013). Liver tumors typically are associated with exposure to PAHs, although the causal agent of lip tumors is less certain. The occurrence of tumors on brown bullhead in the Anacostia River was first documented by FWS in 1996; subsequent research provided extensive supporting evidence that the tumors were strongly correlated with exposure to PAHs in sediment. The incidence of lip and liver tumors in Anacostia River brown bullheads has decreased since 1996, but is still significantly higher than in largely rural “reference” areas of the Chesapeake Bay. Surveys from 2009 to 2011 indicated that 42 percent of brown bullhead females and 14 percent of brown bullhead males had liver tumors. Brown bullheads remain in a relatively small area (linear home range of 0.6-2.1 km [Sakaris et al. 2005]) and are closely associated with sediment; these traits suggest that contaminants in Anacostia River sediments may contribute to development of liver tumors (Pinkney et al. 2013).
4.2.5.5 Benthic Invertebrate Bioassay and Index of Biotic Integrity
A series of 20 sediment locations collected in 2000 as part of the Velinsky et al. (2001) sediment study were evaluated using a sediment triad approach comprised of chemical analysis, direct toxicity tests, and measures of benthic community health (McGee et al. 2009; McGee and Pinkney 2002). Sample locations were distributed from Bladensburg down to the confluence with the Potomac River, excluding the Washington Channel. Physical and chemical analyses included grain size, TOC content, trace metals (aluminum, cadmium, chromium, copper, iron, mercury, nickel, lead, silver, and zinc), 81 PCB congeners or groups of congeners, select organochlorine pesticides, and PAHs. A 10-day survival and growth test using Hyalella azteca (an amphipod) and Chironomus dilutus (a midge) measured direct toxicity of surficial sediment (top 3 to 4 cm). None of the sediment samples affected survival and only one sample adversely affected growth. Benthic community health was described using the Benthic Index of Biotic Integrity (B-IBI).
The study did not demonstrate any clear relationship between benthic community health and contaminant concentrations. Overall levels of contaminants, measured as the mean probable effect concentration (PEC) quotient, were highest near the O Street CSS outfall, decreasing both downstream and upstream of this point. The PEC quotient was not significantly correlated with any measure of benthic community health or toxicity. About 40 percent of the sample locations were considered “degraded,” indicated by an B-IBI of less than 3. Both the amphipod and the midge exposed to this sample showed inhibited growth; in addition, contaminant levels were high, and measures of benthic community health were low. Subsequent analyses using toxicity identification evaluation suggested that the adverse impacts may have been caused by organic compounds (McGee et al. 2009). To the extent practicable, the results of this study will be incorporated into the RI to reflect representative conditions in 2000.
4.2.6 Bathymetric Data Bathymetric data characterizes the spatial variation of the sediment surface also referred to as the “mud line.” To support this investigation, Tetra Tech conducted a bathymetric survey during September and October, 2013 (Appendix A).

Remedial Investigation Work Plan Anacostia River Sediments Project
64
Prior to Tetra Tech bathymetric survey, the existing bathymetric data for the tidal Anacostia River were limited the river reach extending from approximately the downstream limit of the Southeast Federal Center to the 11th Street Bridge (approximately 80 percent of Reach R2 [Figure 4.1]). The Washington Navy Yard and the O Street Outfall investigations conducted prior to the placement of the experimental active sediment caps (described in Section 2.6) both included a bathymetric survey of all or a portion of this reach. The O Street Outfall survey was limited to the immediate vicinity of the outfall while the Navy Yard survey encompassed the entire area. Bathymetric data were unavailable for either the Washington Channel or other portions of the tidal Anacostia River.
4.2.7 Data Gap Assessment for Environmental Media The review of existing information in the literature and databases led to the identification of several data gaps to be filled before or during the RI and NRDA processes. At this time, data gaps exist in the following three general areas:
� Bathymetric and utility survey data, (completed in 2013 and 2014, respectively) � Collection of sediment, pore water, and surface water samples for chemical and physical
property tests, and � Collection of biological samples for risk assessment and NRDA purposes.
These data needs are described in the following subsections along with the rationale and priority for acquisition.
4.2.7.1 Bathymetric Survey Data
With the exception of the Washington Navy Yard and the adjacent pilot test for the active capping site near the O Street Outfall, existing river bottom elevation data at the start of the RI were inadequate with regard to accuracy and coverage. A bathymetric survey of the river bottom was conducted in September and October, 2013 to locate the sediment sample locations both horizontally and vertically with relation to the river. A report discussing the bathymetric survey results is included as Appendix A. Survey information was used to establish riverbed topography and sample elevations in relation to the waterway and the project vertical datum and to complete a geomorphic analysis to assist in the finalization of sediment sampling locations. The geomorphic analysis is summarized in Appendix B. The accurate bathymetry allowed more objective delineation of areas of deposition and erosion and enabled the definition of specific geomorphic units. The initial sample locations (defined in the January 29, 2014 version of the WP) were revised to ensure that all units were represented by sampling without over or under sampling any one unit. With regard to the FS, the bathymetric survey data will be used to support the development of potential remedial alternatives (estimation of dredging and capping quantities) and evaluate logistical options with regard to site access.
4.2.7.2 Collection of Sediment, Pore Water, and Surface Water Samples
As discussed in Section 2, previous sediment sampling events on the Anacostia River have ranged from comprehensive campaigns encompassing the entire estuary to smaller, targeted efforts at discrete areas within the tidal footprint. Discrete sampling has generally been performed in conjunction with investigations at the environmental cleanup sites that border the river.

Remedial Investigation Work Plan Anacostia River Sediments Project
65
The most comprehensive sampling effort in the river was the 2000 ANS sampling event. ANS primarily sampled the river in transects from the mouth at the Potomac River to the upper tidal limit north of the DC, Maryland border. Selection of transect locations does not appear to have been based on any site specific conditions, such as potential source areas or areas of likely sediment deposition. ANS collected surface sediments with a petit Ponar grab sampler. Samples were composited from several grabs at each location from the top 3 to 4 cm of sediment.
For the sites where previous environmental investigations have been completed, the existing characterization data ranges from extensive at sites undergoing active cleanup (e.g., the Washington Navy Yard and CSX Benning Yard) to sites with limited (Pepco Benning Road) or minimal data (Poplar Point). At some data-limited sites such as Pepco Benning Road, investigations are ongoing at the date of this WP. Reduced sampling will occur near the environmental cleanup sites where extensive sediment characterization sampling exists or will be performed to minimize duplication of effort and cost while providing complimentary data.
Regulatory involvement at the environmental sites will help to foster an appropriate level of sediment investigation coordination at each site so that the objectives of this WP are achieved. It should be noted that the lead regulatory agency (e.g., U.S. EPA Region 3, NPS, etc.) and DDOE’s regulatory role may vary by site. At the Washington Navy Yard and CSX sites, the sites most advanced with respect to characterization, the characterization completed to date appears generally consistent with the objectives for this investigation. Both sites, however, require additional review with regard to potential remaining data gaps. The planned investigation at the Pepco site appears to be congruent with this WP. Although the broad objectives of the WGL East Station OU2 RI/FS include the characterization of sediments in the adjacent Anacostia River, specific details regarding the extent of this investigation are under discussion. Information regarding planned sediment investigations is currently unavailable for the Kenilworth Park Landfill and Poplar Point. For this WP, sampling locations are defined within the river segments adjacent to the WGL and the Kenilworth Park landfill sites. These sample locations, however, will be adjusted if WGL or NPS (oversight authority for the Kenilworth Park Landfill) finalize the respective work plans for these sites prior to the commencement of field work for this WP.
Although the existing post-2000 sediment characterization data set is invaluable with regard to estimating the current nature and extent of contamination, additional samples need to be collected throughout the project area to achieve the DQOs within most river reaches. Outside the third-party-investigated environmental cleanup sites, there are substantially fewer data points. The focus of the sample design in this work plan is this larger portion of the river.
Surface Sediment. Current assessments of depth-based variations in constituent concentrations, essentially limited to the Washington Navy Yard (CH2M Hill 2011a), indicate the absence of specific trends for most constituents. The absence of a trend suggests that, outside of random variation between surface versus shallow subsurface concentrations, no systematic increase or decrease was observed. Surface sediment samples will be collected from a percentage of the ANS locations to verify that the results from that 2000 sampling effort are generally representative of current conditions. As discussed in the data usability section, the ANS 2000 data is a key component of the current site

Remedial Investigation Work Plan Anacostia River Sediments Project
66
database; should the sampling results for the planned effort show a poor correlation to the ANS 2000 data and the existence of a consistent trend between the two sample horizons, an additional surface sediment sampling phase will be necessary. Selection of the ANS re-sample points (approximately 20 percent of the new sample locations) will be spread within the project area to achieve adequate spatial coverage, and biased toward likely sediment deposition areas, as identified from the bathymetric survey results. New surface sediment sampling locations will be sited near contaminant source areas, primarily the MS4 outfalls, CSS outfalls, and tributaries. Surface sediment sampling will also be conducted to improve overall spatial coverage, particularly in Washington Channel and Kingman Lake, and will focus on depositional areas. In addition, a portion of the surface sediment samples will be tested under laboratory conditions for direct toxicity to benthic invertebrates (either amphipod or midge) as described in Section 5.2.
Subsurface Sediment. As discussed in Section 4.2.2, subsurface sediment data are limited to the near shore areas adjacent to the Washington Navy Yard and the Fort Dupont Creek outfall downstream from CSX Benning Yard. To address this major data gap, subsurface sampling will be performed at most surface sediment samples throughout the study area.
Sediment Pore Water. Sediment pore water data was generally not collected in any of the investigations which served as data sources for the project database. Pore water data is necessary for assessing the general condition of the benthic habitat and provides a more direct measure of contaminant bioavailability. Pore water data is thus an important input to both the ERA and NRDA. In addition, pore water data will be used to assess potential zones of groundwater influx and to support remedy assessment in the FS, particularly with regard to the consideration of geochemical conditions in the evaluation of sediment capping options.
Surface Water. Few surface water samples have been collected and analyzed in the tidal Anacostia River. Surface water samples will be collected to support the evaluation of direct contact and ingestion in the HHRA and as a component of daily dose to ecological receptors in the BERA. The surface water data will also support the calibration and validation of an updated surface water quality model for the river.
4.2.7.3 Biological Sample Collection
Targeted collection of invertebrates, fish, and turtles from the tidal Anacostia River will support the ERA, HHRA, and NRDA. The only available data on body burdens (tissue concentrations) in biota are fish fillets collected to support fish consumption advisories (Pinckney 2009) and to evaluate contamination at Washington Navy Yard (CH2M Hill 2011a). Fish sampling will be coordinated to address the data needs of all three investigations (ERA, HHRA, and NRDA) to the extent possible. Fish fillets of the species and sizes allowable under angling regulations were collected under a separate DDOE effort in 2013; those data will be used to evaluate exposure in the HHRA. Whole fish of species and sizes representative of food sources for birds and mammals will be sampled for the ERA to support food chain analyses. All fish data will be used in the NRDA. Benthic and epibenthic invertebrates will also be collected from numerous locations in the Anacostia River, principally to support the ERA and NRDA. The body burden of benthic and epibenthic invertebrates is an important line of evidence in the ERA for three reasons: (1)

Remedial Investigation Work Plan Anacostia River Sediments Project
67
invertebrates are key components of the ecological food web; (2) they are directly exposed to both sediment and water; and (3) they are known to bioaccumulate contaminants. If available, turtle and crayfish tissue concentrations will also be evaluated in the HHRA. As discussed in Section 5.2, a large number of sample locations is required to achieve adequate spatial coverage of the project area.
4.2.7.4 Sediment Geotechnical Properties
Insufficient data regarding the engineering properties of the sediment are currently available. Geotechnical data are necessary in the evaluation of remedial alternatives analysis and design. The data will be used to determine the range of equipment and the capacity of the sediments to support such equipment. Specific analysis parameters will include Atterberg limits, percent solids, and specific gravity. Additional engineering property tests, such as in-situ shear strength, laboratory consolidation, column settling, or column consolidation may also be required during later project phases.
4.3 Sources, Pathways, and Source Control The sampling and other characterization activities discussed in this plan will focus on closing data gaps identified regarding contaminant sources, migration pathways, and source control. Potential sources addressed by the investigation are discussed in Section 4.3.1. Source control efforts and remaining data gaps are discussed in Sections 4.3.2 and 4.3.3.
4.3.1 Potential Sources As noted in the CSM discussion in Section 3, the most significant potentially ongoing sources of sediment contamination to the tidal Anacostia River are the environmental sites, CSS outfalls, MS4 outfallss, and tributaries which collectively deliver dissolved PCBs, PAHs, pesticides, metals and suspended sediments laden with these contaminants and pathogenic bacteria. In addition, these constituents in surface water in both total and dissolved phases are hazardous to biota, human ingestion, and human contact.
4.3.2 Institutional and Source Control Efforts Institutional control efforts include the imposition of an advisory for human consumption of fish from the Anacostia River. The source control efforts that have so far been implemented include localized hydraulic control of contaminated groundwater discharge and the DC Water Capitol project directed at curbing CSS outfall discharges.
An institutional control that has been in place since 1989 is the issuance of a fish consumption advisory. The advisory was issued in response to observed levels of PCB and chlordane that exceeded Food and Drug Administration action levels. Through signage, web-postings, and other means, the District government conducts an active campaign to warn anglers of the hazards of consuming fish from the river. However, frequently, the warnings are unheeded by the general population.
The characterization of the nature and extent of contaminated groundwater is underway or in the planning phase for many of the environmental cleanup sites that border the river and, in some cases, groundwater source control measures have been implemented. A groundwater pump and treat system has been operating since 1976 and dense nonaqueous phase liquid (DNAPL) recovery has been occurring at the WGL East Station since 1995. In addition, groundwater pump and treat remediation and NAPL
Remedial Investigation Work Plan Anacostia River Sediments Project
68
recovery was conducted at the former Steuart Petroleum Company facility located on the western shoreline of the Anacostia River adjacent to South Capitol Street Bridge. Depending on the results of planned or ongoing investigations at the Washington Navy Yard and the other sites along the river, additional groundwater remediation operations may be conducted.
An additional source control effort is the ongoing DC Water project to minimize CSS outfall discharges through the containment and treatment of storm water flows. As a result of inadequate storm water and sewage system infrastructure, CSS outfall discharges have been sources of contamination to the river for decades. As noted in Section 3.1.2.2, in accordance with a 2004 consent decree between EPA and DC Water, DC Water has developed the Long Term Control Plan for addressing CSS outfall discharges. As part of this plan, DC Water initiated construction in 2011 on a tunnel and pumping system that will substantially reduce CSS outfall discharges by collecting and storing excess storm water flows for treatment at the Blue Plains facility (DC Water 2012).
4.3.3 Data Gap Assessment for Contaminant Sources Data gaps exist regarding sources, pathways, and source control, as discussed previously. Data gaps associated with tissue concentrations in invertebrates and fish were discussed previously (Section 4.2.5). Data gaps regarding the potentially significant sources of groundwater contamination will be addressed through the investigation and remediation of the environmental cleanup sites. With regard to sources of contaminated sediment and surface water, a major focus of the sampling planned for the RI will be to characterize the potential contributions from the various outfalls and tributaries.
4.4 Define Sediment Management AreasBased on preliminary analysis of the physical site conditions and waterway setting, sediment management during the RI will be defined for the river reaches as shown in Figure 4.1. The reaches are defined on a preliminary basis consistent with observations regarding site geography; final sediment area designations will be based on further evaluation and discussion with DDOE. The reaches are defined consistent with the study area subdivisions presented in Section 4.2.

PEPCO
Poplar Point
Kenilworth Park Landfill North
Washington Navy YardSoutheast
Federal Center
Kenilworth ParkLandfill South
Washington Gas
CSX
CSX
Former Hess Oil Corporation and
Gulf Oil CorporationBulk Oil Facilities
Steuart Petroleum
Firth-SterlingSteel
JBABJBABJBABJoint BaseAnacostia-Bolling
Fort McNair
(R1)
(WC)(R2)
(R3)
(R6)
(KL)
(R7)
(R4)
(KL)
(R5) Piney Run
Watts Branch
Nash Ru n
Dueling Creek
Pope Branch
Hickey Run
Fort Dupont Creek
Northwest Branch Anacostia River
Northeast B
ranch Anacostia
Rive
r
Lower Beaverdam Creek
LegendSEDIMENT STUDY AREA
CLEANUP SITE BOUNDARY(LAND BASED PORTION)
WASHINGTON DC BOUNDARY
RIVER REACH
WASHINGTON CHANNEL
(R1) - S. CAPITOL ST BRIDGE TO MOUTH OF RIVER
(R2) - 11TH ST. BRIDGE TO S. CAPITOL ST BRIDGE
(R3) - CSX BRIDGE TO 11TH ST. BRIDGE
(R4) - E. CAPITOL ST BRIDGE TO CSX BRIDGE
(R5) - BENNING RD. BRIDGE TO E. CAPITOL ST BRIDGE
(R6) - AMTRAK BRIDGE TO BENNING RD. BRIDGE
(R7) - UPPER TIDAL LIMIT TO AMTRAK BRIDGE
KINGMAN LAKE
®0 1,500 3,000
FeetSOURCE: MODIFIED FROM DCGIS, 2012.
FIGURE 4.1LOCATIONS OF RIVER REACHES
Dat
e Sa
ved:
5/1
4/20
14 1
:20:
06 P
M U
ser:
joel
.pet
ers
Pat
h: S
:\CA
DD
\S\2
592\
mxd
\Wor
kPla
n\Fi
gure
_04_
01_A
naco
stia
_11x
17_R
EA
CH
_SE
GM
EN
TS.m
xd
DRAFTNote: The Cleanup Site Boundaries (Land Based Portion) for the Washington Navy Yard are reflective of its historic extent.
M A R Y L A N D
M A R Y L A N D
V I R G
I N I A
11th Street Bridge
PennsylvaniaAvenue SE Bridge
CSXBridge
East CapitolStreet Bridge
Benning RoadBridge
New York Ave/Amtrak Bridge
South CapitolStreet Bridge
KingmanLake
Anacostia RiverNortheast Branch
Anacostia RiverNorthwest Branch
LowerBeaverdamCreek
KingmanIsland
POTOMAC RIVER
ANACOSTIA
RIV
ER
DuelingCreek
ANACOSTIA RIVERSEDIMENTS PROJECT
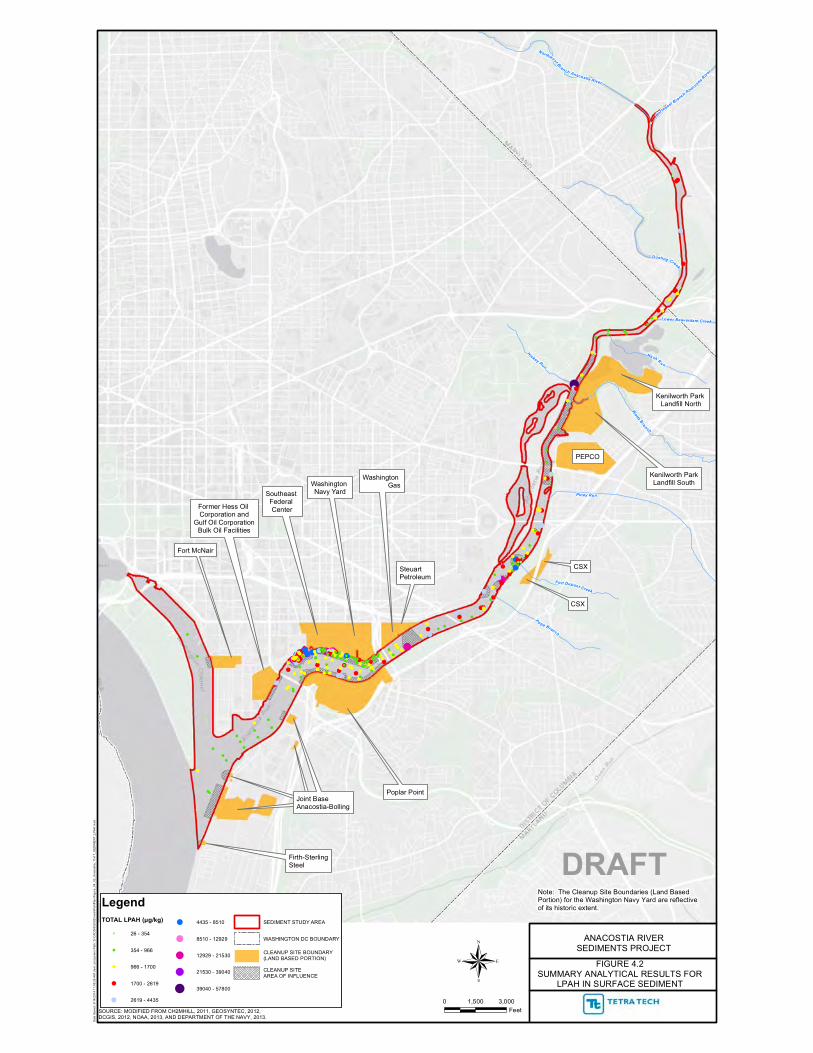
PEPCO
Poplar Point
Kenilworth Park Landfill North
Washington Navy YardSoutheast
Federal Center
Kenilworth ParkLandfill South
Washington Gas
CSX
CSX
Former Hess Oil Corporation and
Gulf Oil CorporationBulk Oil Facilities
Steuart Petroleum
Firth-SterlingSteel
JBABJBABJBABJoint BaseAnacostia-Bolling
Fort McNair
!
!!! !!!
!
!
!!
!!!!!! !
!!! !!
!!!!!!! !!!
!!!!!!!!
!!
!!!!!!!!
!!!!!
!
!
!!!
!
!
!!!!
!
!
!
!!!
!
!
!
!
!!!!
!
!!
!
!
!
!
!
!
!!
!
!
!!!
!
!!!
!!
!
!
!!!
!
!
!
!
!
!
!
!
!
!
!
!
!
!
!
!
!
!
!
!
!
!
!
!
!!
!
!
!
!
!
!
! !
!
!
!
!
!
!
!
!
!
!
!
!
! !
!
!
!!
!
!
!!
!
!
!
!
!
!
!
!
!
!
!
!!
!!
!
!
!
!
!!
!
!
!!
!
!
!!
!
!
!
!
!
!
!
!
!
!
!
!
!
!
!
!
!
!
!
!
!
!
!
!
!!
!
!
!
!
!
!
!!!
!
! !
!!
!
!
!
!
!
! !
!
!
!
!
!
!
!
!
!! !
! !
!
!
!
!
!
!!
!
!
!
!!
!
!
!
!
!
!
!
!
!
!
!
!
!
!
!
! !
!
!
!
!
!
! !!
!
!
!
!
!
!
!
!
!
!
!
!
!
!
!
!
!
!
!
!
!
!
!
!
!
!
!
!
!
!
!
!
!
!
!
Piney Run
Watts Branch
Nash Ru n
Dueling Creek
Pope Branch
Hickey Run
Fort Dupont Creek
Northwest Branch Anacostia River
Northeast B
ranch Anacostia
Rive
r
Lower Beaverdam Creek
LegendTOTAL LPAH (μg/kg)
! 26 - 354
! 354 - 966
! 966 - 1700
! 1700 - 2619
! 2619 - 4435
! 4435 - 8510
! 8510 - 12929
! 12929 - 21530
! 21530 - 39040
! 39040 - 57800
SEDIMENT STUDY AREA
WASHINGTON DC BOUNDARY
CLEANUP SITE BOUNDARY(LAND BASED PORTION)
CLEANUP SITEAREA OF INFLUENCE ®
0 1,500 3,000Feet
FIGURE 4.2SUMMARY ANALYTICAL RESULTS FOR
LPAH IN SURFACE SEDIMENT
Dat
e Sa
ved:
5/1
4/20
14 1
1:59
:28
AM
Use
r: jo
el.p
eter
s P
ath:
S:\C
AD
D\S
\259
2\m
xd\W
orkP
lan\
Figu
re_0
4_02
_Ana
cost
ia_1
1x17
_SED
IME
NT_
LPA
H.m
xd
SOURCE: MODIFIED FROM CH2MHILL, 2011, GEOSYNTEC, 2012,DCGIS, 2012, NOAA, 2013, AND DEPARTMENT OF THE NAVY, 2013.
Note: The Cleanup Site Boundaries (Land Based Portion) for the Washington Navy Yard are reflective of its historic extent.
DRAFT
ANACOSTIA RIVERSEDIMENTS PROJECT

PEPCO
Poplar Point
Kenilworth Park Landfill North
Washington Navy YardSoutheast
Federal Center
Kenilworth ParkLandfill South
Washington Gas
CSX
CSX
Former Hess Oil Corporation and
Gulf Oil CorporationBulk Oil Facilities
Steuart Petroleum
Firth-SterlingSteel
JBABJBABJBABJoint BaseAnacostia-Bolling
Fort McNair
!
! !!!!
!
!
! !!! !
!
!!
!
!
!!!!!! !
!
!!!!!!!!!!
!!!!!
!
!
!
!
!
!!!!!!!
!
!
!!
!
!!!!!!
!
!
!
!!!!!
!
!!
!
!!!!!!
!!
!
!!
!
!!
!
!
!!
!
!
!! !
! !! !
!
!
!
!
!
!
!
!!
!
!
!!
!
!
!
!
!
!! !!
!
!
!
!
!
!
!!
!!
!
!
!
!
!
!
!
!
!!!
!
!
!
!
!
!
!
!!
!
!!
!
!
!
!
!
! !
!
!
!
!
!
!
!
! !! !
!!
!
!!
!
!!
!
!
!
!
!
!
!
!!!!!
!!
!
!
!
!
!
!
!
!
!!
!!
!
!
!
!
!
!
!
!
! !
!
!
!
!
!
!
!
!
!
!
!
!
!
!
!
!!
!
!
!
! !
!
!
!
!
!
!
!
!
!
!
!
!
!
!
!
! !
!
!
!
!
!
!
!
!
!
!
! !!
!
!
!
!
!
!!
!
!
!
!
!
!
!
!
!
!
!
!
!
!
!
!
!
!
!
!
!
!
!
!
!
!
!
!
!
!
!
!
!
!
!
!
!
!
!
!
!
!
!
!
!
!
!
!!
Piney Run
Watts Branch
Nash Ru n
Dueling Creek
Pope Branch
Hickey Run
Fort Dupont Creek
Northwest Branch Anacostia River
Northeast B
ranch Anacostia
Rive
r
Lower Beaverdam Creek
LegendTOTAL PAH (μg/kg)
! 169 - 3662
! 3662 - 6942
! 6942 - 9926
! 9926 - 13931
! 13931 - 18064
! 18064 - 22398
! 22398 - 27740
! 27740 - 36770
! 36770 - 49360
! 49360 - 110567
SEDIMENT STUDY AREA
WASHINGTON DC BOUNDARY
CLEANUP SITE BOUNDARY(LAND BASED PORTION)
CLEANUP SITEAREA OF INFLUENCE ®
0 1,500 3,000Feet
FIGURE 4.3SUMMARY ANALYTICAL RESULTS FOR
TOTAL PAH IN SURFACE SEDIMENT
Dat
e Sa
ved:
5/1
4/20
14 1
:25:
37 P
M U
ser:
joel
.pet
ers
Pat
h: S
:\CA
DD
\S\2
592\
mxd
\Wor
kPla
n\Fi
gure
_04_
03_A
naco
stia
_11x
17_S
ED
IME
NT_
PAH
.mxd
DRAFT
SOURCE: MODIFIED FROM CH2MHILL, 2011, GEOSYNTEC, 2012,DCGIS, 2012, NOAA, 2013, AND DEPARTMENT OF THE NAVY, 2013.
Note: The Cleanup Site Boundaries (Land Based Portion) for the Washington Navy Yard are reflective of its historic extent.
ANACOSTIA RIVERSEDIMENTS PROJECT
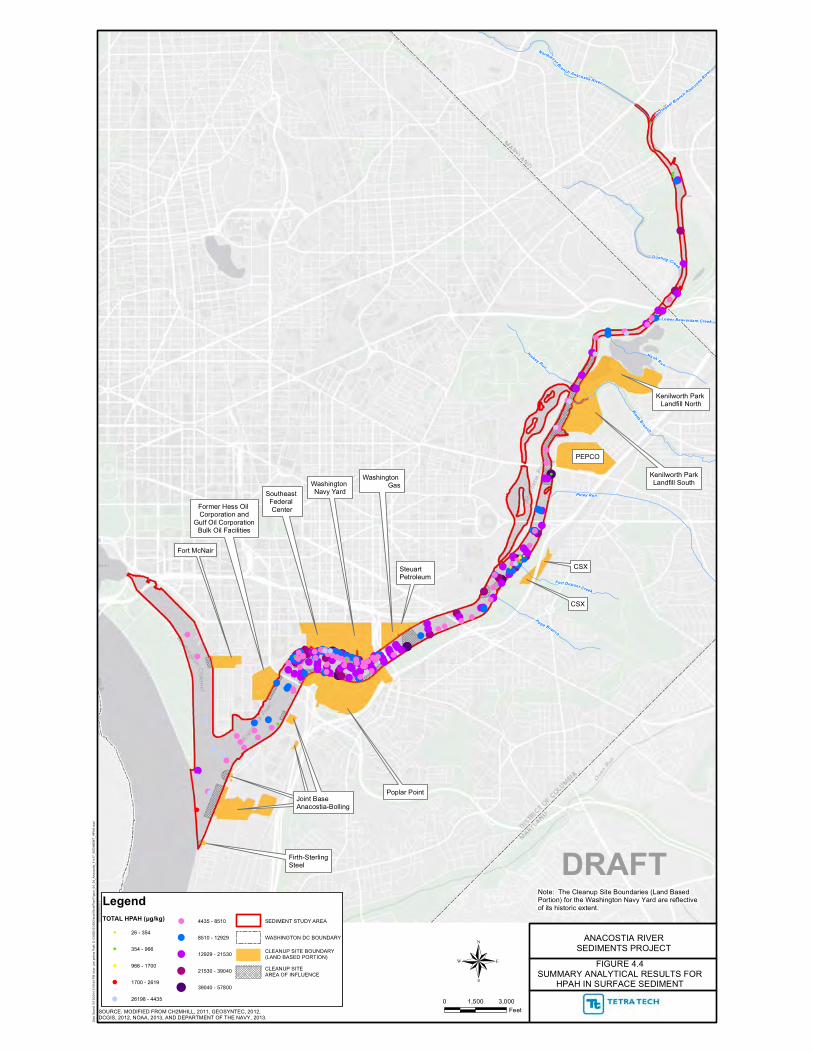
PEPCO
Poplar Point
Kenilworth Park Landfill North
Washington Navy YardSoutheast
Federal Center
Kenilworth ParkLandfill South
Washington Gas
CSX
CSX
Former Hess Oil Corporation and
Gulf Oil CorporationBulk Oil Facilities
Steuart Petroleum
Firth-SterlingSteel
JBABJBABJBABJoint BaseAnacostia-Bolling
Fort McNair
!!
!!
!
! !!
!
!
!!
!
!!!
!
!!!!!!!!!!!!!! !!!
!
!
!
!
!!
!!
!
!
!
!
!!
!
!!!!
!
!!
!
!!!! !!!
!!
!
!!
!
!!
!!! !
!
!!
!!!
!
!!!
!
! !!
!
!
!!
!!! !
!
!
!!!
!!
!!
!
!
!
!!
!!!! !
!
!
!
!
!
!
!
!
!
!!
!
!
!!!
!
!
!
!
!! !
!
!
!!
!
!
!
!
! !!!
!
!
!
!
!
!
!
!
!
!
! !
!
!
!
!
!!
!!
!
!
!
!
!
!
!!
!
!
!
!
!! !!
!
!!!
!
!
!!!!
!
!
!
!
!
!
!
!
!
!
!!
!
!!
!
!
!! !!
!
!
!
!!
!
!
!
!
!
!
!
! !!
!
!!
!
!!!!
!
!!
!
!
!
!
!
!!
!
!
!
!
! !
!
!
!
!
!
! !!!
!
!
!!!
!!
!
!
!
! !
!
!
!
!
!
!
!
!
!
!
!
!!
!
!
!
!
!
!
!
!!
!
!
!
!
!
!
!
!
!
!
!
!!
!
!
!!
!
!
!
!
!
!
!
Piney Run
Watts Branch
Nash Ru n
Dueling Creek
Pope Branch
Hickey Run
Fort Dupont Creek
Northwest Branch Anacostia River
Northeast B
ranch Anacostia
Rive
r
Lower Beaverdam Creek
LegendTOTAL HPAH (μg/kg)
! 26 - 354
! 354 - 966
! 966 - 1700
! 1700 - 2619
! 26198 - 4435
! 4435 - 8510
! 8510 - 12929
! 12929 - 21530
! 21530 - 39040
! 39040 - 57800
SEDIMENT STUDY AREA
WASHINGTON DC BOUNDARY
CLEANUP SITE BOUNDARY(LAND BASED PORTION)
CLEANUP SITEAREA OF INFLUENCE ®
0 1,500 3,000FeetSOURCE: MODIFIED FROM CH2MHILL, 2011, GEOSYNTEC, 2012,
DCGIS, 2012, NOAA, 2013, AND DEPARTMENT OF THE NAVY, 2013.
FIGURE 4.4SUMMARY ANALYTICAL RESULTS FOR
HPAH IN SURFACE SEDIMENT
Dat
e Sa
ved:
5/1
3/20
14 5
:09:
44 P
M U
ser:
joel
.pet
ers
Pat
h: S
:\CA
DD
\S\2
592\
mxd
\Wor
kPla
n\Fi
gure
_04_
04_A
naco
stia
_11x
17_S
ED
IME
NT_
HPA
H.m
xd
Note: The Cleanup Site Boundaries (Land Based Portion) for the Washington Navy Yard are reflective of its historic extent.
DRAFT
ANACOSTIA RIVERSEDIMENTS PROJECT

PEPCO
Poplar Point
Kenilworth Park Landfill North
Washington Navy YardSoutheast
Federal Center
Kenilworth ParkLandfill South
Washington Gas
CSX
CSX
Former Hess Oil Corporation and
Gulf Oil CorporationBulk Oil Facilities
Steuart Petroleum
Firth-SterlingSteel
JBABJBABJBABJoint BaseAnacostia-Bolling
Fort McNair
!!
!!!! !!!!!!
!
!!!
!!
!
!
!
!
!!!
!
!
!
!
!
!
!
!
!
!
!
!
!
!
!
!
!
!
!
!!
!
!
!
!
!
!
!
!!
!
!
!
!
!
!
!
!
!
!
!
!! !
!
!
!
!
!
!
!
!
!
!
!
!
!
!
!
!
!
!
!
!
!
!
!
!
!
!
!
!
!
!!
!
!
!
!
!
!
!
!
!
!
!
!
!
!
!
!
!
!
!
!
!
!
!
!!
!
!
!
!
!
!!
!
!
!
!!
!
!
!
!
!
!
!
!
!
!
!
!
!
!
!
!
!
!
!
!
!
!
!
!
!
!
!
!!
!
!
!
!
!
!
!
!
!
!
!
!
!
!
!
!
!
!
!
!
!
!
!
!
!!
!
!
!
!
!
!
! !
!
!
!
!
!!
!
!!
Piney Run
Watts Branch
Nash Ru n
Dueling Creek
Pope Branch
Hickey Run
Fort Dupont Creek
Northwest Branch Anacostia River
Northeast B
ranch Anacostia
Rive
r
Lower Beaverdam Creek
LegendTOTAL PCBS (μg/kg)
! 0.88 - 177.00
! 177.00 - 538.44
! 538.44 - 1310.91
! 1310.91 - 2617.70
! 2617.70 - 6549.80
SEDIMENT STUDY AREA
WASHINGTON DC BOUNDARY
CLEANUP SITE BOUNDARY(LAND BASED PORTION)
CLEANUP SITEAREA OF INFLUENCE ®
0 1,500 3,000FeetSOURCE: MODIFIED FROM CH2MHILL, 2011, GEOSYNTEC, 2012,
DCGIS, 2012, NOAA, 2013, AND DEPARTMENT OF THE NAVY, 2013.
FIGURE 4.5SUMMARY ANALYTICAL RESULTS FORTOTAL PCBS IN SURFACE SEDIMENT
Dat
e Sa
ved:
5/1
4/20
14 1
:30:
43 P
M U
ser:
joel
.pet
ers
Pat
h: S
:\CA
DD
\S\2
592\
mxd
\Wor
kPla
n\Fi
gure
_04_
05_A
naco
stia
_11x
17_S
ED
IME
NT_
TOTA
LPC
BS
.mxd
Note: The Cleanup Site Boundaries (Land Based Portion) for the Washington Navy Yard are reflective of its historic extent.
DRAFT
ANACOSTIA RIVERSEDIMENTS PROJECT

!
!
!!
!
!
!!!
!
!!!
!
!
!
!
!
!!
!
!
!
!
!
!!!!
!!!
!!
!
!
!
!
!
!
!
!
!
!
!
!!
!
! !
!
!!
!
!
!!
! !
!
!!!!
!
!
!
!
!
!!!
!
!
!
!
!
!
!
!
!
!
!
!
! !!
!
!
!!
!
!
!
!
!
!
!
!!
!
!
!
! !
!
!
!
!
!
!
!
!
!
!
!
!
!
!
!
!
!
!
!
!
!!!! !
!
!
!
!
!
!
!!!
!
!
!!!
!
!
!
!! !! !
!
!
!
!
!!
!! !
!
!
!
! !
!
!!
!
!!
!
!
!
!
!
!
!!
!
!
((
((((
(
(
(
(
PEPCO
Poplar Point
Kenilworth Park Landfill North
Washington Navy YardSoutheast
Federal Center
Kenilworth ParkLandfill South
Washington Gas
CSX
CSX
Former Hess Oil Corporation and
Gulf Oil CorporationBulk Oil Facilities
Steuart Petroleum
Firth-SterlingSteel
JBABJBABJBABJoint BaseAnacostia-Bolling
Fort McNair
Piney Run
Watts Branch
Nash Ru n
Dueling Creek
Pope Branch
Hickey Run
Fort Dupont Creek
Northwest Branch Anacostia River
Northeast B
ranch Anacostia
Rive
r
Lower Beaverdam Creek
Legend( NON-DETECT
CHLORDANE, BETA- (μg/kg)
! 0.170 - 0.179
! 0.179 - 3.24
! 3.24 - 10.00
! 10.00 - 15.00
! 15.00 - 30.91
! 30.91 - 66.12
SEDIMENT STUDY AREA
WASHINGTON DC BOUNDARY
CLEANUP SITE BOUNDARY(LAND BASED PORTION)
CLEANUP SITEAREA OF INFLUENCE
®0 1,500 3,000
FeetSOURCE: MODIFIED FROM CH2MHILL, 2011, GEOSYNTEC, 2012,DCGIS, 2012, NOAA, 2013, AND DEPARTMENT OF THE NAVY, 2013.
FIGURE 4.6SUMMARY ANALYTICAL RESULTS FOR
BETA CHLORDANE IN SURFACE SEDIMENT
Dat
e Sa
ved:
5/1
4/20
14 1
:31:
57 P
M U
ser:
joel
.pet
ers
Pat
h: S
:\CA
DD
\S\2
592\
mxd
\Wor
kPla
n\Fi
gure
_04_
06_A
naco
stia
_11x
17_S
ED
IME
NT_
BET
AC
HLO
RD
AN
E.m
xd
DRAFTNote: The Cleanup Site Boundaries (Land Based Portion) for the Washington Navy Yard are reflective of its historic extent.
ANACOSTIA RIVERSEDIMENTS PROJECT
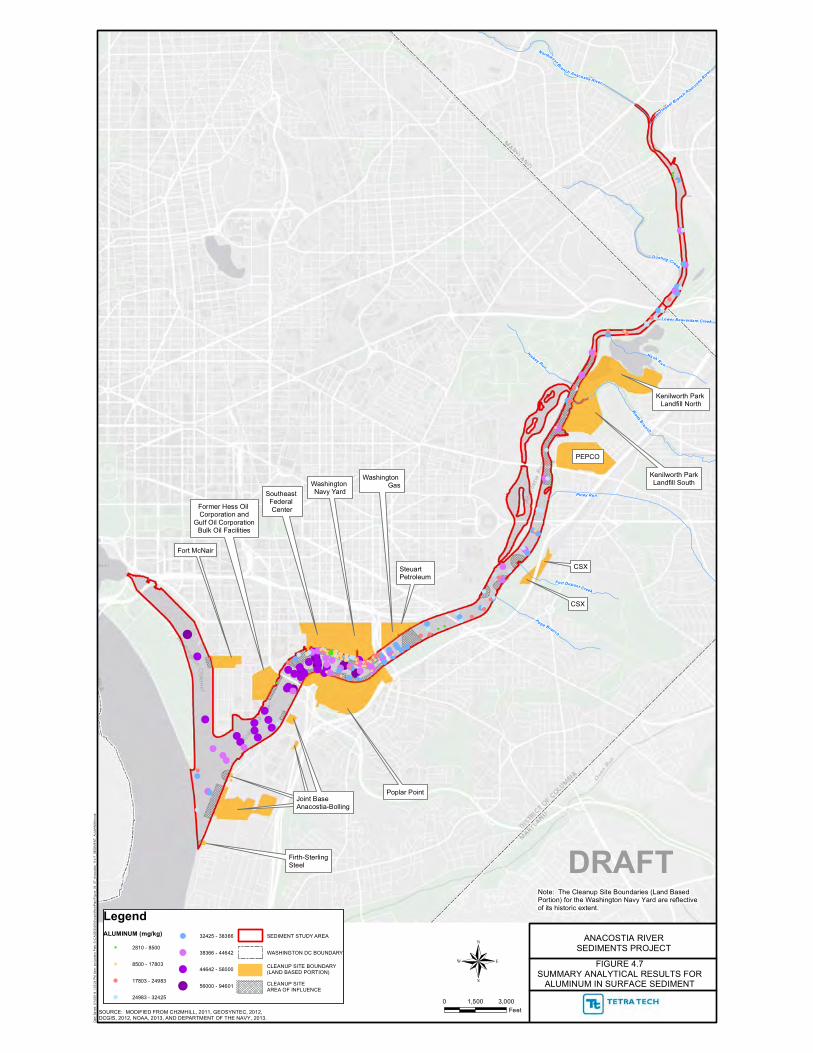
PEPCO
Poplar Point
Kenilworth Park Landfill North
Washington Navy YardSoutheast
Federal Center
Kenilworth ParkLandfill South
Washington Gas
CSX
CSX
Former Hess Oil Corporation and
Gulf Oil CorporationBulk Oil Facilities
Steuart Petroleum
Firth-SterlingSteel
JBABJBABJBABJoint BaseAnacostia-Bolling
Fort McNair
!
!
!! !
!
!
!
!
!
!!
!
!
!
!
!
!
!
!
!!
!
!!!
!!
!!
!
!
!
!
!
!!!
!!
!
!
!
!
!!
!
!
!
!!
!
!
!
!!!
!
!
!
!
!
!
!
!
!
!
!!!
!
!
!
!
!
!
!
!!
!
!
!
!
!
!
!
!
!
!
!!
!
!
!!
!
!
!
!
!
!
!!
!
!
!
!
!
!
!
!
!
!
!
!
!
!
!
!!
!
!
!
!
!
!
!
!!
!
!
!
!
!
!
!!
!
!
!
!
!
!
!
!
!
!
!
!!
!
!
!
!
!
!
!
!
!
!
!
!
!
!
!
!
!
!!
!! !
!
!!
!! !!
!
!
!!
!
!!
!
! !!!
!
!
!!
!
!!
!
!
!
!!
!
!!
!!
!
!
!!
!
!
!
!
!!!!
Piney Run
Watts Branch
Nash Ru n
Dueling Creek
Pope Branch
Hickey Run
Fort Dupont Creek
Northwest Branch Anacostia River
Northeast B
ranch Anacostia
Rive
r
Lower Beaverdam Creek
LegendALUMINUM (mg/kg)
! 2810 - 8500
! 8500 - 17803
! 17803 - 24983
! 24983 - 32425
! 32425 - 38366
! 38366 - 44642
! 44642 - 56000
! 56000 - 94601
SEDIMENT STUDY AREA
WASHINGTON DC BOUNDARY
CLEANUP SITE BOUNDARY(LAND BASED PORTION)
CLEANUP SITEAREA OF INFLUENCE
®0 1,500 3,000
FeetSOURCE: MODIFIED FROM CH2MHILL, 2011, GEOSYNTEC, 2012,DCGIS, 2012, NOAA, 2013, AND DEPARTMENT OF THE NAVY, 2013.
FIGURE 4.7SUMMARY ANALYTICAL RESULTS FOR
ALUMINUM IN SURFACE SEDIMENT
Dat
e Sa
ved:
5/1
4/20
14 1
:35:
24 P
M U
ser:
joel
.pet
ers
Pat
h: S
:\CA
DD
\S\2
592\
mxd
\Wor
kPla
n\Fi
gure
_04_
07_A
naco
stia
_11x
17_S
ED
IME
NT_
ALU
MIN
UM
.mxd
DRAFTNote: The Cleanup Site Boundaries (Land Based Portion) for the Washington Navy Yard are reflective of its historic extent.
ANACOSTIA RIVERSEDIMENTS PROJECT
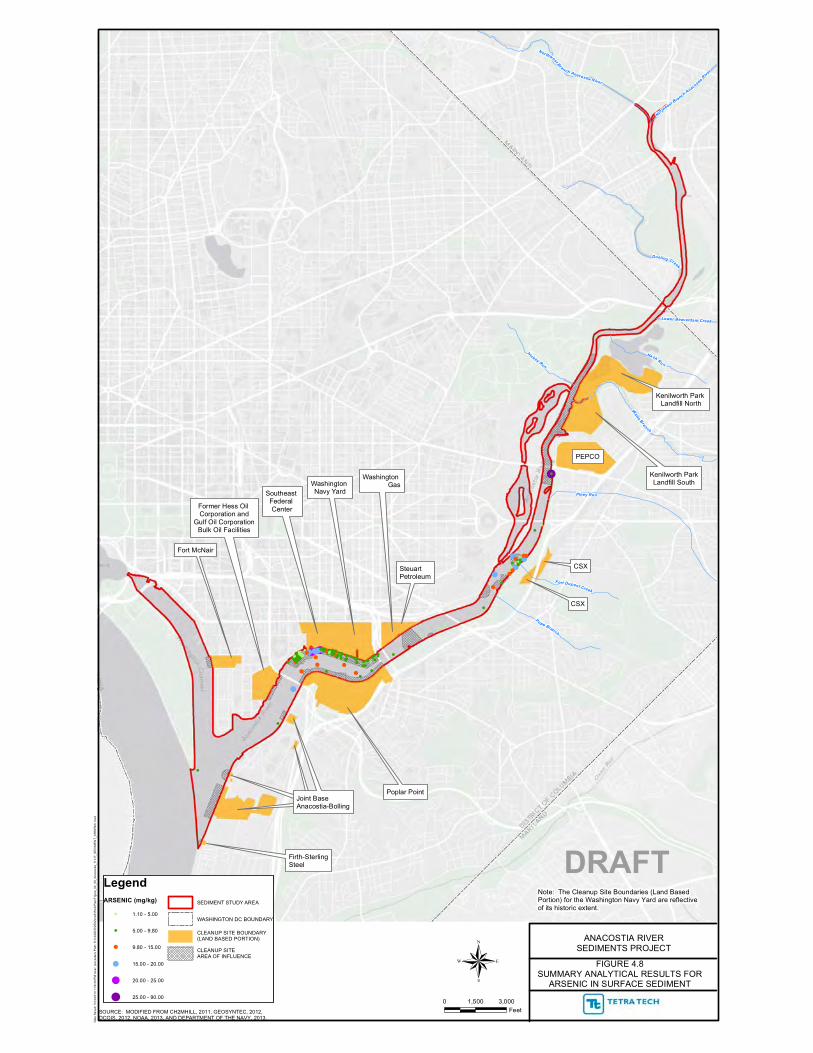
!
!!!!!
!!
!
!
!
!
!
!
!
!
!!
!! !
!
!
!
!
!!
!!
!
!!
!
!
!
!!
!!!
!
!
!!
!
!!
!!
!!!!
!
!!!
!
!!
!!
!
!!!
!!
!
!!
!!! !
!
!!
!
!!
!!!!
!
!
!!
!!!
!!!
! !
!!
!
!
!
!
!
!
!!
!
!!!
!
!
!!!
!
!
!
!
!!
!!
!
!
!!!!
!!
!
!!!
!
!!
!! !
!
!
!
!
!!
! !!
!
!
!
!
!
!!!
!
!
!
!
!
!
!
!!!!!!!
!
!
!
!
!
!
!
!
!
!
!!
!
!
!
!
!!
PEPCO
Poplar Point
Kenilworth Park Landfill North
Washington Navy YardSoutheast
Federal Center
Kenilworth ParkLandfill South
Washington Gas
CSX
CSX
Former Hess Oil Corporation and
Gulf Oil CorporationBulk Oil Facilities
Steuart Petroleum
Firth-SterlingSteel
JBABJBABJBABJoint BaseAnacostia-Bolling
Fort McNair
Piney Run
Watts Branch
Nash Ru n
Dueling Creek
Pope Branch
Hickey Run
Fort Dupont Creek
Northwest Branch Anacostia River
Northeast B
ranch Anacostia
Rive
r
Lower Beaverdam Creek
LegendARSENIC (mg/kg)
! 1.10 - 5.00
! 5.00 - 9.80
! 9.80 - 15.00
! 15.00 - 20.00
! 20.00 - 25.00
! 25.00 - 90.00
SEDIMENT STUDY AREA
WASHINGTON DC BOUNDARY
CLEANUP SITE BOUNDARY(LAND BASED PORTION)
CLEANUP SITEAREA OF INFLUENCE ®
0 1,500 3,000FeetSOURCE: MODIFIED FROM CH2MHILL, 2011, GEOSYNTEC, 2012,
DCGIS, 2012, NOAA, 2013, AND DEPARTMENT OF THE NAVY, 2013.
FIGURE 4.8SUMMARY ANALYTICAL RESULTS FOR
ARSENIC IN SURFACE SEDIMENT
Dat
e Sa
ved:
5/1
4/20
14 1
:36:
40 P
M U
ser:
joel
.pet
ers
Pat
h: S
:\CA
DD
\S\2
592\
mxd
\Wor
kPla
n\Fi
gure
_04_
08_A
naco
stia
_11x
17_S
ED
IME
NT_
AR
SE
NIC
.mxd
DRAFTNote: The Cleanup Site Boundaries (Land Based Portion) for the Washington Navy Yard are reflective of its historic extent.
ANACOSTIA RIVERSEDIMENTS PROJECT

!
!!! !!!!!! !! !!!
!
!!!!!!!!! !!!!!!!!!!
!
!!!
!
!!
!
!!!!!
!
!!
!
!
!
!!
!!!
!!
!
!
!
!!!
!!
! !!
!!
!!
!
!
!!
!
!!!!!
!
!!
!
!
!
!
!
!
!
!!
!
!
!
!
!
!
!
!
!! !
!!!
!
!!
!
!
!!
!
!!
!
!
!
!
!
!
!
!
!
!
!
!
!!
!
!
!
!
!
!
!!!!
!
!
!
!
!
!
!
!
!
!
!!! !!!! !
!
!!
!
!
!
!
!
!
!!
!!
!
!
!
!
!
!
!
!
!
!
!
!
!
! !!
!! !
!!
!
!
!
!
!
!
!
!
!
!
!!
!!
!!!
!!
!
!
!
!
!
!
!
!
!
!
!
!!
!
!
!
!!!
!!
!
!
!
!
!
! !
!
!
!
!
!
!
!
!
!
!
!
!
!
!
!
!
!
!!
!
!
!
!
!
!
!
!
!
!
!
!
!! !
!
!!!!!
!
!
!
!
! !!
!
!
!
!
!
!
!
!
!
!
!
!
!
!
!
!
!
!
!
!
!
!
!
!
!
!!
!
!!
PEPCO
Poplar Point
Kenilworth Park Landfill North
Washington Navy YardSoutheast
Federal Center
Kenilworth ParkLandfill South
Washington Gas
CSX
CSX
Former Hess Oil Corporation and
Gulf Oil CorporationBulk Oil Facilities
Steuart Petroleum
Firth-SterlingSteel
JBABJBABJBABJoint BaseAnacostia-Bolling
Fort McNair
Piney Run
Watts Branch
Nash Ru n
Dueling Creek
Pope Branch
Hickey Run
Fort Dupont Creek
Northwest Branch Anacostia River
Northeast B
ranch Anacostia
Rive
r
Lower Beaverdam Creek
LegendCADMIUM (mg/kg)
! 0.043 - 0.88
! 0.88 - 0.99
! 0.99 - 2.60
! 2.60 - 4.65
! 4.65 - 8.20
! 8.20 - 30.00
SEDIMENT STUDY AREA
WASHINGTON DC BOUNDARY
CLEANUP SITE BOUNDARY(LAND BASED PORTION)
CLEANUP SITEAREA OF INFLUENCE ®
0 1,500 3,000FeetSOURCE: MODIFIED FROM CH2MHILL, 2011, GEOSYNTEC, 2012,
DCGIS, 2012, NOAA, 2013, AND DEPARTMENT OF THE NAVY, 2013.
FIGURE 4.9SUMMARY ANALYTICAL RESULTS FOR
CADMIUM IN SURFACE SEDIMENT
Dat
e Sa
ved:
5/1
4/20
14 1
:37:
52 P
M U
ser:
joel
.pet
ers
Pat
h: S
:\CA
DD
\S\2
592\
mxd
\Wor
kPla
n\Fi
gure
_04_
09_A
naco
stia
_11x
17_S
ED
IME
NT_
CA
DM
IUM
.mxd
DRAFTNote: The Cleanup Site Boundaries (Land Based Portion) for the Washington Navy Yard are reflective of its historic extent.
ANACOSTIA RIVERSEDIMENTS PROJECT

!
!!!!
!
!
!
!
!
!
!
!
!!!
!
! !!
!
!
!!!
!
!!!
!
!
!
!
!
!
!
!
!
!
!
!
! !!
!
!
!
!
!
!
!
!!!!
!
!!
!
!!
!
!
!!
!
!
!
!
!! !
!
!!
!
!
! !
!
!
!
!! !
!
!
!
!
!
!
!
!!
!
!
!
!
!
!
!!
!!
!
!
!
!
!
!
!
!
!
!
!
! !
!
!
!
!
!
!
!
!
! !
!
!
!
!
!!
!
!!
!
!
!
!
!
!
!
!
!
!
!!
!
!
!
!
!
!
!
!!!
!
! !!
!
!
!
!
!
!!
!!!!
!
!!
!
!!!
!!
!!!
!
!
!!
!
!!
!
!
!
! ! !!
!
!!
!
!
!
!
!!
!!
!
!
!
!!!
!!
!
!
!
!!
!
!
!
!
!
!
!!!!!
!! !
!
!
!
!
!
!
!
!
!
!
!
!!
!
!!
!!
!!
!!
!
!
!!!
!
!
!
!
!!
!
!
!
!
!
!
!
!
!
!
!
!!
!
!
!
!
!
!
! !!
!
!!
!
!
!
!
!
!
!!
!
!!!
!
!
!
!!
!
!
!
!
!
!
!
!!
!
!
!!
PEPCO
Poplar Point
Kenilworth Park Landfill North
Washington Navy YardSoutheast
Federal Center
Kenilworth ParkLandfill South
Washington Gas
CSX
CSX
Former Hess Oil Corporation and
Gulf Oil CorporationBulk Oil Facilities
Steuart Petroleum
Firth-SterlingSteel
JBABJBABJBABJoint BaseAnacostia-Bolling
Fort McNair
Piney Run
Watts Branch
Nash Ru n
Dueling Creek
Pope Branch
Hickey Run
Fort Dupont Creek
Northwest Branch Anacostia River
Northeast B
ranch Anacostia
Rive
r
Lower Beaverdam Creek
LegendCHROMIUM (mg/kg)
! 4.8 - 32.2
! 32.2 - 43.4
! 43.4 - 86.9
! 86.9 - 114.3
! 114.3 - 141.6
! 141.6 - 169.0
SEDIMENT STUDY AREA
WASHINGTON DC BOUNDARY
CLEANUP SITE BOUNDARY(LAND BASED PORTION)
CLEANUP SITEAREA OF INFLUENCE ®
0 1,500 3,000FeetSOURCE: MODIFIED FROM CH2MHILL, 2011, GEOSYNTEC, 2012,
DCGIS, 2012, NOAA, 2013, AND DEPARTMENT OF THE NAVY, 2013.
FIGURE 4.10SUMMARY ANALYTICAL RESULTS FOR
CHROMIUM IN SURFACE SEDIMENT
Dat
e Sa
ved:
5/1
4/20
14 1
:39:
05 P
M U
ser:
joel
.pet
ers
Pat
h: S
:\CA
DD
\S\2
592\
mxd
\Wor
kPla
n\Fi
gure
_04_
10_A
naco
stia
_11x
17_S
ED
IME
NT_
CH
RO
MIU
M.m
xd
Note: The Cleanup Site Boundaries (Land Based Portion) for the Washington Navy Yard are reflective of its historic extent.
DRAFT
ANACOSTIA RIVERSEDIMENTS PROJECT
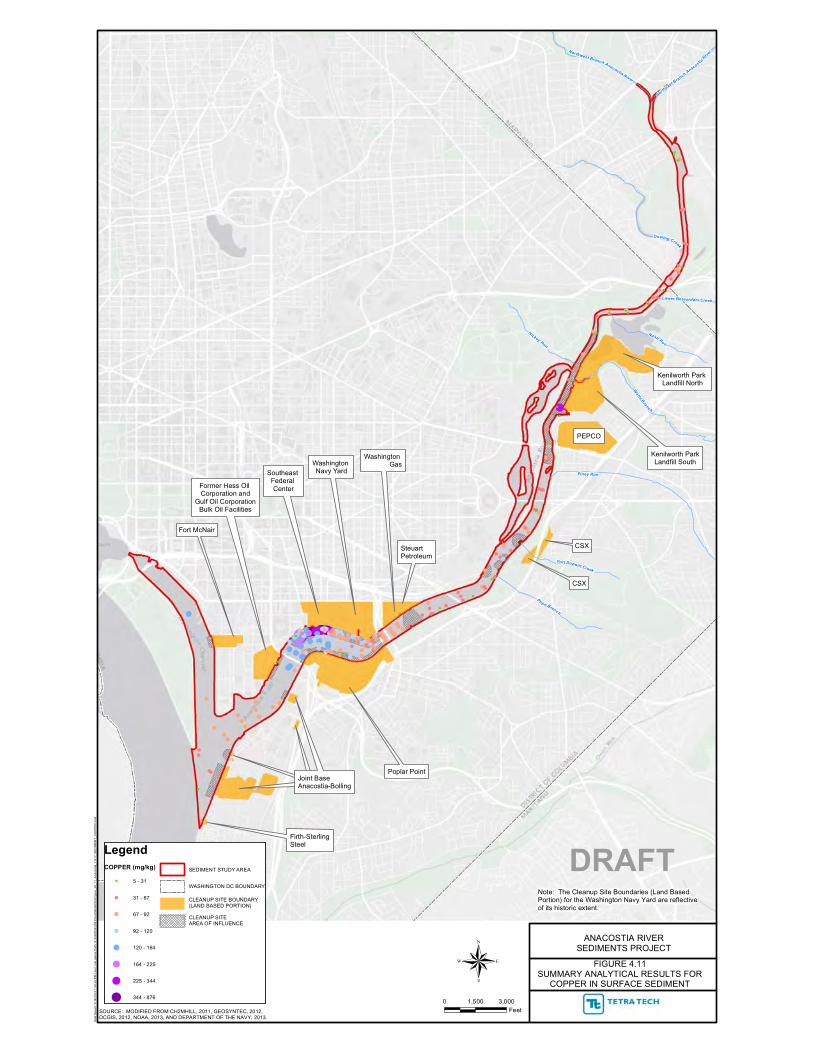
!!!!!!!! !!!
!
!!!!!!!!!!!!!!!!!!
!!!!!!!!!!!!!!!!!!
!!!!!!!!!!!!!!!!!!!!!!!! !!!
!
!!!
!!
!
!! !
!
!!!
!
!
!!
!
!
!!
!
!!
! !
!
!!!!
!!
!
! !!!!
!
!
!
!!!
!
!
!!!!
!!
!
!
!!
!
! !!
!!
!!
!!
!
!
!
!
!
!
! !
!
!
!
!
!
!
!
!!!
!
!
!
!! !
!! !
!
!
!
!
!
!
!
!
!
!
!
!
!
!
!
!
!
!
!
!
!
!
!
!
!
!
!
!
!
!!
!
!
!
!
!
!
!
!
!
!
!
!
!
!
!
!
!
!
!
!
!
!
!
!
!!
!
!
!!
!
!
!
!
!
!
!
!
!
!
!
!
!
!
!
!
!
!
!
!
!
!
!
!
!
!
!
!
!
!
!
!
!
!
!
!
!
!
!
!
!
!
!
!
!
!
!
!
!
!
!
!
!
!
!
!
!
!
!
!
!
!
!
!
!!
PEPCO
Poplar Point
Kenilworth Park Landfill North
Washington Navy YardSoutheast
Federal Center
Kenilworth ParkLandfill South
Washington Gas
CSX
CSX
Former Hess Oil Corporation and
Gulf Oil CorporationBulk Oil Facilities
Steuart Petroleum
Firth-SterlingSteel
JBABJBABJBABJoint BaseAnacostia-Bolling
Fort McNair
Piney Run
Watts Branch
Nash Run
Dueling Creek
Pope Branch
Hickey Run
Fort Dupont Creek
Northwest Branch Anacostia River
Northeast B
ranch Anacostia R
iver
Lower Beaverdam Creek
LegendCOPPER (mg/kg)
! 5 - 31
! 31 - 67
! 67 - 92
! 92 - 120
! 120 - 164
! 164 - 225
! 225 - 344
! 344 - 876
SEDIMENT STUDY AREA
WASHINGTON DC BOUNDARY
CLEANUP SITE BOUNDARY(LAND BASED PORTION)
CLEANUP SITEAREA OF INFLUENCE
®0 1,500 3,000
FeetSOURCE: MODIFIED FROM CH2MHILL, 2011, GEOSYNTEC, 2012,DCGIS, 2012, NOAA, 2013, AND DEPARTMENT OF THE NAVY, 2013.
FIGURE 4.11SUMMARY ANALYTICAL RESULTS FOR
COPPER IN SURFACE SEDIMENT
Dat
e Sa
ved:
5/1
4/20
14 1
:40:
24 P
M U
ser:
joel
.pet
ers
Pat
h: S
:\CA
DD
\S\2
592\
mxd
\Wor
kPla
n\Fi
gure
_04_
11_A
naco
stia
_11x
17_S
ED
IME
NT_
CO
PPE
R.m
xd
Note: The Cleanup Site Boundaries (Land Based Portion) for the Washington Navy Yard are reflective of its historic extent.
DRAFT
ANACOSTIA RIVERSEDIMENTS PROJECT

!!!!!! !!!!!!!!!!!!!! !!!!!!!!!
!!!!
!!
!!!!!!!!!
!!!!!!!
!!!
!!!!!!!!!!!!!!
!!!!!!!!!!!
!
!!
!!! !
!
! !!!
!
!
!! !!!
!
!
!
!
!
!!
!
!
!
!
!
!
!
!
!
!
!
!
!
!
!
!
!
!
!!!
!
!
!
!
!
!!! !
!
!
! !
!
!
!
!!
!
!
!!
!
!
!
!
!
!
!!
!
!
!
!
!
!
! !
!
!
!
!!
!
!!!!
!
!
!!
!
!
!
!
!
!
!
!
!
!!
!
!
!
!
!
!
! !
!!
!
!
!
!
!!
!
!!
!
!
!
!
!
!
!
!!
!
!
!
!
!
!
!
!!
!
!
!
!
!
!
!
!
!
!
!
!
!
!
!
!
!
!
!
!
!
!
!
!
!
!
!
!
!
!
!
!
!
!
!
!
!
!
!
!
!
!
!
!
!
!
!
!
!
!
!
!
!
!
!
!
!
!
!
!
!
!
!
!
!
!
!
!
!
!
!
!
!
!
!
!
!
!
!
!
!
!
!
!
!
!
!
!
!
!
!
!
!
!
!!
!
!
PEPCO
Poplar Point
Kenilworth Park Landfill North
Washington Navy YardSoutheast
Federal Center
Kenilworth ParkLandfill South
Washington Gas
CSX
CSX
Former Hess Oil Corporation and
Gulf Oil CorporationBulk Oil Facilities
Steuart Petroleum
Firth-SterlingSteel
JBABJBABJBABJoint BaseAnacostia-Bolling
Fort McNair
Piney Run
Watts Branch
Nash Ru n
Dueling Creek
Pope Branch
H ickey Run
Fort Dupont Creek
Northwest Branch Anacostia River
Northeast B
ranch Anacostia R
iver
Lower Beaverdam Creek
LegendLEAD (mg/kg)
! 0 - 35
! 35 - 100
! 100 - 200
! 200 - 300
! 300 - 400
! 400 - 500
! 500 - 1000
SEDIMENT STUDY AREA
WASHINGTON DC BOUNDARY
CLEANUP SITE BOUNDARY(LAND BASED PORTION)
CLEANUP SITEAREA OF INFLUENCE
®0 1,500 3,000
FeetSOURCE: MODIFIED FROM CH2MHILL, 2011, GEOSYNTEC, 2012,DCGIS, 2012, NOAA, 2013, AND DEPARTMENT OF THE NAVY, 2013.
FIGURE 4.12SUMMARY ANALYTICAL RESULTS FOR
LEAD IN SURFACE SEDIMENT
Dat
e Sa
ved:
5/1
4/20
14 1
:41:
46 P
M U
ser:
joel
.pet
ers
Pat
h: S
:\CA
DD
\S\2
592\
mxd
\Wor
kPla
n\Fi
gure
_04_
12_A
naco
stia
_11x
17_S
ED
IME
NT_
LEA
D.m
xd
Note: The Cleanup Site Boundaries (Land Based Portion) for the Washington Navy Yard are reflective of its historic extent.
DRAFT
ANACOSTIA RIVERSEDIMENTS PROJECT

!!!!
!!!!!!!!!!
!!!!
!!!!!
!!!!!!!!!!! !
!!!!!!
!
!!!!!!
!!!!!!!
!
!
!
!!!!
!
!
!!!!!!
!!!!!!
!
!!!
!!
!!
!
!
!
!!
!
!
!
!
!
!
!
!
!
!
!
!!
!
!
!
!
!
!
!
!
!
!
!
!
!
!
!
!
!
!
!
!!
!!!
!
!
!!
!
!
!
!
!
!!
!
!
!!!
!
!!
!
!
!
!
!
!
!
!
!
!
!
!
!
!
!
!
!
!
!
!!
!!
!
!
!
!
!
!
!!
!
!
!
!!
!
!
!
!
!
!
!!
!
!
!
!
!
!
!!! !
!
!
!
!
!
!
!
!
!
!
!
!
!
!
!
!
!
!
!
!
!
!
!
!
!
!
!
!
!
!
!
!
!!
!
!
!
!
!
!
!
!
!
!
!
!
!
!
!
!
!
!
!
!
!!
!
!
!
!
!
!
!
!
!
!
!
!
!
!
!
!
!
!
!
!
!
!
!
!
!!
!
!
!
!
!
!
!
!
!
!
!
!
!
!
!
!
!
!
!
!
!
!
!
!
!
!
!
!
!
!
!
!
!
!
!
!
!
(((
(((
(
PEPCO
Poplar Point
Kenilworth Park Landfill North
Washington Navy YardSoutheast
Federal Center
Kenilworth ParkLandfill South
Washington Gas
CSX
CSX
Former Hess Oil Corporation and
Gulf Oil CorporationBulk Oil Facilities
Steuart Petroleum
Firth-SterlingSteel
JBABJBABJBABJoint BaseAnacostia-Bolling
Fort McNair
Piney Run
Watts Branch
Nash Ru n
Dueling Creek
Pope Branch
Hickey Run
Fort Dupont Creek
Northwest Branch Anacostia River
Northeast B
ranch Anacostia
Rive
r
Lower Beaverdam Creek
Legend( NON-DETECT
MERCURY (mg/kg)
! 0.009 - 0.18
! 0.18 - 0.40
! 0.40 - 0.89
! 0.89 - 1.51
! 1.51- 2.20
! 2.20 - 3.20
! 3.20 - 6.00
! 6.00 - 10.70
SEDIMENT STUDY AREA
WASHINGTON DC BOUNDARY
CLEANUP SITE BOUNDARY(LAND BASED PORTION)
CLEANUP SITEAREA OF INFLUENCE
®0 1,500 3,000
FeetSOURCE: MODIFIED FROM CH2MHILL, 2011, GEOSYNTEC, 2012,DCGIS, 2012, NOAA, 2013, AND DEPARTMENT OF THE NAVY, 2013.
FIGURE 4.13SUMMARY ANALYTICAL RESULTS FOR
MERCURY IN SURFACE SEDIMENT
Dat
e Sa
ved:
5/1
4/20
14 1
:45:
07 P
M U
ser:
joel
.pet
ers
Pat
h: S
:\CA
DD
\S\2
592\
mxd
\Wor
kPla
n\Fi
gure
_04_
13_A
naco
stia
_11x
17_S
ED
IME
NT_
ME
RC
UR
Y.m
xd
Note: The Cleanup Site Boundaries (Land Based Portion) for the Washington Navy Yard are reflective of its historic extent.
DRAFT
ANACOSTIA RIVERSEDIMENTS PROJECT

!
!!!!!!!!!
!
!
!
!
!
!!
!
!!!
!!
!
!!
!
!
!
!
!
!
!
!
!!
!
!
!
!
! !
!
!
!
!
!
!
!
!
!!
!
!
!
!!
!
!
!!
!
!
!
!
!
!
! !!
!
!!!
!
!
!
!
!!
! !! !!!
!
!!!
!
!! !
!!!!
!
!
!
!
!
!
!
!
!
!
!!
!
!
!
!
!!!! !!
!!
!
!
!
! !
!!!!
!
!
!
!!
!
!
!
!!!!
!
!
!!
!
!!
! !!!
!
!
!!!
!
!
!
!!!
!
!
!
!
!
!!
!
!!
!
!
!
! !
!
!
!
!
!!
! !!
!
!
!
!
!
!
!
!
!
!
!
!
!
!
!!
!
!
!
!!
!
!
!!!
!
!
!
!!
!
!
!
!!!! !!
!
!
!!
!
!
!
!
! !
!
!
!
!
!!
!
!! !!
!
!!
!
!
!!
!
!
!
!
!
! !
!
!
!
!
!
!
!
!
!!!
!
!
!
!
!
!
!
!
!
!
!
!
!
!!
!!
!
!
!
!
(
PEPCO
Poplar Point
Kenilworth Park Landfill North
Washington Navy YardSoutheast
Federal Center
Kenilworth ParkLandfill South
Washington Gas
CSX
CSX
Former Hess Oil Corporation and
Gulf Oil CorporationBulk Oil Facilities
Steuart Petroleum
Firth-SterlingSteel
JBABJBABJBABJoint BaseAnacostia-Bolling
Fort McNair
Piney Run
Watts Branch
Nash Ru n
Dueling Creek
Pope Branch
Hickey Run
Fort Dupont Creek
Northwest Branch Anacostia River
Northeast B
ranch Anacostia
Rive
r
Lower Beaverdam Creek
Legend( NON-DETECT
NICKEL (mg/kg)
! 0.19 - 22.70
! 22.70 - 47.30
! 47.30 - 64.39
! 64.39 - 100.70
! 100.70 - 148.82
! 148.82 - 386.81
SEDIMENT STUDY AREA
WASHINGTON DC BOUNDARY
CLEANUP SITE BOUNDARY(LAND BASED PORTION)
CLEANUP SITEAREA OF INFLUENCE
®0 1,500 3,000
FeetSOURCE: MODIFIED FROM CH2MHILL, 2011, GEOSYNTEC, 2012,DCGIS, 2012, NOAA, 2013, AND DEPARTMENT OF THE NAVY, 2013.
FIGURE 4.14SUMMARY ANALYTICAL RESULTS FOR
NICKEL IN SURFACE SEDIMENT
Dat
e Sa
ved:
5/1
4/20
14 1
:46:
55 P
M U
ser:
joel
.pet
ers
Pat
h: S
:\CA
DD
\S\2
592\
mxd
\Wor
kPla
n\Fi
gure
_04_
14_A
naco
stia
_11x
17_S
ED
IME
NT_
NIC
KE
L.m
xd
Note: The Cleanup Site Boundaries (Land Based Portion) for the Washington Navy Yard are reflective of its historic extent.
DRAFT
ANACOSTIA RIVERSEDIMENTS PROJECT

!!!!!!
!
!!!!!
!
!
!!
!
!!
!!
!!
!!
!
!!!!!!!!!
!!!
!
!!!!!!
!
!!!!!
!!
!!!!!!!!!!!!!!
!
!
!
!!!!!!!!
!!
!!!!!
!
!
!
!!
!
!
!
!
!!
!!
!
!
!
!
!
!
!!
!!!
!
!!!!!
(
((( ((( (
(
((
((
(
(((((((((
((
(((
(
(
(((
((
((
((
(
((
((
((
(((((((((
(((
(
((
(
(
(
(
(
(
(
((
PEPCO
Poplar Point
Kenilworth Park Landfill North
Washington Navy YardSoutheast
Federal Center
Kenilworth ParkLandfill South
Washington Gas
CSX
CSX
Former Hess Oil Corporation and
Gulf Oil CorporationBulk Oil Facilities
Steuart Petroleum
Firth-SterlingSteel
JBABJBABJBABJoint BaseAnacostia-Bolling
Fort McNair
Piney Run
Watts Branch
Nash Ru n
Dueling Creek
Pope Branch
Hickey Run
Northwest Branch Anacostia River
Fort Dupont Creek
Northeast B
ranch Anacostia
Rive
r
Lower Beaverdam Creek
Legend( NON-DETECT
SELENIUM (mg/kg)
! 0.30 - 0.95
! 0.95 - 1.60
! 1.60 - 2.00
! 2.00 - 5.20
! 5.20 - 12.00
! 12.00 - 58.70
SEDIMENT STUDY AREA
WASHINGTON DC BOUNDARY
CLEANUP SITE BOUNDARY(LAND BASED PORTION)
CLEANUP SITEAREA OF INFLUENCE
®0 1,500 3,000
FeetSOURCE: MODIFIED FROM CH2MHILL, 2011, GEOSYNTEC, 2012,DCGIS, 2012, NOAA, 2013, AND DEPARTMENT OF THE NAVY, 2013.
FIGURE 4.15SUMMARY ANALYTICAL RESULTS FOR
SELENIUM IN SURFACE SEDIMENT
Dat
e Sa
ved:
5/1
4/20
14 1
:48:
23 P
M U
ser:
joel
.pet
ers
Pat
h: S
:\CA
DD
\S\2
592\
mxd
\Wor
kPla
n\Fi
gure
_04_
15_A
naco
stia
_11x
17_S
ED
IME
NT_
SEL
ENIU
M.m
xd
Note: The Cleanup Site Boundaries (Land Based Portion) for the Washington Navy Yard are reflective of its historic extent.
DRAFT
ANACOSTIA RIVERSEDIMENTS PROJECT

!!!! !!!!!!!!! !
!!!
!!!!!!!!!!!!!!!!!!!!!!!!!!!!!!!!!!!!!!!!!!!!!!!
!!!!!
!
!
!
!! ! !!!!
!!
! !
!
! !
!
!
!
!!
!
!!
!!
!
!
!
!
!
!
!
!
! !!
!!
!
!
!
!!
!
!!!
!
!
!
!!
!
!
!! !!!
!
!
!
!
!
!
!!
!
!
!
!
!
!
!
!!
!! !!
!!
!!
!
!!!!
!
!
!
!!
!
!
!
!
!
!
!
!
!
!
!
!
!
!!!
!
!!
!
!
!
!
!!
!
!
!
!
!
!!
!
!
!!!
!
!
!
!
!!
!
!!!
!
!
!
!
!
!
!!
!
!
!
!
!
!
!
!
!
!
! !
!
!
!
!
!
!
!
!
!
!
!
!
!
!
!
!
!
!
!
!
!
!
!
!
!
!
!
!
!
!
!
!
!
!
!
!
!
!
!
!
!
!
!
!
!
!
!
!
!
!
!
!
!
!
!
!
!
!
!
!
!
!
!
!
!
PEPCO
Poplar Point
Kenilworth Park Landfill North
Washington Navy YardSoutheast
Federal Center
Kenilworth ParkLandfill South
Washington Gas
CSX
CSX
Former Hess Oil Corporation and
Gulf Oil CorporationBulk Oil Facilities
Steuart Petroleum
Firth-SterlingSteel
JBABJBABJBABJoint BaseAnacostia-Bolling
Fort McNair
Piney Run
Watts Branch
Nash Ru n
Dueling Creek
Pope Branch
H ickey Run
Fort Dupont Creek
Northwest Branch Anacostia River
Northeast B
ranch Anacostia R
iver
Lower Beaverdam Creek
LegendZINC (mg/kg)
! 17.00 - 121.00
! 121.00 - 278.41
! 278.41 - 398.47
! 398.47 - 559.00
! 559.00 - 892.00
! 892.00 - 1805.88
SEDIMENT STUDY AREA
WASHINGTON DC BOUNDARY
CLEANUP SITE BOUNDARY(LAND BASED PORTION)
CLEANUP SITEAREA OF INFLUENCE ®
0 1,500 3,000FeetSOURCE: MODIFIED FROM CH2MHILL, 2011, GEOSYNTEC, 2012,
DCGIS, 2012, NOAA, 2013, AND DEPARTMENT OF THE NAVY, 2013.
FIGURE 4.16SUMMARY ANALYTICAL RESULTS FOR
ZINC IN SURFACE SEDIMENT
Dat
e Sa
ved:
5/1
3/20
14 5
:40:
53 P
M U
ser:
joel
.pet
ers
Pat
h: S
:\CA
DD
\S\2
592\
mxd
\Wor
kPla
n\Fi
gure
_04_
16_A
naco
stia
_11x
17_S
ED
IME
NT_
ZIN
C.m
xd
Note: The Cleanup Site Boundaries (Land Based Portion) for the Washington Navy Yard are reflective of its historic extent.
DRAFT
ANACOSTIA RIVERSEDIMENTS PROJECT
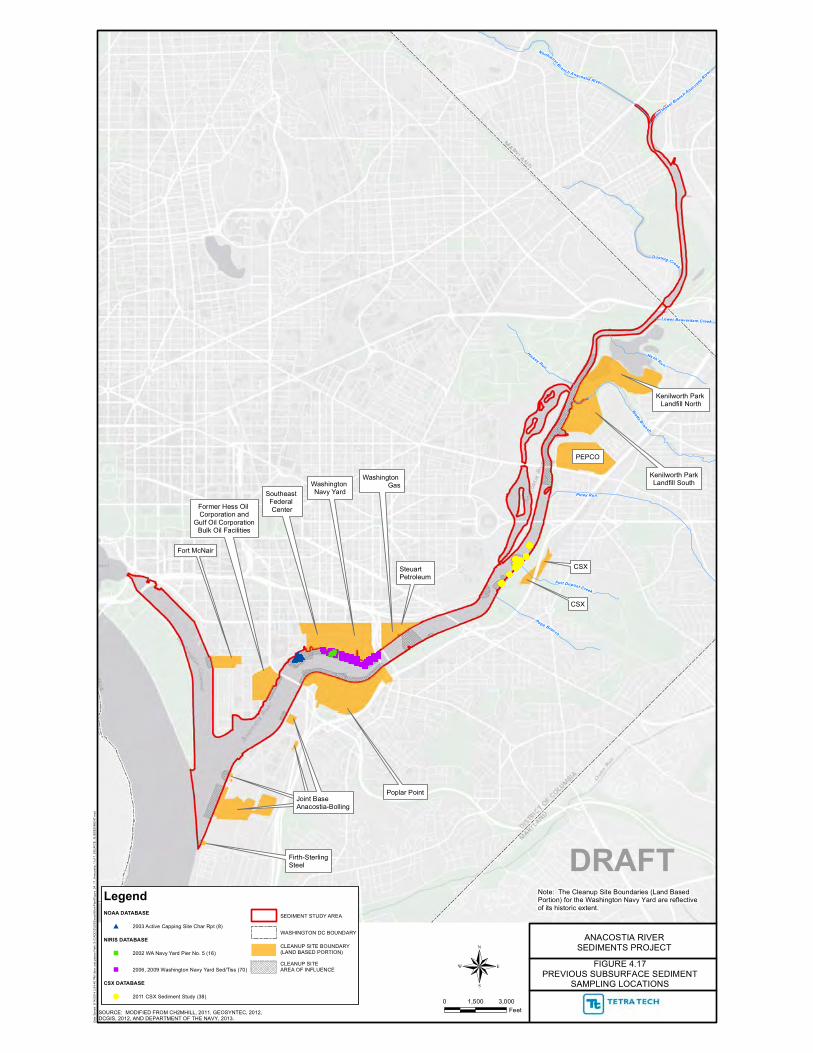
!!!!!!!!!!!!!!!!!!!!!!!!!!!!!!!!!!!!!!!!!!!!!!!!!!!!!!!!!!!!!!!!!!!!!!!!!!!!!!!!!!!!!!!!!!!!!!!!!!!!!!!!!!!!!!!!!!!!!!!!!!!!!!!!!!!!!!!!!!!!!!!!!!!!!!!!!!!!!!!!!!!!!!!!!!!!!!!!!!!!!!!!!!!!!!!!!!!!!!!!!!!!!!!!!!!!!!!!!!!!!!!!!!!!!!!!!!!!!!!!!!!!!!!!!!!!!!!!!!!!!!!!!!!!!!!!!!!!!!!!!!!!!!!!!!!!!!!!!!!!!!!!!!!!!!!!!!!!!!!!!!!!!!!!!!!!!!!!!!!!!!!!!!!!!!!!!!!!!!!!!!!!!!!!!!!!!!!!!!!!!!!!!!!!!!!!!!!!!!!!!!!!!!!!!!!!!!!!!!!!!!!!!!!!!!!!!!!!!!!!!!!!!!!!!!!!!!!!!!!!!!!!!!!!!!!!!!!!!!!!!!!!!!!!!!!!!!!!!!!!!!!!!!!!!!!!!!!!!!!!!!!!!!!!!!!!!!!!!!!!!!!!!!!!!!!!!!!!!!!!!!!!!!!!!!!!!!!!!!!!!!!!!!!!!!!!!!!!!!!!!!!!!!!!!!!!!!!!!!!!!!!!!!!!!!!!!!!!!!!!!!!!!!!!!!!!!!!!!!!!!!!!!!!!!!!!!!!!!!!!!!!!!!!!!!!!!!!!!!!!!!!!!!!!!!!!!!!!!!!!!!!!!!!!!!!!!!!!!!!!!!!!!!!!!!!!!!!!!!!!!!!!!!!!!!!!!!!!!!!!!!!!!!!!!!!!!!!!!!!!!!!!!!!!!!!!!!!!!!!!!!!!!!!!!!!!!!!!!!!!!!!!!!!!!!!!!!!!!!!!!!!!!!!!!!!!!!!!!!!!!!!!!!!!!!!!!!!!!!!!!!!!!!!!!!!!!!!!!!!!!!!!!!!!!!!!!!!!!!!!!!!!!!!!!!!!!!!!!!!!!!!!!!!!!!!!!!!!!!!!!!!!!!!!!!!!!!!!!!!!!!!!!!!!!!!!!!!!!!!!!!!!!!!!!!!!!!!!!!!!!!!!!!!!!!!!!!!!!!!!!!!!!!!!!!!!!!!!!!!!!!!!!!!!!!!!!!!!!!!!!!!!!!!!!!!!!!!!!!!!!!!!!!!!!!!!!!!!!!!!!!!!!!!!!!!!!!!!!!!!!!!!!!!!!!!!!!!!!!!!!!!!!!!!!!!!!!!!!!!!!!!!!!!!!!!!!!!!!!!!!!!!!!!!!!!!!!!!!!!!!!!!!!!!!!!!!!!!!!!!!!!!!!!!!!!!!!!!!!!!!!!!!!!!!!!!!!!!!!!!!!!!!!!!!!!!!!!!!!!!!!!!!!!!!!!!!!!!!!!!!!!!!!!!!!!!!!!!!!!!!!!!!!!!!!!!!!!!!!!!!!!!!!!!!!!!!!!!!!!!!!!!!!!!!!!!!!!!!!!!!!!!!!!!!!!!!!!!!!!!!!!!!!!!!!!!!!!!!!!!!!!!!!!!!!!!!!!!!!!!!!!!!!!!!!!!!!!!!!!!!!!!!!!!!!!!!!!!!!!!!!!!!!!!!!!!!!!!!!!!!!!!!!!!!!!!!!!!!!!!!!!!!!!!!!!!!!!!!!!!!!!!!!!!!!!!!!!!!!!!!!!!!!!!!!!!!!!!!!!!!!!!!!!!!!!!!!!!!!!!!!!!!!!!!!!!!!!!!!!!!!!!!!!!!!!!!!!!!!!!!!!!!!!!!!!!!!!!!!!!!!!!!!!!!!!!!!!!!!!!!!!!!!!!!!!!!!!!!!!!!!!!!!!!!!!!!!!!!!!!!!!!!!!!!!!!!!!!!!!!!!!!!!!!!!!!!!!!!!!!!!!!!!!!!!!!!!!!!!!!!!!!!!!!!!!!!!!!!!!!!!!!!!!!!!!!!!!!!!!!!!!!!!!!!!!!!!!!!!!!!!!!!!!!!!!!!!!!!!!!!!!!!!!!!!!!!!!!!!!!!!!!!!!!!!!!!!!!!!!!!!!!!!!!!!!!!!!!!!!!!!!!!!!!!!!!!!!!!!!!!!!!!!!!!!!!!!!!!!!!!!!!!!!!!!!!!!!!!!!!!!!!!!!!!!!!!!!!!!!!!!!!!!!!!!!!!!!!!!!!!!!!!!!!!!!!!!!!!!!!!!!!!!!!!!!!!!!!!!!!!!!!!!!!!!!!!!!!!!!!!!!!!!!!!!!!!!!!!!!!!!!!!!!!!!!!!!!!!!!!!!!!!!!!!!!!!!!!!!!!!!!!!!!!!!!!!!!!!!!!!!!!!!!!!!!!!!!!!!!!!!!!!!!!!!!!!!!!!!!!!!!!!!!!!!!!!!!!!!!!!!!!!!!!!!!!!!!!!!!!!!!!!!!!!!!!!!!!!!!!!!!!!!!!!!!!!!!!!!!!!!!!!!!!!!!!!!!!!!!!!!!!!!!!!!!!!!!!!!!!!!!!!!!!!!!!!!!!!!!!!!!!!!!!!!!!!!!!!!!!!!!!!!!!!!!!!!!!!!!!!!!!!!!!!!!!!!!!!!!!!!!!!!!!!!!!!!!!!!!!!!!!!!!!!!!!!!!!!!!!!!!!!!!!!!!!!!!!!!!!!!!!!!!!!!!!!!!!!!!!!!!!!!!!!!!!!!!!!!!!!!!!!!!!!!!!!!!!!!!!!!!!!!!!!!!!!!!!!!!!!!!!!!!!!!!!!!!!!!!!!!!!!!!!!!!!!!!!!!!!!!!!!!!!!!!!!!!!!!!!!!!!!!!!!!!!!!!!!!!!!!!!!!!!!!!!!!!!!!!!!!!!!!!!!!!!!!!!!!!!!!!!!!!!!!!!!!!!!!!!!!!!!!!!!!!!!!!!!!!!!!!!!!!!!!!!!!!!!!!!!!!!!!!!!!!!!!!!!!!!!!!!!!!!!!!!!!!!!!!!!!!!!!!!!!!!!!!!!!!!!!!!!!!!!!!!!!!!!!!!!!!!!!!!!!!!!!!!!!!!!!!!!!!!!!!!!!!!!!!!!!!!!!!!!!!!!!!!!!!!!!!!!!!!!!!!!!!!!!!!!!!!!!!!!!!!!!!!!!!!!!!!!!!!!!!!!!!!!!!!!!!!!!!!!!!!!!!!!!!!!!!!!!!!!!!!!!!!!!!!!!!!!!!!!!!!!!!!!!!!!!!!!!!!!!!!!!!!!!!!!!!!!!!!!!!!!!!!!!!!!!!!!!!!!!!!!!!!!!!!!!!!!!!!!!!!!!!!!!!!!!!!!!!!!!!!!!!!!!!!!!!!!!!!!!!!!!!!!!!!!!!!!!!!!!!!!!!!!!!!!!!!!!!!!!!!!!!!!!!!!!!!!!!!!!!!!!!!!!!!!!!!!!!!!!!!!!!!!!!!!!!!!!!!!!!!!!!!!!!!!!!!!!!!!!!!!!!!!!!!!!!!!!!!!!!!!!!!!!!!!!!!!!!!!!!!!!!!!!!!!!!!!!!!!!!!!!!!!!!!!!!!!!!!!!!!!!!!!!!!!!!!!!!!!!!!!!!!!!!!!!!!!!!!!!!!!!!!!!!!!!!!!!!!!!!!!!!!!!!!!!!!!!!!!!!!!!!!!!!!!!!!!!!!!!!!!!!!!!!!!!!!!!!!!!!!!!!!!!!!!!!!!!!!!!!!!!!!!!!!!!!!!!!!!!!!!!!!!!!!!!!!!!!!!!!!!!!!!!!!!!!!!!!!!!!!!!!!!!!!!!!!!!!!!!!!!!!!!!!!!!!!!!!!!!!!!!!!!!!!!!!!!!!!!!!!!!!!!!!!!!!!!!!!!!!!!!!!!!!!!!!!!!!!!!!!!!!!!!!!!!!!!!!!!!!!!!!!!!!!!!!!!!!!!!!!!!!!!!!!!!!!!!!!!!!!!!!!!!!!!!!!!!!!!!!!!!!!!!!!!!!!!!!!!!!!!!!!!!!!!!!!!!!!!!!!!!!!!!!!!!!!!!!!!!!!!!!!!!!!!!!!!!!!!!!!!!!!!!!!!!!!!!!!!!!!!!!!!!!!!!!!!!!!!!!!!!!!!!!!!!!!!!!!!!!!!!!!!!!!!!!!!!!!!!!!!!!!!!!!!!!!!!!!!!!!!!!!!!!!!!!!!!!!!!!!!!!!!!!!!!!!!!!!!!!!!!!!!!!!!!!!!!!!!!!!!!!!!!!!!!!!!!!!!!!!!!!!!!!!!!!!!!!!!!!!!!!!!!!!!!!!!!!!!!!!!!!!!!!!!!!!!!!!!!!!!!!!!!!!!!!!!!!!!!!!!!!!!!!!!!!!!!!!!!!!!!!!!!!!!!!!!!!!!!!!!!!!!!!!!!!!!!!!!!!!!!!!!!!!!!!!!!!!!!!!!!!!!!!!!!!!!!!!!!!!!!!!!!!!!!!!!!!!!!!!!!!!!!!!!!!!!!!!!!!!!!!!!!!!!!!!!!!!!!!!!!!!!!!!!!!!!!!!!!!!!!!!!!!!!!!!!!!!!!!!!!!!!!!!!!!!!!!!!!!!!!!!!!!!!!!!!!!!!!!!!!!!!!!!!!!!!!!!!!!!!!!!!!!!!!!!!!!!!!!!!!!!!!!!!!!!!!!!!!!!!!!!!!!!!!!!!!!!!!!!!!!!!!!!!!!!!!!!!!!!!!!!!!!!!!!!!!!!!!!!!!!!!!!!!!!!!!!!!!!!!!!!!!!!!!!!!!!!!!!!!!!!!!!!!!!!!!!!!!!!!!!!!!!!!!!!!!!!!!!!!!!!!!!!!!!!!!!!!!!!!!!!!!!!!!!!!!!!!!!!!!!!!!!!!!!!!!!!!!!!!!!!!!!!!!!!!!!!!!!!!!!!!!!!!!!!!!!!!!!!!!!!!!!!!!!!!!!!!!!!!!!!!!!!!!!!!!!!!!!!!!!!!!!!!!!!!!!!!!!!!!!!!!!!!!!!!!!!!!!!!!!!!!!!!!!!!!!!!!!!!!!!!!!!!!!!!!!!!!!!!!!!!!!!!!!!!!!!!!!!!!!!!!!!!!!!!!!!!!!!!!!!!!!!!!!!!!!!!!!!!!!!!!!!!!!!!!!!!!!!!!!!!!!!!!!!!!!!!!!!!!!!!!!!!!!!!!!!!!!!!!!!!!!!!!!!!!!!!!!!!!!!!!!!!!!!!!!!!!!!!!!!!!!!!!!!!!!!!!!!!!!!!!!!!!!!!!!!!!!!!!!!!!!!!!!!!!!!!!!!!!!!!!!!!!!!!!!!!!!!!!!!!!!!!!!!!!!!!!!!!!!!!!!!!!!!!!!!!!!!!!!!!!!!!!!!!!!!!!!!!!!!!!!!!!!!!!!!!!!!!!!!!!!!!!!!!!!!!!!!!!!!!!!!!!!!!!!!!!!!!!!!!!!!!!!!!!!!!!!!!!!!!!!!!!!!!!!!!!!!!!!!!!!!!!!!!!!!!!!!!!!!!!!!!!!!!!!!!!!!!!!!!!!!!!!!!!!!!!!!!!!!!!!!!!!!!!!!!!!!!!!!!!!!!!!!!!!!!!!!!!!!!!!!!!!!!!!!!!!!!!!!!!!!!!!!!!!!!!!!!!!!!!!!!!!!!!!!!!!!!!!!!!!!!!!!!!!!!!!!!!!!!!!!!!!!!!!!!!!!!!!!!!!!!!!!!!!!!!!!!!!!!!!!!!!!!!!!!!!!!!!!!!!!!!!!!!!!!!!!!!!!!!!!!!!!!!!!!!!!!!!!!!!!!!!!!!!!!!!!!!!!!!!!!!!!!!!!!!!!!!!!!!!!!!!!!!!!!!!!!!!!!!!!!!!!!!!!!!!!!!!!!!!!!!!!!!!!!!!!!!!!!!!!!!!!!!!!!!!!!!!!!!!!!!!!!!!!!!!!!!!!!!!!!!!!!!!!!!!!!!!!!!!!!!!!!!!!!!!!!!!!!!!!!!!!!!!!!!!!!!!!!!!!!!!!!!!!!!!!!!!!!!!!!!!!!!!!!!!!!!!!!!!!!!!!!!!!!!!!!!!!!!!!!!!!!!!!!!!!!!!!!!!!!!!!!!!!!!!!!!!!!!!!!!!!!!!!!!!!!!!!!!!!!!!!!!!!!!!!!!!!!!!!!!!!!!!!!!!!!!!!!!!!!!!!!!!!!!!!!!!!!!!!!!!!!!!!!!!!!!!!!!!!!!!!!!!!!!!!!!!!!!!!!!!!!!!!!!!!!!!!!!!!!!!!!!!!!!!!!!!!!!!!!!!!!!!!!!!!!!!!!!!!!!!!!!!!!!!!!!!!!!!!!!!!!!!!!!!!!!!!!!!!!!!!!!!!!!!!!!!!!!!!!!!!!!!!!!!!!!!!!!!!!!!!!!!!!!!!!!!!!!!!!!!!!!!!!!!!!!!!!!!!!!!!!!!!!!!!!!!!!!!!!!!!!!!!!!!!!!!!!!!!!!!!!!!!!!!!!!!!!!!!!!!!!!!!!!!!!!!!!!!!!!!!!!!!!!!!!!!!!!!!!!!!!!!!!!!!!!!!!!!!!!!!!!!!!!!!!!!!!!!!!!!!!!!!!!!!!!!!!!!!!!!!!!!!!!!!!!!!!!!!!!!!!!!!!!!!!!!!!!!!!!!!!!!!!!!!!!!!!!!!!!!!!!!!!!!!!!!!!!!!!!!!!!!!!!!!!!!!!!!!!!!!!!!!!!!!!!!!!!!!!!!!!!!!!!!!!!!!!!!!!!!!!!!!!!!!!!!!!!!!!!!!!!!!!!!!!!!!!!!!!!!!!!!!!!!!!!!!!!!!!!!!!!!!!!!!!!!!!!!!!!!!!!!!!!!!!!!!!!!!!!!!!!!!!!!!!!!!!!!!!!!!!!!!!!!!!!!!!!!!!!!!!!!!!!!!!!!!!!!!!!!!!!!!!!!!!!!!!!!!!!!!!!!!!!!!!!!!!!!!!!!!!!!!!!!!!!!!!!!!!!!!!!!!!!!!!!!!!!!!!!!!!!!!!!!!!!!!!!!!!!!!!!!!!!!!!!!!!!!!!!!!!!!!!!!!!!!!!!!!!!!!!!!!!!!!!!!!!!!!!!!!!!!!!!!!!!!!!!!!!!!!!!!!!!!!!!!!!!!!!!!!!!!!!!!!!!!!!!!!!!!!!!!!!!!!!!!!!!!!!!!!!!!!!!!!!!!!!!!!!!!!!!!!!!!!!!!!!!!!!!!!!!!!!!!!!!!!!!!!!!!!!!!!!!!!!!!!!!!!!!!!!!!!!!!!!!!!!!!!!!!!!!!!!!!!!!!!!!!!!!!!!!!!!!!!!!!!!!!!!!!!!!!!!!!!!!!!!!!!!!!!!!!!!!!!!!!!!!!!!!!!!!!!!!!!!!!!!!!!!!!!!!!!!!!!!!!!!!!!!!!!!!!!!!!!!!!!!!!!!!!!!!!!!!!!!!!!!!!!!!!!!!!!!!!!!!!!!!!!!!!!!!!!!!!!!!!!!!!!!!!!!!!!!!!!!!!!!!!!!!!!!!!!!!!!!!!!!!!!!!!!!!!!!!!!!!!!!!!!!!!!!!!!!!!!!!!!!!!!!!!!!!!!!!!!!!!!!!!!!!!!!!!!!!!!!!!!!!!!!!!!!!!!!!!!!!!!!!!!!!!!!!!!!!!!!!!!!!!!!!!!!!!!!!!!!!!!!!!!!!!!!!!!!!!!!!!!!!!!!!!!!!!!!!!!!!!!!!!!!!!!!!!!!!!!!!!!!!!!!!!!!!!!!!!!!!!!!!!!!!!!!!!!!!!!!!!!!!!!!!!!!!!!!!!!!!!!!!!!!!!!!!!!!!!!!!!!!!!!!!!!!!!!!!!!!!!!!!!!!!!!!!!!!!!!!!!!!!!!!!!!!!!!!!!!!!!!!!!!!!!!!!!!!!!!!!!!!!!!!!!!!!!!!!!!!!!!!!!!!!!!!!!!!!!!!!!!!!!!!!!!!!!!!!!!!!!!!!!!!!!!!!!!!!!!!!!!!!!!!!!!!!!!!!!!!!!!!!!!!!!!!!!!!!!!!!!!!!!!!!!!!!!!!!!!!!!!!!!!!!!!!!!!!!!!!!!!!!!!!!!!!!!!!!!!!!!!!!!!!!!!!!!!!!!!!!!!!!!!!!!!!!!!!!!!!!!!!!!!!!!!!!!!!!!!!!!!!!!!!!!!!!!!!!!!!!!!!!!!!!!!!!!!!!!!!!!!!!!!!!!!!!!!!!!!!!!!!!!!!!!!!!!!!!!!!!!!!!!!!!!!!!!!!!!!!!!!!!!!!!!!!!!!!!!!!!!!!!!!!!!!!!!!!!!!!!!!!!!!!!!!!!!!!!!!!!!!!!!!!!!!!!!!!!!!!!!!!!!!!!!!!!!!!!!!!!!!!!!!!!!!!!!!!!!!!!!!!!!!!!!!!!!!!!!!!!!!!!!!!!!!!!!!!!!!!!!!!!!!!!!!!!!!!!!!!!!!!!!!!!!!!!!!!!!!!!!!!!!!!!!!!!!!!!!!!!!!!!!!!!!!!!!!!!!!!!!!!!!!!!!!!!!!!!!!!!!!!!!!!!!!!!!!!!!!!!!!!!!!!!!!!!!!!!!!!!!!!!!!!!!!!!!!!!!!!!!!!!!!!!!!!!!!!!!!!!!!!!!!!!!!!!!!!!!!!!!!!!!!!!!!!!!!!!!!!!!!!!!!!!!!!!!!!!!!!!!!!!!!!!!!!!!!!!!!!!!!!!!!!!!!!!!!!!!!!!!!!!!!!!!!!!!!!!!!!!!!!!!!!!!!!!!!!!!!!!!!!!!!!!!!!!!!!!!!!!!!!!!!!!!!!!!!!!!!!!!!!!!!!!!!!!!!!!!!!!!!!!!!!!!!!!!!!!!!!!!!!!!!!!!!!!!!!!!!!!!!!!!!!!!!!!!!!!!!!!!!!!!!!!!!!!!!!!!!!!!!!!!!!!!!!!!!!!!!!!!!!!!!!!!!!!!!!!!!!!!!!!!!!!!!!!!!!!!!!!!!!!!!!!!!!!!!!!!!!!!!!!!!!!!!!!!!!!!!!!!!!!!!!!!!!!!!!!!!!!!!!!!!!!!!!!!!!!!!!!!!!!!!!!!!!!!!!!!!!!!!!!!!!!!!!!!!!!!!!!!!!!!!!!!!!!!!!!!!!!!!!!!!!!!!!!!!!!!!!!!!!!!!!!!!!!!!!!!!!!!!!!!!!!!!!!!!!!!!!!!!!!!!!!!!!!!!!!!!!!!!!!!!!!!!!!!!!!!!!!!!!!!!!!!!!!!!!!!!!!!!!!!!!!!!!!!!!!!!!!!!!!!!!!!!!!!!!!!!!!!!!!!!!!!!!!!!!!!!!!!!!!!!!!!!!!!!!!!!!!!!!!!!!!!!!!!!!!!!!!!!!!!!!!!!!!!!!!!!!!!!!!!!!!!!!!!!!!!!!!!!!!!!!!!!!!!!!!!!!!!!!!!!!!!!!!!!!!!!!!!!!!!!!!!!!!!!!!!!!!!!!!!!!!!!!!!!!!!!!!!!!!!!!!!!!!!!!!!!!!!!!!!!!!!!!!!!!!!!!!!!!!!!!!!!!!!!!!!!!!!!!!!!!!!!!!!!!!!!!!!!!!!!!!!!!!!!!!!!!!!!!!!!!!!!!!!!!!!!!!!!!!!!!!!!!!!!!!!!!!!!!!!!!!!!!!!!!!!!!!!!!!!!!!!!!!!!!!!!!!!!!!!!!!!!!!!!!!!!!!!!!!!!!!!!!!!!!!!!!!!!!!!!!!!!!!!!!!!!!!!!!!!!!!!!!!!!!!!!!!!!!!!!!!!!!!!!!!!!!!!!!!!!!!!!!!!!!!!!!!!!!!!!!!!
!!
!!!!!!!!!!!!!!!!!!!!!!!!!!!!!!!!!!!!!!!!!!!!!!!!!!!!!!!!!!!!!!!!!!!!!!!!!!!!!!!!!!!!!!!!!!!!!!!!!!!!!!!!!!!!!!!!!!!!!!!!!!!!!!!!!!!!!!!!!!!!!!!!!!!!!!!!!!!!!!!!!!!!!!!!!!!!!!!!!!!!!!!!!!!!!!!!!!!!!!!!!!!!!!!!!!!!!!!!!!!!!!!!!!!!!!!!!!!!!!!!!!!!!!!!!!!!!!!!!!!!!!!!!!!!!!!!!!!!!!!!!!!!!!!!!!!!!!!!!!!!!!!!!!!!!!!!!!!!!!!!!!!!!!!!!!!!!!!!!!!!!!!!!!!!!!!!!!!!!!!!!!!!!!!!!!!!!!!!!!!!!!!!!!!!!!!!!!!!!!!!!!!!!!!!!!!!!!!!!!!!!!!!!!!!!!!!!!!!!!!!!!!!!!!!!!!!!!!!!!!!!!!!!!!!!!!!!!!!!!!!!!!!!!!!!!!!!!!!!!!!!!!!!!!!!!!!!!!!!!!!!!!!!!!!!!!!!!!!!!!!!!!!!!!!!!!!!!!!!!!!!!!!!!!!!!!!!!!!!!!!!!!!!!!!!!!!!!!!!!!!!!!!!!!!!!!!!!!!!!!!!!!!!!!!!!!!!!!!!!!!!!!!!!!!!!!!!!!!!!!!!!!!!!!!!!!!!!!!!!!!!!!!!!!!!!!!!!!!!!!!!!!!!!!!!!!!!!!!!!!!!!!!!!!!!!!!!!!!!!!!!!!!!!!!!!!!!!!!!!!!!!!!!!!!!!!!!!!!!!!!!!!!!!!!!!!!!!!!!!!!!!!!!!!!!!!!!!!!!!!!!!!!!!!!!!!!!!!!!!!!!!!!!!!!!!!!!!!!!!!!!!!!!!!!!!!!!!!!!!!!!!!!!!!!!!!!!!!!!!!!!!!!!!!!!!!!!!!!!!!!!!!!!!!!!!!!!!!!!!!!!!!!!!!!!!!!!!!!!!!!!!!!!!!!!!!!!!!!!!!!!!!!!!!!!!!!!!!!!!!!!!!!!!!!!!!!!!!!!!!!!!!!!!!!!!!!!!!!!!!!!!!!!!!!!!!!!!!!!!!!!!!!!!!!!!!!!!!!!!!!!!!!!!!!!!!!!!!!!!!!!!!!!!!!!!!!!!!!!!!!!!!!!!!!!!!!!!!!!!!!!!!!!!!!!!!!!!!!!!!!!!!!!!!!!!!!!!!!!!!!!!!!!!!!!!!!!!!!!!!!!!!!!!!!!!!!!!!!!!!!!!!!!!!!!!!!!!!!!!!!!!!!!!!!!!!!!!!!!!!!!!!!!!!!!!!!!!!!!!!!!!!!!!!!!!!!!!!!!!!!!!!!!!!!!!!!!!!!!!!!!!!!!!!!!!!!!!!!!!!!!!!!!!!!!!!!!!!!!!!!!!!!!!!!!!!!!!!!!!!!!!!!!!!!!!!!!!!!!!!!!!!!!!!!!!!!!!!!!!!!!!!!!!!!!!!!!!!!!!!!!!!!!!!!!!!!!!!!!!!!!!!!!!!!!!!!!!!!!!!!!!!!!!!!!!!!!!!!!!!!!!!!!!!!!!!!!!!!!!!!!!!!!!!!!!!!!!!!!!!!!!!!!!!!!!!!!!!!!!!!!!!!!!!!!!!!!!!!!!!!!!!!!!!!!!!!!!!!!!!!!!!!!!!!!!!!!!!!!!!!!!!!!!!!!!!!!!!!!!!!!!!!!!!!!!!!!!!!!!!!!!!!!!!!!!!!!!!!!!!!!!!!!!!!!!!!!!!!!!!!!!!!!!!!!!!!!!!!!!!!!!!!!!!!!!!!!!!!!!!!!!!!!!!!!!!!!!!!!!!!!!!!!!!!!!!!!!!!!!!!!!!!!!!!!!!!!!!!!!!!!!!!!!!!!!!!!!!!!!!!!!!!!!!!!!!!!!!!!!!!!!!!!!!!!!!!!!!!!!!!!!!!!!!!!!!!!!!!!!!!!!!!!!!!!!!!!!!!!!!!!!!!!!!!!!!!!!!!!!!!!!!!!!!!!!!!!!!!!!!!!!!!!!!!!!!!!!!!!!!!!!!!!!!!!!!!!!!!!!!!!!!!!!!!!!!!!!!!!!!!!!!!!!!!!!!!!!!!!!!!!!!!!!!!!!!!!!!!!!!!!!!!!!!!!!!!!!!!!!!!!!!!!!!!!!!!!!!!!!!!!!!!!!!!!!!!!!!!!!!!!!!!!!!!!!!!!!!!!!!!!!!!!!!!!!!!!!!!!!!!!!!!!!!!!!!!!!!!!!!!!!!!!!!!!!!!!!!!!!!!!!!!!!!!!!!!!!!!!!!!!!!!!!!!!!!!!!!!!!!!!!!!!!!!!!!!!!!!!!!!!!!!!!!!!!!!!!!!!!!!!!!!!!!!!!!!!!!!!!!!!!!!!!!!!!!!!!!!!!!!!!!!!!!!!!!!!!!!!!!!!!!!!!!!!!!!!!!!!!!!!!!!!!!!!!!!!!!!!!!!!!!!!!!!!!!!!!!!!!!!!!!!!!!!!!!!!!!!!!!!!!!!!!!!!!!!!!!!!!!!!!!!!!!!!!!!!!!!!!!!!!!!!!!!!!!!!!!!!!!!!!!!!!!!!!!!!!!!!!!!!!!!!!!!!!!!!!!!!!!!!!!!!!!!!!!!!!!!!!!!!!!!!!!!!!!!!!!!!!!!!!!!!!!!!!!!!!!!!!!!!!!!!!!!!!!!!!!!!!!!!!!!!!!!!!!!!!!!!!!!!!!!!!!!!!!!!!!!!!!!!!!!!!!!!!!!!!!!!!!!!!!!!!!!!!!!!!!!!!!!!!!!!!!!!!!!!!!!!!!!!!!!!!!!!!!!!!!!!!!!!!!!!!!!!!!!!!!!!!!!!!!!!!!!!!!!!!!!!!!!!!!!!!!!!!!!!!!!!!!!!!!!!!!!!!!!!!!!!!!!!!!!!!!!!!!!!!!!!!!!!!!!!!!!!!!!!!!!!!!!!!!!!!!!!!!!!!!!!!!!!!!!!!!!!!!!!!!!!!!!!!!!!!!!!!!!!!!!!!!!!!!!!!!!!!!!!!!!!!!!!!!!!!!!!!!!!!!!!!!!!!!!!!!!!!!!!!!!!!!!!!!!!!!!!!!!!!!!!!!!!!!!!!!!!!!!!!!!!!!!!!!!!!!!!!!!!!!!!!!!!!!!!!!!!!!!!!!!!!!!!!!!!!!!!!!!!
!!!!!!!!
!!!!!!!!!!!!!!!!!!!!!!!!!!!!!!!!!!!!!!!!!!!!!!!!!!!!!!!!!!!!!!!!!!!!!!!!!!!!!!!!!!!!!!!!!!!!!!!!!!!!!!!!!!!!!!!!!!!!!!!!!!!!!!!!!!!!!!!!!!!!!!!!!!!!!!!!!!!!!!!!!!!!!!!!!!!!!!!!!!!!!!!!!!!!!!!!!!!!!!!!!!!!!!!!!!!!!!!!!!!!!!!!!!!!!!!!!!!!!!!!
!!
!!!!!!!!!!!!!!!!!!!!!!!!!!!!!!!!!!!!!!!!!!!!!!!!!!!!!!!!!!!!!!!!!!!!!!!!!!!!!!!!!!!!!!!!!!!!!!!!!!!!!!!!!!!!!!!!!!!!!!!!!!!!!!!!!!!!!!!!!!!!!!!!!!!!!!!!!!!!!!!!!!!!!!!!!!!!!!!!!!!!!!!!!!!!!!!!!!!!!!!!!!!!!!!!!!!!!!!!!!!!!!!!!!!!!!!!!!!!!!!!!!!!!!!!!!!!!!!!!!!!!!!!!!!!!!!!!!!!!!!!!!!!!!!!!!!!!!!!!!!!!!!!!!!!!!!!!!!!!!!!!!!!!!!!!!!!!!!!!!!!!!!!!!!!!!!!!!!!!!!!!!!!!!!!!!!!!!!!!!!!!!!!!!!!!!!!!!!!!!!!!!!!!!!!!!!!!!!!!!!!!!!!!!!!!!!!!!!!!!!!!!!!!!!!!!!!!!!!!!!!!!!!!!!!!!!!!!!!!!!!!!!!!!!!!!!!!!!!!!!!!!!!!!!!!!!!!!!!!!!!!!!!!!!!!!!!!!!!!!!!!!!!!!!!!!!!!!!!!!!!!!!!!!!!!!!!!!!!!!!!!!!!!!!!!!!!!!!!!!!!!!!!!!!!!!!!!!!!!!!!!!!!!!!!!!!!!!!!!!!!!!!!!!!!!!!!!!!!!!!!!!!!!!!!!!!!!!!!!!!!!!!!!!!!!!!!!!!!!!!!!!!!!!!!!!!!!!!!!!!!!!!!!!!!!!!!!!!!!!!!!!!!!!!!!!!!!!!!!!!!!!!!!!!!!!!!!!!!!!!!!!!!!!!!!!!!!!!!!!!!!!!!!!!!!!!!!!!!!!!!!!!!!!!!!!!!!!!!!!!!!!!!!!!!!!!!!!!!!!!!!!!!!!!!!!!!!!!!!!!!!!!!!!!!!!!!!!!!!!!!!!!!!!!!!!!!!!!!!!!!!!!!!!!!!!!!!!!!!!!!!!!!!!!!!!!!!!!!!!!!!!!!!!!!!!!!!!!!!!!!!!!!!!!!!!!!!!!!!!!!!!!!!!!!!!
!!!!!!!!!!!!!!!!!!!!!!!!!!!!!!!!!!!!!!!!!!!!!!!!!!!!!!!!!!!!!!!!!!!!!!!!!!!!!!!!!!!!!!!!!!!!!!!!!!!!!!!!!!!!!!!!!!!!!!!!!!!!!!!!!!!!!!!!!!!!!!!!!!!!!!!!!!!!!!!!!!!!!!!!!!!!!!!!!!!!!!!!!!!!!!!!!!!!!!!!!!!!!!!!!!!!!!!!!!!!!!!!!!!!!!!!!!!!!!!!!!!!!!!!!!!!!!!!!!!!!!!!!!!!!!!!!!!!!!!!!!!!!!!!!!!!!!!!!!!!!!!!!!!!!!!!!!!!!!!!!!!!!!!!!!!!!!!!!!!!!!!!!!!!!!!!!!!!!!!!!!!!!!!!!!!!!!!!!!!!!!!!!!!!!!!!!!!!!!!!!!!!!!!!!!!!!!!!!!!!!!!!!!!!!!!!!!!!!!!!!!!!!!!!!!!!!!!!!!!!!!!!!!!!!!!!!!!!!!!!!!!!!!!!!!!!!!!!!!!!!!!!!!!!!!!!!!!!!!!!!!!!!!!!!!!!!!!!!!!!!!!!!!!!
!!
!!!!!!
!
!!!!!!!!!!!!!!!!!!!!!!!!!!!!!!!!!!!!!!!!!!!!!!!!!!!!!!!!!!!!!!!!!!!!!!!!!!!!!!!!!!!!!!!!!!!!!!!!!!!!!!!
!
!!!
!!!!
!!!!!
!!
!!!!!!!!!!!!!!!!!!!!!!!!!!!!!!!!!!!!!!!!!!!!!!!!!!!!!!!!!!!!!!!!!!!!!!!!!!!!!!!!!!!!!!!!!!!!!!!!!!!!!!!!!!!!!!!!!!!!!!!!!!!!!!!!!!!!!!!!!!!!!!!!!!!!!!!!!!!!!!!!!!!!!!!!!!!!!!!!!!!!!!!!!!!!!!!!!!!!!!!!!!!!!!!!!!!!!!!!!!!!!!!!!!!!!!!!!!!!!!!!!!!!!!!!!!!!!!!!!!!!!!!!!!!!!!!!!!!!!!!!!!!!!!!!!!!!!!!!!!!!!!!!!!!!!!!!!!!!!!!!!!!!!!!!!!!!!!!!!!!!!!!!!!!!!!!!!!!!!!!!!!!!!!!!!!!!!!!!!!!!!!!!!!!!!!!!!!!!!!!!!!!!!!!!!!!!!!!!!!!!!!!!!!!!!!!!!!!!!!!!!!!!!!!!!!!!!!!!!!!!!!!!!!!!!!!!!!!!!!!!!!!!!!!!!!!!!!!!!!!!!!!!!!!!!!!!!!!!!!!!!!!!!!!!!!!!!!!!!!!!!!!!!!!!!!!!!!!!!!!!!!!!!!!!!!!!!!!!!!!!!!!!!!!!!!!!!!!!!!!!!!!!!!!!!!!!!!!!!!!!!!!!!!!!!!!!!!!!!!!!!!!!!!!!!!!!!!!
!!
!!!!!!!
!
!!!!!!!!!!!!!!!!!!!!!!!!!!!!!!!!!!!!!!!!!!!!!!!!!!!!!!!!!!!!!!!!!!!!!!!!!!!!!!!!!!!!!!!!!!!!!!!!!!!!!!!!!!!!!!!!!!!!!!!!!!!!!!!!!!!!!!!!!!!!!!!!!!!!!!!!!!!!!!!!!!!!!!!!!!!!!!!!!!!!!!!!!!!!!!!!!!!!!!!!!!!!!!!!!!!!!!!!!!!!!!!!!!!!!!!!!!!!!!!!!!!!!!!!!!!!!!!!!!!!!!!!!!!!!!!!!!!!!!!!!!!!!!!!!!!!!!!!!!!!!!!!!!!!!!!!!!!!!!!!!!!!!!!!!!!!!!!!!!!!!!!!!!!!!!!!!!!!!!!!!!
!!
!!!!!!!!!!!!!!!!!!!!!!!!!!!!!!!!!!!!!!!!!!!!!!!!!!!!!!!!!!!!!!!!!!!!!!!!!!!!!!!!!!!!!!!!!!!!!!!!!!!!!!!!!!!
!!!
!!!!!!!!!!!!!!!!!!!!!!!!!!!!!!!!!!!!!!!!!!!!!!!!!!!!!!!!!!!!!!!!!!!!!!!!!!!!!!!!!!!!!!!!!!!!!!!!!!!!!!!!!!!!!!!!!!!!!!!!!!!!!!!!!!!!!!!!!!!!!!!!!!!!!!!!!!!!!!!!!!!!!!!!!!!!!!!!!!!!!!!!!!!!!!!!!!!!!!!!!!!!!!!!!!!!!!!!!!!!!!!!!!!!!!!!!!!!!!!!!!!!!!!!!!!!!!!!!!!!!!!!!!!!!!!!!!!!!!!!!!!!!!!!!!!!!!!!!!!!!!!!!!!!!!!!!!!!!!!!!!!!!!!!!!!!!!!!!!!!!!!!!!!!!!!!!!!!!!!!!!!!!!!!!!!!!!!!!!!!!!!!!!!!!!!!!!!!!!!
!
!!!!!!
!!
!!!!!!!!!!!!!!!!!!!!!!!!!!!!!!!!!!!!!!!!!!!!!!!!!!!!!!!!!!!!!!!!!!!!!!!!!!!!!!!!!!!!!!!!!!!!!!!!!!!!!!!!!!!!!!!!!!!!!!!!!!!!!!!!!!!!!!!!!!!!!!!!!!!!!!!!!!!!!!!!!!!!!!!!!!!!!!!!!!!!!!!!!!!!!!!!!!!!!!!!!!!!!!!!!!!!!!!!!!!!!!!!!!!!!!!!!!!!!!!!!!!!!!!!!!!!!!!!!!!!!!!!!!!!!!!!!!!!!!!!!!!!!!!!!!!!!!!!!!!!!!!!!!!!!!!!!!!!!!!!!!!!!!!!!!!!!!!!!!!!!!!!!!!!!!!!!!!!!!!!!!!!!!!!!!!!!!!!!!!!!!!!!!!!!!!!!!!!!!!!!!!!!!!!!!!!!!!!!!!!!!!!!!!!!!!!!!!!!!!!!!!!!!!!!!!!!!!!!!!!!!!!!!!!!!!!!!!!!!!!!!!!!!!!!!!!!!!!!!!!
!
!!!!!
!!
!!!!!!!!!!!!!!!!!!!!!!!!!!!!!!!!!!!!!!!!!!!!!!!!!!!!!!!!!!!!!!!!!!!!!!!!!!!!!!!!!!!!!!!!!!!!!!!!!!!!!!!!!!!!!!!!!!!!!!!!!!!!!!!!!!!!!!!!!!!!!!!!!!!!!!!!!!!!!!!!!!!!!!!!!!!!!!!!!!!!!!!!!!!!!!!!!!!!!!!!!!!!!!!!!!!!!!!!!!!!!!!!!!!!!!!!!!!!!!!!!!!!!!!!!!!!!!!!!!!!!!!!!!!!!!!!!!!!!!!!!!!!!!!!!!!!!!!!!!!!!!!!!!!!!!!!!!!!!!!!!!!!!!!!!!!!!!!!!!!!!!!!!!!!!!!!!!!!!!!!!!!!!!!!!!!!!!!!!!!!!!!!!!!!!!!!!!!!!!!!!!!!!!!!!!!!!!!!!!!!!!!!!!!!!!!!!!!!!!!!!!!!!!!!!!!!!!!!!!!!!!!!!!!!!!!!!!!!!!!!!!!!!!!!!!!!!!!!!!!!!!!!!
!!!!
!!!!!!!!!!!!!!!!!!!!!!!!!!!!!!!!!!!!!!!!!!!!!!!!!!!!!!!!!!!!!!!!!!!!!!!!!!!!!!!!!!!!!!!!!!!!!!!!!!!!!!!!!!!!!!!!!!!!!!!!!!!!!!!!!!!!!!!!!!!!!!!!!!!!!!!!!!!!!!!!!!!!!!!!!!!!!!!!!!!!!!!!!!!!!!!!!!!!!!!!!!!!!!!!!!!!!!!!!!!!!!!!!!!!!!!!!!!!!!!!!!!!!!!!!!!!!!!!!!!!!!!!!!!!!!!!!!!!!!!!!!!!!!!!!!!!!!!!!!!!!!!!!!!!!!!!!!!!!!!!!!!!!!!!!!!!!!!!!!!!!!!!!!!!!!!!!!!!!!!!!!!!!!!!
!!!
!!!!!!!!!!!!!!!!!!!!!!!!!!!!!!!!!!!!!!!!!!!!!!!!!!!!!!!!!!!!!!!!!!!!!!!!!!!!!!!!!!!!!!!!!!!!!!!!!!!!!!!!!!!!!!!!!!!!!!!!!!!!!!!!!!!!!!!!!!!!!!!!!!!!!!!!!!!!!!!!!!!!!!!!!!!!!!!!!!!!!!!!!!!!!!!!!!!!!!!!!!!!!!!!!!!!!!!!!!!!!!!!!!!!!!!!!!!!!!!!!!!!!!!!!
!!!!!!!!!!!!!!!!!!!!!!!!!!!!!!!!!!!!!!!!!!!!!!!!!!!!!!!!!!!!!!!!!!!!!!!!!!!!!!!!!!!!!!!!!!!!!!!!!!!!!!!!!!!!!!!!!!!!!!!!!!!!!!!!!!!!!!!!!!!!!!!!!!!!!!!!!!!!!!!!!!!!!!!!!!!!!!!!!!!!!!!!!!!!!!!!!!!!!!!!!!!!!!!!!!!!!!!!!!!!!!!!!!!!!!!!!!!!!!!!!!!!!!!!!!!!!!!!!!!!!!!!!!!!!!!!!!!!!!!!!!!!!!!!!!!!!!!!!!!!!!!!!!!!!!!!!!!!!!!!!!!!!!!!!!!!!!!!!!!!!!!!!!!!!!!!!!!!!!!!!!!!!!!!!!!!!!!!!!!!!!!!!!!!!!!!!!!!!!!!!! !!!!!!!!!!!!!!!!!!!!!!!!!!
!!!!!!!!!!!!!!!!!!
!!!!!!!!!!!!!!!!!!!!!!!!!!!!!!!!!!!!!!!!!
!!!
!!!!!!!!!!!!!
!!!!!!!!!!!!!!!!!!!!!!!!!!!!!!!!!
"""""""""""""""""""""""""""""""""""""""""""""""""""""""
" """"""""""""""""""""""""""""""""""""""""
""""""""""""""""""""""""""""""""""""""""""""""""
"""""""""""""""""""""
"""""""""""""""""
""""""""""""""""""""""""""""""""""""""""""""""""""""""
"""""""""""""""""""
"""""""""""""""""""
"""""""""""""""""""""" """"" """""""""""""""""""
""""
"
"""""""
"""""""""""""""""""""""""""""""""""""""""
""""""""""""""""
" "
""
"""""""
""""""""""""""""""""""""
"""""""""" """"""
""""""""""""""""""
"""""""""""""""""""""""""
""""""""""""""""""
""""""""""""""""""""
""" """"
""""""""
"""""""""""""""""" """"""""""""""""""""""""""""""""""""""""""""""""""
"""""""""""""""""""""""""""""""""""""""""""""""""""""""""""""""""""""
""""""""""""""""""""""
""
""""""""
"" """"""""""""""
""""""""""""""""" """""""""""""""""
" "
"
""
"""""""""""""
"""""""""""""""
""""""""""""""""""""""""""""""""""""""""""""""""""""""""""""""""""""""""""""""""""
""""""""""""""""""""""""
""""""""""""""""""""""""""""""""""""""""""""""""""""""""""""""""""""""""""""""""
""""""""""""""""""
""""""""""""""""""
"
"""""""""""""""""""""""""""""""""""""""""""""""""""""""""""""""""""""""""""""""""""""""""
""""""""""""""""""""""""""
"""""""""""""""""""""
"""""
"""""""""""""""""""""""""""""""""""
"""""
""""""""""""""""""""""""
"
"""""""""""""""""""""""""""""""
"""""""""""""""""""""""
""""""""""""""
""""""""
""""""""""""""""""""""""""""
""""""""""""""""""""
"""""""""""""""""""""""""""""""""""""""""""""""""""""""""" """"""
""
"""""""""""""""""""
"""""""""""""""""""""""""""""""""""""
"""""""" """"""""""""""""""""""""""""""""""""""""""""""""""""""""""""""""""""""""
"""""""""""""""""""""""
""""""""""""""""""""""""""""""""""""""""""""""""""""""""""""""""
"
""
""""""""""""""""""""""""""""""""""""""""""""""""""""""""""""""""""""""""""""
""""""""""""""" """"""""""""""""""""""""""""""""""""""""""""""""""""""""""""""""""""""""""""""""""""""""""""
"""""""""""""""""""""""""""""""""""""""""""""""" """"""""""""""""""""""""""""""""""""""""""""""""""""""""""""""""""""""""""""""""""""""""""""""""""""""""""""""""""""""""""""""
"
""""""""""""""" """""""""""""""""""""""""""""""""""""""""" """""""""""""""""""""""
""""""" "
""""""""
"""""""""""
"""""
""""""""""""""""""""""
""""""""""""""""""""""""""""""""""""""""""""
"""""""""""""""""""""""""""""""""""""""""
"
""""""""""""""""""""""""
"""""""""""""""""""""
"""""""""""
""""""
""""""""""""""""""""""""""""""""""""
""""""""""""""""""""""""""""""""""""""""""""""""""""""""""""""""""""""""""""""""""""""""""""""""""""""""
"""
""""""""""""""""""""
"""
"""""""""""""" """""""""""""""""" """"""""""""""""""""""""""""""""""""""""" """""""""""""""""""" """""""""""""""""""""""""""""
"""""""""""""""""" "
""""""""""""""""""""""""""""""""""""""""""""""""""""""""""""""""""""""""""""""""""""""""""""""""""""""""""""""""""""""
""""""""""""""""""""""""""""""""""""""""""
"
"""""""""""""""""""""" """""""""""""""""""""""""""""
""""""""
""""""""""""""""""""""""""""""""""""""""
""""""""""""""""
"""""""""""""""""""""""" """"""""""""""""""""""""
"
"""""""""""""""
""""""""""""""""""""""""""""""""""""""""""""""""""""""""""""""
" """"""""""""""""""""""""""""""""""""""""""""""""""""""""""""""""""""""""
""
"""""""""""""""""""""""
"""""""""""""""""""""""""""""""""""""""""""""""""""""""""""""""""""""""""""""""""""
""""""""" """""""""""""""""
"""""""""""""
"
""
""""
""""""""""""""""""""""""""""""""
"""""""""""""""""""""""""""""""
"""""""""""""""""""""""""""""""""""""
"""""""""""""""""""""""""""""""""""""
" """"
"""""""""""""""""
"""""""""""""""""""
"""""""""""""""""""""""
"""""""""""""""""""
"""""""""""""""""""""""""""""""""""""""""""""""" """"""""""""""" """"""""""""""""""""
"""""""""""""""""""""""""""""""""
""""""""
"""""""""""""""""""""""
"
"""""""""""""""""""""
"""""""""""""""
"""""""""""""""""""""
""""""""""""""""""""""
""""""""""""""""""""""
"
""
""""""""""""""""""""""""""""""""""""""
"
""
"
" """""""""""""""""""
"
""""""""""""""""""""""""""""" """""
"""""""""""""""""""""""""""""""""" """""""
" """"""""""""""""""""""""""""""" """""""""""""""""""""""
"""""""""""""""
"""""""""""""""""""""""""""""""""""""""""
""""""""""""""""""""""""""""""""""""""""""""" "
"""""""""""""""""""""""""""""""""""""""""""""""""""""" "
""""""""""""""""""""""""
"
"""""""""""""""""""""" """"""""""""""""""""
""""""""""""""""""""""""""""""""""""""""""""""" "" """""""""""""""""""""""""""""""""""""""""""""""" """"
""""""""""""""""""""""
"
""""""""""""""""""
""
""""""""""""""""""
""
""""""""""""""""""""""
""""""""""""""""""""""""""""""""""""
"""""""""""""""""""""""""""""""""""""""""""""""""""""""""""""""""
""""""""""""""""""""""
"""""""""""""" """"""""""""""""""""""""""""""""""""
""""""""""""""""""""""""
"""""""""""""""""""""""""""""""""""""""""""""""""""""""""""""""""""""""""""""""""""
""""""""""""""""""""""
"
"""""""""""""""""""""""""""""""""""""""""""""""""""""""""""""""""""
""""""""""""""""""
""""""""
""""""""""""""""""
""""""""""""""""""""""""""""
"""""""
"
"
""""""""""""""""""""""""""""""""""""""""""""""""""""""""""""""""" "
""""""""""""""""""" "
"
""""""""""""""""""""
""""""""""""""""""""""""""""""
"""""""""""""""""""""""""""""""""""""""""""""""""""""
"""""""""""""""""""""""""""""""""""""""
"""""""""""""""""""""
""""""""""""""""""
"
" """""""""""""""""""""""""""""""""""""""""""""""""""""""""""" "
"
""""""""""""""""""""""" """""""
""""
"""""""""""""" """"""""""""""""""""""""""""""""""""""" """"""""""""""""""""""
""
"
""""""""""""""""""" ""
""""""""""""""""""""""""""""""""""""""""""""""""""""
""""""""
"""""""""""""""""""
""""""""""""""""""""""
"""""""""""""""""""""""""""""
"""""""
"""""""""""""""""
""""""""""""""""""
""""""""""""""""""""""""""""""""""""""""""""
""""""""""""""""""""""
""""""""""""""
""""""""""""""""""""""
"""""""""""""""""""""""""""""""
"""""""""""""""""""""""""""""""""""""""" """"""""
""""""""""""""""""""""""""""""""""""" """"""""""""""""""""""""""""""""""""""""""
"""""""""""""""""""""""""""""""
"""""""" """""""""""""""""""" """"""""""""""""""""""""""""""""""""""""""""" """""""""""""""""
"""""
""""""""
"""""""""""""""""""
"""""""""""""""""""""""
""""""""""""""""""""""""""""
"""""""""""""" """ """""""""""""""""""""""
""""""""""""""
""""""""""""""""""
"
"""""""
"""""""""""""""""""""""""""""""""""""
""""""""""""""""""""""""""""""""""""""""""""""""""""""""""""""""" """""""""""""""""""""""""""""""""
""""""""""""""""""""""
""""""""""""""""""""""
"
""""""""""""""""""""""""""""""""""""""""""""""""""""""
"
""""""""""""""
"""""""""""""""""""""
""""""""""""""""""""""""""
"""""""""""""""""""
""""""""""""""""""""""""""""""""""""""""""""""""
"""""""""""""""""""""""""""
"""""""""""""""""""
"""""""""""""""
"""""""""""""""""""" """""""
""""""""
""""""""""""""""""
"""""""""""""""""""""""""""""""""""""""""""""""""""""""""""""""" """""""""""""""""""""""""""
"""""""""""""""""""""
"""""""""""""""""""""""""""""""""""""""""""""""""""""""""""""
""""""""""""""""""""""""""""" """""""" """""""""""""""""""""""""""""""""""""""""""""""""""""""""
"
""""""""""""""""""""""
"
"" """""""
""""""""""""""""""""""""""""""""""""""""""""""""""""""""""""""
""""""""""""""""""""""
""""""""""""""
"""""""""""""""""" ""
""""""""""""""" """" """""""""""""""""""""""""""""""""""""""""""
"""""""""""""""""""""""""""
""""""""""""""""""""""
"
"""""""""""""""""""""""""""""""""""""""""""""""""""""""""""""""""" """""""""""""""""""""""""""""""""""""""""""""""""""""""""""""""""""""""""""""""""""""""""""""""""""""""""""""""""""""""""""""""""""""""
""""""""""""""""""""""""""""
"""""""
""""""""""""""""""
"""""""""""""""""""""""""""""""""""""""""""""""""
""""""""""""""""""""""""""""""""""""""""""""""""""""""""""""""""
""""""""""""""""""" """""""""""""""""""""
"""""""""""""""""" """"""""""""""""""""""""""""""""
"""""""""""""""""""""""""""""""""""""""""""""""""""""""""""""""""""""""""""""""""""" """"""""""""""""""""""
"""""""""""""""""""""""""""""
"""
"""""""""""""""""""""""""""""""""""""""""""""""""""""""""""""""""""""""""""""
"
""
""""""""""""""""""""""""
"
"
"""""""""""""""""""
"
"""""""""""""""""""""
""""""""""""""""""""""
"""""""""""""""""""""""""""""""""""""""""""""""""""""""""""""""
""""""""""""""""""""""
""""""""""""""""""
""""""""""""""""""""""""""""""""""""""""""""""""""""""""""""""""""""""""""""""""""""
""""
"
"
""""""""""""""""""""
"""""""" """""""""""""""""""""" """"""""""""""""""""""""
"""""""""""""""""""""
""""""""""""""""""""""""""""""""""""""""""""""""""""""""""""""""""""""""""""""""""""""""""""""""""""""""""""""""""""""""""""""""""""""""""""""""""""""
"""""""""""""""""""
""""
"
""
"
""""""""""""""""""""""""""""""""""""""""""""""""""""""
""
""
"
"""""""""""""""""""""""""""""""""""""""""""""""""""""""""""""""""""""""" """""""
""""""""""""""""""""""""""""""""""""""""""""""""""""""""""""" """"""""""""""""""""""""""
""""""""""""
""" """""""""""""""""""""""
""""""""""""""""""""""""""""""""""""""""""""""""""""""""""""""""""""""
""
"""""""""""""""""""""""""""""""""""""""""""""""""""""""""""""""""""""""""""""""""""""
"""""""
"""""""""""""""""""""""""""""""""""""""""""""""""""""""
"
""""""""""""""""""""""
"" ""
""""""""
"""""""""""""""""""
"""""""""""""""""""""""""""""""""""""""""""
""""""""""""""""""""""""""""""""""""""""""""""""""""""""""""""""""""""""""""
"""""""""""""""""""""""""""""""""""""""""""""""""""""""""""""""""""""""""""""""""""""""""
""""""" """""""""""""""""""""""""""""""""""""""""""""""""""""""""
""""""""
" "
""""""""""""""""""""""
"""""""""""""""""""""""""""""
" """""""""""""""""""""""""""
"""""""""""""""""""""" """""""""""""""""""""""""""""""""
"
""""""""""""""""""""""""""""""""""""""""""""""""""""""""""""""""""""""""
""""""""""""""""""""""""""
"""""
"""""""""""""""""""""""""""
"""""""""""""""""""""""""""""""""""""""""""""""""" " """"""""""""""""""
""""""""""""""""""""""""""""""""""""""""""""""""
""""""""""""""""""""""
""""""""""""""""""""""
""
"""""""""""""""""""""""
""
"""""""""""""""""""""""""""""""""""""""""""""""""""""""""""
"
"""""""""""""""""""""""""""""""""""""""""""
"""""""""""""""""""""""""""""""""""""""""""""""""""""""""""""""""""""
""""
""""""""""""""""""""""""""""""""""""""""""""""""
"
""""""""""""""""""""
"""" """""""""""""""""""""""""""""""""""""""""""""""""""""""""""""""""""""""""""""""""""""""""""""""""""""""""""""""" """""""""""""""""""""""""""""""""""""""""""""""""""""""""""""""""""""""""""""""
"""""""
""""""""""""""""""""
"###############################################################################################################################################################################################################################################################################################################################################################################################################################################################################################################################################################################################################################################################################################################################################################################################################################################################################################################################################################################################################################################################################################################################################################################################################################################################################################################################################################################################################################################################################################################################################################################################################################################################################################################################################################################################
PEPCO
Poplar Point
Kenilworth Park Landfill North
Washington Navy YardSoutheast
Federal Center
Kenilworth ParkLandfill South
Washington Gas
CSX
CSX
Former Hess Oil Corporation and
Gulf Oil CorporationBulk Oil Facilities
Steuart Petroleum
Firth-SterlingSteel
JBABJBABJBABJoint BaseAnacostia-Bolling
Fort McNair
Piney Run
Watts Branch
Nash Ru n
Dueling Creek
Pope Branch
Hickey Run
Northwest Branch Anacostia River
Fort Dupont Creek
Northeast B
ranch Anacostia
Rive
r
Lower Beaverdam Creek
LegendNOAA DATABASE
# 2003 Active Capping Site Char Rpt (8)
NIRIS DATABASE
" 2002 WA Navy Yard Pier No. 5 (16)
" 2006, 2009 Washington Navy Yard Sed/Tiss (70)
CSX DATABASE
! 2011 CSX Sediment Study (38)
SEDIMENT STUDY AREA
WASHINGTON DC BOUNDARY
CLEANUP SITE BOUNDARY(LAND BASED PORTION)
CLEANUP SITEAREA OF INFLUENCE ®
0 1,500 3,000FeetSOURCE: MODIFIED FROM CH2MHILL, 2011, GEOSYNTEC, 2012,
DCGIS, 2012, AND DEPARTMENT OF THE NAVY, 2013.
FIGURE 4.17PREVIOUS SUBSURFACE SEDIMENT
SAMPLING LOCATIONS
Dat
e Sa
ved:
5/1
4/20
14 2
:54:
40 P
M U
ser:
joel
.pet
ers
Pat
h: S
:\CA
DD
\S\2
592\
mxd
\Wor
kPla
n\Fi
gure
_04_
17_A
naco
stia
_11x
17_S
OU
RC
E_SU
BS
EDIM
EN
T.m
xd
ANACOSTIA RIVERSEDIMENTS PROJECT
Note: The Cleanup Site Boundaries (Land Based Portion) for the Washington Navy Yard are reflective of its historic extent.
DRAFT

Remedial Investigation Work Plan Anacostia River Sediments Project
69
5.0 REMEDIAL INVESTIGATION
The RI will address the goals outlined in Table 4.1. Additional sampling is necessary to validate previous sampling, identify potential sources of COCs in the environmental media, allocate contamination to specific sources where possible, and evaluate the potential for risk to human health and the environment. Additional data is also required to support the NRDA process and provide information needed to assess remedial options in a FS. The sampling approach for sediment, fish and turtle tissue, and benthic invertebrate data gaps will be dynamic in that the sampling performed will be tailored to the conditions observed in the field. A set of implementation plans including a FSP, QAPP, Health and Safety plan have been developed to detail the sampling and analytical methods and quality control criteria and procedures that will be used.
The RI will consist of the collection of samples from surface sediment, subsurface sediment, surface sediment pore water, surface water, and invertebrate, fish, and turtle tissue. In addition, sediment samples will be collected to conduct benthic invertebrate toxicity tests. Table 5.1 (below) summarizes the number of samples planned for each environmental medium and indicates the report section in which sampling activities for each medium are discussed. (Turtles will be collected opportunistically.)
TABLE 5.1 Summary of Planned Sampling Activities for the RI
Environmental Medium Number of
Planned Samples Section Surface Sediment 134 5.1.2 Subsurface Sediment 243 5.1.2 Surface Sediment Pore Water 19 5.1.3 Benthic Invertebrate Characterization (Toxicity Test and Tissue Analysis)
42 5.1.4 and 5.1.5
Surface Water 14 5.2 Fish Tissue 46 5.3
Table 5.2 lists the Maryland state plane coordinates for each sampling location and shows the various media that will sampled at each location. In addition, Table 5.3 summarizes for each medium the laboratory analyses that will be conducted.
5.1 Sediment CharacterizationBuilding upon historical databases, the RI sampling program is designed to gather the majority of the remaining data needed for the RI and risk assessments, as well as initiate some NRDA data collection. The overall RI objectives that the sediment sampling efforts will support include:
� Identify and evaluate direct and indirect, known and unknown sources of significant contamination,
Remedial Investigation Work Plan Anacostia River Sediments Project
70
� Define the horizontal and vertical extent of contamination in surface and subsurface sediment, � Identify surface and buried sources of contamination that pose a potential risk to human health
or the environment, � Assess what sources can be controlled by early actions such as the removal of an unanticipated
contaminant hot spot that presents an immediate threat to human health or the environment, � Update the watershed sediment/surface water model, and � Collect data to understand contaminant fate and transport in the river system to adequately
support remediation decisions.
The following types of data will be collected during sediment sampling:
� Surface sediment chemistry to characterize the nature and extent of contamination, evaluate potential contaminant sourcing processes, support the ERA and the HHRA, and support the planned FS,
� Sediment bioassays to support the assessment of benthic risks for the ERA, � Subsurface sediment chemistry and physical data to characterize the nature and extent of
contamination, and � Surface and subsurface sediment physical data to augment the available sediment chemistry
data and support the planned FS.
Sediment sample locations are shown on Figure 5.1. The analyses planned at each location along with overall sampling objective (RI, NRDA, or both), summary of rationale, and location description are shown on Table 5.4.
5.1.1 Bathymetric Survey As noted in Section 4.0, a bathymetric survey was conducted covering the entire study area. The survey was performed in September and October, 2013 and is documented in a report included as Appendix A. The bathymetric survey provided a basis for understanding the depth of the water column and the configuration of the river bottom and was used to prepare a contour map of the top of the sediment surface in and around the investigation areas. The surveying systems that were used included a multibeam echo sounder for the deeper water areas and a multichannel sweep system to efficiently survey areas with shallower water. A separate buried utility survey was conducted following standard utility notification procedures. The procedures used for the utility survey are discussed in the FSP; the utility survey was completed prior to the commencement of surface or subsurface sediment sampling.
5.1.2 Physical and Chemical Sediment Sampling Sediment samples will be collected from the sediment surface at approximately 134 locations within the project area to laterally characterize the nature and extent of contamination. Sample locations are shown in Figure 5.1. The surface sediment sample interval is defined as 0 to 0.5 foot below the sediment surface. The sampling locations shown on Figure 5.1 reflect the bathymetric survey results and associated analyses of the data generated by this survey. In addition, samples in close proximity to utilities will be relocated as necessary to ensure that sample collection can proceed safely.
Remedial Investigation Work Plan Anacostia River Sediments Project
71
Surface grab samples will be collected using a petite Ponar sampler from the top 0.5 foot of sediment at each sampling location to characterize the surface sediments, to validate previous sample results, to fill existing data gaps, and to characterize the sediments near MS4 and CSS outfalls as appropriate. If obstructions such as boulders or debris are encountered at a specific station, the location of the station may be changed to collect sediment samples as required.
Nearshore surface sediment samples will be collected within areas where fishing or nearshore recreation is documented or observed, including Kingman and Heritage Islands Recreational Areas, Bladensburg Waterfront Park, and Anacostia Park. The purpose of these sample locations is to evaluate the potential risk to anglers or other recreationalists who may be exposed to nearshore sediment during low tides. Fourteen samples are anticipated; however, sample numbers and locations may be adjusted based on field observations of human activity.
During this phase of work, the surface sediment samples will be logged for visual and physical observations. A portion of the sample will be placed in a pan, inspected for sediment type, color, odor, obvious signs of biota and other notable features, and then returned to the river. The remainder of the sample will then be prepared for shipment to the laboratory.
Field personnel will record field observations of the physical characteristics of the sediment encountered at each sampling station and also important observations regarding the physical characteristics of the study area.
Deep sediment core samples will be collected from 83 stations (Figure 5.1) at depths up to 10 feet below the sediment surface to characterize the sediment profile at each location. Based on field screening, up to three sediment horizons will be selected from each core for sampling. Field screening will consist of visual inspection of the core samples for indications of potential contamination including abnormal discoloration or odors, elevated photoionization detector (PID) readings, or other indications suggesting the presence of contamination. The 10 foot depth is based on historical subsurface sampling (Velinsky et al. 2011). If field screening at a given sampling point indicates the potential that contamination extends to depths greater than 10 feet, sampling will continue to greater depths to the extent that the field sampling equipment will permit. Some locations may not achieve 10 feet because of shallow sediment depth or the presence of an obstruction to drilling. Locations that show significant contamination at depth may be evaluated further in a follow-up sampling phase. The sediment cores will be collected using a vessel equipped to advance a 2-4 inch diameter Vibracore™ sampler (or equivalent) to the target depth below the sediment surface, or to refusal, whichever is encountered first.
Field personnel will record field observations of the subsurface sampling event to include:
� Sample station designation � Location coordinates recorded with a Global Positioning System (GPS) unit � Water surface elevation � Depth to sediment � Depth core was advanced

Remedial Investigation Work Plan Anacostia River Sediments Project
72
� Depth of sediment recovered � Sediment core logging for sediment stratigraphy
All sediment samples will be submitted for the following physical and chemical analyses (Table 5.3):
� Grain size by sieve and hydrometer � TOC � PP List � PCB congeners (all shallow sediment samples and selected deep sediment samples as noted
below)
Several specialized analyses will be conducted on a subset (20%) of the sediment samples:
� PCB congeners (deep sediment samples) � Dioxins and furans (shallow and deep sediment samples) � AVS/SEM (shallow and deep sediment samples) � Moisture content/percent solids (deep sediment samples) � Bulk density (shallow and deep sediment samples) � Atterberg Limits (shallow and deep sediment samples)
It is estimated that up to 249 discrete interval subsurface sediment samples will be collected for laboratory analysis. The locations of the specialized analyses will be determined by site specific conditions within the project area, such as likely contaminant sources or fluvial geomorphological features. The specific locations will be outlined in the FSP.
5.1.3 Sediment Pore Water Sampling Pore water within the surface sediment will be sampled at 19 locations (Figure 5.2) to a depth of 0-0.5 feet below the sediment surface. Sample locations were selected to provide spatial coverage of all reaches of the river within the Study Area. The 19 locations will correspond to selected benthic invertebrate exposure sampling locations that are in close proximity to outfalls and areas were elevated PAH concentrations in surface sediment were previously identified. Pore water collection locations will be co-located at selected surface sediment locations as noted in Tables 5.1 and 5.5. Sample locations will be recorded with a GPS unit.
All pore water samples will be collected ex situ via laboratory-based extraction and submitted for the following chemical analyses:
� TOC � Dissolved organic carbon � PP List except VOCs; also, if a limited sample volume is available for a given sample, the
parameter list will be prioritized and reduced accordingly as will be detailed in the FSP.
5.1.4 Sediment Sampling for Benthic Invertebrate Toxicity Tests Benthic invertebrate characterization sampling will be conducted at 42 of the 134 surface sampling locations. The benthic exposure sampling locations are listed in Table 5.5 and shown in Figure 5.2.

Remedial Investigation Work Plan Anacostia River Sediments Project
73
Surface sediment will be collected for toxicity testing from at least half of the benthic exposure sampling locations; benthic invertebrates will be collected where available at the remaining locations. Benthic invertebrates will be collected at locations where they are encountered in sufficient numbers to support tissue analysis, as determined through field judgment. If insufficient benthic invertebrates are present at any given sampling location, sediment will be collected for toxicity testing. Sample points were selected to achieve three goals simultaneously: (1) general spatial coverage of all reaches of the river; (2) biased to include inlets, outfalls, and bridges; and (3) biased toward shallower waters away from people, closer to vegetated habitat where animals might be more likely to forage at low tide.
Direct toxicity tests provide a measure of survival, growth, and reproduction of invertebrates that are in direct contact with sediment. Results will provide both direct and indirect evidence of potential impact to support the ERA and NRDA: (1) The extent of direct toxicity to organisms exposed to surficial sediment is a measure of injury to the aquatic ecosystem and a line of evidence in the ERA; and (2) the potential adverse effect on the availability of typical invertebrate species in the aquatic food web, which is an indirect measure of injury to high trophic level predators, including humans. For example, if benthic invertebrate prey sources are in decline because of toxic effects of sediments, then other organisms (fish, turtles, birds, and mammals) that prey on the invertebrates may experience adverse effects such as increased foraging effort, decreased nutrition, or other indirect effects.
Surficial sediment samples will be collected for lab-based toxicity testing using the amphipod (Hyalella azteca) and midge (Chironomus dilutus). Effects of surface sediments on growth and reproduction of Hyallella azteca will be measured using a 42-day direct exposure test (TT-BRF/TX-SOP-O-065). Effects of surface sediment on survival of Chironomus dilutus will be measured using a 10-day direct exposure test (TT-BRF/TX-SOP-O-019).
5.1.5 Sampling for Benthic and Epibenthic Invertebrates Organisms may not only experience direct toxic effects of sediment contaminants, but may also accumulate contaminants in their tissues. Tissue concentrations of field-collected organisms serve dual purposes as indicators of direct exposure and uptake by benthic invertebrates, and as measures of potential transfer of contaminants from the sediment to other organisms in the aquatic ecosystem. Tissue concentrations in organisms collected from the Anacostia River will be used in both the ERA and the NRDA.
Collecting benthic and epibenthic invertebrates in the field from specific locations is more difficult than collecting sediment because organisms may not be distributed as expected. The purpose of analyzing field-collected organisms is to measure concentrations of contaminants that might actually be transferred to predators at the site. Although laboratory-based bioaccumulation tests on collected sediments may be simpler to conduct, the results are difficult to link to the actual transfer of contaminants from sediment to invertebrates in the river. Tissue concentrations in field-collected organisms represent lifetime exposure under environmentally variable conditions.
Invertebrate samples will be collected opportunistically at approximately half of the locations listed in Table 5.5 and shown in Figure 5.2. During collection of surface sediment samples, the availability of

Remedial Investigation Work Plan Anacostia River Sediments Project
74
invertebrate tissue will be qualitatively evaluated and a decision made whether adequate volume of invertebrate tissue can be obtained within 30 minutes of sampling.
Field-collected tissue samples are the most direct measure of actual ingestion exposure to higher trophic level predators. For example, fish, turtles, birds, and mammals are exposed to whatever chemicals are in the bodies of the benthic organisms they eat. Whenever possible, field-collected tissue concentrations will be used in food chain models to represent dietary exposure to chemicals. However, field-collected tissue samples are limited by two factors: (1) the confounding of multiple sources of contaminants to the benthic organism and (2) the absence of benthic organisms in some locations.
Field-collected tissues may not be available in all sediment locations. Some existing reports indicate that portions of the Anacostia River may have few benthic invertebrates (whether naturally or as a result of contamination).
The field tissue data provide a measure of potential exposure of organisms to contaminants in sediment and other media. The laboratory toxicity tests can support evaluation of the cause of scarce benthic invertebrate populations in certain areas. In summary, laboratory and field data will be integrated in the ERA and NRDA to support rational, defensible conclusions about complete exposure pathways leading to injury and risk.
5.1.6 Approach to Estimating Background and Ambient Concentrations in Sediment Sediments in the study area contain naturally-occurring (background) concentrations of metals as well as ambient concentrations of many ubiquitous anthropogenic chemicals. The ERA and HHRA require that chemical concentrations at a site be evaluated within the context of background/ambient concentrations so that site-specific incremental risk can be characterized. Likewise, background/ambient concentrations must be considered in the development of remedial alternatives in the FS.
In urban ecosystems such as the tidal Anacostia River, identifying unimpacted background sampling locations for sediment is problematic because sediments in the river are derived from urbanized areas upstream. Background metals concentrations in sediments will be derived from the published literature to the extent practicable. If necessary, background metals concentrations will be measured directly in deep cores from within the study area.
Ambient concentrations of organic constituents such as PCBs, PAHs, and pesticides in sediment represent contributions from multiple sources, including the known environmental sites within the study area, CSOs, atmospheric deposition, tributaries, surface runoff, and other sources. Background concentrations of organic chemicals that do not naturally occur are assumed to be zero, excepting PAHs. Total ambient PAH concentrations may represent both naturally occurring background concentrations resulting from events such as fires and anthropogenic sources such as petroleum releases. Ambient concentrations of organic COCs will be estimated based on literature reviews and limited upstream sampling, if necessary.
5.2 Surface Water Sampling Nearshore surface water samples will be collected from within 1 foot of the surface within areas where fishing or nearshore recreation is documented or observed, including Kingman and Heritage Islands
Remedial Investigation Work Plan Anacostia River Sediments Project
75
Recreational Areas, Bladensburg Waterfront Park, Anacostia Park, and the Haines Point waterfront bordering Washington Channel. Sampling locations are shown on Figure 5.3. The surface water samples will be collocated with the 14 nearshore sediment samples described in Section 5.1.2 above. Where necessary, surface water sample locations will be adjusted as needed in response to site specific conditions. The purpose of these sample locations is to evaluate the potential risk to anglers or other recreationalists who may be exposed to nearshore surface water while fishing, boating, swimming, or participating in other activities on the river. A minimum of 14 samples are anticipated; however, the number of samples and sample locations may be adjusted based on field observations of actual or potential human activity. Sample locations are shown in Figure 5.3. Sample locations will be recorded with a GPS unit. All surface water samples will be submitted for the following chemical analyses:
� Field parameters (pH, temperature, specific conductivity, oxidation/reduction potential, dissolved oxygen)
� TOC � PP List � Dioxin-like PCB congeners � Dioxins and furans
5.3 Fish, Turtle, and Crayfish Tissue Sampling and Analysis Fish and turtle tissue concentrations provide evidence that these organisms were exposed to contaminated surface water, sediment, or prey items. Because fish and turtles move around, individual samples do not provide a definitive link to a particular location; however, they do provide an overview of injury and risk within the range of the individuals. Fish tissue sampling will be conducted at 42 locations. Up to six common snapping turtles will be collected opportunistically throughout the tidal Anacostia River. Sample locations are shown on Figure 5.3. Sample location descriptions and rationale are provided in Table 5.6.
At each fish sampling location, one to three types of fish samples will be collected (based on availability). Ideally, fish from three feeding guilds (forage fish, mid-level predator, and top predator) will be collected. However, existing data suggest that top predators (such as catfish and largemouth bass) are absent from some reaches of the river. Forage fish include herring, banded killifish, and topminnows. Mid-level predators are represented by various species of sunfish, including bluegill and pumpkinseed.
Although crayfish are epibenthic invertebrates, their size and behavior make them more likely to be collected during fish sampling than during benthic invertebrate sampling. Crayfish will be collected using baited minnow traps in designated locations. In addition, crayfish will be collected wherever they become available in the field. They are likely to be captured in seines and minnow traps, as well as during electroshocking.
Fish and crayfish samples will be evaluated in the BERA in two ways: (1) risk to these species directly will be estimated by comparing tissue concentrations with effect levels, and (2) tissue concentrations will be incorporated into estimates of food chain transfer to piscivorous birds and mammals (such as the green heron, osprey, cormorant, otter, and raccoon). (See Section 7.0 for discussion of typical birds and

Remedial Investigation Work Plan Anacostia River Sediments Project
76
mammals in the Anacostia River.) Fish and crayfish tissue data will also be used in the HHRA and to support injury determination in the NRDA.
Fish sampling locations were selected to provide spatial coverage of all reaches of the river within the Study Area. Within each reach of the river, sample locations were biased toward outfalls (where contaminants are expected). Sampling will also occur where the presence of contaminants is generally unknown such as inlets and backwater areas. Sample collection locations may be shifted in the field to accommodate logistical requirements of the selected sample collection methods. For example, in mid-summer, dissolved oxygen concentrations in the river often drop to levels that cause physiological stress to fish (Galli et al. 2010). The field team will monitor dissolved oxygen concentrations in the field and avoid collecting fishes when stresses related to low oxygen are severe. Details will be provided in the FSP.

")
!(")
")
")
")
")
")
")
")
")
")
")
!(
!(
")
!(
!(
!(!(
!(
!(!(
!(
!(
!(!(
!(!(
")
")
!(
!(!(
!(
!(
!(
!(
")
!(
")")
!(!(
!(!(
!(
!(!(
!(!(
!(
!(
!(
!(
!(
!(!(
!(
!( !(
!(!(!(
!(!(!(
!(
!(
!(
!(
!(
!(
!(
!(
!(
!(
!(
!(
!(
!(
!(
!(
!(
!(
")
")
")
")
")
")
")
")
")
!(")")
")
")
")
!(
")
!(")
!(!(
!(
!(
")!(
")
")")
")
!(
")
")!(
!( ")!(
")!(
")
")
!(
")
")
")
")
")
")
")
")
#0
#0
#0
#0
#0#0
#0
#0
#0
#0
#0
#0
#0
#0
#0
#0
#0
#0
#0
#0
#0
#0
#0
#0
#0
#0
#0
#0
#0
#0 #0
#0
#0
#0
#0
#0
#0
#0
#0
#0
#0
#0
PEPCO
Poplar Point
Kenilworth Park Landfill North
Washington Navy YardSoutheast
Federal Center
Kenilworth ParkLandfill South
Washington Gas
CSX
CSX
Former Hess Oil Corporation and
Gulf Oil CorporationBulk Oil Facilities
Steuart Petroleum
Firth-SterlingSteel
JBABJBABJBABJoint BaseAnacostia-Bolling
Fort McNair
KL-03
R1-03
R1-04
WC-02
R1-10
R4-05
KL-05
R7-07
R6-01R6-02
R6-03
R6-07
R3-04R3-03
R3-02
R2-09R2-07
R1-06
R1-08
R1-01
WC-01
WC-03
WC-04
WC-08
WC-10
WC-09
R7-10
R4-06
R4-03
R1-05
WC-06
WC-05
R4-04
R1-11
WC-07
R2-02
R2-03
R2-04
KL-01
KL-04
KL-07
R1-02
R2-01
R4-01
R4-09
R5-02
R5-03R5-04
R6-09
R7-02
R7-01
R7-05R7-04
R7-06
R7-08 R7-09
KL-02
R3-09
R3-08
R3-06
R2-10
R3-13
R6-14
R7-13
R7-17
R7-20
R1-12
KL-11
KL-14
KL-22
KL-12
R3-12
R3-15
R6-11
R6-13
R6-17
R6-15
R7-11
R7-15
R7-21
R7-23
R7-22
KL-20
KL-17
R2-13
R6-05R6-04
R6-06
R6-08
R3-01
R3-07
WC-11
R1-07
KL-06R4-08
KL-08KL-09
R2-08
R2-06R2-05
R3-14
R6-10
R7-14
R1-13
KL-10
R3-11
R3-10 R3-16
R7-12
R7-16
R7-19
KL-21
KL-16
R2-12
R2-15
R2-11
R2-16
KL-19
KL-15
KL-23
R7-03
R6-12
R5-05
R5-01
R4-07
R4-02
R3-05
R1-09
KL-13
KL-18
R7-18
R6-16
R1-14R2-14
Legend#0 BENTHIC TISSUE SAMPLING LOCATION
") PROPOSED SHALLOW SEDIMENT SAMPLE
!( PROPOSED SHALLOW/DEEP SEDIMENT SAMPLE
CLEANUP SITE BOUNDARY(LAND BASED PORTION)
SEDIMENT STUDY AREA
CLEANUP SITEAREA OF INFLUENCE
WASHINGTON DC BOUNDARY
®0 1,500 3,000
FeetSOURCE: MODIFIED FROM CH2MHILL, 2011, ANDDCGIS, 2012.
FIGURE 5.1PROPOSED SEDIMENTSAMPLING LOCATIONS
Dat
e Sa
ved:
5/1
4/20
14 1
:52:
01 P
M U
ser:
joel
.pet
ers
Pat
h: S
:\CA
DD
\S\2
592\
mxd
\Wor
kPla
n\Fi
gure
_05_
01_A
naco
stia
_11x
17_P
RO
PO
SED
_SA
MP
LIN
G_L
OC
ATIO
NS
_SE
DIM
EN
T.m
xd
DRAFTR1-5
Italics underlined sample nameindicates sample is for humanhealth-pedestrian access to riverbank.
Note: The Cleanup Site Boundaries (Land Based Portion) for the Washington Navy Yard are reflective of its historic extent.
ANACOSTIA RIVERSEDIMENTS PROJECT

!(
!(
!(
!(
!(
!(
!(
!(
!(
!(
!(
!(
!(
!(
!(
!(
!(
!(
!(
#0
#0
#0
#0
#0#0
#0
#0#0
#0
#0
#0
#0
#0
#0
#0
#0
#0#0
#0
#0
#0
#0
#0
#0
#0
#0
#0
#0
#0 #0
#0
#0
#0
#0
#0
#0
#0
#0
#0
#0
#0
PEPCO
Poplar Point
Kenilworth Park Landfill North
Washington Navy YardSoutheast
Federal Center
Kenilworth ParkLandfill South
Washington Gas
CSX
CSX
Former Hess Oil Corporation and
Gulf Oil CorporationBulk Oil Facilities
Steuart Petroleum
Firth-SterlingSteel
JBABJBABJBABJoint BaseAnacostia-Bolling
Fort McNair
R4-05
WC-09
R7-20
R7-10
R4-06
R4-03
R1-07
R1-05
WC-06
WC-05
R4-04
R1-13
R1-12
R2-04
KL-01
KL-10
KL-12
R1-02
R3-12
R3-15
R4-09
R5-04
R6-13
R6-17
R7-02
R7-05
R7-06
R7-09
R7-12
R7-15
R7-21
R7-23
R7-22
KL-20
KL-21
KL-02
KL-08
R3-06
R2-13
KL-15
KL-23
Legend#0 BENTHIC TISSUE SAMPLING LOCATION
!( PORE WATER SAMPLING LOCATION
CLEANUP SITE BOUNDARY(LAND BASED PORTION)
SEDIMENT STUDY AREA
CLEANUP SITEAREA OF INFLUENCE
WASHINGTON DC BOUNDARY®
0 1,500 3,000Feet
SOURCE: MODIFIED FROM CH2MHILL, 2011, AND DCGIS, 2012.
FIGURE 5.2PROPOSED BENTHIC INVERTEBRATE
EXPOSURE AND PORE WATER SAMPLING LOCATIONS IN SURFACE SEDIMENT
Dat
e Sa
ved:
5/1
4/20
14 1
:54:
45 P
M U
ser:
joel
.pet
ers
Pat
h: S
:\CA
DD
\S\2
592\
mxd
\Wor
kPla
n\Fi
gure
_05_
02_A
naco
stia
_11x
17_P
RO
PO
SED
_SA
MP
LIN
G_L
OC
ATIO
NS
_BE
NTH
IC.m
xd
DRAFT
Note: The Cleanup Site Boundaries (Land Based Portion) for the Washington Navy Yard are reflective of its historic extent.
ANACOSTIA RIVERSEDIMENTS PROJECT
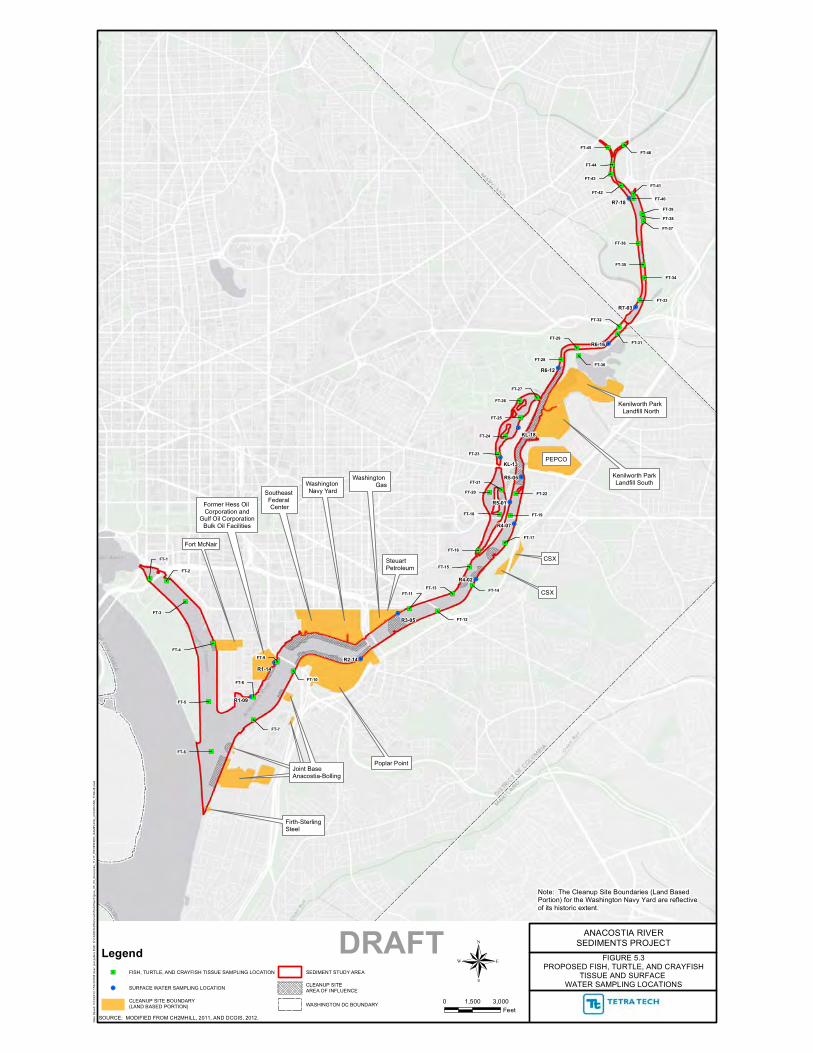
!.
!.!.
!.
!.
!.
!.
!.
!.
!.
!.
!.
!.
!.
"/
"/
"/
"/
"/
"/"/
"/
"/
"/
"/
"/ "/
"/
"/
"/
"/
"/
"/"/
"/ "/
"/
"/
"/
"/"/
"/
"/
"/
"/
"/
"/
"/
"/
"/
"/"/"/
"/"/
"/
"/
"/
"/"/
PEPCO
Poplar Point
Kenilworth Park Landfill North
Washington Navy YardSoutheast
Federal Center
Kenilworth ParkLandfill South
Washington Gas
CSX
CSX
Former Hess Oil Corporation and
Gulf Oil CorporationBulk Oil Facilities
Steuart Petroleum
Firth-SterlingSteel
JBABJBABJBABJoint BaseAnacostia-Bolling
Fort McNair
FT-9
FT-8
FT-7
FT-1
FT-2
FT-3
FT-4
FT-5
FT-6
FT-45FT-46
FT-44
FT-43
FT-42FT-41
FT-40
FT-39
FT-38
FT-37
FT-36
FT-35
FT-34
FT-33
FT-32
FT-31
FT-30
FT-29
FT-28
FT-27
FT-26
FT-25
FT-24
FT-23
FT-22FT-20
FT-18 FT-19
FT-16
FT-17
FT-15
FT-14FT-13
FT-12
FT-11
FT-10
FT-21
KL-18
R7-18
R7-03
R6-16
R6-12
R5-05
R5-01
R4-07
R4-02
R3-05
R1-09
R1-14
R2-14
KL-13
Legend"/ FISH, TURTLE, AND CRAYFISH TISSUE SAMPLING LOCATION
!. SURFACE WATER SAMPLING LOCATION
CLEANUP SITE BOUNDARY(LAND BASED PORTION)
SEDIMENT STUDY AREA
CLEANUP SITEAREA OF INFLUENCE
WASHINGTON DC BOUNDARY
®0 1,500 3,000
FeetSOURCE: MODIFIED FROM CH2MHILL, 2011, AND DCGIS, 2012.
FIGURE 5.3PROPOSED FISH, TURTLE, AND CRAYFISH
TISSUE AND SURFACE WATER SAMPLING LOCATIONS
Dat
e Sa
ved:
5/1
4/20
14 1
:56:
40 P
M U
ser:
joel
.pet
ers
Pat
h: S
:\CA
DD
\S\2
592\
mxd
\Wor
kPla
n\Fi
gure
_05_
03_A
naco
stia
_11x
17_P
RO
PO
SED
_SA
MP
LIN
G_L
OC
ATIO
NS
_TIS
SU
E.m
xd
DRAFT
Note: The Cleanup Site Boundaries (Land Based Portion) for the Washington Navy Yard are reflective of its historic extent.
ANACOSTIA RIVERSEDIMENTS PROJECT

TABL
E 5.
2Su
mm
ary
of P
ropo
sed
Med
ia-S
peci
fic S
ampl
es b
y Sa
mpl
e Lo
catio
n, P
age
1 of
5
Tabl
e 5.
2 - S
umm
ary
of M
edia
-Spe
cific
Sam
ple
Loca
tions
.xlsx
5/15
/201
4
Loca
tion
Reac
hX-
Coor
dina
te 1
Y-Co
ordi
nate
1Su
rfac
e Se
dim
ent
Deep
Se
dim
ent
Pore
Wat
er
2
Bent
hic
Inve
rteb
rate
Ex
posu
re 3,
4
Surf
ace
Wat
erLo
catio
n De
scrip
tion
WC-
0113
0657
1.14
143
4149
.780
5X
XM
outh
of W
ashi
ngto
n Ch
anne
l
WC-
0213
0617
7.21
943
7870
.932
9X
Wes
t sid
e of
Was
hing
ton
Chan
nel,
on sl
ope
betw
een
bank
and
thal
weg
WC-
0313
0650
1.44
843
7909
.749
3X
Cent
er o
f Was
hing
ton
Chan
nel,
mid
way
bet
wee
n tw
o ex
istin
g sa
mpl
e po
ints
WC-
0413
0676
5.40
543
8723
.230
8X
Out
fall
F-07
3-09
4W
C-05
1306
496.
674
4393
61.6
329
XX
Adja
cent
to m
arin
a do
ckW
C-06
1306
148.
096
4401
22.1
954
XX
XAd
jace
nt to
mar
ina
dock
WC-
0713
0471
9.15
144
1131
.359
5X
XCe
nter
of W
ashi
ngto
n Ch
anne
l, m
idw
ay b
etw
een
WC-
1 an
d ex
istin
g sa
mpl
e po
int
WC-
0813
0408
9.04
444
2105
.717
9X
Mid
-cha
nnel
offs
hore
from
Out
fall
F-51
8-46
0W
C-09
1303
807.
944
2659
.570
6X
XX
XO
utfa
ll F-
477-
703
Nor
th o
f I-3
95 B
ridge
WC-
1013
0338
7.43
744
2636
.470
3X
Mid
-cha
nnel
offs
hore
from
WC-
4 an
d W
C-1A
WC-
1113
0349
4.84
944
2771
.995
4X
Out
fall
F-29
0-05
7 N
orth
of I
-395
Brid
geR1
-01
1306
236.
071
4314
93.3
401
XHP
AH h
otsp
ot a
t mou
th o
f Ana
cost
ia R
iver
R1-0
213
0694
3.12
143
1216
.702
7X
XX
Adja
cent
to O
utfa
ll F-
128-
495
R1-0
313
0712
8.96
143
2537
.822
6X
Offs
hore
nea
r con
fluen
ce o
f Was
hing
ton
Chan
nel a
nd
Anac
ostia
Riv
er
R1-0
413
0750
3.00
143
4786
.437
2X
Conf
luen
ce o
f Was
hing
ton
Chan
nel a
nd A
naco
stia
Riv
er
R1-0
513
0855
3.47
443
4363
.657
9X
XX
Nor
th b
and
at O
utfa
ll F-
937-
544
R1-0
613
0816
2.21
943
5955
.176
6X
XFo
rt M
cNai
r Mar
ina
R1-0
713
0851
8.62
143
5565
.170
5X
XX
Nea
r sou
th b
ank,
just
ups
trea
m fr
om c
onflu
ence
with
W
ashi
ngto
n Ch
anne
lR1
-08
1309
013.
268
4357
06.5
86X
XHP
AH h
otsp
ot so
uthe
ast o
f R1-
5
R1-0
913
0884
4.16
843
5901
.597
7X
Char
acte
rizat
ion
for h
uman
hea
lth (p
edes
tria
n ac
cess
to
river
bank
)
R1-1
013
0986
6.54
4366
86.8
232
XSl
ope
nort
hwes
t of t
halw
eg b
etw
een
utili
ty c
orrid
ors
R1-1
113
1019
8.26
243
6619
.319
9X
XCe
nter
cha
nnel
, cov
erag
e of
uns
ampl
ed p
ortio
n of
ch
anne
l
R1-1
213
0981
9.19
843
7098
.962
8X
XX
Wes
t ban
k ne
ar F
-093
-544
cov
erag
e of
uns
ampl
ed
port
ion
of c
hann
el
R1-1
313
1034
7.14
543
7101
.635
3X
XX
XTh
alw
eg b
etw
een
utili
ty c
orrid
ors,
cov
erag
e of
un
sam
pled
por
tion
of c
hann
el
R1-1
413
1008
7.61
643
7724
.286
XCh
arac
teriz
atio
n fo
r hum
an h
ealth
(ped
estr
ian
acce
ss to
riv
erba
nk)
R2-0
113
1126
2.80
143
7920
.708
8X
XO
verla
p w
ith y
ear 2
000
data
poi
nt; e
ast s
hore
line
at
Popl
ar P
oint
R2-0
213
1177
1.69
943
8150
.073
1X
XEa
st sh
orel
ine
at P
opla
r Poi
ntR2
-03
1311
460.
364
4385
02.5
45X
XCe
nter
cha
nnel
, offs
hore
from
R2-
2
R2-0
413
1229
0.87
343
8175
.181
3X
XX
XEa
st sh
orel
ine
at P
opla
r Poi
nt, a
t Sew
er O
utfa
ll F-
897-
104
R2-0
513
1227
1.11
843
8831
.262
8X
XCe
nter
cha
nnel
from
R2-
4
Was
hing
ton
Chan
nel
Sout
h Ca
pito
l Str
eet
Brid
ge to
Mou
th o
f Riv
er
11th
Str
eet B
ridge
to
Sout
h Ca
pito
l Str
eet
Brid
ge
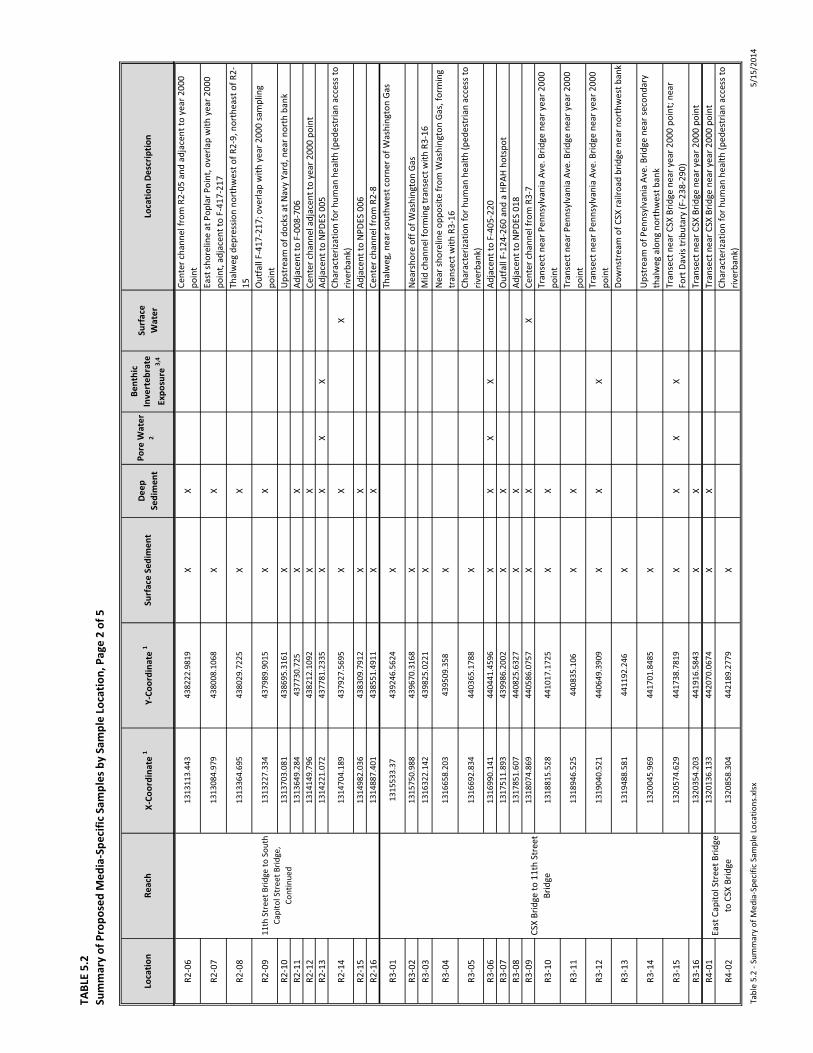
TABL
E 5.
2Su
mm
ary
of P
ropo
sed
Med
ia-S
peci
fic S
ampl
es b
y Sa
mpl
e Lo
catio
n, P
age
2 of
5
Tabl
e 5.
2 - S
umm
ary
of M
edia
-Spe
cific
Sam
ple
Loca
tions
.xlsx
5/15
/201
4
Loca
tion
Reac
hX-
Coor
dina
te 1
Y-Co
ordi
nate
1Su
rfac
e Se
dim
ent
Deep
Se
dim
ent
Pore
Wat
er
2
Bent
hic
Inve
rteb
rate
Ex
posu
re 3,
4
Surf
ace
Wat
erLo
catio
n De
scrip
tion
R2-0
613
1311
3.44
343
8222
.981
9X
XCe
nter
cha
nnel
from
R2-
05 a
nd a
djac
ent t
o ye
ar 2
000
poin
t
R2-0
713
1308
4.97
943
8008
.106
8X
XEa
st sh
orel
ine
at P
opla
r Poi
nt, o
verla
p w
ith y
ear 2
000
poin
t, ad
jace
nt to
F-4
17-2
17
R2-0
813
1336
4.69
543
8029
.722
5X
XTh
alw
eg d
epre
ssio
n no
rthw
est o
f R2-
9, n
orth
east
of R
2-15
R2-0
913
1322
7.33
443
7989
.901
5X
XO
utfa
ll F-
417-
217;
ove
rlap
with
yea
r 200
0 sa
mpl
ing
poin
tR2
-10
1313
703.
081
4386
95.3
161
XU
pstr
eam
of d
ocks
at N
avy
Yard
, nea
r nor
th b
ank
R2-1
113
1364
9.28
443
7730
.725
XX
Adja
cent
to F
-008
-706
R2-1
213
1414
9.79
643
8212
.109
2X
XCe
nter
cha
nnel
adj
acen
t to
year
200
0 po
int
R2-1
313
1422
1.07
243
7781
.233
5X
XX
XAd
jace
nt to
NPD
ES 0
05
R2-1
413
1470
4.18
943
7927
.569
5X
XX
Char
acte
rizat
ion
for h
uman
hea
lth (p
edes
tria
n ac
cess
to
river
bank
)R2
-15
1314
982.
036
4383
09.7
912
XX
Adja
cent
to N
PDES
006
R2-1
613
1488
7.40
143
8551
.491
1X
XCe
nter
cha
nnel
from
R2-
8
R3-0
113
1553
3.37
4392
46.5
624
XTh
alw
eg, n
ear s
outh
wes
t cor
ner o
f Was
hing
ton
Gas
R3-0
213
1575
0.98
843
9670
.316
8X
Nea
rsho
re o
ff of
Was
hing
ton
Gas
R3-0
313
1632
2.14
243
9825
.022
1X
Mid
cha
nnel
form
ing
tran
sect
with
R3-
16
R3-0
413
1665
8.20
343
9509
.358
XN
ear s
hore
line
oppo
site
from
Was
hing
ton
Gas,
form
ing
tran
sect
with
R3-
16
R3-0
513
1669
2.83
444
0365
.178
8X
Char
acte
rizat
ion
for h
uman
hea
lth (p
edes
tria
n ac
cess
to
river
bank
)R3
-06
1316
990.
141
4404
41.4
596
XX
XX
Adja
cent
to F
-405
-220
R3-0
713
1751
1.89
343
9986
.200
2X
XO
utfa
ll F-
124-
260
and
a HP
AH h
otsp
otR3
-08
1317
851.
607
4408
25.6
327
XX
Adja
cent
to N
PDES
018
R3-0
913
1807
4.86
944
0586
.075
7X
XX
Cent
er c
hann
el fr
om R
3-7
R3-1
013
1881
5.52
844
1017
.172
5X
XTr
anse
ct n
ear P
enns
ylva
nia
Ave.
Brid
ge n
ear y
ear 2
000
poin
t
R3-1
113
1894
6.52
544
0835
.106
XX
Tran
sect
nea
r Pen
nsyl
vani
a Av
e. B
ridge
nea
r yea
r 200
0 po
int
R3-1
213
1904
0.52
144
0649
.390
9X
XX
Tran
sect
nea
r Pen
nsyl
vani
a Av
e. B
ridge
nea
r yea
r 200
0 po
int
R3-1
313
1948
8.58
144
1192
.246
XDo
wns
trea
m o
f CSX
railr
oad
brid
ge n
ear n
orth
wes
t ban
k
R3-1
413
2004
5.96
944
1701
.848
5X
Ups
trea
m o
f Pen
nsyl
vani
a Av
e. B
ridge
nea
r sec
onda
ry
thal
weg
alo
ng n
orth
wes
t ban
k
R3-1
513
2057
4.62
944
1738
.781
9X
XX
XTr
anse
ct n
ear C
SX B
ridge
nea
r yea
r 200
0 po
int;
near
Fo
rt D
avis
trib
utar
y (F
-238
-290
)R3
-16
1320
354.
203
4419
16.5
843
XX
Tran
sect
nea
r CSX
Brid
ge n
ear y
ear 2
000
poin
tR4
-01
1320
136.
133
4420
70.0
674
XX
Tran
sect
nea
r CSX
Brid
ge n
ear y
ear 2
000
poin
t
R4-0
213
2085
8.30
444
2189
.277
9X
Char
acte
rizat
ion
for h
uman
hea
lth (p
edes
tria
n ac
cess
to
river
bank
)
East
Cap
itol S
tree
t Brid
ge
to C
SX B
ridge
11th
Str
eet B
ridge
to S
outh
Ca
pito
l Str
eet B
ridge
, Co
ntin
ued
CSX
Brid
ge to
11t
h St
reet
Br
idge

TABL
E 5.
2Su
mm
ary
of P
ropo
sed
Med
ia-S
peci
fic S
ampl
es b
y Sa
mpl
e Lo
catio
n, P
age
3 of
5
Tabl
e 5.
2 - S
umm
ary
of M
edia
-Spe
cific
Sam
ple
Loca
tions
.xlsx
5/15
/201
4
Loca
tion
Reac
hX-
Coor
dina
te 1
Y-Co
ordi
nate
1Su
rfac
e Se
dim
ent
Deep
Se
dim
ent
Pore
Wat
er
2
Bent
hic
Inve
rteb
rate
Ex
posu
re 3,
4
Surf
ace
Wat
erLo
catio
n De
scrip
tion
R4-0
313
2065
9.66
544
2878
.746
8X
XHP
AH h
otsp
ot d
owns
trea
m fr
om K
ingm
an L
ake
conf
luen
ce
R4-0
413
2158
3.00
444
3272
.631
XX
XX
East
ban
k be
twee
n Fo
rt D
upon
t Cre
ek o
utfa
ll an
d CS
X ra
ilroa
d br
idge
R4-0
513
2127
6.77
644
3524
.297
2X
XX
Nor
thw
est b
ank
upst
ream
of m
outh
of K
ingm
an S
loug
h
R4-0
613
2246
4.61
944
4102
.633
XX
East
ban
k no
rth
of F
ort D
upon
t Cre
ek O
utfa
ll
R4-0
713
2290
8.5
4451
47.8
984
XCh
arac
teriz
atio
n fo
r hum
an h
ealth
(ped
estr
ian
acce
ss to
riv
erba
nk)
R4-0
813
2267
8.19
144
5359
.292
8X
XTr
anse
ct n
ear E
ast C
apito
l St.
Brid
ge
R4-0
913
2293
9.66
744
5264
.976
XX
XX
Tran
sect
nea
r Eas
t Cap
itol S
t. Br
idge
; nea
r Cha
plin
tr
ibut
ary
(F-9
03-3
71) a
nd 2
000
poin
tR5
-01
1322
669.
696
4463
01.1
005
XCh
arac
teriz
atio
n fo
r hum
an h
ealth
(ped
estr
ian
acce
ss to
R5
-02
1322
989.
863
4467
24.8
169
XX
Adja
cent
to F
-090
-064
R5-0
313
2320
2.58
744
7537
.779
5X
XTr
anse
ct d
owns
trea
m fr
om y
ear 2
000
tran
sect
R5-0
413
2308
8.74
244
7545
.017
XX
XX
XTr
anse
ct d
owns
trea
m fr
om y
ear 2
000
tran
sect
R5-0
513
2328
8.11
144
7654
.704
1X
XCh
arac
teriz
atio
n fo
r hum
an h
ealth
(ped
estr
ian
acce
ss to
riv
erba
nk)
R6-0
113
2336
7.74
444
8339
.719
5X
XAt
mou
th o
f inl
et fo
r out
fall
at so
uthw
est b
ound
ary
of
the
Pepc
o sit
e
R6-0
213
2305
1.99
344
8462
.642
4X
Cent
er c
hann
el o
ff of
Pep
co si
te; n
ear A
NS
2000
sam
ple
(con
cent
ratio
n 11
19 u
g/kg
)R6
-03
1323
359.
567
4495
13.8
193
XX
Mid
-cha
nnel
off
of P
epco
site
R6-0
413
2362
4.26
444
9636
.855
5X
XAt
sout
h sid
e of
mou
th o
f inl
et fo
r out
fall
at n
orth
wes
t bo
unda
ry o
f the
Pep
co si
te
R6-0
513
2402
7.78
944
9656
.743
6X
Mou
th o
f out
fall
at n
orth
wes
t bou
ndar
y of
the
Pepc
o sit
e
R6-0
613
2415
6.59
445
0575
.13
XX
Nea
rsho
re se
dim
ent b
ar o
ff of
Ken
ilwor
th P
ark
Sout
h La
ndfil
l, in
tran
sect
with
R6-
17R6
-07
1323
886.
803
4506
57.8
11X
XX
Wes
t ban
k ne
ar K
enilw
orth
Par
k So
uth
Land
fill
R6-0
813
2433
8.19
645
1289
.406
4X
Bar a
t mou
th o
f Wat
ts B
ranc
h; n
ear A
NS
2000
sam
ple
(con
cent
ratio
n 59
9 ug
/kg)
R6-0
913
2449
2.66
645
1916
.022
XX
Mou
th o
f Hic
key
Run
near
exi
stin
g el
evat
ed y
ear 2
000
poin
tR6
-10
1324
813.
523
4521
80.8
646
XX
Nea
rsho
re o
ff of
Ken
ilwor
th P
ark
Nor
th L
andf
ill
R6-1
113
2519
7.37
545
3023
.130
4X
XCe
nter
cha
nnel
nea
r Ken
ilwor
th P
ark
Nor
th L
andf
ill
R6-1
213
2525
8.14
745
3465
.208
7X
Char
acte
rizat
ion
for h
uman
hea
lth (p
edes
tria
n ac
cess
to
river
bank
)
R6-1
313
2568
3.15
4544
37.3
665
XX
XX
Shar
p m
eand
er u
pstr
eam
of K
enilw
orth
Par
k N
orth
La
ndfil
l
R6-1
413
2556
3.31
645
4493
.508
8X
Shar
p m
eand
er u
pstr
eam
of K
enilw
orth
Par
k N
orth
La
ndfil
l
Benn
ing
Road
Brid
ge to
Ea
st C
apito
l Str
eet B
ridge
Amtr
ak B
ridge
to B
enni
ng
Road
Brid
ge
East
Cap
itol S
tree
t Brid
ge
to C
SX B
ridge
, Con
tinue
d

TABL
E 5.
2Su
mm
ary
of P
ropo
sed
Med
ia-S
peci
fic S
ampl
es b
y Sa
mpl
e Lo
catio
n, P
age
4 of
5
Tabl
e 5.
2 - S
umm
ary
of M
edia
-Spe
cific
Sam
ple
Loca
tions
.xlsx
5/15
/201
4
Loca
tion
Reac
hX-
Coor
dina
te 1
Y-Co
ordi
nate
1Su
rfac
e Se
dim
ent
Deep
Se
dim
ent
Pore
Wat
er
2
Bent
hic
Inve
rteb
rate
Ex
posu
re 3,
4
Surf
ace
Wat
erLo
catio
n De
scrip
tion
R6-1
513
2755
3.26
445
4747
.301
1X
XN
orth
ban
k be
twee
n ye
ar 2
000
tran
sect
s
R6-1
613
2793
7.66
145
4774
.143
9X
Char
acte
rizat
ion
for h
uman
hea
lth (p
edes
tria
n ac
cess
to
river
bank
)R6
-17
1328
448.
823
4553
05.2
344
XX
XX
Conf
luen
ce w
ith L
ower
Bea
verd
am C
reek
R7-0
113
2877
5.80
445
5658
.711
4X
XTr
anse
ct a
t New
Yor
k Av
e. B
ridge
nea
r exi
stin
g ye
ar
2000
poi
nt
R7-0
213
2856
5.24
645
5676
.788
8X
XX
Tran
sect
at N
ew Y
ork
Ave.
Brid
ge n
ear e
xist
ing
year
20
00 p
oint
R7-0
313
2939
5.83
945
6733
.454
XCh
arac
teriz
atio
n fo
r hum
an h
ealth
(ped
estr
ian
acce
ss to
riv
erba
nk)
R7-0
413
2980
6.31
345
7215
.454
3X
XTr
anse
ct n
ear c
onflu
ence
with
Due
ling
Cree
kR7
-05
1329
671.
034
4572
66.8
231
XX
XTr
anse
ct n
ear c
onflu
ence
with
Due
ling
Cree
k
R7-0
613
2986
5.32
245
8314
.494
XX
XX
Cent
er c
hann
el d
owns
trea
m fr
om u
nnam
ed w
etla
nd
trib
utar
yR7
-07
1329
696.
624
4587
06.5
218
XW
est b
ank
near
Col
mar
Man
or C
omm
unity
Par
kR7
-08
1329
646.
698
4595
34.3
696
XX
Nea
r yea
r 200
0 tr
anse
ctR7
-09
1329
751.
484
4595
72.2
662
XX
XN
ear y
ear 2
000
tran
sect
R7-1
013
2960
0.39
646
0333
.497
4X
XCe
nter
cha
nnel
mid
way
bet
wee
n R7
-7 a
nd R
7-8
R7-1
113
2952
6.85
846
1067
.129
5X
XLo
cate
d ne
ar y
ear 2
000
poin
t; tr
anse
ct w
ith R
7-9
R7-1
213
2980
7.26
346
1192
.236
5X
XX
Conf
luen
ce w
ith u
nnam
ed tr
ibut
ary
at o
utfa
ll PG
-TM
P-13
R7-1
313
2957
4.11
446
1482
.573
6X
XTh
alw
eg n
ear B
lade
nsbu
rg m
arin
aR7
-14
1329
767.
955
4616
80.8
407
XAd
jace
nt to
shor
elin
e at
Bla
dens
burg
mar
ina
R7-1
513
2944
8.83
146
1927
.038
8X
XX
Cent
er c
hann
el se
dim
ent b
ar; n
ear y
ear 2
000
tran
sect
R7-1
613
2951
9.90
746
1985
.358
8X
XCe
nter
cha
nnel
sedi
men
t bar
; nea
r yea
r 200
0 tr
anse
ct
R7-1
713
2953
6.43
446
2326
.394
1X
XX
Nor
th o
f mid
-cha
nnel
bar
to th
e no
rth
of B
lade
nsbu
rg
mar
ina
R7-1
813
2904
2.26
446
2536
.008
3X
Char
acte
rizat
ion
for h
uman
hea
lth (p
edes
tria
n ac
cess
to
river
bank
)
R7-1
913
2920
0.44
546
2692
.055
8X
XCo
nflu
ence
with
unn
amed
trib
utar
y at
out
fall
PG-T
MP-
5
R7-2
013
2887
1.49
746
3063
.705
3X
XSo
uthe
ast o
f Bla
dens
burg
Roa
d Br
idge
alo
ng n
orth
east
ba
nkR7
-21
1328
108.
678
4642
67.8
13X
XCe
nter
cha
nnel
sedi
men
t bar
R7-2
213
2809
0.80
846
4964
.246
7X
XX
Ups
trea
m o
n N
orth
wes
t Bra
nch
R7-2
313
2875
0.16
846
5398
.588
8X
XX
Ups
trea
m o
n N
orth
east
Bra
nch
near
yea
r 200
0 po
int
KL-0
113
2099
5.01
444
3771
.931
7X
XX
XDo
wns
trea
m n
ear m
outh
of K
ingm
an L
ake
KL-0
213
2165
4.71
244
4968
.428
1X
XX
Sout
h of
Eas
t Cap
itol S
t. Br
idge
KL-0
313
2201
8.35
244
5278
.284
2X
XAd
jace
nt to
Eas
t Cap
itol S
t. Br
idge
KL-0
413
2155
2.08
244
5797
.894
9X
XDo
wns
trea
m fr
om F
-284
-041
Upp
er ti
dal l
imit
to
Amtr
ak B
ridge
Amtr
ak B
ridge
to B
enni
ng
Road
Brid
ge, C
ontin
ued
King
man
Lak
e

TABL
E 5.
2Su
mm
ary
of P
ropo
sed
Med
ia-S
peci
fic S
ampl
es b
y Sa
mpl
e Lo
catio
n, P
age
5 of
5
Tabl
e 5.
2 - S
umm
ary
of M
edia
-Spe
cific
Sam
ple
Loca
tions
.xlsx
5/15
/201
4
Loca
tion
Reac
hX-
Coor
dina
te 1
Y-Co
ordi
nate
1Su
rfac
e Se
dim
ent
Deep
Se
dim
ent
Pore
Wat
er
2
Bent
hic
Inve
rteb
rate
Ex
posu
re 3,
4
Surf
ace
Wat
erLo
catio
n De
scrip
tion
KL-0
513
2221
7.61
144
6004
.153
2X
East
cha
nnel
nor
th o
f Eas
t Cap
itol S
tree
t and
sout
h of
Be
nnin
g Ro
adKL
-06
1321
454.
341
4461
47.3
617
XX
Dow
nstr
eam
from
unn
amed
out
fall
on w
est b
ank
KL-0
713
2130
8.96
344
6556
.640
8X
XDo
wns
trea
m fr
om F
-611
-365
KL-0
813
2173
2.48
844
6797
.554
9X
XX
XM
ud fl
at n
orth
of E
ast C
apito
l St.
Brid
ge, n
ear f
ootb
ridge
KL-0
913
2160
0.82
644
6856
.714
8X
XX
Mai
n ch
anne
l of w
est a
rm b
etw
een
E. C
apito
l St a
nd
Benn
ing
Rd
KL-1
013
2212
0.13
144
6957
.946
6X
XX
XEa
st c
hann
el n
orth
of E
ast C
apito
l Str
eet a
nd so
uth
of
Benn
ing
Road
KL-1
113
2199
5.51
344
7449
.696
7X
XM
ain
chan
nel s
outh
of B
enni
ng R
oad
KL-1
213
2203
0.58
344
8388
.886
9X
XX
Dow
nstr
eam
from
F-9
91-0
21
KL-1
313
2216
3.39
244
8695
.459
2X
Char
acte
rizat
ion
for h
uman
hea
lth (p
edes
tria
n ac
cess
to
river
bank
)KL
-14
1322
026.
698
4494
82.1
329
XX
Dow
nstr
eam
from
F-0
52-3
84
KL-1
513
2241
7.95
244
9733
.905
6X
XX
Chan
nel i
n no
rthe
rn si
lted-
in p
ortio
n of
Kin
gman
Lak
e
KL-1
613
2263
4.73
245
0112
.020
2X
XCh
anne
l in
nort
hern
silte
d-in
por
tion
of K
ingm
an L
ake
KL-1
713
2231
4.84
4502
94.8
75X
XCh
anne
l in
nort
hern
silte
d-in
por
tion
of K
ingm
an L
ake
KL-1
813
2312
2.94
945
0277
.185
7X
Char
acte
rizat
ion
for h
uman
hea
lth (p
edes
tria
n ac
cess
to
river
bank
)
KL-1
913
2306
2.98
845
0899
.532
XM
ud fl
at in
nor
ther
n sil
ted-
in p
ortio
n of
Kin
gman
Lak
e
KL-2
013
2332
8.33
445
1244
.048
2X
XX
XX
Chan
nel i
n no
rthe
rn si
lted-
in p
ortio
n of
Kin
gman
Lak
e
KL-2
113
2316
6.51
545
1661
.434
7X
XX
Chan
nel i
n no
rthe
rn si
lted-
in p
ortio
n of
Kin
gman
Lak
e
KL-2
213
2418
1.80
545
1822
.554
6X
XU
pstr
eam
mou
th o
f Kin
gman
Lak
e
KL-2
313
2424
0.65
845
1899
.588
XX
XM
udfla
t adj
acen
t to
upst
ream
mou
th o
f Kin
gman
Lak
e
Not
es1.
X a
nd Y
coo
rdin
ates
are
pre
sent
ed in
Nor
th A
mer
ican
Dat
um 8
3.2.
Por
e w
ater
will
be
colle
cted
from
surf
ace
sedi
men
t sam
ples
and
will
be
labo
rato
ry-e
xtra
cted
.3.
It is
ass
umed
that
hal
f of t
he 4
2 be
nthi
c in
vert
ebra
te sa
mpl
ing
loca
tions
will
yie
ld a
dequ
ate
inve
rteb
rate
tiss
ue fo
r che
mic
al a
naly
sis (1
50 g
ram
s).
4. If
no
bent
hic
inve
rteb
rate
s or a
lim
ited
num
ber b
enth
ic in
vert
ebra
tes a
re o
bser
ved
at a
ben
thic
inve
rteb
rate
sam
plin
g lo
catio
n, o
nly
a sa
mpl
e fo
r tox
icity
test
ing
will
be
colle
cted
.5.
Fish
tiss
ue sa
mpl
ing
loca
tions
are
not
mut
ually
exc
lusiv
e w
ith se
dim
ent s
ampl
ing
loca
tions
, and
fish
tiss
ue sa
mpl
e lo
catio
ns a
re su
mm
arize
d on
Tab
le 4
.2.
King
man
Lak
e, C
ontin
ued

TABLE 5.3 Summary of Analysis, Page 1 of 3
5/15/2014
Media Number of Samples Analysis1 Sediment Surface sediment: 134 samples (0-
0.5 feet bss) All Samples • Priority pollutants • 209 PCB congeners • Alkylated polycyclic aromatic hydrocarbons
(PAHs)2 • Grain size • Total organic carbon • Moisture content/percent solids • Oxidation/Reduction Potential
42 Benthic Exposure Samples • PCDD/PCDF • Acid volatile sulfides/simultaneously
extracted metals (AVS/SEM) • Bulk density • Atterberg limits
Subsurface sediment: 243 samples (3 samples from each 10-foot core collected at 81 locations)
All Samples • Priority pollutants • Alkylated PAHs • Grain size • Total organic carbon
42 Benthic Exposure Sample Locations
• 209 PCB congeners • PCDD/PCDF • Moisture content/percent solids • Bulk density • Atterberg limits
Pore water 19 samples with pore water extraction performed in the laboratory
• Priority pollutants (except VOCs) • Alkylated PAHs • PCDD/PCDF • Total organic carbon • Dissolved organic carbon • Total dissolved solids • Oxidation/Reduction Potential • pH
Surface Water 14 samples • TAL metals plus mercury (total and dissolved) • Semi-volatile organic compounds (SVOCs) • Pesticides • PCB Aroclors • 209 PCB Congeners • PCDD/PCDF • Common ions3 • Total organic carbon • Total suspended solids • Total dissolved solids • Field parameters (pH, specific conductance,

TABLE 5.3 Summary of Analysis, Page 2 of 3
5/15/2014
Media Number of Samples Analysis1 oxidation/reduction potential, dissolved oxygen, turbidity)
Fish, Crayfish, and Turtle Tissue
46 samples collected for use in ecological risk assessment (ERA) and/or human health risk assessment (HHRA)
• TAL metals plus mercury • PCB Aroclors • 209 PCB Congeners • Total Chlordane • Total DDTs • Dieldrin • Heptachlor epoxide • SVOCs • PCDD/PCDF • Lipids • Moisture content
Benthic Invertebrate Tissue
Estimated 21 samples collocated with surficial sediment locations (dependent on recovery of invertebrates in sediment).
• TAL metals plus mercury • PCB Aroclors • 209 PCB Congeners • Total Chlordane • Total DDTs • Dieldrin • Heptachlor epoxide • SVOCs • Alkylated PAHs • PCDD/PCDF • Lipids • Moisture content
Toxicity Testing Estimated 21 surficial sediment samples collocated with surficial sediment locations analyzed for chemical constituents (see Row 1 of this table; benthic exposure samples)
• 42-day Hyalella azteca direct exposure test • 10-day Chironomus dilutus direct exposure
test
1. Analysis Methods: • Priority pollutants analyses methods (sediment and water): VOCs by EPA Method 8260C, SVOCs by EPA
Method 8270D LL, metals by EPA Method 6020A, mercury by EPA Method 7471B, pesticides by EPA Method 8081B LL, PCB Aroclors by EPA Method 8082A LL, dioxins and furans by EPA Method 1613B, total cyanide by EPA Method 9014.
• Alkylated PAHs (sediment and water): analyzed by EPA Method 8270M • PCB congeners (sediment and water): analyzed by EPA Method 1668A • Common ions methods (water): sulfate, nitrate, and chloride by EPA Method 300.0; alkalinity by EPA
Method 2520B; hardness by EPA Method 2340. • Total organic carbon: EPA Method 5310C (water); Lloyd Kahn (sediment) • AVS/SEM (sediment): EPA Method AVS/SEM
2. Alkylated PAHs: 34 alkylated PAHs as defined in EPA (2003): Procedures for the derivation of equilibrium partitioning sediment benchmarks for the protection of benthic organisms: PAH mixtures, EPA 600-R-02-013.
3. Common ions include sulfate, nitrate, chloride, alkalinity, and hardness.
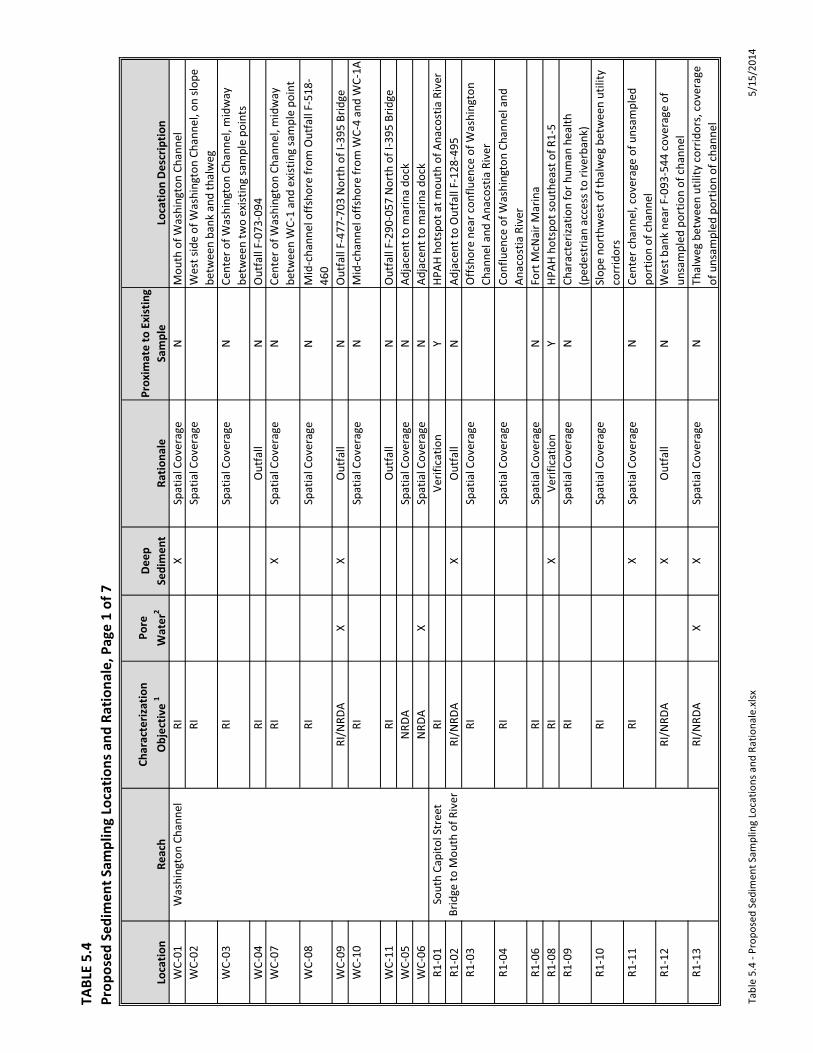
TABL
E 5.
4Pr
opos
ed S
edim
ent S
ampl
ing
Loca
tions
and
Rat
iona
le, P
age
1 of
7
Tabl
e 5.
4 - P
ropo
sed
Sedi
men
t Sam
plin
g Lo
catio
ns a
nd R
atio
nale
.xlsx
5/15
/201
4
Loca
tion
Reac
hCh
arac
teriz
atio
nO
bjec
tive
1Po
re
Wat
er2
Dee
p Se
dim
ent
Ratio
nale
Prox
imat
e to
Exi
stin
gSa
mpl
eLo
catio
n D
escr
iptio
nW
C-01
RIX
Spat
ial C
over
age
NM
outh
of W
ashi
ngto
n Ch
anne
lW
C-02
RISp
atia
l Cov
erag
eW
est s
ide
of W
ashi
ngto
n Ch
anne
l, on
slop
e be
twee
n ba
nk a
nd th
alw
egW
C-03
RISp
atia
l Cov
erag
eN
Cent
er o
f Was
hing
ton
Chan
nel,
mid
way
be
twee
n tw
o ex
istin
g sa
mpl
e po
ints
WC-
04RI
Out
fall
NO
utfa
ll F-
073-
094
WC-
07RI
XSp
atia
l Cov
erag
eN
Cent
er o
f Was
hing
ton
Chan
nel,
mid
way
be
twee
n W
C-1
and
exist
ing
sam
ple
poin
tW
C-08
RISp
atia
l Cov
erag
eN
Mid
-cha
nnel
offs
hore
from
Out
fall
F-51
8-46
0W
C-09
RI/N
RDA
XX
Out
fall
NO
utfa
ll F-
477-
703
Nor
th o
f I-3
95 B
ridge
WC-
10RI
Spat
ial C
over
age
NM
id-c
hann
el o
ffsho
re fr
om W
C-4
and
WC-
1A
WC-
11RI
Out
fall
NO
utfa
ll F-
290-
057
Nor
th o
f I-3
95 B
ridge
WC-
05N
RDA
Spat
ial C
over
age
NAd
jace
nt to
mar
ina
dock
WC-
06N
RDA
XSp
atia
l Cov
erag
eN
Adja
cent
to m
arin
a do
ckR1
-01
RIVe
rific
atio
nY
HPAH
hot
spot
at m
outh
of A
naco
stia
Riv
erR1
-02
RI/N
RDA
XO
utfa
llN
Adja
cent
to O
utfa
ll F-
128-
495
R1-0
3RI
Spat
ial C
over
age
Offs
hore
nea
r con
fluen
ce o
f Was
hing
ton
Chan
nel a
nd A
naco
stia
Riv
erR1
-04
RISp
atia
l Cov
erag
eCo
nflu
ence
of W
ashi
ngto
n Ch
anne
l and
An
acos
tia R
iver
R1-0
6RI
Spat
ial C
over
age
NFo
rt M
cNai
r Mar
ina
R1-0
8RI
XVe
rific
atio
nY
HPAH
hot
spot
sout
heas
t of R
1-5
R1-0
9RI
Spat
ial C
over
age
NCh
arac
teriz
atio
n fo
r hum
an h
ealth
(p
edes
tria
n ac
cess
to ri
verb
ank)
R1-1
0RI
Spat
ial C
over
age
Slop
e no
rthw
est o
f tha
lweg
bet
wee
n ut
ility
co
rrid
ors
R1-1
1RI
XSp
atia
l Cov
erag
eN
Cent
er c
hann
el, c
over
age
of u
nsam
pled
po
rtio
n of
cha
nnel
R1-1
2RI
/NRD
AX
Out
fall
NW
est b
ank
near
F-0
93-5
44 c
over
age
of
unsa
mpl
ed p
ortio
n of
cha
nnel
R1-1
3RI
/NRD
AX
XSp
atia
l Cov
erag
eN
Thal
weg
bet
wee
n ut
ility
cor
ridor
s, c
over
age
of u
nsam
pled
por
tion
of c
hann
el
Was
hing
ton
Chan
nel
Sout
h Ca
pito
l Str
eet
Brid
ge to
Mou
th o
f Riv
er

TABL
E 5.
4Pr
opos
ed S
edim
ent S
ampl
ing
Loca
tions
and
Rat
iona
le, P
age
2 of
7
Tabl
e 5.
4 - P
ropo
sed
Sedi
men
t Sam
plin
g Lo
catio
ns a
nd R
atio
nale
.xlsx
5/15
/201
4
Loca
tion
Reac
hCh
arac
teriz
atio
nO
bjec
tive
1Po
re
Wat
er2
Dee
p Se
dim
ent
Ratio
nale
Prox
imat
e to
Exi
stin
gSa
mpl
eLo
catio
n D
escr
iptio
nR1
-14
RISp
atia
l Cov
erag
eN
Char
acte
rizat
ion
for h
uman
hea
lth
(ped
estr
ian
acce
ss to
rive
rban
k)R1
-05
NRD
A O
utfa
llN
Nor
th b
and
at O
utfa
ll F-
937-
544
R1-0
7N
RDA
XSp
atia
l Cov
erag
eN
Nea
r sou
th b
ank,
just
ups
trea
m fr
om
conf
luen
ce w
ith W
ashi
ngto
n Ch
anne
lR2
-01
RIX
Verif
icat
ion
YO
verla
p w
ith y
ear 2
000
data
poi
nt; e
ast
shor
elin
e at
Pop
lar P
oint
R2-0
2RI
XSp
atia
l Cov
erag
eN
East
shor
elin
e at
Pop
lar P
oint
R2-0
3RI
XSp
atia
l Cov
erag
eN
Cent
er c
hann
el, o
ffsho
re fr
om R
2-2
R2-0
4RI
/NRD
AX
XO
utfa
llY
East
shor
elin
e at
Pop
lar P
oint
, at S
ewer
O
utfa
ll F-
897-
104
R2-0
5RI
XSp
atia
l Cov
erag
eN
Cent
er c
hann
el fr
om R
2-4
R2-0
6RI
XVe
rific
atio
nY
Cent
er c
hann
el fr
om R
2-05
and
adj
acen
t to
year
200
0 po
int
R2-0
7RI
XO
utfa
ll, V
erifi
catio
nY
East
shor
elin
e at
Pop
lar P
oint
, ove
rlap
with
ye
ar 2
000
poin
t, ad
jace
nt to
F-4
17-2
17R2
-08
RIX
Spat
ial C
over
age
NTh
alw
eg d
epre
ssio
n no
rthw
est o
f R2-
9,
nort
heas
t of R
2-15
R2-0
9RI
XO
utfa
ll, V
erifi
catio
nY
Out
fall
F-41
7-21
7; o
verla
p w
ith y
ear 2
000
sam
plin
g po
int
R2-1
0RI
Verif
icat
ion
Ups
trea
m o
f doc
ks a
t Nav
y Ya
rd, n
ear n
orth
ba
nkR2
-11
RIX
Out
fall
NAd
jace
nt to
F-0
08-7
06R2
-12
RIX
Verif
icat
ion
YCe
nter
cha
nnel
adj
acen
t to
year
200
0 po
int
R2-1
3RI
/NRD
AX
XO
utfa
llN
Adja
cent
to N
PDES
005
R2-1
4RI
XSp
atia
l Cov
erag
eN
Char
acte
rizat
ion
for h
uman
hea
lth
(ped
estr
ian
acce
ss to
rive
rban
k)R2
-15
RIX
Out
fall
NAd
jace
nt to
NPD
ES 0
06R2
-16
RIX
Spat
ial C
over
age
NCe
nter
cha
nnel
from
R2-
8R3
-01
RIVe
rific
atio
nY
Thal
weg
, nea
r sou
thw
est c
orne
r of
Was
hing
ton
Gas
R3-0
2RI
Spat
ial C
over
age
NN
ears
hore
off
of W
ashi
ngto
n G
asR3
-03
RISp
atia
l Cov
erag
eN
Mid
cha
nnel
form
ing
tran
sect
with
R3-
16R3
-04
RISp
atia
l Cov
erag
eN
Nea
r sho
relin
e op
posit
e fr
om W
ashi
ngto
n G
as, f
orm
ing
tran
sect
with
R3-
16
11th
Str
eet B
ridge
to
Sout
h Ca
pito
l Str
eet
Brid
ge
Sout
h Ca
pito
l Str
eet
Brid
ge to
Mou
th o
f Riv
er,
Cont
inue
d
CSX
Brid
ge to
11t
h St
reet
Br
idge

TABL
E 5.
4Pr
opos
ed S
edim
ent S
ampl
ing
Loca
tions
and
Rat
iona
le, P
age
3 of
7
Tabl
e 5.
4 - P
ropo
sed
Sedi
men
t Sam
plin
g Lo
catio
ns a
nd R
atio
nale
.xlsx
5/15
/201
4
Loca
tion
Reac
hCh
arac
teriz
atio
nO
bjec
tive
1Po
re
Wat
er2
Dee
p Se
dim
ent
Ratio
nale
Prox
imat
e to
Exi
stin
gSa
mpl
eLo
catio
n D
escr
iptio
nR3
-05
RISp
atia
l Cov
erag
eN
Char
acte
rizat
ion
for h
uman
hea
lth
(ped
estr
ian
acce
ss to
rive
rban
k)R3
-06
RI/N
RDA
XX
Out
fall
NAd
jace
nt to
F-4
05-2
20R3
-07
RIX
Verif
icat
ion,
Out
fall
YO
utfa
ll F-
124-
260
and
a HP
AH h
otsp
otR3
-08
RIX
Out
fall
NAd
jace
nt to
NPD
ES 0
18R3
-09
RIX
Spat
ial C
over
age
NCe
nter
cha
nnel
from
R3-
7R3
-10
RIX
Verif
icat
ion
YTr
anse
ct n
ear P
enns
ylva
nia
Ave.
Brid
ge n
ear
year
200
0 po
int
R3-1
1RI
XVe
rific
atio
nY
Tran
sect
nea
r Pen
nsyl
vani
a Av
e. B
ridge
nea
r ye
ar 2
000
poin
tR3
-12
RI/N
RDA
XVe
rific
atio
nY
Tran
sect
nea
r Pen
nsyl
vani
a Av
e. B
ridge
nea
r ye
ar 2
000
poin
tR3
-13
RISp
atia
l Cov
erag
eDo
wns
trea
m o
f CSX
railr
oad
brid
ge n
ear
nort
hwes
t ban
kR3
-14
RISp
atia
l Cov
erag
eU
pstr
eam
of P
enns
ylva
nia
Ave.
Brid
ge n
ear
seco
ndar
y th
alw
eg a
long
nor
thw
est b
ank
R3-1
5RI
/NRD
AX
XVe
rific
atio
n, O
utfa
llY
Tran
sect
nea
r CSX
Brid
ge n
ear y
ear 2
000
poin
t; ne
ar F
ort D
avis
trib
utar
y (F
-238
-290
)R3
-16
RIX
Spat
ial C
over
age
YTr
anse
ct n
ear C
SX B
ridge
nea
r yea
r 200
0 po
int
R4-0
1RI
XVe
rific
atio
nY
Tran
sect
nea
r CSX
Brid
ge n
ear y
ear 2
000
poin
tR4
-02
RISp
atia
l Cov
erag
eN
Char
acte
rizat
ion
for h
uman
hea
lth
(ped
estr
ian
acce
ss to
rive
rban
k)R4
-07
RISp
atia
l Cov
erag
eN
Char
acte
rizat
ion
for h
uman
hea
lth
(ped
estr
ian
acce
ss to
rive
rban
k)R4
-08
RIX
Spat
ial C
over
age
NTr
anse
ct n
ear E
ast C
apito
l St.
Brid
geR4
-09
RI/N
RDA
XX
Verif
icat
ion,
Out
fall
YTr
anse
ct n
ear E
ast C
apito
l St.
Brid
ge; n
ear
Chap
lin tr
ibut
ary
(F-9
03-3
71) a
nd 2
000
poin
tR4
-03
NRD
A Ve
rific
atio
nY
HPAH
hot
spot
dow
nstr
eam
from
Kin
gman
La
ke c
onflu
ence
CSX
Brid
ge to
11t
h St
reet
Br
idge
, Con
tinue
d
East
Cap
itol S
tree
t Brid
ge
to C
SX B
ridge
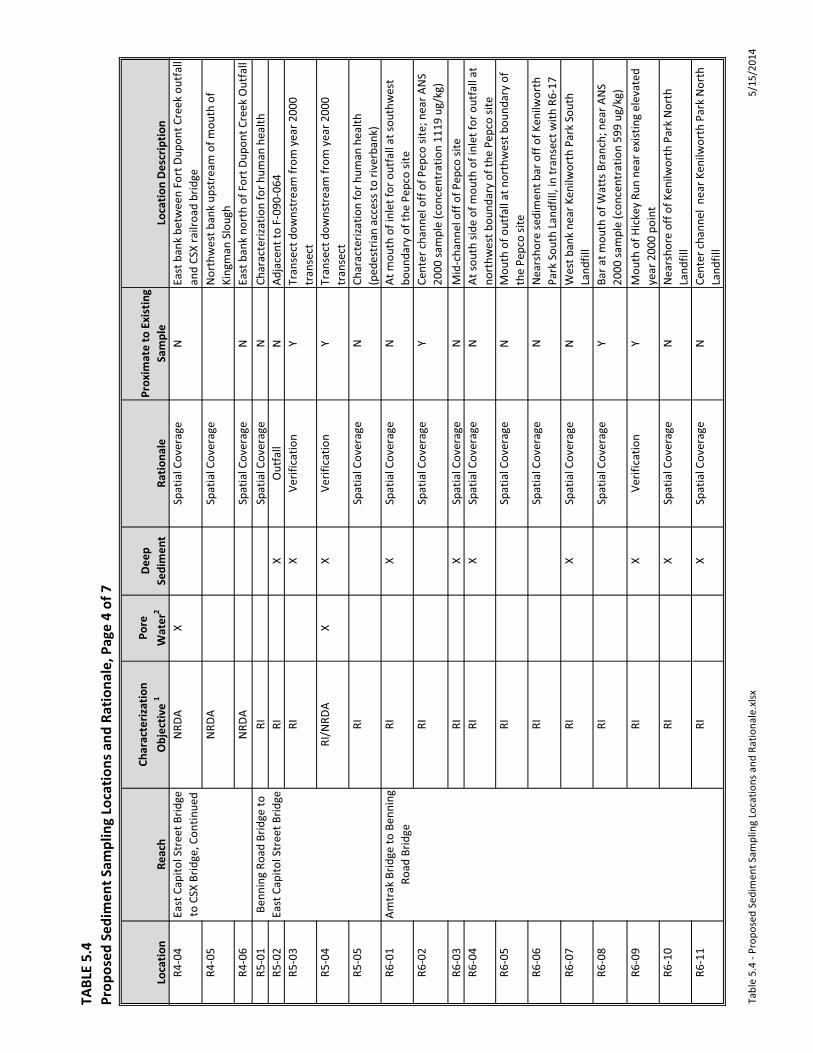
TABL
E 5.
4Pr
opos
ed S
edim
ent S
ampl
ing
Loca
tions
and
Rat
iona
le, P
age
4 of
7
Tabl
e 5.
4 - P
ropo
sed
Sedi
men
t Sam
plin
g Lo
catio
ns a
nd R
atio
nale
.xlsx
5/15
/201
4
Loca
tion
Reac
hCh
arac
teriz
atio
nO
bjec
tive
1Po
re
Wat
er2
Dee
p Se
dim
ent
Ratio
nale
Prox
imat
e to
Exi
stin
gSa
mpl
eLo
catio
n D
escr
iptio
nR4
-04
NRD
A X
Spat
ial C
over
age
NEa
st b
ank
betw
een
Fort
Dup
ont C
reek
out
fall
and
CSX
railr
oad
brid
geR4
-05
NRD
A Sp
atia
l Cov
erag
eN
orth
wes
t ban
k up
stre
am o
f mou
th o
f Ki
ngm
an S
loug
hR4
-06
NRD
A Sp
atia
l Cov
erag
eN
East
ban
k no
rth
of F
ort D
upon
t Cre
ek O
utfa
llR5
-01
RISp
atia
l Cov
erag
eN
Char
acte
rizat
ion
for h
uman
hea
lth
R5-0
2RI
XO
utfa
llN
Adja
cent
to F
-090
-064
R5-0
3RI
XVe
rific
atio
nY
Tran
sect
dow
nstr
eam
from
yea
r 200
0 tr
anse
ctR5
-04
RI/N
RDA
XX
Verif
icat
ion
YTr
anse
ct d
owns
trea
m fr
om y
ear 2
000
tran
sect
R5-0
5RI
Spat
ial C
over
age
NCh
arac
teriz
atio
n fo
r hum
an h
ealth
(p
edes
tria
n ac
cess
to ri
verb
ank)
R6-0
1RI
XSp
atia
l Cov
erag
eN
At m
outh
of i
nlet
for o
utfa
ll at
sout
hwes
t bo
unda
ry o
f the
Pep
co si
teR6
-02
RISp
atia
l Cov
erag
eY
Cent
er c
hann
el o
ff of
Pep
co si
te; n
ear A
NS
2000
sam
ple
(con
cent
ratio
n 11
19 u
g/kg
)R6
-03
RIX
Spat
ial C
over
age
NM
id-c
hann
el o
ff of
Pep
co si
teR6
-04
RIX
Spat
ial C
over
age
NAt
sout
h sid
e of
mou
th o
f inl
et fo
r out
fall
at
nort
hwes
t bou
ndar
y of
the
Pepc
o sit
eR6
-05
RISp
atia
l Cov
erag
eN
Mou
th o
f out
fall
at n
orth
wes
t bou
ndar
y of
th
e Pe
pco
site
R6-0
6RI
Spat
ial C
over
age
NN
ears
hore
sedi
men
t bar
off
of K
enilw
orth
Pa
rk S
outh
Lan
dfill
, in
tran
sect
with
R6-
17R6
-07
RIX
Spat
ial C
over
age
NW
est b
ank
near
Ken
ilwor
th P
ark
Sout
h La
ndfil
lR6
-08
RISp
atia
l Cov
erag
eY
Bar a
t mou
th o
f Wat
ts B
ranc
h; n
ear A
NS
2000
sam
ple
(con
cent
ratio
n 59
9 ug
/kg)
R6-0
9RI
XVe
rific
atio
nY
Mou
th o
f Hic
key
Run
near
exi
stin
g el
evat
ed
year
200
0 po
int
R6-1
0RI
XSp
atia
l Cov
erag
eN
Nea
rsho
re o
ff of
Ken
ilwor
th P
ark
Nor
th
Land
fill
R6-1
1RI
XSp
atia
l Cov
erag
eN
Cent
er c
hann
el n
ear K
enilw
orth
Par
k N
orth
La
ndfil
l
Amtr
ak B
ridge
to B
enni
ng
Road
Brid
ge
Benn
ing
Road
Brid
ge to
Ea
st C
apito
l Str
eet B
ridge
East
Cap
itol S
tree
t Brid
ge
to C
SX B
ridge
, Con
tinue
d

TABL
E 5.
4Pr
opos
ed S
edim
ent S
ampl
ing
Loca
tions
and
Rat
iona
le, P
age
5 of
7
Tabl
e 5.
4 - P
ropo
sed
Sedi
men
t Sam
plin
g Lo
catio
ns a
nd R
atio
nale
.xlsx
5/15
/201
4
Loca
tion
Reac
hCh
arac
teriz
atio
nO
bjec
tive
1Po
re
Wat
er2
Dee
p Se
dim
ent
Ratio
nale
Prox
imat
e to
Exi
stin
gSa
mpl
eLo
catio
n D
escr
iptio
nR6
-12
RISp
atia
l Cov
erag
eN
Char
acte
rizat
ion
for h
uman
hea
lth
(ped
estr
ian
acce
ss to
rive
rban
k)R6
-13
RI/N
RDA
XX
Spat
ial C
over
age
NSh
arp
mea
nder
ups
trea
m o
f Ken
ilwor
th P
ark
Nor
th L
andf
illR6
-14
RISp
atia
l Cov
erag
eSh
arp
mea
nder
ups
trea
m o
f Ken
ilwor
th P
ark
Nor
th L
andf
illR6
-15
RIX
Spat
ial C
over
age
NN
orth
ban
k be
twee
n ye
ar 2
000
tran
sect
sR6
-16
RISp
atia
l Cov
erag
eN
Char
acte
rizat
ion
for h
uman
hea
lth
(ped
estr
ian
acce
ss to
rive
rban
k)R6
-17
RI/N
RDA
XX
Verif
icat
ion,
Out
fall
YCo
nflu
ence
with
Low
er B
eave
rdam
Cre
ekR7
-01
RIX
Verif
icat
ion
YTr
anse
ct a
t New
Yor
k Av
e. B
ridge
nea
r ex
istin
g ye
ar 2
000
poin
tR7
-02
RI/N
RDA
XVe
rific
atio
nY
Tran
sect
at N
ew Y
ork
Ave.
Brid
ge n
ear
exist
ing
year
200
0 po
int
R7-0
3RI
Spat
ial C
over
age
NCh
arac
teriz
atio
n fo
r hum
an h
ealth
(p
edes
tria
n ac
cess
to ri
verb
ank)
R7-0
4RI
XSp
atia
l Cov
erag
eN
Tran
sect
nea
r con
fluen
ce w
ith D
uelin
g Cr
eek
R7-0
5RI
/NRD
AX
Spat
ial C
over
age
NTr
anse
ct n
ear c
onflu
ence
with
Due
ling
Cree
kR7
-06
RI/N
RDA
XX
Spat
ial C
over
age
NCe
nter
cha
nnel
dow
nstr
eam
from
unn
amed
w
etla
nd tr
ibut
ary
R7-0
7RI
Spat
ial C
over
age
Wes
t ban
k ne
ar C
olm
ar M
anor
Com
mun
ity
Park
R7-0
8RI
XVe
rific
atio
nY
Nea
r yea
r 200
0 tr
anse
ctR7
-09
RI/N
RDA
XSp
atia
l Cov
erag
eY
Nea
r yea
r 200
0 tr
anse
ctR7
-11
RIX
Spat
ial C
over
age
YLo
cate
d ne
ar y
ear 2
000
poin
t; tr
anse
ct w
ith
R7-9
R7-1
2RI
/NRD
AX
Out
fall
NCo
nflu
ence
with
unn
amed
trib
utar
y at
ou
tfal
l PG
-TM
P-13
R7-1
3RI
XSp
atia
l Cov
erag
eN
Thal
weg
nea
r Bla
dens
burg
mar
ina
R7-1
4RI
Spat
ial C
over
age
NAd
jace
nt to
shor
elin
e at
Bla
dens
burg
mar
ina
R7-1
5RI
/NRD
AX
Verif
icat
ion
YCe
nter
cha
nnel
sedi
men
t bar
; nea
r yea
r 200
0 tr
anse
ctR7
-16
RIVe
rific
atio
nY
Cent
er c
hann
el se
dim
ent b
ar; n
ear y
ear 2
000
tran
sect
Amtr
ak B
ridge
to B
enni
ng
Road
Brid
ge, C
ontin
ued
Upp
er ti
dal l
imit
to
Amtr
ak B
ridge

TABL
E 5.
4Pr
opos
ed S
edim
ent S
ampl
ing
Loca
tions
and
Rat
iona
le, P
age
6 of
7
Tabl
e 5.
4 - P
ropo
sed
Sedi
men
t Sam
plin
g Lo
catio
ns a
nd R
atio
nale
.xlsx
5/15
/201
4
Loca
tion
Reac
hCh
arac
teriz
atio
nO
bjec
tive
1Po
re
Wat
er2
Dee
p Se
dim
ent
Ratio
nale
Prox
imat
e to
Exi
stin
gSa
mpl
eLo
catio
n D
escr
iptio
nR7
-17
RIX
Spat
ial C
over
age
NN
orth
of m
id-c
hann
el b
ar to
the
nort
h of
Bl
aden
sbur
g m
arin
aR7
-18
RISp
atia
l Cov
erag
eN
Char
acte
rizat
ion
for h
uman
hea
lth
(ped
estr
ian
acce
ss to
rive
rban
k)R7
-19
RIX
Out
fall
NCo
nflu
ence
with
unn
amed
trib
utar
y at
ou
tfal
l PG
-TM
P-5
R7-2
1RI
/NRD
ASp
atia
l Cov
erag
eN
Cent
er c
hann
el se
dim
ent b
arR7
-22
RI/N
RDA
XSp
atia
l Cov
erag
eN
Ups
trea
m o
n N
orth
wes
t Bra
nch
R7-2
3RI
/NRD
AX
Spat
ial C
over
age
YU
pstr
eam
on
Nor
thea
st B
ranc
h ne
ar y
ear
2000
poi
ntR7
-10
NRD
A Sp
atia
l Cov
erag
eN
Cent
er c
hann
el m
idw
ay b
etw
een
R7-7
and
R7
-8R7
-20
NRD
A Sp
atia
l Cov
erag
eN
Sout
heas
t of B
lade
nsbu
rg R
oad
Brid
ge a
long
no
rthe
ast b
ank
KL-0
1RI
/NRD
AX
XSp
atia
l Cov
erag
eN
Dow
nstr
eam
nea
r mou
th o
f Kin
gman
Lak
eKL
-02
RI/N
RDA
XSp
atia
l Cov
erag
eN
Sout
h of
Eas
t Cap
itol S
t. Br
idge
KL-0
3RI
XSp
atia
l Cov
erag
eN
Adja
cent
to E
ast C
apito
l St.
Brid
geKL
-04
RIX
Out
fall
NDo
wns
trea
m fr
om F
-284
-041
KL-0
5RI
Spat
ial C
over
age
East
cha
nnel
nor
th o
f Eas
t Cap
itol S
tree
t and
so
uth
of B
enni
ng R
oad
KL-0
6RI
XO
utfa
llN
Dow
nstr
eam
from
unn
amed
out
fall
on w
est
bank
KL-0
7RI
XO
utfa
llN
Dow
nstr
eam
from
F-6
11-3
65KL
-08
RI/N
RDA
XX
Spat
ial C
over
age
NM
ud fl
at n
orth
of E
ast C
apito
l St.
Brid
ge,
near
foot
brid
geKL
-09
RI/N
RDA
XSp
atia
l Cov
erag
eN
Mai
n ch
anne
l of w
est a
rm b
etw
een
E.
Capi
tol S
t and
Ben
ning
Rd
KL-1
0RI
/NRD
AX
XSp
atia
l Cov
erag
eN
East
cha
nnel
nor
th o
f Eas
t Cap
itol S
tree
t and
so
uth
of B
enni
ng R
oad
KL-1
1RI
XSp
atia
l Cov
erag
eN
Mai
n ch
anne
l sou
th o
f Ben
ning
Roa
dKL
-12
RI/N
RDA
XO
utfa
llN
Dow
nstr
eam
from
F-9
91-0
21KL
-13
RISp
atia
l Cov
erag
eN
Char
acte
rizat
ion
for h
uman
hea
lth
(ped
estr
ian
acce
ss to
rive
rban
k)KL
-14
RIX
Out
fall
NDo
wns
trea
m fr
om F
-052
-384
Upp
er ti
dal l
imit
to
Amtr
ak B
ridge
, Co
ntin
ued
King
man
Lak
e
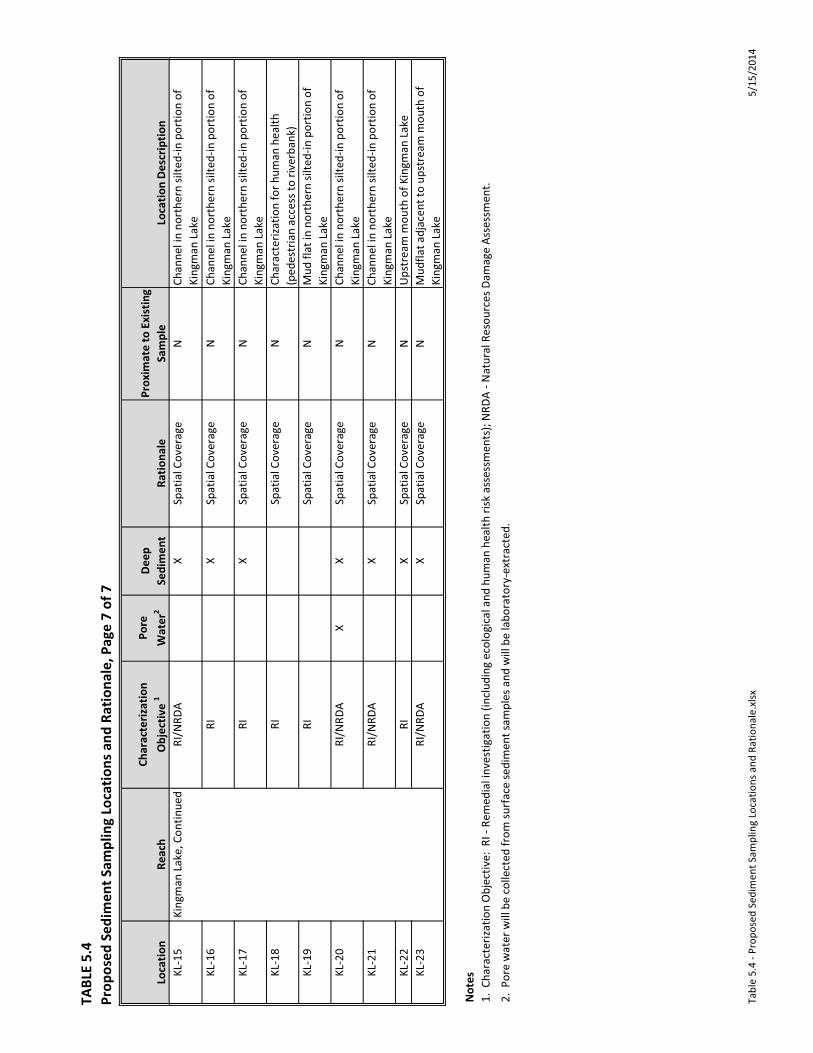
TABL
E 5.
4Pr
opos
ed S
edim
ent S
ampl
ing
Loca
tions
and
Rat
iona
le, P
age
7 of
7
Tabl
e 5.
4 - P
ropo
sed
Sedi
men
t Sam
plin
g Lo
catio
ns a
nd R
atio
nale
.xlsx
5/15
/201
4
Loca
tion
Reac
hCh
arac
teriz
atio
nO
bjec
tive
1Po
re
Wat
er2
Dee
p Se
dim
ent
Ratio
nale
Prox
imat
e to
Exi
stin
gSa
mpl
eLo
catio
n D
escr
iptio
nKL
-15
RI/N
RDA
XSp
atia
l Cov
erag
eN
Chan
nel i
n no
rthe
rn si
lted-
in p
ortio
n of
Ki
ngm
an L
ake
KL-1
6RI
XSp
atia
l Cov
erag
eN
Chan
nel i
n no
rthe
rn si
lted-
in p
ortio
n of
Ki
ngm
an L
ake
KL-1
7RI
XSp
atia
l Cov
erag
eN
Chan
nel i
n no
rthe
rn si
lted-
in p
ortio
n of
Ki
ngm
an L
ake
KL-1
8RI
Spat
ial C
over
age
NCh
arac
teriz
atio
n fo
r hum
an h
ealth
(p
edes
tria
n ac
cess
to ri
verb
ank)
KL-1
9RI
Spat
ial C
over
age
NM
ud fl
at in
nor
ther
n sil
ted-
in p
ortio
n of
Ki
ngm
an L
ake
KL-2
0RI
/NRD
AX
XSp
atia
l Cov
erag
eN
Chan
nel i
n no
rthe
rn si
lted-
in p
ortio
n of
Ki
ngm
an L
ake
KL-2
1RI
/NRD
AX
Spat
ial C
over
age
NCh
anne
l in
nort
hern
silte
d-in
por
tion
of
King
man
Lak
eKL
-22
RIX
Spat
ial C
over
age
NU
pstr
eam
mou
th o
f Kin
gman
Lak
eKL
-23
RI/N
RDA
XSp
atia
l Cov
erag
eN
Mud
flat a
djac
ent t
o up
stre
am m
outh
of
King
man
Lak
e
Not
es1.
Cha
ract
eriza
tion
Obj
ectiv
e: R
I - R
emed
ial i
nves
tigat
ion
(incl
udin
g ec
olog
ical
and
hum
an h
ealth
risk
ass
essm
ents
); N
RDA
- Nat
ural
Res
ourc
es D
amag
e As
sess
men
t.
2. P
ore
wat
er w
ill b
e co
llect
ed fr
om su
rfac
e se
dim
ent s
ampl
es a
nd w
ill b
e la
bora
tory
-ext
ract
ed.
King
man
Lak
e, C
ontin
ued

TABL
E 5.
5Pr
opos
ed B
enth
ic In
vert
ebra
te a
nd P
orew
ater
Sam
plin
g Lo
catio
ns, P
age
1 of
2
Tabl
e 5.
5 - P
ropo
sed
Bent
hic
Inve
rteb
rate
and
Por
ewat
er S
ampl
ing
Loca
tions
.xlsx
5/15
/201
4
Loca
tion
Reac
hCh
arac
teriz
atio
nO
bjec
tive
1Po
re W
ater
2Lo
catio
nW
C-09
RI/N
RDA
XO
utfa
ll F-
477-
703
Nor
th o
f I-3
95 B
ridge
WC-
06N
RDA
XAd
jace
nt to
mar
ina
dock
WC-
05N
RDA
Adja
cent
to m
arin
a do
ckR1
-02
RI/N
RDA
Adja
cent
to O
utfa
ll F-
128-
495
R1-0
5N
RDA
Nor
th b
and
at O
utfa
ll F-
937-
544
R1-0
7N
RDA
XN
ear s
outh
ban
k, ju
st u
pstr
eam
from
con
fluen
ce w
ith W
ashi
ngto
n Ch
anne
lR1
-12
RI/N
RDA
Wes
t ban
k ne
ar F
-093
-544
cov
erag
e of
uns
ampl
ed p
ortio
n of
cha
nnel
R1-1
3RI
/NRD
AX
Thal
weg
bet
wee
n ut
ility
cor
ridor
s, c
over
age
of u
nsam
pled
por
tion
of c
hann
el
R2-0
4RI
/NRD
AX
East
shor
elin
e at
Pop
lar P
oint
, at S
ewer
Out
fall
F-89
7-10
4
R2-1
3RI
/NRD
AX
Adja
cent
to N
PDES
005
R3-0
6RI
/NRD
AX
Adja
cent
to F
-405
-220
R3-1
2RI
/NRD
ATr
anse
ct n
ear P
enns
ylva
nia
Ave.
Brid
ge n
ear y
ear 2
000
poin
t
R3-1
5RI
/NRD
AX
Tran
sect
nea
r CSX
Brid
ge n
ear y
ear 2
000
poin
t; ne
ar F
ort D
avis
trib
utar
y (F
-238
-29
0)
R4-0
9RI
/NRD
AX
Tran
sect
nea
r Eas
t Cap
itol S
t. Br
idge
; nea
r Cha
plin
trib
utar
y (F
-903
-371
) and
200
0 po
int
R4-0
3N
RDA
HPAH
hot
spot
dow
nstr
eam
from
Kin
gman
Lak
e co
nflu
ence
R4-0
4N
RDA
XEa
st b
ank
betw
een
Fort
Dup
ont C
reek
out
fall
and
CSX
railr
oad
brid
geR4
-05
NRD
A N
orth
wes
t ban
k up
stre
am o
f mou
th o
f Kin
gman
Slo
ugh
R4-0
6N
RDA
East
ban
k no
rth
of F
ort D
upon
t Cre
ek O
utfa
ll
R5-0
4Be
nnin
g Ro
ad B
ridge
to
East
Cap
itol S
tree
t Brid
geRI
/NRD
AX
Tran
sect
dow
nstr
eam
from
yea
r 200
0 tr
anse
ct
R6-1
3RI
/NRD
AX
Shar
p m
eand
er u
pstr
eam
of K
enilw
orth
Par
k N
orth
Lan
dfill
R6-1
7RI
/NRD
AX
Conf
luen
ce w
ith L
ower
Bea
verd
am C
reek
R7-0
2RI
/NRD
ATr
anse
ct a
t New
Yor
k Av
e. B
ridge
nea
r exi
stin
g ye
ar 2
000
poin
tR7
-05
RI/N
RDA
Tran
sect
nea
r con
fluen
ce w
ith D
uelin
g Cr
eek
R7-0
6RI
/NRD
AX
Cent
er c
hann
el d
owns
trea
m fr
om u
nnam
ed w
etla
nd tr
ibut
ary
R7-0
9RI
/NRD
AN
ear y
ear 2
000
tran
sect
R7-1
2RI
/NRD
ACo
nflu
ence
with
unn
amed
trib
utar
y at
out
fall
PG-T
MP-
13R7
-15
RI/N
RDA
XCe
nter
cha
nnel
sedi
men
t bar
; nea
r yea
r 200
0 tr
anse
ct
Was
hing
ton
Chan
nel
Sout
h Ca
pito
l Str
eet
Brid
ge to
Mou
th o
f Riv
er
11th
Str
eet B
ridge
to
Sout
h Ca
pito
l Str
eet
Brid
ge
CSX
Brid
ge to
11t
h St
reet
Br
idge
East
Cap
itol S
tree
t Brid
ge
to C
SX B
ridge
Amtr
ack
Brid
ge to
Be
nnin
g Ro
ad
Upp
er ti
dal l
imit
to
Amtr
ak B
ridge

TABL
E 5.
5Pr
opos
ed B
enth
ic In
vert
ebra
te a
nd P
orew
ater
Sam
plin
g Lo
catio
ns, P
age
2 of
2
Tabl
e 5.
5 - P
ropo
sed
Bent
hic
Inve
rteb
rate
and
Por
ewat
er S
ampl
ing
Loca
tions
.xlsx
5/15
/201
4
Loca
tion
Reac
hCh
arac
teriz
atio
nO
bjec
tive
1Po
re W
ater
2Lo
catio
nR7
-21
RI/N
RDA
Cent
er c
hann
el se
dim
ent b
arR7
-23
RI/N
RDA
Ups
trea
m o
n N
orth
east
Bra
nch
near
yea
r 200
0 po
int
R7-2
2RI
/NRD
AU
pstr
eam
on
Nor
thw
est B
ranc
hR7
-10
NRD
A Ce
nter
cha
nnel
mid
way
bet
wee
n R7
-7 a
nd R
7-8
R7-2
0N
RDA
Sout
heas
t of B
lade
nsbu
rg R
oad
Brid
ge a
long
nor
thea
st b
ank
KL-0
1RI
/NRD
AX
Dow
nstr
eam
nea
r mou
th o
f Kin
gman
Lak
eKL
-02
RI/N
RDA
Sout
h of
Eas
t Cap
itol S
t. Br
idge
KL-0
8RI
/NRD
AX
Mud
flat
nor
th o
f Eas
t Cap
itol S
t. Br
idge
, nea
r foo
tbrid
geKL
-09
RI/N
RDA
Mai
n ch
anne
l of w
est a
rm b
etw
een
E. C
apito
l St a
nd B
enni
ng R
d
KL-1
0RI
/NRD
AX
East
cha
nnel
nor
th o
f Eas
t Cap
itol S
tree
t and
sout
h of
Ben
ning
Roa
dKL
-12
RI/N
RDA
Dow
nstr
eam
from
F-9
91-0
21KL
-15
RI/N
RDA
Chan
nel i
n no
rthe
rn si
lted-
in p
ortio
n of
Kin
gman
Lak
eKL
-20
RI/N
RDA
XCh
anne
l in
nort
hern
silte
d-in
por
tion
of K
ingm
an L
ake
KL-2
1RI
/NRD
ACh
anne
l in
nort
hern
silte
d-in
por
tion
of K
ingm
an L
ake
KL-2
3RI
/NRD
AM
udfla
t adj
acen
t to
upst
ream
mou
th o
f Kin
gman
Lak
eN
otes
:1.
Cha
ract
eriza
tion
Obj
ectiv
e: R
I - R
emed
ial i
nves
tigat
ion
(incl
udin
g ec
olog
ical
and
hum
an h
ealth
risk
ass
essm
ents
); N
RDA
- Nat
ural
Res
ourc
es D
amag
e As
sess
men
t.2.
Por
e w
ater
will
be
labo
rato
ry-e
xtra
cted
.
King
man
Lak
e
Upp
er ti
dal l
imit
to
Amtr
ak B
ridge
, Co
ntin
ued

TABL
E 5.
6Pr
opos
ed F
ish,
Tur
tle, a
nd C
rayf
ish
Tiss
ue a
nd S
urfa
ce W
ater
Sam
plin
g Lo
catio
ns a
nd R
atio
nale
, Pag
e 1
of 5
Tabl
e 5.
6_Pr
opos
ed F
ish T
issue
Sam
plin
g Lo
catio
ns_M
ay20
14.x
lsx6/
9/20
14
Loca
tion
Med
ium
Reac
hCh
arac
teriz
atio
n O
bjec
tive
1,2
Ecol
ogic
al a
nd H
uman
Hea
lth R
isk
Asse
ssm
ent R
atio
nale
Loca
tion
T-26
-FTi
ssue
Was
hing
ton
Chan
nel
ERA/
NRD
AER
A sa
mpl
es c
olle
cted
op
port
unist
ical
ly a
t thi
s loc
atio
nBe
twee
n Fr
anci
s Cas
e an
d 14
th
Stre
et B
ridge
s
T-25
-FTi
ssue
Was
hing
ton
Chan
nel
ERA/
NRD
AER
A sa
mpl
es c
olle
cted
op
port
unist
ical
ly a
t thi
s loc
atio
nN
ear b
oat s
lips o
n ea
st b
ank
T-23
-FTi
ssue
Was
hing
ton
Chan
nel
ERA/
NRD
AER
A sa
mpl
es c
olle
cted
op
port
unist
ical
ly a
t thi
s loc
atio
nN
ear b
oat s
lips o
n ea
st b
ank
T-20
-FTi
ssue
Was
hing
ton
Chan
nel
ERA/
NRD
ASp
atia
l cov
erag
eEa
st b
ank
Was
hing
ton
Chan
nel
near
Tita
nic
Mem
oria
l T-
19-F
Tiss
ueW
ashi
ngto
n Ch
anne
lER
A/N
RDA
Spat
ial c
over
age
Cent
er o
f Was
hing
ton
Chan
nel
near
the
Nat
iona
l War
Col
lege
T-33
-FTi
ssue
Sout
h Ca
pito
l Str
eet B
ridge
to
Mou
th o
f Riv
erER
A/N
RDA
Cont
amin
ants
may
be
elev
ated
, an
d fis
h m
ay c
ongr
egat
e ne
ar
brid
ge
Belo
w 1
1th
Stre
et B
ridge
, eas
t ba
nk a
t pie
r
T-32
-FTi
ssue
Sout
h Ca
pito
l Str
eet B
ridge
to
Mou
th o
f Riv
erER
A/N
RDA
Cont
amin
ants
may
be
elev
ated
, an
d fis
h m
ay c
ongr
egat
e ne
ar
brid
ge
Belo
w 1
1th
Stre
et B
ridge
, wes
t ba
nk a
t pie
r
T-30
-FTi
ssue
Sout
h Ca
pito
l Str
eet B
ridge
to
Mou
th o
f Riv
erER
A/N
RDA
ERA
sam
ples
col
lect
ed
oppo
rtun
istic
ally
at t
his l
ocat
ion
Wes
t ban
k at
pie
r
T-28
-FTi
ssue
Sout
h Ca
pito
l Str
eet B
ridge
to
Mou
th o
f Riv
erER
A/N
RDA
ERA
sam
ples
col
lect
ed
oppo
rtun
istic
ally
at t
his l
ocat
ion
East
ban
k at
pie
r
T-17
-FTi
ssue
Sout
h Ca
pito
l Str
eet B
ridge
to
Mou
th o
f Riv
erER
A/N
RDA
Spat
ial c
over
age
At c
onflu
ence
with
Pot
omac
R1-5
-SW
Surf
ace
wat
erSo
uth
Capi
tol S
tree
t Brid
ge to
M
outh
of R
iver
HHRA
Pote
ntia
l hum
an re
crea
tiona
l ex
posu
reCo
loca
ted
with
surf
ace
sedi
men
t sa
mpl
e R1
-5R1
-6-S
WSu
rfac
e w
ater
Sout
h Ca
pito
l Str
eet B
ridge
to
Mou
th o
f Riv
erHH
RAPo
tent
ial h
uman
recr
eatio
nal
expo
sure
Colo
cate
d w
ith su
rfac
e se
dim
ent
sam
ple
R1-6
R2-1
4-SW
Surf
ace
wat
er11
th S
tree
t Brid
ge to
Sou
th
Capi
tol S
tree
t Brid
geHH
RAPo
tent
ial h
uman
recr
eatio
nal
expo
sure
Colo
cate
d w
ith su
rfac
e se
dim
ent
sam
ple
R2-1
4

TABL
E 5.
6Pr
opos
ed F
ish,
Tur
tle, a
nd C
rayf
ish
Tiss
ue a
nd S
urfa
ce W
ater
Sam
plin
g Lo
catio
ns a
nd R
atio
nale
, Pag
e 2
of 5
Tabl
e 5.
6_Pr
opos
ed F
ish T
issue
Sam
plin
g Lo
catio
ns_M
ay20
14.x
lsx6/
9/20
14
Loca
tion
Med
ium
Reac
hCh
arac
teriz
atio
n O
bjec
tive
1,2
Ecol
ogic
al a
nd H
uman
Hea
lth R
isk
Asse
ssm
ent R
atio
nale
Loca
tion
T-38
-FTi
ssue
CSX
Brid
ge to
11t
h St
reet
Brid
geER
A/N
RDA
Cont
amin
ants
may
be
elev
ated
, an
d fis
h m
ay c
ongr
egat
e ne
ar
brid
ge
Belo
w P
enns
ylva
nia
Aven
ue
Brid
ge, e
ast b
ank
T-35
-FTi
ssue
CSX
Brid
ge to
11t
h St
reet
Brid
geER
A/N
RDA
ERA
sam
ples
col
lect
ed
oppo
rtun
istic
ally
at t
his l
ocat
ion
Boat
slip
s on
wes
t ban
k be
low
Pe
nnsy
lvan
ia A
venu
e Br
idge
R3-9
-SW
Surf
ace
wat
erCS
X Br
idge
to 1
1th
Stre
et B
ridge
HHRA
Pote
ntia
l hum
an re
crea
tiona
l ex
posu
reCo
loca
ted
with
surf
ace
sedi
men
t sa
mpl
e R3
-9T-
39-F
Tiss
ueEa
st C
apito
l Str
eet B
ridge
to C
SX
Brid
geER
A/N
RDA
ERA
sam
ples
col
lect
ed
oppo
rtun
istic
ally
at t
his l
ocat
ion
Boat
slip
s on
wes
t ban
k
T-44
-FTi
ssue
East
Cap
itol S
tree
t Brid
ge to
CSX
Br
idge
ERA/
NRD
ASp
atia
l cov
erag
eM
ain
stem
eas
t ban
k
T-43
-FTi
ssue
East
Cap
itol S
tree
t Brid
ge to
CSX
Br
idge
ERA/
NRD
ASp
atia
l cov
erag
eM
ain
stem
wes
t ban
k
T-41
-FTi
ssue
East
Cap
itol S
tree
t Brid
ge to
CSX
Br
idge
ERA/
NRD
AER
A sa
mpl
es c
olle
cted
op
port
unist
ical
ly a
t thi
s loc
atio
nBe
low
railr
oad
brid
ge; f
ishin
g pi
er
on e
ast b
ank
R4-4
-SW
Surf
ace
wat
erEa
st C
apito
l Str
eet B
ridge
to C
SX
Brid
geHH
RAPo
tent
ial h
uman
recr
eatio
nal
expo
sure
Colo
cate
d w
ith su
rfac
e se
dim
ent
sam
ple
R4-4
R4-5
-SW
Surf
ace
wat
erEa
st C
apito
l Str
eet B
ridge
to C
SX
Brid
geHH
RAPo
tent
ial h
uman
recr
eatio
nal
expo
sure
Colo
cate
d w
ith su
rfac
e se
dim
ent
sam
ple
R4-5
T-51
-FTi
ssue
Benn
ing
Road
Brid
ge to
Eas
t Ca
pito
l Str
eet B
ridge
ERA/
NRD
ASp
atia
l cov
erag
eAd
jace
nt to
F-0
90-0
64
T-47
-FTi
ssue
Benn
ing
Road
Brid
ge to
Eas
t Ca
pito
l Str
eet B
ridge
ERA/
NRD
ACo
ntam
inan
ts m
ay b
e el
evat
ed,
and
fish
may
con
greg
ate
near
br
idge
Nea
r Whi
tney
Str
eet M
emor
ial
Brid
ge; m
ain
stem
R5-4
-SW
Surf
ace
wat
erBe
nnin
g Ro
ad B
ridge
to E
ast
Capi
tol S
tree
t Brid
geHH
RAPo
tent
ial h
uman
recr
eatio
nal
expo
sure
Colo
cate
d w
ith su
rfac
e se
dim
ent
sam
ple
R5-4
R5-5
-SW
Surf
ace
wat
erBe
nnin
g Ro
ad B
ridge
to E
ast
Capi
tol S
tree
t Brid
geHH
RAPo
tent
ial h
uman
recr
eatio
nal
expo
sure
Colo
cate
d w
ith su
rfac
e se
dim
ent
sam
ple
R5-5

TABL
E 5.
6Pr
opos
ed F
ish,
Tur
tle, a
nd C
rayf
ish
Tiss
ue a
nd S
urfa
ce W
ater
Sam
plin
g Lo
catio
ns a
nd R
atio
nale
, Pag
e 3
of 5
Tabl
e 5.
6_Pr
opos
ed F
ish T
issue
Sam
plin
g Lo
catio
ns_M
ay20
14.x
lsx6/
9/20
14
Loca
tion
Med
ium
Reac
hCh
arac
teriz
atio
n O
bjec
tive
1,2
Ecol
ogic
al a
nd H
uman
Hea
lth R
isk
Asse
ssm
ent R
atio
nale
Loca
tion
T-66
-FTi
ssue
Amtr
ak B
ridge
to B
enni
ng R
oad
Brid
geER
A/N
RDA
Cont
amin
ants
may
be
elev
ated
, an
d fis
h m
ay c
ongr
egat
e ne
ar R
R br
idge
; sha
llow
trib
utar
y dr
ains
in
to ri
ver o
n ea
st b
ank
Dow
nstr
eam
of t
he ra
ilroa
d br
idge
; on
east
ban
k at
mou
th o
f tr
ibut
ary
T-64
-FTi
ssue
Amtr
ak B
ridge
to B
enni
ng R
oad
Brid
geER
A/N
RDA
Fora
ging
are
a fo
r gre
en h
eron
and
ot
her b
irds;
like
ly fi
sh n
urse
ry a
rea
and
cray
fish
habi
tat
In c
hann
els w
ithin
with
in m
udfla
ts
on e
ast b
ank
(bel
ow K
enilw
orth
Ga
rden
s)
T-62
-FTi
ssue
Amtr
ak B
ridge
to B
enni
ng R
oad
Brid
geER
A/N
RDA
Fora
ging
are
a fo
r gre
en h
eron
and
ot
her b
irds;
like
ly fi
sh n
urse
ry a
rea
and
cray
fish
habi
tat
In m
ain
chan
nel a
t ent
ranc
e to
m
udfla
ts (b
elow
Ken
ilwor
th
Gard
ens)
R6
-6-S
WSu
rfac
e w
ater
Amtr
ak B
ridge
to B
enni
ng R
oad
Brid
geHH
RAPo
tent
ial h
uman
recr
eatio
nal
expo
sure
Colo
cate
d w
ith su
rfac
e se
dim
ent
sam
ple
R6-6
R6-7
-SW
Surf
ace
wat
erAm
trak
Brid
ge to
Ben
ning
Roa
d Br
idge
HHRA
Pote
ntia
l hum
an re
crea
tiona
l ex
posu
reCo
loca
ted
with
surf
ace
sedi
men
t sa
mpl
e R6
-7T-
60-F
Tiss
ueAm
trak
Brid
ge to
Ben
ning
Roa
d Br
idge
ERA/
NRD
ASp
atia
l cov
erag
eU
pstr
eam
from
Ken
ilwor
th P
ark
Land
fill a
nd c
onflu
ence
of H
icke
y Ru
nT-
92-F
Tiss
ueU
pper
tida
l lim
it to
Am
trak
Br
idge
ERA/
NRD
ASp
atia
l cov
erag
eN
ear A
naco
stia
Trib
utar
y Tr
ail
(ATT
) brid
geT-
91-F
Tiss
ueU
pper
tida
l lim
it to
Am
trak
Br
idge
ERA/
NRD
ASp
atia
l cov
erag
eU
pstr
eam
on
Nor
thea
st B
ranc
h,
belo
w B
altim
ore
Aven
ue B
ridge
T-
90-F
Tiss
ueU
pper
tida
l lim
it to
Am
trak
Br
idge
ERA/
NRD
ASp
atia
l cov
erag
eSa
ndba
r acc
essib
le fr
om A
TT
T-89
-FTi
ssue
Upp
er ti
dal l
imit
to A
mtr
ak
Brid
geER
A/N
RDA
Nar
row
cha
nnel
wes
t of s
andb
ar
may
pro
vide
refu
ge fo
r fish
aw
ay
from
mai
n ch
anne
l
Shor
elin
e ch
anne
l nex
t to
sand
bar
acce
ssib
le fr
om A
TT
T-88
-FTi
ssue
Upp
er ti
dal l
imit
to A
mtr
ak
Brid
geER
A/N
RDA
Spat
ial c
over
age
Nea
r Bla
dens
burg
Brid
ge

TABL
E 5.
6Pr
opos
ed F
ish,
Tur
tle, a
nd C
rayf
ish
Tiss
ue a
nd S
urfa
ce W
ater
Sam
plin
g Lo
catio
ns a
nd R
atio
nale
, Pag
e 4
of 5
Tabl
e 5.
6_Pr
opos
ed F
ish T
issue
Sam
plin
g Lo
catio
ns_M
ay20
14.x
lsx6/
9/20
14
Loca
tion
Med
ium
Reac
hCh
arac
teriz
atio
n O
bjec
tive
1,2
Ecol
ogic
al a
nd H
uman
Hea
lth R
isk
Asse
ssm
ent R
atio
nale
Loca
tion
T-87
-FTi
ssue
Upp
er ti
dal l
imit
to A
mtr
ak
Brid
geER
A/N
RDA
Shal
low
are
a of
app
aren
t se
dim
ent d
epos
ition
may
be
attr
activ
e to
fora
ge fi
sh a
nd th
eir
pred
ator
s
Shal
low
nar
row
inle
t on
east
ban
k ne
ar A
TT b
ridge
T-86
-FTi
ssue
Upp
er ti
dal l
imit
to A
mtr
ak
Brid
geER
A/N
RDA
ERA
sam
ples
col
lect
ed
oppo
rtun
istic
ally
at t
his l
ocat
ion
East
ban
k so
uth
of A
TT b
ridge
; in
deep
er c
hann
elT-
85-F
Tiss
ueU
pper
tida
l lim
it to
Am
trak
Br
idge
ERA/
NRD
AER
A sa
mpl
es c
olle
cted
op
port
unist
ical
ly a
t thi
s loc
atio
nPi
ers a
ssoc
iate
d w
ith B
lade
nsbu
rg
Wat
erfr
ont P
ark
T-84
-FTi
ssue
Upp
er ti
dal l
imit
to A
mtr
ak
Brid
geER
A/N
RDA
ERA
sam
ples
col
lect
ed
oppo
rtun
istic
ally
at t
his l
ocat
ion
Pier
s ass
ocia
ted
with
Bla
dens
burg
W
ater
fron
t Par
kT-
83-F
Tiss
ueU
pper
tida
l lim
it to
Am
trak
Br
idge
ERA/
NRD
AER
A sa
mpl
es c
olle
cted
op
port
unist
ical
ly a
t thi
s loc
atio
nPi
ers a
ssoc
iate
d w
ith B
lade
nsbu
rg
Wat
erfr
ont P
ark
T-77
-FTi
ssue
Upp
er ti
dal l
imit
to A
mtr
ak
Brid
geER
A/N
RDA
Spat
ial c
over
age
Ope
n ch
anne
l
T-74
-FTi
ssue
Upp
er ti
dal l
imit
to A
mtr
ak
Brid
geER
A/N
RDA
Tida
l cha
nnel
s with
in m
arsh
may
be
att
ract
ive
to fo
rage
fish
and
th
eir p
reda
tors
Nea
r mou
th o
f the
tida
l cha
nnel
s pr
ovid
ing
acce
ss to
mar
sh o
n ea
st
bank
T-71
-FTi
ssue
Upp
er ti
dal l
imit
to A
mtr
ak
Brid
geER
A/N
RDA
Tida
l cha
nnel
s with
in m
arsh
may
be
att
ract
ive
to fo
rage
fish
and
th
eir p
reda
tors
Nea
r mou
th o
f the
tida
l cha
nnel
s pr
ovid
ing
acce
ss to
mar
sh o
n ea
st
bank
T-70
-FTi
ssue
Upp
er ti
dal l
imit
to A
mtr
ak
Brid
geER
A/N
RDA
The
trib
utar
y ap
pear
s ver
y sh
allo
w
at lo
w ti
de, g
ood
habi
tat f
or
fora
ge fi
sh (a
nd c
rayf
ish) a
nd th
eir
vert
ebra
te p
reda
tors
On
wes
t ban
k, d
owns
trea
m o
f sm
all t
ribut
ary
with
pie
r
T-68
-FTi
ssue
Upp
er ti
dal l
imit
to A
mtr
ak
Brid
geER
A/N
RDA
Cont
amin
ants
may
be
elev
ated
, an
d fis
h m
ay c
ongr
egat
e ne
ar
brid
ge
Dow
nstr
eam
of R
oute
50
brid
ge;
on w
est b
ank
R7-1
6-SW
Surf
ace
wat
erU
pper
Tid
al L
imit
to A
mtr
ak
Brid
geHH
RAPo
tent
ial h
uman
recr
eatio
nal
expo
sure
Colo
cate
d w
ith su
rfac
e se
dim
ent
sam
ple
R7-1
6
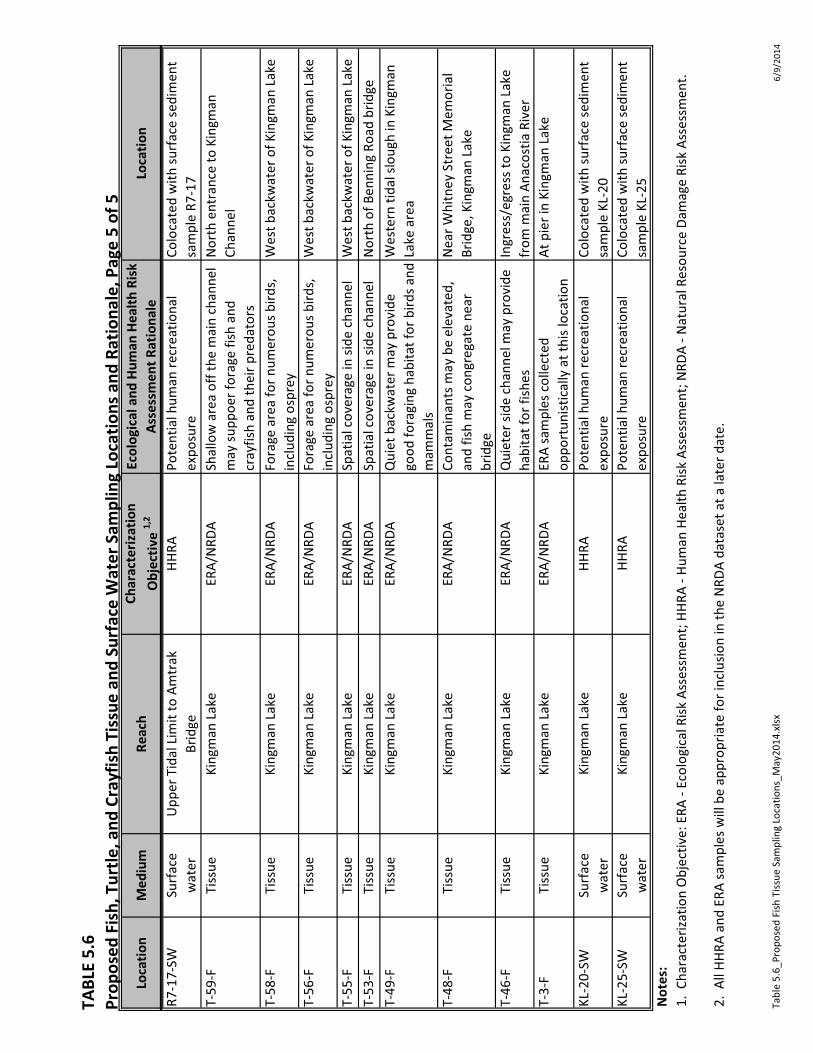
TABL
E 5.
6Pr
opos
ed F
ish,
Tur
tle, a
nd C
rayf
ish
Tiss
ue a
nd S
urfa
ce W
ater
Sam
plin
g Lo
catio
ns a
nd R
atio
nale
, Pag
e 5
of 5
Tabl
e 5.
6_Pr
opos
ed F
ish T
issue
Sam
plin
g Lo
catio
ns_M
ay20
14.x
lsx6/
9/20
14
Loca
tion
Med
ium
Reac
hCh
arac
teriz
atio
n O
bjec
tive
1,2
Ecol
ogic
al a
nd H
uman
Hea
lth R
isk
Asse
ssm
ent R
atio
nale
Loca
tion
R7-1
7-SW
Surf
ace
wat
erU
pper
Tid
al L
imit
to A
mtr
ak
Brid
geHH
RAPo
tent
ial h
uman
recr
eatio
nal
expo
sure
Colo
cate
d w
ith su
rfac
e se
dim
ent
sam
ple
R7-1
7T-
59-F
Tiss
ueKi
ngm
an L
ake
ERA/
NRD
ASh
allo
w a
rea
off t
he m
ain
chan
nel
may
supp
oer f
orag
e fis
h an
d cr
ayfis
h an
d th
eir p
reda
tors
Nor
th e
ntra
nce
to K
ingm
an
Chan
nel
T-58
-FTi
ssue
King
man
Lak
eER
A/N
RDA
Fora
ge a
rea
for n
umer
ous b
irds,
in
clud
ing
ospr
eyW
est b
ackw
ater
of K
ingm
an L
ake
T-56
-FTi
ssue
King
man
Lak
eER
A/N
RDA
Fora
ge a
rea
for n
umer
ous b
irds,
in
clud
ing
ospr
eyW
est b
ackw
ater
of K
ingm
an L
ake
T-55
-FTi
ssue
King
man
Lak
eER
A/N
RDA
Spat
ial c
over
age
in si
de c
hann
elW
est b
ackw
ater
of K
ingm
an L
ake
T-53
-FTi
ssue
King
man
Lak
eER
A/N
RDA
Spat
ial c
over
age
in si
de c
hann
elN
orth
of B
enni
ng R
oad
brid
geT-
49-F
Tiss
ueKi
ngm
an L
ake
ERA/
NRD
AQ
uiet
bac
kwat
er m
ay p
rovi
de
good
fora
ging
hab
itat f
or b
irds a
nd
mam
mal
s
Wes
tern
tida
l slo
ugh
in K
ingm
an
Lake
are
a
T-48
-FTi
ssue
King
man
Lak
eER
A/N
RDA
Cont
amin
ants
may
be
elev
ated
, an
d fis
h m
ay c
ongr
egat
e ne
ar
brid
ge
Nea
r Whi
tney
Str
eet M
emor
ial
Brid
ge, K
ingm
an L
ake
T-46
-FTi
ssue
King
man
Lak
eER
A/N
RDA
Qui
eter
side
cha
nnel
may
pro
vide
ha
bita
t for
fish
esIn
gres
s/eg
ress
to K
ingm
an L
ake
from
mai
n An
acos
tia R
iver
T-3-
FTi
ssue
King
man
Lak
eER
A/N
RDA
ERA
sam
ples
col
lect
ed
oppo
rtun
istic
ally
at t
his l
ocat
ion
At p
ier i
n Ki
ngm
an L
ake
KL-2
0-SW
Surf
ace
wat
erKi
ngm
an L
ake
HHRA
Pote
ntia
l hum
an re
crea
tiona
l ex
posu
reCo
loca
ted
with
surf
ace
sedi
men
t sa
mpl
e KL
-20
KL-2
5-SW
Surf
ace
wat
erKi
ngm
an L
ake
HHRA
Pote
ntia
l hum
an re
crea
tiona
l ex
posu
reCo
loca
ted
with
surf
ace
sedi
men
t sa
mpl
e KL
-25
Not
es:
2. A
ll HH
RA a
nd E
RA sa
mpl
es w
ill b
e ap
prop
riate
for i
nclu
sion
in th
e N
RDA
data
set a
t a la
ter d
ate.
1. C
hara
cter
izatio
n O
bjec
tive:
ERA
- Ec
olog
ical
Risk
Ass
essm
ent;
HHRA
- Hu
man
Hea
lth R
isk A
sses
smen
t; N
RDA
- Nat
ural
Res
ourc
e Da
mag
e Ri
sk A
sses
smen
t.

Remedial Investigation Work Plan Anacostia River Sediments Project
77
6.0 DATA EVALUATION AND REPORTING
This section describes the processes used to ensure the analytical data generated during the field effort are verified, validated, and documented. This section also addresses the synthesis of these data into the project database, the tasks to identify and document potential remaining data gaps and associated reporting, and the objectives moving forward for updating and revising the watershed model.
6.1 Data EvaluationField sampling will be conducted in accordance with the FSP which will address the required numbers, types, and locations of samples and the required types of field and laboratory analyses needed to achieve the project DQOs. The FSP will also indicate the procedures to be used to document sample collection including the chain of custody (CC) and laboratory analyses request documents. CCs and other field documentation will be reviewed on a daily basis to ensure accuracy and completeness. Any discrepancies will be resolved before samples are delivered to the laboratory.
Detailed DQOs will be defined along with quality control criteria and limits in the QAPP. Sampling and analytical methods were selected to meet the project DQOs and quality control criteria. Analytical data collected during this investigation will be verified and validated in accordance with USEPA Region 3 protocols (validation protocols). Validation of fixed-base laboratory analytical data will be performed at an acceptance level sufficient for risk assessment Level 4. Data verification is the process of evaluating the completeness, correctness, and conformance and compliance of a specific data set against method and procedural requirements. Data validation is an analyte- and sample-specific process to determine the analytical quality of a data set. Data quality flags as assigned by the analytical laboratory will be independently reviewed against the validation protocols. Individual values may be flagged as non-detect, detected and qualified (e.g., biased high, biased low, estimated, etc.), or rejected. An analysis result flagged as rejected cannot be used.
Following validation, the data will be incorporated into the project database. An initial goal will be to compare the surface sediment sampling results from the current event with the results from the ANS 2000 sampling event. The results of this comparison will verify usability of the ANS 2000 data for use in assessing the nature and extent of contamination and other project objectives. RI Data Report.
The data from the current sampling will be spatially evaluated to identify any potential remaining data gaps and to quantify zones of elevated concentrations. An RI Data Report will be prepared that will discuss project objectives, field data collection procedures, and analytical methods and summarize the data collection results. In the reporting and discussion of aggregated PCB and PAH results, the report will specify the method of calculation of the specific aggregation. For example, total PCB congeners will be calculated as the sum of the concentrations determined for the 209 PCB congeners; total PCB Aroclors will be the sum of the concentrations determined for the seven PP Aroclors. Similarly, total PAH will be determined as the sum of the 16 PP PAH concentrations. The Data Report will also include a discussion of data validation conducted in accordance with the approved QAPP. The report will also document the

Remedial Investigation Work Plan Anacostia River Sediments Project
78
management and disposal of investigation-derived wastes. Data tables will be used to denote locations where screening criteria are exceeded.
The data report will include:
� A summary of field activities and methods, including a discussion of any discrepancies with the sampling and analysis plan and the effect of such changes upon data usability.
� Rules for data reduction and use. � Tabulated chemical, physical, and biological data. � A sample identification matrix that relates sample identification numbers to sample locations. � Maps showing actual sample locations. � Field logs. � Laboratory data sheets.
Lastly, the report will provide conclusions and recommendations regarding potential remaining data gap closure and associated strategies for moving forward to the RI Summary Report.
6.2 RI Summary Report An RI Summary Report will be prepared that synthesizes the results of all investigations conducted during the RI. All data will be reported in tabular form, and various map overlays and other plots will be used to present the information. The pertinent features of the RI report will be a description of the investigations conducted, discussion of the nature and extent of contamination identified, characterization of potential migration pathways, evaluation of contaminant fate and transport, and incorporation of the baseline human health and ecological risk assessments. The RI portion of the report outline will follow the EPA guidance.
The RI Summary Report will include a summary of the historical data along with the data collected under this work plan. The RI Summary Report will include updates to the conceptual site model, the TAM/WASP model and current findings for the known environmental cleanup sites. The RI summary report will define the nature and extent of the contamination in the River, identify hot spots, summarize the sources of contamination and source control, and provide an evaluation of contaminant fate and transport including the results from the update of the TAM/WASP model.
The RI will evaluate the risk implications of potential exposure to sediments (surface and subsurface), surface water, and biota. This discussion will be based on the results of the baseline ERA and HHRA (and data used in these assessments) and subsurface sediment chemistry data.
The major topics of the RI will include:
� Environmental setting and previous investigations; � Nature and extent of contamination; � Contamination sources, pathways, and source control; � Fate and transport of sediment and sediment-associated chemicals; � Summaries of the risks identified in the baseline ERA and the HHRA

Remedial Investigation Work Plan Anacostia River Sediments Project
79
Ecological risk assessment and human health risk assessment summary reports will be prepared as attachments to the RI report, or as separate reports. These reports will summarize the findings for the ecological and human health risks from contaminants in the sediments, surface water, pore water and biota in the river. More information on the ecological and human health risk assessments are presented in Sections 7 and 8 of this work plan.
6.3 Watershed Model Update and Revision Once verification and validation of the RI data are complete, the data can be used to support efforts to update the hydrodynamic and fate and transport model for the tidal Anacostia River. As discussed in Behm and others (2003), the calibration process can include adjusting chemical load inputs (contributions from CSS outfalls, MS4 outfalls, tributaries, groundwater seepage, etc.), sediment/water partitioning coefficients, and other fate and transport parameters to achieve the best possible match between predicted water column, fish tissue, and sediment concentrations and observed concentrations. In addition, updating the watershed model may involve computer code modifications to allow treatment of a greater range of system processes (e.g., emulsification, photo-oxidation, biodegradation, etc.) that can be important in accessing the fate and transport of sediment contaminants. Alternatively, other computer modeling approaches may potentially be considered to augment the TAM/WASP model should the addition of these processes be deemed necessary by watershed stakeholders.

Remedial Investigation Work Plan Anacostia River Sediments Project
80
7.0 ECOLOGICAL RISK ASSESSMENT
The primary objective of the ERA is to determine whether site contaminants pose a current or potential risk to ecological receptors in the absence of remediation. The ERA will be used to determine whether remediation is necessary at the site, provide justification for performing remedial action, and determine which exposure pathways must be remediated. The areas to be addressed in the ERA include the Anacostia River (bank-to-bank) sediments, surface water, and related biota within the study area. Areas adjacent to the environmental cleanup sites may be excluded from the ERA because other entities may be responsible for characterization and assessment in these areas, as appropriate. On Figure 1.1, the excluded areas are denoted as “Area of Influence.” As part of the RI, the ERA will be based on data collected during the RI field activities and other data available from other reliable sources, including historical data and data from the known environmental sites that are found to be usable based on the project DQOs.
This technical approach was based on both site specific and programmatic information, including the following: review of field investigations conducted on the Anacostia River; a review of supporting data on the river ecosystem; EPA guidance on ERAs; and knowledge of and experience with best practices in ERAs.
The physical characteristics and known environmental condition of the tidal Anacostia River are described in Section 2.0. The ecological CSM is presented in Section 3.2. Together, these discussions provide a context for the technical approach. General approaches to the SLERA and BERA are presented below.
7.1 SLERA The SLERA will be conducted consistent with Steps 1 and 2 of EPA’s 8-step ERA guidance for Superfund sites (EPA 1997a), discussions with DDOE staff, and applicable DDOE guidance. Two steps are involved in conducting a SLERA: (1) problem formulation and (2) screening level exposure estimate and risk calculation. Upon completion of Steps 1 and 2, the site must be evaluated for one of the three possible decisions summarized below.
1. There is enough information to conclude that potential ecological risks negligible and therefore no further action is warranted at the site on the basis of ecological risk.
2. The information is not adequate to make a decision at this point, and the ERA process will proceed to a BERA.
3. The information indicates a potential for adverse ecological effects, and a focused BERA is warranted.
Although many studies have been conducted on the tidal Anacostia River and evidence of ecological risk has been reported, completion of Steps 1 and 2 of the ERA process is a necessary element of the RI. It is reasonable to assume that the SLERA will support a decision that a BERA should be conducted (#2 above) because no formal BERA has addressed all the components of the tidal Anacostia ecosystem. The

Remedial Investigation Work Plan Anacostia River Sediments Project
81
following sections discuss problem formulation and screening-level exposure estimates and risk calculations for the SLERA.
7.1.1 Problem Formulation The objective of the problem formulation step is to collect sufficient information concerning the Anacostia River Site to develop a CSM. The preliminary CSM, introduced in Section 3.2, includes a fate and transport diagram (Figure 3.1) that traces movements of contaminants through the ecosystem and identifies potential exposure pathways and receptors. One of the major goals of the CSM is to identify complete exposure pathways and receptors at potential risk.
7.1.1.1 Habitat Assessment
The purpose of the habitat assessment is to gather data necessary to identify potential ecological receptors and to support the development of a conceptual site model. The assessment will summarize existing information on habitat within the study area from other studies and the published literature. It will include the identification of the state and federal threatened and endangered species and DDOE species of concern likely to be present at the study site.
7.1.1.2 Assessment Endpoints
Assessment endpoints for a SLERA are focused on adverse effects on all potential ecological receptors. Key receptor groups associated with the Anacostia River include benthic invertebrates, fish, freshwater turtles, and semi-aquatic avian and mammalian receptors that may be exposed to contaminants in sediment, water, and food items in the river. Typical species and exposure pathways for ecological receptors in the Anacostia River are discussed in Section 3.2.2 (Conceptual Site Model). Fate and transport mechanisms, ecotoxicological properties, habitats, and receptors at the site all influenced the selection of the assessment endpoints. The survival, growth, and reproduction of key organisms are considered ecological values to be protected. The general ecological management goal that will guide selection of assessment endpoints is summarized below:
� Ensure adequate protection of ecological systems within the tidal Anacostia River by protecting them from the deleterious effects of acute and chronic exposures to site-related COC.
The specific assessment endpoints for the SLERA are summarized below:
� Ensure adequate protection of the aquatic communities in the Anacostia River by protecting them from the deleterious effects of acute and chronic exposures to site-related COCs in sediment, surface water, and prey.
� Ensure adequate protection of the aquatic-dependent vertebrate populations (turtles, birds, and mammals) associated with the Anacostia River by protecting them from the deleterious effects of acute and chronic exposures due to uptake of site-related COCs in sediment, surface water, and prey.
� Ensure adequate protection of threatened and endangered species and species of special concern and their habitats in the Anacostia River by protecting them from the deleterious direct and indirect effects of acute and chronic exposures to site-related COCs.
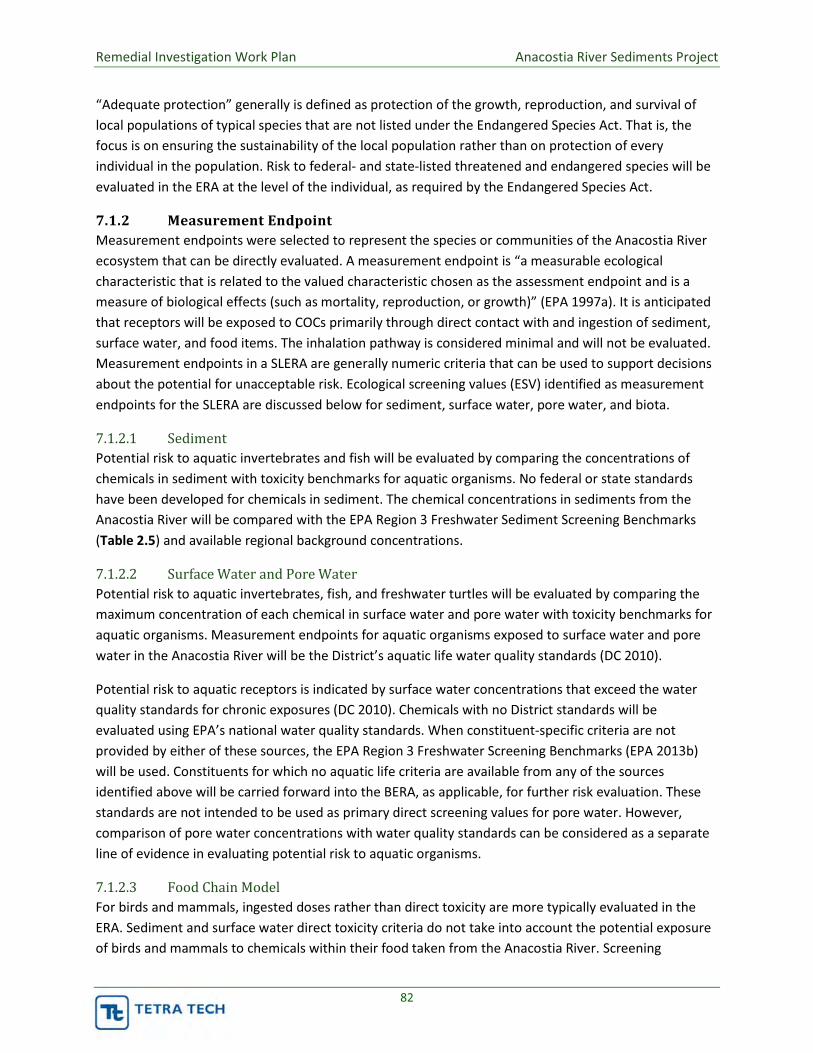
Remedial Investigation Work Plan Anacostia River Sediments Project
82
“Adequate protection” generally is defined as protection of the growth, reproduction, and survival of local populations of typical species that are not listed under the Endangered Species Act. That is, the focus is on ensuring the sustainability of the local population rather than on protection of every individual in the population. Risk to federal- and state-listed threatened and endangered species will be evaluated in the ERA at the level of the individual, as required by the Endangered Species Act.
7.1.2 Measurement Endpoint Measurement endpoints were selected to represent the species or communities of the Anacostia River ecosystem that can be directly evaluated. A measurement endpoint is “a measurable ecological characteristic that is related to the valued characteristic chosen as the assessment endpoint and is a measure of biological effects (such as mortality, reproduction, or growth)” (EPA 1997a). It is anticipated that receptors will be exposed to COCs primarily through direct contact with and ingestion of sediment, surface water, and food items. The inhalation pathway is considered minimal and will not be evaluated. Measurement endpoints in a SLERA are generally numeric criteria that can be used to support decisions about the potential for unacceptable risk. Ecological screening values (ESV) identified as measurement endpoints for the SLERA are discussed below for sediment, surface water, pore water, and biota.
7.1.2.1 Sediment
Potential risk to aquatic invertebrates and fish will be evaluated by comparing the concentrations of chemicals in sediment with toxicity benchmarks for aquatic organisms. No federal or state standards have been developed for chemicals in sediment. The chemical concentrations in sediments from the Anacostia River will be compared with the EPA Region 3 Freshwater Sediment Screening Benchmarks (Table 2.5) and available regional background concentrations.
7.1.2.2 Surface Water and Pore Water
Potential risk to aquatic invertebrates, fish, and freshwater turtles will be evaluated by comparing the maximum concentration of each chemical in surface water and pore water with toxicity benchmarks for aquatic organisms. Measurement endpoints for aquatic organisms exposed to surface water and pore water in the Anacostia River will be the District’s aquatic life water quality standards (DC 2010).
Potential risk to aquatic receptors is indicated by surface water concentrations that exceed the water quality standards for chronic exposures (DC 2010). Chemicals with no District standards will be evaluated using EPA’s national water quality standards. When constituent-specific criteria are not provided by either of these sources, the EPA Region 3 Freshwater Screening Benchmarks (EPA 2013b) will be used. Constituents for which no aquatic life criteria are available from any of the sources identified above will be carried forward into the BERA, as applicable, for further risk evaluation. These standards are not intended to be used as primary direct screening values for pore water. However, comparison of pore water concentrations with water quality standards can be considered as a separate line of evidence in evaluating potential risk to aquatic organisms.
7.1.2.3 Food Chain Model
For birds and mammals, ingested doses rather than direct toxicity are more typically evaluated in the ERA. Sediment and surface water direct toxicity criteria do not take into account the potential exposure of birds and mammals to chemicals within their food taken from the Anacostia River. Screening

Remedial Investigation Work Plan Anacostia River Sediments Project
83
benchmarks will consist of toxicity reference values (TRV) derived from the toxicological literature on reproductive and physiological effects of contaminants. Daily ingested doses will be estimated based on chemical concentrations in sediment, surface water, and prey in the river and information on natural history of avian and mammalian receptors. The measurement endpoint for birds and mammals will be a daily ingested dose of chemicals calculated using a food chain model (FCM). Dose estimates will then be compared with TRVs to assess potential risk, as described below.
The FCM assumes exposure to COCs primarily through ingestion of contaminated environmental sediment, surface water, and prey. Exposure models estimate the mass of a COC ingested daily by a receptor per kilogram of body weight per day (the daily COC dose). Estimates of exposure generally are based on knowledge of the spatial and temporal distribution of both COCs and receptors, and on specific natural and life history characteristics that influence exposure to COCs. Maximum detected concentrations of chemicals in surface sediment and surface water samples will be used in FCMs to estimate doses to avian and mammalian receptors in the SLERA.
Daily doses will be estimated for each COC and representative receptor when adequate data are available and these models are appropriate. Dose estimates will then be compared with a high and low TRV to estimate the potential adverse biological effects on the receptor. No observed adverse effect level (NOAEL) and lowest observed adverse effect level (LOAEL) TRVs will be used as low and high benchmarks, respectively, to evaluate potential risks to birds and mammals. The NOAEL TRV will represent the highest dose at which no adverse effects are expected to occur (de minimis risk). A receptor could potentially receive a daily dose that exceeds the NOAEL TRV and still not experience an adverse effect; thus, NOAEL TRVs are conservative and have the potential to over-estimate risk. The LOAEL TRV represents the lowest dose at which adverse effects have been detected. While typically less conservative than NOAEL TRVs, LOAEL TRVs are generally more representative of a natural toxicological response with meaningful ecological ramifications. The risk to each representative species will be characterized using a hazard quotient (HQ) approach based on this comparison.
The total exposure from ingestion for each receptor of concern will be calculated as the sum of the dietary exposure estimates. The following generic equation will be adapted for each representative receptor:
BWSUF])C[IR]CIR[+]CIR([
=Dose swswsedsedpreypreytotal
××+××
where
Dosetotal = Estimated dose from ingestion (mg/kg-day)
IRprey = Ingestion rate of prey (kg/day)
Cprey = Concentration in DW of COC in prey (mg/kg)
IRsed = Ingestion rate of sediment (kg/day)
Csed = Concentration in DW of COC in sediment (mg/kg)
IRsw = Ingestion rate of surface water (L/day)
Remedial Investigation Work Plan Anacostia River Sediments Project
84
Csw = Concentration of COC in surface water (mg/L)
SUF = Site use factor (unitless)
BW = Adult body weight (kg)
The risk estimates developed in the SLERA will ensure that the assessment does not indicate little or no risk when a risk actually exists. Therefore, conservative assumptions will be used in this analysis in the absence of site- or species-specific data, such as maximum concentrations, site use factors of unity, and other conservative assumptions. Ecological receptors were selected based on species distributions reported in the literature (AWTA 2002; Galli et al. 2010; NPS 2010). Exposure will be assessed within the context of the following linear food chains to evaluate potential ecological effects on secondary consumer birds and mammals:
� Surface Water and S���������������\�����������&�������� � ���������������� ���������������\�����������&����������������
Site-specific prey data may not be available for use in the dose calculation described above. Therefore, bioaccumulation models will be used to estimate the concentrations of COCs in prey tissue based on the concentrations of COCs in sediment. Sediment-to-biota bioaccumulation models for benthic invertebrates and fish may be used, either as simple bioaccumulation factors (BAF) that can be multiplied by the concentration in the sediment or as regression models that incorporate the concentration in sediment to estimate the COC concentration in prey. Biota-sediment accumulation factors (BSAF) that incorporate the percent lipid in tissue and TOC in sediment may also be incorporated into the food chain models as appropriate.
Updated ecological sediment screening level BAFs, BSAFs, and regressions will be used whenever available. Additional regression models and simple BAFs (Bechtel-Jacobs Company, LLC 1998; Sample and Arenal 1999; Sample, Opresko, and Suter 1996; Baes, Sharp, Sjoreen, and Shor 1984; EPA 2005) will be chosen if no regression is available. A regression model will be applied only if the model is significant (the slope differs significantly [p < 0.05] from 0) and the coefficient of determination (R2) is greater than or equal to 0.6. If these criteria are not met, another regression model, BAF, or BSAF will be selected to estimate bioaccumulation.
7.1.3 SLERA Exposure Estimates and Risk Calculations The maximum concentration is considered a conservative estimate of the exposure point concentration (EPC) in the SLERA. In general, an estimate of exposure is compared with a relevant toxicologically-based screening value to yield an HQ representing potential risk, as shown in the equation below:
TRV
Doseor
ESV
EPCHQ =
An HQ threshold value of 1.0 will be used to identify COCs. Although probabilities cannot be specified based on a point-estimate approach, an HQ of less than 1.0 is generally regarded as indicating a low probability of adverse ecological effects. A constituent with an HQ greater than 1.0 is present at levels above its threshold concentration but may or may not pose actual risk.

Remedial Investigation Work Plan Anacostia River Sediments Project
85
7.1.4 SLERA Summary and Conclusions One of the final objectives of the SLERA is to identify potential ecological risks that should be further characterized and refined in the BERA. EPA guidance has identified this as a risk management decision point. The SLERA will present a summary of the procedures used, the potential risks identified, and a discussion of the uncertainties associated with the results. Based on the results of the SLERA and the uncertainties, a risk management recommendation will be provided on whether a BERA is needed to support a final risk management decision. Based on review of existing data and prior studies, it is anticipated that a BERA will be conducted immediately following the SLERA. In the BERA, exposure assumptions are refined to reflect more realistic field conditions. Additional data may be collected in the BERA to measure field conditions that affect exposure, effects, and related risks.
7.2 BERASteps 3 through 8 of the ERA guidance constitute a BERA (EPA 1997a). The three principal phases of a BERA are problem formulation, study design and implementation, and risk characterization.
7.2.1 Problem Formulation – Refinement The objective of the BERA problem formulation is to establish the risk assessment goals and focus, characterize potential ecological effects, update the CSM, refine exposure pathways, and establish the assessment endpoints.
As an initial step in BERA problem formulation, COCs identified during the SLERA will be re-evaluated to focus the BERA on COCs most likely to drive a remedial action. COCs that pose a negligible risk based on low magnitude (HQ near 1.0), low frequency of detection (less than 5 percent), or minimal difference from background may be eliminated from further consideration in the BERA.
Tetra Tech will review the recent toxicity literature for the COCs retained in the BERA to identify whether there are more relevant TRVs based on the NOAELs and LOAELs for site-specific receptors. The toxicity mechanism and function (acute or chronic) for each TRV also will be identified. The goal is to identify TRVs that are more appropriate for the species and exposure pathways expected at the site. Observations and biota collected during the field sample phase will be used to provide realistic adjustments to the conservative default assumptions of the SLERA.
Potentially complete exposure pathways identified in the SLERA CSM will be refined based on site-specific conditions. The fate and transport of each COC significantly affects potential exposure and effects at the site.
To complete the CSM for the BERA, measurement and assessment endpoints will be reviewed and modified as needed. Available literature will be reviewed to refine assumptions on distribution and abundance of species; conservation status; and natural history of key species (such as foraging behavior, habitat use, home range, and other site-specific information). Potential or known presence of federal- and state-identified threatened and endangered species and DDOE species of special concern will be evaluated.

Remedial Investigation Work Plan Anacostia River Sediments Project
86
The BERA endpoints will focus on specific exposure pathways for a variety of receptors. In the riverine habitats of the Anacostia River, these endpoints may include the following:
� Function and viability of the aquatic community (benthic invertebrates, fish, turtles); � Function and viability of omnivorous mammals along the shoreline (represented by the mink
and river otter ); � Function and viability of carnivorous birds along the shoreline (represented by the green heron
and osprey).
Omnivorous and carnivorous birds and mammals are important consumers at the site and play a role in structuring the riverine community. Adverse effects on these top predators may initiate a cascade of adverse ecosystem effects because the loss of top predators generally leads to disruption of lower trophic levels.
7.2.2 Measurement Endpoints and Study Design Measurement endpoints identified in the SLERA will be re-evaluated and revised as appropriate for the BERA, based on field observations and literature reviews.
The next step in the BERA will be to prepare a study design to clearly identify the lines of evidence and the measurement endpoints needed to evaluate risk to assessment endpoints. The following sections discuss the aquatic habitat study design and the FCM.
7.2.2.1 Sediment
The conservative sediment criteria and guidelines used in the SLERA will be reviewed and modified in the BERA, if appropriate. In cases where the conservative guidelines are retained, the full range of sediment exposure concentrations will be evaluated using probabilistic statistics rather than simply comparing the maximum sediment concentration with a toxicity benchmark.
Laboratory bioassays will provide a measure of direct toxicity to standardized test organisms under controlled exposure conditions. Bioassay results will be compared with both laboratory control samples and reference samples (if available). (The determination of reference sediment locations is still under review.)
7.2.2.2 Surface Water
The same measurement endpoints for surface water used in the SLERA will be used in the BERA because they are regulatory standards for the protection of aquatic life.
Estimated doses may be refined to reflect more realistic exposure scenarios in the Anacostia River. For example, site use factors and ingestion rates may be modified to represent a more typical exposure rather than the maximum exposure scenario for receptors that are not protected under the Endangered Species Act. Comparison with acute rather than chronic water quality standards can reflect more realistic exposure scenarios for typical species in the river.
Remedial Investigation Work Plan Anacostia River Sediments Project
87
7.2.2.3 Prey Tissue
The FCM used in the SLERA is based on maximum sediment and water concentrations and modeled tissue concentrations to estimate doses. To make the FCM more site specific and realistic, tissues of organisms from the Anacostia River will be analyzed for target chemicals. Where available, benthic invertebrates, such as crayfish and clams, will be collected. Fishes of a species and size likely to be eaten by birds and mammals will also be analyzed (see Section 5.3) It is anticipated that both pelagic and demersal fish species (such as killifish, sunfish, herring, and catfish) will be collected.
Collocated sediment and tissue samples can be analyzed to derive site-specific BSAFs for use in the BERA. If field-collected tissue samples are unavailable, it may be necessary to collect site-specific sediments for bioaccumulation testing in the laboratory to derive estimates of BSAFs in a later phase of the BERA.
7.2.2.4 Bioassays
Laboratory bioassays provide an independent line of evidence in the BERA. As mentioned above, such direct toxicity tests can provide a better understanding of the toxicity associated with sediment from a specific area than a simple review of sediment chemistry. However, bioassays are not always definitive, and toxic effects are not always well correlated with sediment chemistry. A 42-day amphipod test will measure effects on survival, growth, and reproduction. A 10-dat chironomid test will measure effects on survival. Bioassay results will be evaluated as one line of evidence contributing to the risk characterization.
7.2.3 Risk Characterization Risk characterization focuses on the causal relationship between exposure and effects. The characterization will incorporate what is known about potential exposure pathways to representative receptors in the Anacostia River with evidence of chemical concentrations in sediment, water, and biota. Risk characterization consists of two parts: (1) risk estimation and (2) risk description.
Risk estimation is a quantitative process in which exposure concentrations are compared with effect levels appropriate to the receptor and medium being evaluated. The resulting HQs are numerical estimates of risk, given the assumptions stated elsewhere in the BERA. Risk estimates are calculated for individual chemicals and receptors, and do not take into account multiple exposures or indirect effects. For some receptors, more than one risk estimate will be calculated based on different exposure or effect assumptions. For example, risk estimates can be calculated for surface water concentrations using both acute and chronic standards. For sediment, risk estimates can be prepared for samples at discrete depths. The particular assumptions that prevail for each type of risk estimate will be explained in the BERA.
Risk description is a more qualitative evaluation of the numerical risk estimates and other factors that influence the realization of risk for each receptor. In the risk description, chemicals of greatest concern, or “risk drivers,” are identified based on the magnitude of the risk estimate and the confidence level in the exposure assessment. Risk to federal- and state-identified threatened and endangered species will be discussed at the level of the individual, as required by the Endangered Species Act.

Remedial Investigation Work Plan Anacostia River Sediments Project
88
7.2.4 Uncertainty Analysis It is critical that the risk managers understand the uncertainties associated with the risk estimates provided in the BERA. The uncertainty analysis will discuss a variety of topics including the limitations of the sampling data, use of toxicity benchmarks, food chain modeling, bioaccumulation data, bioavailability, site use factors, body weight and ingestion rates, development of TRVs, individual and population variations, and risk characterization.
7.2.5 BERA Summary and Conclusions Overall risks to the selected ecological receptors will be presented using a weight-of-evidence approach. This approach considers the various COCs present, the uncertainties associated with the data collection methods, toxicity data, and risk estimation methods. It will also evaluate the consistency between laboratory and field data and the impact of each line of evidence on the estimated risks. Presentation of the estimated risks based on both NOAEL and LOAEL TRVs will provide risk managers with an understanding of the potential range of risks for the ecological receptors and will allow them to develop site-specific remediation goals.

Remedial Investigation Work Plan Anacostia River Sediments Project
89
8.0 HUMAN HEALTH RISK ASSESSMENT
The primary objective of the HHRA is to determine whether site contaminants pose a current or potential risk to human health in the absence of remediation. The HHRA will be used to determine whether remediation is necessary at the site, provide justification for performing remedial action, and determine what exposure pathways must be remediated. The areas to be addressed in the risk assessment include the Anacostia River (bank-to-bank) sediments, surface water, and related biota within the study area. The anticipated significant exposure pathways that will be considered are ingestion of contaminated tissue (fish, turtle, and crayfish, as available) and surface water and direct contact with contaminated surface water and sediment. As noted in Section 1.4, the assessment of risks to human health resulting from exposure to potential contaminants in the soil on Kingman and Heritage Islands is outside of the scope of this investigation.
Tetra Tech will conduct HHRA activities consistent with EPA and District of Columbia (DC) guidance. The primary guidance documents to be used in preparing the HHRA are listed below. This list is not comprehensive, and other EPA and District guidance documents, as well as documents prepared by other organizations, will be used as appropriate.
1. EPA. 1989. Risk Assessment Guidance for Superfund (RAGS), Volume 1: Human Health Evaluation Manual (Part A).” Interim Final. Office of Emergency and Remedial Response (OERR). Washington, D.C. EPA 540-1-89-002. December.
2. EPA. 1991. “RAGS, Volume I: Human Health Evaluation Manual, Supplemental Guidance: Standard Default Exposure Factors.” Interim Final. Office of Solid Waste and Emergency Response (OSWER) Directive 9285.6-03. March 25.
3. EPA. 1992b. “Guidance for Data Usability in Risk Assessment (Part A) Final.” OERR. Publication 9285.7-09A. April.
4. EPA. 1997b. “Exposure Factors Handbook.” Volumes I through III. Office of Research and Development. EPA 600-P-95-002Fa, -Fb, and -Fc. August.
5. EPA. 2001. RAGS, Volume 1 – Human Health Evaluation Manual Part D, Standardized Planning, Reporting, and Review of Superfund Risk Assessments. Final. Office of Superfund Remediation and Technology Innovation. Publication 9285.7-47. December.
6. EPA. 2002a. “Calculating Upper Confidence Limits for Exposure Point Concentrations at Hazardous Waste Sites.” OSWER 9285.6-10. December.
7. EPA. 2003. “Human Health Toxicity Values in Superfund Risk Assessments.” OSWER Directive 9285.7-53. December.
8. EPA. 2004. Risk Assessment Guidance for Superfund Volume I: Human Health Evaluation Manual (Part E, Supplemental Guidance for Dermal Risk Assessment). Final. OSWER. EPA 540-R-99-005. July.
Remedial Investigation Work Plan Anacostia River Sediments Project
90
9. EPA. 2005. “Supplemental Guidance for Assessing Susceptibility from Early-Life Exposure to Carcinogens.” Risk Assessment Forum. EPA 630-R-03-003F. March.
10. EPA. 2010. “ProUCL Version 4.1 User Guide.” Draft. ORD. EPA 600-R-07-041. May.
11. EPA. 2011. “Exposure Factors Handbook: 2011 Edition.” Office of Research and Development (ORD). EPA 600-R-090-052F. September12.
12. EPA. 2013c. “User’s Guide for Regional Screening Levels (May 2013).”
13. EPA. 2013d. “Regional Screening Level (RSL) Fish Ingestion Table, (May 2013).”
As described in EPA’s RAGS, the risk assessment will be conducted in four basic steps: (1) data evaluation and identification of COC, (2) exposure assessment, (3) toxicity assessment, and (4) risk and hazard characterization. In addition, the HHRA will include a discussion and evaluation of significant sources of uncertainties in the risk assessment process as applied at the Anacostia Site. Each of these risk assessment elements is summarized below.
8.1 Data Evaluation and Identification of COCs The HHRA will be based primarily on available medium-specific analytical results associated with RI activities. These RI results will be as supplemented by historical analytical results collected by other individuals and organizations at sites associated with the tidal Anacostia River; contaminants from these other sites may have contributed to contamination in the tidal Anacostia River. In these investigations numerous sediment, surface water, pore water, biota, and other samples have been or will be collected.
The cumulative analytical results will be evaluated in accordance with EPA’s Guidance for Data Usability in Risk Assessment (Part A) Final (EPA 1992a) to determine whether the data may be used in a quantitative risk assessment. The evaluation process will be documented as part of HHRA activities.
Medium-specific COCs will be selected following the process described in EPA’s RAGS. The first step is to identify all chemicals positively detected in at least one sample, including (1) chemicals with no data qualifiers and (2) chemicals with data qualifiers indicating known identities but estimated concentrations (for example, J-qualified data). As discussed in RAGS, this initial list of chemicals may be reduced based on the following factors:
� Evaluation of detection frequency (chemicals detected in less than 5 percent of samples and not potentially site-related will not be retained as COCs),
� Evaluation of essential nutrients, and � Use of a concentration-toxicity screen (the more conservative [lower] of chemical-, receptor-,
and medium-specific levels among EPA Regional Screening Levels [RSL] [EPA 2013b], EPA fish ingestion RSLs [EPA 2013d], maximum contaminant levels [MCL] [EPA 2012], federal and District water quality criteria [EPA 2013a], and other medium-specific levels as appropriate).
After consideration of these factors, those chemicals with maximum detected concentrations exceeding screening levels or for which screening levels are not available will be retained as medium-specific COCs. To ensure that elevated detection limits (DL) do not result in inappropriate exclusion of chemicals from
Remedial Investigation Work Plan Anacostia River Sediments Project
91
further evaluation, one-half of the maximum detected DL of a constituent not detected in a given medium will be compared to the appropriate screening level. The results of these comparisons may result in inclusion of a non-detected chemical as a COC or discussion of the potential impact of excluding such a chemical as part of the uncertainty discussion.
In EPA’s RAGS (1989), background screening was a secondary step in the COC selection process. However, consistent with EPA’s evolving stance regarding the use of background in risk assessments (EPA 2002b), more recent EPA guidance eliminates the consideration of background screening in the selection of COCs. The primary contaminants associated with the Anacostia site include PAHs, PCBs, dioxins and furans, pesticides, and metals. Concentrations of COCs in upstream medium-specific samples will be qualitatively compared to site-specific concentrations to provide context for and inform the interpretation of HHRA results by risk managers.
8.2 Exposure Assessment The exposure assessment presents the methods used to estimate the types and magnitudes of potential human exposure to COCs in various media. EPA’s RAGS defines exposure as human contact with a chemical or physical agent. The exposure assessment consists of three fundamental steps: (1) exposure setting characterization (including characterizing the site and potential receptors), (2) exposure pathway identification through a CSM, and (3) exposure quantification. Each of these steps is briefly discussed below.
8.2.1 Exposure Setting Characterization The exposure setting consists of the physical setting (including natural and man-made features), land uses, and the populations living near the site. This information forms the foundation for selecting potential receptors, exposure pathways, and exposure parameters (for example, how often a receptor may visit the site). The environmental setting of the Anacostia River is described in Section 2.0 of this WP.
8.2.2 Exposure Pathway Identification Exposure pathways to be considered in the HHRA will be identified through a human health CSM. The CSM links potential or actual contaminant releases to potential human exposures. Specifically, the CSM identifies (1) potential contaminant sources and mechanisms of release, (2) potential receptors and exposure pathways, and (3) exposure scenarios. Figure 3.1 presents the generalized CSM for the Anacostia site. This generalized CSM will be updated to reflect specific conditions, receptors, pathways, etc. which are identified as relevant and important to the HHRA. The human health CSM will be included as part of the draft HHRA.
Consistent with EPA’s RAGS, the Anacostia Site HHRA will consider only complete (or potentially complete) exposure pathways. An exposure pathway generally consists of four elements: a source and mechanism of chemical release, (2) a retention or transport medium (or media in cases involving media transfer of chemicals), (3) a point of potential human contact with the contaminated medium, and (4) an exposure route (for example, ingestion). Based on an initial review, the primary human health receptors are persons engaged in recreational activities. Additionally, workers engaged in construction and utility

Remedial Investigation Work Plan Anacostia River Sediments Project
92
installation/repair activities may be exposed to site-related contamination if the activities are located immediately adjacent to or extend into the river. A preliminary list of potential human receptors for consideration in the HHRA is presented below:
� Recreational receptors – this group of receptors includes persons (adult, youth, and child) engaged in recreational activities (including fishing, swimming, boating, and hiking) in or along the Anacostia River in the study area. It is important to remember that the HHRA (and the RI in general) is focused on the area within the river from bank to bank; that is, the HHRA will not be evaluating potential exposure to contaminated soil and sediment outside the banks. Also, recreational receptors include friends and relatives of persons who catch fish and other biota (such as turtles, clams, or crayfish) from the Anacostia River who may be exposed through ingestion of contaminated biota tissue only.
� Subsistence Receptors – this group of receptors includes persons (adult, youth, and child) who rely on fish and other organisms from the Anacostia River for the majority of their protein. Reports in the public media indicate that as many as 17,000 individuals may be considered subsistence fishers that rely on the Anacostia River (Anacostia Watershed Society 2012). According to EPA, concern about fish and shellfish safety is higher for subsistence anglers, as they exhibit some of the highest consumption rates (http://cfpub.epa.gov/eroe/index.cfm?fuseaction=list.listBySubTopic&ch=47&s=287).
� Construction and Utility Workers – this group of receptors (adults only) includes persons engaged in construction and utility installation/repair activities that requires exposure to sediment and surface water within the banks of the Anacostia River in the study area.
All receptors are assumed to be exposed under both current and future land use conditions. In fact, for the purposes of the draft HHRA, current and future land use conditions for the Anacostia site are expected to be similar in the sense that activities that currently occur in and along the river (for example, swimming, boating, and fishing) are expected to also take place in the future. However, the frequency and locations at which these activities occur may change in response to the construction of planned developments along the river.
The primary exposure scenarios expected at the site involve exposures to chemicals in sediment, surface water, and biota. Potential exposure scenarios include the following:
� Direct contact (incidental ingestion of and dermal contact with) chemicals in sediment and surface water. Potential human exposure to sediment by recreational receptors is assumed to be limited to shallow depths as encountered while receptors are engaged in expected recreational activities in and along the river such as swimming, boating, and fishing. The risk assessment will assess potential exposure to sediment 0 to 6 inches deep, but will acknowledge the potential for limited contact to somewhat deeper sediment (up to about 12 inches deep).Construction and utility workers may be exposed to deeper sediments.
� Ingestion of chemicals in biotic tissue (assumed to be primarily fish tissue, but may also include other species such as crayfish, clams, and turtles). For the purposes of the draft HHRA, most human receptors are assumed to consume only fillets and not the whole fish (EPA 1997c 1998).
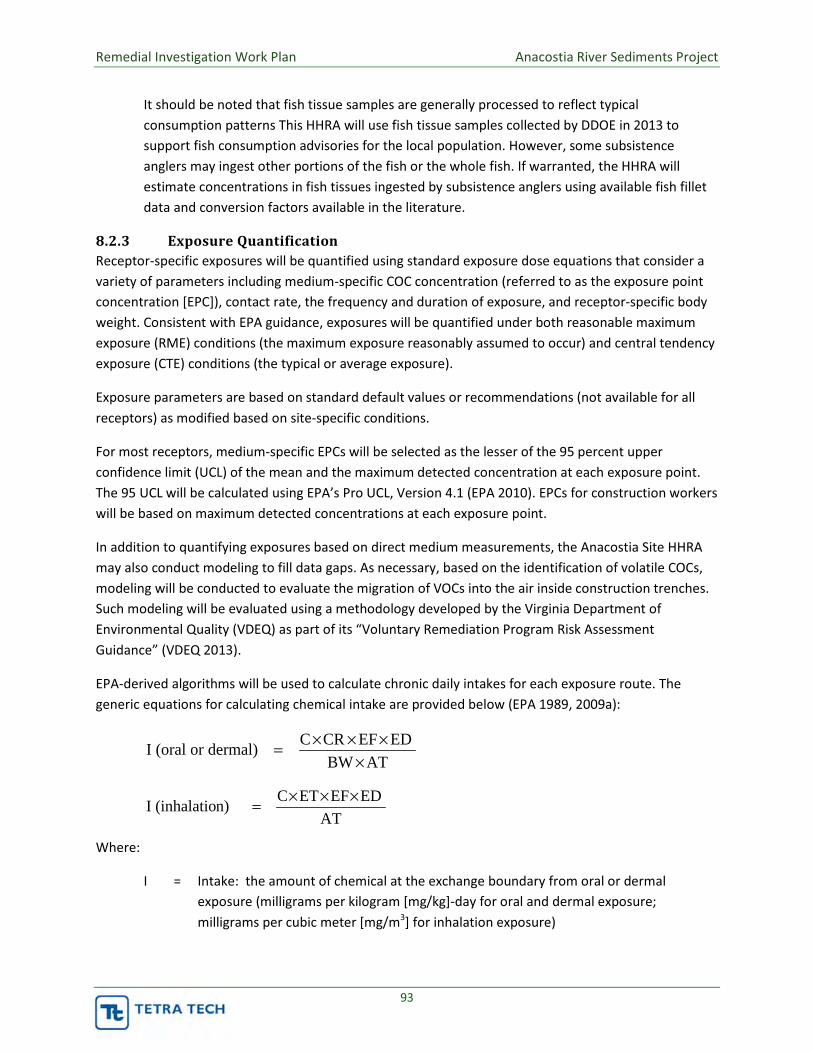
Remedial Investigation Work Plan Anacostia River Sediments Project
93
It should be noted that fish tissue samples are generally processed to reflect typical consumption patterns This HHRA will use fish tissue samples collected by DDOE in 2013 to support fish consumption advisories for the local population. However, some subsistence anglers may ingest other portions of the fish or the whole fish. If warranted, the HHRA will estimate concentrations in fish tissues ingested by subsistence anglers using available fish fillet data and conversion factors available in the literature.
8.2.3 Exposure Quantification Receptor-specific exposures will be quantified using standard exposure dose equations that consider a variety of parameters including medium-specific COC concentration (referred to as the exposure point concentration [EPC]), contact rate, the frequency and duration of exposure, and receptor-specific body weight. Consistent with EPA guidance, exposures will be quantified under both reasonable maximum exposure (RME) conditions (the maximum exposure reasonably assumed to occur) and central tendency exposure (CTE) conditions (the typical or average exposure).
Exposure parameters are based on standard default values or recommendations (not available for all receptors) as modified based on site-specific conditions.
For most receptors, medium-specific EPCs will be selected as the lesser of the 95 percent upper confidence limit (UCL) of the mean and the maximum detected concentration at each exposure point. The 95 UCL will be calculated using EPA’s Pro UCL, Version 4.1 (EPA 2010). EPCs for construction workers will be based on maximum detected concentrations at each exposure point.
In addition to quantifying exposures based on direct medium measurements, the Anacostia Site HHRA may also conduct modeling to fill data gaps. As necessary, based on the identification of volatile COCs, modeling will be conducted to evaluate the migration of VOCs into the air inside construction trenches. Such modeling will be evaluated using a methodology developed by the Virginia Department of Environmental Quality (VDEQ) as part of its “Voluntary Remediation Program Risk Assessment Guidance” (VDEQ 2013).
EPA-derived algorithms will be used to calculate chronic daily intakes for each exposure route. The generic equations for calculating chemical intake are provided below (EPA 1989, 2009a):
ATBWEDEFCRCdermal)or(oralI
××××=
ATEDEFETCn)(inhalatioI ×××=
Where:
I = Intake: the amount of chemical at the exchange boundary from oral or dermal exposure (milligrams per kilogram [mg/kg]-day for oral and dermal exposure; milligrams per cubic meter [mg/m3] for inhalation exposure)

Remedial Investigation Work Plan Anacostia River Sediments Project
94
C = Chemical concentration within the exposure medium: the EPC (for example, mg/kg for soil)
CR = Contact rate: the amount of contaminated medium contacted orally or dermally per unit of time or event; may be the ingestion rate or dermal contact rate (for example, milligrams per day [mg/day] for the ingestion rate of soil). The contact rate is not applicable to inhalation exposures.
ET = Exposure time: number of hours of exposure (hours per day [hr/day]); exposure time is applicable only to inhalation exposures.
EF = Exposure frequency: how often the exposure occurs (days per year)
ED = Exposure duration: the number of years a receptor comes in contact with the contaminated medium (years)
BW = Body weight: the average body weight of the receptor over the exposure period (kilograms); applicable only to oral and dermal exposures
AT = Averaging time: the period over which exposure is averaged (days for oral and dermal exposures; hours for inhalation exposures).
For carcinogens, the averaging time is 25,550 days (oral and dermal exposures) and 613,200 hours (inhalation exposures) on the basis of a lifetime exposure of 70 years, which represents the average life expectancy.
For noncarcinogens, the averaging time is the exposure duration expressed in days (ED x 365 days/year) for oral and dermal exposures and in hours (ED x 365 days/year x 24 hr/day) for inhalation exposures.
Pathway-specific variations of the generic equations above will be used to calculate intakes of COCs. The proposed receptor-specific exposure parameters used in variations of these equations will be presented in tabular format.
Also, EPA guidance regarding evaluation of risk from early-life exposure to carcinogens recommends a different approach to estimating chemical intake for carcinogenic chemicals with a mutagenic mode of action (EPA 2005). This guidance will be incorporated and used to modify the above equations consistent with EPA’s RSL User’s Guide (EPA 2013c).
8.3 Toxicity Assessment The toxicity assessment identifies the toxicity factors that will be used to quantify potential adverse effects (including both carcinogenic and noncarcinogenic effects) on human health associated with potential exposure to site-specific COCs. COC-specific toxicity factors will be identified from EPA’s RSL tables (EPA 2013b), which list toxicity values selected in accordance with EPA’s revised recommended toxicity value hierarchy (EPA 2003), summarized below.

Remedial Investigation Work Plan Anacostia River Sediments Project
95
� Tier 1 – EPA’s Integrated Risk Information System (IRIS) (EPA 2013e) � Tier 2 – EPA’s provisional peer-reviewed toxicity values (PPRTV) � Tier 3 – Other EPA and non-EPA sources of toxicity information, including, but not limited to, (1)
the California Environmental Protection Agency (CalEPA) toxicity values, (2) the Agency for Toxic Substances and Disease Registry (ATSDR) minimal risk levels (MRL), and EPA’s Health Effects Assessment Summary Tables (HEAST).
Chronic noncarcinogenic toxicity factors will be used for all receptors, with one exception. Because construction workers typically are expected to be exposed at a single site for a period of time less than 7 years (often 1 year or less), subchronic toxicity factors will be used for construction workers.
8.4 Risk Characterization Risk characterization combines the exposure estimates calculated in the exposure assessment with the toxicity factors identified in the toxicity assessment to calculate COC-, exposure pathway-, and receptor-specific carcinogenic risks (risks) and noncarcinogenic hazards (hazards). Risks and hazards will be calculated following standardized methods described in EPA’s RAGS (EPA 1989) and summarized below.
8.4.1 Characterization of Cancer Risk Risks associated with exposure to chemicals classified as carcinogens are estimated as the incremental probability that an individual will develop cancer over a lifetime as a direct result of an exposure (EPA 1989). The estimated risk is expressed as a unitless probability.
Three steps are used in estimating cancer risks for chemicals classified as carcinogens. First, the chemical intake is multiplied by the chemical-specific slope factor (SF) (oral and dermal exposure) or the chemical-specific inhalation unit risk (IUR) (inhalation exposure) to derive a cancer risk estimate for a single chemical and pathway. The calculation is based on the following relationship:
� Chemical-Specific Cancer Risk (oral or dermal) = Intake (mg/kg-day) x SF (mg/kg-day)-1 � Chemical-Specific Cancer Risk (inhalation) = Intake (milligrams per cubic meter [mg/m3]) x
103 (micrograms [μg]/milligram [mg]) x IUR (micrograms per cubic meter [μg/m3])-1
Second, the individual chemical cancer risks are assumed additive to estimate the cancer risk associated with exposure to multiple carcinogens for a single exposure pathway, as follows:
� Pathway-Specific Cancer Risk = ��������-Specific Cancer Risk
Third, pathway-specific risks are summed to estimate the total cancer risk for each receptor.
8.4.2 Hazard The potential for exposure that may result in adverse health effects other than cancer is evaluated by comparing the intake with a reference dose (RfD) (oral and dermal exposure) and with a reference concentration (RfC) (inhalation exposure) of each chemical not classified as a carcinogen, and of each carcinogen known to cause adverse health effects other than cancer. When calculated for a single chemical, the comparison yields a ratio termed the HQ:
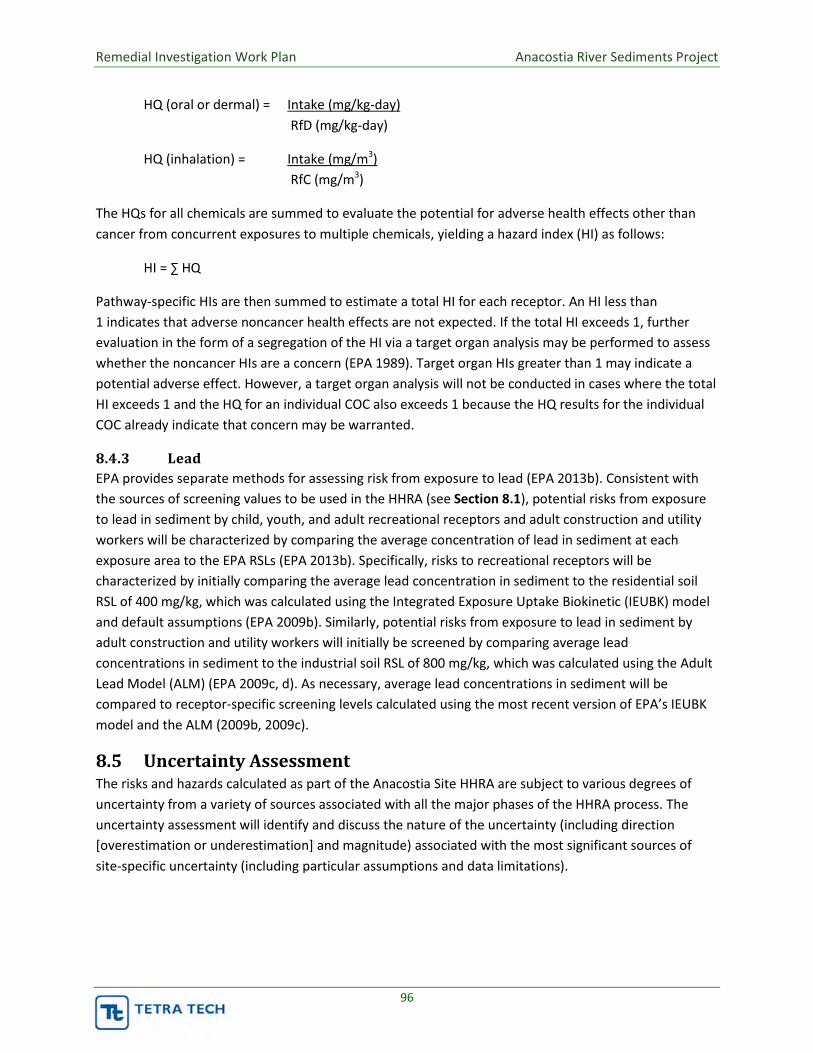
Remedial Investigation Work Plan Anacostia River Sediments Project
96
HQ (oral or dermal) = Intake (mg/kg-day) RfD (mg/kg-day)
HQ (inhalation) = Intake (mg/m3) RfC (mg/m3)
The HQs for all chemicals are summed to evaluate the potential for adverse health effects other than cancer from concurrent exposures to multiple chemicals, yielding a hazard index (HI) as follows:
���������
Pathway-specific HIs are then summed to estimate a total HI for each receptor. An HI less than 1 indicates that adverse noncancer health effects are not expected. If the total HI exceeds 1, further evaluation in the form of a segregation of the HI via a target organ analysis may be performed to assess whether the noncancer HIs are a concern (EPA 1989). Target organ HIs greater than 1 may indicate a potential adverse effect. However, a target organ analysis will not be conducted in cases where the total HI exceeds 1 and the HQ for an individual COC also exceeds 1 because the HQ results for the individual COC already indicate that concern may be warranted.
8.4.3 Lead EPA provides separate methods for assessing risk from exposure to lead (EPA 2013b). Consistent with the sources of screening values to be used in the HHRA (see Section 8.1), potential risks from exposure to lead in sediment by child, youth, and adult recreational receptors and adult construction and utility workers will be characterized by comparing the average concentration of lead in sediment at each exposure area to the EPA RSLs (EPA 2013b). Specifically, risks to recreational receptors will be characterized by initially comparing the average lead concentration in sediment to the residential soil RSL of 400 mg/kg, which was calculated using the Integrated Exposure Uptake Biokinetic (IEUBK) model and default assumptions (EPA 2009b). Similarly, potential risks from exposure to lead in sediment by adult construction and utility workers will initially be screened by comparing average lead concentrations in sediment to the industrial soil RSL of 800 mg/kg, which was calculated using the Adult Lead Model (ALM) (EPA 2009c, d). As necessary, average lead concentrations in sediment will be compared to receptor-specific screening levels calculated using the most recent version of EPA’s IEUBK model and the ALM (2009b, 2009c).
8.5 Uncertainty Assessment The risks and hazards calculated as part of the Anacostia Site HHRA are subject to various degrees of uncertainty from a variety of sources associated with all the major phases of the HHRA process. The uncertainty assessment will identify and discuss the nature of the uncertainty (including direction [overestimation or underestimation] and magnitude) associated with the most significant sources of site-specific uncertainty (including particular assumptions and data limitations).
Remedial Investigation Work Plan Anacostia River Sediments Project
97
9.0 NATURAL RESOURCE DAMAGE ASSESSMENT PROCESS
This section provides a brief summary of the NRDA process and how, for the Anacostia contaminated sediment project, the NRDA process relates to the Remedial Investigation (RI). The NRDA process is separate from remediation and clean-up activities. The goal of NRDA is to make the public “whole” for injuries to, or the loss of, natural resources and associated services provided by those resources.
The NRDA process is determined by the type of discharge or release to the environment. If natural resources are injured by a discharge or a release of a mixture of oil and hazardous substances, DOI regulations are used. If damages are from discharges or oil, NOAA regulations are used for the assessment.
Section 301(c) of the CERCLA requires the promulgation of regulations for the assessment of damages for injury to, destruction of, or loss of natural resources resulting from a discharge of oil or release of a hazardous substance. The responsibility for this rulemaking was delegated to the DOI by Executive Order 12580 (January 23, 1987).
CERCLA and Oil Pollution Act (OPA) authorize the United States, States (including the District of Columbia) and Indian Tribes to act on behalf of the public as Natural Resource Trustees for natural resources under their respective trusteeship (CERCLA 107(f)(1) and OPA 1006(c)). Regulations require the Trustees to coordinate the assessment effort, with the lead response agency where response activity is planned or underway at a particular site (40 CFR 11.23(f)). Where there are multiple Trustees, 40 CFR 615(a) provides for those Trustees to cooperate and coordinate their activities. This may include the formation of a Trustee Council and the designation of a lead administrative Trustee for the site, which will facilitate communication between the remedial activities and natural resource Trustees. Trustees must coordinate their activities with other Trustees, response agencies and potentially responsible parties when operations are conducted concurrently (15 CFR 990.14).
The NRDA process as called out under 43 CFR 11 and includes several components and steps:
� Pre-assessment Screening, � Assessment Plan, � Assessment Implementation phase (Type A procedures or Type B procedures), and � Post-Assessment phase.
After the Trustees have formed the Trustee Council and assigned roles where appropriate, the Pre-assessment Screen phase will involve the preliminary collection of data and the determination of the likelihood of a successful damage claim, including:
a) the finding if an injury has occurred, b) that the damage can be linked to releases, and c) that responsible parties can be identified.
Remedial Investigation Work Plan Anacostia River Sediments Project
98
The Assessment Plan will confirm that damage to resources have occurred and determine the assessment procedures to be used, either a Type A assessment (simplified) or a Type B assessment (site specific studies). Included in the Assessment Plan, phases are the methods for quantification of the injury that has occurred and the determination of the appropriate restoration action.
The Assessment Implementation phase involves the collection of data to determine and quantify the injury and to determine the damage. The Implementation phase will determine a baseline for the resources and quantify the reduction of the resources and/or services compared to the baseline from the impacts. Trustees will report results of the assessment Implementation Phase in the Post-assessment Phase. Restoration alternatives will be proposed with the identification of a preferred alternative or multiple alternatives based on several factors including, but not limited to:
� technical feasibility, � cost to benefits comparison, and � consistency with cleanup response actions conducted or planned.
Although the NRDA process is separate from remedial clean-up activities, data collected as part of the RI may be used in the NRDA assessments. To that end, NRDA considerations have been incorporated into the RI sampling plan. Data collected as part of the RI may be used in the NRDA process once the Trustees initiate the NRDA Pre-assessment Screening. As the NRDA process is initialized the Trustees will determine the NRDA plan(s) to determine, assess the damage, and develop the proposed restoration. The Trustees will also coordinate the NRDA activities with the response action and the identified responsible parties.

Remedial Investigation Work Plan Anacostia River Sediments Project
99
10.0 SCHEDULE
This section provides a summary of the schedule for the Anacostia River contaminated sediments project through the completion of the RI. Table 10.1 lists the major milestones for the project and the due dates relative to the sequence of tasks.
TABLE 10.1 Summary of Deliverables for the Anacostia River Sediments Project
Task Due Date or Duration Draft Remedial Investigation Work Plan Submitted for Public Review and Comment January 29, 2014
Draft Community Involvement Work Plan Submitted for Public Review and Comment March 7, 2014
Public Comment Period for Draft Remedial Investigation Work Plan and Community Relations Plan Completed
February 12, 2014
Final Remedial Investigation Work Plan Completed June 10, 2014
Draft Site Plans (FSP/QAPP/HASP) Submitted for Public Review and Comment No public review
Public Comment Period for Draft Site Plans (FSP/QAPP/HASP) Completed No public review
Final Site Plans (FSP/QAPP/HASP) June 11, 2014
Pre-field Start-up Public Meeting June 17, 2014
Remedial Investigation Field Work Start-up June 23, 2014*
Remedial Investigation Data Report 60 days after receipt of laboratory analyses results from the field investigation
Draft Remedial Investigation Report 90 days after approval of the RI Data Report
Final Remedial Investigation Report 45 days after receipt of comments on the Draft RI Report
* Assumes that requisite environmental permits (NPS permit outstanding as of June 6, 2014) can be obtained and project funding is in place.
Remedial Investigation Work Plan Anacostia River Sediments Project
100
11.0 REFERENCES
AECOM, 2012. Remedial Investigation and Feasibility Study Work Plan (Draft), Benning Road Facility, prepared for Pepco and Pepco Energy Services, July 2012.
Agency for Toxic Substances and Disease Registry (ATSDR). 2014. Retrieved from www.atsdr.cdc.gov
Anacostia Watershed Society, 2012. Study of Anacostia Anglers Indicates Widespread Sharing of Contaminated Fish, November 8, 2012.
Anacostia Watershed Toxics Alliance, 2009. White Paper on PCB and PAH Contaminated Sediment in the Anacostia River, Draft Final, February 23, 2009.
Anacostia Watershed Toxics Alliance and Anacostia Watershed Restoration Commission, 2002. Charting a Course Toward Restoration: A Toxic Chemical Management Strategy for the Anacostia River.
Baes, C.F., III, Sharp, R.D., Sjoreen, A.L., and Shor, R.W., 1984. A review and Analysis of Parameters for Analysis of Parameters for Assessing Transport of Environmentally Released Radionuclides through Agriculture, Oak Ridge National Laboratory, ORNL-5786, September 1984.
Bechtel-Jacobs Company, LLC, 1998. Biota Sediment Accumulation Factors for Invertebrates: Review and Recommendations for the Oak Ridge Reservation. Bechtel Jacobs Company LLC, Oak Ridge, TN.
Behm, P., Buckley, A., and Schultz, C.L., 2003. TAM/WASP Toxics Screening Level Model for the Tidal Portion of the Anacostia River – Final Report, Interstate Commission on the Potomac River Basin Report No. 03-2, prepared for District of Columbia Department of Health Environmental Health Administration Bureau of Environmental Quality Water Quality Division, April 2003.
Champ, M.A., 1979. The Distribution, Transport, and Cycling of Dissolved and Particulate Organic Carbon in the Potomac and Anacostia Rivers in Greater Washington Area Final Report, prepared for The District of Columbia Water Resources Research Center, November 1979.
CH2M Hill, 2012. No Further Response Action Planned Decision Document Site 1 – Building 168
Crawlspace, Joint Base Anacostia Bolling, Washington, DC, prepared for Naval Facilities Engineering Command Washington, January 2012.
CH2M Hill, 2011a. Operable Unit 2 Remedial Investigation Report, Washington Navy Yard, Washington, DC, prepared for the Department of the Navy Naval Facilities Engineering Command, February 2011.
CH2M Hill, 2011b. Draft Site Investigation Report – AOC 1, Joint Base Anacostia Bolling, Washington, DC, prepared for the Department of the Navy Naval Facilities Engineering Command Washington, March 2011.

Remedial Investigation Work Plan Anacostia River Sediments Project
101
CH2M Hill, 2011c. Draft Remedial Investigation Report, Site 2 Metro Fill Area and Waterfront Fill Area, Joint Base Anacostia Bolling, Washington, DC, prepared for the Department of the Navy Naval Facilities Engineering Command Washington, June 2011.
CH2M Hill, 2007. 11th Street Bridges Final Environmental Impact Statement, Volume I, prepared for District of Columbia Department of Transportation, October 2007.
Clark, L.J. and Crutchley, G., 1995. Special Sampling Investigation Washington Navy Yard and Environs, April 24-27, 1995. U.S. EPA Region III, Environmental Programs Branch, April, 1995.
Cooke, C.W., 1952. Sedimentary Deposits of Prince Georges County and the District of Columbia, Geology and Water Resources of Prince Georges County, prepared for the Maryland Department of Geology, Mines, and Water Resources, 1952.
District of Columbia Office of the Chief Technology Officer, 2013. DC Atlas Plus, July 2013. Retrieved from http://octo.dc.gov/service/atlas-plus
District of Columbia Department of Health Environmental Health Administration Bureau of Environmental Quality Water Quality Division, 2003. Total Maximum Daily Loads for Organics and Metals in the Anacostia River, Fort Chaplin Tributary, Fort Davis Tributary, Fort Dupont Creek, Fort Stanton Tributary, Hickey Run, Nash Run, Popes Branch, Texas Avenue Tributary, and Watts Branch – Final, prepared for the Government of the District of Columbia, August 2003.
District of Columbia Water Resources Research Center, 1993. Ground Water Resource Assessment Study for the District of Columbia, prepared for the Water Quality Control Branch, District of Columbia Department of Consumer and Regulatory Affairs, Environmental Regulation Administration Water Resources Management Division, October 1993.
District of Columbia Water and Sewer Authority, 2012. CSO Long Term Control Plan Tunnel Program Factsheet, March 2012.
Retrieved from www.dcwater.com/news/presskits/75years/clean_rivers_factsheet_2012.pdf
District Department of the Environment, 2012. Chesapeake Bay TMDL, Phase II Watershed Implementation Plan, March 2012.
District Department of the Environment, Underground Storage Tank Branch, 2012. Closed Leaking Underground Storage Tank (LUST) Cases – Updated August 2012. Retrieved from http://ddoe.dc.gov/service/underground-storage-tanks-ust-and-lust
District Department of the Environment, Underground Storage Tank Branch, 2012. List of Federally Regulated Open LUST Cases (Petroleum Contaminated Sites – Not Heating Oil) As of August 2012. Retrieved from http://ddoe.dc.gov/service/underground-storage-tanks-ust-and-lust
Remedial Investigation Work Plan Anacostia River Sediments Project
102
District Department of the Environment, 2010. Notice of Final Rulemaking – Triennial Review of the District of Columbia’s Water Quality Standards. Title 21 of the District of Columbia Municipal Regulations, Chapter 11, August 13, 2010.
Dolph, J.E. 2001. Industrial History of the Former Naval Receiving Station, Anacostia Park, Washington, DC, prepared for the National Oceanographic and Atmospheric Administration, December 2001.
Ecology and Environment, 2008. Final Remedial Investigation at the Kenilworth Park South Landfill N.E. Washington, D.C., prepared for National Park Service, June 2008.
Ecology and Environment, 2007a. Final Remedial Investigation at the Kenilworth Park North Landfill N.E. Washington, D.C., prepared for National Park Service, November 2007.
Ecology and Environment, Inc., 2007b. Final Problem Formulation Technical Report for the Baseline Ecological Risk Assessment Kenilworth Park North Landfill Site, N.E. Washington, D.C., prepared for National Park Service, November 2007.
Ecology and Environment, Inc., 2007c. Final Problem Formulation Technical Report for the Baseline Ecological Risk Assessment Kenilworth Park South Landfill Site, N.E. Washington, D.C., prepared for National Park Service, December 2007.
Ecology and Environment, Inc., 2006. Record of Decision National Park Service WGL East Station Site Anacostia Park National Capitol Parks-East Washington, D.C., prepared for National Park Service, August 2006.
EnviroScience, Inc., 2013. Draft Analytical Sampling Results Report: Fort Dupont Creek and the Anacostia River, Washington, DC, prepared for CSX Transportation, Inc., April 4, 2013.
Foster, G.D., Roberts, E.C., Jr., Gruessner, B., and Velinsky, D.J., 2000. Hydrogeochemistry and Transport of Organic Contaminants in an Urban Watershed of Chesapeake Bay (USA), Applied Geochemistry 2000, 15, 901-915.
Galli, J., T. Phong, A. Maynard, K. Choi, and Metropolitan Washington Council of Governments. (2010). Anacostia Watershed Environmental Baseline Conditions and Restoration Report. 72 pages.
Geosyntec Consultants, 2013a. Final Yard Office Site Assessment Report and Corrective Action Plan Benning Yard District of Columbia, prepared for CSX Transportation, April 2013.
Geosyntec Consultants, 2013b. Hydrodynamic and Fate and Transport Modeling Model Development CSX Benning Yard, prepared for CSX Transportation, February 2013.
Geosyntec Consultants, 2010. Historical Report, CSXT Benning Yard, Washington, D.C., prepared for CSX Transportation, November 2010.
Gruessner, B., Velinsky, D.J., Scudlark, J., Foster, G.D., and Mason, R., 1997 (revised April 1998). Dissolved and Particulate Transport of Chemical Contaminants in the Northeast and Northwest
Remedial Investigation Work Plan Anacostia River Sediments Project
103
Branches of the Anacostia River, Report 97-10, prepared for the Interstate Commission for the Potomac River Basin.
Hawkins, G., 2009. Anacostia River Discharge Monitoring Report: Municipal Separate Storm Sewer System NPDES Permit No. DC0000221, prepared for the Government of the District of Columbia Washington, DC, August 19, 2009.
Horne Engineering Services, Inc., 2003. Revised Draft, Site Characterization Report for Comparative Validation of Innovative “Active Capping” Technologies, Anacostia River, Washington, DC. Prepared for The Hazardous Substance Research Center, South and Southeast, Louisiana State University, December 2003.
Hydro – Terra, Inc., 1999. Additional Remedial Investigation and Feasibility Study, East Station, Washington, D.C. (Phase IV). March 1999.
Hwang, H.M., and Foster, G.D., 2008. Polychlorinated Biphenyls in Stormwater Runoff Entering the Tidal Anacostia River, Washington, DC, Through Small Urban Catchments and Combined Sewer Outfalls. Journal of Environmental Science and Health Part A, 43, 567-575.
Johnston, P.M., 1964. Geology and Ground-Water Resources of Washington, D.C., and Vicinity, prepared for United States Department of the Interior, 1964.
Katz, C.N., Carlson, A.R., and Chadwick, D.B., 2001. Draft Anacostia River Seepage and Pore Water Survey Report, prepared for the Space and Naval Warfare Systems Center, 2001.
Kelly, J., 2007. Steel Yourself for This Nugget Uncovered by Answer Man. The Washington Post. Retrieved from www.washingtonpost.com/wpdyn/content/article/2007/07/28/AR2007072801087.html
Kilian, J.V., Becker, A.J., Stranko, S.A., Ashton, M., Klauda, R.J., Gerber, J., and Hurd, M., 2010. The Status and Distribution of Maryland Crayfishes. Southeastern Naturalist, 9(Special Issue 3), 11-32.
Kim, S., Mandel, R., Nagel, A., and Schultz, C., 2007. Anacostia Sediment Models: Phase 3 Anacostia HSPF Watershed Model and Version 3 TAM/WASP Water Clarity Model, Interstate Commission on the Potomac River Basin, March 2007.
Koterba, M.T., Dieter, C.A., and Miller, C.V., 2010. Pesticides in Groundwater in the Anacostia River and Rock Creek Watersheds in Washington, D.C., 2005 and 2008, prepared in cooperation with the District Department of the Environment. U.S. Geological Survey Scientific Investigations Report 2010-5130, 90 pages.
Lampert, D.J., Lu, X., and Reible, D.D., 2013. Long-Term PAH Monitoring Results from the Anacostia River Active Capping Demonstration Using Polydimethylsiloxane (PDMS) Fibers. Environmental Science: Processes & Impacts, 15, 554-562.Logan, W.S., 1999. Estimation of Shallow

Remedial Investigation Work Plan Anacostia River Sediments Project
104
Groundwater Flux to the Anacostia River. Draft Report for District of Columbia Department of Health.
Logan, W.S., 1999. Estimation of Shallow Groundwater Flux to the Anacostia River. Draft Report for District of Columbia Department of Health.
MACTEC, 2005. Phase I Environmental Site Assessment and Contaminated Materials Management Report: Proposed South Capitol Street Bridge Realignment, Southeast, Washington, DC, prepared for District of Columbia Department of Transportation. December 7, 2005.
Mandel, R., and Schultz, C.L., 2000. The TAM/WASP Model: A Modeling Framework for the Total Maximum Daily Load Allocation in the Tidal Anacostia River, Final Report. Prepared for the Environmental Health Administration, Department of Health, Government of the District of Columbia. Prepared by the Interstate Commission on the Potomac River Basin. October, 2000.
McGee, Beth L., Pinkney, Alfred E., Velinsky, David J., Ashley, Jeffrey T.F., Fisher, Daniel J., Ferrington, Leonard C., and Norberg-King, Teresa J., 2009. Using the Sediment Quality Triad to Characterize Baseline Conditions in the Anacostia River, Washington, DC, USA. Environmental Monitoring and Assessment, 156, 51-67.
McGee, B.L., and Pinkney, A.E., 2002. Using the Sediment Quality Triad to Characterize Baseline Conditions in the Anacostia River, Washington DC Publication No. CBFO-C02-09, prepared for the Anacostia Watershed Toxics Alliance, October 2002.
Miller, C.V., Gutierrez-Magness, A.L., Feit Majedi, B.L., and Foster, G.D., 2007. Water Quality in the Upper Anacostia River, Maryland: Continuous and Discrete Monitoring with Simulations to Estimate Concentrations and Yields, 1003-05, Scientific Investigations Report 2007-5142, prepared for the United States Department of the Interior and the United States Geologic Survey, 2007.
Murphy, D.R., Pinkney, A.E., Foley, R.E., McGowan, P.C., Li, R., and Domico, L., 1998. Effects of wetland restoration using Anacostia River sediments at Kenilworth Marsh. U.S. Fish and Wildlife Service, Annapolis, MD, CBFO-C98-02.
National Capitol Parks-East, 2011. Statement of Work for Remedial Design/Remedial Action for Operable Unit 1 and Remedial Investigation/Feasibility Study for Operable Unit 2: WGL East Station Site, October 2011.
National Oceanic and Atmospheric Administration (NOAA), Office of Response and Restoration (OR&R), Coastal Protection and Restoration Division (CPRD) and AWTA, n.d. About the Anacostia River Watershed: Wildlife. Retrieved from http://mapping.orr.noaa.gov/website/test/anacostia/guide/aboutar/aboutar.html
NOAA, 1992a. Steuart Petroleum, Anacostia River, Washington, D.C. IncidentNews, January 19, 1992. Retrieved from http://incidentnews.noaa.gov/incident/6867
Remedial Investigation Work Plan Anacostia River Sediments Project
105
NOAA, 1992b. Steuart Petroleum, Incident Response Document. IncidentNews, January 21, 1992. Retrieved from http://incidentnews.noaa.gov/incident/6867/514312
NOAA, 1992c. Steuart Petroleum, Incident Response Document. IncidentNews, January 21, 1992. Retrieved from http://incidentnews.noaa.gov/incident/6867/514311
National Park Service, 2014. Kenilworth Park & Aquatic Gardens, District of Columbia. Retrieved from www.nps.gov/keaq/historyculture/people.htm
National Park Service, 2010. National Park Service Culture Resources Inventory: Kenilworth Aquatic Gardens, National Capitol Parks-East – Anacostia Park.
NAVFAC, 2012. No Action Decision Document, Closure Document for Site 3 – Athletic Fields, Joint Base Anacostia Bolling, Washington, DC, September 2012.
Opinion Works, 2012. Addressing the Risk: Understanding and Changing Anglers’ Attitudes on the Dangers of Consuming Anacostia River Fish. Retrieved from www.anacostiaws.org/userfiles/file/AWS_angling_FINAL_web.pdf
Paul, P. and Ghosh, U., 2010. Measurement of Dissolved Polychlorinated Biphenyls in Rivers Using Passive Samplers. PowerPoint presentation, Maryland Water Monitoring Council 16th Annual Conference, November 18, 2010. Retrieved from http://mddnr.chesapeakebay.net/MWMC/conf/2010/2010_ppt_Paul.pdf
Phelps, H.L., 2013. Locating Sources of Toxics in the Anacostia River Watershed (DC, MD) Using Active Biomonitoring with the Asiatic Clam Corbicula fluminea [PowerPoint Slides]. Retrieved from www.his.com/~hphelps/
Phelps, H.L., 2011. Are Anacostia River Toxics Mostly from DC or Maryland? Active Biomonitoring Research. Poster Presentation. Retrieved from www.his.com/~hphelps/download.htm
Phelps, H.L., 2008. Active Biomonitoring for PCB, PAH and Chlordane Sources in the Anacostia Watershed, final report prepared for the DC Water Resources Research Center, June 1, 2008.
Phelps, H.L., 2002. Sources of Bioavailable Toxic Pollutants in the Anacostia, final report prepared for the DC Water Resources Research Center, Washington D.C., May 30, 2002.
Phelps, H.L., 2001. Biomonitoring Anacostia River Estuary Pollutants with the Asiatic Clam (Corbicula fluminea): Possible Effects of Dredging, final technical report prepared for the District of Columbia Water Resources Research Center, December 2001.
Phelps, H.L., 2000. DC’s Contaminated Anacostia Estuary Sediments: A Biomonitoring Approach, final technical report prepared for the District of Columbia Water Resources Research Center, June 2000.

Remedial Investigation Work Plan Anacostia River Sediments Project
106
Pinkney, A.E., Harshbarger, J.C., and Rutter, M.A., 2013. Temporal and Spatial Patterns in Tumor Prevalence in Brown Bullhead (Ameiurus nebulosus) in the Tidal Potomac River Watershed. U.S. Fish and Wildlife Service, Chesapeake Bay Field Office, Annapolis, MD, CBFO-C13-02.
Pinkney, A. E., 2009. Analysis of Contaminant Concentrations in Fish Tissue Collected from the Waters of the District of Columbia Publication No. CBFO-C08-03, prepared for The District Department of the Environment Natural Resources Administration Water Quality Division, March 2009.
Pinkney, A.E., Doelling Brown, P., McGee, B.L., Johnson, K.N., and Fisher, D.J., 2003. Contaminant monitoring in the Kingman Lake restored wetland, Washington, DC. Prepared for Baltimore District Army Corps of Engineers. U.S. Fish and Wildlife Service, Chesapeake Bay Field Office, Annapolis, MD, CBFO-C03-07.
Pinkney, A.E., Harshbarger, J.C., May, E.B., and Melancon, M.J., 2002. Tumor Prevalence and Biomarkers of Exposure and Response in Brown Bullheads (Ameriurus nebulosus) from the Anacostia River, Washington D.C. and Tuckahoe River, Maryland. U.S. Fish and Wildlife Service, Chesapeake Bay Field Office, Annapolis, MD, CBFO-C02-07.
Pinkney, A. E., Dobony, C.A., and Doelling Brown, P., 2001. Analysis of Contaminant Concentrations in Fish Tissue Collected from the Waters of the District of Columbia. Final Report. U.S. Fish and Wildlife Service, Chesapeake Bay Field Office, Annapolis, MD, CBFO-C01-01b.
Pinkney, A.E., McGowan, P.C., and Fisher, D.J., 2006. Risk-based monitoring of the Kingman Lake Restored Wetland, Washington, DC. U.S. Fish and Wildlife Service, Chesapeake Bay Field Office, Annapolis, MD, CBFO-C05-02.
Prestegaard, K.L., Occhi, M.E., and Blanchet, Z., 2010. A Nested Watershed Study of Streamflow, Suspended Sediment, and Contaminant Sources in the Urbanized Coastal Plain. Goldschmidt Conference, Knoxville, Tennessee, June, 16, 2010.
Rattner, B.A., McGowan, P.C., Golden, N.H., Hatfield, J.S., Toschik, P.C., Lukei, R.F., Jr. Hale, R.C., Schmitz-Afonso, I., and Rice, C.P., 2004. Contaminant Exposure and Reproductive Success of Ospreys (Pandion haliaetus) Nesting in Chesapeake Bay Regions of Concern. Archives of Environmental Contamination and Toxicology, 47, 126-140.
Reible, D., Lampert, D., Constant, D., Mutch, R.D., Jr., and Zhu, Y., 2006. Active Capping Demonstration in the Anacostia River, Washington, D.C. Remediation, Winter 2006, 39-53.
Ridolfi Engineers, Inc., 2003a. Phase I Environment Site Assessment, Poplar Point Site (Section One), Washington, D.C., prepared for the District of Columbia and the National Oceanic and Atmospheric Administration, January 31, 2003.
Ridolfi Engineers, Inc., 2003b. Site Characterization Report, Poplar Point, Washington, D.C., prepared for the District of Columbia and the National Oceanic and Atmospheric Administration, October 2003.
Remedial Investigation Work Plan Anacostia River Sediments Project
107
Sakaris, P.C., Jesien, R.V., Pinkney, A.E., 2005. Brown Bullhead as an Indicator Species: Seasonal Movement Patterns and Home Ranges within the Anacostia River, Washington, D.C. Transactions of the American Fisheries Society, 134:5, 1262-1270.
Sample, B.E. and Arenal, C.A., 1999. Allometric Models for Interspecies Extrapolation of Wildlife Toxicity Data. Bulletin Environmental Contamination Toxicology, 62:653-663.
Sample, B.E., Opresko, D.M., and Suter, G.W., 1996. Toxicological Benchmarks for Wildlife: 1996 Revision. Prepared by the Risk Assessment Program, Health Sciences Research Division, Oak Ridge, Tennessee, June 1996.
Scatena, F.N., 1986. Recent Patterns of Sediment Accumulation in the Anacostia River. Baltimore: Department of Geography and Environmental Engineering, Johns Hopkins University.
Schlekat, C.E., McGee, B.L., Boward, D.M., Reinharz, E., Velinsky, D.J., and Wade, T.L., 1994. Tidal River Sediments in the Washington D.C. Area. III. Biological Effects Associated with Sediment Contamination. Estuaries, 17:2, 334-344, June 1994.
Schultz, C.L., 2003. Calibration of the TAM/WASP Sediment Transport Model – Final Report, Interstate Commission on the Potomac River Basin Report No. 03-01, April 2003.
Shin, A., 2000. Shell Game: Poachers Harvest a Slow-Moving Delicacy on the Anacostia River. Washington City Paper, January 7, 2000. Retrieved from www.washingtoncitypaper.com/articles/18768/shell-game
Syracuse Research Corporation and the National Oceanic and Atmospheric Administration, 2000. Interpretive Summary of Existing Data Relevant to Potential Contaminants of Concern within the Anacostia River Watershed, prepared for GEO-CENTERS, Inc., June 2000.
Tetra Tech, 2014. Field Sampling Plan for Remedial Investigation, Remedial Investigation Anacostia River Sediment Project, Washington, DC, submitted to the District Department of the Environment, May 2014.
Tetra Tech, 2013a. Draft Community Involvement Plan for the Anacostia River Study Area: District Department of the Environment, Government of the District of Columbia, submitted to the District Department of the Environment, June 2013.
Tetra Tech, 2013b. Draft Review of the CSX Transportation, Inc. Benning Yard Sediment Investigation Report, Chemical Fingerprinting Report, and Hydrodynamic Modeling Report, prepared for the District of Columbia Department of the Environment, June 2013.
Tetra Tech, 2013c. Sampling and Analysis Plan, District of Columbia Toxic TMDL Sampling, Contract EP-R8-12-04, Task Order 03, prepared for U.S. Environmental Protection Agency Region 3, July 2013.

Remedial Investigation Work Plan Anacostia River Sediments Project
108
The Johnson Company, Inc., 2012. Feasibility Study Report: Kenilworth Park Landfill Northeast, Washington, D.C., prepared for The National Park Service, April 2012.
The Washington Times, 1907. Suburbs Being Purchased in Vicinity of Capital for Factories of Future. Suburban Real Estate Section, May 12, 1907. Retrieved from http://chroniclingamerica.loc.gov/lccn/sn84026749/1907-05-12/ed-1/seq-44/
U.S. Army Center for Health Promotion and Preventive Medicine, 2004. Development of Terrestrial Exposure and Bioaccumulation Information for the Army Risk Assessment Modeling System (ARAMS). Aberdeen Proving Ground, Maryland, U.S. Army Center for Health Promotion and Preventive Medicine, 591 pages.
U.S. Army Corps of Engineers, 2011. Capital Engineers, the U.S. Army Corps of Engineers in the Development of Washington, D.C., 1790 – 2004. Office of History, Headquarters, U.S. Army Corps of Engineers, Alexandria, VA, EP 870-1-67.
U.S. Army Corps of Engineers, 1993. Innovative Dredged Material Disposal Strategies for the Anacostia River, USACE Baltimore District, Baltimore, MD.
U.S. Fish and Wildlife Service Chesapeake Bay Field Office, 2013. Tumors in Brown Bullhead Catfish in the Anacostia and Potomac Rivers: Survey Results 2009-2011, April 2013.
United States Environmental Protection Agency (U.S. EPA), 2013a. Code of Federal Regulations. Title 40, Part 131, Water Quality Standards.
U.S. EPA, 2013b. Regional Screening Level Fish Ingestion Table (TR=1E-6, HQ=1) May 2013. Retrieved from www.epa.gov/reg3hwmd/risk/human/index.htm
U.S. EPA, 2013c. User’s Guide for Regional Screening Levels (May 2013). Retrieved from www.epa.gov/reg3hwmd/risk/human/rb-concentration_table/usersguide.htm
U.S. EPA, 2013d. Regional Screening Level Fish Ingestion Table (May 2013). Retrieved from www.epa.gov/reg3hwmd/risk/human/pdf/MAY_2013_FISH_THQ1.pdf
U.S. EPA, 2013e. Integrated Risk Information System. Retrieved from www.epa.gov/iris
U.S. EPA, 2013f. Sampling and Analysis Plan, District of Columbia Toxic TMDL Sampling, Contract EP-R8-12-04, Task Order 03, prepared for U.S. Environmental Protection Agency Region 3, July 2013.
U.S. EPA, 2012. Drinking Water Contaminants: List of Contaminants and Their Maximum Contaminant Levels.
U.S. EPA, 2011. Exposure Factors Handbook: 2011 Edition, EPA 600-R-90-052F, September 2011.
U.S. EPA, 2010. ProUCL Version 4.1 User Guide, Draft, EPA 600-R-07-041, May 2010.

Remedial Investigation Work Plan Anacostia River Sediments Project
109
U.S. EPA, 2009a. Risk Assessment Guidance for Superfund, Volume I: Human Health Evaluation Manual (Part F), Supplemental Guidance for Inhalation Risk Assessment, EPA 540-R-070-002, January 2009.
U.S. EPA, 2009b. Overview of Changes from Integrated Exposure Update Biokinetic Model (IEUBM) Version 1 Build 264 to IEUBKwin version 1.1, June 2009.
U.S. EPA, 2009c. Update of the Adult Lead Methodology’s Default Baseline Blood Lead Concentration and Geometric Standard Deviation Parameter, June 2009.
U.S. EPA, 2006a. EPA Region III BTAG Freshwater Screening Bencmarks, July 2006. Retrieved from www.epa.gov/reg3hscd/risk/eco/btag/sbv/fw/screenbench.htm#download
U.S. EPA, 2006b. EPA Region III BTAG Freshwater Sediment Screening Benchmarks, August 2006. Retrieved from www.epa.gov/reg3hscd/risk/eco/btag/sbv/fwsed/screenbench.htm#download
U.S. EPA, 2005. Supplemental Guidance for Assessing Susceptibility from Early-Life Exposure to Carcinogens, EPA 630-R-03-003F, March 2005.
U.S. EPA, 2004. Risk Assessment Guidance for Superfund Volume I: Human Health Evaluation Manual (Part E), Supplemental Guidance for Dermal Risk Assessment, Final, EPA 540-R-99-005, July 2004.
U.S. EPA, 2003. Human Health Toxicity Values in Superfund Risk Assessments, Publication Number 9285.7-53, December 2003.
U.S. EPA, 2002a. Calculating Upper Confidence Limits for Exposure Point Concentrations at Hazardous Waste Sites, Publication Number 9285.6-10, December 2002.
U.S. EPA, 2002b. Guidance for Developing Quality Systems for Environmental Programs, Final, EPA QA/G-1, November 2002.
U.S. EPA, 2002c. Policy Considerations for the Application of Background Data in Risk Assessment and Remedy Selection, Role of Background in the CERCLA Cleanup Process. OSWER. OSWER 9285.6-07P. April 26, 2002.
U.S. EPA, 2001. Risk Assessment Guidance for Superfund, Volume 1 – Human Health Evaluation Manual (Part D), Standardized Planning, Reporting, and Review of Superfund Risk Assessments, Final, Publication Number 9285.7-47, December 2001.
U.S. EPA, 2000. Guidance for Assessing Chemical Contaminant Data for Use in Fish Advisories, Office of Water, Volume 1: Fish Sampling and Analysis, Third Edition, 485 pages.
U.S. EPA, 1999. EPA Superfund Record of Decision: WGL Site, EPA ID: DCD077797793, EPA ROD-R03-99-159, prepared for EPA, Region III, September 3, 1999.
Remedial Investigation Work Plan Anacostia River Sediments Project
110
U.S. EPA, 1999. Data collection for the hazardous waste identification rule; Section 12. Ecological Exposure Factors. Washington, DC 20460, U.S. Environmental Protection Agency Office of Solid Waste, 48 pages.
U.S. EPA, 1998. Guidance for Conducting Fish and Wildlife Consumption Surveys. Office of Water. EPA 823-B-98-007. November 1998.
U.S. EPA, 1997a. Ecological Risk Assessment Guidance for Superfund: Process for Designing and Conducting Ecological Risk Assessments, Interim Final, prepared by Office of Solid Waste and Emergency Response (OSWER), EPA 540-R-97-006.
U.S. EPA, 1997b. Exposure Factors Handbook Volumes I through III, EPA 600-P-95-002Fa, -Fb, and –Fc, August 1997.
U.S. EPA, 1997c. Guidance for Assessing Chemical Contaminant Data for Use in Fish Advisories, Volume II: Risk Assessment and Fish Consumption Limits, Second Edition, prepared by Office of Water, EPA 823-B-97-009. July 1997.
U.S. EPA, 1993. Wildlife exposure factors handbook, Volume I and II, prepared by Office of Research and Development and OSWER, EPA 600-R-93-187b.
U.S. EPA, 1992a. Guidance for Data Usability in Risk Assessment (Part A) Final, Publication Number 9285.7-09A, April 1992.
U.S. EPA, 1992b. Guidance for Performing Tests on Dredged Material Proposed for Ocean Disposal or the Regional Testing Manual, prepared by EPA Region 2 and United States Army Core of Engineers-New York Division, 1992.
U.S. EPA, 1991. Risk Assessment Guidance for Superfund, Volume 1: Human Health Evaluation Manual, Supplemental Guidance: Standard Default Exposure Factors, Interim Final, EPA 540-R-92-003, March 1991.
U.S. EPA, 1989. Risk Assessment Guidance for Superfund, Volume 1: Human Health Evaluation Manual (Part A), Interim Final, EPA 540-1-89-002, December 1989.
U.S. EPA, 1988. Guidance for Conducting Remedial Investigations and Feasibility Studies Under CERCLA, Interim Final, EPA 540-G-89-004, October 1988.
U.S. Geological Survey, n.d. Entire Contaminant Hazard Reviews. Patuxent Wildlife Research Center. Retrieved from www.pwrc.usgs.gov/eisler/reviews.cfm
U.S. Geological Survey, 2009. Anacostia River Fringe Wetlands Restoration Project Final Report Five Year Monitoring Program (2003 through 2007). January 2009.
URS Group, Inc., 2000. Near Shore River Sediment Sampling, Southeast Federal Center, Washington, D.C., Special Study Numbers SP-15 and SP-15 Modification No. 1, December 2000.
Remedial Investigation Work Plan Anacostia River Sediments Project
111
Velinsky, D.J., Riedel, G.F., Ashley, J.T.F., and Cornwell, J.C., 2011. Historical Contamination of the Anacostia River, Washington, DC. Environmental Monitoring Assessment, 183, 307-328.
Velinsky, D.J., and Ashley, J., 2001. Sediment Transport: Additional chemical Analysis Study, Phase II, Final Report No. 01-30, Patrick Center for Environmental Research, The Academy of Natural Sciences, December 20, 2001.
Velinsky, D.J., Riedel, G.F., and Foster, G., 1999. Effect of Stormwater Runoff on the Water Quality of the Tidal Anacostia River, America’s Archetypical Urban River. Society of Environmental Toxicology and Chemistry, 20th Annual Meeting, November, 1999.
Virginia Department of Environmental Quality, 2013. Voluntary Remediation Program – Risk Assessment Guidance. Retrieved from www.deq.virginia.gov/Programs/LandProtectionRevitalization/RemediationProgram/VoluntaryRemediationProgram/VRPRiskAssessmentGuidance/Guidance.aspx
Warner, A., Shepp, D.L., Corish, K., and Galli, J., 1997. An Existing Source Assessment of Pollutants to the Anacostia Watershed, prepared by the Metropolitan Washington Council of Governments, Washington, DC, 1997

Remedial Investigation Work Plan Anacostia River Sediments Project
APPENDIX A
DECEMBER 9, 2013 ANACOSTIA RIVER BATHYMETRIC SURVEY 2013,
TECHNICAL MEMORANDUM

Anacostia River
Bathymetric Survey 2013
Technical Memorandum
�
December 9, 2013
Prepared by:
19803 North Creek Parkway Bothell, WA 98011
425-482-7600

Anacostia River Bathymetric Survey 2013 Table of Contents
District Department of the Environment Page ii
Table of Contents
1.0� Overview .......................................................................................................................... 1-1�
2.0� System Setup .................................................................................................................. 2-1�
2.1� Vessel Offsets ........................................................................................................ 2-3�
2.2� Geodesy Settings ................................................................................................... 2-4�
2.3� GPS Control and Validation ................................................................................... 2-5�
2.4� Survey Procedures ................................................................................................. 2-5�
2.5� Multibeam Calibration — Patch Test Results ......................................................... 2-5�
2.6� Daily Quality Control Procedures ........................................................................... 2-6�
2.7� Sound Speed Casts ............................................................................................... 2-6�
3.0� Bathymetry Results ........................................................................................................ 3-1�
3.1� Bathymetry Repeatability/Accuracy ........................................................................ 3-1�
4.0� Data Collection Challenges ........................................................................................... 4-1�
4.1� Government Shutdown ........................................................................................... 4-1�
4.2� Water Level Observations ...................................................................................... 4-1�
�
List of Appendices
Appendix A – Anacostia River Bathymetry
Appendix B – Published Control Monuments
Appendix C – Positioning QC Check Results
Appendix D – Daily Bar Check and Water Level Quality Control
Appendix E – Surface Comparison Statistics
Appendix F – Electronic Deliverables (submitted electronically)
�
�

Anacostia River Bathymetric Survey 2013 Table of Contents
District Department of the Environment Page iii
List of Figures
Figure 1.� Survey Area ........................................................................................................ 1-2�
Figure 2.� RESON SeaBat 7125 Multibeam Survey Vessel – R/V Ugle Duckling .............................................................................................................. 2-1�
Figure 3.� Side mount pole with Lieca RTK GPS, PHINS motion reference unit and MBE below the waterline ...................................................................... 2-1�
Figure 4.� Ross Smart Single Beam Sweep Survey Vessel – R/V MIJITT ......................... 2-2�
Figure 5.� Single Beam Survey Vessel – R/V MIJITT ......................................................... 2-2�
Figure 6.� CSX RR Bridge operations sign ......................................................................... 4-1�
Figure 7.� Low tide conditions above the Bladensburg Marina (a good deal of this area was surveyed at high tide) ................................................................... 4-2�
Figure 8.� NOAA Tidal Station 8594900 records from 09/20/13 to 10/31/13 ...................... 4-3�
List of Tables
Table 1.� Survey Team ...................................................................................................... 1-1�
Table 2.� Survey Equipment .............................................................................................. 2-3�
Table 3.� R/V Ugle Duckling Sensor Offsets (meters) ....................................................... 2-3�
Table 4.� R/V MIJITT Sweep Sensor Offsets (meters) ...................................................... 2-4�
Table 5.� R/V MIJITT SBE Sensor Offsets (in meters) ...................................................... 2-4�
Table 6.� Survey Geodesy Settings ................................................................................... 2-4�
Table 7.� Multibeam Patch Test Results ............................................................................ 2-5�
Table 8.� IVS Cross-Check Anaylsis Data Printout ............................................................ 3-1�
Anacostia River Bathymetric Survey 2013 Acronyms and Abbreviations
District Department of the Environment Page iv
Acronyms and Abbreviations
����� ������� �����������������������
����� ������������������������������������
���� ��������������������������� �
�� �� ��������������!��� ���������������
� �� ���!��� ���������������
�" �� ��������� ��"���������� ����������������
#$%� ���!������ ��������
#�&� �������������������
'��()� '��� ��������������*+()�
'�,�((� '��� ���������,������������*+((�
-�� .��������������
-�� .�������������
�/,� ������� �,������
��0� ����1����2�������
�$%� ������!������ ��������
&���%� &��������������������������%��������
&�#� &�������������������#�������������������������
,�3� ,�����������������3���
4��(5� 4��������������������*+(5�
�

Anacostia River Bathymetric Survey 2013 Overview
District Department of the Environment Page 1-1
1.0 Overview
��������� ��"��6�7��������� 8������������ � 1������������!������ ��������7#$%8�����1� �������9���������������!������ ��������7�$%8�!�� ������������������ ������������������������ ��%������������������!�����������!���:;*)6��� ������������9�������������������!�� ���������� ���������������������� ���������������� �� ������������������������� �����������9����!���� ������� �������������������������� ��$������!���4���������� ��2�7���������3����*8��������������������������������������������������������������������7� ��������� �����������������������<��86����!���*������� ����������������� ������������ �������6�
Table 1. Survey Team
Name Project Role
Robert Feldpausch Project Manager / Principal Hydrographer
Kyle Enright Project Field Lead / Hydrographer
Burton Bridge ASCM Hydrographer / Programmer
Michael Reed Hydrographer
Lou Schwartz Survey Vessel Captain
Onthonio Whyte Survey Vessel Captain
�
�

Anacostia River Bathymetric Survey 2013 Overview
District Department of the Environment Page 1-2
�Figure 1. Survey Area

Anacostia River Bathymetric Survey 2013 System Setup
District Department of the Environment Page 2-1
2.0 System Setup
��������� ����������� ���)51�������9�������7� ��������� �,������=�/,>�&������2���8�9� ���#$%��������7���������3����:�����3����)8��������� ��������������������� ������������6����������� ���������������� ���*(1�����?���!����7� ��������� �,������=�/,>�#"@"��8�9� ����1� �������9�����������������$%������������� ��� ����9���9���������� �����������7���������3����5�����3����A86��#� ����� �������������9�������� ����9�7�����<�������B�����8����!������������������9� �� ���������������6��������� ��#$%��������� �����9�� ��������������������������9��������� �������������� ���������!������������������������ ����9�9����6��
�
Figure 2. RESON SeaBat 7125 Multibeam Survey Vessel – R/V Ugle Duckling
�
Figure 3. Side mount pole with Lieca RTK GPS, PHINS motionreference unit and MBE below the waterline
�

Anacostia River Bathymetric Survey 2013 System Setup
District Department of the Environment Page 2-2
�
Figure 4. Ross Smart Single Beam Sweep Survey Vessel – R/V MIJITT
�
Figure 5. Single Beam Survey Vessel – R/V MIJITT
� ���%��'����$���#$%������� �����C��������1����2�������7��08����!��� ���������������7� �8������"D���� �"'��������� �����������������������7����8�9���������<�����������1�������������� ���������������������6�� �����������������������������������������������������������9����������������1�������������9� ��� �������������������6���
� ��#$%���������� ��������9������%��'����$���E*:A���������� �� � ��������������������������!���������������!��6��� ��5;;12�F�E*:A�����1 � 1������������!������������!�� ����������*1�������!���9�� �����������2�������;6A1�������!���9�� ������������2��������6��� �����$���E*:A�����:AB���������������������������!������������������*);1��������9�� ��������������!���������!��������������������������������!���6��� ������������������<�������� � 1��������������� ����9 ������������?������9� ��������!������������������ �������������������������������� �9������������������� ������ ���������� �������!������������� ����������������1������!?����6�
��������� ���F����������(EA1D������ ��� ����9�9������������� ������������������$%��������� ���������F����������<�7���1� �������9���8�����������6��� ������������������������� ����9�9�����

Anacostia River Bathymetric Survey 2013 System Setup
District Department of the Environment Page 2-3
��������������� ������������������� ������#$%��������9 ������������������9� �*����B���������9����������� ������������6���
��������� ������� � 1.������������������������7#�&8��� ��"D�%�� �"'��B;;;6��� ������������������ � 1������������������ �� ��������� �����������9 �������������9� �� ��C������0�� �������������������������������������������������� ����� ���������6���
� ���.��������������� ����������� �9������!���:6����������������������������������9��������� ��!�� �������������9����G ��0H/�G�4%% H��6�:;*)6�
Table 2. Survey Equipment
Sensor Type Manufacturer and Model
Multibeam Sonar Reson SeaBat 7125
Single Beam Sonar(s) Odom 3 degree 200kHz single frequency transducer
Single Beam acquisition system Ross Smart Sweep 875-X
Motion Reference Unit (MRU) IXSEA PHINS 6000
Heading IXSEA PHINS 6000
Elevation IXSEA PHINS 6000 / Leica 1230 RTK GPS
Position IXSEA PHINS 6000 / Leica 1230 RTK GPS
Sound Speed Profilers Seabird MicroCat SBE-37 and YSI CastAway CTD
�
2.1 Vessel Offsets
� ��#�&�9����������������� ������������������������� ��D��G������I��<������� ��������J�����������������������6����!���)����!���5�������!���A�� �9�� ������������������������������ ���G ��0������G�4%% � ���9��������6��� ����������������9�����������F������ �����"����������� ��"���������� �����������������E6*�7�" �8�,�����������������3���7,�38��������!������������������6����������9������������������������ ���1�������������������!����������� ����������6�
Table 3. R/V Ugle Duckling Sensor Offsets (meters)
Sensor Across (Starboard
Positive)Along
(Forward Positive) Vertical
(Down Positive)
Multibeam Sonar (SeaBat 7125) 0.20 0.24 2.53
Motion Sensor/Navigation (PHINS 6000) 0.00 0.00 0.00
GPS Tide (Leica RTK antenna) 0.21 0.00 -1.13
Redundant Position (Trimble Ag DGPS) -0.45 1.95 -2.28

Anacostia River Bathymetric Survey 2013 System Setup
District Department of the Environment Page 2-4
Table 4. R/V MIJITT Sweep Sensor Offsets (meters)
Sensor Across (Starboard
Positive)Along
(Forward Positive) Vertical
(Down Positive)
Single Beam Sonar (Odom Transducer 1) -3.81 0.32 0.97
Single Beam Sonar (Odom Transducer 2) -2.29 0.32 1.00
Single Beam Sonar (Odom Transducer 3) -0.77 0.32 0.98
Single Beam Sonar (Odom Transducer 4) 0.78 0.32 1.00
Single Beam Sonar (Odom Transducer 5) 2.30 0.32 1.01
Motion Sensor/Navigation (PHINS 6000) 0.00 0.00 0.00
Redundant Position (Trimble Ag DGPS) -0.50 0.27 -1.65
GPS Tide (Leica RTK antenna) 0.00 0.27 -1.65
Table 5. R/V MIJITT SBE Sensor Offsets (in meters)
Sensor Across (Starboard
Positive)Along
(Forward Positive) Vertical
(Down Positive)
Single Beam Sonar (Odom Transducer 1) 0.00 0.00 0.00
Redundant Position (Trimble Ag DGPS) -0.50 -0.11 -2.16
GPS Tide (Leica RTK antenna) 0.00 -0.11 -2.16
2.2 Geodesy Settings
���F������7D��G8�������������������� �����?����9����������������&�#�I����*(�'��� 6�%�������������9�������������������� ��� ��4��(5������������'��� ���������,������������*+((�7'�,�1((8������ ��'���������������������7'��8�����*:�6����!���B����������� ���������������������6�
Table 6. Survey Geodesy Settings
Parameter Setting
Datum WGS 84
Projection UTM Zone 18 North
Horizontal Datum UTM North
Vertical Datum NAVD-88
Ellipsoid WGS84
Distance Unit meters
Depth Unit meters
Geoid Model 12a

Anacostia River Bathymetric Survey 2013 System Setup
District Department of the Environment Page 2-5
2.3 GPS Control and Validation
,����������� ��F���������������9����� ��������� � 1��������� ����������9� ���0�����������6����0������������9���������������������������"������������������������ ��C���������'����������� ��������������������������������������������7����8���#������������,����6����C����*:);�� ��������������� �����������F������� ����������������9����������������� ����������������������������� ����0�� ����������6��%�� ������������������������������!�� ���!��'�������� ��&��������������������������%��������7&���%8��9����������������������������9�����������7���������������<�$������������������� ����86��������<���� �9��� ������������� ��-����������������������������� ����������������������6�
2.4 Survey Procedures
�������9������������������������� ���������������!������������������ ���������������6�����%��'����$���E*:A����!����������9������������������ �� � ��������!��������������� ��������9 ����9��������� ������������������6��"��� ����9����������� �����1� �����������1!�����9����9�����F��6��"����������������������������������������$%�9������������������!�� �����������6���
� ���������������������������������������������7��������� ������ ����8���������� ����������������������� ��� �� ��9�����������9����������������������� ���� ���������������������9����������������9� �� ��������������������������� �������6���
��0�� ��9����������� �� ��7I8�����9��������������7D�����G8��������������������� ��������9������������������������������.������������������������������������������!��� ���������������������6��� ����������0�� ������ �� �������������2��9�����K��0�����6L��4� ���0������������ ��������� ��������������� ��9��������������������������������������������������������������� ������1���������������������6��
2.5 Multibeam Calibration — Patch Test Results
��������������� ������������2��9����������������������!������������9�������������������������� �����������������!��9����� �����!������ ������������� ��#�&6��� ����������������!������������������������������ ����������� ��������9����������������!��9����� �����!��������������� �������������������������������!��� ��#�&�������������6��� ����������������!��������������������������������������������� ������������.�����6��� ��������������.��������������������1���� ���F���!��� ��C������0�� �M������������������������9������������!��9������������7������!�� 7).��
Table 7. Multibeam Patch Test Results
VesselSonarHead Latency Roll Pitch Yaw
DatesValid
R/V Ugle Duckling 1 0.00 1.6 0.0 -5.0 09/20 – 10/04

Anacostia River Bathymetric Survey 2013 System Setup
District Department of the Environment Page 2-6
2.6 Daily Quality Control Procedures
������ �������9�����������-������������9�������������N����!���� ��2������������ �������J���!�������������������������� ��������������������9������������ ��2����������������������������������������� ������6��������<���� �9��� ������������� ����-�����������6�
2.7 Sound Speed Casts
� �������������������� ��� �� ��9������������������� ��#$%J���������!�������!�� �� ������������������������������������ �����������������6��������������������� ��������������������������������������� �������������������������!�������� ��������������6��������������� ������������������������������������������������� ��� �� ��9������������������������������������������ �7���8��������������9 � ����������������������� ������������6�
�����������������9����������������������������������� ���������������������� ����� �����6��� ����������������������������������������������� �����������.���������� ���� ����������������������������6�������������������9��������������2��������� ��� ���� ������9� �����������������9��� �����������6��
�
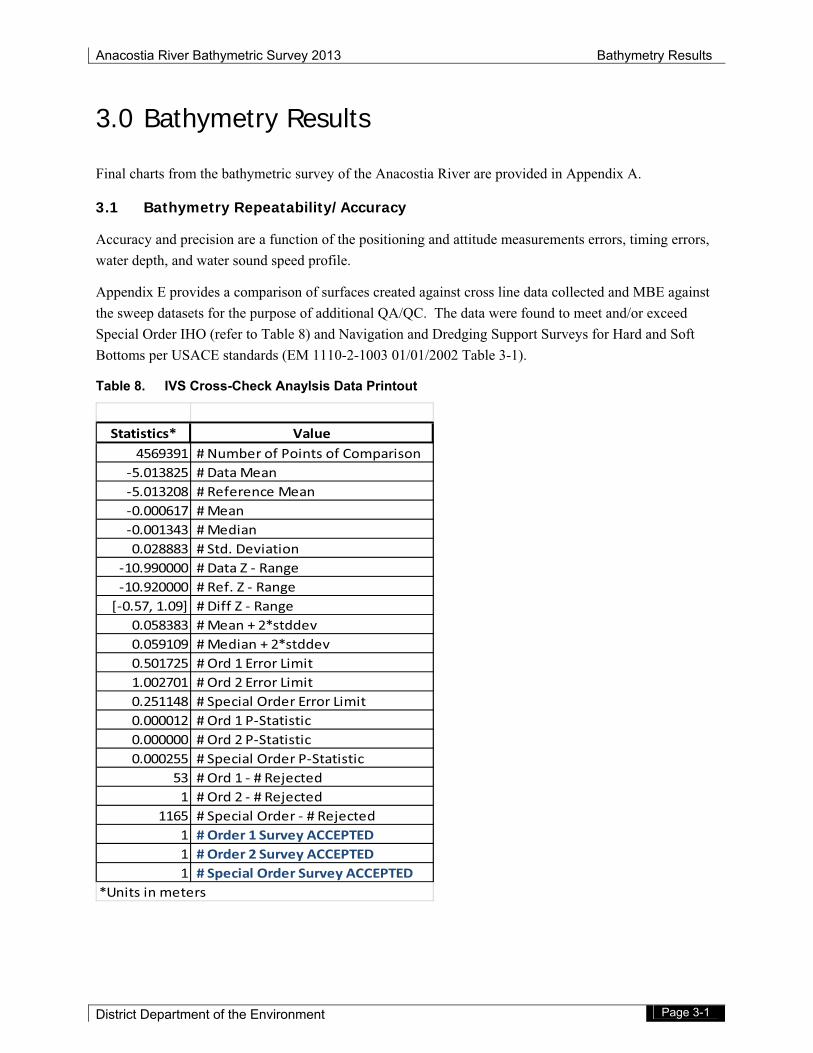
Anacostia River Bathymetric Survey 2013 Bathymetry Results
District Department of the Environment Page 3-1
3.0 Bathymetry Results
3����� ����������� ��!�� ����������������� ������������������������������������<��6�����
3.1 Bathymetry Repeatability/Accuracy
������������������������������������� �������������������������������������������������������9��������� ������9����������������������6�
������<�%����������������������������������������������������������������������������#$%��������� ���9������������������ ���������������������-�/-�6��� �������9��������������������/����<������������������"���7�����������!���(8�����'����������������������������������������������������$�����������&���%�����������7%#�***;1:1*;;)�;*/;*/:;;:���!���)1*86���
Table 8. IVS Cross-Check Anaylsis Data Printout
Statistics* Value4569391 �#�Number�of�Points�of�Comparison
�5.013825 �#�Data�Mean�5.013208 �#�Reference�Mean�0.000617 �#�Mean�0.001343 �#�Median0.028883 �#�Std.�Deviation
�10.990000 �#�Data�Z���Range�10.920000 �#�Ref.�Z���Range
[�0.57,�1.09] �#�Diff�Z���Range0.058383 �#�Mean�+�2*stddev0.059109 �#�Median�+�2*stddev0.501725 �#�Ord�1�Error�Limit1.002701 �#�Ord�2�Error�Limit0.251148 �#�Special�Order�Error�Limit0.000012 �#�Ord�1�P�Statistic0.000000 �#�Ord�2�P�Statistic0.000255 �#�Special�Order�P�Statistic
53 �#�Ord�1���#�Rejected1 �#�Ord�2���#�Rejected
1165 �#�Special�Order���#�Rejected1 �#�Order�1�Survey�ACCEPTED1 �#�Order�2�Survey�ACCEPTED1 �#�Special�Order�Survey�ACCEPTED
*Units�in�meters �

Anacostia River Bathymetric Survey 2013 Data Collection Challenges
District Department of the Environment Page 4-1
4.0 Data Collection Challenges
4.1 Government Shutdown
� ���������������������� ���9�������*;/;*/*)����*;/*B/*)������������������������������������������6��� ���������������������������9����������������������� �������������!�������� ������������!��� ��������������������6������ ��!�������� ��������!������� ������������� ���������������������!��"��������������������� ��2��$FF���� ���� ��2������$������!���4���������� ��2�������� ���������9������������������!��6��� ��������������������!�F��������� ��&������2�������������!��"������#����6�������� ��#"@"���9����������������� ����9�������������� �����������9����������������������������9����������!���2��9��������������������� �� ����D���������$����6����D�9��������!������������ ���!�����9� ��� ��5(1 �������������������� �������7���������3����B86�
�
Figure 6. CSX RR Bridge operations sign
4.2 Water Level Observations
� ��9���������������� �������9���� ���������������!��� ������7���������3����E86��� ��������� ������������� ����������� � �������9������� ������ �������������������6����������� �������������� ������� ��������!���!�������F��������������������� ���9����!������� ����9��������������!��������
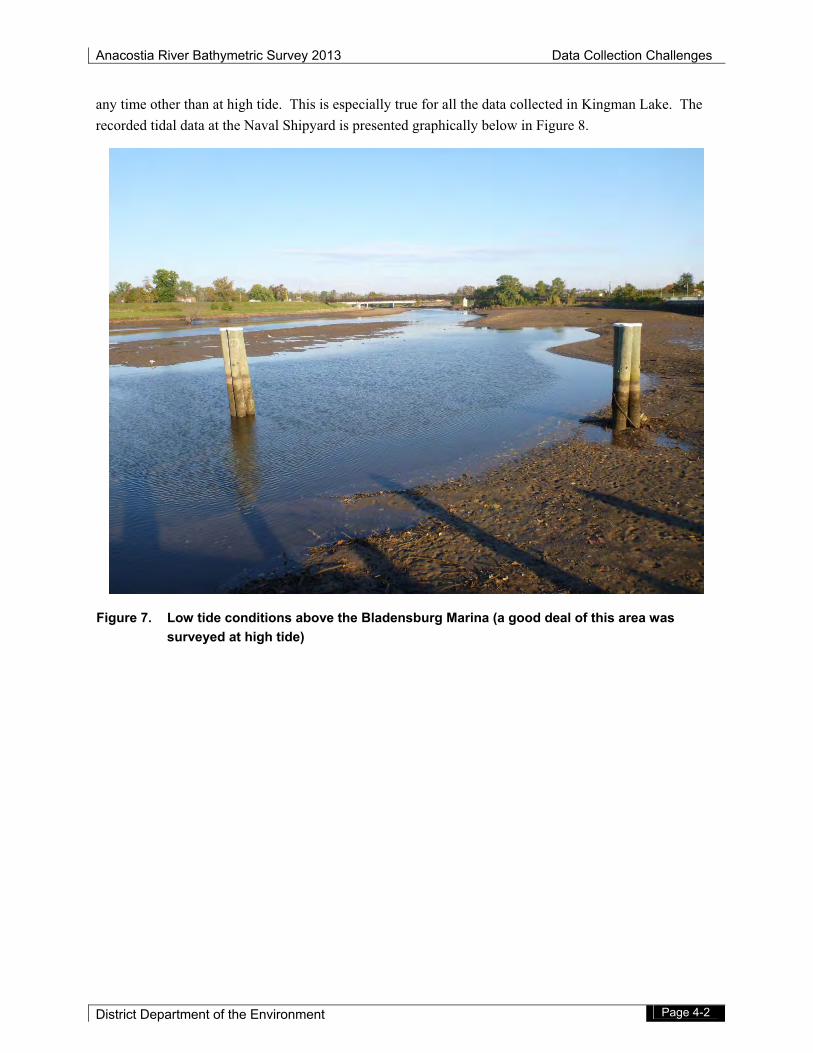
Anacostia River Bathymetric Survey 2013 Data Collection Challenges
District Department of the Environment Page 4-2
���������� ���� ������ � ����6��� ��������������������������� �������������������0������C�2�6��� ������������������������� ��'������ ���������������������� ������!���9���3����(6�
�
Figure 7. Low tide conditions above the Bladensburg Marina (a good deal of this area was surveyed at high tide)
�

Anacostia River Bathymetric Survey 2013 Data Collection Challenges
District Department of the Environment Page 4-3
�
Figure 8. NOAA Tidal Station 8594900 records from 09/20/13 to 10/31/13
�
�0.400
�0.200
0.000
0.200
0.400
0.600
0.800
1.000
1.200
1.400
1.600
09/2
0/20
13�0
0:00
09/2
1/20
13�0
5:30
09/2
2/20
13�1
1:00
09/2
3/20
13�1
6:30
09/2
4/20
13�2
2:00
09/2
6/20
13�0
3:30
09/2
7/20
13�0
9:00
09/2
8/20
13�1
4:30
09/2
9/20
13�2
0:00
10/0
1/20
13�0
1:30
10/0
1/20
13�0
7:00
10/0
2/20
13�1
2:30
10/0
3/20
13�1
8:00
10/0
4/20
13�2
3:30
10/0
6/20
13�0
5:00
10/0
7/20
13�1
0:30
10/0
8/20
13�1
6:00
10/0
9/20
13�2
1:30
10/1
1/20
13�0
3:00
10/1
2/20
13�0
8:30
10/1
3/20
13�1
4:00
10/1
4/20
13�1
9:30
10/1
6/20
13�0
1:00
10/1
7/20
13�0
6:30
10/1
8/20
13�1
2:00
10/1
9/20
13�1
7:30
10/2
0/20
13�2
3:00
10/2
2/20
13�0
4:30
10/2
3/20
13�1
0:00
10/2
4/20
13�1
5:30
10/2
5/20
13�2
1:00
10/2
7/20
13�0
2:30
10/2
8/20
13�0
8:00
10/2
9/20
13�1
3:30
10/3
0/20
13�1
9:00
Predicted�(m) Verified�(m)

Anacostia River Bathymetric Survey 2013 Appendix A
District Department of the Environment
Appendix A
Anacostia River Bathymetry 2013

Sheet 5
Sheet 3
Sheet 2 Sheet 4
Sheet 6
0 500 1,000
Meters
Notes:1. Multibeam bathymetry data collected using Hypack/Hysweep 2013.2. Multibeam bathymetry processing performed using CARIS HIPS and Sips, Hypack MBMax, IVS3D Fledermaus and Tetra Tech developed software.3. Charts and other data products developed in ArcGIS 10 and IVS3D Fledermaus.4. The bathymetry data represents conditions in the river at the time of collection. Bedforms are expected to change over time due to the varying water flows in the river.5. Bathymetric surfaces derived using a one meter CARIS uncertainty grid. This gridding method takes into account calculated position and measurement uncertainty values for individual soundings as well as sonar beam footprint.6. Horizontal and vertical control established by NOAA and USACE
See note 6.
WGS 84
UTM 18 North
Meters
Meters
Geodetic Settings Survey Equipment
Horizontal Datum
Coordinate System
Horizontal Units
Vertical Units
Vertical Control
Horizontal Control
Multibeam Sonar
Positioning System
Heading Sensor
Motion Sensor
Sound Speed Profilers
Dates Surveyed
RESON Seabat 7125
Leica 1230 RTK GPS /IXSEA PHINS 6000
IXSEA PHINS 6000
IXSEA PHINS 6000
YSI Castaway CTD/Seabird SBE 37
9/25/13 - 10/31/13
2013 Multibeam Bathymetry DataAnacostia River Survey
Tetra TechMarine Mapping Group
19803 North Creek ParkwayBothell, WA 98011
J. MacLachlan
K. Enright / M. Reed
R. FeldpauschReviewed by:
Drafted by:
Data Processing:
Data Acquisition:
K. Enright / M. Reed
NAVD88 g12aVertical Datum
See note 6.
Elevation (Meters)
0.50 to 0.010.00 to -0.49-0.50 to -0.99-1.00 to -1.49-1.5 to -1.99-2.0 to -2.49-2.50 to -2.99.-3.00 to -3.49-3.50 to -3.99-4.00 to -4.49-4.5 to -4.99-5.00 to -5.49-5.50 to -5.99-6.00 to -6.49-6.5 to -6.99-7.00 to -7.49-7.50 to -7.99-8.00 to -8.49-8.50 to -8.99-9.00 to -9.49-9.50 to -9.99-10.00 to -10.49-10.50 to -10.99-11.00 to -11.32
Path: R:\Projects_2013\Anacostia_River\maps\Anacostia_Bathy_01_Overview_of_06_20131206.mxd
Sheet:
1 of 6
Served Imagery: ESRI and Partner Providers
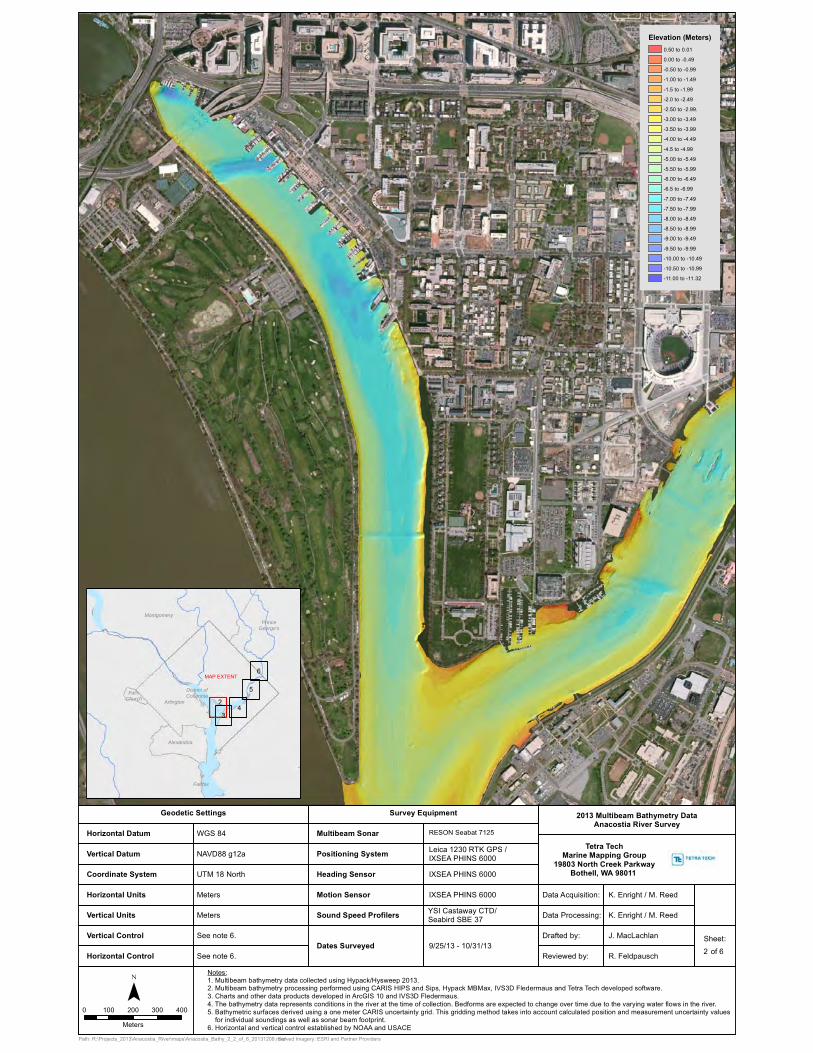
¯0 100 200 300 400
Meters
Notes:1. Multibeam bathymetry data collected using Hypack/Hysweep 2013.2. Multibeam bathymetry processing performed using CARIS HIPS and Sips, Hypack MBMax, IVS3D Fledermaus and Tetra Tech developed software.3. Charts and other data products developed in ArcGIS 10 and IVS3D Fledermaus.4. The bathymetry data represents conditions in the river at the time of collection. Bedforms are expected to change over time due to the varying water flows in the river.5. Bathymetric surfaces derived using a one meter CARIS uncertainty grid. This gridding method takes into account calculated position and measurement uncertainty values for individual soundings as well as sonar beam footprint.6. Horizontal and vertical control established by NOAA and USACE
See note 6.
WGS 84
UTM 18 North
Meters
Meters
Geodetic Settings Survey Equipment
Horizontal Datum
Coordinate System
Horizontal Units
Vertical Units
Vertical Control
Horizontal Control
Multibeam Sonar
Positioning System
Heading Sensor
Motion Sensor
Sound Speed Profilers
Dates Surveyed
RESON Seabat 7125
Leica 1230 RTK GPS /IXSEA PHINS 6000
IXSEA PHINS 6000
IXSEA PHINS 6000
YSI Castaway CTD/Seabird SBE 37
9/25/13 - 10/31/13
2013 Multibeam Bathymetry DataAnacostia River Survey
Tetra TechMarine Mapping Group
19803 North Creek ParkwayBothell, WA 98011
J. MacLachlan
K. Enright / M. Reed
R. FeldpauschReviewed by:
Drafted by:
Data Processing:
Data Acquisition:
K. Enright / M. Reed
NAVD88 g12aVertical Datum
See note 6.
Elevation (Meters)0.50 to 0.01
0.00 to -0.49
-0.50 to -0.99
-1.00 to -1.49
-1.5 to -1.99
-2.0 to -2.49
-2.50 to -2.99.
-3.00 to -3.49
-3.50 to -3.99
-4.00 to -4.49
-4.5 to -4.99
-5.00 to -5.49
-5.50 to -5.99
-6.00 to -6.49
-6.5 to -6.99
-7.00 to -7.49
-7.50 to -7.99
-8.00 to -8.49
-8.50 to -8.99
-9.00 to -9.49
-9.50 to -9.99
-10.00 to -10.49
-10.50 to -10.99
-11.00 to -11.32
Path: R:\Projects_2013\Anacostia_River\maps\Anacostia_Bathy_2_2_of_6_20131209.mxd
Sheet:
of 6
Served Imagery: ESRI and Partner Providers
District ofColumbia
Alexandria
MontgomeryPrince
George's
Fairfax
FallsChurch Arlington
34
2
5
6MAP EXTENT
2
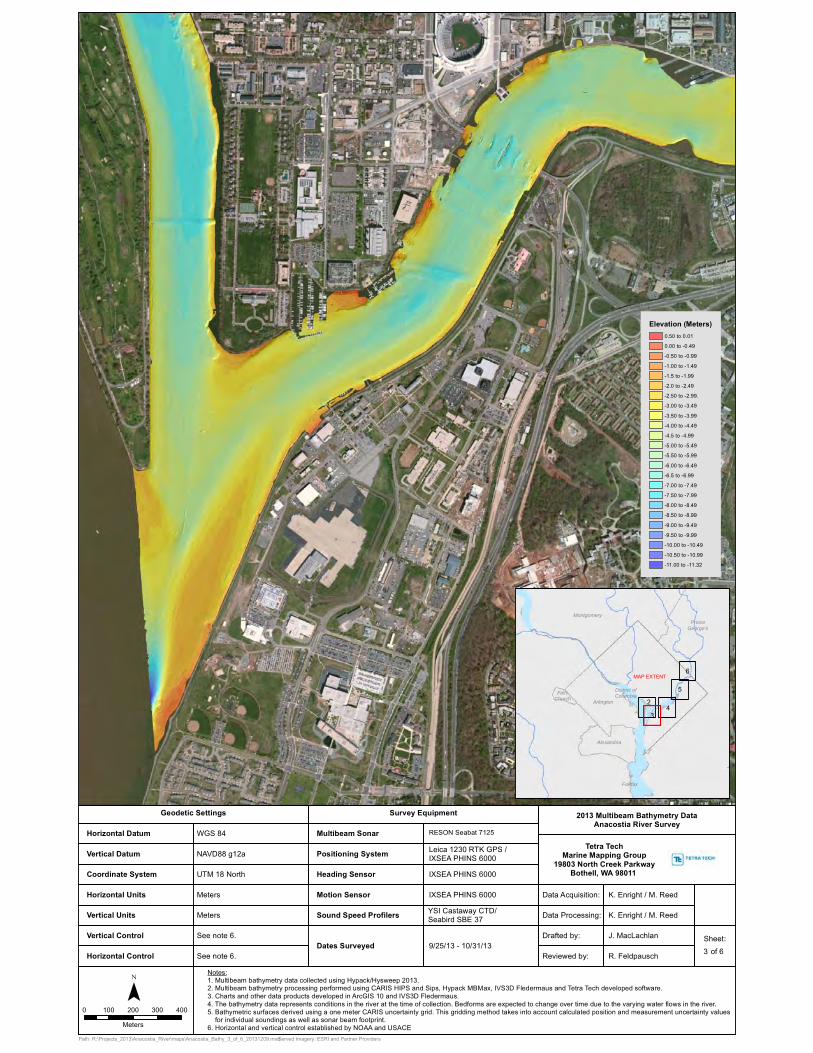
¯0 100 200 300 400
Meters
Notes:1. Multibeam bathymetry data collected using Hypack/Hysweep 2013.2. Multibeam bathymetry processing performed using CARIS HIPS and Sips, Hypack MBMax, IVS3D Fledermaus and Tetra Tech developed software.3. Charts and other data products developed in ArcGIS 10 and IVS3D Fledermaus.4. The bathymetry data represents conditions in the river at the time of collection. Bedforms are expected to change over time due to the varying water flows in the river.5. Bathymetric surfaces derived using a one meter CARIS uncertainty grid. This gridding method takes into account calculated position and measurement uncertainty values for individual soundings as well as sonar beam footprint.6. Horizontal and vertical control established by NOAA and USACE
See note 6.
WGS 84
UTM 18 North
Meters
Meters
Geodetic Settings Survey Equipment
Horizontal Datum
Coordinate System
Horizontal Units
Vertical Units
Vertical Control
Horizontal Control
Multibeam Sonar
Positioning System
Heading Sensor
Motion Sensor
Sound Speed Profilers
Dates Surveyed
RESON Seabat 7125
Leica 1230 RTK GPS /IXSEA PHINS 6000
IXSEA PHINS 6000
IXSEA PHINS 6000
YSI Castaway CTD/Seabird SBE 37
9/25/13 - 10/31/13
2013 Multibeam Bathymetry DataAnacostia River Survey
Tetra TechMarine Mapping Group
19803 North Creek ParkwayBothell, WA 98011
J. MacLachlan
K. Enright / M. Reed
R. FeldpauschReviewed by:
Drafted by:
Data Processing:
Data Acquisition:
K. Enright / M. Reed
NAVD88 g12aVertical Datum
See note 6.
Elevation (Meters)0.50 to 0.01
0.00 to -0.49
-0.50 to -0.99
-1.00 to -1.49
-1.5 to -1.99
-2.0 to -2.49
-2.50 to -2.99.
-3.00 to -3.49
-3.50 to -3.99
-4.00 to -4.49
-4.5 to -4.99
-5.00 to -5.49
-5.50 to -5.99
-6.00 to -6.49
-6.5 to -6.99
-7.00 to -7.49
-7.50 to -7.99
-8.00 to -8.49
-8.50 to -8.99
-9.00 to -9.49
-9.50 to -9.99
-10.00 to -10.49
-10.50 to -10.99
-11.00 to -11.32
Path: R:\Projects_2013\Anacostia_River\maps\Anacostia_Bathy_3_of_6_20131209.mxd
Sheet:
of 6
Served Imagery: ESRI and Partner Providers
District ofColumbia
Alexandria
MontgomeryPrince
George's
Fairfax
FallsChurch Arlington
34
2
5
6MAP EXTENT
3
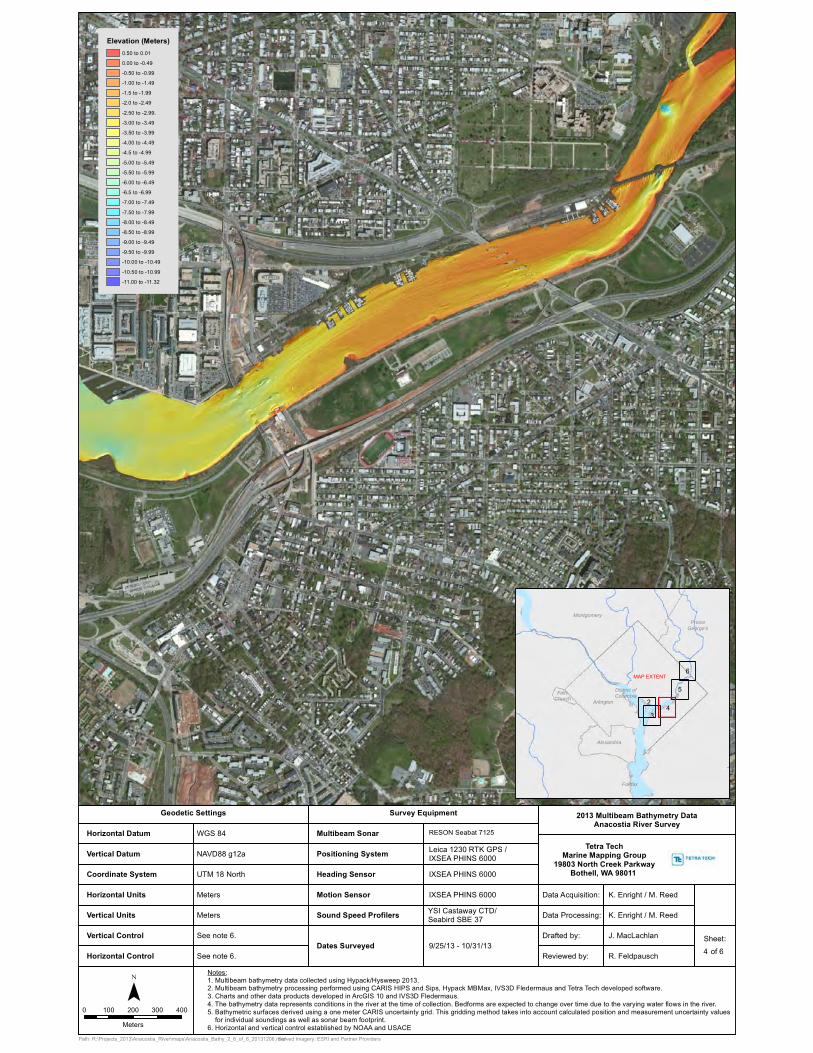
¯0 100 200 300 400
Meters
Notes:1. Multibeam bathymetry data collected using Hypack/Hysweep 2013.2. Multibeam bathymetry processing performed using CARIS HIPS and Sips, Hypack MBMax, IVS3D Fledermaus and Tetra Tech developed software.3. Charts and other data products developed in ArcGIS 10 and IVS3D Fledermaus.4. The bathymetry data represents conditions in the river at the time of collection. Bedforms are expected to change over time due to the varying water flows in the river.5. Bathymetric surfaces derived using a one meter CARIS uncertainty grid. This gridding method takes into account calculated position and measurement uncertainty values for individual soundings as well as sonar beam footprint.6. Horizontal and vertical control established by NOAA and USACE
See note 6.
WGS 84
UTM 18 North
Meters
Meters
Geodetic Settings Survey Equipment
Horizontal Datum
Coordinate System
Horizontal Units
Vertical Units
Vertical Control
Horizontal Control
Multibeam Sonar
Positioning System
Heading Sensor
Motion Sensor
Sound Speed Profilers
Dates Surveyed
RESON Seabat 7125
Leica 1230 RTK GPS /IXSEA PHINS 6000
IXSEA PHINS 6000
IXSEA PHINS 6000
YSI Castaway CTD/Seabird SBE 37
9/25/13 - 10/31/13
2013 Multibeam Bathymetry DataAnacostia River Survey
Tetra TechMarine Mapping Group
19803 North Creek ParkwayBothell, WA 98011
J. MacLachlan
K. Enright / M. Reed
R. FeldpauschReviewed by:
Drafted by:
Data Processing:
Data Acquisition:
K. Enright / M. Reed
NAVD88 g12aVertical Datum
See note 6.
Elevation (Meters)0.50 to 0.01
0.00 to -0.49
-0.50 to -0.99
-1.00 to -1.49
-1.5 to -1.99
-2.0 to -2.49
-2.50 to -2.99.
-3.00 to -3.49
-3.50 to -3.99
-4.00 to -4.49
-4.5 to -4.99
-5.00 to -5.49
-5.50 to -5.99
-6.00 to -6.49
-6.5 to -6.99
-7.00 to -7.49
-7.50 to -7.99
-8.00 to -8.49
-8.50 to -8.99
-9.00 to -9.49
-9.50 to -9.99
-10.00 to -10.49
-10.50 to -10.99
-11.00 to -11.32
Path: R:\Projects_2013\Anacostia_River\maps\Anacostia_Bathy_2_6_of_6_20131206.mxd
Sheet:
of 6
Served Imagery: ESRI and Partner Providers
District ofColumbia
Alexandria
MontgomeryPrince
George's
Fairfax
FallsChurch Arlington
34
2
5
6MAP EXTENT
4

¯0 100 200 300 400
Meters
Notes:1. Multibeam bathymetry data collected using Hypack/Hysweep 2013.2. Multibeam bathymetry processing performed using CARIS HIPS and Sips, Hypack MBMax, IVS3D Fledermaus and Tetra Tech developed software.3. Charts and other data products developed in ArcGIS 10 and IVS3D Fledermaus.4. The bathymetry data represents conditions in the river at the time of collection. Bedforms are expected to change over time due to the varying water flows in the river.5. Bathymetric surfaces derived using a one meter CARIS uncertainty grid. This gridding method takes into account calculated position and measurement uncertainty values for individual soundings as well as sonar beam footprint.6. Horizontal and vertical control established by NOAA and USACE
See note 6.
WGS 84
UTM 18 North
Meters
Meters
Geodetic Settings Survey Equipment
Horizontal Datum
Coordinate System
Horizontal Units
Vertical Units
Vertical Control
Horizontal Control
Multibeam Sonar
Positioning System
Heading Sensor
Motion Sensor
Sound Speed Profilers
Dates Surveyed
RESON Seabat 7125
Leica 1230 RTK GPS /IXSEA PHINS 6000
IXSEA PHINS 6000
IXSEA PHINS 6000
YSI Castaway CTD/Seabird SBE 37
9/25/13 - 10/31/13
2013 Multibeam Bathymetry DataAnacostia River Survey
Tetra TechMarine Mapping Group
19803 North Creek ParkwayBothell, WA 98011
J. MacLachlan
K. Enright / M. Reed
R. FeldpauschReviewed by:
Drafted by:
Data Processing:
Data Acquisition:
K. Enright / M. Reed
NAVD88 g12aVertical Datum
See note 6.
Elevation (Meters)0.50 to 0.01
0.00 to -0.49
-0.50 to -0.99
-1.00 to -1.49
-1.5 to -1.99
-2.0 to -2.49
-2.50 to -2.99.
-3.00 to -3.49
-3.50 to -3.99
-4.00 to -4.49
-4.5 to -4.99
-5.00 to -5.49
-5.50 to -5.99
-6.00 to -6.49
-6.5 to -6.99
-7.00 to -7.49
-7.50 to -7.99
-8.00 to -8.49
-8.50 to -8.99
-9.00 to -9.49
-9.50 to -9.99
-10.00 to -10.49
-10.50 to -10.99
-11.00 to -11.32
Path: R:\Projects_2013\Anacostia_River\maps\Anacostia_Bathy_2_6_of_6_20131206.mxd
Sheet:
of 6
Served Imagery: ESRI and Partner Providers
District ofColumbia
Alexandria
MontgomeryPrince
George's
Fairfax
FallsChurch Arlington
34
2
5
6MAP EXTENT
5

¯0 100 200 300 400
Meters
Notes:1. Multibeam bathymetry data collected using Hypack/Hysweep 2013.2. Multibeam bathymetry processing performed using CARIS HIPS and Sips, Hypack MBMax, IVS3D Fledermaus and Tetra Tech developed software.3. Charts and other data products developed in ArcGIS 10 and IVS3D Fledermaus.4. The bathymetry data represents conditions in the river at the time of collection. Bedforms are expected to change over time due to the varying water flows in the river.5. Bathymetric surfaces derived using a one meter CARIS uncertainty grid. This gridding method takes into account calculated position and measurement uncertainty values for individual soundings as well as sonar beam footprint.6. Horizontal and vertical control established by NOAA and USACE
See note 6.
WGS 84
UTM 18 North
Meters
Meters
Geodetic Settings Survey Equipment
Horizontal Datum
Coordinate System
Horizontal Units
Vertical Units
Vertical Control
Horizontal Control
Multibeam Sonar
Positioning System
Heading Sensor
Motion Sensor
Sound Speed Profilers
Dates Surveyed
RESON Seabat 7125
Leica 1230 RTK GPS /IXSEA PHINS 6000
IXSEA PHINS 6000
IXSEA PHINS 6000
YSI Castaway CTD/Seabird SBE 37
9/25/13 - 10/31/13
2013 Multibeam Bathymetry DataAnacostia River Survey
Tetra TechMarine Mapping Group
19803 North Creek ParkwayBothell, WA 98011
J. MacLachlan
K. Enright / M. Reed
R. FeldpauschReviewed by:
Drafted by:
Data Processing:
Data Acquisition:
K. Enright / M. Reed
NAVD88 g12aVertical Datum
See note 6.
Elevation (Meters)0.50 to 0.01
0.00 to -0.49
-0.50 to -0.99
-1.00 to -1.49
-1.5 to -1.99
-2.0 to -2.49
-2.50 to -2.99.
-3.00 to -3.49
-3.50 to -3.99
-4.00 to -4.49
-4.5 to -4.99
-5.00 to -5.49
-5.50 to -5.99
-6.00 to -6.49
-6.5 to -6.99
-7.00 to -7.49
-7.50 to -7.99
-8.00 to -8.49
-8.50 to -8.99
-9.00 to -9.49
-9.50 to -9.99
-10.00 to -10.49
-10.50 to -10.99
-11.00 to -11.32
Path: R:\Projects_2013\Anacostia_River\maps\Anacostia_Bathy_2_6_of_6_20131206.mxd
Sheet:
of 6
Served Imagery: ESRI and Partner Providers
District ofColumbia
Alexandria
MontgomeryPrince
George's
Fairfax
FallsChurch Arlington
34
2
5
6MAP EXTENT
6

Anacostia River Bathymetric Survey 2013 Appendix B
District Department of the Environment
Appendix B
Published Control Monuments


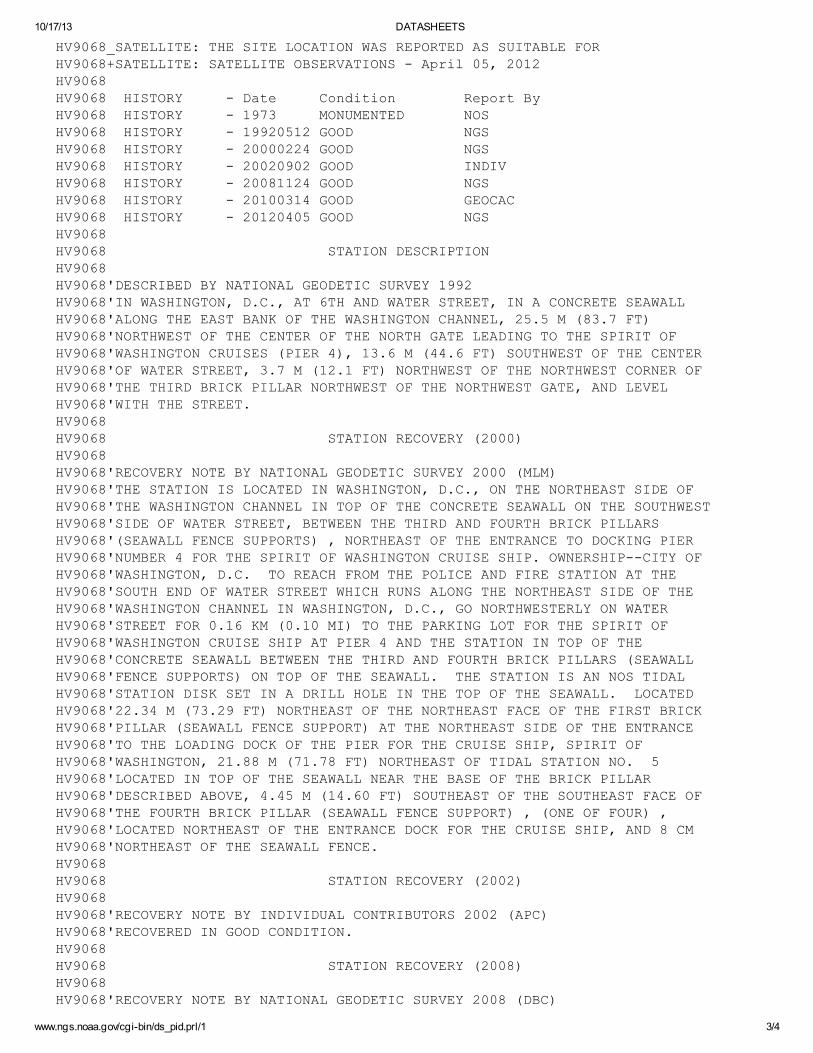


Anacostia River Bathymetric Survey 2013 Appendix C
District Department of the Environment
Appendix C
Positioning QC Check Results
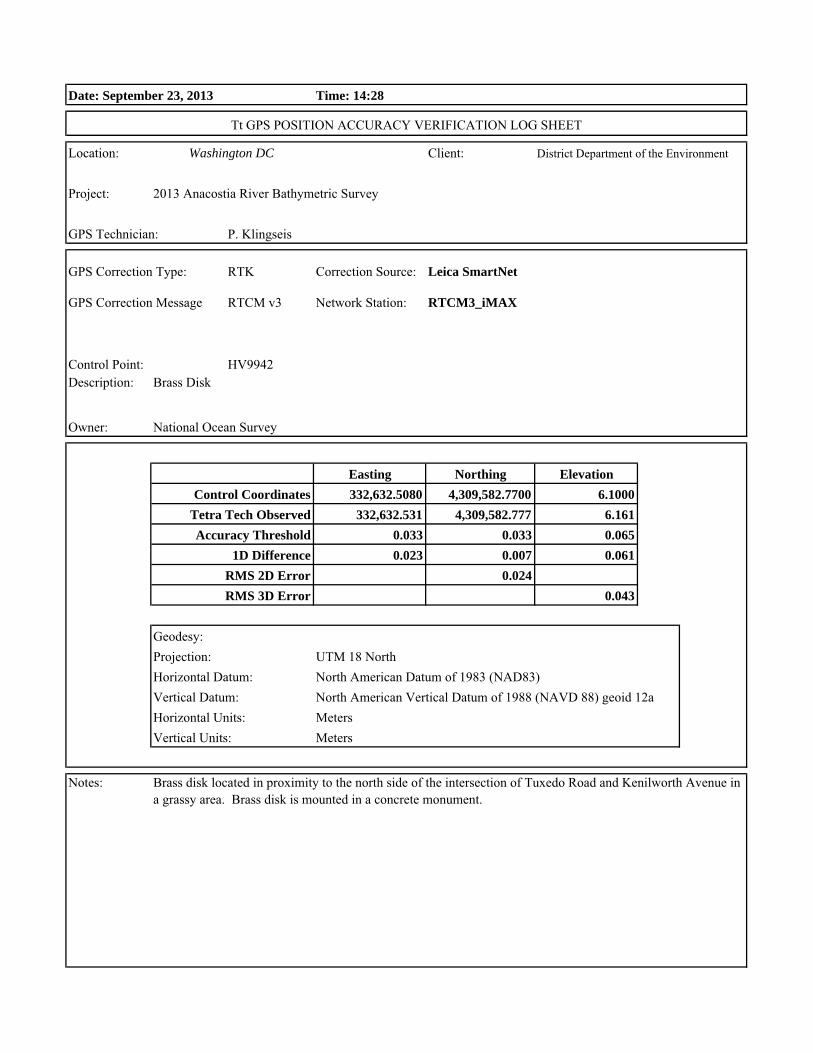
Date: September 23, 2013 Time: 14:28
C������N �����N ���������������������� ��%���������
��?���N
6�0������
� ����������������N ��0 ���������������N Leica SmartNet
� ������������#������ ���#��) '��9��2�������N RTCM3_iMAX
�,++5:���������N
�9���N
Easting Northing Elevation332,632.5080 4,309,582.7700 6.1000
332,632.531 4,309,582.777 6.1610.033 0.033 0.0650.023 0.007 0.061
0.0240.043
'����N $�������2��������������<�������� ������ ��������� �����������������<�������������0���9��� ����������������������6��$�������2������������������������������6
,�����������N '��� ���������,���������������*+((�7'�,��((8������*:����F������&���N #�����,�������&���N #�����
�������N ��?�����N &�#�*(�'��� ���F����������N '��� �����������������*+()�7'��()8
�������� ���N$�������2
'������������������
Control CoordinatesTetra Tech ObservedAccuracy Threshold
1D DifferenceRMS 2D ErrorRMS 3D Error
���� �� ��"�"�'����&���G�,%�"3"���"�'�C�����%%�
Washington DC
:;*)���������������$�� ������������
� ����� ����N

Date: September 23, 2013 Time: 15:38
C������N �����N ���������������������� ��%���������
��?���N
6�0������
� ����������������N ��0 ���������������N Leica SmartNet
� ������������#������ ���#��) '��9��2�������N RTCM3_iMAX
�,+;B(���������N
�9���N
Easting Northing Elevation324,665.1050 4,304,875.8130 2.4380
324,665.122 4,304,875.804 2.4740.033 0.033 0.0650.017 0.009 0.036
0.0180.028
'����N $�������2����������������9����������4��������������� ����� 9����4���������6�
,�����������N '��� ���������,���������������*+((�7'�,��((8������*:����F������&���N #�����,�������&���N #�����
�������N ��?�����N &�#�*(�'��� ���F����������N '��� �����������������*+()�7'��()8
�������� ���N$�������2
'������������������
Control CoordinatesTetra Tech ObservedAccuracy Threshold
1D DifferenceRMS 2D ErrorRMS 3D Error
���� �� ��"�"�'����&���G�,%�"3"���"�'�C�����%%�
Washington DC
:;*)���������������$�� ������������
� ����� ����N

Date: September 24, 2013 Time: 15:29
C������N �����N ���������������������� ��%���������
��?���N
6�0������
� ����������������N ��0 ���������������N Leica SmartNet
� ������������#������ ���#��) '��9��2�������N RTCM3_iMAX
�,+;B(���������N
�9���N
Easting Northing Elevation324,665.1050 4,304,875.8130 2.4380
324,665.124 4,304,875.811 2.4740.033 0.033 0.0650.019 0.002 0.036
0.0190.028
'����N $�������2����������������9����������4��������������� ����� 9����4���������6�
,�����������N '��� ���������,���������������*+((�7'�,��((8������*:����F������&���N #�����,�������&���N #�����
�������N ��?�����N &�#�*(�'��� ���F����������N '��� �����������������*+()�7'��()8
�������� ���N$�������2
'������������������
Control CoordinatesTetra Tech ObservedAccuracy Threshold
1D DifferenceRMS 2D ErrorRMS 3D Error
���� �� ��"�"�'����&���G�,%�"3"���"�'�C�����%%�
Washington DC
:;*)���������������$�� ������������
� ����� ����N
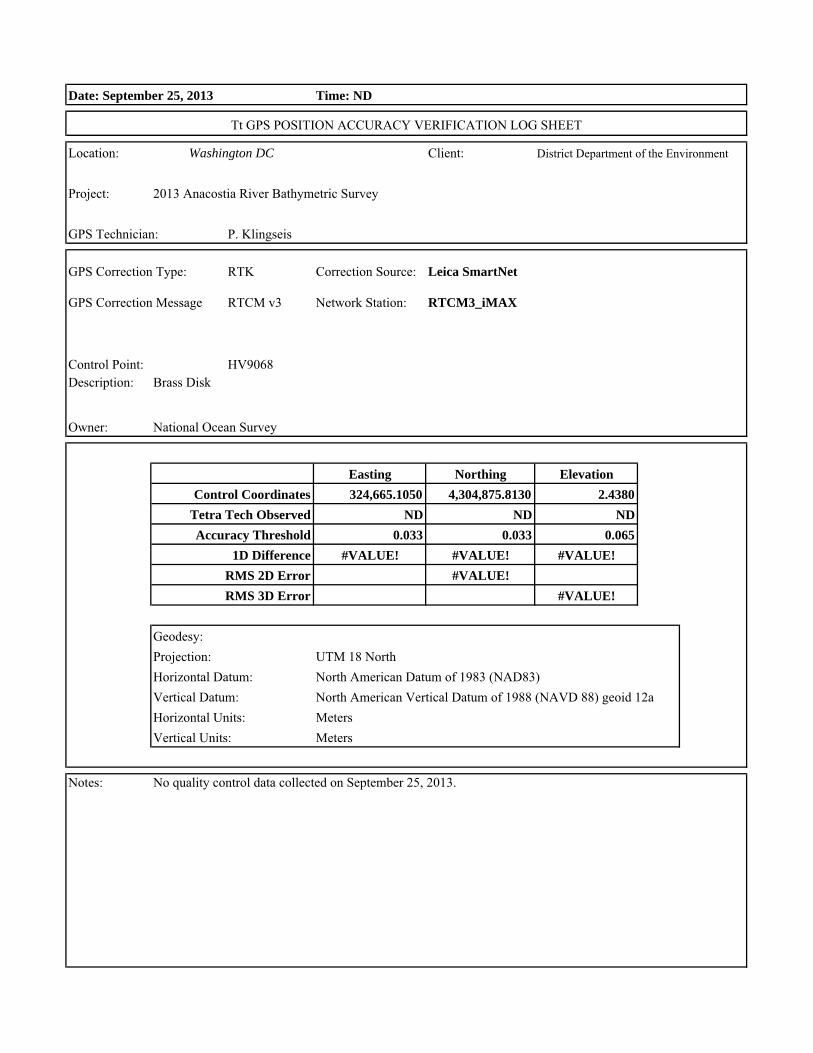
Date: September 25, 2013 Time: ND
C������N �����N ���������������������� ��%���������
��?���N
6�0������
� ����������������N ��0 ���������������N Leica SmartNet
� ������������#������ ���#��) '��9��2�������N RTCM3_iMAX
�,+;B(���������N
�9���N
Easting Northing Elevation324,665.1050 4,304,875.8130 2.4380
ND ND ND0.033 0.033 0.065
#VALUE! #VALUE! #VALUE!#VALUE!
#VALUE!
'����N
���� �� ��"�"�'����&���G�,%�"3"���"�'�C�����%%�
Washington DC
:;*)���������������$�� ������������
� ����� ����N
�������� ���N$�������2
'������������������
Control CoordinatesTetra Tech ObservedAccuracy Threshold
1D DifferenceRMS 2D ErrorRMS 3D Error
�������N ��?�����N &�#�*(�'��� ���F����������N '��� �����������������*+()�7'��()8
'��.�������������������������������������!���:A��:;*)6
,�����������N '��� ���������,���������������*+((�7'�,��((8������*:����F������&���N #�����,�������&���N #�����

Date: September 26, 2013 Time: 11:29
C������N �����N ���������������������� ��%���������
��?���N
6�0������
� ����������������N ��0 ���������������N Leica SmartNet
� ������������#������ ���#��) '��9��2�������N RTCM3_iMAX
�,+;B(���������N
�9���N
Easting Northing Elevation324,665.1050 4,304,875.8130 2.4380
324,665.122 4,304,875.789 2.4910.033 0.033 0.0650.017 0.024 0.053
0.0240.042
'����N
���� �� ��"�"�'����&���G�,%�"3"���"�'�C�����%%�
Washington DC
:;*)���������������$�� ������������
� ����� ����N
�������� ���N$�������2
'������������������
Control CoordinatesTetra Tech ObservedAccuracy Threshold
1D DifferenceRMS 2D ErrorRMS 3D Error
�������N ��?�����N &�#�*(�'��� ���F����������N '��� �����������������*+()�7'��()8
$�������2����������������9����������4��������������� ����� 9����4���������6�
,�����������N '��� ���������,���������������*+((�7'�,��((8������*:����F������&���N #�����,�������&���N #�����

Date: September 27, 2013 Time: 11:41
C������N �����N ���������������������� ��%���������
��?���N
6�0������
� ����������������N ��0 ���������������N Leica SmartNet
� ������������#������ ���#��) '��9��2�������N RTCM3_iMAX
�,+;B(���������N
�9���N
Easting Northing Elevation324,665.1050 4,304,875.8130 2.4380
324,665.120 4,304,875.817 2.4950.033 0.033 0.0650.015 0.004 0.057
0.0150.036
'����N
���� �� ��"�"�'����&���G�,%�"3"���"�'�C�����%%�
Washington DC
:;*)���������������$�� ������������
� ����� ����N
�������� ���N$�������2
'������������������
Control CoordinatesTetra Tech ObservedAccuracy Threshold
1D DifferenceRMS 2D ErrorRMS 3D Error
�������N ��?�����N &�#�*(�'��� ���F����������N '��� �����������������*+()�7'��()8
$�������2����������������9����������4��������������� ����� 9����4���������6�
,�����������N '��� ���������,���������������*+((�7'�,��((8������*:����F������&���N #�����,�������&���N #�����

Date: September 28, 2013 Time: 11:46
C������N �����N ���������������������� ��%���������
��?���N
6�0������
� ����������������N ��0 ���������������N Leica SmartNet
� ������������#������ ���#��) '��9��2�������N RTCM3_iMAX
�,+;B(���������N
�9���N
Easting Northing Elevation324,665.1050 4,304,875.8130 2.4380
324,665.126 4,304,875.803 2.4830.033 0.033 0.0650.021 0.010 0.045
0.0220.035
'����N
���� �� ��"�"�'����&���G�,%�"3"���"�'�C�����%%�
Washington DC
:;*)���������������$�� ������������
� ����� ����N
�������� ���N$�������2
'������������������
Control CoordinatesTetra Tech ObservedAccuracy Threshold
1D DifferenceRMS 2D ErrorRMS 3D Error
�������N ��?�����N &�#�*(�'��� ���F����������N '��� �����������������*+()�7'��()8
$�������2����������������9����������4��������������� ����� 9����4���������6�
,�����������N '��� ���������,���������������*+((�7'�,��((8������*:����F������&���N #�����,�������&���N #�����

Date: September 30, 2013 Time: 10:37
C������N �����N ���������������������� ��%���������
��?���N
6�0������
� ����������������N ��0 ���������������N Leica SmartNet
� ������������#������ ���#��) '��9��2�������N RTCM3_iMAX
�,+;B(���������N
�9���N
Easting Northing Elevation324,665.1050 4,304,875.8130 2.4380
324,665.085 4,304,875.808 2.4780.033 0.033 0.0650.020 0.005 0.040
0.0200.031
'����N
���� �� ��"�"�'����&���G�,%�"3"���"�'�C�����%%�
Washington DC
:;*)���������������$�� ������������
� ����� ����N
�������� ���N$�������2
'������������������
Control CoordinatesTetra Tech ObservedAccuracy Threshold
1D DifferenceRMS 2D ErrorRMS 3D Error
�������N ��?�����N &�#�*(�'��� ���F����������N '��� �����������������*+()�7'��()8
$�������2����������������9����������4��������������� ����� 9����4���������6�
,�����������N '��� ���������,���������������*+((�7'�,��((8������*:����F������&���N #�����,�������&���N #�����

Date: October 1, 2013 Time: 12:13
C������N �����N ���������������������� ��%���������
��?���N
6�0������
� ����������������N ��0 ���������������N Leica SmartNet
� ������������#������ ���#��) '��9��2�������N RTCM3_iMAX
�,+;B(���������N
�9���N
Easting Northing Elevation324,665.1050 4,304,875.8130 2.4380
324,665.119 4,304,875.798 2.4790.033 0.033 0.0650.014 0.015 0.041
0.0180.031
'����N
���� �� ��"�"�'����&���G�,%�"3"���"�'�C�����%%�
Washington DC
:;*)���������������$�� ������������
� ����� ����N
�������� ���N$�������2
'������������������
Control CoordinatesTetra Tech ObservedAccuracy Threshold
1D DifferenceRMS 2D ErrorRMS 3D Error
�������N ��?�����N &�#�*(�'��� ���F����������N '��� �����������������*+()�7'��()8
$�������2����������������9����������4��������������� ����� 9����4���������6�
,�����������N '��� ���������,���������������*+((�7'�,��((8������*:����F������&���N #�����,�������&���N #�����
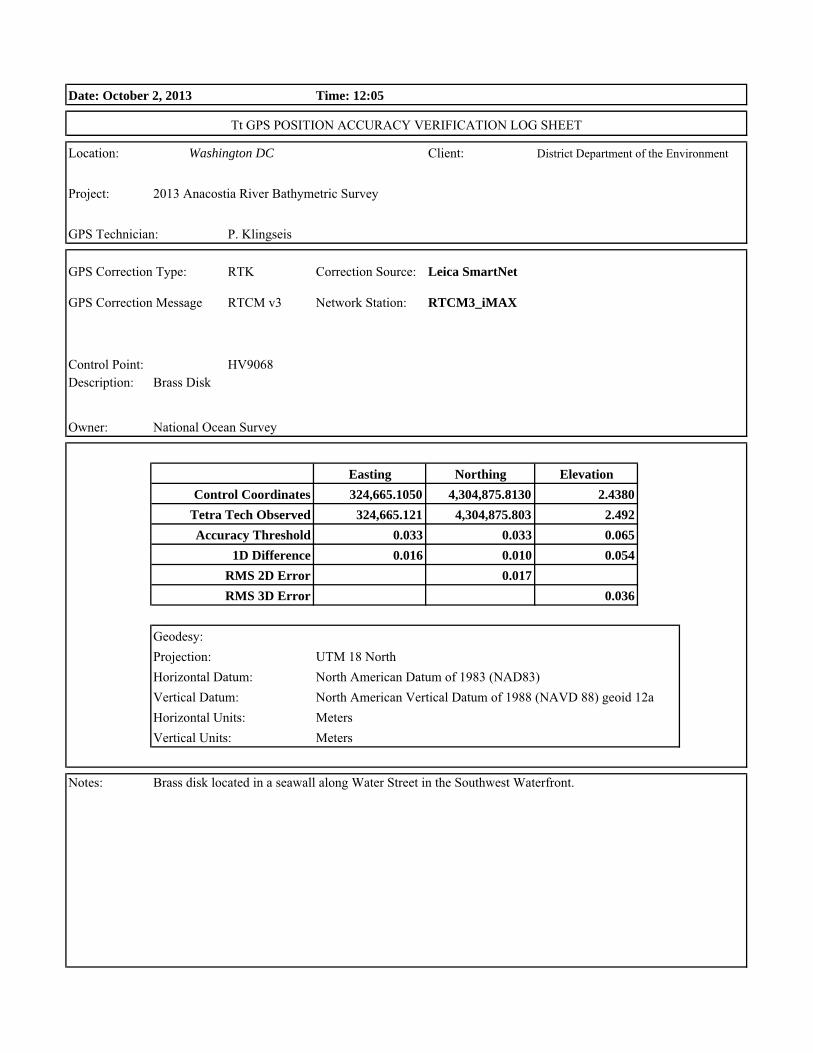
Date: October 2, 2013 Time: 12:05
C������N �����N ���������������������� ��%���������
��?���N
6�0������
� ����������������N ��0 ���������������N Leica SmartNet
� ������������#������ ���#��) '��9��2�������N RTCM3_iMAX
�,+;B(���������N
�9���N
Easting Northing Elevation324,665.1050 4,304,875.8130 2.4380
324,665.121 4,304,875.803 2.4920.033 0.033 0.0650.016 0.010 0.054
0.0170.036
'����N
���� �� ��"�"�'����&���G�,%�"3"���"�'�C�����%%�
Washington DC
:;*)���������������$�� ������������
� ����� ����N
�������� ���N$�������2
'������������������
Control CoordinatesTetra Tech ObservedAccuracy Threshold
1D DifferenceRMS 2D ErrorRMS 3D Error
�������N ��?�����N &�#�*(�'��� ���F����������N '��� �����������������*+()�7'��()8
$�������2����������������9����������4��������������� ����� 9����4���������6�
,�����������N '��� ���������,���������������*+((�7'�,��((8������*:����F������&���N #�����,�������&���N #�����
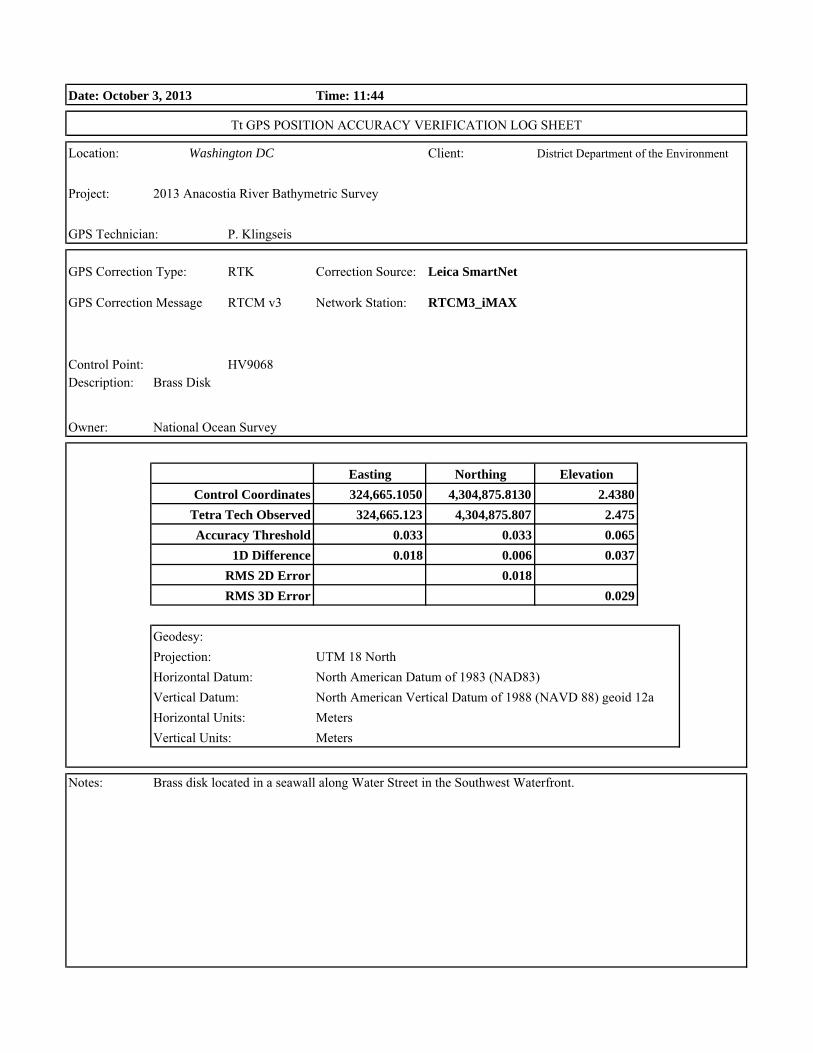
Date: October 3, 2013 Time: 11:44
C������N �����N ���������������������� ��%���������
��?���N
6�0������
� ����������������N ��0 ���������������N Leica SmartNet
� ������������#������ ���#��) '��9��2�������N RTCM3_iMAX
�,+;B(���������N
�9���N
Easting Northing Elevation324,665.1050 4,304,875.8130 2.4380
324,665.123 4,304,875.807 2.4750.033 0.033 0.0650.018 0.006 0.037
0.0180.029
'����N $�������2����������������9����������4��������������� ����� 9����4���������6�
,�����������N '��� ���������,���������������*+((�7'�,��((8������*:����F������&���N #�����,�������&���N #�����
�������N ��?�����N &�#�*(�'��� ���F����������N '��� �����������������*+()�7'��()8
�������� ���N$�������2
'������������������
Control CoordinatesTetra Tech ObservedAccuracy Threshold
1D DifferenceRMS 2D ErrorRMS 3D Error
���� �� ��"�"�'����&���G�,%�"3"���"�'�C�����%%�
Washington DC
:;*)���������������$�� ������������
� ����� ����N

Date: October 4, 2013 Time: 12:09
C������N �����N ���������������������� ��%���������
��?���N
6�0������
� ����������������N ��0 ���������������N Leica SmartNet
� ������������#������ ���#��) '��9��2�������N RTCM3_iMAX
�,+;B(���������N
�9���N
Easting Northing Elevation324,665.1050 4,304,875.8130 2.4380
324,665.118 4,304,875.808 2.4930.033 0.033 0.0650.013 0.005 0.055
0.0130.035
'����N
���� �� ��"�"�'����&���G�,%�"3"���"�'�C�����%%�
Washington DC
:;*)���������������$�� ������������
� ����� ����N
�������� ���N$�������2
'������������������
Control CoordinatesTetra Tech ObservedAccuracy Threshold
1D DifferenceRMS 2D ErrorRMS 3D Error
�������N ��?�����N &�#�*(�'��� ���F����������N '��� �����������������*+()�7'��()8
$�������2����������������9����������4��������������� ����� 9����4���������6�
,�����������N '��� ���������,���������������*+((�7'�,��((8������*:����F������&���N #�����,�������&���N #�����

Date: October 8, 2013 Time: 13:54
C������N �����N ���������������������� ��%���������
��?���N
6�0������
� ����������������N ��0 ���������������N Leica SmartNet
� ������������#������ ���#��) '��9��2�������N RTCM3_iMAX
�,+;B(���������N
�9���N
Easting Northing Elevation324,665.1050 4,304,875.8130 2.4380
324,665.123 4,304,875.798 2.4560.033 0.033 0.0650.018 0.015 0.018
0.0210.026
'����N $�������2����������������9����������4��������������� ����� 9����4���������6�
,�����������N '��� ���������,���������������*+((�7'�,��((8������*:����F������&���N #�����,�������&���N #�����
�������N ��?�����N &�#�*(�'��� ���F����������N '��� �����������������*+()�7'��()8
�������� ���N$�������2
'������������������
Control CoordinatesTetra Tech ObservedAccuracy Threshold
1D DifferenceRMS 2D ErrorRMS 3D Error
���� �� ��"�"�'����&���G�,%�"3"���"�'�C�����%%�
Washington DC
:;*)���������������$�� ������������
� ����� ����N

Date: October 9, 2013 Time: 10:28
C������N �����N ���������������������� ��%���������
��?���N
6�0������
� ����������������N ��0 ���������������N Leica SmartNet
� ������������#������ ���#��) '��9��2�������N RTCM3_iMAX
�,+;B(���������N
�9���N
Easting Northing Elevation324,665.1050 4,304,875.8130 2.4380
324,665.113 4,304,875.805 2.4600.033 0.033 0.0650.008 0.008 0.022
0.0100.017
'����N $�������2����������������9����������4��������������� ����� 9����4���������6�
,�����������N '��� ���������,���������������*+((�7'�,��((8������*:����F������&���N #�����,�������&���N #�����
�������N ��?�����N &�#�*(�'��� ���F����������N '��� �����������������*+()�7'��()8
�������� ���N$�������2
'������������������
Control CoordinatesTetra Tech ObservedAccuracy Threshold
1D DifferenceRMS 2D ErrorRMS 3D Error
���� �� ��"�"�'����&���G�,%�"3"���"�'�C�����%%�
Washington DC
:;*)���������������$�� ������������
� ����� ����N

Date: October 10, 2013 Time: 15:13
C������N �����N ���������������������� ��%���������
��?���N
6�0������
� ����������������N ��0 ���������������N Leica SmartNet
� ������������#������ ���#��) '��9��2�������N RTCM3_iMAX
�,+;B(���������N
�9���N
Easting Northing Elevation324,665.1050 4,304,875.8130 2.4380
324,665.109 4,304,875.801 2.5020.033 0.033 0.0650.004 0.012 0.064
0.0090.039
'����N
���� �� ��"�"�'����&���G�,%�"3"���"�'�C�����%%�
Washington DC
:;*)���������������$�� ������������
� ����� ����N
�������� ���N$�������2
'������������������
Control CoordinatesTetra Tech ObservedAccuracy Threshold
1D DifferenceRMS 2D ErrorRMS 3D Error
�������N ��?�����N &�#�*(�'��� ���F����������N '��� �����������������*+()�7'��()8
$�������2����������������9����������4��������������� ����� 9����4���������6�
,�����������N '��� ���������,���������������*+((�7'�,��((8������*:����F������&���N #�����,�������&���N #�����

Date: October 11, 2013 Time: 11:10
C������N �����N ���������������������� ��%���������
��?���N
6�0������
� ����������������N ��0 ���������������N Leica SmartNet
� ������������#������ ���#��) '��9��2�������N RTCM3_iMAX
�,+;B(���������N
�9���N
Easting Northing Elevation324,665.1050 4,304,875.8130 2.4380
324,665.107 4,304,875.792 2.4970.033 0.033 0.0650.002 0.021 0.059
0.0150.040
'����N
���� �� ��"�"�'����&���G�,%�"3"���"�'�C�����%%�
Washington DC
:;*)���������������$�� ������������
� ����� ����N
�������� ���N$�������2
'������������������
Control CoordinatesTetra Tech ObservedAccuracy Threshold
1D DifferenceRMS 2D ErrorRMS 3D Error
�������N ��?�����N &�#�*(�'��� ���F����������N '��� �����������������*+()�7'��()8
$�������2����������������9����������4��������������� ����� 9����4���������6�
,�����������N '��� ���������,���������������*+((�7'�,��((8������*:����F������&���N #�����,�������&���N #�����

Date: October 12, 2013 Time: 10:23
C������N �����N ���������������������� ��%���������
��?���N
6�0������
� ����������������N ��0 ���������������N Leica SmartNet
� ������������#������ ���#��) '��9��2�������N RTCM3_iMAX
�,+;B(���������N
�9���N
Easting Northing Elevation324,665.1050 4,304,875.8130 2.4380
324,665.101 4,304,875.798 2.4580.033 0.033 0.0650.004 0.015 0.020
0.0120.020
'����N
���� �� ��"�"�'����&���G�,%�"3"���"�'�C�����%%�
Washington DC
:;*)���������������$�� ������������
� ����� ����N
�������� ���N$�������2
'������������������
Control CoordinatesTetra Tech ObservedAccuracy Threshold
1D DifferenceRMS 2D ErrorRMS 3D Error
�������N ��?�����N &�#�*(�'��� ���F����������N '��� �����������������*+()�7'��()8
$�������2����������������9����������4��������������� ����� 9����4���������6�
,�����������N '��� ���������,���������������*+((�7'�,��((8������*:����F������&���N #�����,�������&���N #�����

Date: October 13, 2013 Time: 10:20
C������N �����N ���������������������� ��%���������
��?���N
6�0������
� ����������������N ��0 ���������������N Leica SmartNet
� ������������#������ ���#��) '��9��2�������N RTCM3_iMAX
�,+;B(���������N
�9���N
Easting Northing Elevation324,665.1050 4,304,875.8130 2.4380
324,665.109 4,304,875.801 2.5020.033 0.033 0.0650.004 0.012 0.064
0.0090.039
'����N
���� �� ��"�"�'����&���G�,%�"3"���"�'�C�����%%�
Washington DC
:;*)���������������$�� ������������
� ����� ����N
�������� ���N$�������2
'������������������
Control CoordinatesTetra Tech ObservedAccuracy Threshold
1D DifferenceRMS 2D ErrorRMS 3D Error
�������N ��?�����N &�#�*(�'��� ���F����������N '��� �����������������*+()�7'��()8
$�������2����������������9����������4��������������� ����� 9����4���������6�
,�����������N '��� ���������,���������������*+((�7'�,��((8������*:����F������&���N #�����,�������&���N #�����

Date: October 14, 2013 Time: 12:34
C������N �����N ���������������������� ��%���������
��?���N
@6������
� ����������������N ��0 ���������������N Leica SmartNet
� ������������#������ ���#��) '��9��2�������N RTCM3_iMAX
�,+;B(���������N
�9���N
Easting Northing Elevation324,665.1050 4,304,875.8130 2.4380
324,665.129 4,304,875.800 2.4900.033 0.033 0.0650.024 0.013 0.052
0.0260.041
'����N $�������2����������������9����������4��������������� ����� 9����4���������6�
,�����������N '��� ���������,���������������*+((�7'�,��((8������*:����F������&���N #�����,�������&���N #�����
�������N ��?�����N &�#�*(�'��� ���F����������N '��� �����������������*+()�7'��()8
�������� ���N$�������2
'������������������
Control CoordinatesTetra Tech ObservedAccuracy Threshold
1D DifferenceRMS 2D ErrorRMS 3D Error
���� �� ��"�"�'����&���G�,%�"3"���"�'�C�����%%�
Washington DC
:;*)���������������$�� ������������
� ����� ����N

Date: October 15, 2013 Time: 12:17
C������N �����N ���������������������� ��%���������
��?���N
@6������
� ����������������N ��0 ���������������N Leica SmartNet
� ������������#������ ���#��) '��9��2�������N RTCM3_iMAX
�,+;B(���������N
�9���N
Easting Northing Elevation324,665.1050 4,304,875.8130 2.4380
324,665.118 4,304,875.791 2.4900.033 0.033 0.0650.013 0.022 0.052
0.0200.039
'����N $�������2����������������9����������4��������������� ����� 9����4���������6�
,�����������N '��� ���������,���������������*+((�7'�,��((8������*:����F������&���N #�����,�������&���N #�����
�������N ��?�����N &�#�*(�'��� ���F����������N '��� �����������������*+()�7'��()8
�������� ���N$�������2
'������������������
Control CoordinatesTetra Tech ObservedAccuracy Threshold
1D DifferenceRMS 2D ErrorRMS 3D Error
���� �� ��"�"�'����&���G�,%�"3"���"�'�C�����%%�
Washington DC
:;*)���������������$�� ������������
� ����� ����N

Date: October 16, 2013 Time: 12:00
C������N �����N ���������������������� ��%���������
��?���N
6�0������
� ����������������N ��0 ���������������N Leica SmartNet
� ������������#������ ���#��) '��9��2�������N RTCM3_iMAX
�,+;B(���������N
�9���N
Easting Northing Elevation324,665.1050 4,304,875.8130 2.4380
324,665.107 4,304,875.791 2.4730.033 0.033 0.0650.002 0.022 0.035
0.0160.030
'����N $�������2����������������9����������4��������������� ����� 9����4���������6�
,�����������N '��� ���������,���������������*+((�7'�,��((8������*:����F������&���N #�����,�������&���N #�����
�������N ��?�����N &�#�*(�'��� ���F����������N '��� �����������������*+()�7'��()8
�������� ���N$�������2
'������������������
Control CoordinatesTetra Tech ObservedAccuracy Threshold
1D DifferenceRMS 2D ErrorRMS 3D Error
���� �� ��"�"�'����&���G�,%�"3"���"�'�C�����%%�
Washington DC
:;*)���������������$�� ������������
� ����� ����N

Date: October 17, 2013 Time: 12:27
C������N �����N ���������������������� ��%���������
��?���N
06�%��� �
� ����������������N ��0 ���������������N Leica SmartNet
� ������������#������ ���#��) '��9��2�������N RTCM3_iMAX
�,+;B(���������N
�9���N
Easting Northing Elevation324,665.1050 4,304,875.8130 2.4380
324,665.115 4,304,875.807 2.4850.033 0.033 0.0650.010 0.006 0.047
0.0110.030
'����N $�������2����������������9����������4��������������� ����� 9����4���������6�
,�����������N '��� ���������,���������������*+((�7'�,��((8������*:����F������&���N #�����,�������&���N #�����
�������N ��?�����N &�#�*(�'��� ���F����������N '��� �����������������*+()�7'��()8
�������� ���N$�������2
'������������������
Control CoordinatesTetra Tech ObservedAccuracy Threshold
1D DifferenceRMS 2D ErrorRMS 3D Error
���� �� ��"�"�'����&���G�,%�"3"���"�'�C�����%%�
Washington DC
:;*)���������������$�� ������������
� ����� ����N

Date: October 22, 2013 Time: 06:56
C������N �����N ���������������������� ��%���������
��?���N
06�%��� �
� ����������������N ��0 ���������������N Leica SmartNet
� ������������#������ ���#��) '��9��2�������N RTCM3_iMAX
$$$-:)���������N
�9���N
Easting Northing Elevation332,008.7910 4,311,195.8130 2.5230
332,008.768 4,311,195.810 2.5520.033 0.033 0.0650.023 0.003 0.029
0.0230.029
'����N ��������2��������������������������!������$������!���4���������� ��2������6��&���%���26
,�����������N '��� ���������,���������������*+((�7'�,��((8������*:����F������&���N #�����,�������&���N #�����
�������N ��?�����N &�#�*(�'��� ���F����������N '��� �����������������*+()�7'��()8
�������� ���N�����
&���%
Control CoordinatesTetra Tech ObservedAccuracy Threshold
1D DifferenceRMS 2D ErrorRMS 3D Error
���� �� ��"�"�'����&���G�,%�"3"���"�'�C�����%%�
Washington DC
:;*)���������������$�� ������������
� ����� ����N

Date: October 22, 2013 Time: 11:56
C������N �����N ���������������������� ��%���������
��?���N
06�%��� �
� ����������������N ��0 ���������������N Leica SmartNet
� ������������#������ ���#��) '��9��2�������N RTCM3_iMAX
�,+;B(���������N
�9���N
Easting Northing Elevation324,665.1050 4,304,875.8130 2.4380
324,665.121 4,304,875.805 2.4870.033 0.033 0.0650.016 0.008 0.049
0.0170.033
'����N $�������2����������������9����������4��������������� ����� 9����4���������6�
,�����������N '��� ���������,���������������*+((�7'�,��((8������*:����F������&���N #�����,�������&���N #�����
�������N ��?�����N &�#�*(�'��� ���F����������N '��� �����������������*+()�7'��()8
�������� ���N$����
'������������������
Control CoordinatesTetra Tech ObservedAccuracy Threshold
1D DifferenceRMS 2D ErrorRMS 3D Error
���� �� ��"�"�'����&���G�,%�"3"���"�'�C�����%%�
Washington DC
:;*)���������������$�� ������������
� ����� ����N

Date: October 23, 2013 Time: 07:32
C������N �����N ���������������������� ��%���������
��?���N
06�%��� �
� ����������������N ��0 ���������������N Leica SmartNet
� ������������#������ ���#��) '��9��2�������N RTCM3_iMAX
$$$-:)���������N
�9���N
Easting Northing Elevation332,008.7910 4,311,195.8130 2.5230
332,008.775 4,311,195.816 2.5570.033 0.033 0.0650.016 0.003 0.034
0.0160.026
'����N ��������2��������������������������!������$������!���4���������� ��2������6��&���%���26
,�����������N '��� ���������,���������������*+((�7'�,��((8������*:����F������&���N #�����,�������&���N #�����
�������N ��?�����N &�#�*(�'��� ���F����������N '��� �����������������*+()�7'��()8
�������� ���N�����
&���%
Control CoordinatesTetra Tech ObservedAccuracy Threshold
1D DifferenceRMS 2D ErrorRMS 3D Error
���� �� ��"�"�'����&���G�,%�"3"���"�'�C�����%%�
Washington DC
:;*)���������������$�� ������������
� ����� ����N

Date: October 24, 2013 Time: 07:05
C������N �����N ���������������������� ��%���������
��?���N
06�%��� �
� ����������������N ��0 ���������������N Leica SmartNet
� ������������#������ ���#��) '��9��2�������N RTCM3_iMAX
$$$-:)���������N
�9���N
Easting Northing Elevation332,008.7910 4,311,195.8130 2.5230
332,008.772 4,311,195.814 2.5490.033 0.033 0.0650.019 0.001 0.026
0.0190.024
'����N
���� �� ��"�"�'����&���G�,%�"3"���"�'�C�����%%�
Washington DC
:;*)���������������$�� ������������
� ����� ����N
�������� ���N�����
&���%
Control CoordinatesTetra Tech ObservedAccuracy Threshold
1D DifferenceRMS 2D ErrorRMS 3D Error
�������N ��?�����N &�#�*(�'��� ���F����������N '��� �����������������*+()�7'��()8
��������2��������������������������!������$������!���4���������� ��2������6��&���%���26
,�����������N '��� ���������,���������������*+((�7'�,��((8������*:����F������&���N #�����,�������&���N #�����

Date: October 25, 2013 Time: 08:45
C������N �����N ���������������������� ��%���������
��?���N
06�%��� �
� ����������������N ��0 ���������������N Leica SmartNet
� ������������#������ ���#��) '��9��2�������N RTCM3_iMAX
$$$-:)���������N
�9���N
Easting Northing Elevation332,008.7910 4,311,195.8130 2.5230
332,008.772 4,311,195.813 2.5550.033 0.033 0.0650.019 0.000 0.032
0.0190.027
'����N ��������2��������������������������!������$������!���4���������� ��2������6��&���%���26
,�����������N '��� ���������,���������������*+((�7'�,��((8������*:����F������&���N #�����,�������&���N #�����
�������N ��?�����N &�#�*(�'��� ���F����������N '��� �����������������*+()�7'��()8
�������� ���N�����
&���%
Control CoordinatesTetra Tech ObservedAccuracy Threshold
1D DifferenceRMS 2D ErrorRMS 3D Error
���� �� ��"�"�'����&���G�,%�"3"���"�'�C�����%%�
Washington DC
:;*)���������������$�� ������������
� ����� ����N

Date: October 27, 2013 Time: 18:30
C������N �����N ���������������������� ��%���������
��?���N
06�%��� �
� ����������������N ��0 ���������������N Leica SmartNet
� ������������#������ ���#��) '��9��2�������N RTCM3_iMAX
$$$-:)���������N
�9���N
Easting Northing Elevation332,008.7910 4,311,195.8130 2.5230
332,008.817 4,311,195.866 2.5050.033 0.033 0.0650.026 0.053 0.018
0.0460.060
'����N ��������2��������������������������!������$������!���4���������� ��2������6��&���%���26�������������!!!����������������������� ���������������������������������6
,�����������N '��� ���������,���������������*+((�7'�,��((8������*:����F������&���N #�����,�������&���N #�����
�������N ��?�����N &�#�*(�'��� ���F����������N '��� �����������������*+()�7'��()8
�������� ���N�����
&���%
Control CoordinatesTetra Tech ObservedAccuracy Threshold
1D DifferenceRMS 2D ErrorRMS 3D Error
���� �� ��"�"�'����&���G�,%�"3"���"�'�C�����%%�
Washington DC
:;*)���������������$�� ������������
� ����� ����N

Date: October 28, 2013 Time: 06:40
C������N �����N ���������������������� ��%���������
��?���N
06�%��� �
� ����������������N ��0 ���������������N Leica SmartNet
� ������������#������ ���#��) '��9��2�������N RTCM3_iMAX
$$$-:)���������N
�9���N
Easting Northing Elevation332,008.7910 4,311,195.8130 2.5230
332,008.755 4,311,195.835 2.4920.033 0.033 0.0650.036 0.022 0.031
0.0390.046
'����N
���� �� ��"�"�'����&���G�,%�"3"���"�'�C�����%%�
Washington DC
:;*)���������������$�� ������������
� ����� ����N
�������� ���N�����
&���%
Control CoordinatesTetra Tech ObservedAccuracy Threshold
1D DifferenceRMS 2D ErrorRMS 3D Error
�������N ��?�����N &�#�*(�'��� ���F����������N '��� �����������������*+()�7'��()8
��������2��������������������������!������$������!���4���������� ��2������6��&���%���26�������������!!!����������������������� ���������������������������������6
,�����������N '��� ���������,���������������*+((�7'�,��((8������*:����F������&���N #�����,�������&���N #�����

Date: October 29, 2013 Time: 07:10
C������N �����N ���������������������� ��%���������
��?���N
06�%��� �
� ����������������N ��0 ���������������N Leica SmartNet
� ������������#������ ���#��) '��9��2�������N RTCM3_iMAX
$$$-:)���������N
�9���N
Easting Northing Elevation332,008.7910 4,311,195.8130 2.5230
332,008.789 4,311,195.813 2.5030.033 0.033 0.0650.002 0.000 0.020
0.0020.012
'����N
���� �� ��"�"�'����&���G�,%�"3"���"�'�C�����%%�
Washington DC
:;*)���������������$�� ������������
� ����� ����N
�������� ���N�����
&���%
Control CoordinatesTetra Tech ObservedAccuracy Threshold
1D DifferenceRMS 2D ErrorRMS 3D Error
�������N ��?�����N &�#�*(�'��� ���F����������N '��� �����������������*+()�7'��()8
��������2��������������������������!������$������!���4���������� ��2������6��&���%���26������������������������������������������?���6
,�����������N '��� ���������,���������������*+((�7'�,��((8������*:����F������&���N #�����,�������&���N #�����
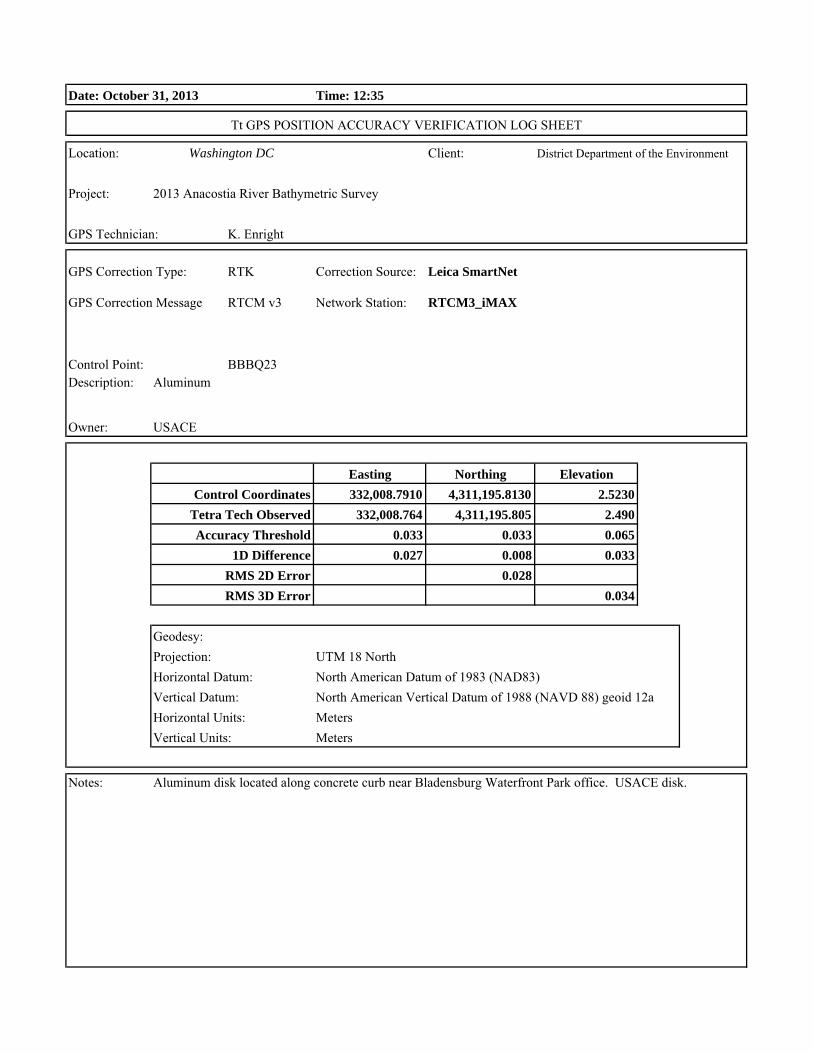
Date: October 31, 2013 Time: 12:35
C������N �����N ���������������������� ��%���������
��?���N
06�%��� �
� ����������������N ��0 ���������������N Leica SmartNet
� ������������#������ ���#��) '��9��2�������N RTCM3_iMAX
$$$-:)���������N
�9���N
Easting Northing Elevation332,008.7910 4,311,195.8130 2.5230
332,008.764 4,311,195.805 2.4900.033 0.033 0.0650.027 0.008 0.033
0.0280.034
'����N
���� �� ��"�"�'����&���G�,%�"3"���"�'�C�����%%�
Washington DC
:;*)���������������$�� ������������
� ����� ����N
�������� ���N�����
&���%
Control CoordinatesTetra Tech ObservedAccuracy Threshold
1D DifferenceRMS 2D ErrorRMS 3D Error
�������N ��?�����N &�#�*(�'��� ���F����������N '��� �����������������*+()�7'��()8
��������2��������������������������!������$������!���4���������� ��2������6��&���%���26
,�����������N '��� ���������,���������������*+((�7'�,��((8������*:����F������&���N #�����,�������&���N #�����

Anacostia River Bathymetric Survey 2013 Appendix D
District Department of the Environment
Appendix D
Daily Bar Check and Water Level Quality Control

Ana
cost
ia R
iver
Bat
hym
etric
Sur
vey
2013
A
ppen
dix
D
Dis
trict
Dep
artm
ent o
f the
Env
ironm
ent
Page
D-1
Dai
ly B
ar C
hec
kR
/V U
gle
e D
uck
ling
MB
E
Not
e:��H
ysw
eep�
bar�c
heck
�resu
lts�
are�
stor
ed�w
ithi
n�ea
ch�h
ypac
k�pr
ojec
t�as�
"Bar
chec
k.tx
t"
Pro
ject
Avg
.0.
04P
roje
ct S
tdv.
0.02
Pro
ject
Min
0.01
Pro
ject
Ma
x0.
06
Da
teti
me
'B
ar
De
pth
(m
)M
ea
s.
De
pth
(m
)S
on
ar
Dra
ft (
m)
Pit
ch C
orr
.C
orr
. D
ep
thD
iff.
AB
S(D
iff.
)N
ote
s
09/2
5/13
11:3
82.
744.
201.
080.
002.
75�0
.01
0.01
09/2
6/13
10:5
02.
443.
841.
090.
002.
400.
040.
0409
/27/
13n/
a3.
054.
461.
100.
003.
030.
020.
0209
/28/
13n/
a3.
054.
471.
050.
002.
990.
060.
0609
/30/
1311
:26
2.44
3.85
1.08
0.01
2.40
0.04
0.04
10/0
1/13
11:2
82.
443.
861.
080.
012.
410.
030.
0310
/02/
1311
:15
2.44
3.85
1.07
0.00
2.39
0.05
0.05
10/0
3/13
11:1
42.
443.
831.
080.
002.
380.
060.
0610
/04/
1311
:38
2.44
3.87
1.07
0.00
2.41
0.03
0.03

Ana
cost
ia R
iver
Bat
hym
etric
Sur
vey
2013
A
ppen
dix
D
Dis
trict
Dep
artm
ent o
f the
Env
ironm
ent
Page
D-2
Dai
ly B
ar C
hec
kR
/V M
IJIT
T S
ing
le B
eam
/ S
ing
le B
eam
Sw
eep
Not
e:��H
ysw
eep�
bar�c
heck
�resu
lts�
are�
stor
ed�w
ithi
n�ea
ch�h
ypac
k�pr
ojec
t�as�
"Bar
chec
k.tx
t"
Pro
ject
Avg
.0.
03P
roje
ct S
tdv.
0.01
Pro
ject
Min
0.00
Pro
ject
Ma
x0.
06
Da
teti
me
'
Sp
ee
d o
f S
ou
nd
(f
t/s)
Ba
r D
ep
th
(m)
Me
as.
D
ep
th (
m)
So
na
r D
raft
(m
)C
orr
. D
ep
thD
iff.
AB
S(D
iff.
)N
ote
s
10/0
8/13
Duc
er 1
18:3
214
89.7
1.52
1.25
0.31
1.56
0.04
0.04
Duc
er 2
18:3
214
89.7
1.52
1.25
0.31
1.56
0.04
0.04
Duc
er 3
18:3
214
89.7
1.52
1.22
0.31
1.53
0.01
0.01
Duc
er 4
18:3
214
89.7
3.51
3.25
0.31
3.56
0.05
0.05
Duc
er 5
18:3
214
89.7
3.66
3.38
0.31
3.69
0.04
0.04
10/0
9/13
Duc
er 1
11:5
014
89.5
3.20
2.93
0.31
3.24
0.04
0.04
Duc
er 2
11:5
014
89.5
3.44
3.14
0.31
3.45
0.01
0.01
Duc
er 3
11:5
014
89.5
3.69
3.35
0.31
3.66
�0.0
30.
03D
ucer
411
:50
1489
.53.
963.
690.
314.
000.
040.
04D
ucer
511
:50
1489
.54.
153.
780.
314.
09�0
.06
0.06

Ana
cost
ia R
iver
Bat
hym
etric
Sur
vey
2013
A
ppen
dix
D
Dis
trict
Dep
artm
ent o
f the
Env
ironm
ent
Page
D-3
Da
teti
me
'
Sp
ee
d o
f S
ou
nd
(f
t/s)
Ba
r D
ep
th
(m)
Me
as.
D
ep
th (
m)
So
na
r D
raft
(m
)C
orr
. D
ep
thD
iff.
AB
S(D
iff.
)N
ote
s
10/1
0/13
Duc
er 1
13:1
314
69.0
3.38
3.08
0.31
3.39
0.01
0.01
Duc
er 2
13:1
314
69.0
3.60
3.32
0.31
3.63
0.04
0.04
Duc
er 3
13:1
314
69.0
3.87
3.51
0.32
3.83
�0.0
50.
05D
ucer
413
:13
1469
.04.
113.
840.
324.
160.
050.
05D
ucer
513
:13
1469
.04.
303.
960.
324.
28�0
.02
0.02
10/1
1/13
Duc
er 1
n/a
1473
.82.
932.
560.
372.
930.
000.
00D
ucer
2n/
a14
73.8
3.14
2.85
0.32
3.17
0.03
0.03
Duc
er 3
n/a
1473
.83.
413.
080.
323.
40�0
.02
0.02
Duc
er 4
n/a
1473
.83.
693.
410.
323.
730.
050.
05D
ucer
5n/
a14
73.8
3.84
3.54
0.32
3.86
0.02
0.02
10/1
3/13
Duc
er 1
n/a
1473
.83.
323.
010.
363.
370.
050.
05D
ucer
2n/
a14
73.8
3.57
3.27
0.32
3.59
0.03
0.03
Duc
er 3
n/a
1473
.83.
803.
430.
323.
75�0
.05
0.05
Duc
er 4
n/a
1473
.84.
083.
830.
314.
140.
050.
05D
ucer
5n/
a14
73.8
4.24
3.97
0.31
4.28
0.04
0.04
10/1
4/13
Duc
er 1
11:2
614
73.9
3.54
3.23
0.29
3.52
�0.0
10.
01D
ucer
211
:26
1473
.93.
753.
510.
293.
800.
050.
05D
ucer
311
:26
1473
.94.
023.
690.
303.
99�0
.04
0.04
Duc
er 4
11:2
614
73.9
4.24
3.96
0.31
4.27
0.04
0.04
Duc
er 5
11:2
614
73.9
4.45
4.15
0.32
4.47
0.02
0.02

Ana
cost
ia R
iver
Bat
hym
etric
Sur
vey
2013
A
ppen
dix
D
Dis
trict
Dep
artm
ent o
f the
Env
ironm
ent
Page
D-4
Da
teti
me
'
Sp
ee
d o
f S
ou
nd
(f
t/s)
Ba
r D
ep
th
(m)
Me
as.
D
ep
th (
m)
So
na
r D
raft
(m
)C
orr
. D
ep
thD
iff.
AB
S(D
iff.
)N
ote
s
10/1
5/13
Duc
er 1
11:1
114
73.6
3.66
3.35
0.32
3.67
0.02
0.02
Duc
er 2
11:1
114
73.6
3.90
3.63
0.31
3.94
0.04
0.04
Duc
er 3
11:1
114
73.6
4.15
3.78
0.31
4.09
�0.0
60.
06D
ucer
411
:11
1473
.64.
364.
050.
314.
360.
010.
01D
ucer
511
:11
1473
.64.
544.
240.
324.
560.
020.
0210
/16/
13D
ucer
112
:02
1472
.63.
603.
370.
283.
650.
050.
05D
ucer
212
:02
1472
.63.
813.
540.
283.
820.
010.
01D
ucer
312
:02
1472
.64.
083.
720.
314.
03�0
.06
0.06
Duc
er 4
12:0
214
72.6
4.30
3.93
0.32
4.25
�0.0
50.
05D
ucer
512
:02
1472
.64.
484.
210.
324.
530.
050.
0510
/17/
13D
ucer
111
:42
1474
.93.
783.
490.
313.
800.
020.
02D
ucer
211
:42
1474
.94.
023.
690.
314.
00�0
.03
0.03
Duc
er 3
11:4
214
74.9
4.24
3.96
0.31
4.27
0.04
0.04
Duc
er 4
11:4
214
74.9
4.54
4.18
0.32
4.50
�0.0
50.
05D
ucer
511
:42
1474
.94.
724.
450.
324.
770.
050.
0510
/22/
13D
ucer
113
:28
1464
.12.
682.
440.
302.
740.
060.
06D
ucer
213
:28
1464
.12.
712.
440.
322.
760.
050.
05D
ucer
313
:28
1464
.12.
712.
410.
322.
730.
020.
02D
ucer
413
:28
1464
.12.
742.
410.
322.
73�0
.02
0.02
Duc
er 5
13:2
814
64.1
2.71
2.41
0.33
2.74
0.03
0.03

Ana
cost
ia R
iver
Bat
hym
etric
Sur
vey
2013
A
ppen
dix
D
Dis
trict
Dep
artm
ent o
f the
Env
ironm
ent
Page
D-5
Da
teti
me
'
Sp
ee
d o
f S
ou
nd
(f
t/s)
Ba
r D
ep
th
(m)
Me
as.
D
ep
th (
m)
So
na
r D
raft
(m
)C
orr
. D
ep
thD
iff.
AB
S(D
iff.
)N
ote
s
10/2
3/13
Duc
er 1
12:0
414
60.6
2.04
1.80
0.28
2.08
0.04
0.04
Duc
er 2
12:0
414
60.6
2.07
1.80
0.29
2.09
0.02
0.02
Duc
er 3
12:0
414
60.6
2.07
1.74
0.29
2.03
�0.0
50.
05D
ucer
412
:04
1460
.62.
041.
770.
322.
090.
050.
05D
ucer
512
:04
1460
.62.
041.
740.
352.
090.
050.
0510
/24/
13D
ucer
112
:16
1452
.11.
831.
490.
371.
860.
030.
03D
ucer
212
:16
1452
.11.
861.
520.
381.
900.
040.
04D
ucer
312
:16
1452
.11.
861.
550.
321.
870.
020.
02D
ucer
412
:16
1452
.11.
831.
580.
291.
870.
050.
05D
ucer
512
:16
1452
.11.
831.
580.
291.
870.
050.
0510
/25/
13D
ucer
113
:25
1444
.11.
861.
620.
271.
890.
030.
03D
ucer
213
:25
1444
.11.
891.
620.
301.
920.
030.
03D
ucer
313
:25
1444
.11.
891.
580.
321.
900.
020.
02D
ucer
413
:25
1444
.11.
891.
550.
361.
910.
020.
02D
ucer
513
:25
1444
.11.
861.
520.
381.
900.
040.
0410
/27/
13D
ucer
112
:34
1449
.01.
921.
710.
271.
980.
060.
06D
ucer
212
:34
1449
.01.
951.
700.
291.
990.
040.
04D
ucer
312
:34
1449
.01.
951.
680.
311.
990.
040.
04D
ucer
412
:34
1449
.01.
951.
640.
341.
980.
020.
02D
ucer
512
:34
1449
.01.
951.
610.
371.
980.
030.
03

Ana
cost
ia R
iver
Bat
hym
etric
Sur
vey
2013
A
ppen
dix
D
Dis
trict
Dep
artm
ent o
f the
Env
ironm
ent
Page
D-6
Da
teti
me
'
Sp
ee
d o
f S
ou
nd
(f
t/s)
Ba
r D
ep
th
(m)
Me
as.
D
ep
th (
m)
So
na
r D
raft
(m
)C
orr
. D
ep
thD
iff.
AB
S(D
iff.
)N
ote
s
10/2
8/13
Duc
er 1
11:5
614
50.8
1.95
1.71
0.26
1.97
0.02
0.02
Duc
er 2
11:5
614
50.8
1.98
1.71
0.29
2.00
0.02
0.02
Duc
er 3
11:5
614
50.8
1.95
1.67
0.30
1.97
0.02
0.02
Duc
er 4
11:5
614
50.8
1.95
1.64
0.34
1.98
0.02
0.02
Duc
er 5
11:5
614
50.8
1.95
1.60
0.39
1.99
0.04
0.04
10/2
9/13
Duc
er 1
13:0
614
51.5
2.01
1.77
0.26
2.03
0.02
0.02
Duc
er 2
13:0
614
51.5
2.04
1.77
0.29
2.06
0.02
0.02

Ana
cost
ia R
iver
Bat
hym
etric
Sur
vey
2013
A
ppen
dix
D
Dis
trict
Dep
artm
ent o
f the
Env
ironm
ent
Page
D-7
Pro
ject
Avg
.0.
001
Pro
ject
Std
v0.
040
Pro
ject
Min
-0.0
67P
roje
ct M
ax
0.06
2
Da
teT
ime
Un
it
Le
ica
Ro
ver
Wa
terl
ine
H
t.(w
/ge
oid
)-H
YP
AC
K
Tid
e c
orr
INS
Dra
ftC
orr
. T
ide
(N
o P
itch
)D
iff
(no
pit
ch)
AB
S(D
iff)
9/25
/201
311
:47
Hys
wee
p�0
.162
1.34
1�1
.450
�0.1
09�0
.054
0.05
4Li
eca
�0.1
621.
225
�1.4
50�0
.225
0.06
20.
062
9/26
/201
310
:45
Hys
wee
p�0
.111
1.39
6�1
.440
�0.0
44�0
.067
0.06
7Li
eca
�0.1
111.
286
�1.4
40�0
.154
0.04
30.
043
9/27
/201
310
:45
Liec
a0.
054
1.57
9�1
.481
0.09
8�0
.045
0.04
59/
28/2
013
12:1
9H
ysw
eep
0.04
51.
558
�1.4
800.
078
�0.0
330.
033
Liec
a0.
045
1.57
3�1
.480
0.09
3�0
.048
0.04
89/
30/2
013
11:0
5H
ysw
eep
0.55
21.
981
�1.4
800.
501
0.05
00.
050
Liec
a0.
552
1.99
3�1
.480
0.51
40.
038
0.03
810
/1/2
013
11:2
8H
ysw
eep
0.62
72.
012
�1.4
300.
582
0.04
50.
045
Liec
a0.
627
2.01
2�1
.430
0.58
20.
045
0.04
510
/2/2
013
11:1
0H
ysw
eep
0.65
42.
088
�1.4
400.
648
0.00
60.
006
Liec
a0.
654
2.10
3�1
.440
0.66
3�0
.009
0.00
910
/3/2
013
11:1
3H
ysw
eep
0.68
02.
164
�1.4
600.
704
�0.0
240.
024
Liec
a0.
680
2.16
4�1
.460
0.70
4�0
.024
0.02
4
Dai
ly W
ater
Lev
el C
hec
k
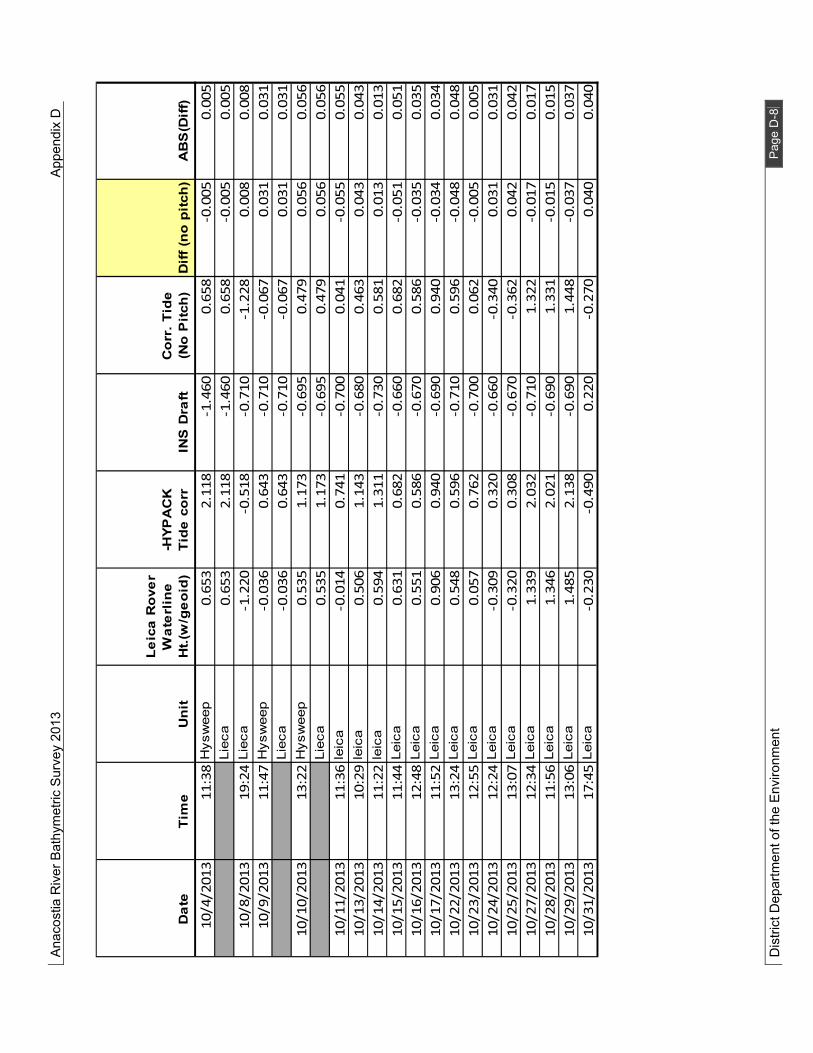
Ana
cost
ia R
iver
Bat
hym
etric
Sur
vey
2013
A
ppen
dix
D
Dis
trict
Dep
artm
ent o
f the
Env
ironm
ent
Page
D-8
Da
teT
ime
Un
it
Le
ica
Ro
ver
Wa
terl
ine
H
t.(w
/ge
oid
)-H
YP
AC
K
Tid
e c
orr
INS
Dra
ftC
orr
. T
ide
(N
o P
itch
)D
iff
(no
pit
ch)
AB
S(D
iff)
10/4
/201
311
:38
Hys
wee
p0.
653
2.11
8�1
.460
0.65
8�0
.005
0.00
5Li
eca
0.65
32.
118
�1.4
600.
658
�0.0
050.
005
10/8
/201
319
:24
Liec
a�1
.220
�0.5
18�0
.710
�1.2
280.
008
0.00
810
/9/2
013
11:4
7H
ysw
eep
�0.0
360.
643
�0.7
10�0
.067
0.03
10.
031
Liec
a�0
.036
0.64
3�0
.710
�0.0
670.
031
0.03
110
/10/
2013
13:2
2H
ysw
eep
0.53
51.
173
�0.6
950.
479
0.05
60.
056
Liec
a0.
535
1.17
3�0
.695
0.47
90.
056
0.05
610
/11/
2013
11:3
6le
ica
�0.0
140.
741
�0.7
000.
041
�0.0
550.
055
10/1
3/20
1310
:29
leic
a0.
506
1.14
3�0
.680
0.46
30.
043
0.04
310
/14/
2013
11:2
2le
ica
0.59
41.
311
�0.7
300.
581
0.01
30.
013
10/1
5/20
1311
:44
Leic
a0.
631
0.68
2�0
.660
0.68
2�0
.051
0.05
110
/16/
2013
12:4
8Le
ica
0.55
10.
586
�0.6
700.
586
�0.0
350.
035
10/1
7/20
1311
:52
Leic
a0.
906
0.94
0�0
.690
0.94
0�0
.034
0.03
410
/22/
2013
13:2
4Le
ica
0.54
80.
596
�0.7
100.
596
�0.0
480.
048
10/2
3/20
1312
:55
Leic
a0.
057
0.76
2�0
.700
0.06
2�0
.005
0.00
510
/24/
2013
12:2
4Le
ica
�0.3
090.
320
�0.6
60�0
.340
0.03
10.
031
10/2
5/20
1313
:07
Leic
a�0
.320
0.30
8�0
.670
�0.3
620.
042
0.04
210
/27/
2013
12:3
4Le
ica
1.33
92.
032
�0.7
101.
322
�0.0
170.
017
10/2
8/20
1311
:56
Leic
a1.
346
2.02
1�0
.690
1.33
1�0
.015
0.01
510
/29/
2013
13:0
6Le
ica
1.48
52.
138
�0.6
901.
448
�0.0
370.
037
10/3
1/20
1317
:45
Leic
a�0
.230
�0.4
900.
220
�0.2
700.
040
0.04
0

Anacostia River Bathymetric Survey 2013 Appendix E
District Department of the Environment
Appendix E
Surface to Crossline Comparison Statistics
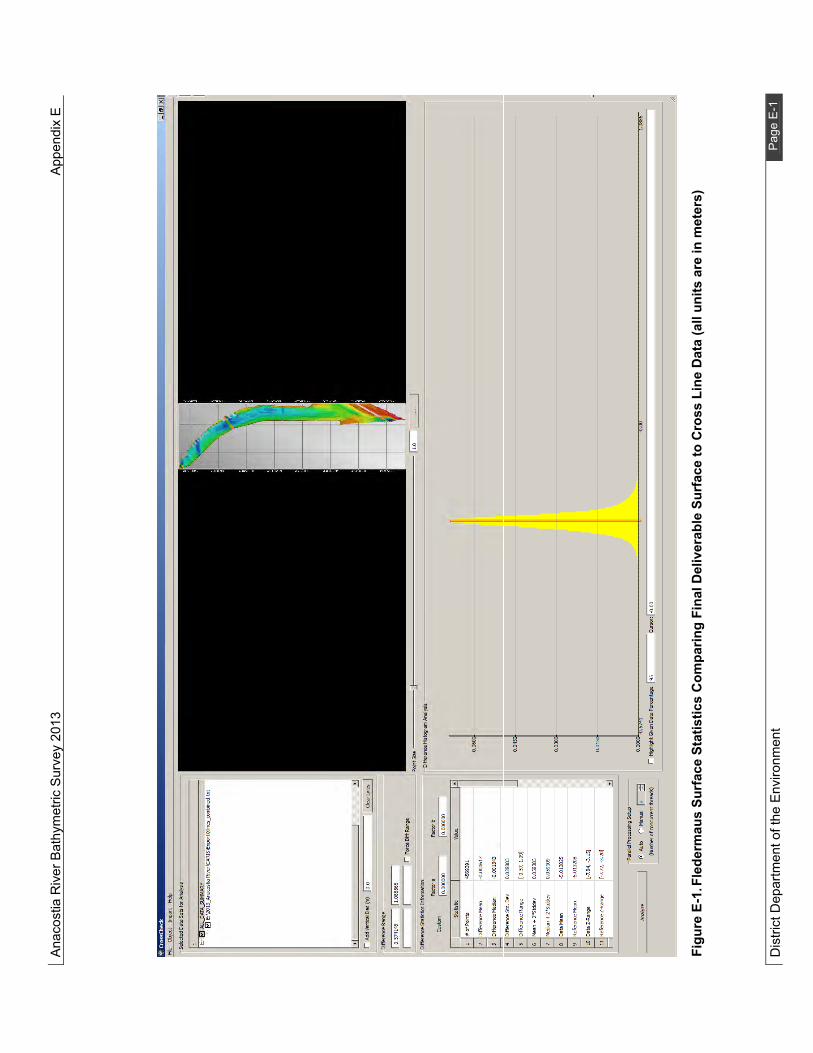
Ana
cost
ia R
iver
Bat
hym
etric
Sur
vey
2013
A
ppen
dix
E
Dis
trict
Dep
artm
ent o
f the
Env
ironm
ent
Page
E-1
�
Figu
re E
-1. F
lede
rmau
s Su
rfac
e St
atis
tics
Com
parin
g Fi
nal D
eliv
erab
le S
urfa
ce to
Cro
ss L
ine
Dat
a (a
ll un
its a
re in
met
ers)
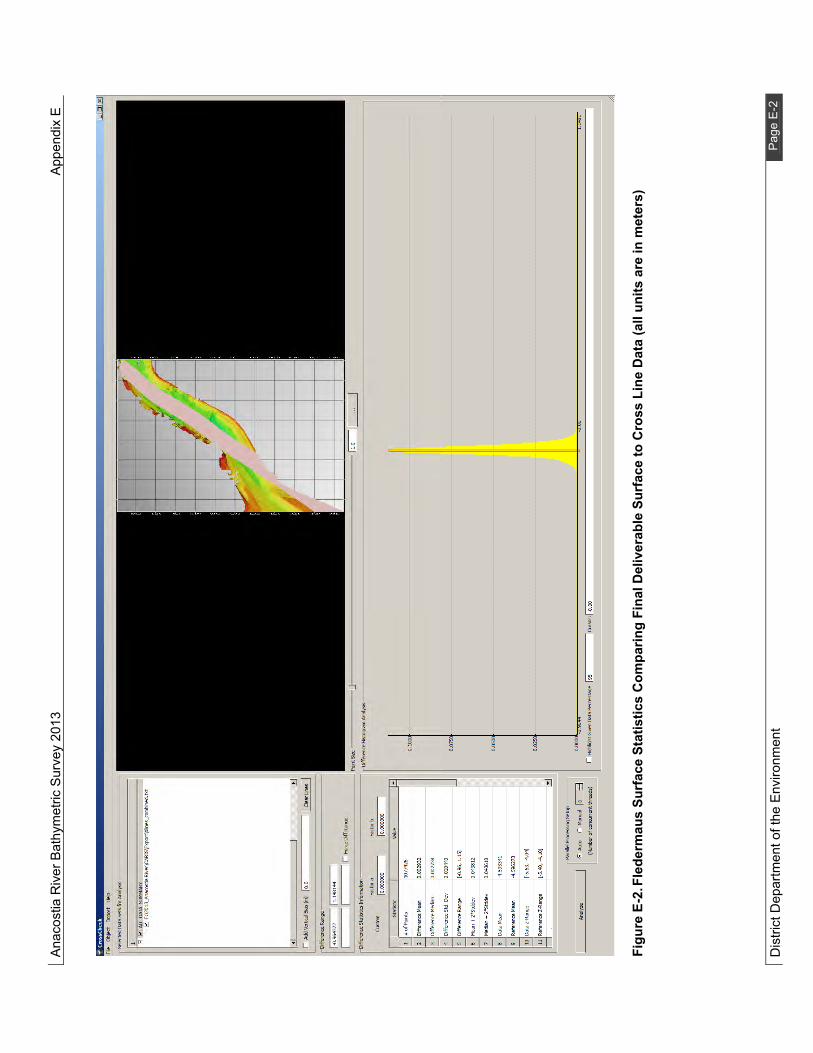
Ana
cost
ia R
iver
Bat
hym
etric
Sur
vey
2013
A
ppen
dix
E
Dis
trict
Dep
artm
ent o
f the
Env
ironm
ent
Page
E-2
Figu
re E
-2. F
lede
rmau
s Su
rfac
e St
atis
tics
Com
parin
g Fi
nal D
eliv
erab
le S
urfa
ce to
Cro
ss L
ine
Dat
a (a
ll un
its a
re in
met
ers)

Ana
cost
ia R
iver
Bat
hym
etric
Sur
vey
2013
A
ppen
dix
E
Dis
trict
Dep
artm
ent o
f the
Env
ironm
ent
Page
E-3
Figu
re E
-3. F
lede
rmau
s Su
rfac
e St
atis
tics
Com
parin
g Fi
nal D
eliv
erab
le S
urfa
ce to
Cro
ss L
ine
Dat
a (a
ll un
its a
re in
met
ers)

Ana
cost
ia R
iver
Bat
hym
etric
Sur
vey
2013
A
ppen
dix
E
Dis
trict
Dep
artm
ent o
f the
Env
ironm
ent
Page
E-4
Figu
re E
-4. F
lede
rmau
s Su
rfac
e St
atis
tics
Com
parin
g Fi
nal D
eliv
erab
le S
urfa
ce to
Cro
ss L
ine
Dat
a (a
ll un
its a
re in
met
ers)

Ana
cost
ia R
iver
Bat
hym
etric
Sur
vey
2013
A
ppen
dix
E
Dis
trict
Dep
artm
ent o
f the
Env
ironm
ent
Page
E-5
Figu
re E
-5. F
lede
rmau
s Su
rfac
e St
atis
tics
Com
parin
g Fi
nal D
eliv
erab
le S
urfa
ce to
Cro
ss L
ine
Dat
a (a
ll un
its a
re in
met
ers)

Ana
cost
ia R
iver
Bat
hym
etric
Sur
vey
2013
A
ppen
dix
E
Dis
trict
Dep
artm
ent o
f the
Env
ironm
ent
Page
E-6
Figu
re E
-6. F
lede
rmau
s Su
rfac
e St
atis
tics
Com
parin
g Fi
nal D
eliv
erab
le S
urfa
ce to
Cro
ss L
ine
Dat
a (a
ll un
its a
re in
met
ers)

Ana
cost
ia R
iver
Bat
hym
etric
Sur
vey
2013
A
ppen
dix
E
Dis
trict
Dep
artm
ent o
f the
Env
ironm
ent
Page
E-7
Figu
re E
-7. F
lede
rmau
s Su
rfac
e St
atis
tics
Com
parin
g Fi
nal D
eliv
erab
le S
urfa
ce to
Cro
ss L
ine
Dat
a (a
ll un
its a
re in
met
ers)

Ana
cost
ia R
iver
Bat
hym
etric
Sur
vey
2013
A
ppen
dix
E
Dis
trict
Dep
artm
ent o
f the
Env
ironm
ent
Page
E-8
Figu
re E
-8. F
lede
rmau
s Su
rfac
e St
atis
tics
Com
parin
g M
BE
data
to S
BE
data
with
in o
verla
ppin
g ar
eas
(all
units
are
in m
eter
s)
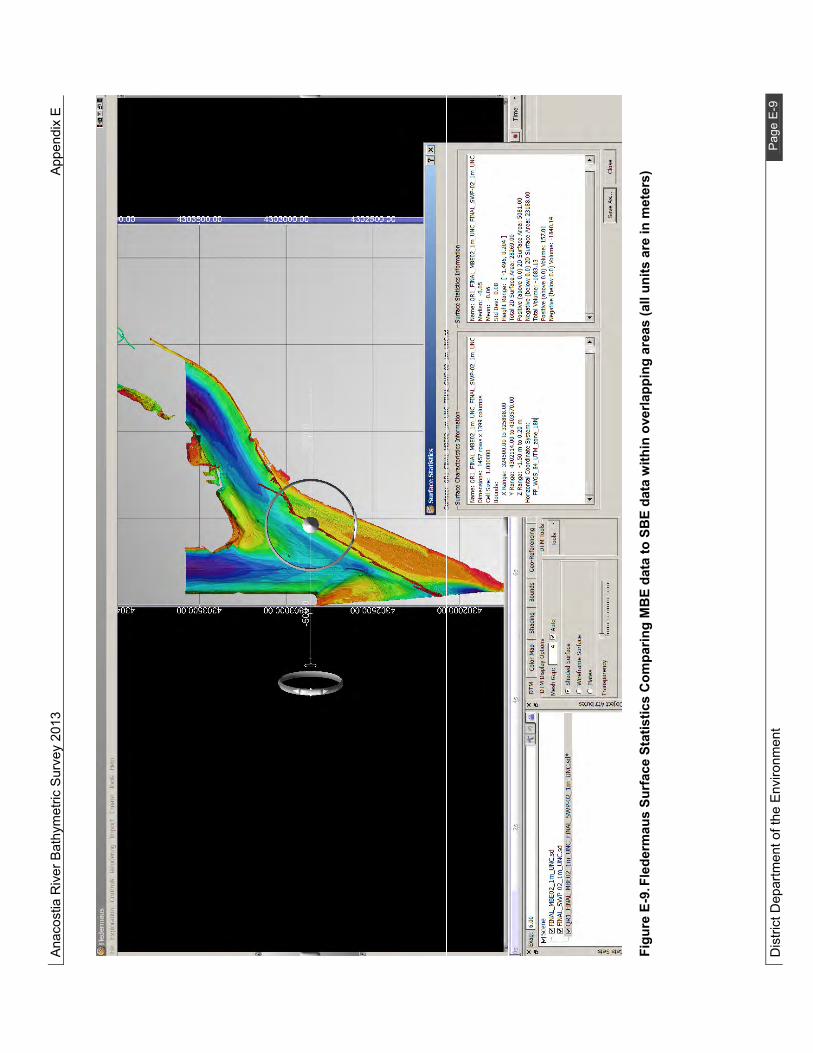
Ana
cost
ia R
iver
Bat
hym
etric
Sur
vey
2013
A
ppen
dix
E
Dis
trict
Dep
artm
ent o
f the
Env
ironm
ent
Page
E-9
Figu
re E
-9. F
lede
rmau
s Su
rfac
e St
atis
tics
Com
parin
g M
BE
data
to S
BE
data
with
in o
verla
ppin
g ar
eas
(all
units
are
in m
eter
s)

Anacostia River Bathymetric Survey 2013 Appendix F
District Department of the Environment
Appendix F
Electronic Deliverables (submitted electronically)
Gridded ASCII Dataset

Remedial Investigation Work Plan Anacostia River Sediments Project
APPENDIX B
JANUARY 8, 2014 GEOMORPHIC ANALYSIS TECHNICAL MEMORANDUM

TECHNICAL MEMORANDUM
Appendix B Page 1 of 2
Date: January 8, 2014
To: File From: Dave Richardson, Brad Schrotenboer, and Mark Shupe Subject: Anacostia River Sediment Project Geomorphic Analysis
The purpose of this memorandum is to provide the results of a geomorphic analysis performed based on the results of the bathymetric survey of the tidal Anacostia River performed by Tetra Tech, Inc. (Tetra Tech) between September 20 and October 30, 2013. Bathymetric data provides a basis for understanding patterns of deposition and erosion in the river and was used to prepare a contour map of the top of the sediment surface in and around the study area for the Anacostia River Sediment Project. Results of the bathymetric survey are summarized in the Tetra Tech December 9, 2013 Anacostia River Bathymetric Survey 2013 Technical Memorandum (Technical Memorandum), which is provided as Appendix A of the Anacostia River Remedial Investigation Work Plan. Bathymetric Survey Methodology and Results The survey was performed using high-resolution multibeam echosounding (MBE), multi-channel sweep and single beam echosounding (SBE) equipment. It included the entire study area (Figure 1.1 of the Work Plan), except portions with insufficient water depth for the minimum-draft survey vessel (an 18-foot jet boat). Low to no water conditions prohibited surveying the upper portion of Kingman Lake and the main channel of the Anacostia River north of Bladensburg Marina. Maps showing the variation of river bottom elevation throughout the study area are included in the Technical Memorandum. In summary, bottom elevations in the Washington Channel typically range from -3.5 to approximately -9 feet (MSL). Elevations of the river bottom below the 11th Street Bridge crossing are slightly greater (ranging from -0.5 to -7.0 feet) than in the Washington Channel. From the 11th Street Bridge up river to the Bladensburg Marina, the bottom elevation increases, ranging from +0.5 to -3.5 feet. North of the foot bridges that cross Kingman Lake between the Benning Road and East Capitol Street bridges, Kingman Lake is accessible by boat only during extreme high tide events. Overall, the elevations in the accessible portion of Kingman Lake ranged from less than +0.5 feet to approximately -3.5 feet and were typically between -0.5 and -1.5 feet.

Appendix B Page 2 of 2
Geomorphic Surface Mapping Geomorphic surface mapping describes the depositional pattern in a water body using the sediment bed elevations provided by bathymetric mapping. The differences in elevation define the thalweg, point bars, scour holes, transverse bars, outfall deposits, and other features. The mapping can also provide insight into the effects of anthropogenic features on the sediment bed. The purpose of the geomorphic surface mapping is to understand the depositional pattern and provide sediment sampling locations selected to confirm or adjust the geomorphic surface boundaries. Contaminants of concern will be deposited with fine grained sediment or in the sand fraction based on their fate and transport characteristics. The geomorphic surface mapping allows a focused sampling strategy based on contaminant fate and transport. The geomorphic surface mapping was based on the September – October 2013 bathymetric field survey (noted above) as well as bathymetry derivatives (primarily contours, slope, and aspect). The river was mapped into distinct geomorphic surfaces. Boundaries were based on changes in aspect, slope, bed roughness/character, and other subtle differences that define the depositional and erosional pattern. The thalweg, the deepest part of the river, was also delineated to assist with the mapping process. After the geomorphic surface mapping, a review of the historic sediment sample concentration data was completed to determine the broad patterns of deposition and erosion and the relationship to historic contaminant distribution. After comparing the geomorphic mapping and the thalweg location with the historic data, the pattern that emerged was one in which higher contaminant concentrations tended to be found near the thalweg of the channel, as opposed to along the edges of the channel. This deposition pattern appeared to be slightly stronger for poly-chlorinated biphenyl (PCB) data than for polycyclic aromatic hydrocarbon (PAH) data, suggesting that contaminant deposition in the tidal river is similar to an impounded body of water (lake or pond), as opposed to the deposition pattern typical for a higher-gradient meandering river. The deposition pattern appears to result from the low channel gradient, slow water velocity, and tidal effects. Sample Location Selection The initial (pre-bathymetric survey) sample locations defined in the draft Work Plan (dated January 29, 2014 and posted for public comment) were adjusted based on the geomorphic mapping and the broad patterns of contaminant deposition identified using historic sample concentration data. Sample locations were adjusted to provide sufficient characterization of the most important geomorphic zones of the river, the depositional areas. Proposed sample locations were removed if an area was sufficiently characterized by historic and/or other proposed sample locations. Proposed sample locations selected for human health characterization (pedestrian access to the river) were not adjusted. Verification locations were generally not adjusted, but the distance to the nearest historic sample (2000 or later) was noted. Outfall locations were generally not adjusted. The final sample layout maintains the original number of sample locations while adjusting a number of them to provide
Appendix B Page 3 of 2
characterization of the geomorphic environments in the river. For each proposed sample location that was moved, removed, or added a rationale has been provided. If necessary (for moved locations), the description of the location was updated. These changes are reflected on Table 1, Figure 1, and Figure 2 of this memorandum, and the changes were incorporated into the final versions of the Work Plan, Quality Assurance Project Plan (QAPP) and the Field Sampling Plan (FSP).

!(
!(
!(
!(
!(
!(
!(
!(
!(
!(
!(
!(
!("
!(
!(
!(!(
"
!(!(
!(
!(
!(
!(!(
!(
!(
!(
!(
"
!(
!(
!(
" !(
!(
"
!(
!(
!(
!(
!(
!(
!(
!(
"
"
!(
!("
!(
!( !(
""
!(
!(
"
!(!(
!(!(
!(!(")
!(")
")
")
")
")
")
")
")
")
")
")
!(
!(
")")
!(!(
!(!(
!(
!(!(
!(
!(
!(!(
!(
!(
")
")
!( !(
!(!(
!(
!(
!(
!(
")
!(
")")
!(!(
!(!(
!(
!(!(
!(!(
!(
!(
!(
!(
!(
!(!(
!(
!(!(
!(!(!(
!(!(!(
!(
!(
!(
!(
!(
!(
!(
!(
!(
!(
!(
!(
!(!(!(
!(
!( !(
!(
!(
")
")
")
")
")
")
")
")
")
")
!(")
")
")
")
")
")
")
!(
")
!(")
!(!(
!(
!(
")!(")
")
")
")
")
")
")
!(
")
")
")
!(
!(")
!(
")!(
#0
#0
#0
#0
#0
#0
#0
#0
#0
#0
PEPCO
Poplar Point
Kenilworth Park Landfill North
Washington Navy Yard
Southeast Federal Center
Kenilworth ParkLandfill South
Washington Gas
CSX
CSX
R6-8
R6-9
R1-9
R1-8
R1-7
WC-9
WC-8
WC-7
WC-6
WC-4
R1-3
R1-2
R1-1WC-3
WC-2
R2-2
R2-3
KL-1
KL-2
KL-3
KL-5KL-6
KL-7
KL-9
KL-8
R1-4
R2-1
R3-1R3-2
R3-3R3-4
R4-1
R4-2
R4-3
R5-1
R5-2
R6-2R6-3
R6-4R6-5
R7-2R7-1
R7-4 R7-3
R7-5
R7-7 R7-6
R7-8R7-9
R3-6
R3-7R3-8
R2-6
R2-7 R2-8
R2-9
R6-6
R6-7
R5-4
R5-5
R4-4
R4-5
R1-5
R1-6
R6-10R6-11
R6-17
R6-15
R6-13
R3-14
R3-12
R3-16
R3-11
R7-19
WC-11
WC-10
WC-1A
R7-11
R7-12
R7-13
R7-14R7-15
KL-11KL-12
KL-13
KL-16
R2-11
R7-17
WC-5
R2-4
KL-4
R3-5
R5-3
R3-9
R6-16
R6-12
R6-14
R3-13
R3-15
R7-18
R7-20
R7-21
R3-10
R2-15R2-5
KL-10
R6-1A
R7-10
KL-14
KL-15
KL-17KL-20
KL-22
KL-23
R2-10
R2-12R2-13
KL-18KL-19
KL-21
KL-24
R7-16
R2-14
KL-25
T-21-B
T-22-B
T-18-B
T-27-B
T-29-B
T-42-B
T-45-B
T-16-B
T-75-B
T-79-B
Legend#0 BENTHIC TISSUE SAMPLING LOCATION
") PROPOSED SHALLOW SEDIMENT SAMPLE
!( PROPOSED SHALLOW/DEEP SEDIMENT SAMPLE
!( Moved Existing Location (43)
" Remove Location (11)
!( New Location (11)
CLEANUP SITE BOUNDARY
SEDIMENT STUDY AREA
AWTA AOC
WASHINGTON DC BOUNDARY
®0 1,500 3,000
FeetSOURCE: MODIFIED FROM CH2MHILL, 2011, ANDDCGIS, 2012.
FIGURE 5.1PROPOSED SEDIMENTSAMPLING LOCATIONS
Dat
e Sa
ved:
12/
17/2
013
4:53
:13
PM U
ser:
joel
.pet
ers
Pat
h: S
:\CA
DD
\S\2
592\
mxd
\Wor
kPla
n\R
EV
ISE
D_B
ATH
YMET
RIC
_Fig
ure_
05_0
1_A
naco
stia
_11x
17_P
RO
PO
SE
D_S
AM
PLI
NG
_LO
CAT
ION
S_S
ED
IMEN
T.m
xd
ANACOSTIA RIVER SEDIMENTSREMEDIAL INVESTIGATION WORKPLAN
DRAFTR1-5
Italics underlined sample nameindicates sample is for humanhealth-pedestrian access to riverbank.
Summary of geomorphicanalysis adjustments to theinitial sample locationsdefined in the draft Work Plan(dated January 29, 2014 ).See Table 1 for additionaldetail regarding theadjustments to specificsamples.
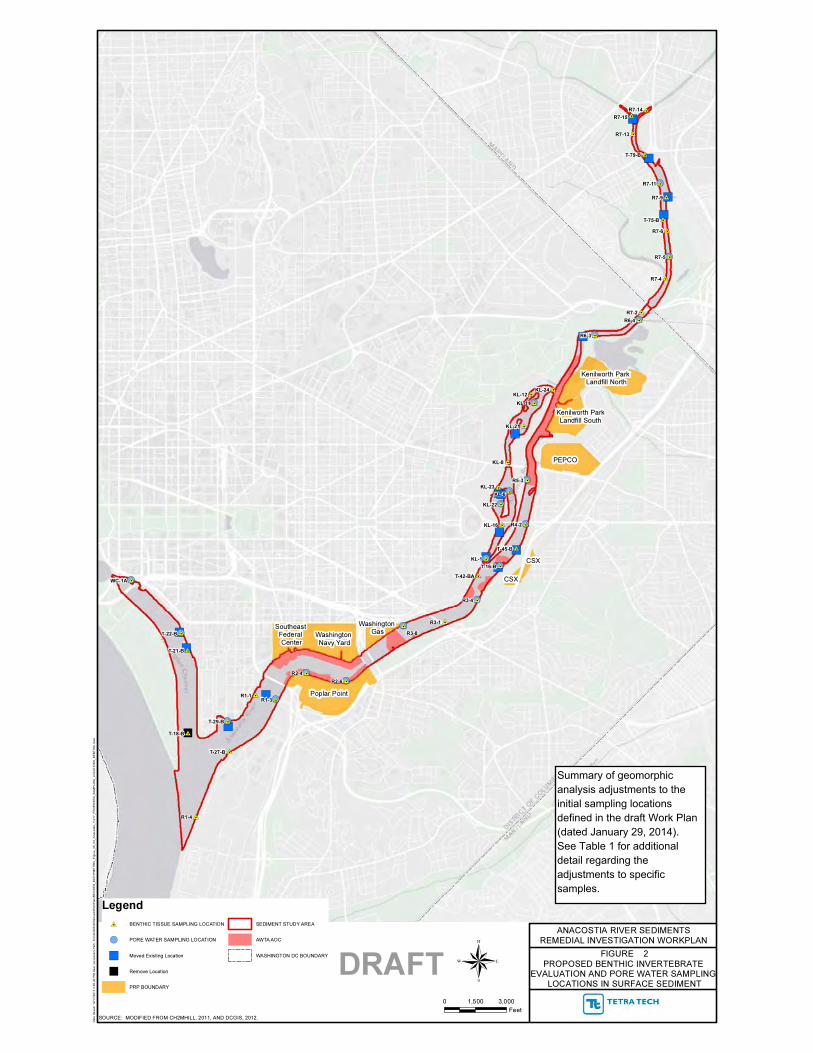
��
����
��
��
��
��
��
��
��
�
��
��
��
��
��
��
��
��
��
��
��
��
��
��
��
��
��
��
��
��
��
��
��
��
��
��
��
��
��
��
��
��
��
��
����
��
��
��
��
��
��
��
��
��
��
��
��
��
��
��
��
��
��
����
��
��
��
��
��
��
��
��
��
��
��
�����
���� ����
������� � ��������� �� �
������ ����� ��
��� ��� �������� �
������� � ��������� ��� �
������ �� �
��!
��!
��������
����
���
��
���
����
����
����
����
����
���
���
� ��
� ��
� ��
� �
� ��
����
���
�����
� ���
� ���
� ���
� ���
����
����
���
����
����
����
����
�� ���
�� ���
������
������
��� ��
������
������
������
�����
�������
�����
�� "��#$%� #%��&� �'(��%� ���'#%��
�� ��)� �'#�) �'(��%� ���'#%��
�� (���� �*�� ��� ��+ ���
� )�,��� ��+ ���
�)� "�&�-')�
��-%(��# �#&-� ')�'
'�#''��
�'�$%� #�� -� "�&�-')�
�. /01.. 20...
���
��&)��3 (�-%�%�- �)�( �$4($%��0 4.//0 '�- -� %�0 4./45
�% &)� 154
�)�����- "��#$%� %�6�)#�")'#��6'�&'#%�� '�- ��)� �'#�) �'(��%�
���'#%��� %� �&)�'�� ��-%(��#
- �����3/47/874./2939139.�(&��3:���5�� ��� �3�3;�'--;�;41<4;,*�;������;)�6%��-="'#$�(�#)%�=�����=.1=.4='�+�� �=//*/8=�)�����-=�'(��%� =���'#%���="��#$%�5,*�
'�'���#%' )%6�) ��-%(��#�)�(�-%'� %�6��#% '#%�� ��)���'�
�����
Summary of geomorphicanalysis adjustments to theinitial sampling locationsdefined in the draft Work Plan(dated January 29, 2014).See Table 1 for additionaldetail regarding theadjustments to specificsamples.

TABL
E 1
Mod
ifica
tions
to P
ropo
sed
Sedi
men
t Sam
plin
g Lo
catio
ns a
s Def
ined
in th
e W
ork
Plan
(Jan
uary
29,
201
4 v
ersi
on) P
age
1 of
5
Fina
l Sam
ple
Loca
tion
Tabl
e (W
P 5.
1) 2
-6-1
4.xl
sx6/
9/20
14
New
Nam
eN
ame
Reac
hPo
re
Wat
erDe
ep
Sedi
men
tRa
tiona
le
Prox
imat
e to
Ex
istin
gSa
mpl
eLo
catio
n
Not
es, I
nclu
ding
Rat
iona
le fo
r Mov
ing,
Rem
ovin
g, o
r Add
ing
Prop
osed
Sam
ple
Loca
tions
:
I
n m
ain
tabl
e re
d hi
ghlig
htin
g sig
nifie
s re
mov
ed lo
catio
ns, g
reen
hig
hlig
ht id
entif
ies a
dded
loca
tions
, yel
low
hig
hlig
ht m
eans
upd
ated
cel
l val
ue, a
nd b
lue
text
indi
cate
s the
loca
tion
was
m
oved
.
WC-
09W
C-1A
Was
hing
ton
Chan
nel
XX
Out
fall
NO
utfa
ll F-
477-
703
Nor
th o
f I-3
95 B
ridge
WC-
07W
C-2
Was
hing
ton
Chan
nel
XSp
atia
l Cov
erag
eN
Cent
er o
f Was
hing
ton
Chan
nel,
mid
way
bet
wee
n W
C-1
and
exist
ing
sam
ple
poin
tM
oved
nor
thw
est t
o ch
arac
teriz
e br
oad,
shal
low
cha
nnel
slop
e w
est o
f tha
lweg
.
WC-
3W
ashi
ngto
n Ch
anne
lX
Spat
ial C
over
age
NCe
nter
of W
ashi
ngto
n Ch
anne
l, m
idw
ay b
etw
een
two
exist
ing
sam
ple
poin
tsAl
read
y ha
ve g
ood
cove
rage
from
hist
oric
and
pro
pose
d sa
mpl
e lo
catio
ns in
the
sam
e ge
omor
phic
are
a.
WC-
11W
C-4
Was
hing
ton
Chan
nel
Out
fall
NO
utfa
ll F-
290-
057
Nor
th o
f I-3
95 B
ridge
Type
cha
nged
to o
utfa
ll. W
as o
rigin
ally
list
ed a
s 'Sp
atia
l Cov
erag
e' b
ut th
is di
d no
t mat
ch lo
catio
n de
scrip
tion.
WC-
10W
C-5
Was
hing
ton
Chan
nel
Spat
ial C
over
age
NM
id-c
hann
el o
ffsho
re fr
om W
C-4
and
WC-
1AM
oved
nor
thw
est t
o be
in c
ente
r of t
halw
eg d
epre
ssio
n.
WC-
08W
C-6
Was
hing
ton
Chan
nel
Spat
ial C
over
age
NM
id-c
hann
el o
ffsho
re fr
om O
utfa
ll F-
518-
460
Mov
ed w
est t
o be
in th
alw
eg a
nd c
ente
r of g
eom
orph
ic p
olyg
on.
WC-
7W
ashi
ngto
n Ch
anne
lSp
atia
l Cov
erag
eN
Mid
-cha
nnel
offs
hore
from
mar
ina
and
Out
fall
F-89
2-36
1Hi
stor
ic a
nd p
ropo
sed
loca
tions
alre
ady
char
acte
rizin
g th
e sa
me
geom
orph
ic a
rea.
WC-
8W
ashi
ngto
n Ch
anne
lSp
atia
l Cov
erag
eN
Mid
-cha
nnel
offs
hore
from
Out
falls
F-9
69-9
34 &
F-0
18-8
09Hi
stor
ic a
nd p
ropo
sed
loca
tions
alre
ady
char
acte
rizin
g th
e sa
me
geom
orph
ic a
rea.
WC-
04W
C-9
Was
hing
ton
Chan
nel
Out
fall
NO
utfa
ll F-
073-
094
WC-
02N
ew L
ocat
ion
Was
hing
ton
Chan
nel
Spat
ial C
over
age
Wes
t sid
e of
Was
hing
ton
Chan
nel,
on sl
ope
betw
een
bank
an
d th
alw
e gAd
ded
to c
hara
cter
ize
wes
t cha
nnel
slop
e in
Was
hing
ton
Chan
nel;
in tr
anse
ct w
ith W
C-10
WC-
03W
C-10
Was
hing
ton
Chan
nel
Spat
ial C
over
age
NCe
nter
of W
ashi
ngto
n Ch
anne
l, m
idw
ay b
etw
een
two
exist
ing
sam
ple
poin
ts
R1-0
4N
ew L
ocat
ion
tol S
tree
t Brid
ge to
Mou
th o
f Riv
erSp
atia
l Cov
erag
eCo
nflu
ence
of W
ashi
ngto
n Ch
anne
l and
Ana
cost
ia R
iver
Adde
d to
cha
ract
eriz
e de
posit
iona
l are
a at
con
fluen
ce o
f Was
hing
ton
Chan
nel a
nd A
naco
stia
Riv
er
WC-
01W
C-11
Was
hing
ton
Chan
nel
XSp
atia
l Cov
erag
eN
Mou
th o
f Was
hing
ton
Chan
nel
WC-
06T-
22-B
Was
hing
ton
Chan
nel
XSp
atia
l Cov
erag
eN
Adja
cent
to m
arin
a do
ckM
oved
slig
htly
nor
thw
est.
Pre
viou
s loc
atio
n m
ay b
e in
acce
ssib
le w
hen
boat
s are
doc
ked.
WC-
05T-
21-B
Was
hing
ton
Chan
nel
Spat
ial C
over
age
NAd
jace
nt to
mar
ina
dock
Mov
ed n
orth
to u
nsam
pled
geo
mor
phic
pol
ygon
, aw
ay fr
om g
eom
orph
ic p
olyg
on b
ound
ary.
T-18
-BW
ashi
ngto
n Ch
anne
lSp
atia
l Cov
erag
eN
Cent
er c
hann
el u
pstr
eam
from
mou
th o
f Was
hing
ton
Chan
nel
Alre
ady
have
goo
d co
vera
ge fr
om h
istor
ic a
nd p
ropo
sed
sam
ple
loca
tions
in th
e sa
me
geom
orph
ic a
rea.
R1-1
2R1
-1So
uth
Capi
tol S
tree
t Br
idge
to M
outh
of
Rive
rX
Out
fall
NW
est b
ank
near
F-0
93-5
44 c
over
age
of u
nsam
pled
por
tion
of
chan
nel
R1-1
1R1
-2So
uth
Capi
tol S
tree
t Br
idge
to M
outh
of
Rive
rX
Spat
ial C
over
age
NCe
nter
cha
nnel
, cov
erag
e of
uns
ampl
ed p
ortio
n of
cha
nnel
R1-1
0N
ew L
ocat
ion
tol S
tree
t Brid
ge to
Mou
th o
f Riv
erSp
atia
l Cov
erag
eSl
ope
nort
hwes
t of t
halw
eg b
etw
een
utili
ty c
orrid
ors
Adde
d to
cha
ract
eriz
e slo
ping
nor
thw
est b
ank
in u
nsam
pled
are
a
R1-1
3R1
-3So
uth
Capi
tol S
tree
t Br
idge
to M
outh
of
Rive
rX
XSp
atia
l Cov
erag
eN
Thal
weg
bet
wee
n ut
ility
cor
ridor
s, co
vera
ge o
f uns
ampl
ed
port
ion
of c
hann
elM
oved
nor
thw
est t
o pr
ovid
e co
vera
ge in
are
a be
twee
n ut
ility
cor
ridor
s (at
thal
weg
).
R1-0
2R1
-4So
uth
Capi
tol S
tree
t Br
idge
to M
outh
of
Rive
rX
Out
fall
NAd
jace
nt to
Out
fall
F-12
8-49
5
R1-0
3N
ew L
ocat
ion
tol S
tree
t Brid
ge to
Mou
th o
f Riv
erSp
atia
l Cov
erag
eO
ffsho
re n
ear c
onflu
ence
of W
ashi
ngto
n Ch
anne
l and
An
acos
tia R
iver
Adde
d to
cha
ract
eriz
e br
oad,
shal
low
dep
ositi
onal
are
a al
ong
sout
heas
t ban
k, n
ear c
onflu
ence
of W
ashi
ngto
n Ch
anne
l and
Ana
cost
ia R
iver
R1-0
9R1
-5So
uth
Capi
tol S
tree
t Br
idge
to M
outh
of
Rive
rSp
atia
l Cov
erag
eN
Char
acte
rizat
ion
for h
uman
hea
lth (p
edes
tria
n ac
cess
to
river
bank
)
R1-1
4R1
-6So
uth
Capi
tol S
tree
t Br
idge
to M
outh
of
Rive
rSp
atia
l Cov
erag
eN
Char
acte
rizat
ion
for h
uman
hea
lth (p
edes
tria
n ac
cess
to
river
bank
)
R1-0
7T-
29-B
Sout
h Ca
pito
l Str
eet
Brid
ge to
Mou
th o
f Ri
ver
XSp
atia
l Cov
erag
eN
Nea
r sou
th b
ank,
just
ups
trea
m fr
om c
onflu
ence
with
W
ashi
ngto
n Ch
anne
lM
oved
sout
h to
cha
ract
eriz
e un
sam
pled
pol
ygon
and
like
ly fl
ow p
ath
betw
een
outf
all a
nd m
ain
chan
nel.
R1-0
5T-
27-B
Sout
h Ca
pito
l Str
eet
Brid
ge to
Mou
th o
f Ri
ver
Out
fall
NN
orth
ban
d at
Out
fall
F-93
7-54
4Th
ere
is no
map
ped
outf
all n
ear t
his l
ocat
ion.
The
out
fall
liste
d is
on th
e op
posit
e ba
nk o
f the
rive
r.
R1-0
1R1
-7So
uth
Capi
tol S
tree
t Br
idge
to M
outh
of
Rive
rVe
rific
atio
nY
HPAH
hot
spot
at m
outh
of A
naco
stia
Riv
er31
ft fr
om 2
000
ANS/
USF
WS
Tria
d St
udy
sam
ple
loca
tion
R1-0
8R1
-8So
uth
Capi
tol S
tree
t Br
idge
to M
outh
of
Rive
rX
Verif
icat
ion
YHP
AH h
otsp
ot so
uthe
ast o
f R1-
534
ft fr
om 2
000
ANS/
USF
WS
Tria
d St
udy
sam
ple
loca
tion
R1-0
6R1
-9So
uth
Capi
tol S
tree
t Br
idge
to M
outh
of
Rive
rSp
atia
l Cov
erag
eN
Fort
McN
air M
arin
a
R2-0
1R2
-111
th S
tree
t Brid
ge to
So
uth
Capi
tol S
tree
t X
Verif
icat
ion
YO
verla
p w
ith y
ear 2
000
data
poi
nt; e
ast s
hore
line
at P
opla
r Po
int
61 ft
from
200
0 AN
S/U
SFW
S Tr
iad
Stud
y sa
mpl
e lo
catio
n

TABL
E 1
Mod
ifica
tions
to P
ropo
sed
Sedi
men
t Sam
plin
g Lo
catio
ns a
s Def
ined
in th
e W
ork
Plan
(Jan
uary
29,
201
4 v
ersi
on) P
age
1 of
5
Fina
l Sam
ple
Loca
tion
Tabl
e (W
P 5.
1) 2
-6-1
4.xl
sx6/
9/20
14
New
Nam
eN
ame
Reac
hPo
re
Wat
erD
eep
Sedi
men
tRa
tiona
le
Prox
imat
e to
Ex
istin
gSa
mpl
eLo
catio
n
Not
es, I
nclu
ding
Rat
iona
le fo
r Mov
ing,
Rem
ovin
g, o
r Add
ing
Prop
osed
Sam
ple
Loca
tions
:
In m
ain
tabl
e re
d hi
ghlig
htin
g sig
nifie
s rem
oved
loca
tions
, gre
en h
ighl
ight
iden
tifie
s add
ed lo
catio
ns,
yello
w h
ighl
ight
mea
ns u
pdat
ed c
ell v
alue
, and
blu
e te
xt in
dica
tes t
he lo
catio
n w
as m
oved
.
WC-
09W
C-1A
Was
hing
ton
Chan
nel
XX
Out
fall
NO
utfa
ll F-
477-
703
Nor
th o
f I-3
95 B
ridge
WC-
07W
C-2
Was
hing
ton
Chan
nel
XSp
atia
l Cov
erag
eN
Cent
er o
f Was
hing
ton
Chan
nel,
mid
way
bet
wee
n W
C-1
and
exist
ing
sam
ple
poin
tM
oved
nor
thw
est t
o ch
arac
teriz
e br
oad,
shal
low
cha
nnel
slop
e w
est o
f tha
lweg
.
WC-
3W
ashi
ngto
n Ch
anne
lX
Spat
ial C
over
age
NCe
nter
of W
ashi
ngto
n Ch
anne
l, m
idw
ay b
etw
een
two
exist
ing
sam
ple
poin
tsAl
read
y ha
ve g
ood
cove
rage
from
hist
oric
and
pro
pose
d sa
mpl
e lo
catio
ns in
the
sam
e ge
omor
phic
are
a.
WC-
11W
C-4
Was
hing
ton
Chan
nel
Out
fall
NO
utfa
ll F-
290-
057
Nor
th o
f I-3
95 B
ridge
Type
cha
nged
to o
utfa
ll. W
as o
rigin
ally
list
ed a
s 'Sp
atia
l Cov
erag
e' b
ut th
is di
d no
t mat
ch lo
catio
n de
scrip
tion.
WC-
10W
C-5
Was
hing
ton
Chan
nel
Spat
ial C
over
age
NM
id-c
hann
el o
ffsho
re fr
om W
C-4
and
WC-
1AM
oved
nor
thw
est t
o be
in c
ente
r of t
halw
eg d
epre
ssio
n.
WC-
08W
C-6
Was
hing
ton
Chan
nel
Spat
ial C
over
age
NM
id-c
hann
el o
ffsho
re fr
om O
utfa
ll F-
518-
460
Mov
ed w
est t
o be
in th
alw
eg a
nd c
ente
r of g
eom
orph
ic p
olyg
on.
WC-
7W
ashi
ngto
n Ch
anne
lSp
atia
l Cov
erag
eN
Mid
-cha
nnel
offs
hore
from
mar
ina
and
Out
fall
F-89
2-36
1Hi
stor
ic a
nd p
ropo
sed
loca
tions
alre
ady
char
acte
rizin
g th
e sa
me
geom
orph
ic a
rea.
WC-
8W
ashi
ngto
n Ch
anne
lSp
atia
l Cov
erag
eN
Mid
-cha
nnel
offs
hore
from
Out
falls
F-9
69-9
34 &
F-0
18-8
09Hi
stor
ic a
nd p
ropo
sed
loca
tions
alre
ady
char
acte
rizin
g th
e sa
me
geom
orph
ic a
rea.
WC-
04W
C-9
Was
hing
ton
Chan
nel
Out
fall
NO
utfa
ll F-
073-
094
WC-
02N
ew L
ocat
ion
Was
hing
ton
Chan
nel
Spat
ial C
over
age
Wes
t sid
e of
Was
hing
ton
Chan
nel,
on sl
ope
betw
een
bank
an
d th
alw
egAd
ded
to c
hara
cter
ize
wes
t cha
nnel
slop
e in
Was
hing
ton
Chan
nel;
in tr
anse
ct w
ith W
C-10
WC-
03W
C-10
Was
hing
ton
Chan
nel
Spat
ial C
over
age
NCe
nter
of W
ashi
ngto
n Ch
anne
l, m
idw
ay b
etw
een
two
exist
ing
sam
ple
poin
ts
R1-0
4N
ew L
ocat
ion
tol S
tree
t Brid
ge to
Mou
th o
f Riv
erSp
atia
l Cov
erag
eCo
nflu
ence
of W
ashi
ngto
n Ch
anne
l and
Ana
cost
ia R
iver
Adde
d to
cha
ract
eriz
e de
posit
iona
l are
a at
con
fluen
ce o
f Was
hing
ton
Chan
nel a
nd A
naco
stia
Riv
er
WC-
01W
C-11
Was
hing
ton
Chan
nel
XSp
atia
l Cov
erag
eN
Mou
th o
f Was
hing
ton
Chan
nel
WC-
06T-
22-B
Was
hing
ton
Chan
nel
XSp
atia
l Cov
erag
eN
Adja
cent
to m
arin
a do
ckM
oved
slig
htly
nor
thw
est.
Pre
viou
s loc
atio
n m
ay b
e in
acce
ssib
le w
hen
boat
s are
doc
ked.
WC-
05T-
21-B
Was
hing
ton
Chan
nel
Spat
ial C
over
age
NAd
jace
nt to
mar
ina
dock
Mov
ed n
orth
to u
nsam
pled
geo
mor
phic
pol
ygon
, aw
ay fr
om g
eom
orph
ic p
olyg
on b
ound
ary.
T-18
-BW
ashi
ngto
n Ch
anne
lSp
atia
l Cov
erag
eN
Cent
er c
hann
el u
pstr
eam
from
mou
th o
f Was
hing
ton
Chan
nel
Alre
ady
have
goo
d co
vera
ge fr
om h
istor
ic a
nd p
ropo
sed
sam
ple
loca
tions
in th
e sa
me
geom
orph
ic a
rea.
R1-1
2R1
-1So
uth
Capi
tol S
tree
t Br
idge
to M
outh
of
Rive
rX
Out
fall
NW
est b
ank
near
F-0
93-5
44 c
over
age
of u
nsam
pled
por
tion
of
chan
nel
R1-1
1R1
-2So
uth
Capi
tol S
tree
t Br
idge
to M
outh
of
Rive
rX
Spat
ial C
over
age
NCe
nter
cha
nnel
, cov
erag
e of
uns
ampl
ed p
ortio
n of
cha
nnel
R1-1
0N
ew L
ocat
ion
tol S
tree
t Brid
ge to
Mou
th o
f Riv
erSp
atia
l Cov
erag
eSl
ope
nort
hwes
t of t
halw
eg b
etw
een
utili
ty c
orrid
ors
Adde
d to
cha
ract
eriz
e slo
ping
nor
thw
est b
ank
in u
nsam
pled
are
a
R1-1
3R1
-3So
uth
Capi
tol S
tree
t Br
idge
to M
outh
of
Rive
rX
XSp
atia
l Cov
erag
eN
Thal
weg
bet
wee
n ut
ility
cor
ridor
s, c
over
age
of u
nsam
pled
po
rtio
n of
cha
nnel
Mov
ed n
orth
wes
t to
prov
ide
cove
rage
in a
rea
betw
een
utili
ty c
orrid
ors (
at th
alw
eg).
R1-0
2R1
-4So
uth
Capi
tol S
tree
t Br
idge
to M
outh
of
Rive
rX
Out
fall
NAd
jace
nt to
Out
fall
F-12
8-49
5
R1-0
3N
ew L
ocat
ion
tol S
tree
t Brid
ge to
Mou
th o
f Riv
erSp
atia
l Cov
erag
eO
ffsho
re n
ear c
onflu
ence
of W
ashi
ngto
n Ch
anne
l and
An
acos
tia R
iver
Adde
d to
cha
ract
eriz
e br
oad,
shal
low
dep
ositi
onal
are
a al
ong
sout
heas
t ban
k, n
ear c
onflu
ence
of
Was
hing
ton
Chan
nel a
nd A
naco
stia
Riv
er
R1-0
9R1
-5So
uth
Capi
tol S
tree
t Br
idge
to M
outh
of
Rive
rSp
atia
l Cov
erag
eN
Char
acte
rizat
ion
for h
uman
hea
lth (p
edes
tria
n ac
cess
to
river
bank
)
R1-1
4R1
-6So
uth
Capi
tol S
tree
t Br
idge
to M
outh
of
Rive
rSp
atia
l Cov
erag
eN
Char
acte
rizat
ion
for h
uman
hea
lth (p
edes
tria
n ac
cess
to
river
bank
)
R1-0
7T-
29-B
Sout
h Ca
pito
l Str
eet
Brid
ge to
Mou
th o
f Ri
ver
XSp
atia
l Cov
erag
eN
Nea
r sou
th b
ank,
just
ups
trea
m fr
om c
onflu
ence
with
W
ashi
ngto
n Ch
anne
lM
oved
sout
h to
cha
ract
eriz
e un
sam
pled
pol
ygon
and
like
ly fl
ow p
ath
betw
een
outf
all a
nd m
ain
chan
nel.
R1-0
5T-
27-B
Sout
h Ca
pito
l Str
eet
Brid
ge to
Mou
th o
f Ri
ver
Out
fall
NN
orth
ban
d at
Out
fall
F-93
7-54
4Th
ere
is no
map
ped
outf
all n
ear t
his l
ocat
ion.
The
out
fall
liste
d is
on th
e op
posit
e ba
nk o
f the
rive
r.

TABL
E 1
Mod
ifica
tions
to P
ropo
sed
Sedi
men
t Sam
plin
g Lo
catio
ns a
s Def
ined
in th
e W
ork
Plan
(Jan
uary
29,
201
4 v
ersi
on) P
age
2 of
5
Fina
l Sam
ple
Loca
tion
Tabl
e (W
P 5.
1) 2
-6-1
4.xl
sx6/
9/20
14
New
Nam
eN
ame
Reac
hPo
re
Wat
erD
eep
Sedi
men
tRa
tiona
le
Prox
imat
e to
Ex
istin
gSa
mpl
eLo
catio
n
Not
es, I
nclu
ding
Rat
iona
le fo
r Mov
ing,
Rem
ovin
g, o
r Add
ing
Prop
osed
Sam
ple
Loca
tions
:
In m
ain
tabl
e re
d hi
ghlig
htin
g sig
nifie
s rem
oved
loca
tions
, gre
en h
ighl
ight
iden
tifie
s add
ed lo
catio
ns,
yello
w h
ighl
ight
mea
ns u
pdat
ed c
ell v
alue
, and
blu
e te
xt in
dica
tes t
he lo
catio
n w
as m
oved
.
R1-0
1R1
-7So
uth
Capi
tol S
tree
t Br
idge
to M
outh
of
Rive
rVe
rific
atio
nY
HPAH
hot
spot
at m
outh
of A
naco
stia
Riv
er31
ft fr
om 2
000
ANS/
USF
WS
Tria
d St
udy
sam
ple
loca
tion
R1-0
8R1
-8So
uth
Capi
tol S
tree
t Br
idge
to M
outh
of
Rive
rX
Verif
icat
ion
YHP
AH h
otsp
ot so
uthe
ast o
f R1-
534
ft fr
om 2
000
ANS/
USF
WS
Tria
d St
udy
sam
ple
loca
tion
R1-0
6R1
-9So
uth
Capi
tol S
tree
t Br
idge
to M
outh
of
Rive
rSp
atia
l Cov
erag
eN
Fort
McN
air M
arin
a
R2-0
1R2
-111
th S
tree
t Brid
ge to
So
uth
Capi
tol S
tree
t Br
idge
XVe
rific
atio
nY
Ove
rlap
with
yea
r 200
0 da
ta p
oint
; eas
t sho
relin
e at
Pop
lar
Poin
t61
ft fr
om 2
000
ANS/
USF
WS
Tria
d St
udy
sam
ple
loca
tion
R2-0
2R2
-211
th S
tree
t Brid
ge to
So
uth
Capi
tol S
tree
t Br
idge
XSp
atia
l Cov
erag
eN
East
shor
elin
e at
Pop
lar P
oint
R2-0
3R2
-311
th S
tree
t Brid
ge to
So
uth
Capi
tol S
tree
t Br
idge
XSp
atia
l Cov
erag
eN
Cent
er c
hann
el, o
ffsho
re fr
om R
2-2
Mov
ed n
orth
wes
t int
o m
ain
thal
weg
, mid
way
bet
wee
n hi
stor
ic sa
mpl
e lo
catio
ns.
R2-0
4R2
-411
th S
tree
t Brid
ge to
So
uth
Capi
tol S
tree
t Br
idge
XX
Out
fall
YEa
st sh
orel
ine
at P
opla
r Poi
nt, a
t Sew
er O
utfa
ll F-
897-
104
R2-0
7R2
-511
th S
tree
t Brid
ge to
So
uth
Capi
tol S
tree
t Br
idge
XO
utfa
ll, V
erifi
catio
nY
East
shor
elin
e at
Pop
lar P
oint
, ove
rlap
with
yea
r 200
0 po
int,
adja
cent
to F
-417
-217
40 ft
from
200
0 AN
S/U
SFW
S Tr
iad
Stud
y sa
mpl
e lo
catio
n
R2-1
3R2
-611
th S
tree
t Brid
ge to
So
uth
Capi
tol S
tree
t Br
idge
XX
Out
fall
NAd
jace
nt to
NPD
ES 0
05
R2-1
2R2
-711
th S
tree
t Brid
ge to
So
uth
Capi
tol S
tree
t Br
idge
XVe
rific
atio
nY
Cent
er c
hann
el a
djac
ent t
o ye
ar 2
000
poin
t61
ft fr
om 2
000
ANS/
USF
WS
Tria
d St
udy
sam
ple
loca
tion
R2-1
5R2
-811
th S
tree
t Brid
ge to
So
uth
Capi
tol S
tree
t Br
idge
XO
utfa
llN
Adja
cent
to N
PDES
006
R2-1
1R2
-911
th S
tree
t Brid
ge to
So
uth
Capi
tol S
tree
t Br
idge
XO
utfa
llN
Adja
cent
to F
-008
-706
R2-0
8R2
-10
11th
Str
eet B
ridge
to
Sout
h Ca
pito
l Str
eet
Brid
geX
Spat
ial C
over
age
NTh
alw
eg d
epre
ssio
n no
rthw
est o
f R2-
9, n
orth
east
of R
2-15
Mov
ed so
uthw
est t
o de
pres
sion
whe
re m
ain
thal
weg
and
seco
ndar
y th
alw
eg m
eet.
R2-1
0N
ew L
ocat
ion
Brid
ge to
Sou
th C
apito
l Str
eet B
ridge
Verif
icat
ion
Ups
trea
m o
f doc
ks a
t Nav
y Ya
rd, n
ear n
orth
ban
kU
pstr
eam
of t
he d
ocks
at t
he N
avy
Yard
, in
area
whe
re c
hann
el w
iden
s, to
ver
ify h
istor
ic d
ata
(200
6, 2
009
Was
hing
ton
Nav
y Ya
rd S
ed/T
iss)
R2-0
6R2
-11
11th
Str
eet B
ridge
to
Sout
h Ca
pito
l Str
eet
Brid
geX
Verif
icat
ion
YCe
nter
cha
nnel
from
R2-
05 a
nd a
djac
ent t
o ye
ar 2
000
poin
t69
ft fr
om 2
000
ANS/
USF
WS
Tria
d St
udy
sam
ple
loca
tion
R2-1
6R2
-12
11th
Str
eet B
ridge
to
Sout
h Ca
pito
l Str
eet
Brid
geX
Spat
ial C
over
age
NCe
nter
cha
nnel
from
R2-
8
R2-0
5R2
-13
11th
Str
eet B
ridge
to
Sout
h Ca
pito
l Str
eet
Brid
geX
Spat
ial C
over
age
NCe
nter
cha
nnel
from
R2-
4M
oved
nor
th o
f tha
lweg
to c
hara
cter
ize
broa
d, fl
at c
hann
el b
ed.
R2-1
4R2
-14
11th
Str
eet B
ridge
to
Sout
h Ca
pito
l Str
eet
Brid
geX
Spat
ial C
over
age
NCh
arac
teriz
atio
n fo
r hum
an h
ealth
(ped
estr
ian
acce
ss to
riv
erba
nk)
R2-0
9R2
-15
11th
Str
eet B
ridge
to
Sout
h Ca
pito
l Str
eet
Brid
geX
Out
fall,
Ver
ifica
tion
YO
utfa
ll F-
417-
217;
ove
rlap
with
yea
r 200
0 sa
mpl
ing
poin
t75
ft fr
om 2
000
ANS/
USF
WS
Tria
d St
udy
sam
ple
loca
tion
R3-1
2R3
-1CS
X Br
idge
to 1
1th
Stre
et B
ridge
XVe
rific
atio
nY
Tran
sect
nea
r Pen
nsyl
vani
a Av
e. B
ridge
nea
r yea
r 200
0 po
int
58 ft
from
200
0 AN
S/U
SFW
S Tr
iad
Stud
y sa
mpl
e lo
catio
n
R3-1
1R3
-2CS
X Br
idge
to 1
1th
Stre
et B
ridge
XVe
rific
atio
nY
Tran
sect
nea
r Pen
nsyl
vani
a Av
e. B
ridge
nea
r yea
r 200
0 po
int
92 ft
from
200
0 AN
S/U
SFW
S Tr
iad
Stud
y sa
mpl
e lo
catio
n

TABL
E 1
Mod
ifica
tions
to P
ropo
sed
Sedi
men
t Sam
plin
g Lo
catio
ns a
s Def
ined
in th
e W
ork
Plan
(Jan
uary
29,
201
4 v
ersi
on) P
age
3 of
5
Fina
l Sam
ple
Loca
tion
Tabl
e (W
P 5.
1) 2
-6-1
4.xl
sx6/
9/20
14
New
Nam
eN
ame
Reac
hPo
re
Wat
erD
eep
Sedi
men
tRa
tiona
le
Prox
imat
e to
Ex
istin
gSa
mpl
eLo
catio
n
Not
es, I
nclu
ding
Rat
iona
le fo
r Mov
ing,
Rem
ovin
g, o
r Add
ing
Prop
osed
Sam
ple
Loca
tions
:
In m
ain
tabl
e re
d hi
ghlig
htin
g sig
nifie
s rem
oved
loca
tions
, gre
en h
ighl
ight
iden
tifie
s add
ed lo
catio
ns,
yello
w h
ighl
ight
mea
ns u
pdat
ed c
ell v
alue
, and
blu
e te
xt in
dica
tes t
he lo
catio
n w
as m
oved
.
R3-1
0R3
-3CS
X Br
idge
to 1
1th
Stre
et B
ridge
XVe
rific
atio
nY
Tran
sect
nea
r Pen
nsyl
vani
a Av
e. B
ridge
nea
r yea
r 200
0 po
int
89 ft
from
200
0 AN
S/U
SFW
S Tr
iad
Stud
y sa
mpl
e lo
catio
n
R3-1
4N
ew L
ocat
ion
Brid
ge to
11t
h St
reet
Brid
geSp
atia
l Cov
erag
eU
pstr
eam
of P
enns
ylva
nia
Ave.
Brid
ge n
ear s
econ
dary
th
alw
eg a
long
nor
thw
est b
ank
Adde
d to
cha
ract
eriz
e br
oad
depo
sitio
nal a
rea
that
is c
urre
ntly
uns
ampl
ed.
R3-1
3N
ew L
ocat
ion
Brid
ge to
11t
h St
reet
Brid
geSp
atia
l Cov
erag
eDo
wns
trea
m o
f CSX
railr
oad
brid
ge n
ear n
orth
wes
t ban
kAd
ded
loca
tion
to c
hara
cter
ize
seco
ndar
y th
alw
eg a
nd d
epos
ition
are
a do
wns
trea
m o
f rai
lroad
brid
ge
R3-1
5R3
-4CS
X Br
idge
to 1
1th
Stre
et B
ridge
XX
Verif
icat
ion,
Out
fall
YTr
anse
ct n
ear C
SX B
ridge
nea
r yea
r 200
0 po
int;
near
For
t Da
vis t
ribut
ary
(F-2
38-2
90)
53 ft
from
200
0 AN
S/U
SFW
S Tr
iad
Stud
y sa
mpl
e lo
catio
n
R3-1
6R3
-5CS
X Br
idge
to 1
1th
Stre
et B
ridge
XVe
rific
atio
nY
Tran
sect
nea
r CSX
Brid
ge n
ear y
ear 2
000
poin
tCl
oses
t 200
0 AN
S/U
SFW
S Tr
iad
Stud
y sa
mpl
e lo
catio
n is
338
ft a
way
R3-0
9R3
-6CS
X Br
idge
to 1
1th
Stre
et B
ridge
XSp
atia
l Cov
erag
eN
Cent
er c
hann
el fr
om R
3-7
R3-0
8R3
-7CS
X Br
idge
to 1
1th
Stre
et B
ridge
XO
utfa
llN
Adja
cent
to N
PDES
018
R3-0
6R3
-8CS
X Br
idge
to 1
1th
Stre
et B
ridge
XX
Out
fall
NAd
jace
nt to
F-4
05-2
20
R3-0
5R3
-9CS
X Br
idge
to 1
1th
Stre
et B
ridge
Spat
ial C
over
age
NCh
arac
teriz
atio
n fo
r hum
an h
ealth
(ped
estr
ian
acce
ss to
riv
erba
nk)
R3-0
7R3
-10
CSX
Brid
ge to
11t
h St
reet
Brid
geX
Verif
icat
ion,
Out
fall
YO
utfa
ll F-
124-
260
and
a HP
AH h
otsp
ot46
ft fr
om 2
000
ANS/
USF
WS
Tria
d St
udy
sam
ple
loca
tion
R3-0
1R3
-11
CSX
Brid
ge to
11t
h St
reet
Brid
geVe
rific
atio
nN
Thal
weg
, nea
r sou
thw
est c
orne
r of W
ashi
ngto
n G
asM
oved
sout
heas
t fro
m n
ears
hore
are
a to
thal
weg
. Ch
ange
d to
'Ver
ifica
tion'
from
'Spa
tial C
over
age'
be
caus
e an
exi
stin
g sa
mpl
e is
alre
ady
in th
is lo
catio
n (2
000
ANS/
USF
WS
Tria
d St
udy)
.R3
-12
Brid
ge to
11t
h St
reet
Brid
geSp
atia
l Cov
erag
eN
Nea
rsho
re o
ff of
Was
hing
ton
Gas
Anot
her s
patia
l cov
erag
e lo
catio
n is
alre
ady
near
by.
R3-1
3Br
idge
to 1
1th
Stre
et B
ridge
Spat
ial C
over
age
NM
id c
hann
el fo
rmin
g tr
anse
ct w
ith R
3-12
Adeq
uate
cov
erag
e al
read
y ex
ists i
n th
is ar
ea.
R3-0
4R3
-14
CSX
Brid
ge to
11t
h St
reet
Brid
geSp
atia
l Cov
erag
eN
Nea
r sho
relin
e op
posit
e fr
om W
ashi
ngto
n G
as, f
orm
ing
tran
sect
with
R3-
16M
oved
sout
hwes
t alo
ng se
cond
ary
thal
weg
. Be
tter
pos
ition
bet
wee
n hi
stor
ic tr
anse
cts.
R3-0
2R3
-15
CSX
Brid
ge to
11t
h St
reet
Brid
geSp
atia
l Cov
erag
eN
Nea
rsho
re o
ff of
Was
hing
ton
Gas
Mov
ed so
uthw
est t
o be
in li
ne w
ith h
istor
ic tr
anse
ct a
nd to
bet
ter r
epre
sent
geo
mor
phic
surf
ace.
R3-0
3R3
-16
CSX
Brid
ge to
11t
h St
reet
Brid
geSp
atia
l Cov
erag
eN
Mid
cha
nnel
form
ing
tran
sect
with
R3-
16M
oved
nor
thea
st to
war
d m
ain
thal
weg
and
in li
ne w
ith n
ew lo
catio
n of
R3-
14.
Prov
ides
bet
ter c
over
age
in u
nsam
pled
are
a.
R4-0
1R4
-1Ea
st C
apito
l Str
eet
Brid
ge to
CSX
Brid
geX
Verif
icat
ion
YTr
anse
ct n
ear C
SX B
ridge
nea
r yea
r 200
0 po
int
39 ft
from
200
0 AN
S/U
SFW
S Tr
iad
Stud
y sa
mpl
e lo
catio
n
R4-0
9R4
-2Ea
st C
apito
l Str
eet
Brid
ge to
CSX
Brid
geX
XVe
rific
atio
n, O
utfa
llY
Tran
sect
nea
r Eas
t Cap
itol S
t. Br
idge
; nea
r Cha
plin
trib
utar
y (F
-903
-371
) and
200
0 po
int
Clos
est 2
000
ANS/
USF
WS
Tria
d St
udy
sam
ple
loca
tion
is 13
3 ft
aw
ay
R4-0
8R4
-3Ea
st C
apito
l Str
eet
Brid
ge to
CSX
Brid
geX
Spat
ial C
over
age
NTr
anse
ct n
ear E
ast C
apito
l St.
Brid
geM
oved
slig
htly
sout
hwes
t to
be in
cen
ter o
f geo
mor
phic
pol
ygon
, aw
ay fr
om tr
ansit
iona
l edg
e ar
eas.
R4-0
7R4
-4Ea
st C
apito
l Str
eet
Brid
ge to
CSX
Brid
geSp
atia
l Cov
erag
eN
Char
acte
rizat
ion
for h
uman
hea
lth (p
edes
tria
n ac
cess
to
river
bank
)
R4-0
5N
ew L
ocat
ion
pito
l Str
eet B
ridge
to C
SX B
ridge
Spat
ial C
over
age
Nor
thw
est b
ank
upst
ream
of m
outh
of K
ingm
an S
loug
hAd
ded
to c
hara
cter
ize
wid
enin
g ch
anne
l and
bro
ad d
epos
ition
al a
rea
just
ups
trea
m o
f con
fluen
ce
betw
een
King
man
Slo
ugh
and
Anac
ostia
Riv
er
R4-0
2R4
-5Ea
st C
apito
l Str
eet
Brid
ge to
CSX
Brid
geSp
atia
l Cov
erag
eN
Char
acte
rizat
ion
for h
uman
hea
lth (p
edes
tria
n ac
cess
to
river
bank
)
R4-0
3T-
42-B
AEa
st C
apito
l Str
eet
Brid
ge to
CSX
Brid
geVe
rific
atio
nY
HPAH
hot
spot
dow
nstr
eam
from
Kin
gman
Lak
e co
nflu
ence
66 ft
from
200
0 AN
S/U
SFW
S Tr
iad
Stud
y sa
mpl
e lo
catio
n
R4-0
4T-
16-B
East
Cap
itol S
tree
t Br
idge
to C
SX B
ridge
XSp
atia
l Cov
erag
eN
East
ban
k be
twee
n Fo
rt D
upon
t Cre
ek o
utfa
ll an
d CS
X ra
ilroa
d br
idge
Mov
ed so
uthw
est t
o pr
ovid
e be
tter
spat
ial c
over
age
betw
een
exist
ing
hist
oric
loca
tions
.
R4-0
6T-
45-B
East
Cap
itol S
tree
t Br
idge
to C
SX B
ridge
Spat
ial C
over
age
NEa
st b
ank
nort
h of
For
t Dup
ont C
reek
Out
fall
Mov
ed so
uth
to b
e cl
oser
to sh
ore.
R5-0
2R5
-1Be
nnin
g Ro
ad B
ridge
to
Eas
t Cap
itol S
tree
t Br
idge
XO
utfa
llN
Adja
cent
to F
-090
-064
R5-0
3R5
-2Be
nnin
g Ro
ad B
ridge
to
Eas
t Cap
itol S
tree
t Br
idge
XVe
rific
atio
nY
Tran
sect
dow
nstr
eam
from
yea
r 200
0 tr
anse
ct
R5-0
4R5
-3Be
nnin
g Ro
ad B
ridge
to
Eas
t Cap
itol S
tree
t Br
idge
XX
Verif
icat
ion
YTr
anse
ct d
owns
trea
m fr
om y
ear 2
000
tran
sect
Clos
est 2
000
ANS/
USF
WS
Tria
d St
udy
sam
ple
loca
tion
is 14
5 ft
aw
ay
R5-0
5R5
-4Be
nnin
g Ro
ad B
ridge
to
Eas
t Cap
itol S
tree
t Br
idge
Spat
ial C
over
age
NCh
arac
teriz
atio
n fo
r hum
an h
ealth
(ped
estr
ian
acce
ss to
riv
erba
nk)
70 ft
from
200
0 AN
S/U
SFW
S Tr
iad
Stud
y sa
mpl
e lo
catio
n

TABL
E 1
Mod
ifica
tions
to P
ropo
sed
Sedi
men
t Sam
plin
g Lo
catio
ns a
s Def
ined
in th
e W
ork
Plan
(Jan
uary
29,
201
4 v
ersi
on) P
age
4 of
5
Fina
l Sam
ple
Loca
tion
Tabl
e (W
P 5.
1) 2
-6-1
4.xl
sx6/
9/20
14
New
Nam
eN
ame
Reac
hPo
re
Wat
erD
eep
Sedi
men
tRa
tiona
le
Prox
imat
e to
Ex
istin
gSa
mpl
eLo
catio
n
Not
es, I
nclu
ding
Rat
iona
le fo
r Mov
ing,
Rem
ovin
g, o
r Add
ing
Prop
osed
Sam
ple
Loca
tions
:
In m
ain
tabl
e re
d hi
ghlig
htin
g sig
nifie
s rem
oved
loca
tions
, gre
en h
ighl
ight
iden
tifie
s add
ed lo
catio
ns,
yello
w h
ighl
ight
mea
ns u
pdat
ed c
ell v
alue
, and
blu
e te
xt in
dica
tes t
he lo
catio
n w
as m
oved
.
R5-0
1R5
-5Be
nnin
g Ro
ad B
ridge
to
Eas
t Cap
itol S
tree
t Br
idge
Spat
ial C
over
age
NCh
arac
teriz
atio
n fo
r hum
an h
ealth
(ped
estr
ian
acce
ss to
riv
erba
nk)
R6-0
9R6
-1A
Amtr
ak B
ridge
to
Benn
ing
Road
Brid
geX
Verif
icat
ion
YM
outh
of H
icke
y Ru
n ne
ar e
xist
ing
elev
ated
yea
r 200
0 po
int
Chan
ged
stat
us to
ver
ifica
tion
only
, bec
ause
no
nam
ed o
utfa
ll ne
arby
. 21
ft fr
om 2
000
ANS/
USF
WS
Tria
d St
udy
sam
ple
loca
tion.
R6-1
1R6
-2Am
trak
Brid
ge to
Be
nnin
g Ro
ad B
ridge
XSp
atia
l Cov
erag
eN
Cent
er c
hann
el n
ear K
enilw
orth
Par
k N
orth
Lan
dfill
Mov
ed so
uthw
est t
o pr
ovid
e be
tter
long
itudi
nal c
over
age
betw
een
hist
oric
sam
ple
loca
tions
. In
cen
ter o
f ch
anne
l.
R6-1
4N
ew L
ocat
ion
k Br
idge
to B
enni
ng R
oad
Brid
geSp
atia
l Cov
erag
eSh
arp
mea
nder
ups
trea
m o
f Ken
ilwor
th P
ark
Nor
th L
andf
illAd
ded
to c
hara
cter
ize
thal
weg
at s
harp
mea
nder
ben
d
R6-1
3R6
-3Am
trak
Brid
ge to
Be
nnin
g Ro
ad B
ridge
XX
Spat
ial C
over
age
NSh
arp
mea
nder
ups
trea
m o
f Ken
ilwor
th P
ark
Nor
th L
andf
illM
oved
wes
t to
bett
er c
hara
cter
ize
wel
l-dev
elop
ed p
oint
bar
at s
harp
mea
nder
.
R6-1
7R6
-4Am
trak
Brid
ge to
Be
nnin
g Ro
ad B
ridge
XX
Verif
icat
ion,
Out
fall
YCo
nflu
ence
with
Low
er B
eave
rdam
Cre
ek96
ft fr
om 2
000
ANS/
USF
WS
Tria
d St
udy
sam
ple
loca
tion
R6-1
5R6
-5Am
trak
Brid
ge to
Be
nnin
g Ro
ad B
ridge
XSp
atia
l Cov
erag
eN
Nor
th b
ank
betw
een
year
200
0 tr
anse
cts
Mov
ed sl
ight
ly n
orth
wes
t to
bett
er c
hara
cter
ize
geom
orph
ic su
rfac
e (a
way
from
tran
sitio
nal a
rea)
.
R6-1
6R6
-6Am
trak
Brid
ge to
Be
nnin
g Ro
ad B
ridge
Spat
ial C
over
age
NCh
arac
teriz
atio
n fo
r hum
an h
ealth
(ped
estr
ian
acce
ss to
riv
erba
nk)
R6-1
2R6
-7Am
trak
Brid
ge to
Be
nnin
g Ro
ad B
ridge
Spat
ial C
over
age
NCh
arac
teriz
atio
n fo
r hum
an h
ealth
(ped
estr
ian
acce
ss to
riv
erba
nk)
R6-0
5R6
-8Am
trak
Brid
ge to
Be
nnin
g Ro
ad B
ridge
Spat
ial C
over
age
NM
outh
of o
utfa
ll at
nor
thw
est b
ound
ary
of th
e Pe
pco
site
R6-0
4R6
-9Am
trak
Brid
ge to
Be
nnin
g Ro
ad B
ridge
XSp
atia
l Cov
erag
eN
At so
uth
side
of m
outh
of i
nlet
for o
utfa
ll at
nor
thw
est
boun
dary
of t
he P
epco
site
Mov
ed so
uthw
est t
o be
in a
dep
ositi
on a
rea,
whe
re fl
ow fr
om o
utfa
ll m
eets
mai
n ch
anne
l.
R6-0
1R6
-10
Amtr
ak B
ridge
to
Benn
ing
Road
Brid
geX
Spat
ial C
over
age
NAt
mou
th o
f inl
et fo
r out
fall
at so
uthw
est b
ound
ary
of th
e Pe
pco
site
Mov
ed e
ast t
o be
clo
ser t
o ou
tfal
l
R6-0
2R6
-11
Amtr
ak B
ridge
to
Benn
ing
Road
Brid
geSp
atia
l Cov
erag
eY
Cent
er c
hann
el o
ff of
Pep
co si
te; n
ear A
NS
2000
sam
ple
(con
cent
ratio
n 11
19 u
g/kg
)M
oved
wes
t to
be in
the
thal
weg
.
R6-0
6R6
-12
Amtr
ak B
ridge
to
Benn
ing
Road
Brid
geSp
atia
l Cov
erag
eN
Nea
rsho
re se
dim
ent b
ar o
ff of
Ken
ilwor
th P
ark
Sout
h La
ndfil
l, in
tran
sect
with
R6-
17M
oved
slig
htly
sout
h to
be
mid
way
bet
wee
n ex
istin
g tr
anse
cts.
R6-1
0R6
-13
Amtr
ak B
ridge
to
Benn
ing
Road
Brid
geX
Spat
ial C
over
age
NN
ears
hore
off
of K
enilw
orth
Par
k N
orth
Lan
dfill
Mov
ed sl
ight
ly so
uthw
est a
nd c
lose
r to
bank
to b
ette
r rep
rese
nt g
eom
ophi
c de
posit
ion
area
.
R6-1
4k
Brid
ge to
Ben
ning
Roa
d Br
idge
Spat
ial C
over
age
NN
ears
hore
off
of K
enilw
orth
Par
k N
orth
Lan
dfill
Suffi
cien
t spa
tial/g
eom
orph
ic c
over
age
in a
rea
R6-0
8R6
-15
Amtr
ak B
ridge
to
Benn
ing
Road
Brid
geSp
atia
l Cov
erag
eY
Bar a
t mou
th o
f Wat
ts B
ranc
h; n
ear A
NS
2000
sam
ple
(con
cent
ratio
n 59
9 ug
/kg)
85 ft
from
200
0 AN
S/U
SFW
S Tr
iad
Stud
y sa
mpl
e lo
catio
n
R6-0
3R6
-16
Amtr
ak B
ridge
to
Benn
ing
Road
Brid
geX
Spat
ial C
over
age
NM
id-c
hann
el o
ff of
Pep
co si
teM
oved
nor
th to
be
in th
alw
eg a
nd m
idw
ay b
etw
een
exist
ing
tran
sect
s.
R6-0
7R6
-17
Amtr
ak B
ridge
to
Benn
ing
Road
Brid
geX
Spat
ial C
over
age
NW
est b
ank
near
Ken
ilwor
th P
ark
Sout
h La
ndfil
lM
oved
to o
ppos
ite si
de o
f cha
nnel
to b
e in
unc
hara
cter
ized
geo
mor
phic
surf
ace.
R7-0
1R7
-1U
pper
tida
l lim
it to
Am
trak
Brid
geX
Verif
icat
ion
YTr
anse
ct a
t New
Yor
k Av
e. B
ridge
nea
r exi
stin
g ye
ar 2
000
poin
t47
ft fr
om 2
000
ANS/
USF
WS
Tria
d St
udy
sam
ple
loca
tion
R7-0
2R7
-2U
pper
tida
l lim
it to
Am
trak
Brid
geX
Verif
icat
ion
YTr
anse
ct a
t New
Yor
k Av
e. B
ridge
nea
r exi
stin
g ye
ar 2
000
poin
t99
ft fr
om 2
000
ANS/
USF
WS
Tria
d St
udy
sam
ple
loca
tion
R7-0
4R7
-3U
pper
tida
l lim
it to
Am
trak
Brid
geX
Spat
ial C
over
age
NTr
anse
ct n
ear c
onflu
ence
with
Due
ling
Cree
kM
oved
sout
heas
t to
be in
thal
weg
R7-0
5R7
-4U
pper
tida
l lim
it to
Am
trak
Brid
geX
Spat
ial C
over
age
NTr
anse
ct n
ear c
onflu
ence
with
Due
ling
Cree
k
R7-0
6R7
-5U
pper
tida
l lim
it to
Am
trak
Brid
geX
XSp
atia
l Cov
erag
eN
Cent
er c
hann
el d
owns
trea
m fr
om u
nnam
ed w
etla
nd
trib
utar
yR7
-07
New
Loc
atio
ner
tida
l lim
it to
Am
trak
Brid
geSp
atia
l Cov
erag
eW
est b
ank
near
Col
mar
Man
or C
omm
unity
Par
kAd
ded
to c
hara
cter
ize
geom
ophi
c en
viro
nmen
t alo
ng w
est b
ank
R7-0
9R7
-6U
pper
tida
l lim
it to
Am
trak
Brid
geX
Verif
icat
ion
YN
ear y
ear 2
000
tran
sect
R7-0
8R7
-7U
pper
tida
l lim
it to
Am
trak
Brid
geX
Verif
icat
ion
YN
ear y
ear 2
000
tran
sect
R7-1
1R7
-8U
pper
tida
l lim
it to
Am
trak
Brid
geX
Verif
icat
ion
YLo
cate
d ne
ar y
ear 2
000
poin
t; tr
anse
ct w
ith R
7-9
Clos
est 2
000
ANS/
USF
WS
Tria
d St
udy
sam
ple
loca
tion
is 1,
113
ft a
way
R7-1
2R7
-9U
pper
tida
l lim
it to
Am
trak
Brid
geX
Out
fall
NCo
nflu
ence
with
unn
amed
trib
utar
y at
out
fall
PG-T
MP-
13M
oved
slig
htly
eas
t int
o un
char
acte
rized
geo
mor
phic
surf
ace
and
clos
er to
out
fall
R7-1
6R7
-10
Upp
er ti
dal l
imit
to
Amtr
ak B
ridge
Verif
icat
ion
YCe
nter
cha
nnel
sedi
men
t bar
; nea
r yea
r 200
0 tr
anse
ct65
ft fr
om 2
000
ANS/
USF
WS
Tria
d St
udy
sam
ple
loca
tion
R7-1
5R7
-11
Upp
er ti
dal l
imit
to
Amtr
ak B
ridge
XVe
rific
atio
nY
Cent
er c
hann
el se
dim
ent b
ar; n
ear y
ear 2
000
tran
sect
93 ft
from
200
0 AN
S/U
SFW
S Tr
iad
Stud
y sa
mpl
e lo
catio
n

TABL
E 1
Mod
ifica
tions
to P
ropo
sed
Sedi
men
t Sam
plin
g Lo
catio
ns a
s Def
ined
in th
e W
ork
Plan
(Jan
uary
29,
201
4 v
ersi
on) P
age
5 of
5
Fina
l Sam
ple
Loca
tion
Tabl
e (W
P 5.
1) 2
-6-1
4.xl
sx6/
9/20
14
New
Nam
eN
ame
Reac
hPo
re
Wat
erD
eep
Sedi
men
tRa
tiona
le
Prox
imat
e to
Ex
istin
gSa
mpl
eLo
catio
n
Not
es, I
nclu
ding
Rat
iona
le fo
r Mov
ing,
Rem
ovin
g, o
r Add
ing
Prop
osed
Sam
ple
Loca
tions
:
In m
ain
tabl
e re
d hi
ghlig
htin
g sig
nifie
s rem
oved
loca
tions
, gre
en h
ighl
ight
iden
tifie
s add
ed lo
catio
ns,
yello
w h
ighl
ight
mea
ns u
pdat
ed c
ell v
alue
, and
blu
e te
xt in
dica
tes t
he lo
catio
n w
as m
oved
.
R7-1
9R7
-12
Upp
er ti
dal l
imit
to
Amtr
ak B
ridge
XO
utfa
llN
Conf
luen
ce w
ith u
nnam
ed tr
ibut
ary
at o
utfa
ll PG
-TM
P-5
R7-2
1R7
-13
Upp
er ti
dal l
imit
to
Amtr
ak B
ridge
Spat
ial C
over
age
NCe
nter
cha
nnel
sedi
men
t bar
R7-2
3R7
-14
Upp
er ti
dal l
imit
to
Amtr
ak B
ridge
XVe
rific
atio
nY
Ups
trea
m o
n N
orth
east
Bra
nch
near
yea
r 200
0 po
int
Clos
est 2
000
ANS/
USF
WS
Tria
d St
udy
sam
ple
loca
tion
is 1,
086
ft a
way
R7-2
2R7
-15
Upp
er ti
dal l
imit
to
Amtr
ak B
ridge
XSp
atia
l Cov
erag
eN
Ups
trea
m o
n N
orth
wes
t Bra
nch
Mov
ed to
war
d co
nflu
ence
to a
void
influ
ence
s fro
m u
pstr
eam
ped
estr
ian
brid
ge
R7-1
8R7
-16
Upp
er ti
dal l
imit
to
Amtr
ak B
ridge
Spat
ial C
over
age
NCh
arac
teriz
atio
n fo
r hum
an h
ealth
(ped
estr
ian
acce
ss to
riv
erba
nk)
R7-0
3R7
-17
Upp
er ti
dal l
imit
to
Amtr
ak B
ridge
Spat
ial C
over
age
NCh
arac
teriz
atio
n fo
r hum
an h
ealth
(ped
estr
ian
acce
ss to
riv
erba
nk)
Does
not
app
ear t
o be
in a
typi
cally
acc
essib
le a
rea.
R7-1
0T-
75-B
Upp
er ti
dal l
imit
to
Amtr
ak B
ridge
Spat
ial C
over
age
NCe
nter
cha
nnel
mid
way
bet
wee
n R7
-7 a
nd R
7-8
Mov
ed n
orth
east
to c
ente
r of c
hann
el.
R7-2
0T-
79-B
Upp
er ti
dal l
imit
to
Amtr
ak B
ridge
Spat
ial C
over
age
NSo
uthe
ast o
f Bla
dens
burg
Roa
d Br
idge
alo
ng n
orth
east
ban
kM
oved
dow
nstr
eam
to e
dge
of ri
p ra
p to
avo
id in
fluen
ce b
y up
stre
am ro
ad b
ridge
R7-1
8er
tida
l lim
it to
Am
trak
Brid
geSp
atia
l Cov
erag
eN
Adja
cent
to p
ier s
truc
ture
at B
lade
nsbu
rg m
arin
aAd
ditio
nal c
hara
cter
izat
ion
in m
arin
a ar
ea u
nnec
essa
ry
R7-1
3R7
-19
Upp
er ti
dal l
imit
to
Amtr
ak B
ridge
XSp
atia
l Cov
erag
eN
Thal
weg
nea
r Bla
dens
burg
mar
ina
Mov
ed to
end
of d
ocks
, nea
r tha
lweg
R7-1
4R7
-20
Upp
er ti
dal l
imit
to
Amtr
ak B
ridge
Spat
ial C
over
age
NAd
jace
nt to
shor
elin
e at
Bla
dens
burg
mar
ina
R7-1
7R7
-21
Upp
er ti
dal l
imit
to
Amtr
ak B
ridge
XSp
atia
l Cov
erag
eN
Nor
th o
f mid
-cha
nnel
bar
to th
e no
rth
of B
lade
nsbu
rg
mar
ina
Mov
ed n
orth
of m
id-c
hann
el b
ar w
here
cha
nnel
wid
ens a
nd d
epos
ition
is li
kely
KL-0
1KL
-1Ki
ngm
an L
ake
XX
Spat
ial C
over
age
NDo
wns
trea
m n
ear m
outh
of K
ingm
an L
ake
Mov
ed n
orth
to b
e in
seco
ndar
y th
alw
eg.
KL-2
King
man
Lak
eX
Spat
ial C
over
age
NBr
oad
chan
nel b
etw
een
King
man
Lak
e m
outh
and
Eas
t Ca
pito
l Str
eet
Cove
rage
of s
imila
r geo
mop
rhic
are
a al
read
y pr
ovid
ed b
y KL
-16
KL-0
4KL
-3Ki
ngm
an L
ake
XO
utfa
llN
Dow
nstr
eam
from
F-2
84-0
41KL
-06
KL-4
King
man
Lak
eX
Out
fall
NDo
wns
trea
m fr
om u
nnam
ed o
utfa
ll on
wes
t ban
kKL
-07
KL-5
King
man
Lak
eX
Out
fall
NDo
wns
trea
m fr
om F
-611
-365
Mov
ed sl
ight
ly n
orth
wes
t to
be c
lose
r to
outf
all a
nd in
dist
inct
geo
mor
phic
are
a.
KL-0
5N
ew L
ocat
ion
King
man
Lak
eSp
atia
l Cov
erag
eEa
st c
hann
el n
orth
of E
ast C
apito
l Str
eet a
nd so
uth
of
Benn
ing
Road
Adde
d to
cap
ture
bro
ad d
epos
ition
al a
rea
in K
ingm
an L
ake
KL-1
0KL
-6Ki
ngm
an L
ake
XX
Spat
ial C
over
age
NEa
st c
hann
el n
orth
of E
ast C
apito
l Str
eet a
nd so
uth
of
Benn
ing
Road
KL-1
1KL
-7Ki
ngm
an L
ake
XSp
atia
l Cov
erag
eN
Mai
n ch
anne
l sou
th o
f Ben
ning
Roa
dKL
-12
KL-8
King
man
Lak
eX
Out
fall
NDo
wns
trea
m fr
om F
-991
-021
Chan
ged
'Loc
atio
n' fi
eld
to re
flect
cor
rect
out
fall.
KL-1
4KL
-9Ki
ngm
an L
ake
XO
utfa
llN
Dow
nstr
eam
from
F-0
52-3
84KL
-22
KL-1
0Ki
ngm
an L
ake
XSp
atia
l Cov
erag
eN
Ups
trea
m m
outh
of K
ingm
an L
ake
Mov
ed e
ast t
o be
in m
ain
chan
nel o
f mou
th.
KL-2
0KL
-11
King
man
Lak
eX
XSp
atia
l Cov
erag
eN
Chan
nel i
n no
rthe
rn si
lted-
in p
ortio
n of
Kin
gman
Lak
eKL
-21
KL-1
2Ki
ngm
an L
ake
XSp
atia
l Cov
erag
eN
Chan
nel i
n no
rthe
rn si
lted-
in p
ortio
n of
Kin
gman
Lak
eKL
-17
KL-1
3Ki
ngm
an L
ake
XSp
atia
l Cov
erag
eN
Chan
nel i
n no
rthe
rn si
lted-
in p
ortio
n of
Kin
gman
Lak
eKL
-16
KL-1
4Ki
ngm
an L
ake
XSp
atia
l Cov
erag
eN
Chan
nel i
n no
rthe
rn si
lted-
in p
ortio
n of
Kin
gman
Lak
eKL
-03
KL-1
5Ki
ngm
an L
ake
XSp
atia
l Cov
erag
eN
Adja
cent
to E
ast C
apito
l St.
Brid
geM
oved
sout
heas
t to
be in
seco
ndar
y th
alw
eg.
KL-0
2KL
-16
King
man
Lak
eX
Spat
ial C
over
age
NSo
uth
of E
ast C
apito
l St.
Brid
geM
oved
sout
h to
be
in c
ente
r of l
arge
geo
mor
phic
surf
ace,
aw
ay fr
om b
ridge
.KL
-17
King
man
Lak
eSp
atia
l Cov
erag
eN
Wes
t ban
k ne
ar g
olf c
ours
eRe
mov
ed d
ue to
suffi
cien
t geo
mor
phic
cov
erag
e in
are
a.KL
-18
King
man
Lak
eSp
atia
l Cov
erag
eN
Isla
nd e
ast o
f KL-
17Re
mov
ed d
ue to
suffi
cien
t geo
mor
phic
cov
erag
e in
are
a.KL
-19
KL-1
9Ki
ngm
an L
ake
Spat
ial C
over
age
NM
ud fl
at in
nor
ther
n sil
ted-
in p
ortio
n of
Kin
gman
Lak
eM
oved
wes
t to
be o
n m
udfla
t adj
acen
t to
islan
d.
KL-1
8KL
- 20
King
man
Lak
eSp
atia
l Cov
erag
eN
Char
acte
rizat
ion
for h
uman
hea
lth (p
edes
tria
n ac
cess
to
river
bank
)
KL-1
5KL
-21
King
man
Lak
eX
Spat
ial C
over
age
NCh
anne
l in
nort
hern
silte
d-in
por
tion
of K
ingm
an L
ake
Mov
ed so
uth
and
wes
t to
be in
wid
er p
art o
f mai
n ch
anne
l, an
d ju
st u
pstr
eam
of s
light
cha
nnel
co
nstr
ictio
n
KL-0
8KL
-22
King
man
Lak
eX
XSp
atia
l Cov
erag
eN
Mud
flat
nor
th o
f Eas
t Cap
itol S
t. Br
idge
, nea
r foo
tbrid
geM
oved
to n
orth
end
of m
udfla
t, w
here
acc
essib
ility
is e
asie
r and
dep
ositi
on is
mor
e lik
ely
KL-0
9KL
-23
King
man
Lak
eX
Spat
ial C
over
age
NM
ain
chan
nel o
f wes
t arm
bet
wee
n E.
Cap
itol S
t and
Ben
ning
Rd
Mov
ed so
uth
to c
hara
cter
ize
mai
n ch
anne
l.
KL-2
3KL
-24
King
man
Lak
eX
Spat
ial C
over
age
NM
udfla
t adj
acen
t to
upst
ream
mou
th o
f Kin
gman
Lak
e
KL-1
3KL
-25
King
man
Lak
eSp
atia
l Cov
erag
eN
Char
acte
rizat
ion
for h
uman
hea
lth (p
edes
tria
n ac
cess
to
river
bank
)

TABL
E 1
Mod
ifica
tions
to P
ropo
sed
Sedi
men
t Sam
plin
g Lo
catio
ns a
s Def
ined
in th
e W
ork
Plan
(Jan
uary
29,
201
4 v
ersi
on) P
age
2 of
5
Fina
l Sam
ple
Loca
tion
Tabl
e (W
P 5.
1) 2
-6-1
4.xl
sx6/
9/20
14
New
Nam
eN
ame
Reac
hPo
re
Wat
erDe
ep
Sedi
men
tRa
tiona
le
Prox
imat
e to
Ex
istin
gSa
mpl
eLo
catio
n
Not
es, I
nclu
ding
Rat
iona
le fo
r Mov
ing,
Rem
ovin
g, o
r Add
ing
Prop
osed
Sam
ple
Loca
tions
:
I
n m
ain
tabl
e re
d hi
ghlig
htin
g sig
nifie
s re
mov
ed lo
catio
ns, g
reen
hig
hlig
ht id
entif
ies a
dded
loca
tions
, yel
low
hig
hlig
ht m
eans
upd
ated
cel
l val
ue, a
nd b
lue
text
indi
cate
s the
loca
tion
was
m
oved
.
R2-0
2R2
-211
th S
tree
t Brid
ge to
So
uth
Capi
tol S
tree
t Br
idge
XSp
atia
l Cov
erag
eN
East
shor
elin
e at
Pop
lar P
oint
R2-0
3R2
-311
th S
tree
t Brid
ge to
So
uth
Capi
tol S
tree
t Br
idge
XSp
atia
l Cov
erag
eN
Cent
er c
hann
el, o
ffsho
re fr
om R
2-2
Mov
ed n
orth
wes
t int
o m
ain
thal
weg
, mid
way
bet
wee
n hi
stor
ic sa
mpl
e lo
catio
ns.
R2-0
4R2
-411
th S
tree
t Brid
ge to
So
uth
Capi
tol S
tree
t Br
idge
XX
Out
fall
YEa
st sh
orel
ine
at P
opla
r Poi
nt, a
t Sew
er O
utfa
ll F-
897-
104
R2-0
7R2
-511
th S
tree
t Brid
ge to
So
uth
Capi
tol S
tree
t Br
idge
XO
utfa
ll, V
erifi
catio
nY
East
shor
elin
e at
Pop
lar P
oint
, ove
rlap
with
yea
r 200
0 po
int,
adja
cent
to F
-417
-217
40 ft
from
200
0 AN
S/U
SFW
S Tr
iad
Stud
y sa
mpl
e lo
catio
n
R2-1
3R2
-611
th S
tree
t Brid
ge to
So
uth
Capi
tol S
tree
t Br
idge
XX
Out
fall
NAd
jace
nt to
NPD
ES 0
05
R2-1
2R2
-711
th S
tree
t Brid
ge to
So
uth
Capi
tol S
tree
t Br
idge
XVe
rific
atio
nY
Cent
er c
hann
el a
djac
ent t
o ye
ar 2
000
poin
t61
ft fr
om 2
000
ANS/
USF
WS
Tria
d St
udy
sam
ple
loca
tion
R2-1
5R2
-811
th S
tree
t Brid
ge to
So
uth
Capi
tol S
tree
t Br
idge
XO
utfa
llN
Adja
cent
to N
PDES
006
R2-1
1R2
-911
th S
tree
t Brid
ge to
So
uth
Capi
tol S
tree
t Br
idge
XO
utfa
llN
Adja
cent
to F
-008
-706
R2-0
8R2
-10
11th
Str
eet B
ridge
to
Sout
h Ca
pito
l Str
eet
Brid
geX
Spat
ial C
over
age
NTh
alw
eg d
epre
ssio
n no
rthw
est o
f R2-
9, n
orth
east
of R
2-15
Mov
ed so
uthw
est t
o de
pres
sion
whe
re m
ain
thal
weg
and
seco
ndar
y th
alw
eg m
eet.
R2-1
0N
ew L
ocat
ion
Brid
ge to
Sou
th C
apito
l Str
eet B
ridge
Verif
icat
ion
Ups
trea
m o
f doc
ks a
t Nav
y Ya
rd, n
ear n
orth
ban
kU
pstr
eam
of t
he d
ocks
at t
he N
avy
Yard
, in
area
whe
re c
hann
el w
iden
s, to
ver
ify h
istor
ic d
ata
(200
6, 2
009
Was
hing
ton
Nav
y Ya
rd S
ed/T
iss)
R2-0
6R2
-11
11th
Str
eet B
ridge
to
Sout
h Ca
pito
l Str
eet
Brid
geX
Verif
icat
ion
YCe
nter
cha
nnel
from
R2-
05 a
nd a
djac
ent t
o ye
ar 2
000
poin
t69
ft fr
om 2
000
ANS/
USF
WS
Tria
d St
udy
sam
ple
loca
tion
R2-1
6R2
-12
11th
Str
eet B
ridge
to
Sout
h Ca
pito
l Str
eet
Brid
geX
Spat
ial C
over
age
NCe
nter
cha
nnel
from
R2-
8
R2-0
5R2
-13
11th
Str
eet B
ridge
to
Sout
h Ca
pito
l Str
eet
Brid
geX
Spat
ial C
over
age
NCe
nter
cha
nnel
from
R2-
4M
oved
nor
th o
f tha
lweg
to c
hara
cter
ize
broa
d, fl
at c
hann
el b
ed.
R2-1
4R2
-14
11th
Str
eet B
ridge
to
Sout
h Ca
pito
l Str
eet
Brid
geX
Spat
ial C
over
age
NCh
arac
teriz
atio
n fo
r hum
an h
ealth
(ped
estr
ian
acce
ss to
riv
erba
nk)
R2-0
9R2
-15
11th
Str
eet B
ridge
to
Sout
h Ca
pito
l Str
eet
Brid
geX
Out
fall,
Ver
ifica
tion
YO
utfa
ll F-
417-
217;
ove
rlap
with
yea
r 200
0 sa
mpl
ing
poin
t75
ft fr
om 2
000
ANS/
USF
WS
Tria
d St
udy
sam
ple
loca
tion
R3-1
2R3
-1CS
X Br
idge
to 1
1th
Stre
et B
ridge
XVe
rific
atio
nY
Tran
sect
nea
r Pen
nsyl
vani
a Av
e. B
ridge
nea
r yea
r 200
0 po
int
58 ft
from
200
0 AN
S/U
SFW
S Tr
iad
Stud
y sa
mpl
e lo
catio
n
R3-1
1R3
-2CS
X Br
idge
to 1
1th
Stre
et B
ridge
XVe
rific
atio
nY
Tran
sect
nea
r Pen
nsyl
vani
a Av
e. B
ridge
nea
r yea
r 200
0 po
int
92 ft
from
200
0 AN
S/U
SFW
S Tr
iad
Stud
y sa
mpl
e lo
catio
n
R3-1
0R3
-3CS
X Br
idge
to 1
1th
Stre
et B
ridge
XVe
rific
atio
nY
Tran
sect
nea
r Pen
nsyl
vani
a Av
e. B
ridge
nea
r yea
r 200
0 po
int
89 ft
from
200
0 AN
S/U
SFW
S Tr
iad
Stud
y sa
mpl
e lo
catio
n
R3-1
4N
ew L
ocat
ion
Brid
ge to
11t
h St
reet
Brid
geSp
atia
l Cov
erag
eU
pstr
eam
of P
enns
ylva
nia
Ave.
Brid
ge n
ear s
econ
dary
th
alw
e g a
long
nor
thw
est b
ank
Adde
d to
cha
ract
eriz
e br
oad
depo
sitio
nal a
rea
that
is c
urre
ntly
uns
ampl
ed.
R3-1
3N
ew L
ocat
ion
Brid
ge to
11t
h St
reet
Brid
geSp
atia
l Cov
erag
eDo
wns
trea
m o
f CSX
railr
oad
brid
ge n
ear n
orth
wes
t ban
kAd
ded
loca
tion
to c
hara
cter
ize
seco
ndar
y th
alw
eg a
nd d
epos
ition
are
a do
wns
trea
m o
f rai
lroad
brid
ge
R3-1
5R3
-4CS
X Br
idge
to 1
1th
Stre
et B
ridge
XX
Verif
icat
ion,
Out
fall
YTr
anse
ct n
ear C
SX B
ridge
nea
r yea
r 200
0 po
int;
near
For
t Da
vis t
ribut
ary
(F-2
38-2
90)
53 ft
from
200
0 AN
S/U
SFW
S Tr
iad
Stud
y sa
mpl
e lo
catio
n
R3-1
6R3
-5CS
X Br
idge
to 1
1th
Stre
et B
ridge
XVe
rific
atio
nY
Tran
sect
nea
r CSX
Brid
ge n
ear y
ear 2
000
poin
tCl
oses
t 200
0 AN
S/U
SFW
S Tr
iad
Stud
y sa
mpl
e lo
catio
n is
338
ft a
way
R3-0
9R3
-6CS
X Br
idge
to 1
1th
Stre
et B
ridge
XSp
atia
l Cov
erag
eN
Cent
er c
hann
el fr
om R
3-7
R3-0
8R3
-7CS
X Br
idge
to 1
1th
Stre
et B
ridge
XO
utfa
llN
Adja
cent
to N
PDES
018
R3-0
6R3
-8CS
X Br
idge
to 1
1th
Stre
et B
ridge
XX
Out
fall
NAd
jace
nt to
F-4
05-2
20
R3-0
5R3
-9CS
X Br
idge
to 1
1th
Stre
et B
ridge
Spat
ial C
over
age
NCh
arac
teriz
atio
n fo
r hum
an h
ealth
(ped
estr
ian
acce
ss to
riv
erba
nk)
R3-0
7R3
-10
CSX
Brid
ge to
11t
h St
reet
Brid
geX
Verif
icat
ion,
Out
fall
YO
utfa
ll F-
124-
260
and
a HP
AH h
otsp
ot46
ft fr
om 2
000
ANS/
USF
WS
Tria
d St
udy
sam
ple
loca
tion
R3-0
1R3
-11
CSX
Brid
ge to
11t
h St
reet
Brid
geVe
rific
atio
nN
Thal
weg
, nea
r sou
thw
est c
orne
r of W
ashi
ngto
n G
asM
oved
sout
heas
t fro
m n
ears
hore
are
a to
thal
weg
. Ch
ange
d to
'Ver
ifica
tion'
from
'Spa
tial C
over
age'
bec
ause
an
exist
ing
sam
ple
is al
read
y in
this
loca
tion
(200
0 AN
S/U
SFW
S Tr
iad
Stud
y).

TABL
E 1
Mod
ifica
tions
to P
ropo
sed
Sedi
men
t Sam
plin
g Lo
catio
ns a
s Def
ined
in th
e W
ork
Plan
(Jan
uary
29,
201
4 v
ersi
on) P
age
3 of
5
Fina
l Sam
ple
Loca
tion
Tabl
e (W
P 5.
1) 2
-6-1
4.xl
sx6/
9/20
14
New
Nam
eN
ame
Reac
hPo
re
Wat
erDe
ep
Sedi
men
tRa
tiona
le
Prox
imat
e to
Ex
istin
gSa
mpl
eLo
catio
n
Not
es, I
nclu
ding
Rat
iona
le fo
r Mov
ing,
Rem
ovin
g, o
r Add
ing
Prop
osed
Sam
ple
Loca
tions
:
I
n m
ain
tabl
e re
d hi
ghlig
htin
g sig
nifie
s re
mov
ed lo
catio
ns, g
reen
hig
hlig
ht id
entif
ies a
dded
loca
tions
, yel
low
hig
hlig
ht m
eans
upd
ated
cel
l val
ue, a
nd b
lue
text
indi
cate
s the
loca
tion
was
m
oved
.R3
-12
Brid
ge to
11t
h St
reet
Brid
geSp
atia
l Cov
erag
eN
Nea
rsho
re o
ff of
Was
hing
ton
Gas
Anot
her s
patia
l cov
erag
e lo
catio
n is
alre
ady
near
by.
R3-1
3Br
idge
to 1
1th
Stre
et B
ridge
Spat
ial C
over
age
NM
id c
hann
el fo
rmin
g tr
anse
ct w
ith R
3-12
Adeq
uate
cov
erag
e al
read
y ex
ists i
n th
is ar
ea.
R3-0
4R3
-14
CSX
Brid
ge to
11t
h St
reet
Brid
geSp
atia
l Cov
erag
eN
Nea
r sho
relin
e op
posit
e fr
om W
ashi
ngto
n G
as, f
orm
ing
tran
sect
with
R3-
16M
oved
sout
hwes
t alo
ng se
cond
ary
thal
weg
. Be
tter
pos
ition
bet
wee
n hi
stor
ic tr
anse
cts.
R3-0
2R3
-15
CSX
Brid
ge to
11t
h St
reet
Brid
geSp
atia
l Cov
erag
eN
Nea
rsho
re o
ff of
Was
hing
ton
Gas
Mov
ed so
uthw
est t
o be
in li
ne w
ith h
istor
ic tr
anse
ct a
nd to
bet
ter r
epre
sent
geo
mor
phic
surf
ace.
R3-0
3R3
-16
CSX
Brid
ge to
11t
h St
reet
Brid
geSp
atia
l Cov
erag
eN
Mid
cha
nnel
form
ing
tran
sect
with
R3-
16M
oved
nor
thea
st to
war
d m
ain
thal
weg
and
in li
ne w
ith n
ew lo
catio
n of
R3-
14.
Prov
ides
bet
ter c
over
age
in u
nsam
pled
are
a.
R4-0
1R4
-1Ea
st C
apito
l Str
eet
Brid
ge to
CSX
Brid
geX
Verif
icat
ion
YTr
anse
ct n
ear C
SX B
ridge
nea
r yea
r 200
0 po
int
39 ft
from
200
0 AN
S/U
SFW
S Tr
iad
Stud
y sa
mpl
e lo
catio
n
R4-0
9R4
-2Ea
st C
apito
l Str
eet
Brid
ge to
CSX
Brid
geX
XVe
rific
atio
n, O
utfa
llY
Tran
sect
nea
r Eas
t Cap
itol S
t. Br
idge
; nea
r Cha
plin
trib
utar
y (F
-903
-371
) and
200
0 po
int
Clos
est 2
000
ANS/
USF
WS
Tria
d St
udy
sam
ple
loca
tion
is 13
3 ft
aw
ay
R4-0
8R4
-3Ea
st C
apito
l Str
eet
Brid
ge to
CSX
Brid
geX
Spat
ial C
over
age
NTr
anse
ct n
ear E
ast C
apito
l St.
Brid
geM
oved
slig
htly
sout
hwes
t to
be in
cen
ter o
f geo
mor
phic
pol
ygon
, aw
ay fr
om tr
ansit
iona
l edg
e ar
eas.
R4-0
7R4
-4Ea
st C
apito
l Str
eet
Brid
ge to
CSX
Brid
geSp
atia
l Cov
erag
eN
Char
acte
rizat
ion
for h
uman
hea
lth (p
edes
tria
n ac
cess
to
river
bank
)
R4-0
5N
ew L
ocat
ion
pito
l Str
eet B
ridge
to C
SX B
ridge
Spat
ial C
over
age
Nor
thw
est b
ank
upst
ream
of m
outh
of K
ingm
an S
loug
hAd
ded
to c
hara
cter
ize
wid
enin
g ch
anne
l and
bro
ad d
epos
ition
al a
rea
just
ups
trea
m o
f con
fluen
ce b
etw
een
King
man
Slo
ugh
and
Anac
ostia
Riv
er
R4-0
2R4
-5Ea
st C
apito
l Str
eet
Brid
ge to
CSX
Brid
geSp
atia
l Cov
erag
eN
Char
acte
rizat
ion
for h
uman
hea
lth (p
edes
tria
n ac
cess
to
river
bank
)
R4-0
3T-
42-B
AEa
st C
apito
l Str
eet
Brid
ge to
CSX
Brid
geVe
rific
atio
nY
HPAH
hot
spot
dow
nstr
eam
from
Kin
gman
Lak
e co
nflu
ence
66 ft
from
200
0 AN
S/U
SFW
S Tr
iad
Stud
y sa
mpl
e lo
catio
n
R4-0
4T-
16-B
East
Cap
itol S
tree
t Br
idge
to C
SX B
ridge
XSp
atia
l Cov
erag
eN
East
ban
k be
twee
n Fo
rt D
upon
t Cre
ek o
utfa
ll an
d CS
X ra
ilroa
d br
idge
Mov
ed so
uthw
est t
o pr
ovid
e be
tter
spat
ial c
over
age
betw
een
exist
ing
hist
oric
loca
tions
.
R4-0
6T-
45-B
East
Cap
itol S
tree
t Br
idge
to C
SX B
ridge
Spat
ial C
over
age
NEa
st b
ank
nort
h of
For
t Dup
ont C
reek
Out
fall
Mov
ed so
uth
to b
e cl
oser
to sh
ore.
R5-0
2R5
-1Be
nnin
g Ro
ad B
ridge
X
Out
fall
NAd
jace
nt to
F-0
90-0
64
R5-0
3R5
-2Be
nnin
g Ro
ad B
ridge
to
Eas
t Cap
itol S
tree
t Br
idge
XVe
rific
atio
nY
Tran
sect
dow
nstr
eam
from
yea
r 200
0 tr
anse
ct
R5-0
4R5
-3Be
nnin
g Ro
ad B
ridge
to
Eas
t Cap
itol S
tree
t Br
idge
XX
Verif
icat
ion
YTr
anse
ct d
owns
trea
m fr
om y
ear 2
000
tran
sect
Clos
est 2
000
ANS/
USF
WS
Tria
d St
udy
sam
ple
loca
tion
is 14
5 ft
aw
ay
R5-0
5R5
-4Be
nnin
g Ro
ad B
ridge
to
Eas
t Cap
itol S
tree
t Br
idge
Spat
ial C
over
age
NCh
arac
teriz
atio
n fo
r hum
an h
ealth
(ped
estr
ian
acce
ss to
riv
erba
nk)
70 ft
from
200
0 AN
S/U
SFW
S Tr
iad
Stud
y sa
mpl
e lo
catio
n
R5-0
1R5
-5Be
nnin
g Ro
ad B
ridge
to
Eas
t Cap
itol S
tree
t Br
idge
Spat
ial C
over
age
NCh
arac
teriz
atio
n fo
r hum
an h
ealth
(ped
estr
ian
acce
ss to
riv
erba
nk)
R6-0
9R6
-1A
Amtr
ak B
ridge
to
Benn
ing
Road
Brid
geX
Verif
icat
ion
YM
outh
of H
icke
y Ru
n ne
ar e
xist
ing
elev
ated
yea
r 200
0 po
int
Chan
ged
stat
us to
ver
ifica
tion
only
, bec
ause
no
nam
ed o
utfa
ll ne
arby
. 21
ft fr
om 2
000
ANS/
USF
WS
Tria
d St
udy
sam
ple
loca
tion.
R6-1
1R6
-2Am
trak
Brid
ge to
Be
nnin
g Ro
ad B
ridge
XSp
atia
l Cov
erag
eN
Cent
er c
hann
el n
ear K
enilw
orth
Par
k N
orth
Lan
dfill
Mov
ed so
uthw
est t
o pr
ovid
e be
tter
long
itudi
nal c
over
age
betw
een
hist
oric
sam
ple
loca
tions
. In
cen
ter o
f cha
nnel
.
R6-1
4N
ew L
ocat
ion
k Br
idge
to B
enni
ng R
oad
Brid
geSp
atia
l Cov
erag
eSh
arp
mea
nder
ups
trea
m o
f Ken
ilwor
th P
ark
Nor
th L
andf
illAd
ded
to c
hara
cter
ize
thal
weg
at s
harp
mea
nder
ben
d
R6-1
3R6
-3Am
trak
Brid
ge to
Be
nnin
g Ro
ad B
ridge
XX
Spat
ial C
over
age
NSh
arp
mea
nder
ups
trea
m o
f Ken
ilwor
th P
ark
Nor
th L
andf
illM
oved
wes
t to
bett
er c
hara
cter
ize
wel
l-dev
elop
ed p
oint
bar
at s
harp
mea
nder
.
R6-1
7R6
-4Am
trak
Brid
ge to
Be
nnin
g Ro
ad B
ridge
XX
Verif
icat
ion,
Out
fall
YCo
nflu
ence
with
Low
er B
eave
rdam
Cre
ek96
ft fr
om 2
000
ANS/
USF
WS
Tria
d St
udy
sam
ple
loca
tion
R6-1
5R6
-5Am
trak
Brid
ge to
Be
nnin
g Ro
ad B
ridge
XSp
atia
l Cov
erag
eN
Nor
th b
ank
betw
een
year
200
0 tr
anse
cts
Mov
ed sl
ight
ly n
orth
wes
t to
bett
er c
hara
cter
ize
geom
orph
ic su
rfac
e (a
way
from
tran
sitio
nal a
rea)
.
R6-1
6R6
-6Am
trak
Brid
ge to
Be
nnin
g Ro
ad B
ridge
Spat
ial C
over
age
NCh
arac
teriz
atio
n fo
r hum
an h
ealth
(ped
estr
ian
acce
ss to
riv
erba
nk)
R6-1
2R6
-7Am
trak
Brid
ge to
Be
nnin
g Ro
ad B
ridge
Spat
ial C
over
age
NCh
arac
teriz
atio
n fo
r hum
an h
ealth
(ped
estr
ian
acce
ss to
riv
erba
nk)
R6-0
5R6
-8Am
trak
Brid
ge to
Be
nnin
g Ro
ad B
ridge
Spat
ial C
over
age
NM
outh
of o
utfa
ll at
nor
thw
est b
ound
ary
of th
e Pe
pco
site
R6-0
4R6
-9Am
trak
Brid
ge to
Be
nnin
g Ro
ad B
ridge
XSp
atia
l Cov
erag
eN
At so
uth
side
of m
outh
of i
nlet
for o
utfa
ll at
nor
thw
est
boun
dar y
of t
he P
epco
site
Mov
ed so
uthw
est t
o be
in a
dep
ositi
on a
rea,
whe
re fl
ow fr
om o
utfa
ll m
eets
mai
n ch
anne
l.
R6-0
1R6
-10
Amtr
ak B
ridge
to
Benn
ing
Road
Brid
geX
Spat
ial C
over
age
NAt
mou
th o
f inl
et fo
r out
fall
at so
uthw
est b
ound
ary
of th
e Pe
pco
site
Mov
ed e
ast t
o be
clo
ser t
o ou
tfal
l
R6-0
2R6
-11
Amtr
ak B
ridge
to
Benn
ing
Road
Brid
geSp
atia
l Cov
erag
eY
Cent
er c
hann
el o
ff of
Pep
co si
te; n
ear A
NS
2000
sam
ple
(con
cent
ratio
n 11
19 u
g/kg
)M
oved
wes
t to
be in
the
thal
weg
.
R6-0
6R6
-12
Amtr
ak B
ridge
to
Benn
ing
Road
Brid
geSp
atia
l Cov
erag
eN
Nea
rsho
re se
dim
ent b
ar o
ff of
Ken
ilwor
th P
ark
Sout
h La
ndfil
l, in
tran
sect
with
R6-
17M
oved
slig
htly
sout
h to
be
mid
way
bet
wee
n ex
istin
g tr
anse
cts.
R6-1
0R6
-13
Amtr
ak B
ridge
to
Benn
ing
Road
Brid
geX
Spat
ial C
over
age
NN
ears
hore
off
of K
enilw
orth
Par
k N
orth
Lan
dfill
Mov
ed sl
ight
ly so
uthw
est a
nd c
lose
r to
bank
to b
ette
r rep
rese
nt g
eom
ophi
c de
posit
ion
area
.

TABL
E 1
Mod
ifica
tions
to P
ropo
sed
Sedi
men
t Sam
plin
g Lo
catio
ns a
s Def
ined
in th
e W
ork
Plan
(Jan
uary
29,
201
4 v
ersi
on) P
age
4 of
5
Fina
l Sam
ple
Loca
tion
Tabl
e (W
P 5.
1) 2
-6-1
4.xl
sx6/
9/20
14
New
Nam
eN
ame
Reac
hPo
re
Wat
erDe
ep
Sedi
men
tRa
tiona
le
Prox
imat
e to
Ex
istin
gSa
mpl
eLo
catio
n
Not
es, I
nclu
ding
Rat
iona
le fo
r Mov
ing,
Rem
ovin
g, o
r Add
ing
Prop
osed
Sam
ple
Loca
tions
:
I
n m
ain
tabl
e re
d hi
ghlig
htin
g sig
nifie
s re
mov
ed lo
catio
ns, g
reen
hig
hlig
ht id
entif
ies a
dded
loca
tions
, yel
low
hig
hlig
ht m
eans
upd
ated
cel
l val
ue, a
nd b
lue
text
indi
cate
s the
loca
tion
was
m
oved
.R6
-14
k Br
idge
to B
enni
ng R
oad
Brid
geSp
atia
l Cov
erag
eN
Nea
rsho
re o
ff of
Ken
ilwor
th P
ark
Nor
th L
andf
illSu
ffici
ent s
patia
l/geo
mor
phic
cov
erag
e in
are
a
R6-0
8R6
-15
Amtr
ak B
ridge
to
Benn
ing
Road
Brid
geSp
atia
l Cov
erag
eY
Bar a
t mou
th o
f Wat
ts B
ranc
h; n
ear A
NS
2000
sam
ple
(con
cent
ratio
n 59
9 ug
/kg)
85 ft
from
200
0 AN
S/U
SFW
S Tr
iad
Stud
y sa
mpl
e lo
catio
n
R6-0
3R6
-16
Amtr
ak B
ridge
to
Benn
ing
Road
Brid
geX
Spat
ial C
over
age
NM
id-c
hann
el o
ff of
Pep
co si
teM
oved
nor
th to
be
in th
alw
eg a
nd m
idw
ay b
etw
een
exist
ing
tran
sect
s.
R6-0
7R6
-17
Amtr
ak B
ridge
to
Benn
ing
Road
Brid
geX
Spat
ial C
over
age
NW
est b
ank
near
Ken
ilwor
th P
ark
Sout
h La
ndfil
lM
oved
to o
ppos
ite si
de o
f cha
nnel
to b
e in
unc
hara
cter
ized
geo
mor
phic
surf
ace.
R7-0
1R7
-1U
pper
tida
l lim
it to
Am
trak
Brid
geX
Verif
icat
ion
YTr
anse
ct a
t New
Yor
k Av
e. B
ridge
nea
r exi
stin
g ye
ar 2
000
poin
t47
ft fr
om 2
000
ANS/
USF
WS
Tria
d St
udy
sam
ple
loca
tion
R7-0
2R7
-2U
pper
tida
l lim
it to
Am
trak
Brid
geX
Verif
icat
ion
YTr
anse
ct a
t New
Yor
k Av
e. B
ridge
nea
r exi
stin
g ye
ar 2
000
poin
t99
ft fr
om 2
000
ANS/
USF
WS
Tria
d St
udy
sam
ple
loca
tion
R7-0
4R7
-3U
pper
tida
l lim
it to
Am
trak
Brid
geX
Spat
ial C
over
age
NTr
anse
ct n
ear c
onflu
ence
with
Due
ling
Cree
kM
oved
sout
heas
t to
be in
thal
weg
R7-0
5R7
-4U
pper
tida
l lim
it to
Am
trak
Brid
geX
Spat
ial C
over
age
NTr
anse
ct n
ear c
onflu
ence
with
Due
ling
Cree
k
R7-0
6R7
-5U
pper
tida
l lim
it to
Am
trak
Brid
geX
XSp
atia
l Cov
erag
eN
Cent
er c
hann
el d
owns
trea
m fr
om u
nnam
ed w
etla
nd
trib
utar
yR7
-07
New
Loc
atio
ner
tida
l lim
it to
Am
trak
Brid
geSp
atia
l Cov
erag
eW
est b
ank
near
Col
mar
Man
or C
omm
unity
Par
kAd
ded
to c
hara
cter
ize
geom
ophi
c en
viro
nmen
t alo
ng w
est b
ank
R7-0
9R7
-6U
pper
tida
l lim
it to
Am
trak
Brid
geX
Verif
icat
ion
YN
ear y
ear 2
000
tran
sect
R7-0
8R7
-7U
pper
tida
l lim
it to
Am
trak
Brid
geX
Verif
icat
ion
YN
ear y
ear 2
000
tran
sect
R7-1
1R7
-8U
pper
tida
l lim
it to
Am
trak
Brid
geX
Verif
icat
ion
YLo
cate
d ne
ar y
ear 2
000
poin
t; tr
anse
ct w
ith R
7-9
Clos
est 2
000
ANS/
USF
WS
Tria
d St
udy
sam
ple
loca
tion
is 1,
113
ft a
way
R7-1
2R7
-9U
pper
tida
l lim
it to
Am
trak
Brid
geX
Out
fall
NCo
nflu
ence
with
unn
amed
trib
utar
y at
out
fall
PG-T
MP-
13M
oved
slig
htly
eas
t int
o un
char
acte
rized
geo
mor
phic
surf
ace
and
clos
er to
out
fall
R7-1
6R7
-10
Upp
er ti
dal l
imit
to
Amtr
ak B
ridge
Verif
icat
ion
YCe
nter
cha
nnel
sedi
men
t bar
; nea
r yea
r 200
0 tr
anse
ct65
ft fr
om 2
000
ANS/
USF
WS
Tria
d St
udy
sam
ple
loca
tion
R7-1
5R7
-11
Upp
er ti
dal l
imit
to
Amtr
ak B
ridge
XVe
rific
atio
nY
Cent
er c
hann
el se
dim
ent b
ar; n
ear y
ear 2
000
tran
sect
93 ft
from
200
0 AN
S/U
SFW
S Tr
iad
Stud
y sa
mpl
e lo
catio
n
R7-1
9R7
-12
Upp
er ti
dal l
imit
to
Amtr
ak B
ridge
XO
utfa
llN
Conf
luen
ce w
ith u
nnam
ed tr
ibut
ary
at o
utfa
ll PG
-TM
P-5
R7-2
1R7
-13
Upp
er ti
dal l
imit
to
Amtr
ak B
ridge
Spat
ial C
over
age
NCe
nter
cha
nnel
sedi
men
t bar
R7-2
3R7
-14
Upp
er ti
dal l
imit
to
Amtr
ak B
ridge
XVe
rific
atio
nY
Ups
trea
m o
n N
orth
east
Bra
nch
near
yea
r 200
0 po
int
Clos
est 2
000
ANS/
USF
WS
Tria
d St
udy
sam
ple
loca
tion
is 1,
086
ft a
way
R7-2
2R7
-15
Upp
er ti
dal l
imit
to
Amtr
ak B
ridge
XSp
atia
l Cov
erag
eN
Ups
trea
m o
n N
orth
wes
t Bra
nch
Mov
ed to
war
d co
nflu
ence
to a
void
influ
ence
s fro
m u
pstr
eam
ped
estr
ian
brid
ge
R7-1
8R7
-16
Upp
er ti
dal l
imit
to
Amtr
ak B
ridge
Spat
ial C
over
age
NCh
arac
teriz
atio
n fo
r hum
an h
ealth
(ped
estr
ian
acce
ss to
riv
erba
nk)
R7-0
3R7
-17
Upp
er ti
dal l
imit
to
Amtr
ak B
ridge
Spat
ial C
over
age
NCh
arac
teriz
atio
n fo
r hum
an h
ealth
(ped
estr
ian
acce
ss to
riv
erba
nk)
Does
not
app
ear t
o be
in a
typi
cally
acc
essib
le a
rea.
R7-1
0T-
75-B
Upp
er ti
dal l
imit
to
Amtr
ak B
ridge
Spat
ial C
over
age
NCe
nter
cha
nnel
mid
way
bet
wee
n R7
-7 a
nd R
7-8
Mov
ed n
orth
east
to c
ente
r of c
hann
el.
R7-2
0T-
79-B
Upp
er ti
dal l
imit
to
Amtr
ak B
ridge
Spat
ial C
over
age
NSo
uthe
ast o
f Bla
dens
burg
Roa
d Br
idge
alo
ng n
orth
east
ban
kM
oved
dow
nstr
eam
to e
dge
of ri
p ra
p to
avo
id in
fluen
ce b
y up
stre
am ro
ad b
ridge
R7-1
8er
tida
l lim
it to
Am
trak
Brid
geSp
atia
l Cov
erag
eN
Adja
cent
to p
ier s
truc
ture
at B
lade
nsbu
rg m
arin
aAd
ditio
nal c
hara
cter
izat
ion
in m
arin
a ar
ea u
nnec
essa
ry
R7-1
3R7
-19
Upp
er ti
dal l
imit
to
Amtr
ak B
ridge
XSp
atia
l Cov
erag
eN
Thal
weg
nea
r Bla
dens
burg
mar
ina
Mov
ed to
end
of d
ocks
, nea
r tha
lweg
R7-1
4R7
-20
Upp
er ti
dal l
imit
to
Amtr
ak B
ridge
Spat
ial C
over
age
NAd
jace
nt to
shor
elin
e at
Bla
dens
burg
mar
ina
R7-1
7R7
-21
Upp
er ti
dal l
imit
to
Amtr
ak B
ridge
XSp
atia
l Cov
erag
eN
Nor
th o
f mid
-cha
nnel
bar
to th
e no
rth
of B
lade
nsbu
rg
mar
ina
Mov
ed n
orth
of m
id-c
hann
el b
ar w
here
cha
nnel
wid
ens a
nd d
epos
ition
is li
kely
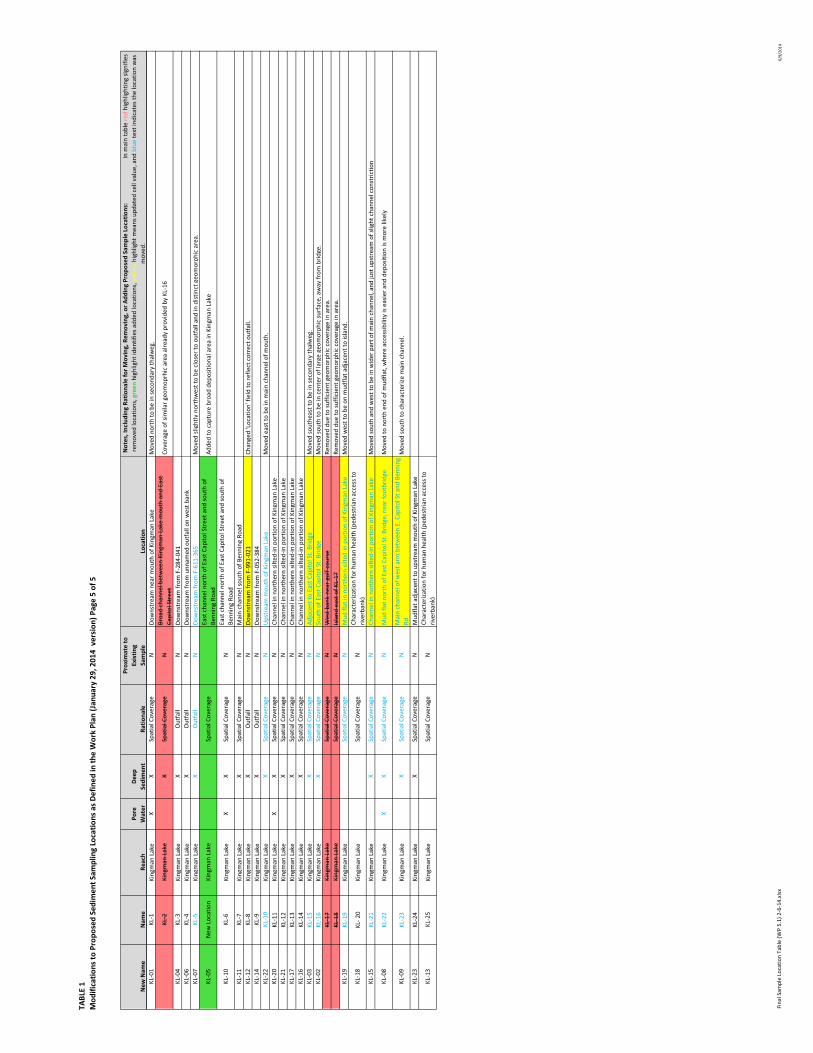
TABL
E 1
Mod
ifica
tions
to P
ropo
sed
Sedi
men
t Sam
plin
g Lo
catio
ns a
s Def
ined
in th
e W
ork
Plan
(Jan
uary
29,
201
4 v
ersi
on) P
age
5 of
5
Fina
l Sam
ple
Loca
tion
Tabl
e (W
P 5.
1) 2
-6-1
4.xl
sx6/
9/20
14
New
Nam
eN
ame
Reac
hPo
re
Wat
erDe
ep
Sedi
men
tRa
tiona
le
Prox
imat
e to
Ex
istin
gSa
mpl
eLo
catio
n
Not
es, I
nclu
ding
Rat
iona
le fo
r Mov
ing,
Rem
ovin
g, o
r Add
ing
Prop
osed
Sam
ple
Loca
tions
:
I
n m
ain
tabl
e re
d hi
ghlig
htin
g sig
nifie
s re
mov
ed lo
catio
ns, g
reen
hig
hlig
ht id
entif
ies a
dded
loca
tions
, yel
low
hig
hlig
ht m
eans
upd
ated
cel
l val
ue, a
nd b
lue
text
indi
cate
s the
loca
tion
was
m
oved
.KL
-01
KL-1
King
man
Lak
eX
XSp
atia
l Cov
erag
eN
Dow
nstr
eam
nea
r mou
th o
f Kin
gman
Lak
eM
oved
nor
th to
be
in se
cond
ary
thal
weg
.
KL-2
King
man
Lak
eX
Spat
ial C
over
age
NBr
oad
chan
nel b
etw
een
King
man
Lak
e m
outh
and
Eas
t Ca
pito
l Str
eet
Cove
rage
of s
imila
r geo
mop
rhic
are
a al
read
y pr
ovid
ed b
y KL
-16
KL-0
4KL
-3Ki
n gm
an L
ake
XO
utfa
llN
Dow
nstr
eam
from
F-2
84-0
41KL
-06
KL-4
King
man
Lak
eX
Out
fall
NDo
wns
trea
m fr
om u
nnam
ed o
utfa
ll on
wes
t ban
kKL
-07
KL-5
King
man
Lak
eX
Out
fall
NDo
wns
trea
m fr
om F
-611
-365
Mov
ed sl
ight
ly n
orth
wes
t to
be c
lose
r to
outf
all a
nd in
dist
inct
geo
mor
phic
are
a.
KL-0
5N
ew L
ocat
ion
King
man
Lak
eSp
atia
l Cov
erag
eEa
st c
hann
el n
orth
of E
ast C
apito
l Str
eet a
nd so
uth
of
Benn
ing
Road
Adde
d to
cap
ture
bro
ad d
epos
ition
al a
rea
in K
ingm
an L
ake
KL-1
0KL
-6Ki
ngm
an L
ake
XX
Spat
ial C
over
age
NEa
st c
hann
el n
orth
of E
ast C
apito
l Str
eet a
nd so
uth
of
Benn
ing
Road
KL-1
1KL
-7Ki
ngm
an L
ake
XSp
atia
l Cov
erag
eN
Mai
n ch
anne
l sou
th o
f Ben
ning
Roa
dKL
-12
KL-8
King
man
Lak
eX
Out
fall
NDo
wns
trea
m fr
om F
-991
-021
Chan
ged
'Loc
atio
n' fi
eld
to re
flect
cor
rect
out
fall.
KL-1
4KL
-9Ki
ngm
an L
ake
XO
utfa
llN
Dow
nstr
eam
from
F-0
52-3
84KL
-22
KL-1
0Ki
ngm
an L
ake
XSp
atia
l Cov
erag
eN
Ups
trea
m m
outh
of K
ingm
an L
ake
Mov
ed e
ast t
o be
in m
ain
chan
nel o
f mou
th.
KL-2
0KL
-11
King
man
Lak
eX
XSp
atia
l Cov
erag
eN
Chan
nel i
n no
rthe
rn si
lted-
in p
ortio
n of
Kin
gman
Lak
eKL
-21
KL-1
2Ki
ngm
an L
ake
XSp
atia
l Cov
erag
eN
Chan
nel i
n no
rthe
rn si
lted-
in p
ortio
n of
Kin
gman
Lak
eKL
-17
KL-1
3Ki
ngm
an L
ake
XSp
atia
l Cov
erag
eN
Chan
nel i
n no
rthe
rn si
lted-
in p
ortio
n of
Kin
gman
Lak
eKL
-16
KL-1
4Ki
ngm
an L
ake
XSp
atia
l Cov
erag
eN
Chan
nel i
n no
rthe
rn si
lted-
in p
ortio
n of
Kin
gman
Lak
eKL
-03
KL-1
5Ki
ngm
an L
ake
XSp
atia
l Cov
erag
eN
Adja
cent
to E
ast C
apito
l St.
Brid
geM
oved
sout
heas
t to
be in
seco
ndar
y th
alw
eg.
KL-0
2KL
-16
King
man
Lak
eX
Spat
ial C
over
age
NSo
uth
of E
ast C
apito
l St.
Brid
geM
oved
sout
h to
be
in c
ente
r of l
arge
geo
mor
phic
surf
ace,
aw
ay fr
om b
ridge
.KL
-17
King
man
Lak
eSp
atia
l Cov
erag
eN
Wes
t ban
k ne
ar g
olf c
ours
eRe
mov
ed d
ue to
suffi
cien
t geo
mor
phic
cov
erag
e in
are
a.KL
-18
King
man
Lak
eSp
atia
l Cov
erag
eN
Isla
nd e
ast o
f KL-
17Re
mov
ed d
ue to
suffi
cien
t geo
mor
phic
cov
erag
e in
are
a.KL
-19
KL-1
9Ki
ngm
an L
ake
Spat
ial C
over
age
NM
ud fl
at in
nor
ther
n sil
ted-
in p
ortio
n of
Kin
gman
Lak
eM
oved
wes
t to
be o
n m
udfla
t adj
acen
t to
islan
d.
KL-1
8KL
- 20
King
man
Lak
eSp
atia
l Cov
erag
eN
Char
acte
rizat
ion
for h
uman
hea
lth (p
edes
tria
n ac
cess
to
river
bank
)KL
-15
KL-2
1Ki
ngm
an L
ake
XSp
atia
l Cov
erag
eN
Chan
nel i
n no
rthe
rn si
lted-
in p
ortio
n of
Kin
gman
Lak
eM
oved
sout
h an
d w
est t
o be
in w
ider
par
t of m
ain
chan
nel,
and
just
ups
trea
m o
f slig
ht c
hann
el c
onst
rictio
n
KL-0
8KL
-22
King
man
Lak
eX
XSp
atia
l Cov
erag
eN
Mud
flat
nor
th o
f Eas
t Cap
itol S
t. Br
idge
, nea
r foo
tbrid
geM
oved
to n
orth
end
of m
udfla
t, w
here
acc
essib
ility
is e
asie
r and
dep
ositi
on is
mor
e lik
ely
KL-0
9KL
-23
King
man
Lak
eX
Spat
ial C
over
age
NM
ain
chan
nel o
f wes
t arm
bet
wee
n E.
Cap
itol S
t and
Ben
ning
Rd
Mov
ed so
uth
to c
hara
cter
ize
mai
n ch
anne
l.
KL-2
3KL
-24
King
man
Lak
eX
Spat
ial C
over
age
NM
udfla
t adj
acen
t to
upst
ream
mou
th o
f Kin
gman
Lak
e
KL-1
3KL
-25
King
man
Lak
eSp
atia
l Cov
erag
eN
Char
acte
rizat
ion
for h
uman
hea
lth (p
edes
tria
n ac
cess
to
river
bank
)