QUARTERLY MACROECONOMIC AND FISCAL BULLETIN
39
QUARTERLY MACROECONOMIC AND FISCAL BULLETIN Third Quarterly Report FY1399 Macroeconomic and Fiscal Policy Directorate General (MFPD) Ministry of Finance Meezan 1399 (October 2020)
Transcript of QUARTERLY MACROECONOMIC AND FISCAL BULLETIN
QUARTERLY MACROECONOMIC
AND FISCAL BULLETIN
Third Quarterly Report
FY1399
Macroeconomic and Fiscal Policy
Directorate General (MFPD)
Ministry of Finance
Meezan 1399 (October 2020)
3rd Quarterly Macroeconomic and Fiscal Bulletin, FY 1399
Quarterly Macroeconomic and Fiscal
Bulletin
3rd Quarterly Report FY1399
Afghanistan’s Macroeconomic and Fiscal Performance
Macroeconomic and Fiscal Policy Directorate General (MFPD)
Ministry of Finance, Afghanistan
Meezan 1399 (October 2020)
Acknowledgments
The Quarterly Macroeconomic and Fiscal Bulletin (QMFB), which is published every quarter in a fiscal
year, outlines the country’s macroeconomic and fiscal performance during a quarter and compares the
fiscal performance of current quarter with the previous quarter. It covers recent economic
developments, revenue collection performance, and expenditure execution by sector, province and
inputs, and presents the fiscal sustainability and fiscal balance of a quarter.
The Quarterly Macroeconomic and Fiscal Bulletin is intended for a wide audience, including policy
makers, the development partners, the private sector, and the community analysts and professionals
engaged in Afghanistan’s economy.
This document was prepared by the staff of Macroeconomic and Fiscal Policy Directorate General of
the Ministry of Finance. The authors are grateful for the cooperation, comments and suggestions
received from the Government officials with respect to sharing of the data and statistics.
3rd Quarterly Macroeconomic and Fiscal Bulletin, FY 1399
Table of contents
Executive Summary ..................................................................................................................................... 2
Macroeconomic Overview .......................................................................................................................... 5
Revenue Performance ................................................................................................................................. 8
Revenues Collection by Key Provinces .................................................................................................... 9
Grants ........................................................................................................................................................... 11
Expenditure Performance ........................................................................................................................ 13
Operating and Development Expenditure ............................................................................................ 13
Expenditures by Sector……………….…………………………………………………………………………….16
Expenditure by COFOG ............................................................................................................................ 17
Expenditure Summary by Inputs ............................................................................................................ 18
Debt ............................................................................................................................................................... 20
Fiscal Sustainability .................................................................................................................................. 21
Fiscal Balance ............................................................................................................................................. 23
Annexure ...................................................................................................................................................... 25
3rd Quarterly Macroeconomic and Fiscal Bulletin, FY 1399
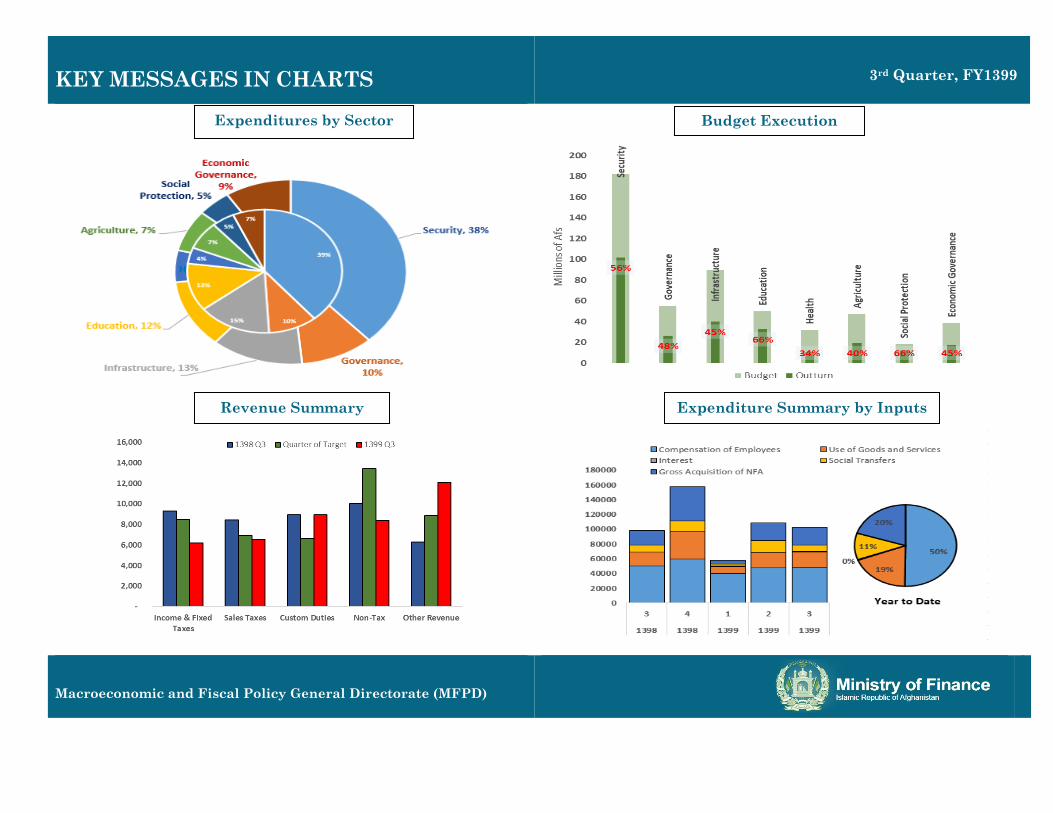
KEY MESSAGES IN CHARTS
3rd Quarter, FY1399
Macroeconomic and Fiscal Policy General Directorate (MFPD)
Budget Execution
Rate
Expenditure Summary by Inputs
Expenditures by Sector
Revenue Summary
3rd Quarterly Macroeconomic and Fiscal Bulletin, FY 1399
2
Executive Summary
Afghanistan’s economy experienced substantial improvement in development outcomes since 2001, mainly in expanded access
to water, sanitation, electricity, education, and health sectors. The country’s macroeconomic management remains strong,
domestic revenue have increased dramatically since FY1393 (2014) and major public financial management reforms have been
implemented.
Afghanistan’s economy grew by 3.9 percent in FY1398, driven mainly by strong growth in agriculture sector following recovery
from drought. At the same time, the country continued to experience insecurity and political uncertainty. During the first half
of FY1399, Afghanistan’s economy has been hard-hit by the spread of the COVID-19, which mainly impacted on consumption,
exports, and remittance. The economy contracted sharply over the first half of the year, where GDP growth was expected to
reach to negative 5 percent during the year. With the favorable weather condition in the country, wheat production and other
agriculture crop have supported in agriculture growth, but both industry and service outputs have hardly impacted due to
lockdowns, restrictions, and border closures.
The government gradually eased restrictions and lockdown during the third quarter of FY1399. All borders and air-corridors
were reopened, where trade (export and imports) activities accelerated with international markets. These all led to a notable
increase in economic growth that improved economic activities, consumptions, trade activities, investments during the third
quarter of FY1399.
Household consumption has highly declined due to a sharp reduction in household’s incomes, disruption to services and retail
activities. In addition, investment has also been affected negatively due to the COVID-19 crisis. Poverty rate is expected to
have worsened after the COVID-19 pandemic that hugely impacted the living condition of households. And is expected to
remain high, driven by weak labor demand and security-related constrains on service deliver.
Prices during FY1399, rapidly increased due to the vast spread of the Covid-19 and pandemic. Food items were highly affected
by border closers and pandemic issue, which increased to 9 percent in the second quarter of FY1399, but slightly decline in the
third quarter of FY1399. The average inflation rate in the second quarter was 4.2 percent, but declined during the third quarter
of the year.
3rd Quarterly Macroeconomic and Fiscal Bulletin, FY 1399
3
Price stability is an ultimate goal of the country. During all three quarters of FY1399, Afghani currency depreciated against
the Euro and Swiss France, but appreciated against Indian rupee, Pakistani Rupee, US dollar, and major international
currency that are exchange in the Afghan markets. Currency exchange rate remained fluctuated against the US dollar in
between Afs 76 to Afs 77 during all three quarters and will continue to be at this price by end of the year.
Domestic revenue performance continued to be strong till end of FY1398 with total collection of Afs 207.3 billion which means
it reached the yearly target. Domestic revenues reached to 15.7 percent of GDP. The strong revenue performance was mainly
driven by one-off revenue collections of Afs 32 billion, of which Afs 24 billion were transferred from Da Afghanistan Bank
operating profit. Domestic revenue for the FY1399 was target Afs 209 billion, but due to COVID-19 crisis around the country
and globe, the target was declined to Afs 177 billion. The collection in the first and second quarters of FY1399 had rapidly
deteriorated driven by reduced economic activity, restrictions on international trade, and deteriorating compliance, core
domestic revenues were lower by 34 percent against the target. The collection continued to be lower in the third quarter of
FY1399. Total government’s revenue collection including grants till the end of the third quarter of FY1399 was Afs 232.5
billion, of which Afs 121.1 billion were collected from domestic sources. Domestic revenue collection till the end of the third
quarter was 11 percent lower than the same period in FY1398 driven by the impact of COVID-19, weak confidence, political
uncertainty, and continued insecurity in the country. Similarly, revenue collection including donor grants has fallen by 7
percent as a result of reduction in grants in the third quarter of FY1399.
Government spending by the end of the third quarter reached Afs 215.1 billion. Recurrent spending reached Afs 183 billion
with an estimated execution rate of 59 percent. Recurrent expenditure shows similar amount of spending compared with the
same period of last year. The development budget execution shows 41 percent spending. Spending was 11 percent higher
compared with same period of last year. Higher development budget execution was driven by discretionary development
spending. Donor financed non-discretionary projects are currently undergoing significant restructuring to funding the
responds to the COVID-19 pandemic.
Overall operating balance was positive in this period. Total operating budget for the year 1399 was Afs 310 billion. Total budget
allocation for both operating and development was Afs 519 billion which will relatively adjust by end of the year due to
pandemic issue in the country.
3rd Quarterly Macroeconomic and Fiscal Bulletin, FY 1399
4
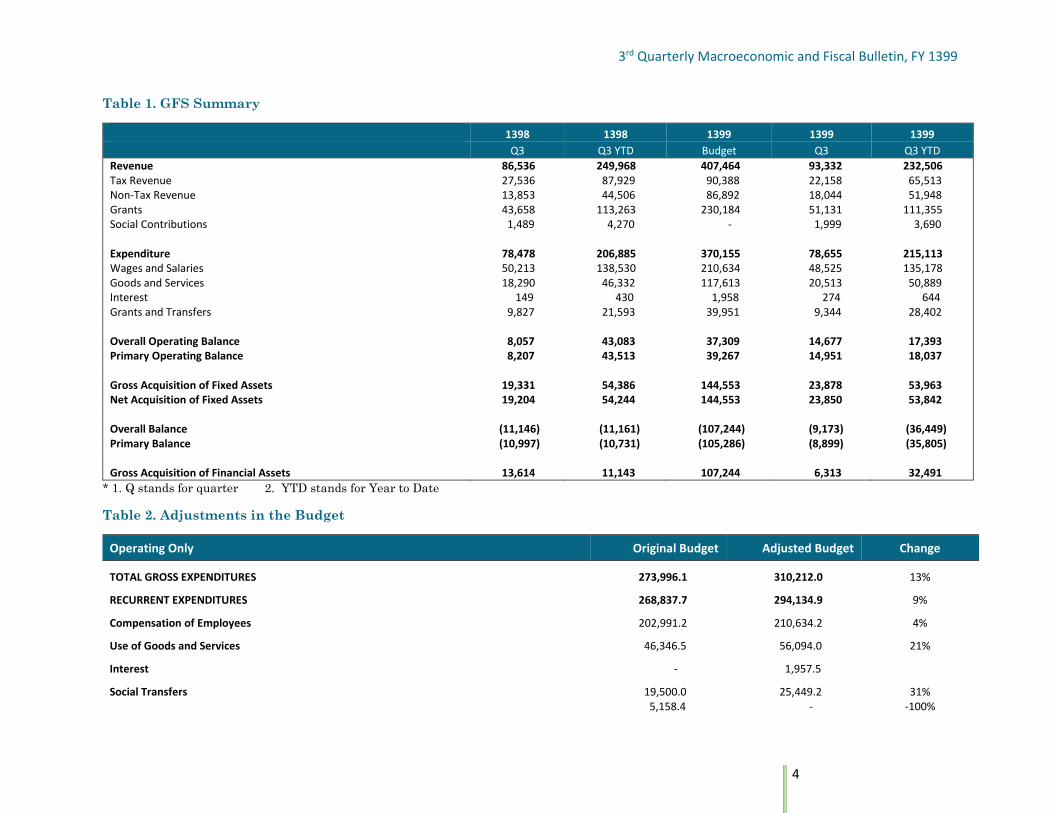
Table 1. GFS Summary
1398 1398 1399 1399 1399
Q3 Q3 YTD Budget Q3 Q3 YTD
Revenue 86,536 249,968 407,464 93,332 232,506 Tax Revenue 27,536 87,929 90,388 22,158 65,513 Non-Tax Revenue 13,853 44,506 86,892 18,044 51,948 Grants 43,658 113,263 230,184 51,131 111,355 Social Contributions 1,489 4,270 - 1,999 3,690 Expenditure 78,478 206,885 370,155 78,655 215,113 Wages and Salaries 50,213 138,530 210,634 48,525 135,178 Goods and Services 18,290 46,332 117,613 20,513 50,889 Interest 149 430 1,958 274 644 Grants and Transfers 9,827 21,593 39,951 9,344 28,402 Overall Operating Balance 8,057 43,083 37,309 14,677 17,393 Primary Operating Balance 8,207 43,513 39,267 14,951 18,037 Gross Acquisition of Fixed Assets 19,331 54,386 144,553 23,878 53,963 Net Acquisition of Fixed Assets 19,204 54,244 144,553 23,850 53,842 Overall Balance (11,146) (11,161) (107,244) (9,173) (36,449) Primary Balance (10,997) (10,731) (105,286) (8,899) (35,805) Gross Acquisition of Financial Assets 13,614 11,143 107,244 6,313 32,491
* 1. Q stands for quarter 2. YTD stands for Year to Date
Table 2. Adjustments in the Budget
Operating Only Original Budget Adjusted Budget Change
TOTAL GROSS EXPENDITURES 273,996.1 310,212.0 13%
RECURRENT EXPENDITURES 268,837.7 294,134.9 9%
Compensation of Employees 202,991.2 210,634.2 4%
Use of Goods and Services 46,346.5 56,094.0 21%
Interest - 1,957.5
Social Transfers 19,500.0 25,449.2 31% 5,158.4 - -100%
3rd Quarterly Macroeconomic and Fiscal Bulletin, FY 1399
5
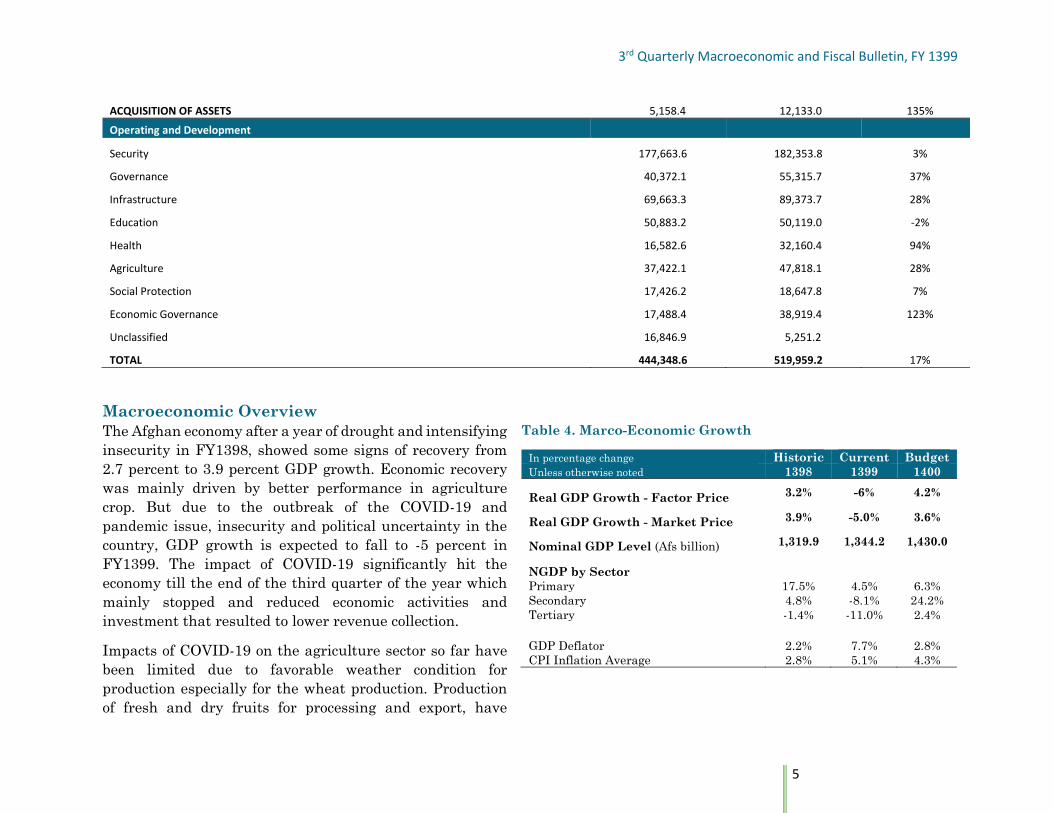
ACQUISITION OF ASSETS 5,158.4 12,133.0 135%
Operating and Development
Security 177,663.6 182,353.8 3%
Governance 40,372.1 55,315.7 37%
Infrastructure 69,663.3 89,373.7 28%
Education 50,883.2 50,119.0 -2%
Health 16,582.6 32,160.4 94%
Agriculture 37,422.1 47,818.1 28%
Social Protection 17,426.2 18,647.8 7%
Economic Governance 17,488.4 38,919.4 123%
Unclassified 16,846.9 5,251.2
TOTAL 444,348.6 519,959.2 17%
Macroeconomic Overview
The Afghan economy after a year of drought and intensifying
insecurity in FY1398, showed some signs of recovery from
2.7 percent to 3.9 percent GDP growth. Economic recovery
was mainly driven by better performance in agriculture
crop. But due to the outbreak of the COVID-19 and
pandemic issue, insecurity and political uncertainty in the
country, GDP growth is expected to fall to -5 percent in
FY1399. The impact of COVID-19 significantly hit the
economy till the end of the third quarter of the year which
mainly stopped and reduced economic activities and
investment that resulted to lower revenue collection.
Impacts of COVID-19 on the agriculture sector so far have
been limited due to favorable weather condition for
production especially for the wheat production. Production
of fresh and dry fruits for processing and export, have
Table 4. Marco-Economic Growth
In percentage change Historic Current Budget
Unless otherwise noted 1398 1399 1400
Real GDP Growth - Factor Price 3.2% -6% 4.2%
Real GDP Growth - Market Price 3.9% -5.0% 3.6%
Nominal GDP Level (Afs billion) 1,319.9 1,344.2 1,430.0
NGDP by Sector
Primary 17.5% 4.5% 6.3%
Secondary 4.8% -8.1% 24.2%
Tertiary -1.4% -11.0% 2.4%
GDP Deflator 2.2% 7.7% 2.8%
CPI Inflation Average 2.8% 5.1% 4.3%
3rd Quarterly Macroeconomic and Fiscal Bulletin, FY 1399
6
negatively impacted due to disruption to supply chains and
closure of international markets and export routes.
Industry and service sectors have strongly impacted by the
spread of the COVID-19 in the country till the end of the
third quarter of FY1399. Border closures and banned of
international markets impacted highly on export companies
and those that rely on imported inputs. Business activities
also negatively impacted by contraction in customer demand
during this period. Demand for goods and services declined
highly due to lockdown measures.
The government gradually eased restrictions and lockdown
during the third quarter of FY1399. All borders and air-
corridors were reopened, where trade (export and imports)
activities accelerated with international markets. These all
led to a notable increase in economic growth that improved
economic activities, consumptions, trade activities,
investments during the third quarter of FY1399.
It is expected with the post pandemic global economic
recovery and normal situation in the country, economic
growth will pick up to 3.6 percent in FY1400, subject to the
post pandemic global economic recovery.
Household consumption has highly declined due to a sharp
reduction in household’s incomes, disruption to services and
retail activities. In addition, investment has also been
affected negatively due to the COVID-19 crisis. Poverty rate
is expected to have worsened after the COVID-19 pandemic
that hugely impacted the living condition of households. And
is expected to remain high, driven by weak labor demand
and security-related constrains on service deliver.
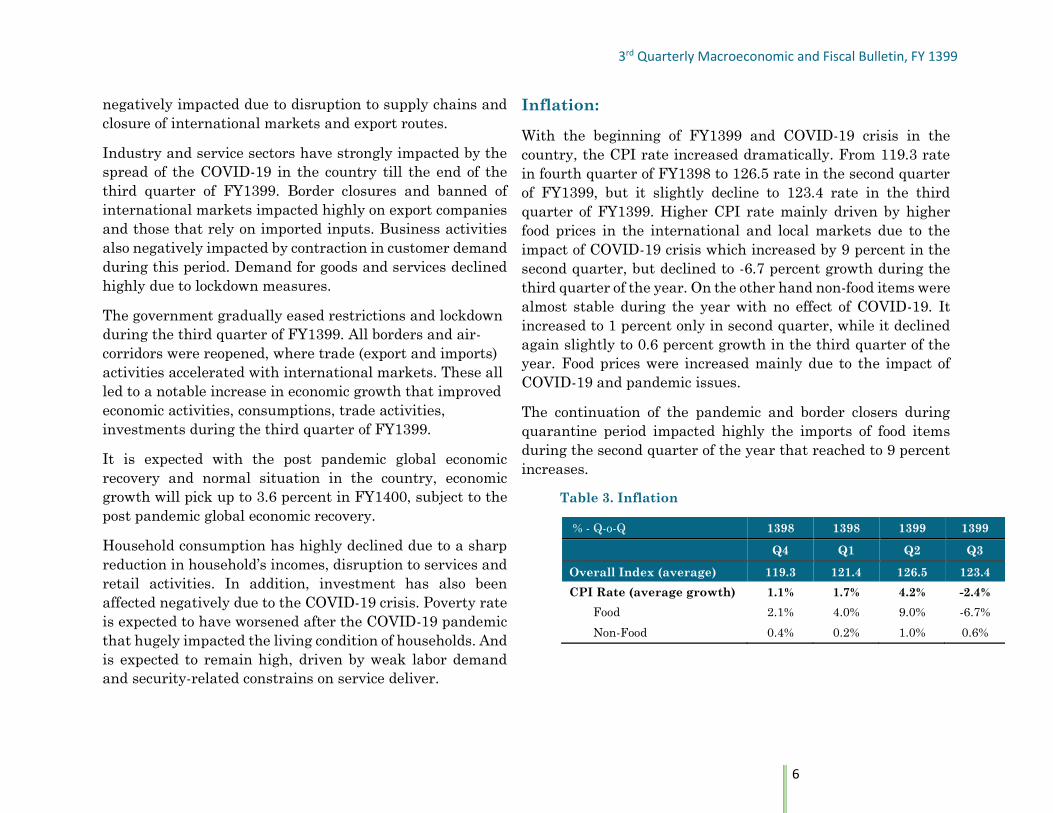
Inflation:
With the beginning of FY1399 and COVID-19 crisis in the
country, the CPI rate increased dramatically. From 119.3 rate
in fourth quarter of FY1398 to 126.5 rate in the second quarter
of FY1399, but it slightly decline to 123.4 rate in the third
quarter of FY1399. Higher CPI rate mainly driven by higher
food prices in the international and local markets due to the
impact of COVID-19 crisis which increased by 9 percent in the
second quarter, but declined to -6.7 percent growth during the
third quarter of the year. On the other hand non-food items were
almost stable during the year with no effect of COVID-19. It
increased to 1 percent only in second quarter, while it declined
again slightly to 0.6 percent growth in the third quarter of the
year. Food prices were increased mainly due to the impact of
COVID-19 and pandemic issues.
The continuation of the pandemic and border closers during
quarantine period impacted highly the imports of food items
during the second quarter of the year that reached to 9 percent
increases.
Table 3. Inflation
% - Q-o-Q 1398 1398 1399 1399
Q4 Q1 Q2 Q3
Overall Index (average) 119.3 121.4 126.5 123.4
CPI Rate (average growth) 1.1% 1.7% 4.2% -2.4%
Food 2.1% 4.0% 9.0% -6.7%
Non-Food 0.4% 0.2% 1.0% 0.6%
3rd Quarterly Macroeconomic and Fiscal Bulletin, FY 1399
7
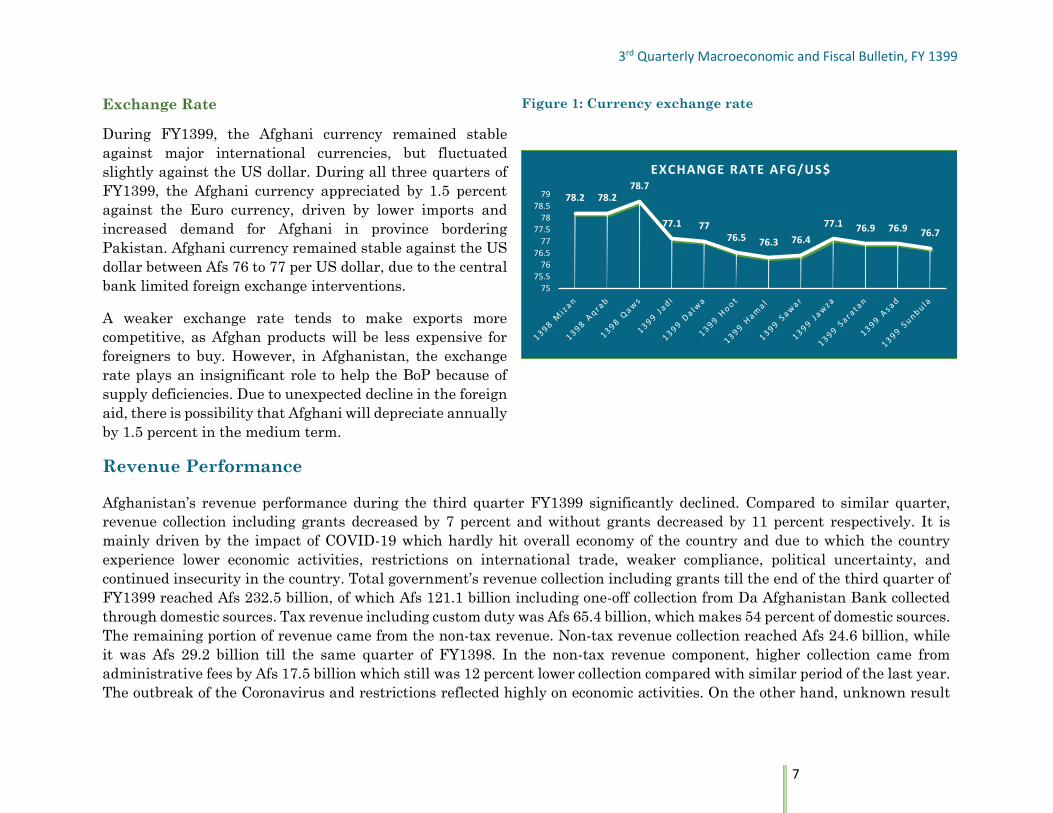
Exchange Rate
During FY1399, the Afghani currency remained stable
against major international currencies, but fluctuated
slightly against the US dollar. During all three quarters of
FY1399, the Afghani currency appreciated by 1.5 percent
against the Euro currency, driven by lower imports and
increased demand for Afghani in province bordering
Pakistan. Afghani currency remained stable against the US
dollar between Afs 76 to 77 per US dollar, due to the central
bank limited foreign exchange interventions.
A weaker exchange rate tends to make exports more
competitive, as Afghan products will be less expensive for
foreigners to buy. However, in Afghanistan, the exchange
rate plays an insignificant role to help the BoP because of
supply deficiencies. Due to unexpected decline in the foreign
aid, there is possibility that Afghani will depreciate annually
by 1.5 percent in the medium term.
Figure 1: Currency exchange rate
Revenue Performance
Afghanistan’s revenue performance during the third quarter FY1399 significantly declined. Compared to similar quarter,
revenue collection including grants decreased by 7 percent and without grants decreased by 11 percent respectively. It is
mainly driven by the impact of COVID-19 which hardly hit overall economy of the country and due to which the country
experience lower economic activities, restrictions on international trade, weaker compliance, political uncertainty, and
continued insecurity in the country. Total government’s revenue collection including grants till the end of the third quarter of
FY1399 reached Afs 232.5 billion, of which Afs 121.1 billion including one-off collection from Da Afghanistan Bank collected
through domestic sources. Tax revenue including custom duty was Afs 65.4 billion, which makes 54 percent of domestic sources.
The remaining portion of revenue came from the non-tax revenue. Non-tax revenue collection reached Afs 24.6 billion, while
it was Afs 29.2 billion till the same quarter of FY1398. In the non-tax revenue component, higher collection came from
administrative fees by Afs 17.5 billion which still was 12 percent lower collection compared with similar period of the last year.
The outbreak of the Coronavirus and restrictions reflected highly on economic activities. On the other hand, unknown result
78.2 78.278.7
77.1 7776.5 76.3 76.4
77.1 76.9 76.9 76.7
75
75.5
76
76.5
77
77.5
78
78.5
79
EXCHANGE RATE AFG/US$
3rd Quarterly Macroeconomic and Fiscal Bulletin, FY 1399
8
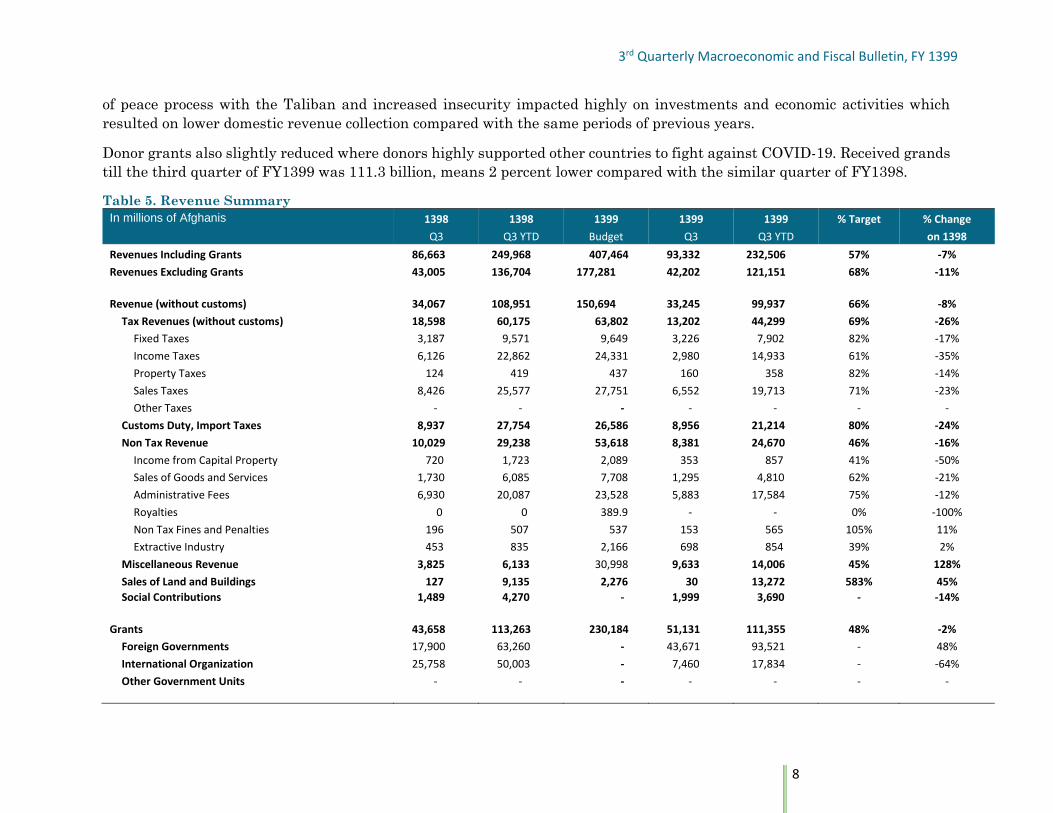
of peace process with the Taliban and increased insecurity impacted highly on investments and economic activities which
resulted on lower domestic revenue collection compared with the same periods of previous years.
Donor grants also slightly reduced where donors highly supported other countries to fight against COVID-19. Received grands
till the third quarter of FY1399 was 111.3 billion, means 2 percent lower compared with the similar quarter of FY1398.
Table 5. Revenue Summary
In millions of Afghanis 1398 1398 1399 1399 1399 % Target % Change
Q3 Q3 YTD Budget Q3 Q3 YTD on 1398
Revenues Including Grants 86,663 249,968 407,464 93,332 232,506 57% -7%
Revenues Excluding Grants 43,005 136,704 177,281 42,202 121,151 68% -11%
Revenue (without customs) 34,067 108,951 150,694 33,245 99,937 66% -8%
Tax Revenues (without customs) 18,598 60,175 63,802 13,202 44,299 69% -26%
Fixed Taxes 3,187 9,571 9,649 3,226 7,902 82% -17%
Income Taxes 6,126 22,862 24,331 2,980 14,933 61% -35%
Property Taxes 124 419 437 160 358 82% -14%
Sales Taxes 8,426 25,577 27,751 6,552 19,713 71% -23%
Other Taxes - - - - - - -
Customs Duty, Import Taxes 8,937 27,754 26,586 8,956 21,214 80% -24%
Non Tax Revenue 10,029 29,238 53,618 8,381 24,670 46% -16%
Income from Capital Property 720 1,723 2,089 353 857 41% -50%
Sales of Goods and Services 1,730 6,085 7,708 1,295 4,810 62% -21%
Administrative Fees 6,930 20,087 23,528 5,883 17,584 75% -12%
Royalties 0 0 389.9 - - 0% -100%
Non Tax Fines and Penalties 196 507 537 153 565 105% 11%
Extractive Industry 453 835 2,166 698 854 39% 2%
Miscellaneous Revenue 3,825 6,133 30,998 9,633 14,006 45% 128%
Sales of Land and Buildings 127 9,135 2,276 30 13,272 583% 45%
Social Contributions 1,489 4,270 - 1,999 3,690 - -14%
Grants 43,658 113,263 230,184 51,131 111,355 48% -2%
Foreign Governments 17,900 63,260 - 43,671 93,521 - 48%
International Organization 25,758 50,003 - 7,460 17,834 - -64%
Other Government Units - - - - - - -
3rd Quarterly Macroeconomic and Fiscal Bulletin, FY 1399
9
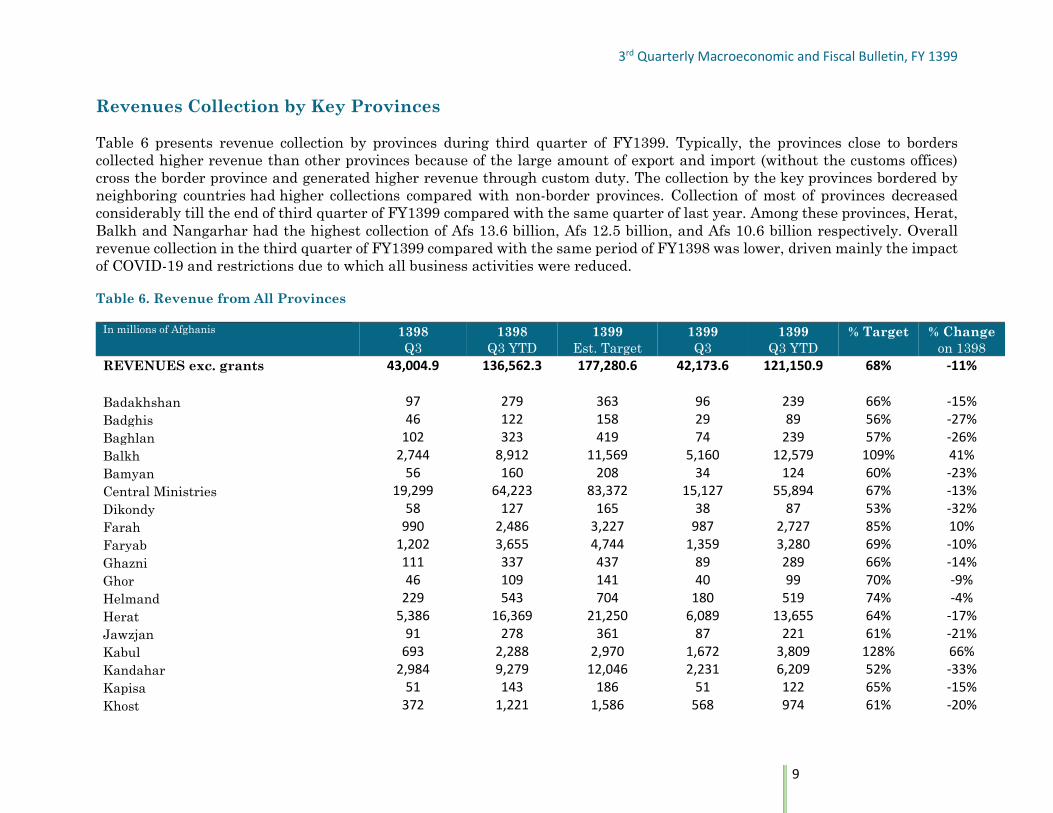
Revenues Collection by Key Provinces
Table 6 presents revenue collection by provinces during third quarter of FY1399. Typically, the provinces close to borders
collected higher revenue than other provinces because of the large amount of export and import (without the customs offices)
cross the border province and generated higher revenue through custom duty. The collection by the key provinces bordered by
neighboring countries had higher collections compared with non-border provinces. Collection of most of provinces decreased
considerably till the end of third quarter of FY1399 compared with the same quarter of last year. Among these provinces, Herat,
Balkh and Nangarhar had the highest collection of Afs 13.6 billion, Afs 12.5 billion, and Afs 10.6 billion respectively. Overall
revenue collection in the third quarter of FY1399 compared with the same period of FY1398 was lower, driven mainly the impact
of COVID-19 and restrictions due to which all business activities were reduced.
Table 6. Revenue from All Provinces
In millions of Afghanis 1398 1398 1399 1399 1399 % Target % Change
Q3 Q3 YTD Est. Target Q3 Q3 YTD on 1398
REVENUES exc. grants 43,004.9 136,562.3 177,280.6 42,173.6 121,150.9 68% -11%
Badakhshan 97 279 363 96 239 66% -15%
Badghis 46 122 158 29 89 56% -27%
Baghlan 102 323 419 74 239 57% -26%
Balkh 2,744 8,912 11,569 5,160 12,579 109% 41%
Bamyan 56 160 208 34 124 60% -23%
Central Ministries 19,299 64,223 83,372 15,127 55,894 67% -13%
Dikondy 58 127 165 38 87 53% -32%
Farah 990 2,486 3,227 987 2,727 85% 10%
Faryab 1,202 3,655 4,744 1,359 3,280 69% -10%
Ghazni 111 337 437 89 289 66% -14%
Ghor 46 109 141 40 99 70% -9%
Helmand 229 543 704 180 519 74% -4%
Herat 5,386 16,369 21,250 6,089 13,655 64% -17%
Jawzjan 91 278 361 87 221 61% -21%
Kabul 693 2,288 2,970 1,672 3,809 128% 66%
Kandahar 2,984 9,279 12,046 2,231 6,209 52% -33%
Kapisa 51 143 186 51 122 65% -15%
Khost 372 1,221 1,586 568 974 61% -20%
3rd Quarterly Macroeconomic and Fiscal Bulletin, FY 1399
10
Kunar 63 184 239 45 130 54% -29%
Kunduz 333 1,083 1,405 347 1,087 77% 0%
Laghman 56 172 224 107 187 84% 9%
Logar 52 112 146 30 86 59% -24%
Nangarhar 5,044 14,615 18,972 4,384 10,677 56% -27%
Nimroz 1,751 5,734 7,444 2,245 5,168 69% -10%
Nuristan 26 53 69 17 43 63% -19%
Offshore Payments 0 0 0 0 0 - -
Paktika 237 913 1,186 59 205 17% -78%
Paktiya 315 1,363 1,769 378 1,058 60% -22%
Pangsher 37 87 113 15 56 50% -35%
Parwan 135 354 460 126 295 64% -17%
Samangan 57 174 226 264 351 155% 101%
Saripul 67 163 211 57 130 62% -20%
Takhar 133 349 453 91 270 60% -23%
Uruzgan 21 70 91 19 51 56% -27%
Wardak 72 181 235 49 122 52% -33%
Zabul 45 103 133 30 80 60% -22%
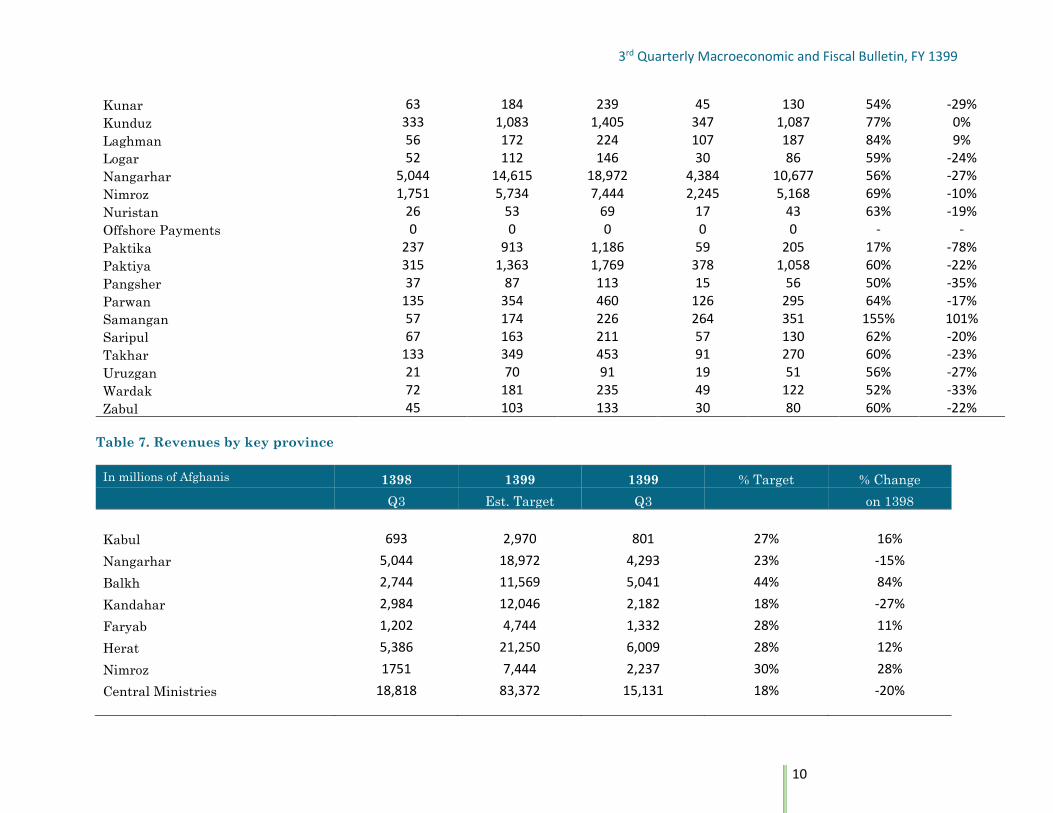
Table 7. Revenues by key province
In millions of Afghanis 1398 1399 1399 % Target % Change
Q3 Est. Target Q3 on 1398
Kabul 693 2,970 801 27% 16%
Nangarhar 5,044 18,972 4,293 23% -15%
Balkh 2,744 11,569 5,041 44% 84%
Kandahar 2,984 12,046 2,182 18% -27%
Faryab 1,202 4,744 1,332 28% 11%
Herat 5,386 21,250 6,009 28% 12%
Nimroz 1751 7,444 2,237 30% 28%
Central Ministries 18,818 83,372 15,131 18% -20%

3rd Quarterly Macroeconomic and Fiscal Bulletin, FY 1399
11
Grants
Afghanistan still remains heavily reliant on international grant support. Donor grants support to core budget which finances
major expenditure items in both operating and development budget. The outcome of Geneva pledging conference 2020 was
strong expression of the international community enduring commitment to Afghanistan. Donors pledged at least US 3.3 billion
for the first year of the upcoming quadrennial, with annual commitments to stay at the same level year-on-year.
Total revenue including grants till the end of the third quarter amounted to Afs 232.5 billion out of which Afs 111.3 billion was
grants only. Table below 8a indicates the operational grants for the third quarter of FY 1399. CSTC-A in the Ministry of Defense
is the largest grants contributor consisted of 39 percent of total grants by end of third quarter while it was 56 percent during
the same fiscal period in FY1398. Funds released from LOTFA decreased by 14 percent in the third quarter from 33 percent in
the same quarter of FY 1398. Similarly, funds from CSTC-A in the Ministry of Interior decreased from 12 percent in the same
quarter of FY1398 to 3 percent in the third quarter of FY1399. Afghanistan Reconstruction Trust Fund (ARTF) increased by 38
percent compared to the same quarter of FY 1398.
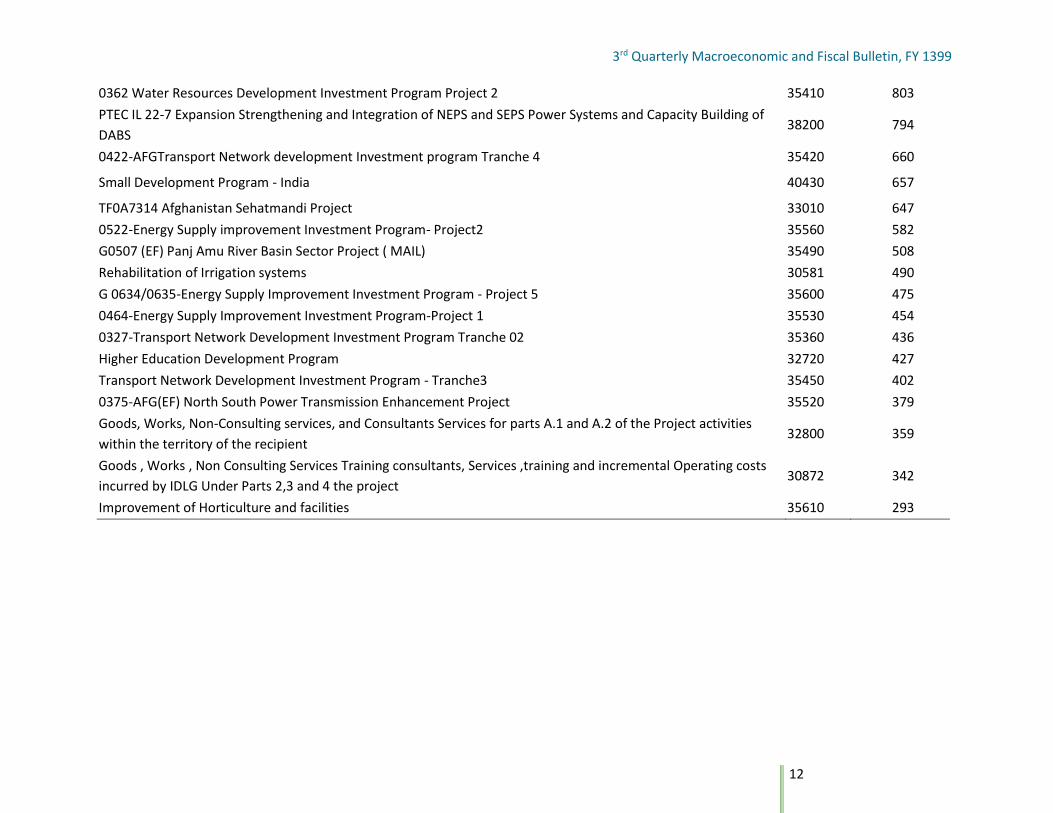
Table 8b represents the largest development projects financed through grants during the third quarter of FY1399. Two projects
related to ‘Improving Service Delivery’ are the first two largest grant provided with Afs 2.6 billion and Afs 1.6 billion
disbursement during the third quarter. Following ‘Energy Sector Development Investment Program’ was the third project
with Afs 1 billion grants expenditure during the third of the year.
Table 8a. Operating Grants
All values are in Million Afs 1398 1398 % 1399 1399 %
Q3 Q3 YTD Total Q3 Q3 YTD Total
Afghanistan Reconstruction Trust Fund (ARTF) 17 28 0% 16,043 32,550 38% Law & Order Trust Fund (LOTFA) 6,587 17,728 33% 3,598 16,246 19% CSTC-A 1 MoD 9,659 30,236 56% 12,543 33,217 39% CSTC-A 1 MoI 1,616 6,463 12% 2,721 2,721 3% 1/ Combined Security Transitional Command Afghanistan
Table 8b. Largest Development Grants for the YTD
All Values are in Million Afghanis Code 1399 YTD
Improving Service Delivery 32810 2,695
Improving Service Delivery 30940 1,530
0332 Energy Sector Development investment Program Trance 4 35430 1,001
3rd Quarterly Macroeconomic and Fiscal Bulletin, FY 1399
12
0362 Water Resources Development Investment Program Project 2 35410 803
PTEC IL 22-7 Expansion Strengthening and Integration of NEPS and SEPS Power Systems and Capacity Building of
DABS 38200 794
0422-AFGTransport Network development Investment program Tranche 4 35420 660
Small Development Program - India 40430 657
TF0A7314 Afghanistan Sehatmandi Project 33010 647
0522-Energy Supply improvement Investment Program- Project2 35560 582
G0507 (EF) Panj Amu River Basin Sector Project ( MAIL) 35490 508
Rehabilitation of Irrigation systems 30581 490
G 0634/0635-Energy Supply Improvement Investment Program - Project 5 35600 475
0464-Energy Supply Improvement Investment Program-Project 1 35530 454
0327-Transport Network Development Investment Program Tranche 02 35360 436
Higher Education Development Program 32720 427
Transport Network Development Investment Program - Tranche3 35450 402
0375-AFG(EF) North South Power Transmission Enhancement Project 35520 379
Goods, Works, Non-Consulting services, and Consultants Services for parts A.1 and A.2 of the Project activities
within the territory of the recipient 32800 359
Goods , Works , Non Consulting Services Training consultants, Services ,training and incremental Operating costs
incurred by IDLG Under Parts 2,3 and 4 the project 30872 342
Improvement of Horticulture and facilities 35610 293
3rd Quarterly Macroeconomic and Fiscal Bulletin, FY 1399
13
Expenditure Performance
Operating and Development Expenditure
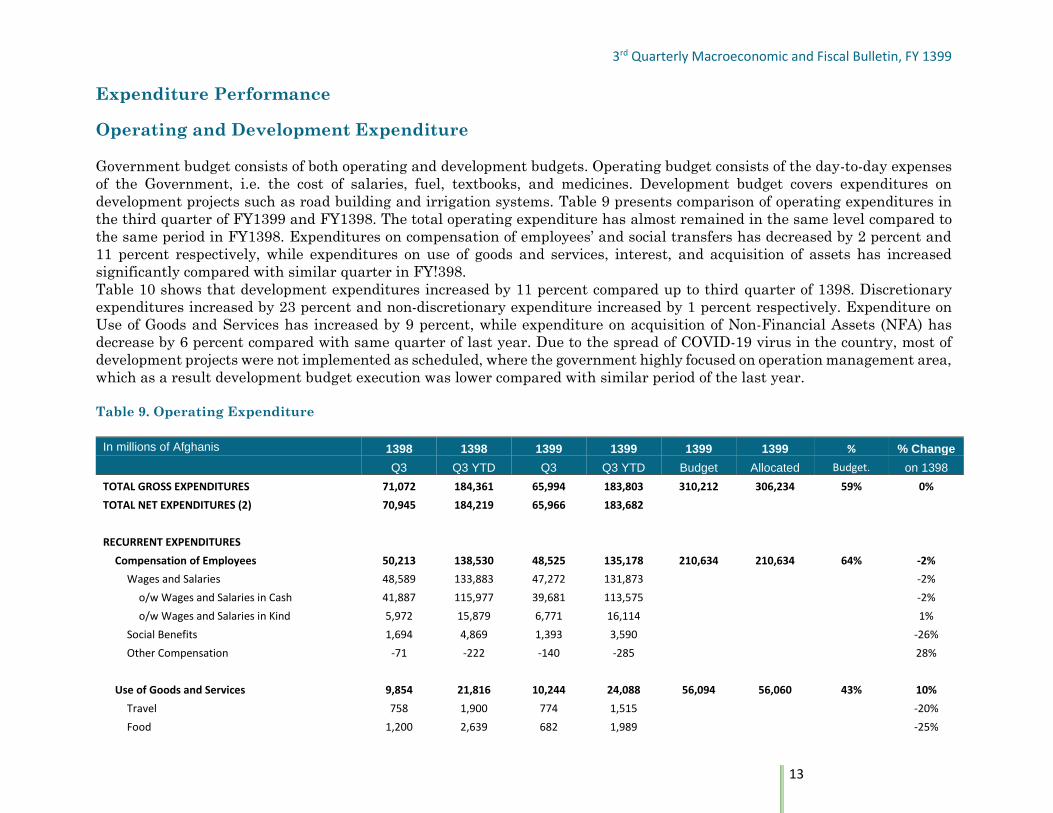
Government budget consists of both operating and development budgets. Operating budget consists of the day-to-day expenses
of the Government, i.e. the cost of salaries, fuel, textbooks, and medicines. Development budget covers expenditures on
development projects such as road building and irrigation systems. Table 9 presents comparison of operating expenditures in
the third quarter of FY1399 and FY1398. The total operating expenditure has almost remained in the same level compared to
the same period in FY1398. Expenditures on compensation of employees’ and social transfers has decreased by 2 percent and
11 percent respectively, while expenditures on use of goods and services, interest, and acquisition of assets has increased
significantly compared with similar quarter in FY!398.
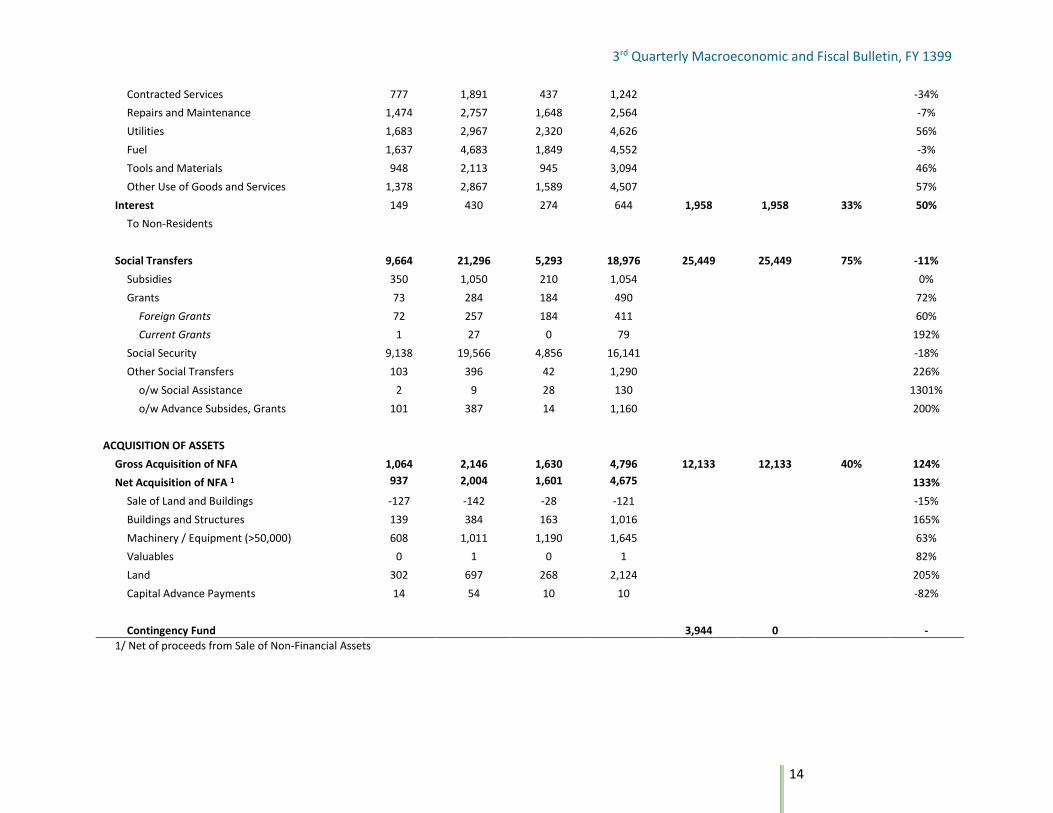
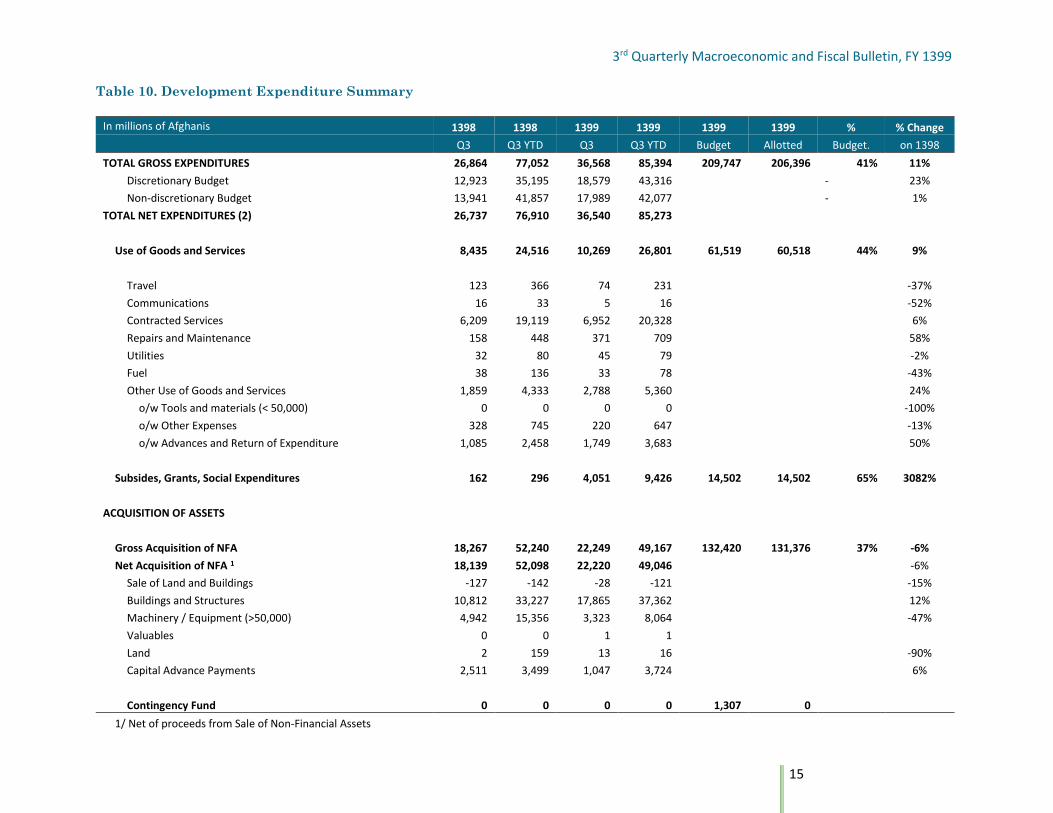
Table 10 shows that development expenditures increased by 11 percent compared up to third quarter of 1398. Discretionary
expenditures increased by 23 percent and non-discretionary expenditure increased by 1 percent respectively. Expenditure on
Use of Goods and Services has increased by 9 percent, while expenditure on acquisition of Non-Financial Assets (NFA) has
decrease by 6 percent compared with same quarter of last year. Due to the spread of COVID-19 virus in the country, most of
development projects were not implemented as scheduled, where the government highly focused on operation management area,
which as a result development budget execution was lower compared with similar period of the last year.
Table 9. Operating Expenditure
In millions of Afghanis 1398 1398 1399 1399 1399 1399 % % Change
Q3 Q3 YTD Q3 Q3 YTD Budget Allocated Budget. on 1398
TOTAL GROSS EXPENDITURES 71,072 184,361 65,994 183,803 310,212 306,234 59% 0%
TOTAL NET EXPENDITURES (2) 70,945 184,219 65,966 183,682
RECURRENT EXPENDITURES
Compensation of Employees 50,213 138,530 48,525 135,178 210,634 210,634 64% -2%
Wages and Salaries 48,589 133,883 47,272 131,873 -2%
o/w Wages and Salaries in Cash 41,887 115,977 39,681 113,575 -2%
o/w Wages and Salaries in Kind 5,972 15,879 6,771 16,114 1%
Social Benefits 1,694 4,869 1,393 3,590 -26%
Other Compensation -71 -222 -140 -285 28%
Use of Goods and Services 9,854 21,816 10,244 24,088 56,094 56,060 43% 10%
Travel 758 1,900 774 1,515 -20%
Food 1,200 2,639 682 1,989 -25%
3rd Quarterly Macroeconomic and Fiscal Bulletin, FY 1399
14
Contracted Services 777 1,891 437 1,242 -34%
Repairs and Maintenance 1,474 2,757 1,648 2,564 -7%
Utilities 1,683 2,967 2,320 4,626 56%
Fuel 1,637 4,683 1,849 4,552 -3%
Tools and Materials 948 2,113 945 3,094 46%
Other Use of Goods and Services 1,378 2,867 1,589 4,507 57%
Interest 149 430 274 644 1,958 1,958 33% 50%
To Non-Residents
Social Transfers 9,664 21,296 5,293 18,976 25,449 25,449 75% -11%
Subsidies 350 1,050 210 1,054 0%
Grants 73 284 184 490 72%
Foreign Grants 72 257 184 411 60%
Current Grants 1 27 0 79 192%
Social Security 9,138 19,566 4,856 16,141 -18%
Other Social Transfers 103 396 42 1,290 226%
o/w Social Assistance 2 9 28 130 1301%
o/w Advance Subsides, Grants 101 387 14 1,160 200%
ACQUISITION OF ASSETS
Gross Acquisition of NFA 1,064 2,146 1,630 4,796 12,133 12,133 40% 124%
Net Acquisition of NFA 1 937 2,004 1,601 4,675 133%
Sale of Land and Buildings -127 -142 -28 -121 -15%
Buildings and Structures 139 384 163 1,016 165%
Machinery / Equipment (>50,000) 608 1,011 1,190 1,645 63%
Valuables 0 1 0 1 82%
Land 302 697 268 2,124 205%
Capital Advance Payments 14 54 10 10 -82%
Contingency Fund 3,944 0 -
1/ Net of proceeds from Sale of Non-Financial Assets
3rd Quarterly Macroeconomic and Fiscal Bulletin, FY 1399
15
Table 10. Development Expenditure Summary
In millions of Afghanis 1398 1398 1399 1399 1399 1399 % % Change
Q3 Q3 YTD Q3 Q3 YTD Budget Allotted Budget. on 1398
TOTAL GROSS EXPENDITURES 26,864 77,052 36,568 85,394 209,747 206,396 41% 11%
Discretionary Budget 12,923 35,195 18,579 43,316 - 23%
Non-discretionary Budget 13,941 41,857 17,989 42,077 - 1%
TOTAL NET EXPENDITURES (2) 26,737 76,910 36,540 85,273
Use of Goods and Services 8,435 24,516 10,269 26,801 61,519 60,518 44% 9%
Travel 123 366 74 231 -37%
Communications 16 33 5 16 -52%
Contracted Services 6,209 19,119 6,952 20,328 6%
Repairs and Maintenance 158 448 371 709 58%
Utilities 32 80 45 79 -2%
Fuel 38 136 33 78 -43%
Other Use of Goods and Services 1,859 4,333 2,788 5,360 24%
o/w Tools and materials (< 50,000) 0 0 0 0 -100%
o/w Other Expenses 328 745 220 647 -13%
o/w Advances and Return of Expenditure 1,085 2,458 1,749 3,683 50%
Subsides, Grants, Social Expenditures 162 296 4,051 9,426 14,502 14,502 65% 3082%
ACQUISITION OF ASSETS
Gross Acquisition of NFA 18,267 52,240 22,249 49,167 132,420 131,376 37% -6%
Net Acquisition of NFA 1 18,139 52,098 22,220 49,046 -6%
Sale of Land and Buildings -127 -142 -28 -121 -15%
Buildings and Structures 10,812 33,227 17,865 37,362 12%
Machinery / Equipment (>50,000) 4,942 15,356 3,323 8,064 -47%
Valuables 0 0 1 1 Land 2 159 13 16 -90%
Capital Advance Payments 2,511 3,499 1,047 3,724 6%
Contingency Fund 0 0 0 0 1,307 0
1/ Net of proceeds from Sale of Non-Financial Assets
3rd Quarterly Macroeconomic and Fiscal Bulletin, FY 1399
16
Expenditures by Sector
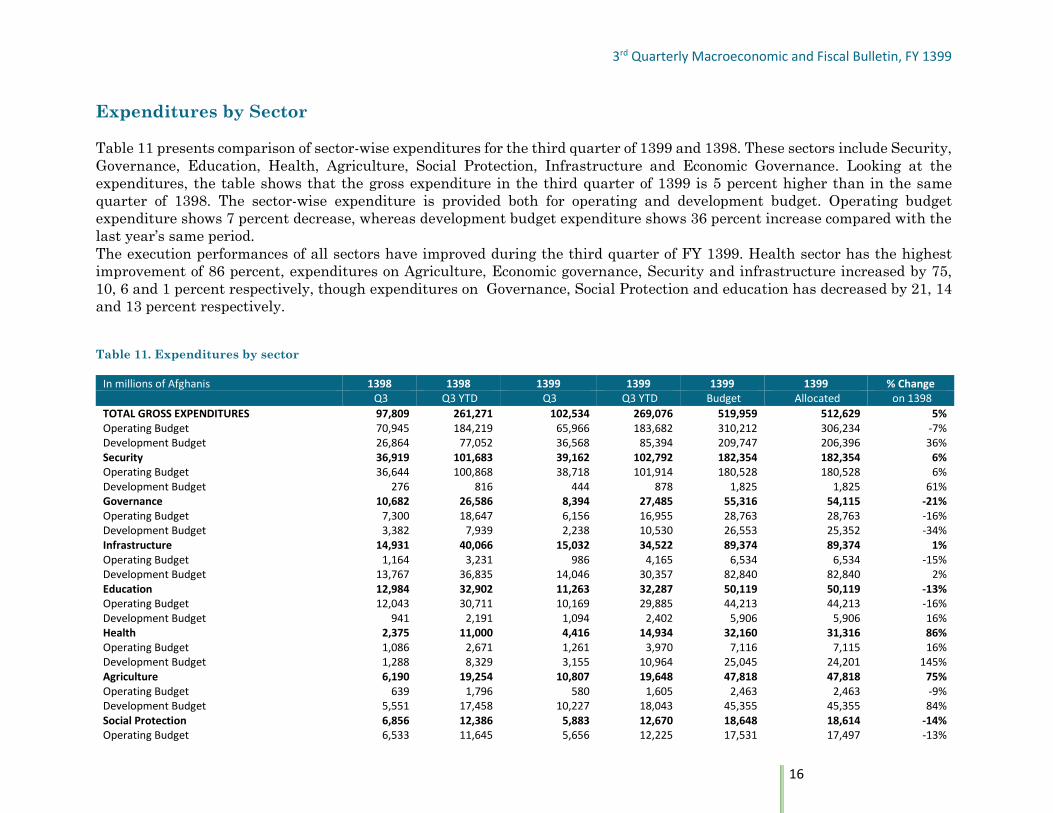
Table 11 presents comparison of sector-wise expenditures for the third quarter of 1399 and 1398. These sectors include Security,
Governance, Education, Health, Agriculture, Social Protection, Infrastructure and Economic Governance. Looking at the
expenditures, the table shows that the gross expenditure in the third quarter of 1399 is 5 percent higher than in the same
quarter of 1398. The sector-wise expenditure is provided both for operating and development budget. Operating budget
expenditure shows 7 percent decrease, whereas development budget expenditure shows 36 percent increase compared with the
last year’s same period.
The execution performances of all sectors have improved during the third quarter of FY 1399. Health sector has the highest
improvement of 86 percent, expenditures on Agriculture, Economic governance, Security and infrastructure increased by 75,
10, 6 and 1 percent respectively, though expenditures on Governance, Social Protection and education has decreased by 21, 14
and 13 percent respectively.
Table 11. Expenditures by sector
In millions of Afghanis 1398 1398 1399 1399 1399 1399 % Change Q3 Q3 YTD Q3 Q3 YTD Budget Allocated on 1398
TOTAL GROSS EXPENDITURES 97,809 261,271 102,534 269,076 519,959 512,629 5% Operating Budget 70,945 184,219 65,966 183,682 310,212 306,234 -7% Development Budget 26,864 77,052 36,568 85,394 209,747 206,396 36% Security 36,919 101,683 39,162 102,792 182,354 182,354 6% Operating Budget 36,644 100,868 38,718 101,914 180,528 180,528 6% Development Budget 276 816 444 878 1,825 1,825 61% Governance 10,682 26,586 8,394 27,485 55,316 54,115 -21% Operating Budget 7,300 18,647 6,156 16,955 28,763 28,763 -16% Development Budget 3,382 7,939 2,238 10,530 26,553 25,352 -34% Infrastructure 14,931 40,066 15,032 34,522 89,374 89,374 1% Operating Budget 1,164 3,231 986 4,165 6,534 6,534 -15% Development Budget 13,767 36,835 14,046 30,357 82,840 82,840 2% Education 12,984 32,902 11,263 32,287 50,119 50,119 -13% Operating Budget 12,043 30,711 10,169 29,885 44,213 44,213 -16% Development Budget 941 2,191 1,094 2,402 5,906 5,906 16% Health 2,375 11,000 4,416 14,934 32,160 31,316 86% Operating Budget 1,086 2,671 1,261 3,970 7,116 7,115 16% Development Budget 1,288 8,329 3,155 10,964 25,045 24,201 145% Agriculture 6,190 19,254 10,807 19,648 47,818 47,818 75% Operating Budget 639 1,796 580 1,605 2,463 2,463 -9% Development Budget 5,551 17,458 10,227 18,043 45,355 45,355 84% Social Protection 6,856 12,386 5,883 12,670 18,648 18,614 -14% Operating Budget 6,533 11,645 5,656 12,225 17,531 17,497 -13%
3rd Quarterly Macroeconomic and Fiscal Bulletin, FY 1399
17
Development Budget 323 741 227 444 1,117 1,117 -30% Economic Governance 6,872 17,393 7,577 24,738 38,919 38,919 10% Operating Budget 5,536 14,650 2,440 12,963 19,119 19,119 -56% Development Budget 1,336 2,743 5,138 11,775 19,800 19,800 285% Unclassified 0 0 0 0 5,251 0 - Operating Budget 0 0 0 0 3,944 0 - Development Budget 0 0 0 0 1,307 0 -
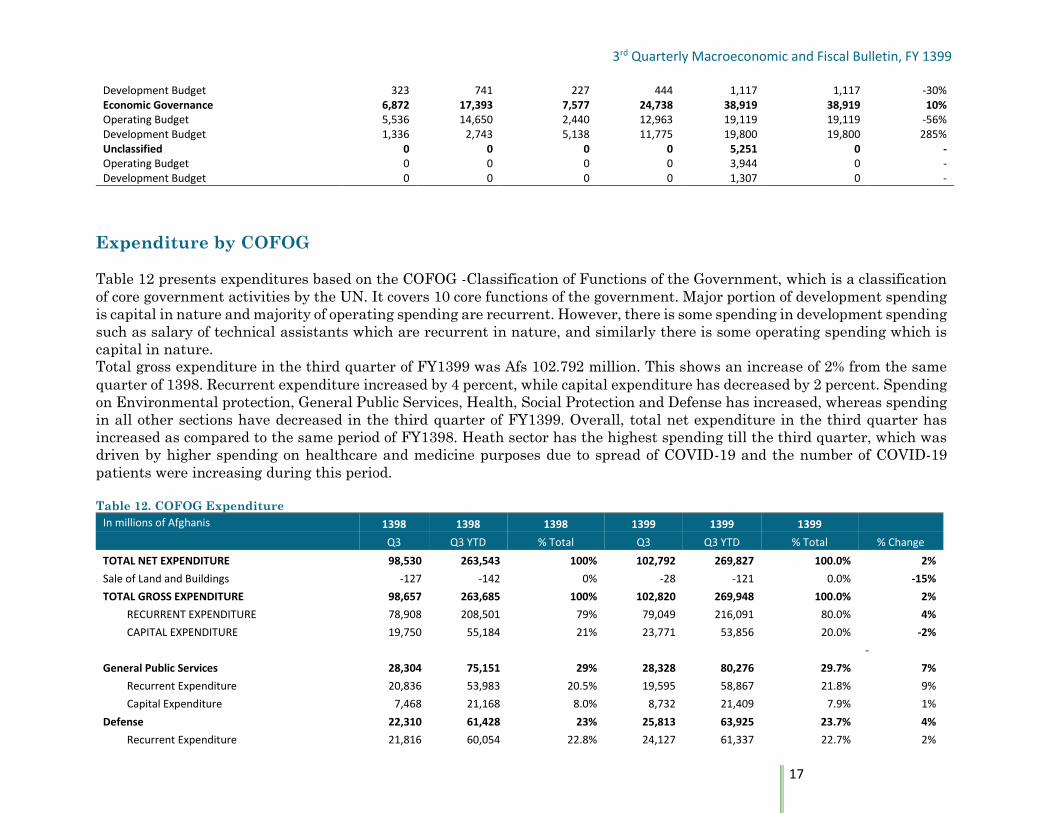
Expenditure by COFOG
Table 12 presents expenditures based on the COFOG -Classification of Functions of the Government, which is a classification
of core government activities by the UN. It covers 10 core functions of the government. Major portion of development spending
is capital in nature and majority of operating spending are recurrent. However, there is some spending in development spending
such as salary of technical assistants which are recurrent in nature, and similarly there is some operating spending which is
capital in nature.
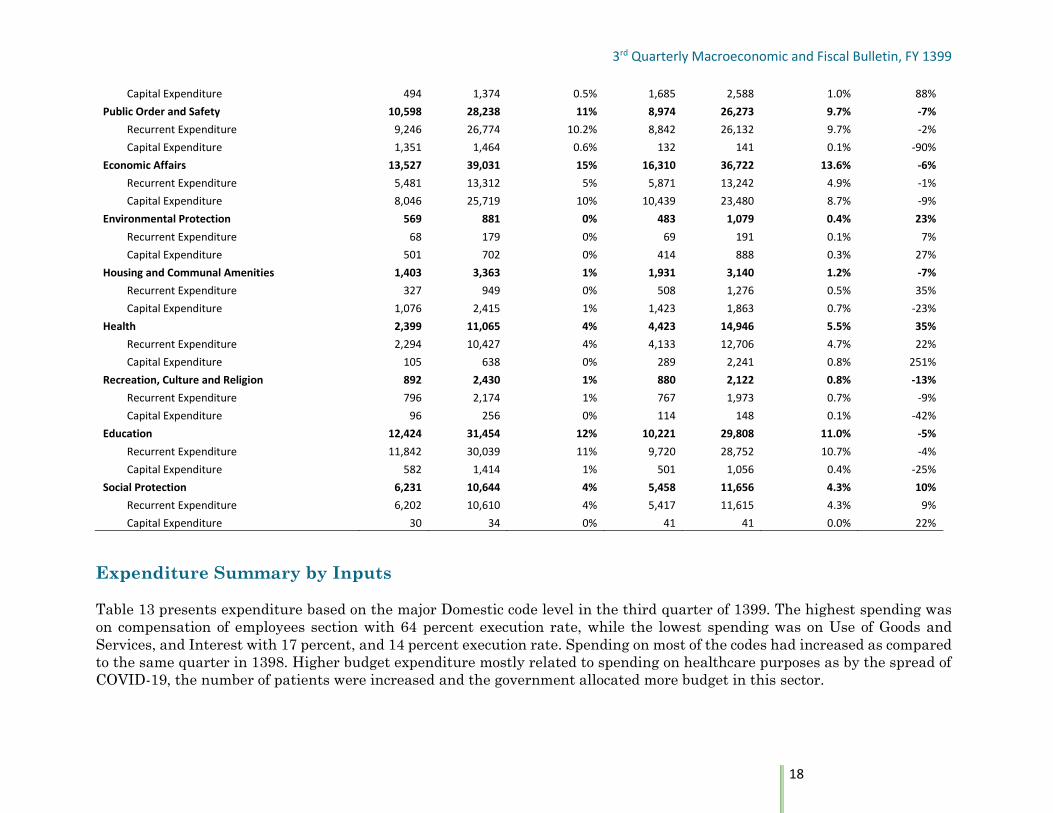
Total gross expenditure in the third quarter of FY1399 was Afs 10 .2 792 million. This shows an increase of 2% from the same
quarter of 1398. Recurrent expenditure increased by 4 percent, while capital expenditure has decreased by 2 percent. Spending
on Environmental protection, General Public Services, Health, Social Protection and Defense has increased, whereas spending
in all other sections have decreased in the third quarter of FY1399. Overall, total net expenditure in the third quarter has
increased as compared to the same period of FY1398. Heath sector has the highest spending till the third quarter, which was
driven by higher spending on healthcare and medicine purposes due to spread of COVID-19 and the number of COVID-19
patients were increasing during this period.
Table 12. COFOG Expenditure
In millions of Afghanis 1398 1398 1398 1399 1399 1399
Q3 Q3 YTD % Total Q3 Q3 YTD % Total % Change
TOTAL NET EXPENDITURE 98,530 263,543 100% 102,792 269,827 100.0% 2%
Sale of Land and Buildings -127 -142 0% -28 -121 0.0% -15%
TOTAL GROSS EXPENDITURE 98,657 263,685 100% 102,820 269,948 100.0% 2%
RECURRENT EXPENDITURE 78,908 208,501 79% 79,049 216,091 80.0% 4%
CAPITAL EXPENDITURE 19,750 55,184 21% 23,771 53,856 20.0% -2%
-
General Public Services 28,304 75,151 29% 28,328 80,276 29.7% 7%
Recurrent Expenditure 20,836 53,983 20.5% 19,595 58,867 21.8% 9%
Capital Expenditure 7,468 21,168 8.0% 8,732 21,409 7.9% 1%
Defense 22,310 61,428 23% 25,813 63,925 23.7% 4%
Recurrent Expenditure 21,816 60,054 22.8% 24,127 61,337 22.7% 2%
3rd Quarterly Macroeconomic and Fiscal Bulletin, FY 1399
18
Capital Expenditure 494 1,374 0.5% 1,685 2,588 1.0% 88%
Public Order and Safety 10,598 28,238 11% 8,974 26,273 9.7% -7%
Recurrent Expenditure 9,246 26,774 10.2% 8,842 26,132 9.7% -2%
Capital Expenditure 1,351 1,464 0.6% 132 141 0.1% -90%
Economic Affairs 13,527 39,031 15% 16,310 36,722 13.6% -6%
Recurrent Expenditure 5,481 13,312 5% 5,871 13,242 4.9% -1%
Capital Expenditure 8,046 25,719 10% 10,439 23,480 8.7% -9%
Environmental Protection 569 881 0% 483 1,079 0.4% 23%
Recurrent Expenditure 68 179 0% 69 191 0.1% 7%
Capital Expenditure 501 702 0% 414 888 0.3% 27%
Housing and Communal Amenities 1,403 3,363 1% 1,931 3,140 1.2% -7%
Recurrent Expenditure 327 949 0% 508 1,276 0.5% 35%
Capital Expenditure 1,076 2,415 1% 1,423 1,863 0.7% -23%
Health 2,399 11,065 4% 4,423 14,946 5.5% 35%
Recurrent Expenditure 2,294 10,427 4% 4,133 12,706 4.7% 22%
Capital Expenditure 105 638 0% 289 2,241 0.8% 251%
Recreation, Culture and Religion 892 2,430 1% 880 2,122 0.8% -13%
Recurrent Expenditure 796 2,174 1% 767 1,973 0.7% -9%
Capital Expenditure 96 256 0% 114 148 0.1% -42%
Education 12,424 31,454 12% 10,221 29,808 11.0% -5%
Recurrent Expenditure 11,842 30,039 11% 9,720 28,752 10.7% -4%
Capital Expenditure 582 1,414 1% 501 1,056 0.4% -25%
Social Protection 6,231 10,644 4% 5,458 11,656 4.3% 10%
Recurrent Expenditure 6,202 10,610 4% 5,417 11,615 4.3% 9%
Capital Expenditure 30 34 0% 41 41 0.0% 22%
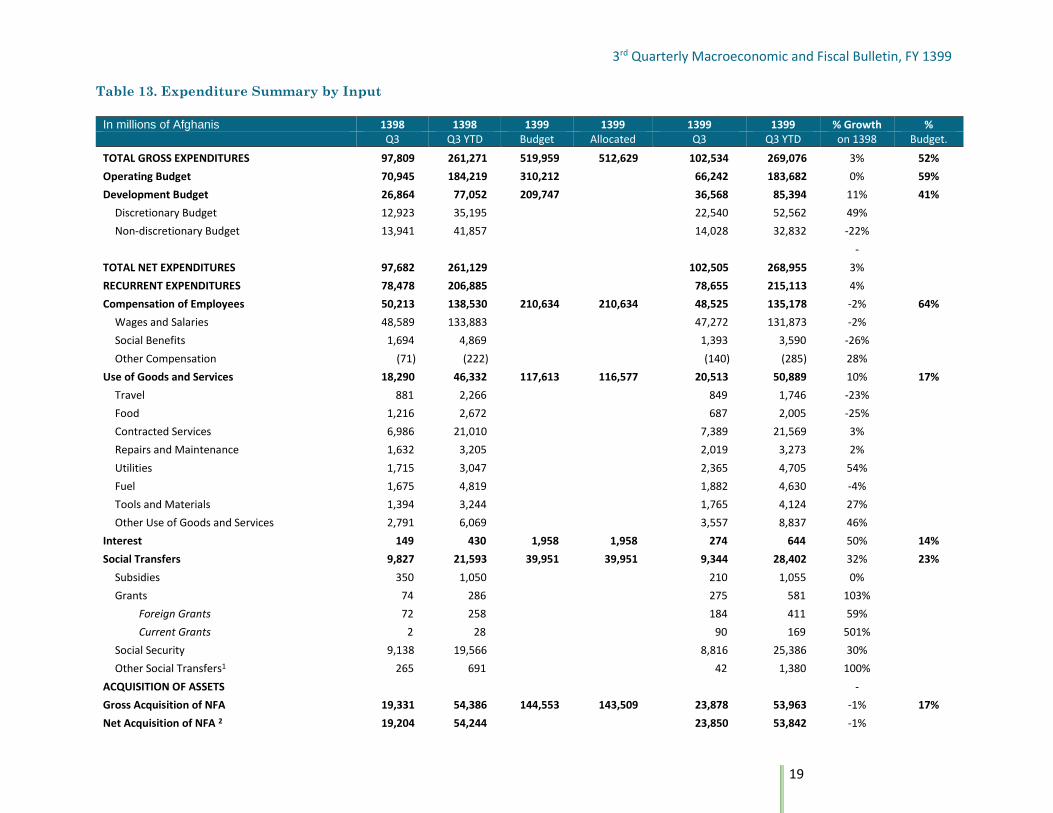
Expenditure Summary by Inputs
Table 13 presents expenditure based on the major Domestic code level in the third quarter of 1399. The highest spending was
on compensation of employees section with 64 percent execution rate, while the lowest spending was on Use of Goods and
Services, and Interest with 17 percent, and 14 percent execution rate. Spending on most of the codes had increased as compared
to the same quarter in 1398. Higher budget expenditure mostly related to spending on healthcare purposes as by the spread of
COVID-19, the number of patients were increased and the government allocated more budget in this sector.
3rd Quarterly Macroeconomic and Fiscal Bulletin, FY 1399
19
Table 13. Expenditure Summary by Input
In millions of Afghanis 1398 1398 1399 1399 1399 1399 % Growth % Q3 Q3 YTD Budget Allocated Q3 Q3 YTD on 1398 Budget.
TOTAL GROSS EXPENDITURES 97,809 261,271 519,959 512,629 102,534 269,076 3% 52%
Operating Budget 70,945 184,219 310,212 66,242 183,682 0% 59%
Development Budget 26,864 77,052 209,747 36,568 85,394 11% 41%
Discretionary Budget 12,923 35,195 22,540 52,562 49%
Non-discretionary Budget 13,941 41,857 14,028 32,832 -22%
-
TOTAL NET EXPENDITURES 97,682 261,129 102,505 268,955 3%
RECURRENT EXPENDITURES 78,478 206,885 78,655 215,113 4%
Compensation of Employees 50,213 138,530 210,634 210,634 48,525 135,178 -2% 64%
Wages and Salaries 48,589 133,883 47,272 131,873 -2%
Social Benefits 1,694 4,869 1,393 3,590 -26%
Other Compensation (71) (222) (140) (285) 28%
Use of Goods and Services 18,290 46,332 117,613 116,577 20,513 50,889 10% 17%
Travel 881 2,266 849 1,746 -23%
Food 1,216 2,672 687 2,005 -25%
Contracted Services 6,986 21,010 7,389 21,569 3%
Repairs and Maintenance 1,632 3,205 2,019 3,273 2%
Utilities 1,715 3,047 2,365 4,705 54%
Fuel 1,675 4,819 1,882 4,630 -4%
Tools and Materials 1,394 3,244 1,765 4,124 27%
Other Use of Goods and Services 2,791 6,069 3,557 8,837 46%
Interest 149 430 1,958 1,958 274 644 50% 14%
Social Transfers 9,827 21,593 39,951 39,951 9,344 28,402 32% 23%
Subsidies 350 1,050 210 1,055 0%
Grants 74 286 275 581 103%
Foreign Grants 72 258 184 411 59%
Current Grants 2 28 90 169 501%
Social Security 9,138 19,566 8,816 25,386 30%
Other Social Transfers1 265 691 42 1,380 100%
ACQUISITION OF ASSETS -
Gross Acquisition of NFA 19,331 54,386 144,553 143,509 23,878 53,963 -1% 17%
Net Acquisition of NFA 2 19,204 54,244 23,850 53,842 -1%
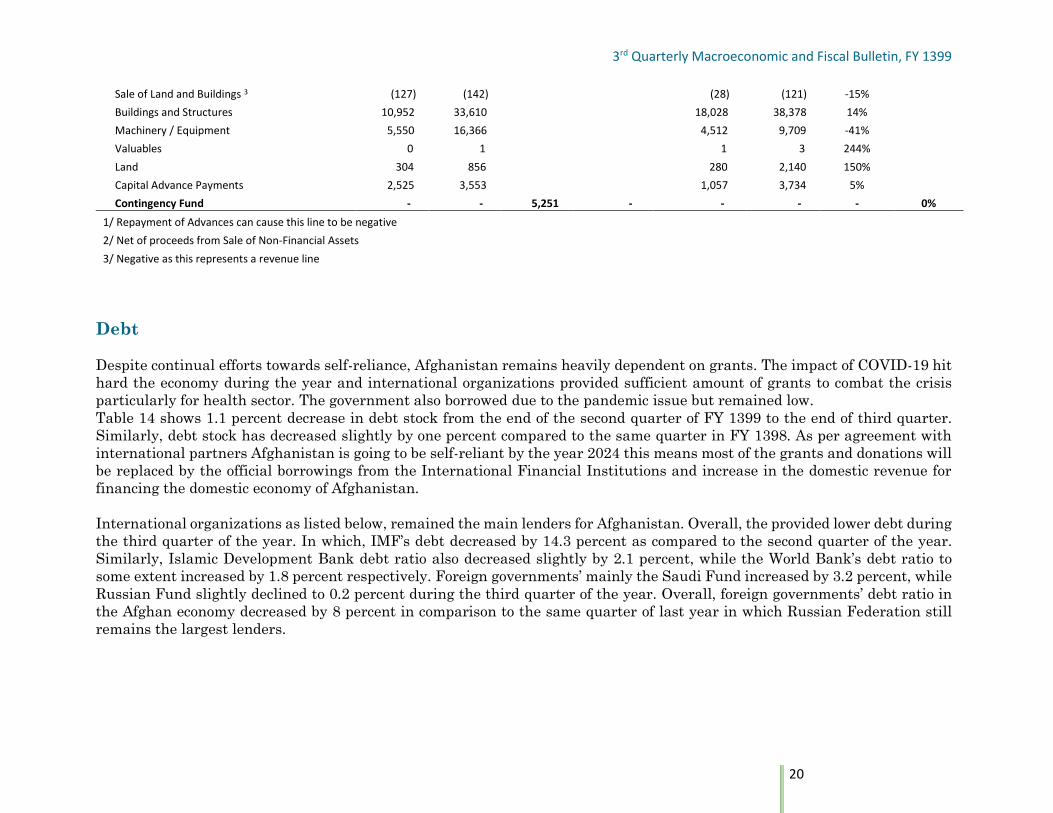
3rd Quarterly Macroeconomic and Fiscal Bulletin, FY 1399
20
Sale of Land and Buildings 3 (127) (142) (28) (121) -15%
Buildings and Structures 10,952 33,610 18,028 38,378 14%
Machinery / Equipment 5,550 16,366 4,512 9,709 -41%
Valuables 0 1 1 3 244%
Land 304 856 280 2,140 150%
Capital Advance Payments 2,525 3,553 1,057 3,734 5%
Contingency Fund - - 5,251 - - - - 0%
1/ Repayment of Advances can cause this line to be negative
2/ Net of proceeds from Sale of Non-Financial Assets
3/ Negative as this represents a revenue line
Debt
Despite continual efforts towards self-reliance, Afghanistan remains heavily dependent on grants. The impact of COVID-19 hit
hard the economy during the year and international organizations provided sufficient amount of grants to combat the crisis
particularly for health sector. The government also borrowed due to the pandemic issue but remained low.
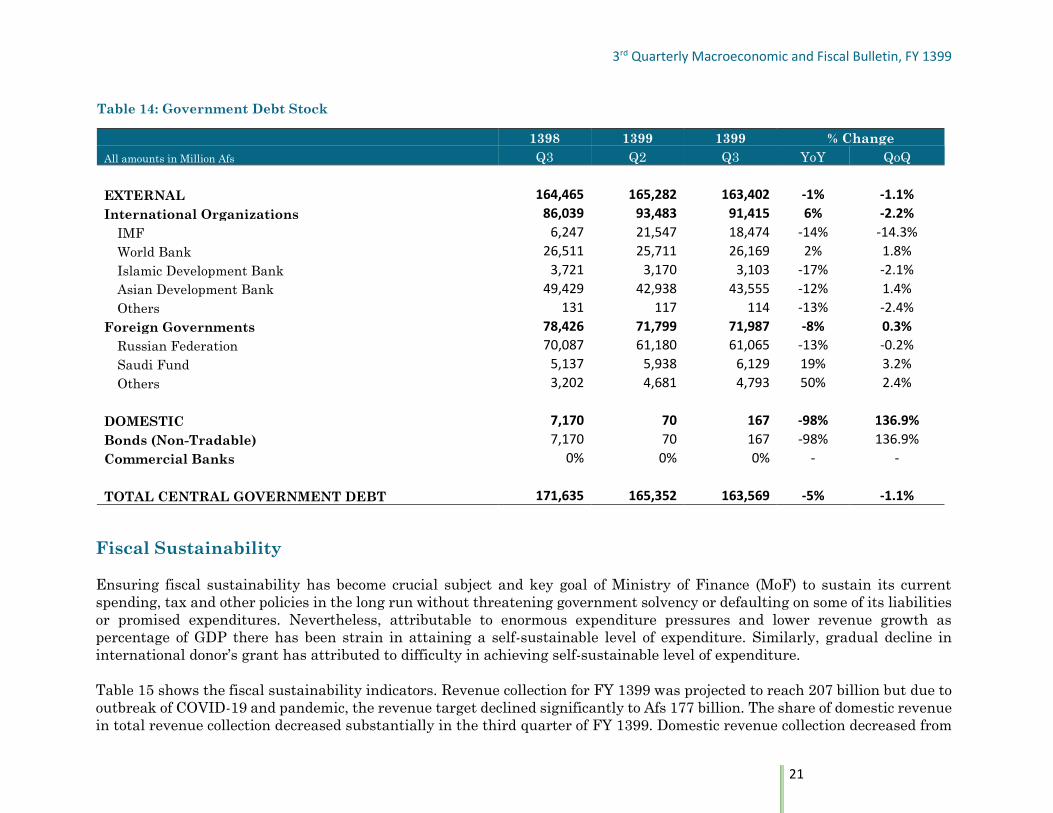
Table 14 shows 1.1 percent decrease in debt stock from the end of the second quarter of FY 1399 to the end of third quarter.
Similarly, debt stock has decreased slightly by one percent compared to the same quarter in FY 1398. As per agreement with
international partners Afghanistan is going to be self-reliant by the year 2024 this means most of the grants and donations will
be replaced by the official borrowings from the International Financial Institutions and increase in the domestic revenue for
financing the domestic economy of Afghanistan.
International organizations as listed below, remained the main lenders for Afghanistan. Overall, the provided lower debt during
the third quarter of the year. In which, IMF’s debt decreased by 14.3 percent as compared to the second quarter of the year.
Similarly, Islamic Development Bank debt ratio also decreased slightly by 2.1 percent, while the World Bank’s debt ratio to
some extent increased by 1.8 percent respectively. Foreign governments’ mainly the Saudi Fund increased by 3.2 percent, while
Russian Fund slightly declined to 0.2 percent during the third quarter of the year. Overall, foreign governments’ debt ratio in
the Afghan economy decreased by 8 percent in comparison to the same quarter of last year in which Russian Federation still
remains the largest lenders.
3rd Quarterly Macroeconomic and Fiscal Bulletin, FY 1399
21
Table 14: Government Debt Stock
1398 1399 1399 % Change
All amounts in Million Afs Q3 Q2 Q3 YoY QoQ
EXTERNAL 164,465 165,282 163,402 -1% -1.1%
International Organizations 86,039 93,483 91,415 6% -2.2%
IMF 6,247 21,547 18,474 -14% -14.3%
World Bank 26,511 25,711 26,169 2% 1.8%
Islamic Development Bank 3,721 3,170 3,103 -17% -2.1%
Asian Development Bank 49,429 42,938 43,555 -12% 1.4%
Others 131 117 114 -13% -2.4%
Foreign Governments 78,426 71,799 71,987 -8% 0.3%
Russian Federation 70,087 61,180 61,065 -13% -0.2%
Saudi Fund 5,137 5,938 6,129 19% 3.2%
Others 3,202 4,681 4,793 50% 2.4%
DOMESTIC 7,170 70 167 -98% 136.9%
Bonds (Non-Tradable) 7,170 70 167 -98% 136.9%
Commercial Banks 0% 0% 0% - -
TOTAL CENTRAL GOVERNMENT DEBT 171,635 165,352 163,569 -5% -1.1%
Fiscal Sustainability
Ensuring fiscal sustainability has become crucial subject and key goal of Ministry of Finance (MoF) to sustain its current
spending, tax and other policies in the long run without threatening government solvency or defaulting on some of its liabilities
or promised expenditures. Nevertheless, attributable to enormous expenditure pressures and lower revenue growth as
percentage of GDP there has been strain in attaining a self-sustainable level of expenditure. Similarly, gradual decline in
international donor’s grant has attributed to difficulty in achieving self-sustainable level of expenditure.
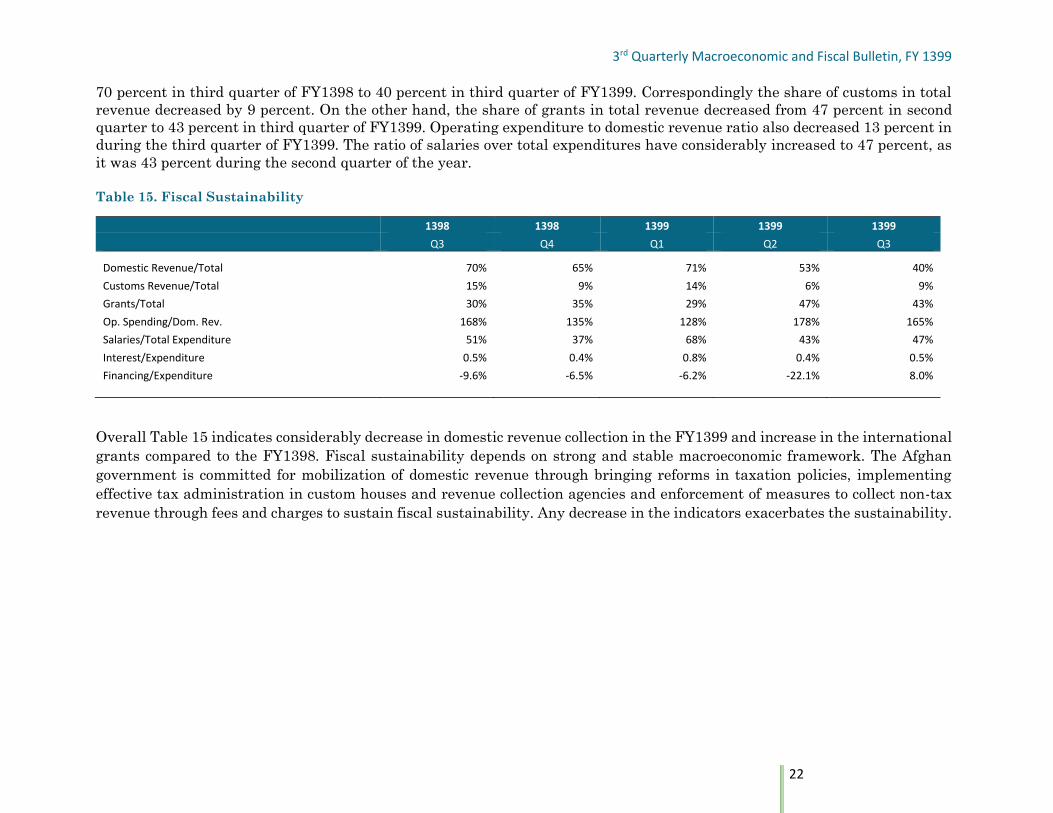
Table 15 shows the fiscal sustainability indicators. Revenue collection for FY 1399 was projected to reach 207 billion but due to
outbreak of COVID-19 and pandemic, the revenue target declined significantly to Afs 177 billion. The share of domestic revenue
in total revenue collection decreased substantially in the third quarter of FY 1399. Domestic revenue collection decreased from
3rd Quarterly Macroeconomic and Fiscal Bulletin, FY 1399
22
70 percent in third quarter of FY1398 to 40 percent in third quarter of FY1399. Correspondingly the share of customs in total
revenue decreased by 9 percent. On the other hand, the share of grants in total revenue decreased from 47 percent in second
quarter to 43 percent in third quarter of FY1399. Operating expenditure to domestic revenue ratio also decreased 13 percent in
during the third quarter of FY1399. The ratio of salaries over total expenditures have considerably increased to 47 percent, as
it was 43 percent during the second quarter of the year.
Table 15. Fiscal Sustainability
1398 1398 1399 1399 1399
Q3 Q4 Q1 Q2 Q3
Domestic Revenue/Total 70% 65% 71% 53% 40%
Customs Revenue/Total 15% 9% 14% 6% 9%
Grants/Total 30% 35% 29% 47% 43%
Op. Spending/Dom. Rev. 168% 135% 128% 178% 165%
Salaries/Total Expenditure 51% 37% 68% 43% 47%
Interest/Expenditure 0.5% 0.4% 0.8% 0.4% 0.5%
Financing/Expenditure -9.6% -6.5% -6.2% -22.1% 8.0%
Overall Table 15 indicates considerably decrease in domestic revenue collection in the FY1399 and increase in the international
grants compared to the FY1398. Fiscal sustainability depends on strong and stable macroeconomic framework. The Afghan
government is committed for mobilization of domestic revenue through bringing reforms in taxation policies, implementing
effective tax administration in custom houses and revenue collection agencies and enforcement of measures to collect non-tax
revenue through fees and charges to sustain fiscal sustainability. Any decrease in the indicators exacerbates the sustainability.
3rd Quarterly Macroeconomic and Fiscal Bulletin, FY 1399
23
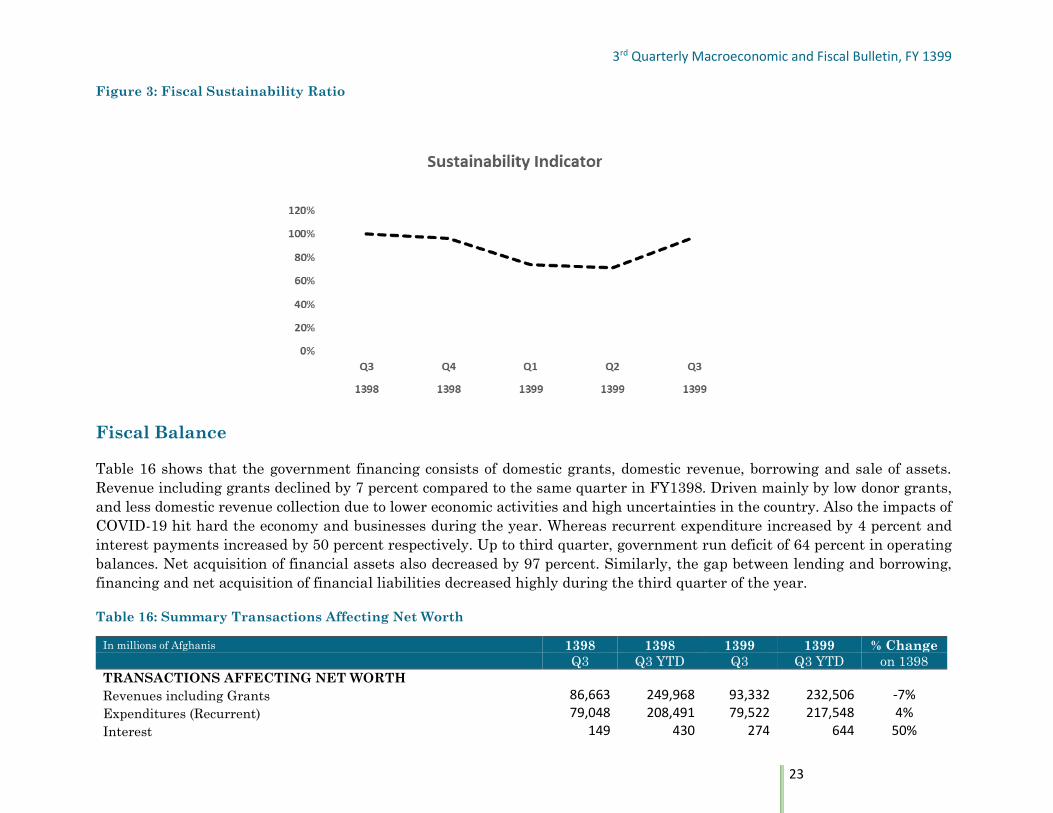
Figure 3: Fiscal Sustainability Ratio
Fiscal Balance
Table 16 shows that the government financing consists of domestic grants, domestic revenue, borrowing and sale of assets.
Revenue including grants declined by 7 percent compared to the same quarter in FY1398. Driven mainly by low donor grants,
and less domestic revenue collection due to lower economic activities and high uncertainties in the country. Also the impacts of
COVID-19 hit hard the economy and businesses during the year. Whereas recurrent expenditure increased by 4 percent and
interest payments increased by 50 percent respectively. Up to third quarter, government run deficit of 64 percent in operating
balances. Net acquisition of financial assets also decreased by 97 percent. Similarly, the gap between lending and borrowing,
financing and net acquisition of financial liabilities decreased highly during the third quarter of the year.
Table 16: Summary Transactions Affecting Net Worth
In millions of Afghanis 1398 1398 1399 1399 % Change
Q3 Q3 YTD Q3 Q3 YTD on 1398
TRANSACTIONS AFFECTING NET WORTH
Revenues including Grants 86,663 249,968 93,332 232,506 -7%
Expenditures (Recurrent) 79,048 208,491 79,522 217,548 4%
Interest 149 430 274 644 50%
3rd Quarterly Macroeconomic and Fiscal Bulletin, FY 1399
24
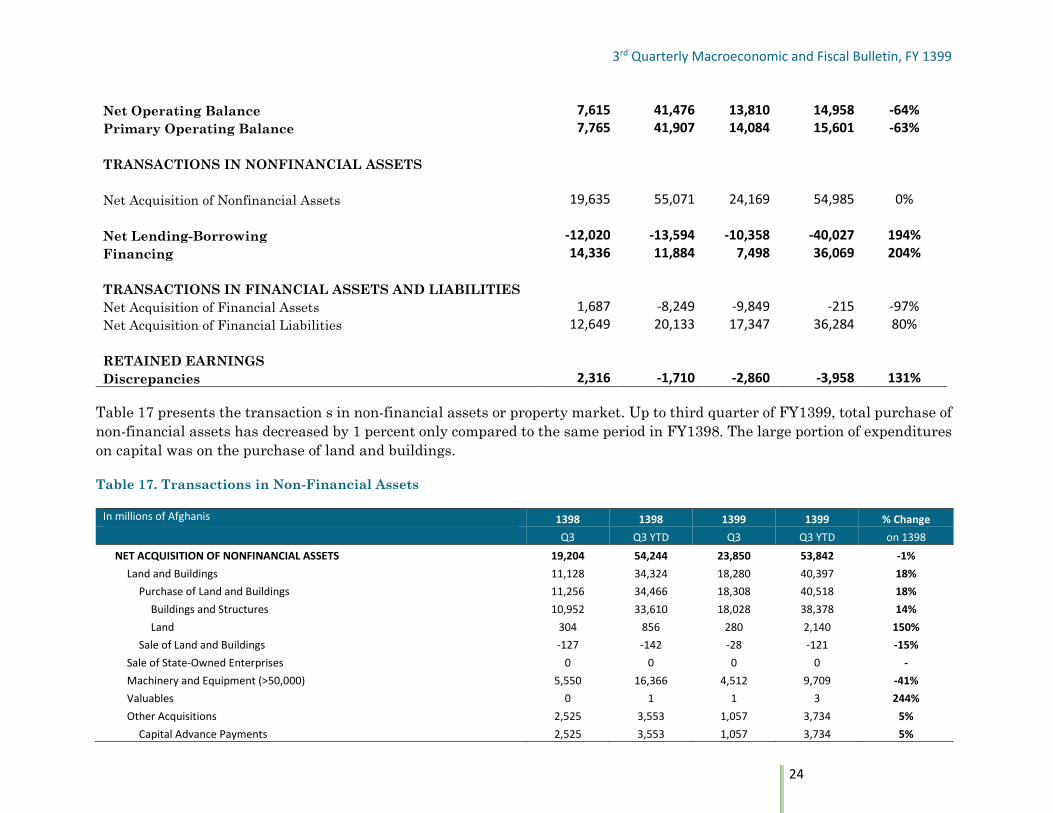
Net Operating Balance 7,615 41,476 13,810 14,958 -64%
Primary Operating Balance 7,765 41,907 14,084 15,601 -63%
TRANSACTIONS IN NONFINANCIAL ASSETS
Net Acquisition of Nonfinancial Assets 19,635 55,071 24,169 54,985 0%
Net Lending-Borrowing -12,020 -13,594 -10,358 -40,027 194%
Financing 14,336 11,884 7,498 36,069 204%
TRANSACTIONS IN FINANCIAL ASSETS AND LIABILITIES
Net Acquisition of Financial Assets 1,687 -8,249 -9,849 -215 -97%
Net Acquisition of Financial Liabilities 12,649 20,133 17,347 36,284 80%
RETAINED EARNINGS
Discrepancies 2,316 -1,710 -2,860 -3,958 131%
Table 17 presents the transaction s in non-financial assets or property market. Up to third quarter of FY1399, total purchase of
non-financial assets has decreased by 1 percent only compared to the same period in FY1398. The large portion of expenditures
on capital was on the purchase of land and buildings.
Table 17. Transactions in Non-Financial Assets
In millions of Afghanis 1398 1398 1399 1399 % Change Q3 Q3 YTD Q3 Q3 YTD on 1398
NET ACQUISITION OF NONFINANCIAL ASSETS 19,204 54,244 23,850 53,842 -1%
Land and Buildings 11,128 34,324 18,280 40,397 18%
Purchase of Land and Buildings 11,256 34,466 18,308 40,518 18%
Buildings and Structures 10,952 33,610 18,028 38,378 14%
Land 304 856 280 2,140 150%
Sale of Land and Buildings -127 -142 -28 -121 -15%
Sale of State-Owned Enterprises 0 0 0 0 -
Machinery and Equipment (>50,000) 5,550 16,366 4,512 9,709 -41%
Valuables 0 1 1 3 244%
Other Acquisitions 2,525 3,553 1,057 3,734 5%
Capital Advance Payments 2,525 3,553 1,057 3,734 5%
3rd Quarterly Macroeconomic and Fiscal Bulletin, FY 1399
25
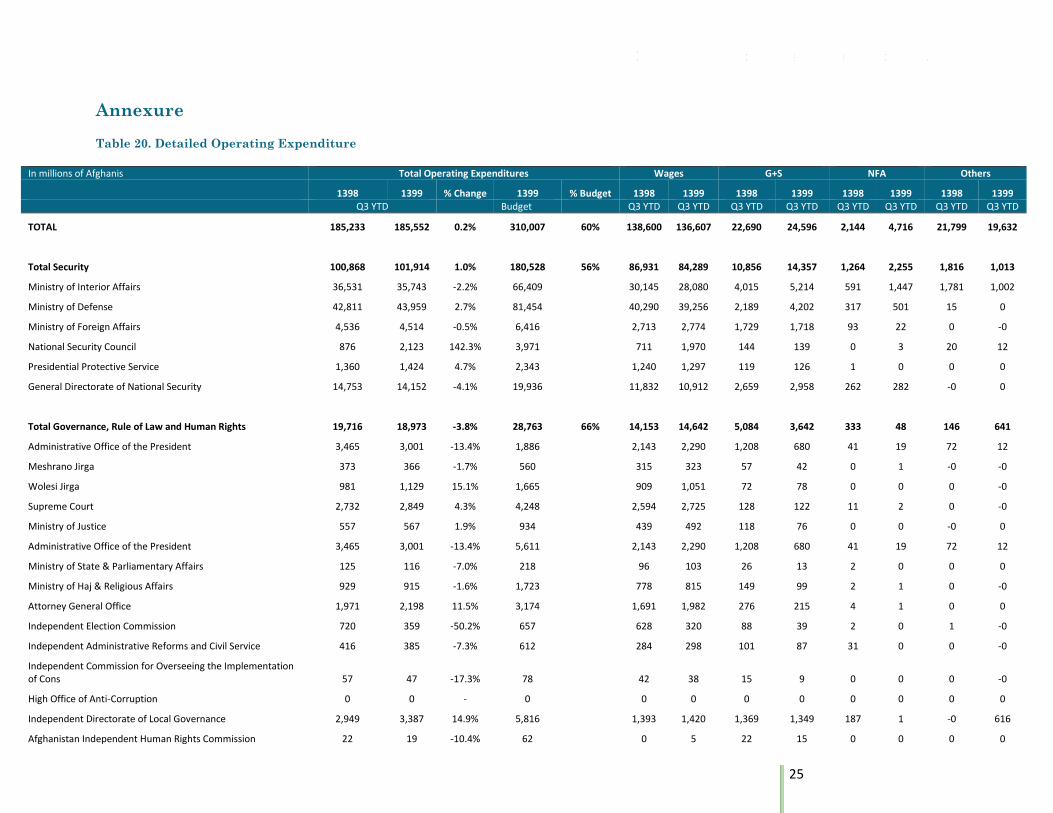
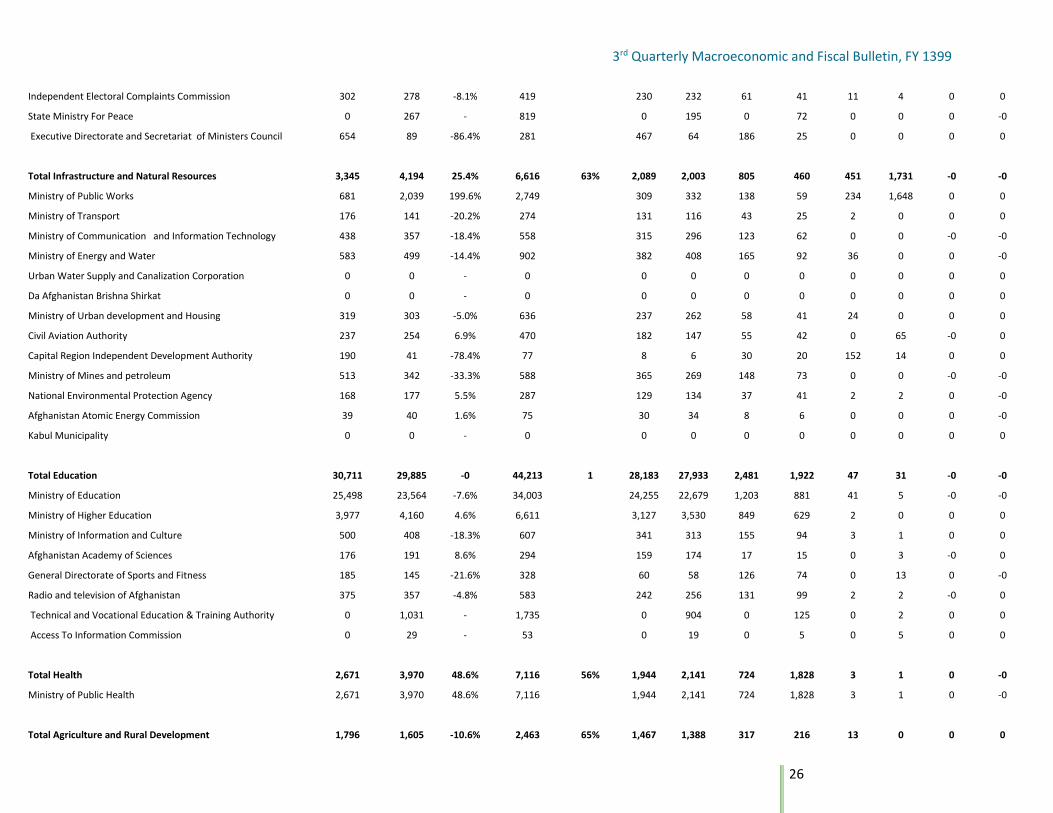
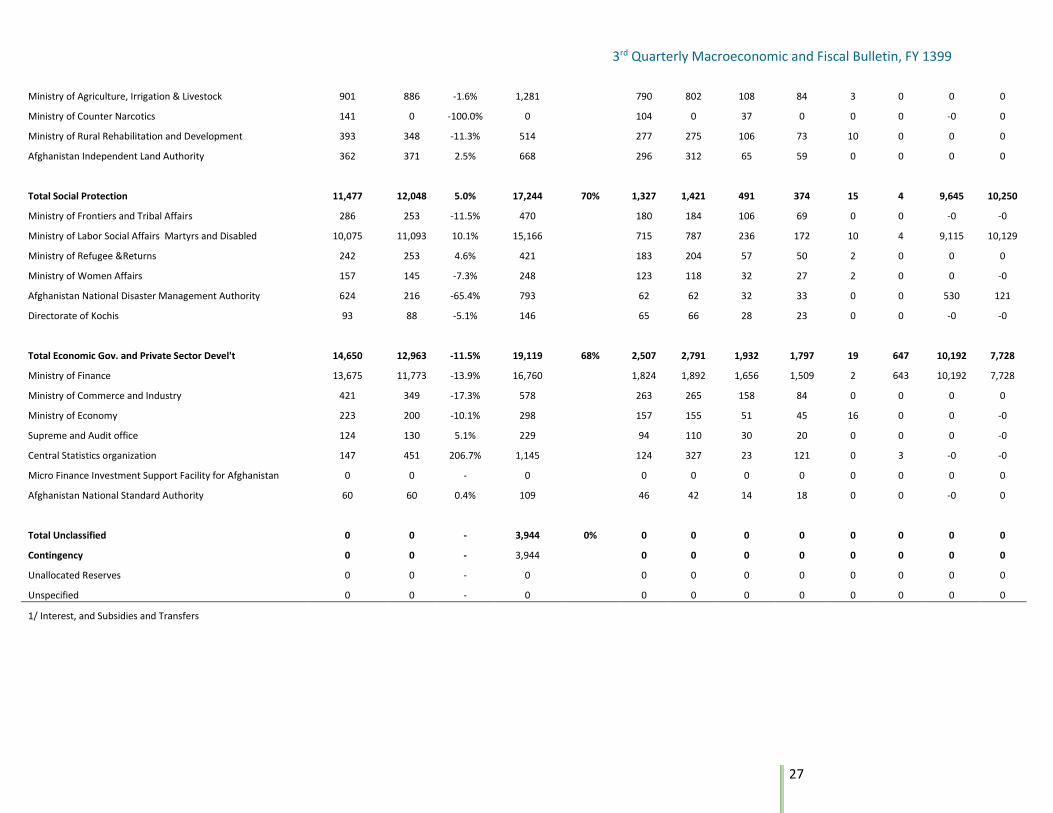
Annexure
Table 20. Detailed Operating Expenditure
In millions of Afghanis Total Operating Expenditures Wages G+S NFA Others
1398 1399 % Change 1399 % Budget 1398 1399 1398 1399 1398 1399 1398 1399 Q3 YTD Budget Q3 YTD Q3 YTD Q3 YTD Q3 YTD Q3 YTD Q3 YTD Q3 YTD Q3 YTD
TOTAL 185,233 185,552 0.2% 310,007 60% 138,600 136,607 22,690 24,596 2,144 4,716 21,799 19,632
Total Security 100,868 101,914 1.0% 180,528 56% 86,931 84,289 10,856 14,357 1,264 2,255 1,816 1,013
Ministry of Interior Affairs 36,531 35,743 -2.2% 66,409 30,145 28,080 4,015 5,214 591 1,447 1,781 1,002
Ministry of Defense 42,811 43,959 2.7% 81,454 40,290 39,256 2,189 4,202 317 501 15 0
Ministry of Foreign Affairs 4,536 4,514 -0.5% 6,416 2,713 2,774 1,729 1,718 93 22 0 -0
National Security Council 876 2,123 142.3% 3,971 711 1,970 144 139 0 3 20 12
Presidential Protective Service 1,360 1,424 4.7% 2,343 1,240 1,297 119 126 1 0 0 0
General Directorate of National Security 14,753 14,152 -4.1% 19,936 11,832 10,912 2,659 2,958 262 282 -0 0
Total Governance, Rule of Law and Human Rights 19,716 18,973 -3.8% 28,763 66% 14,153 14,642 5,084 3,642 333 48 146 641
Administrative Office of the President 3,465 3,001 -13.4% 1,886 2,143 2,290 1,208 680 41 19 72 12
Meshrano Jirga 373 366 -1.7% 560 315 323 57 42 0 1 -0 -0
Wolesi Jirga 981 1,129 15.1% 1,665 909 1,051 72 78 0 0 0 -0
Supreme Court 2,732 2,849 4.3% 4,248 2,594 2,725 128 122 11 2 0 -0
Ministry of Justice 557 567 1.9% 934 439 492 118 76 0 0 -0 0
Administrative Office of the President 3,465 3,001 -13.4% 5,611 2,143 2,290 1,208 680 41 19 72 12
Ministry of State & Parliamentary Affairs 125 116 -7.0% 218 96 103 26 13 2 0 0 0
Ministry of Haj & Religious Affairs 929 915 -1.6% 1,723 778 815 149 99 2 1 0 -0
Attorney General Office 1,971 2,198 11.5% 3,174 1,691 1,982 276 215 4 1 0 0
Independent Election Commission 720 359 -50.2% 657 628 320 88 39 2 0 1 -0
Independent Administrative Reforms and Civil Service 416 385 -7.3% 612 284 298 101 87 31 0 0 -0
Independent Commission for Overseeing the Implementation of Cons 57 47 -17.3% 78 42 38 15 9 0 0 0 -0
High Office of Anti-Corruption 0 0 - 0 0 0 0 0 0 0 0 0
Independent Directorate of Local Governance 2,949 3,387 14.9% 5,816 1,393 1,420 1,369 1,349 187 1 -0 616
Afghanistan Independent Human Rights Commission 22 19 -10.4% 62 0 5 22 15 0 0 0 0
3rd Quarterly Macroeconomic and Fiscal Bulletin, FY 1399
26
Independent Electoral Complaints Commission 302 278 -8.1% 419 230 232 61 41 11 4 0 0
State Ministry For Peace 0 267 - 819 0 195 0 72 0 0 0 -0
Executive Directorate and Secretariat of Ministers Council 654 89 -86.4% 281 467 64 186 25 0 0 0 0
Total Infrastructure and Natural Resources 3,345 4,194 25.4% 6,616 63% 2,089 2,003 805 460 451 1,731 -0 -0
Ministry of Public Works 681 2,039 199.6% 2,749 309 332 138 59 234 1,648 0 0
Ministry of Transport 176 141 -20.2% 274 131 116 43 25 2 0 0 0
Ministry of Communication and Information Technology 438 357 -18.4% 558 315 296 123 62 0 0 -0 -0
Ministry of Energy and Water 583 499 -14.4% 902 382 408 165 92 36 0 0 -0
Urban Water Supply and Canalization Corporation 0 0 - 0 0 0 0 0 0 0 0 0
Da Afghanistan Brishna Shirkat 0 0 - 0 0 0 0 0 0 0 0 0
Ministry of Urban development and Housing 319 303 -5.0% 636 237 262 58 41 24 0 0 0
Civil Aviation Authority 237 254 6.9% 470 182 147 55 42 0 65 -0 0
Capital Region Independent Development Authority 190 41 -78.4% 77 8 6 30 20 152 14 0 0
Ministry of Mines and petroleum 513 342 -33.3% 588 365 269 148 73 0 0 -0 -0
National Environmental Protection Agency 168 177 5.5% 287 129 134 37 41 2 2 0 -0
Afghanistan Atomic Energy Commission 39 40 1.6% 75 30 34 8 6 0 0 0 -0
Kabul Municipality 0 0 - 0 0 0 0 0 0 0 0 0
Total Education 30,711 29,885 -0 44,213 1 28,183 27,933 2,481 1,922 47 31 -0 -0
Ministry of Education 25,498 23,564 -7.6% 34,003 24,255 22,679 1,203 881 41 5 -0 -0
Ministry of Higher Education 3,977 4,160 4.6% 6,611 3,127 3,530 849 629 2 0 0 0
Ministry of Information and Culture 500 408 -18.3% 607 341 313 155 94 3 1 0 0
Afghanistan Academy of Sciences 176 191 8.6% 294 159 174 17 15 0 3 -0 0
General Directorate of Sports and Fitness 185 145 -21.6% 328 60 58 126 74 0 13 0 -0
Radio and television of Afghanistan 375 357 -4.8% 583 242 256 131 99 2 2 -0 0
Technical and Vocational Education & Training Authority 0 1,031 - 1,735 0 904 0 125 0 2 0 0
Access To Information Commission 0 29 - 53 0 19 0 5 0 5 0 0
Total Health 2,671 3,970 48.6% 7,116 56% 1,944 2,141 724 1,828 3 1 0 -0
Ministry of Public Health 2,671 3,970 48.6% 7,116 1,944 2,141 724 1,828 3 1 0 -0
Total Agriculture and Rural Development 1,796 1,605 -10.6% 2,463 65% 1,467 1,388 317 216 13 0 0 0
3rd Quarterly Macroeconomic and Fiscal Bulletin, FY 1399
27
Ministry of Agriculture, Irrigation & Livestock 901 886 -1.6% 1,281 790 802 108 84 3 0 0 0
Ministry of Counter Narcotics 141 0 -100.0% 0 104 0 37 0 0 0 -0 0
Ministry of Rural Rehabilitation and Development 393 348 -11.3% 514 277 275 106 73 10 0 0 0
Afghanistan Independent Land Authority 362 371 2.5% 668 296 312 65 59 0 0 0 0
Total Social Protection 11,477 12,048 5.0% 17,244 70% 1,327 1,421 491 374 15 4 9,645 10,250
Ministry of Frontiers and Tribal Affairs 286 253 -11.5% 470 180 184 106 69 0 0 -0 -0
Ministry of Labor Social Affairs Martyrs and Disabled 10,075 11,093 10.1% 15,166 715 787 236 172 10 4 9,115 10,129
Ministry of Refugee &Returns 242 253 4.6% 421 183 204 57 50 2 0 0 0
Ministry of Women Affairs 157 145 -7.3% 248 123 118 32 27 2 0 0 -0
Afghanistan National Disaster Management Authority 624 216 -65.4% 793 62 62 32 33 0 0 530 121
Directorate of Kochis 93 88 -5.1% 146 65 66 28 23 0 0 -0 -0
Total Economic Gov. and Private Sector Devel't 14,650 12,963 -11.5% 19,119 68% 2,507 2,791 1,932 1,797 19 647 10,192 7,728
Ministry of Finance 13,675 11,773 -13.9% 16,760 1,824 1,892 1,656 1,509 2 643 10,192 7,728
Ministry of Commerce and Industry 421 349 -17.3% 578 263 265 158 84 0 0 0 0
Ministry of Economy 223 200 -10.1% 298 157 155 51 45 16 0 0 -0
Supreme and Audit office 124 130 5.1% 229 94 110 30 20 0 0 0 -0
Central Statistics organization 147 451 206.7% 1,145 124 327 23 121 0 3 -0 -0
Micro Finance Investment Support Facility for Afghanistan 0 0 - 0 0 0 0 0 0 0 0 0
Afghanistan National Standard Authority 60 60 0.4% 109 46 42 14 18 0 0 -0 0
Total Unclassified 0 0 - 3,944 0% 0 0 0 0 0 0 0 0
Contingency 0 0 - 3,944 0 0 0 0 0 0 0 0
Unallocated Reserves 0 0 - 0 0 0 0 0 0 0 0 0
Unspecified 0 0 - 0 0 0 0 0 0 0 0 0
1/ Interest, and Subsidies and Transfers
3rd Quarterly Macroeconomic and Fiscal Bulletin, FY 1399
28
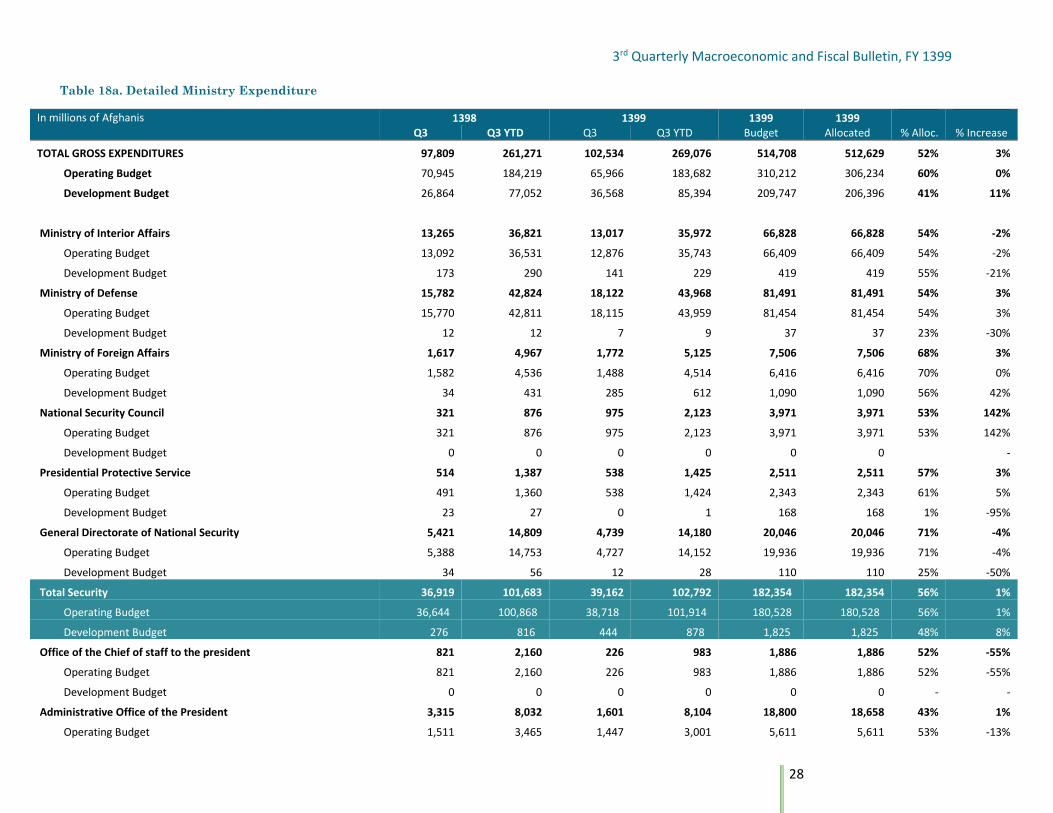
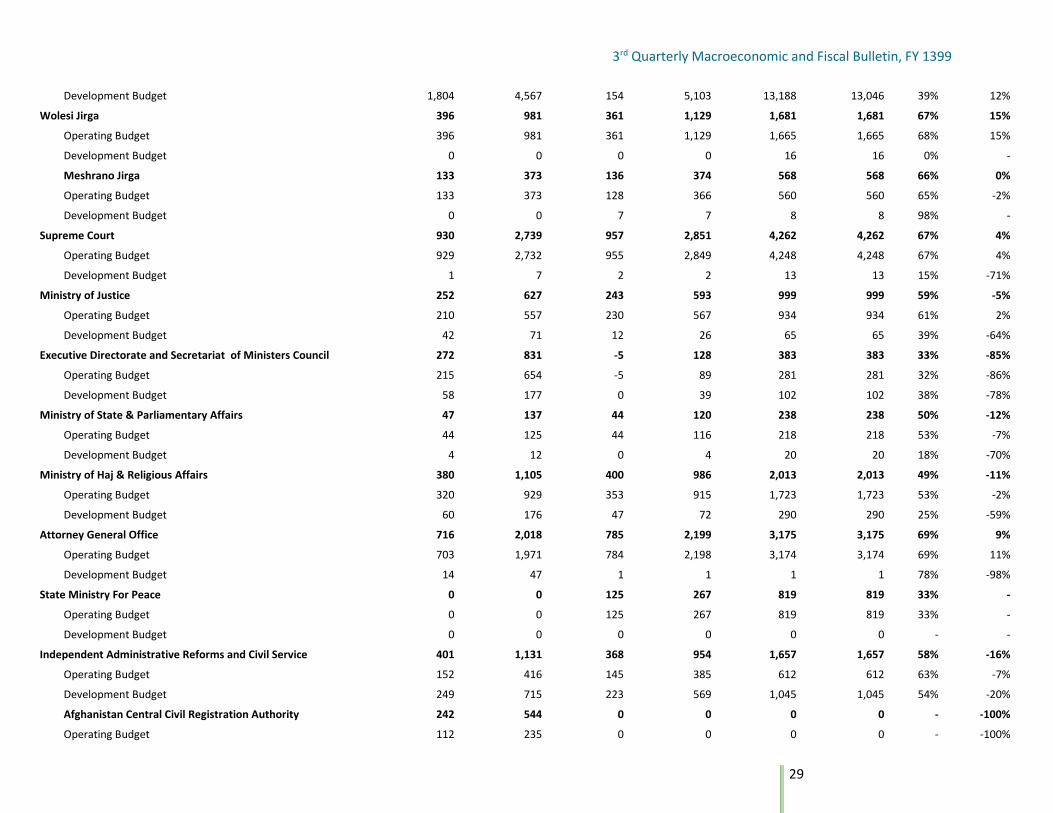
Table 18a. Detailed Ministry Expenditure
In millions of Afghanis 1398 1399 1399 1399
Q3 Q3 YTD Q3 Q3 YTD Budget Allocated % Alloc. % Increase
TOTAL GROSS EXPENDITURES 97,809 261,271 102,534 269,076 514,708 512,629 52% 3%
Operating Budget 70,945 184,219 65,966 183,682 310,212 306,234 60% 0%
Development Budget 26,864 77,052 36,568 85,394 209,747 206,396 41% 11%
Ministry of Interior Affairs 13,265 36,821 13,017 35,972 66,828 66,828 54% -2%
Operating Budget 13,092 36,531 12,876 35,743 66,409 66,409 54% -2%
Development Budget 173 290 141 229 419 419 55% -21%
Ministry of Defense 15,782 42,824 18,122 43,968 81,491 81,491 54% 3%
Operating Budget 15,770 42,811 18,115 43,959 81,454 81,454 54% 3%
Development Budget 12 12 7 9 37 37 23% -30%
Ministry of Foreign Affairs 1,617 4,967 1,772 5,125 7,506 7,506 68% 3%
Operating Budget 1,582 4,536 1,488 4,514 6,416 6,416 70% 0%
Development Budget 34 431 285 612 1,090 1,090 56% 42%
National Security Council 321 876 975 2,123 3,971 3,971 53% 142%
Operating Budget 321 876 975 2,123 3,971 3,971 53% 142%
Development Budget 0 0 0 0 0 0 -
Presidential Protective Service 514 1,387 538 1,425 2,511 2,511 57% 3%
Operating Budget 491 1,360 538 1,424 2,343 2,343 61% 5%
Development Budget 23 27 0 1 168 168 1% -95%
General Directorate of National Security 5,421 14,809 4,739 14,180 20,046 20,046 71% -4%
Operating Budget 5,388 14,753 4,727 14,152 19,936 19,936 71% -4%
Development Budget 34 56 12 28 110 110 25% -50%
Total Security 36,919 101,683 39,162 102,792 182,354 182,354 56% 1%
Operating Budget 36,644 100,868 38,718 101,914 180,528 180,528 56% 1%
Development Budget 276 816 444 878 1,825 1,825 48% 8%
Office of the Chief of staff to the president 821 2,160 226 983 1,886 1,886 52% -55%
Operating Budget 821 2,160 226 983 1,886 1,886 52% -55%
Development Budget 0 0 0 0 0 0 - -
Administrative Office of the President 3,315 8,032 1,601 8,104 18,800 18,658 43% 1%
Operating Budget 1,511 3,465 1,447 3,001 5,611 5,611 53% -13%
3rd Quarterly Macroeconomic and Fiscal Bulletin, FY 1399
29
Development Budget 1,804 4,567 154 5,103 13,188 13,046 39% 12%
Wolesi Jirga 396 981 361 1,129 1,681 1,681 67% 15%
Operating Budget 396 981 361 1,129 1,665 1,665 68% 15%
Development Budget 0 0 0 0 16 16 0% -
Meshrano Jirga 133 373 136 374 568 568 66% 0%
Operating Budget 133 373 128 366 560 560 65% -2%
Development Budget 0 0 7 7 8 8 98% -
Supreme Court 930 2,739 957 2,851 4,262 4,262 67% 4%
Operating Budget 929 2,732 955 2,849 4,248 4,248 67% 4%
Development Budget 1 7 2 2 13 13 15% -71%
Ministry of Justice 252 627 243 593 999 999 59% -5%
Operating Budget 210 557 230 567 934 934 61% 2%
Development Budget 42 71 12 26 65 65 39% -64%
Executive Directorate and Secretariat of Ministers Council 272 831 -5 128 383 383 33% -85%
Operating Budget 215 654 -5 89 281 281 32% -86%
Development Budget 58 177 0 39 102 102 38% -78%
Ministry of State & Parliamentary Affairs 47 137 44 120 238 238 50% -12%
Operating Budget 44 125 44 116 218 218 53% -7%
Development Budget 4 12 0 4 20 20 18% -70%
Ministry of Haj & Religious Affairs 380 1,105 400 986 2,013 2,013 49% -11%
Operating Budget 320 929 353 915 1,723 1,723 53% -2%
Development Budget 60 176 47 72 290 290 25% -59%
Attorney General Office 716 2,018 785 2,199 3,175 3,175 69% 9%
Operating Budget 703 1,971 784 2,198 3,174 3,174 69% 11%
Development Budget 14 47 1 1 1 1 78% -98%
State Ministry For Peace 0 0 125 267 819 819 33% -
Operating Budget 0 0 125 267 819 819 33% -
Development Budget 0 0 0 0 0 0 - -
Independent Administrative Reforms and Civil Service 401 1,131 368 954 1,657 1,657 58% -16%
Operating Budget 152 416 145 385 612 612 63% -7%
Development Budget 249 715 223 569 1,045 1,045 54% -20%
Afghanistan Central Civil Registration Authority 242 544 0 0 0 0 - -100%
Operating Budget 112 235 0 0 0 0 - -100%
3rd Quarterly Macroeconomic and Fiscal Bulletin, FY 1399
30
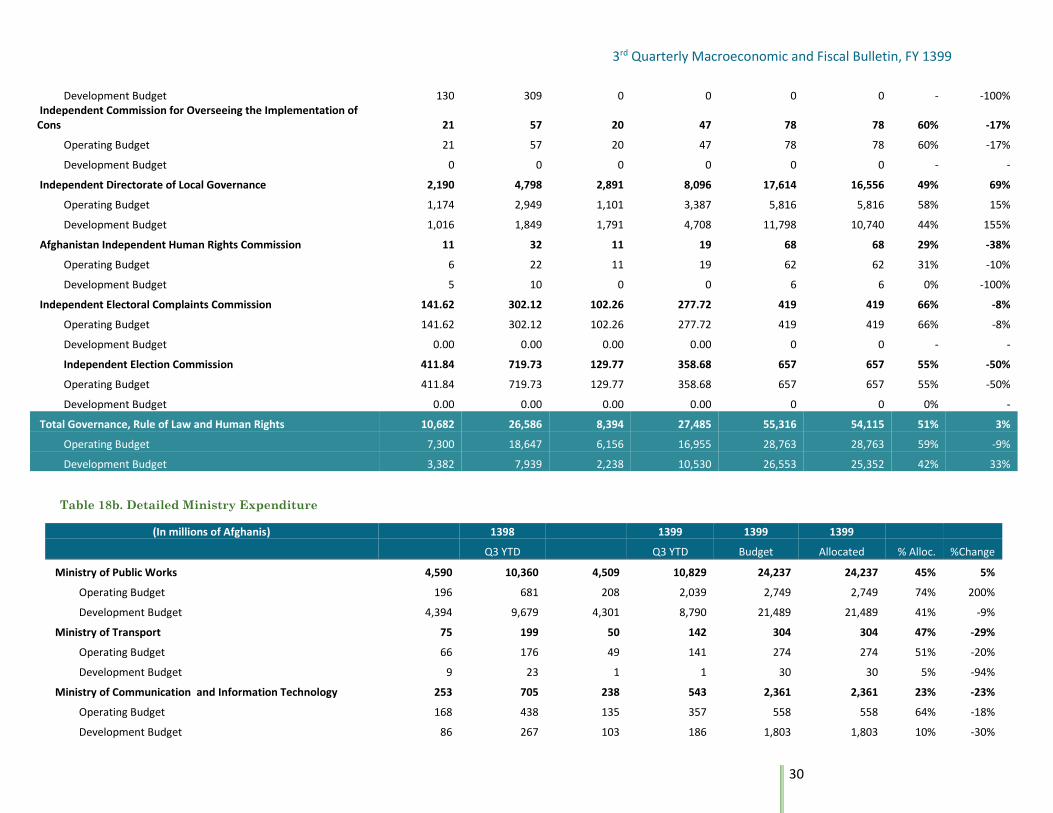
Development Budget 130 309 0 0 0 0 - -100% Independent Commission for Overseeing the Implementation of Cons 21 57 20 47 78 78 60% -17%
Operating Budget 21 57 20 47 78 78 60% -17%
Development Budget 0 0 0 0 0 0 - -
Independent Directorate of Local Governance 2,190 4,798 2,891 8,096 17,614 16,556 49% 69%
Operating Budget 1,174 2,949 1,101 3,387 5,816 5,816 58% 15%
Development Budget 1,016 1,849 1,791 4,708 11,798 10,740 44% 155%
Afghanistan Independent Human Rights Commission 11 32 11 19 68 68 29% -38%
Operating Budget 6 22 11 19 62 62 31% -10%
Development Budget 5 10 0 0 6 6 0% -100%
Independent Electoral Complaints Commission 141.62 302.12 102.26 277.72 419 419 66% -8%
Operating Budget 141.62 302.12 102.26 277.72 419 419 66% -8%
Development Budget 0.00 0.00 0.00 0.00 0 0 - -
Independent Election Commission 411.84 719.73 129.77 358.68 657 657 55% -50%
Operating Budget 411.84 719.73 129.77 358.68 657 657 55% -50%
Development Budget 0.00 0.00 0.00 0.00 0 0 0% -
Total Governance, Rule of Law and Human Rights 10,682 26,586 8,394 27,485 55,316 54,115 51% 3%
Operating Budget 7,300 18,647 6,156 16,955 28,763 28,763 59% -9%
Development Budget 3,382 7,939 2,238 10,530 26,553 25,352 42% 33%
Table 18b. Detailed Ministry Expenditure
(In millions of Afghanis) 1398 1399 1399 1399
Q3 YTD Q3 YTD Budget Allocated % Alloc. %Change
Ministry of Public Works 4,590 10,360 4,509 10,829 24,237 24,237 45% 5%
Operating Budget 196 681 208 2,039 2,749 2,749 74% 200%
Development Budget 4,394 9,679 4,301 8,790 21,489 21,489 41% -9%
Ministry of Transport 75 199 50 142 304 304 47% -29%
Operating Budget 66 176 49 141 274 274 51% -20%
Development Budget 9 23 1 1 30 30 5% -94%
Ministry of Communication and Information Technology 253 705 238 543 2,361 2,361 23% -23%
Operating Budget 168 438 135 357 558 558 64% -18%
Development Budget 86 267 103 186 1,803 1,803 10% -30%
3rd Quarterly Macroeconomic and Fiscal Bulletin, FY 1399
31
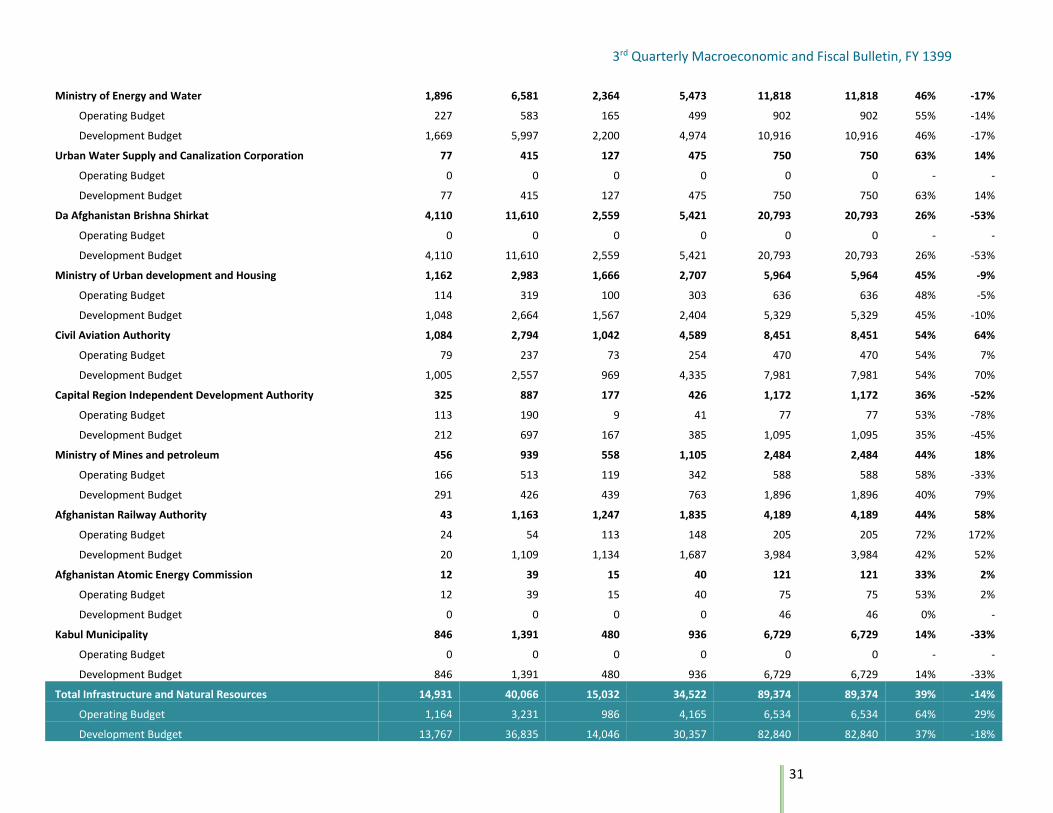
Ministry of Energy and Water 1,896 6,581 2,364 5,473 11,818 11,818 46% -17%
Operating Budget 227 583 165 499 902 902 55% -14%
Development Budget 1,669 5,997 2,200 4,974 10,916 10,916 46% -17%
Urban Water Supply and Canalization Corporation 77 415 127 475 750 750 63% 14%
Operating Budget 0 0 0 0 0 0 - -
Development Budget 77 415 127 475 750 750 63% 14%
Da Afghanistan Brishna Shirkat 4,110 11,610 2,559 5,421 20,793 20,793 26% -53%
Operating Budget 0 0 0 0 0 0 - -
Development Budget 4,110 11,610 2,559 5,421 20,793 20,793 26% -53%
Ministry of Urban development and Housing 1,162 2,983 1,666 2,707 5,964 5,964 45% -9%
Operating Budget 114 319 100 303 636 636 48% -5%
Development Budget 1,048 2,664 1,567 2,404 5,329 5,329 45% -10%
Civil Aviation Authority 1,084 2,794 1,042 4,589 8,451 8,451 54% 64%
Operating Budget 79 237 73 254 470 470 54% 7%
Development Budget 1,005 2,557 969 4,335 7,981 7,981 54% 70%
Capital Region Independent Development Authority 325 887 177 426 1,172 1,172 36% -52%
Operating Budget 113 190 9 41 77 77 53% -78%
Development Budget 212 697 167 385 1,095 1,095 35% -45%
Ministry of Mines and petroleum 456 939 558 1,105 2,484 2,484 44% 18%
Operating Budget 166 513 119 342 588 588 58% -33%
Development Budget 291 426 439 763 1,896 1,896 40% 79%
Afghanistan Railway Authority 43 1,163 1,247 1,835 4,189 4,189 44% 58%
Operating Budget 24 54 113 148 205 205 72% 172%
Development Budget 20 1,109 1,134 1,687 3,984 3,984 42% 52%
Afghanistan Atomic Energy Commission 12 39 15 40 121 121 33% 2%
Operating Budget 12 39 15 40 75 75 53% 2%
Development Budget 0 0 0 0 46 46 0% -
Kabul Municipality 846 1,391 480 936 6,729 6,729 14% -33%
Operating Budget 0 0 0 0 0 0 - -
Development Budget 846 1,391 480 936 6,729 6,729 14% -33%
Total Infrastructure and Natural Resources 14,931 40,066 15,032 34,522 89,374 89,374 39% -14%
Operating Budget 1,164 3,231 986 4,165 6,534 6,534 64% 29%
Development Budget 13,767 36,835 14,046 30,357 82,840 82,840 37% -18%
3rd Quarterly Macroeconomic and Fiscal Bulletin, FY 1399
32
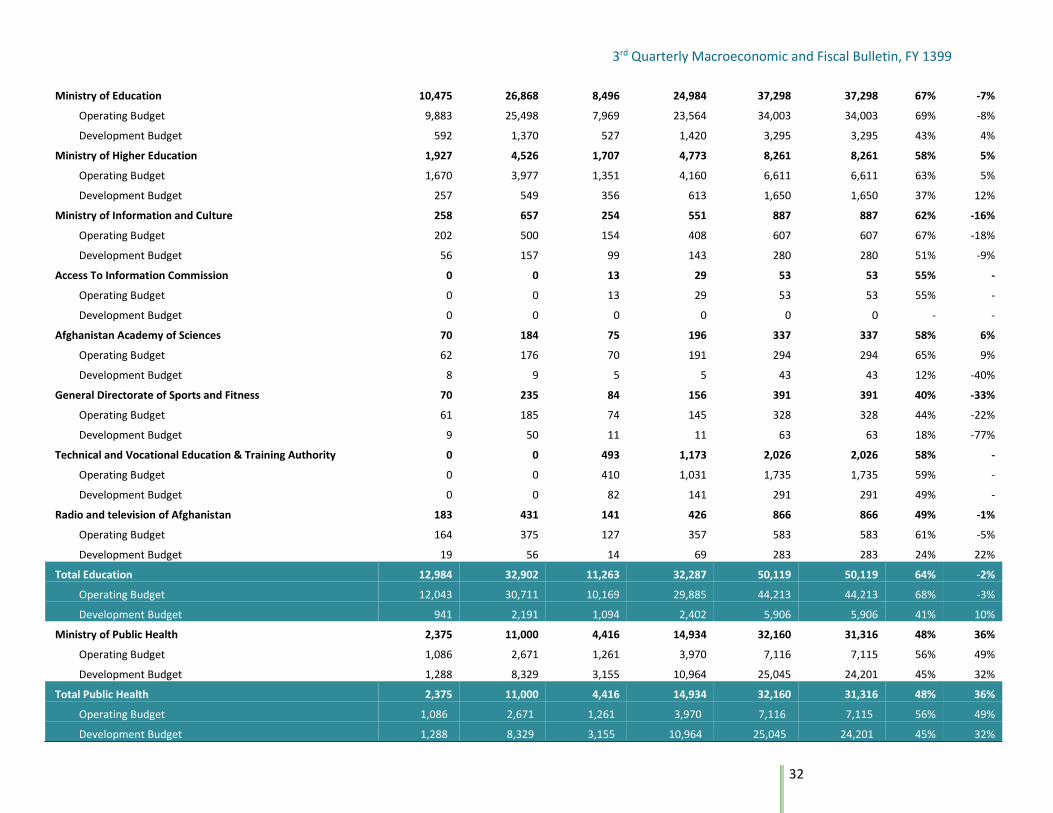
Ministry of Education 10,475 26,868 8,496 24,984 37,298 37,298 67% -7%
Operating Budget 9,883 25,498 7,969 23,564 34,003 34,003 69% -8%
Development Budget 592 1,370 527 1,420 3,295 3,295 43% 4%
Ministry of Higher Education 1,927 4,526 1,707 4,773 8,261 8,261 58% 5%
Operating Budget 1,670 3,977 1,351 4,160 6,611 6,611 63% 5%
Development Budget 257 549 356 613 1,650 1,650 37% 12%
Ministry of Information and Culture 258 657 254 551 887 887 62% -16%
Operating Budget 202 500 154 408 607 607 67% -18%
Development Budget 56 157 99 143 280 280 51% -9%
Access To Information Commission 0 0 13 29 53 53 55% -
Operating Budget 0 0 13 29 53 53 55% -
Development Budget 0 0 0 0 0 0 - -
Afghanistan Academy of Sciences 70 184 75 196 337 337 58% 6%
Operating Budget 62 176 70 191 294 294 65% 9%
Development Budget 8 9 5 5 43 43 12% -40%
General Directorate of Sports and Fitness 70 235 84 156 391 391 40% -33%
Operating Budget 61 185 74 145 328 328 44% -22%
Development Budget 9 50 11 11 63 63 18% -77%
Technical and Vocational Education & Training Authority 0 0 493 1,173 2,026 2,026 58% -
Operating Budget 0 0 410 1,031 1,735 1,735 59% -
Development Budget 0 0 82 141 291 291 49% -
Radio and television of Afghanistan 183 431 141 426 866 866 49% -1%
Operating Budget 164 375 127 357 583 583 61% -5%
Development Budget 19 56 14 69 283 283 24% 22%
Total Education 12,984 32,902 11,263 32,287 50,119 50,119 64% -2%
Operating Budget 12,043 30,711 10,169 29,885 44,213 44,213 68% -3%
Development Budget 941 2,191 1,094 2,402 5,906 5,906 41% 10%
Ministry of Public Health 2,375 11,000 4,416 14,934 32,160 31,316 48% 36%
Operating Budget 1,086 2,671 1,261 3,970 7,116 7,115 56% 49%
Development Budget 1,288 8,329 3,155 10,964 25,045 24,201 45% 32%
Total Public Health 2,375 11,000 4,416 14,934 32,160 31,316 48% 36%
Operating Budget 1,086 2,671 1,261 3,970 7,116 7,115 56% 49%
Development Budget 1,288 8,329 3,155 10,964 25,045 24,201 45% 32%
3rd Quarterly Macroeconomic and Fiscal Bulletin, FY 1399
33
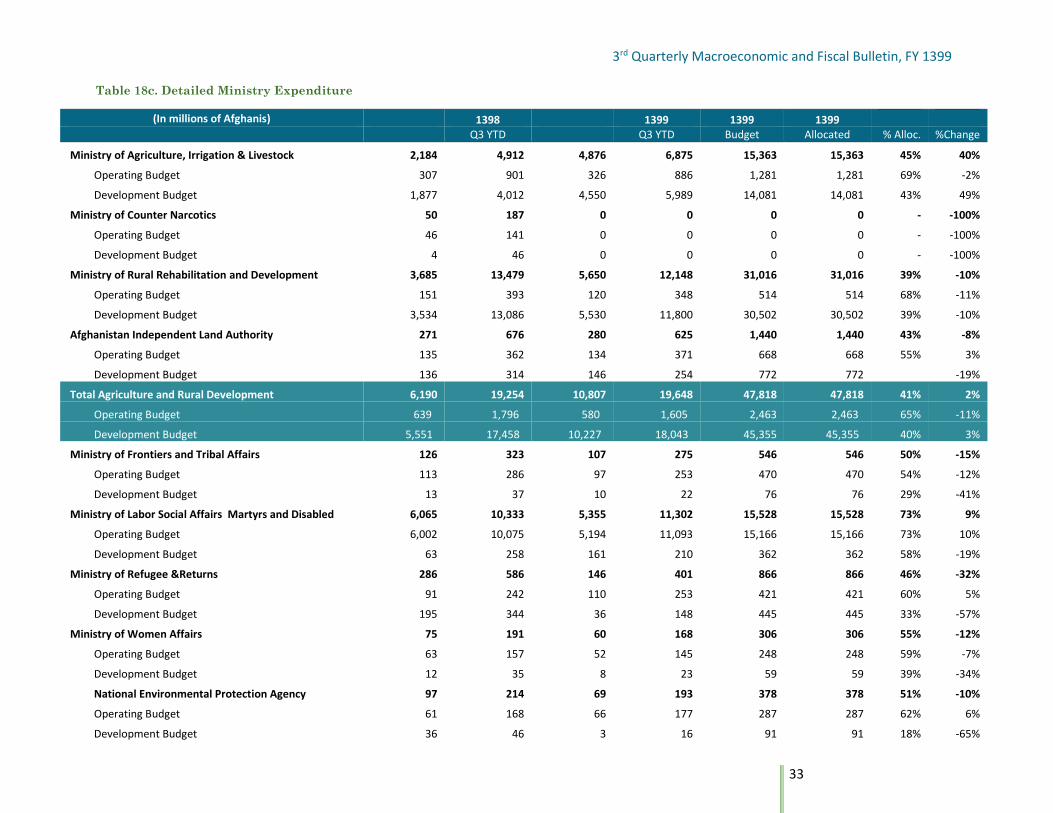
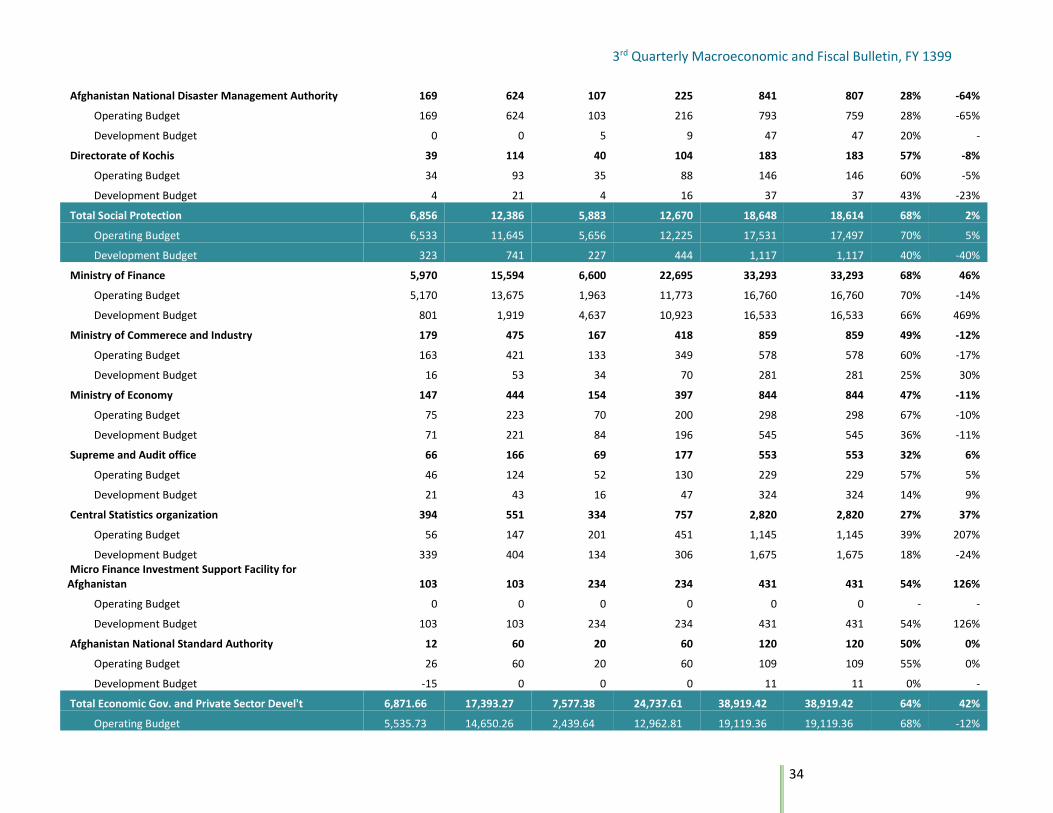
Table 18c. Detailed Ministry Expenditure
(In millions of Afghanis) 1398 1399 1399 1399
Q3 YTD Q3 YTD Budget Allocated % Alloc. %Change
Ministry of Agriculture, Irrigation & Livestock 2,184 4,912 4,876 6,875 15,363 15,363 45% 40%
Operating Budget 307 901 326 886 1,281 1,281 69% -2%
Development Budget 1,877 4,012 4,550 5,989 14,081 14,081 43% 49%
Ministry of Counter Narcotics 50 187 0 0 0 0 - -100%
Operating Budget 46 141 0 0 0 0 - -100%
Development Budget 4 46 0 0 0 0 - -100%
Ministry of Rural Rehabilitation and Development 3,685 13,479 5,650 12,148 31,016 31,016 39% -10%
Operating Budget 151 393 120 348 514 514 68% -11%
Development Budget 3,534 13,086 5,530 11,800 30,502 30,502 39% -10%
Afghanistan Independent Land Authority 271 676 280 625 1,440 1,440 43% -8%
Operating Budget 135 362 134 371 668 668 55% 3%
Development Budget 136 314 146 254 772 772 -19%
Total Agriculture and Rural Development 6,190 19,254 10,807 19,648 47,818 47,818 41% 2%
Operating Budget 639 1,796 580 1,605 2,463 2,463 65% -11%
Development Budget 5,551 17,458 10,227 18,043 45,355 45,355 40% 3%
Ministry of Frontiers and Tribal Affairs 126 323 107 275 546 546 50% -15%
Operating Budget 113 286 97 253 470 470 54% -12%
Development Budget 13 37 10 22 76 76 29% -41%
Ministry of Labor Social Affairs Martyrs and Disabled 6,065 10,333 5,355 11,302 15,528 15,528 73% 9%
Operating Budget 6,002 10,075 5,194 11,093 15,166 15,166 73% 10%
Development Budget 63 258 161 210 362 362 58% -19%
Ministry of Refugee &Returns 286 586 146 401 866 866 46% -32%
Operating Budget 91 242 110 253 421 421 60% 5%
Development Budget 195 344 36 148 445 445 33% -57%
Ministry of Women Affairs 75 191 60 168 306 306 55% -12%
Operating Budget 63 157 52 145 248 248 59% -7%
Development Budget 12 35 8 23 59 59 39% -34%
National Environmental Protection Agency 97 214 69 193 378 378 51% -10%
Operating Budget 61 168 66 177 287 287 62% 6%
Development Budget 36 46 3 16 91 91 18% -65%
3rd Quarterly Macroeconomic and Fiscal Bulletin, FY 1399
34
Afghanistan National Disaster Management Authority 169 624 107 225 841 807 28% -64%
Operating Budget 169 624 103 216 793 759 28% -65%
Development Budget 0 0 5 9 47 47 20% -
Directorate of Kochis 39 114 40 104 183 183 57% -8%
Operating Budget 34 93 35 88 146 146 60% -5%
Development Budget 4 21 4 16 37 37 43% -23%
Total Social Protection 6,856 12,386 5,883 12,670 18,648 18,614 68% 2%
Operating Budget 6,533 11,645 5,656 12,225 17,531 17,497 70% 5%
Development Budget 323 741 227 444 1,117 1,117 40% -40%
Ministry of Finance 5,970 15,594 6,600 22,695 33,293 33,293 68% 46%
Operating Budget 5,170 13,675 1,963 11,773 16,760 16,760 70% -14%
Development Budget 801 1,919 4,637 10,923 16,533 16,533 66% 469%
Ministry of Commerece and Industry 179 475 167 418 859 859 49% -12%
Operating Budget 163 421 133 349 578 578 60% -17%
Development Budget 16 53 34 70 281 281 25% 30%
Ministry of Economy 147 444 154 397 844 844 47% -11%
Operating Budget 75 223 70 200 298 298 67% -10%
Development Budget 71 221 84 196 545 545 36% -11%
Supreme and Audit office 66 166 69 177 553 553 32% 6%
Operating Budget 46 124 52 130 229 229 57% 5%
Development Budget 21 43 16 47 324 324 14% 9%
Central Statistics organization 394 551 334 757 2,820 2,820 27% 37%
Operating Budget 56 147 201 451 1,145 1,145 39% 207%
Development Budget 339 404 134 306 1,675 1,675 18% -24% Micro Finance Investment Support Facility for Afghanistan 103 103 234 234 431 431 54% 126%
Operating Budget 0 0 0 0 0 0 - -
Development Budget 103 103 234 234 431 431 54% 126%
Afghanistan National Standard Authority 12 60 20 60 120 120 50% 0%
Operating Budget 26 60 20 60 109 109 55% 0%
Development Budget -15 0 0 0 11 11 0% -
Total Economic Gov. and Private Sector Devel't 6,871.66 17,393.27 7,577.38 24,737.61 38,919.42 38,919.42 64% 42%
Operating Budget 5,535.73 14,650.26 2,439.64 12,962.81 19,119.36 19,119.36 68% -12%
3rd Quarterly Macroeconomic and Fiscal Bulletin, FY 1399
35
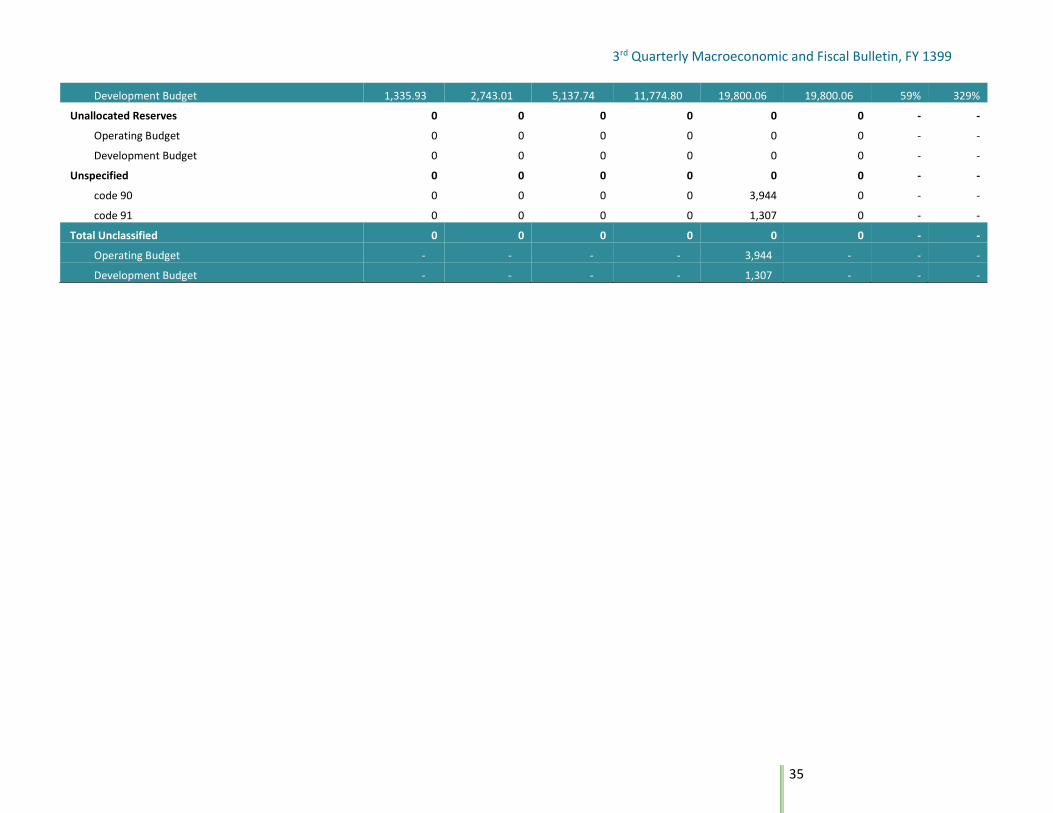
Development Budget 1,335.93 2,743.01 5,137.74 11,774.80 19,800.06 19,800.06 59% 329%
Unallocated Reserves 0 0 0 0 0 0 - -
Operating Budget 0 0 0 0 0 0 - -
Development Budget 0 0 0 0 0 0 - -
Unspecified 0 0 0 0 0 0 - -
code 90 0 0 0 0 3,944 0 - -
code 91 0 0 0 0 1,307 0 - -
Total Unclassified 0 0 0 0 0 0 - -
Operating Budget - - - - 3,944 - - -
Development Budget - - - - 1,307 - - -
3rd Quarterly Macroeconomic and Fiscal Bulletin, FY 1399
36
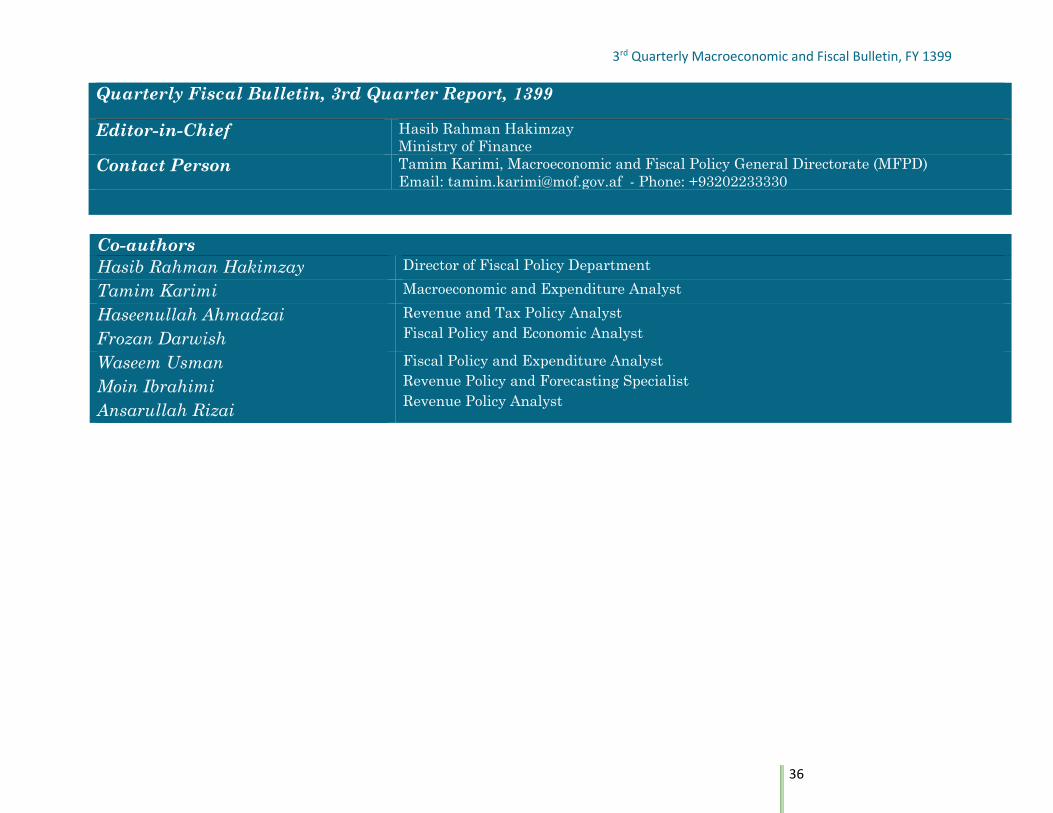
Quarterly Fiscal Bulletin, 3rd Quarter Report, 1399
Editor-in-Chief Hasib Rahman Hakimzay
Ministry of Finance
Contact Person Tamim Karimi, Macroeconomic and Fiscal Policy General Directorate (MFPD)
Email: [email protected] - Phone: +93202233330
Co-authors
Hasib Rahman Hakimzay Director of Fiscal Policy Department
Tamim Karimi Macroeconomic and Expenditure Analyst
Haseenullah Ahmadzai
Frozan Darwish
Revenue and Tax Policy Analyst
Fiscal Policy and Economic Analyst
Waseem Usman
Moin Ibrahimi
Ansarullah Rizai
Fiscal Policy and Expenditure Analyst
Revenue Policy and Forecasting Specialist
Revenue Policy Analyst