SCDI Future Scotland - Macroeconomic & Fiscal Sustainability
63
Future Scotland Macroeconomic and Fiscal Sustainability April 2013
-
Upload
yvonne-macarthur -
Category
Documents
-
view
215 -
download
0
description
SCDI Future Scotland - Macroeconomic & Fiscal Sustainability
Transcript of SCDI Future Scotland - Macroeconomic & Fiscal Sustainability
Future Scotland
Macroeconomic and Fiscal Sustainability
April 2013

Disclaimer SCDI is an independent, non-aligned organisation, which maintains impartiality in matters of political debate. In this programme of work, SCDI is seeking to inform members on key economic issues relating to the debate on Scotland’s constitutional future. The contents of the Future Scotland reports are not intended to reflect SCDI policy.
SCDI Future Scotland | Macroeconomic and Fiscal Sustainability | April 2013 1
Contents Page Foreword 3 Introduction 4 Executive Summary 5
Closing the Gap Constitutional Debate Key Questions
The Fiscal Gap 11
Scotland Long-term Fiscal Challenges 13
Fiscal Projections Economic – Low Growth Economic – Innovation Economic – Infrastructure Social – Ageing Demographics Social – Inequality Environmental – Climate Change Environmental – Resource Constraints
The Scottish Economy 18
Overview Competitiveness
Options and Opportunities to Address the Fiscal Challenge 20
Increase Revenues o Where Might Economic Growth to Generate Higher Revenues
Come From? o What Changes to Taxes Might Generate Higher Revenues?
Reduce Tax Evasion and Avoidance Taxes Reserved Taxes Institute of Fiscal Studies ‘Mirrlees Review’ of UK Tax
System (2012) Further Proposals Devolved Taxes
How Might Savings Be Made in Government Expenditure? The Constitutional Debate 30
Scotland’s Fiscal Position
SCDI Future Scotland | Macroeconomic and Fiscal Sustainability | April 2013 2
Page Division of Assets and Liabilities 31
International Rules The Role of External Creditors – Paper by Dane Rowlands Negotiations Debt Oil Revenues
Monetary Policy Options 40
Pound Euro Scottish Currency – Pegged Scottish Currency – Unpegged
Financial Stability 42
Financial Regulation Lender of Last Resort
Fiscal Policy 45
Credit Rating/ Borrowing Monetary Policy, Financial Stability and Fiscal Independence
The Fiscal Challenge 50
Revenue Generation and Collection Scottish Government Post-Independence Expenditure Policy Scottish Government Post-Independence Taxation Policy
Enhanced Devolution 52
Scotland Act Northern Ireland and Wales Party Political Proposals
o Federalism – Lib Dem Proposals o Labour Party Commission o Conservatives
Think-tank Proposals o Devo More o Devo Plus o Devo Max
ANNEX A 56 ANNEX B 57 ANNEX C 58 ANNEX D 59
SCDI Future Scotland | Macroeconomic and Fiscal Sustainability | April 2013 3
Foreword Future Scotland: Future Growth In 2010, SCDI articulated in its Blueprint for Scotland the long-term vision and aspirations we maintain for a Scotland which is ambitious, enterprising and outward-looking; and which measures success in its ability to maximise its natural assets, its economic potential and its people. For more than eight decades, SCDI has pioneered thinking on the significant economic challenges of the time, from a perspective which is independent, inclusive and representative across civic Scotland. In 2013 SCDI continues to be a catalyst for debate and thought leadership, as our economy faces the challenges of unprecedented global change and competition. As an independent organisation with a broad membership, SCDI takes no political view on these issues for the Scottish electorate. However, the organisation’s role has always been to examine and consider impartially the industrial, commercial and economic challenges and opportunities facing Scotland. Amidst the current debate about Scotland’s future constitutional options, SCDI has undertaken an enquiry into some of the key issues across the Macroeconomic and Fiscal, Europe and International, and Energy spheres. Through this work, we hope to inform and provide insights to our members and stakeholders, through the identification and analysis of the issues and evidence to be considered. By way of recommendation, my engagement with expert colleagues on the Energy Working Group has been extremely useful in developing my understanding of the major issues for the sector – and the opportunities for our economy. As this body of work has developed, it has become increasingly clear that the issues raised in individual workstreams should not be considered in isolation, and that there is significant interrelation. For example, the implications for skills and employment in Scotland’s economy has been a recurrent theme across all workstreams. Therefore, it is recognised that a change in the responsibilities of governance of Scotland would not result in a series of discrete options, but rather a range of interrelated key choices, each of which would entail opportunities and constraints and many, if not all, of which would be related to others. Ultimately, such arrangements would be determined in negotiation and with agreement of other parties. The work is informed by wide and in-depth consultation across SCDI’s broad membership, including organisations across all sectors of the economy, in the corporate sector, SMEs, public sector agencies, trade unions, local authorities, educational institutions and the third sector. Online and face-to-face interviews have gathered substantial evidence from SCDI members and our work has also been informed by relevant statistics, statements and publications from a range of experts. These reports are not intended to provide comprehensive answers, or to outline SCDI policy. They are, however, intended to provide a framework to inform SCDI members and encourage further discussion, including at the SCDI Forum. I very much hope that this extensive programme of work will prove valuable to all who wish to achieve sustainable economic growth for Scotland. Bill Drummond Chair Scottish Council for Development and Industry
SCDI Future Scotland | Macroeconomic and Fiscal Sustainability | April 2013 4
Introduction In the debate about Scotland’s economic future and the constitutional context, there is a need for impartial and informed analysis, and SCDI has responded to the requests from members to facilitate and inform their thinking and the discussion on key economic factors. Within this report, we present the findings of our Macroeconomic and Fiscal Sustainability Workstream – a high-level steering group of key business and civic leaders. In compiling it, SCDI has aimed to act as a safe forum and conduit for constructive debate and dialogue on the issues. In our 2010 Blueprint for Scotland, we proposed the managed restoration of the public finances (while continuing to support capital investment, research and development and skills) as a key five-year priority for the Scottish economy. It is now clear that this process will take longer and involve more fundamental choices and changes than originally envisaged – and that, looking forward, the main challenge will be to identify a balanced approach that delivers sustainable economic growth while addressing the additional pressures on public finances likely to be imposed by increasing social, economic and environmental demands. Our starting point was the need to address this challenge and forge a new path towards macroeconomic and fiscal sustainability, in any constitutional settlement. However, given SCDI’s overarching remit, consideration of the means by which sustainable economic growth might be achieved has been retained as a central theme. Our investigation has also taken account of another key priority identified in the Blueprint: the need to restore the strength, reputation and competitiveness of Scotland’s financial services sector and its important support for investment in business, manufacturing and infrastructure. We outline the principal economic issues in these areas and suggest a number of Key Questions which politicians, campaigners and stakeholders on all sides of the constitutional debate should consider. These Key Questions are summarised on page 10 below. We would like to thank the Steering Group and the many SCDI members who have contributed their expertise and experience to make this process robust and representative. Brendan Dick Brian Veitch Co-chairs Macroeconomic and Fiscal Sustainability Workstream
SCDI Future Scotland | Macroeconomic and Fiscal Sustainability | April 2013 5
Executive Summary1 The UK recorded a deficit between its tax receipts and its expenditure in 27 of the 33 years between 1979 and 2011. Persistent annual deficits accumulated to build up the UK national debt, and this resulted in increasing interest charges to service the debt. Between 1997 and 2007 the UK Government reduced public sector borrowing slightly, but the majority of other leading industrial countries achieved a greater reduction. When the financial crisis struck, this left the UK in a more vulnerable position relative to comparable countries. The UK’s annual fiscal deficit increased substantially following the financial crisis and recession in 2007-08, as tax revenues slumped. In response, a rolling programme of spending cuts and tax increases has been implemented, but, thus far, these have only reduced the annual fiscal deficit from 11.2% of GDP in 2009-10 to 7.9% of GDP in 2011-12. As a result, the UK national debt has continued to increase, albeit at a slightly reduced rate. With the economy sluggish and the recession significantly reducing its long-term productive potential, debt is forecast to continue growing and to peak at 85.6% of GDP in 2016-17. The UK’s credit rating has been downgraded for the first time since 1978. This has raised questions about the sustainability of the levels of borrowing which prevailed under the pre-2007 economic and fiscal model and whether a new approach is needed to close the fiscal gap. Scotland’s public finances are also in deficit. It is estimated that in 2011-12 Scotland had a deficit of 11.2% of GDP excluding North Sea revenue or a deficit of 2.3% of GDP when a geographical share of North Sea revenue is included. In recent years, Scotland’s deficit has tended to be larger than the UK’s when tax revenues from oil and gas are excluded and similar if not smaller when they are included. If oil and gas tax revenues were to decline, Scotland’s fiscal deficit would increase, unless other revenue sources emerge or spending is reduced. It is also forecast that the UK’s public finances will come under renewed pressure over the longer term, with receipts from oil and gas production taxes, environmental taxes and tobacco duties expected to reduce by up to 2% of GDP over the next 30 years. This report recognises a significant number of long-term challenges which will put pressure on fiscal sustainability:
Economic - Low Growth – linked to high indebtedness curtailing public spending and an ageing population reducing worker productivity and entrepreneurship;
Economic – Innovation – weak business investment and R&D spending Economic – Infrastructure – inadequate investment and structures to support the
development of economic infrastructure projects, in particular transport and energy Social – Ageing Demographics – much of the future spending increases projected
can be attributed to the UK’s ageing population profile. In Scotland, the number of ‘dependants’ per 100 people of working age population is expected to rise from 60 per 100 to 64 per 100 in 2035, with an increase of pensionable aged people of 2.9% compared with 1.7% for the UK. An ageing population will incur higher health, care and pension costs. Modelling carried out by COSLA forecast a funding gap for local authority services of almost £3bn by 2016-17, with around half attributed to a rising demand for services driven largely by demographics and future needs. Twenty per cent of people in the UK are doing nothing to save for their retirement
1 For all source references please see full report
SCDI Future Scotland | Macroeconomic and Fiscal Sustainability | April 2013 6
Social – Inequality – income inequality may slow growth, causes credit booms and financial busts and weaken demand. The UK has had the most rapid increase in income inequality of the 34 OECD countries since 1975, with a rising share of national income taken by the top 1%. Inequality of opportunity accounts for over 20% of total inequality in Britain and inhibits social mobility. In 2009, Scotland had the widest gap in educational attainment between the top and bottom 20% in developed Europe
Environmental – Climate Change – The Scottish Government has estimated the cost to the Government of implementing its proposals and policies on climate change could amount to £8bn by 2022. It has been estimated that while this would cost less than 1% of GDP in 2020, the long-term cost of not acting would be 5-20% of GDP
Environmental – Resource Constraints – Over the next 20 years the growth of the resource hungry middle-classes is predicted to be faster than at any other time in history, and to reach 5bn by the end of the period. At the same time, resources will be under pressure from rising extraction costs
Closing the Gap This report makes an assessment of the ability of the Scottish economy to meet these challenges. In a UK context, the Scottish economy has performed relatively well over the last 30 years, in comparison with some other UK regions such as North East England. The success of the oil and gas and financial services sectors in Scotland were two significant factors. Scotland’s gross value added (GVA) per head at 98.7% of the UK average in 2010 is exceeded only by London and South-East England. Scotland’s average annual growth in GDP over the 30 years to 2006 was 0.5% below the UK average and 0.9% behind the average of comparable EU countries. However, Scotland’s population has not grown as fast as either over the same period. Those industrial sectors which grew fastest in Scotland over the 10 years prior to the 2007/08 financial crisis, such as financial services, property and retail, are unlikely to grow as strongly in the future. While the latest annual survey of Scottish exports showed an increase of 7% to £23.9bn in 2011, there is evidence that at a UK level that exports stalled in 2012. Scotland has particular weaknesses in entrepreneurial activity, business R&D and innovation. The Scottish Government has identified three means by which Scotland’s long-term sustainable rate of economic growth can be increased and its per capita income raised:
Increasing the level of labour productivity and competitiveness; Increasing the participation rate i.e. the number of people actually working; Increasing Scotland's population and the supply of potential workers.
Its economic strategy identifies seven key growth sectors and analysis of the strategies of these sectors suggests that strongest growth is anticipated in oil and gas, renewables and food and drink. The report then considers revenue-raising from key taxes and reducing tax evasion and avoidance. Over the last 35 years the overall tax take in the UK has been relatively stable at around 38% of GDP. Corporation tax in the UK is currently higher than the EU average of 22.6%, but, with the aim of stimulating investment, it is to be reduced in stages to reach 20% in 2015, the lowest rate of any major western economy, with the aim of stimulating investment. We highlight the recommendations of the ‘Mirrlees Review’ on reforming the UK tax system; these include improvement of the work incentives for those around pension age (to increase total earnings by £3bn) and the introduction of road user charging to replace fuel
SCDI Future Scotland | Macroeconomic and Fiscal Sustainability | April 2013 7
duty and protect revenue of £38bn. The Scottish Government has relatively few revenue-raising powers and has implemented a freeze on council tax. In 2011-12, Scotland accounted for 9.3% of total UK public spending, compared to its 8.4% share of the UK population. In 2010-11 spending was estimated to be higher in all categories with the exception of defence. Following devolution, the Scottish Government Budget grew by an average of 5.5% per annum in real terms, but this growth ended with UK fiscal consolidation. It may take until 2025-26 for the Scottish Government’s total budget to return to its 2009-10 levels in real terms and, in which case, the cumulative loss in the intervening period is estimated at potentially £51bn. The Scottish Government has a target that all public sector bodies should deliver a 3% efficiency target per annum. It has been estimated that as much as 40% of public service spending is directed towards interventions which could have been avoided by adopting a preventative approach. The Scottish Government is spending an estimated £500m over three years until 2014-15, focussed on supporting adult social care, early years and tackling re-offending. It also appointed an Independent Budget Review Panel in 2010 for advice on spending. A number of its recommendations were implemented, but, as identified in this report, some were not. Constitutional Debate This is the fiscal context for the debate on Scotland’s constitutional future. Under current constitutional arrangements, the Scottish Budget is largely determined by a block grant from the UK Government. The size of this grant is defined by the Barnett Formula. The advantages of this approach include its simplicity, stability and the absence of UK ring-fencing of Scottish spending. However, there is a very weak link between expenditure and revenue-raising in Scotland. Arguably, this reduces accountability and efficiency, and does not provide sufficient incentives to improve the economy and deliver value for money. Public spending per capita in Scotland is above the average for England and slightly above for Wales. On the other hand, if the UK deficit is removed from GDP calculations, and the geographic share of North Sea oil and gas revenue that an independent Scotland could expect to receive is included, Scotland currently receives approximately as much public money as it contributes through taxes. The fiscal position of an independent Scotland would not be the same as that of Scotland within the UK. We identify key UK assets and liabilities and consider how these might be divided if Scotland were to separate from the UK. The UK Government’s view is that an independent Scotland would be responsible for a share of the UK’s liabilities, but, legally, the rUK would continue to own the UK’s assets. The Scottish Government’s view is that Scotland would be entitled to a proportionate share of the UK’s assets and that there would be a negotiation on liabilities. It highlights the major and at times overlooked influence of external creditors on the negotiations whose interest is receiving their money back. Three debt-division methods have been proposed:
1. Population – Scotland accounts for 8.4% of the UK’s population. 2. GDP – Scotland accounts for 8.3% of the UK’s GVA 3. Historical benefits – net benefits/ fiscal debts over a period e.g. 30 years?
Of these three methods, debt division based on population or GDP are regarded as the most probable, and would result in similar net debt/ GDP ratio figures for an independent Scotland. Projections of oil and gas production tax revenues and liabilities from decommissioning are central to any debate about the potential fiscal position of an independent Scotland.
SCDI Future Scotland | Macroeconomic and Fiscal Sustainability | April 2013 8
Government revenues from production are a function of (a) oil prices, (b) oil/gas production, (c) new investment and capital allowances allowed against income for tax purposes. In recent years, there have been wide swings in the price of oil and medium-term forecasts vary significantly. North Sea oil and gas production has appeared more erratic and difficult to predict. Increased capital investment totalling £13bn for the year ending 2013 will increase oil and gas production in time but, in the short-term, tax revenues will reduce as the capital allowances associated with planned investment increases. For an independent Scotland, the key issues would be the volatility of this revenue and maximising revenues in the long-term. Over the long-term, estimates prepared by the OBR suggest that tax revenues will fall to the equivalent of 3% of Scottish GDP, compared with 5-10% of GDP during the previous 30 years. Other economists believe that revenues can be sustained at 5%. The costs of providing decommissioning relief to industry for the UK Government are estimated to be around £16.5bn, mostly for installations in Scottish waters. An independent Scotland would need to be able to fund its share or this could lead to premature decommissioning of fields by industry. The monetary policy decisions for an independent Scotland are central to its fiscal and financial regulation arrangements. Four currency options are discussed in this report:
Euro; Sterling Union; Scottish Currency – pegged; and Scottish Currency – unpegged.
The report summarises the potential institutional arrangements for each and the potential opportunities and constraints for economic and fiscal policy which these options entail. The UK has an opt-out from the euro, however all new Member States are obliged in their accession agreements to adopt the euro when they meet the necessary criteria. The Scottish Government has said that it would aim to negotiate retention of an opt-out while the UK Government has said that an independent Scotland would not automatically inherit one. An independent Scotland would be highly unlikely to meet the debt-to-GDP ratio criteria for membership in the near future. Membership of the euro would mean a common currency with Scotland’s largest overseas trade market, but also adherence to the strict rules of the EU’s Fiscal Stability Treaty. A Sterling Union is the strong preference of the Scottish Government. The UK is an optimal currency zone and a sterling union would minimise economic disruption. An independent Scottish Government would have scope to use fiscal levers, but a rUK Government may seek in negotiations on the currency to limit its flexibility over spending and borrowing, while the Bank of England may set an interest rate for the rUK and not for an independent Scotland. A pegged Scottish currency would also support cross-border trade with the rUK and allow for more flexibility on future options, but would import monetary policy from the rUK with implicit fiscal constraints, and involve start-up and, probably, higher borrowing costs. An unpegged Scottish currency would mean that an independent Scotland could devalue, boost its monetary supply and control its interest rates in response to conditions. However, it would be more disruptive for businesses and mean start-up and transition costs, with the probability that uncertainty and the need to build credibility in the bond markets would mean higher borrowing costs. These arrangements are of key concern to the highly-integrated UK financial services sector. Two of the UK’s largest banks, RBS and Lloyds, both part-owned by the UK Government, have their HQs in Scotland. Insurers based in Scotland sell 94% of their products to the rest
SCDI Future Scotland | Macroeconomic and Fiscal Sustainability | April 2013 9
of the UK while 84% of mortgages sold by Scottish firms are to the rest of the UK. Scottish Financial Enterprise believes that, implicitly under the EU’s regulatory framework, Scotland would need its own financial regulator. The Scottish Government’s Fiscal Commission has proposed that systemically important banking institutions should be supervised either by the Bank of England, under an agency agreement with the Scottish Government, or by a Scottish Monetary Institute in partnership with the Bank. A Scottish regulator would undertake microprudential regulation of financial services companies. The challenges of establishing a separate financial regulator should not be underestimated. Lender of last resort facilities were provided to RBS at a cost of about 3% of UK GDP – comparable figures for an independent Scotland have been estimated at 37% of GDP. The Scottish Government’s Fiscal Commission has proposed that such interventions in the future could be undertaken jointly and co-ordinated through its proposed Macroeconomic Governance Committee. The UK Government has also said that the rUK would be unlikely to intervene until there was an impact on the rUK’s financial position and, if it did agree to the arrangements, it would probably negotiate tight rules to govern the finances of the Scottish Government and Scotland’s banks. Financial markets and overseas customers would want as much assurance as possible. This may influence the banks on their future corporate locations and structures. Monetary and financial regulation arrangements would influence the rate at which an independent Scotland could borrow. Credit ratings are usually but not always reflected in a government’s cost of borrowing. Moodys has recently downgraded the UK’s credit rating. There is some evidence of a small country risk premium for borrowing, though small countries are among the few remaining with AAA ratings. Scotland’s debt inheritance, lack of a track record, volatile revenues and large banks, may result, initially, in a higher borrowing rate and, therefore, extra outlays from the budget of an independent Scottish Government. The Scottish Government’s Fiscal Commission has recommended that an independent Scotland should plan budgets on a “cautious estimate” for North Sea oil revenues and invest any upside revenue volatility in a stabilisation fund. How an independent Scotland would address the fiscal sustainability challenge would not be clear until the completion of negotiations with the rUK and the formation of the first independent Scottish Government. Our report does identify some of the expenditure and taxation proposals of the present administration. In particular, Scottish Ministers would like to reduce corporation tax. However, in negotiations on the continuance of a sterling union and common financial regulation, it is possible that the rUK may seek to limit an independent Scottish Government’s flexibility in fiscal policy, particularly if it was concerned about the fiscal stability of a sterling zone, and about cross-border competition for investment and the potential reduction of its tax revenues. This report concludes with a description of the Scotland Bill and opposition party policies and/ or processes for enhanced devolution. This has not been a focus for SCDI’s work, but we are interested in how all constitutional arrangements – independence, the status quo, and enhanced devolution - would address the Key Questions that follow.
SCDI Future Scotland | Macroeconomic and Fiscal Sustainability | April 2013 10
Key Questions How could best use be made of fiscal and other levers to deliver sustainable economic growth while addressing the pressures on public finances likely to be imposed by increasing social, economic and environmental demands? How could different constitutional arrangements, including the Union and Scottish Independence, and their associated opportunities and constraints, impact on the challenge above and the following questions?
1. How can the current and projected gaps between Scotland’s revenues and expenditure be closed? What can we learn from countries which have successfully tackled fiscal challenges and have greater fiscal sustainability?
2. What can be done to stimulate sustainable economic growth, particularly in those areas where Scotland’s performance has been at its weakest, such as the rates of entrepreneurial activity, business R&D and innovation activity?
3. What are the fiscal levers which could most improve business growth in Scotland? What would be the likely trade-offs between tax competiveness, public investment and the costs of doing business across the UK market?
4. What can be done to address fiscal challenges from economic competition, an
ageing population, climate change, inequality, infrastructural renewal and declining revenues from oil and gas production and environmental taxes?
5. What can be done - in terms of key criteria such as economic growth and structure,
budgetary performance and stability, debt burdens and management, political stability, wealth and demographics – to ensure that Scotland benefits from competitive rates of borrowing from financial markets?
6. How could possible currency arrangements affect Scotland’s ability to deliver on this agenda and what opportunities and constraints could these entail?
SCDI Future Scotland | Macroeconomic and Fiscal Sustainability | April 2013 11
The Fiscal Gap All governments borrow money. Governments may run a deficit between their revenues and their expenditures which requires borrowing from the financial markets for a variety of sound reasons e.g. to cover for an unexpected shortfall in revenues, to stimulate demand in the economy, to invest in infrastructure which will enable economic growth in the long-term or to finance war. Successive UK Governments have needed to borrow to make up the difference between receipts and expenditure. In the 33 years between 1979 and 2011, the UK has had a deficit in 27 of these. Persistent annual deficits lead to the build up of national debt and interest payments, Following large-scale wars, the UK has had a level of debt which is far higher than today. However, by running budget surpluses, it managed to reduce these debts over time. Between 1997 and 2007 the UK Government reduced public sector borrowing slightly and was using a greater proportion of borrowing to finance investment rather than current spending. Public sector debt was also reduced over this period. However, the vast majority of other leading industrial countries achieved a greater reduction in borrowing and debt over this decade, leaving the UK in a worse-off position when the financial crisis struck, relative to comparable countries2. The deficit substantially increased following the financial crisis and recession in 2007-08, as tax revenues slumped. In response, a rolling programme of tax increases and spending cuts has been implemented under successive Governments. The new Coalition Government committed to two fiscal targets - a fiscal mandate which states that the structural current budget must be forecast to be in balance or surplus by the end of the five year forecast horizon, and a supplementary target that states Public Sector Net Debt (PSND) as a share of national income must be falling at a fixed date of 2015-16. The Institute of Fiscal Studies (IFS) reported that by the end of 2012-13, 79% of the planned tax increases, 67% of the investment spending cuts, 32% of the benefit spending cuts and 21% of the public service cuts will have been implemented3. When it is completed, the austerity programme will be the longest in the UK’s history. The Scottish Government has estimated that, on current forecasts, it could take until 2025-26 for the Scottish Budget to return to the level of 2009-10 in real terms, which would result in a cumulative amount foregone over that period of close to £51bn4. Arguments will continue as to whether the cuts were unavoidable and necessary to heal the economy and public finances, or have resulted in higher deficits by reducing growth, thereby decreasing tax revenues and leading to higher welfare spending5. Either way, the deficit is now forecast by the independent Office of Budgetary Responsibility to be 5.6% of GDP in 2012-13, and is expected to peak at 6.8% next year before declining to 2.2% of GDP by 2017-18. Debt is forecast to continue growing and peak at 85.6% of GDP in 2016-17, before falling only slightly to 84.8% in 2017-18. As a result, the Government’s target for PSND looks highly likely to be missed6. Debt interest is making up a growing proportion of the UK Government’s expenditure, and in turn restricts governments’ ability to respond to future challenges. Reflecting this deteriorating outlook, agencies have started to downgrade the credit rating of the UK for borrowing for the first time since 1978. 2 Chote, R. et al, 'The Public Finances: 1997 to 2010', Institute of Fiscal Studies, IFS BN93, 2010 3 Institute of Fiscal Studies, ‘The IFS Green Budget: February 2013’, 2013 4 Gillespie, G., ‘State of the Economy – November 2012’, Scottish Government, 2012 5 International Monetary Fund, ‘World Economic Outlook: Coping with High Debt and Sluggish Growth’, 2012 6 Office for Budget Responsibility, ‘Economic and Fiscal Outlook’, 2013
SCDI Future Scotland | Macroeconomic and Fiscal Sustainability | April 2013 12
As has previously been noted, the UK has successfully reduced far larger debts in its history. Even following the recession in the early 1990s, there were fears about the sustainability of the UK’s public debt which economic growth subsequently dispelled. However, there is a concern among SCDI members and some economists that the long-term fiscal position of the UK is weaker than at that time. Reasons for this include:
The UK’s structural budget deficit was already growing before the recession; The large proportion of tax revenues which were generated from the UK’s financial
services sector will not return due to reforms to the banking sector; The UK, with Japan, is the most indebted of all big, rich economies. The aggregate
indebtedness of the UK – the sum of household debts, company debts, government debts and bank debts – was estimated to have risen to 507% of GDP by 2012. By way of comparison, US indebtedness fell to 279% of GDP and Germany’s was 278% (and even Spain’s was far lower at 363%)7;
The UK faces substantial long-term expenditure challenges, particularly due to fundamental demographic changes increasing health and social care costs;
According to the OBR’s analysis, the recession has significantly reduced the long-term productive potential of the UK economy and there is little scope for above-trend rates of economic growth. In 2008, the Treasury’s “cautious” projection was that potential national income would grow by 2.5% per year. However, the OBR estimates that the potential capacity of the economy increased by an average of 0.4% a year between 2007−08 and 2012−13 and from 2013-14 onwards the long-term growth rate is just 2.25%. As such, potential national income is now estimated to be 13% lower in 2016−17 than was projected by the Treasury in 20088;
The economic axis of the world is shifting decisively to emerging markets. One possible way of reducing debt is through inflation reducing the debt to GDP ratio. The IMF, however, considered 26 episodes since 1875 when debt has topped 100% of GDP and how that ratio was then reduced, concluding that the relationship between inflation and debt reduction is ambiguous, and while hyperinflation clearly correlates with sharp debt reduction, if these extreme episodes are excluded, there is no clear association between the average inflation rate and the change in debt9. Higher inflation can boost tax revenues. However, it can also increase spending on benefits and public sector wages. It can result in investors demanding higher interest rates to compensate for inflation risks. UK debt is high, its debt maturity is around 13 years, and a fifth of this debt is inflation linked. It has therefore been ranked as one of the worst placed G7 countries to reduce debt through inflation (Germany was ranked best placed due to its small deficit, little inflation linked debt and average debt maturity of six years). Private sector debt is also much higher that it was in the 1970s, and in Britain 66% of outstanding mortgages are variable rate10. Inflation in the UK has been and is expected to remain above the Bank of England’s 2% target. While some of these challenges may be particularly acute for the UK, on-going debates in the US and Eurozone have illustrated that the broader issue of fiscal sustainability is common to many developed countries. For example, the German Chancellor Angela Merkel
7 McKinsey Global Institute, ‘Debt and deleveraging: Uneven progress on the path to growth’, 2012 8 Johnson, P. and Phillips, D., ‘Scottish independence: the fiscal context’, Institute for Fiscal Studies, 2012 9 International Monetary Fund, ‘World Economic Outlook: Coping with High Debt and Sluggish Growth’, 2012 10 The Economist, ‘Escaping the debt crisis: the inflation option’, The Economist, 14 June 2011
SCDI Future Scotland | Macroeconomic and Fiscal Sustainability | April 2013 13
has pointed out that, while Europe accounts for 8% of the world’s population and 25% of its GDP, it accounts for 50% of its social spending11. Scotland The Government Expenditure and Revenue Scotland (GERS) is the official analysis of the current budget balance for the public sector in Scotland. It estimated that in 2011-12 there was a deficit of £14bn (11.2% of GDP) excluding North Sea revenue or a deficit of £3.4bn (2.3% of GDP) including an illustrative geographical share of North Sea revenue. In 2011-12, the UK as a whole ran a current budget deficit, including 100% of North Sea revenue, of £92.3bn (6% of GDP). In the year 2009-10, Scotland’s fiscal deficit would have been 18.1% of GDP excluding oil revenues and 10.7% of GDP including a geographical share of oil revenues. Between 1980-81 and 2011-12 Scotland’s average annual net fiscal deficit is estimated at 9.2% of GDP excluding North Sea revenue. Including a geographical share of North Sea revenue, this becomes an average 0.2% surplus. The UK in the same period is estimated to have run an average annual net fiscal deficit of 3.2%12.
The IFS has found that this has been generally true of recent years. Excluding oil and gas revenues, or assigning them on a population basis, results in a larger spending gap in Scotland than in the UK as a whole. However, assigning oil and gas revenues geographically results in a similar if not smaller spending gap in Scotland13. The Centre for Public Policy for Region’s (CPPR) forecasts of Scotland’s fiscal balance have predicted that by the year 2016-17 (excluding North Sea revenue) Scotland would have a deficit of £13.7bn (9.3% of GDP). When North Sea revenue is taken into account, the deficit closes to £9.2bn (5.1% of GDP)14. So there is a similar large deficit between revenues and expenditure in Scotland to the UK as a whole. How to return to long-term fiscal sustainability is, therefore, a challenge which Scotland would and must face under any constitutional settlement. Long-term Fiscal Challenges Fiscal Projections The long-term outlook for public spending and revenues is subject to huge uncertainties. When projected forward, relatively minor changes to GDP growth or demographics in the short-term compound into far greater differences. Central to the projections made by the OBR is an assumption that economic productivity will grow at an average 2.2% per year, in line with the average rate over the last 50 years. The OBR suggests that public finances will come under pressure over the longer term. Spending other than on debt interest will rise from 35.6% of GDP forecast for 2016-17 to 40.8% of GDP by 2061-62. Meanwhile, declining receipts from oil and gas production taxes, environmental taxes and tobacco duties are expected to reduce revenue by up to 2% of GDP over the next 30 years. Corporation tax and VAT receipts may also come under downward pressure due to international competition. This would result in the primary budget balance moving from a projected surplus of 1.7% of GDP in 2016-17 to a deficit of 2.6% of
11 Peel, Q., 'Merkel warns on cost of welfare', Financial Times, 16 December 2012 12 Scottish Government, ‘Government Expenditure and Revenue Scotland 2011-12’, 2013 13 Johnson, P. and Phillips, D., ‘Scottish independence: the fiscal context’, Institute for Fiscal Studies, 2012 14 Centre for Public Policy for Regions, ‘Analysis of Scotland’s Past and Future Fiscal Position: Reflections on GERS 2013, the Scottish Government’s Oil and Gas Analytical Bulletin, and the 2013 UK Budget’, March 2013
SCDI Future Scotland | Macroeconomic and Fiscal Sustainability | April 2013 14
GDP in 2061-62. Debt is projected to fall from 74% of GDP in 2016-17 to 57% in the mid-2020s, before rising at an increasingly faster rate to reach 89% of GDP in 2061-6215. The sustainability of public sector debt can be measured through consideration of the ‘fiscal gap’ i.e. how large a permanent spending cut or tax increase is necessary to move public sector net debt to a particular target level at a particular target date. The OBR illustrates that to return UK debt to a pre-crisis level of 40% of GDP in 2061-62, the government would need to introduce, probably incrementally, a permanent tax increase or spending cut of 1.1% of GDP (£17bn in today’s terms)16. The Scottish Government expects real terms increases in the costs of providing public services for two reasons: in the long run wages rise in real terms to ensure that appropriate staff can be recruited and retained, and demographic pressures will increase demand for public services, particularly but not only in health, requiring real terms increases in budgets, and the costs of state pensions and public sector pensions17. Economic – Low Growth High debt/GDP levels (90% and above) are associated with lower growth. Between 1830 and 2009 average real GDP growth during periods of UK government debt of over 90% was only 1.8% per year, compared to 2.15% with debt between 60-90% of GDP, 2.2% for debt between 30-60% of GDP and 2.5% for debt below 30%18. Academics have modelled financial collapses from the last 200 years and found that, on average, it took countries with similar levels of modern debt 23 years to recover19. By the 2020s and 2030s the working age population of ageing European countries and Japan is expected to contract between 0.5% and 1.5% per year. Household savings rates will decline as a larger share of the population moves into retirement years, potentially dampening economic growth and worker productivity, and entrepreneurship will fall. It has been suggested that “unless labour-force participation rates surge or economic performance improves dramatically, some developed countries could face a future of secular economic stagnation—in other words, of zero real GDP growth from peak to peak of the business cycle”20. It is expected that small-population, ageing European countries will have the slowest growth. While the UK will perform better, its growth rates over the next few decades are still expected to be significantly lower than over the previous decades. HSBC has suggested annual GDP growth rates for the UK of 1.6% (2010-20), 1.7% (2020-30), 1.9% (2030-40) and 2.2% (2040-50), compared to 2.4% over the last 30 years21.
15 Office for Budget Responsibility, ‘Financial Sustainability Report’, 2012 16 Ibid 17 Swinney, J., Scottish Government Cabinet Paper, 2012 18 Reinhart, C.M., Rogoff, K.S., ‘Growth in a Time of Debt’, The National Bureau of Economic Research, Working paper No.15639, 2010 19 Reinhart, C.M., Reinhart, V.R, and Rogoff, K.S., ‘Debt Overhangs: Past and Present’, The National Bureau of Economic Research, Working paper No.18015, 2012 20 Jackson, R., ‘How demography is reshaping the economic and social landscape of the 21st century’, The Geneva Association, 2012 21 Ward, K., ‘The World in 2050: From the Top 30 to the Top100’, HSBC Global Research, 2012
SCDI Future Scotland | Macroeconomic and Fiscal Sustainability | April 2013 15
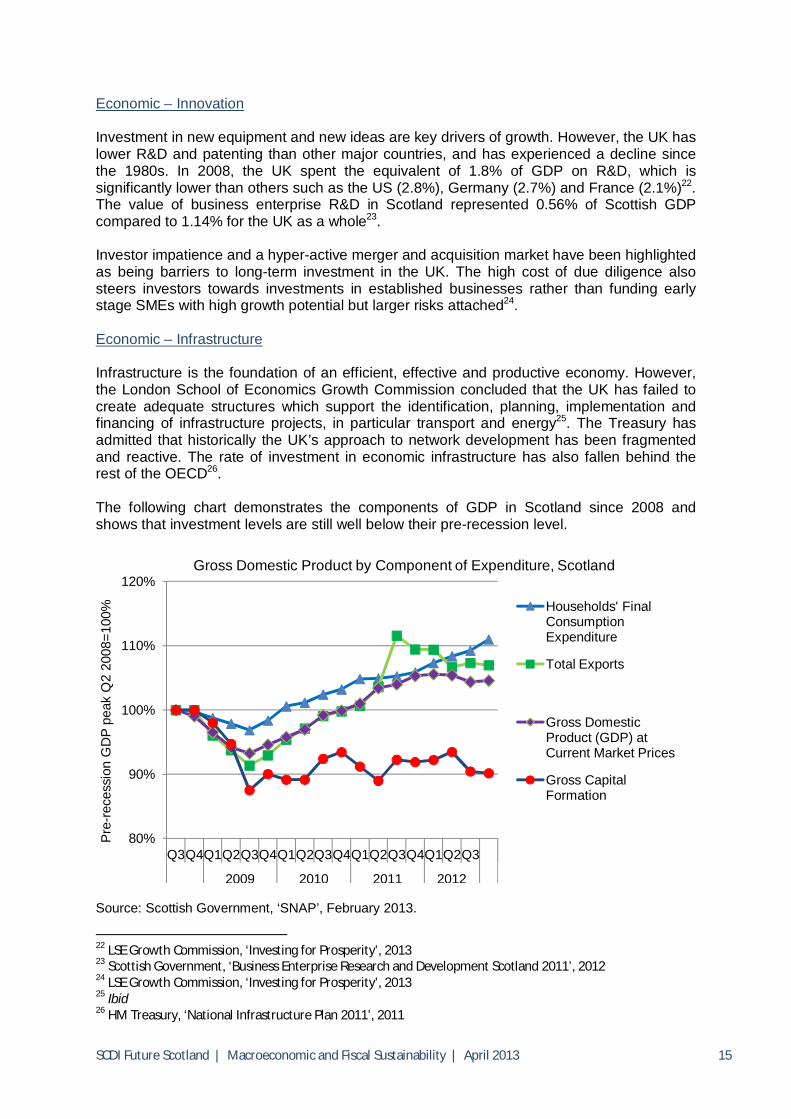
Economic – Innovation Investment in new equipment and new ideas are key drivers of growth. However, the UK has lower R&D and patenting than other major countries, and has experienced a decline since the 1980s. In 2008, the UK spent the equivalent of 1.8% of GDP on R&D, which is significantly lower than others such as the US (2.8%), Germany (2.7%) and France (2.1%)22. The value of business enterprise R&D in Scotland represented 0.56% of Scottish GDP compared to 1.14% for the UK as a whole23. Investor impatience and a hyper-active merger and acquisition market have been highlighted as being barriers to long-term investment in the UK. The high cost of due diligence also steers investors towards investments in established businesses rather than funding early stage SMEs with high growth potential but larger risks attached24. Economic – Infrastructure Infrastructure is the foundation of an efficient, effective and productive economy. However, the London School of Economics Growth Commission concluded that the UK has failed to create adequate structures which support the identification, planning, implementation and financing of infrastructure projects, in particular transport and energy25. The Treasury has admitted that historically the UK’s approach to network development has been fragmented and reactive. The rate of investment in economic infrastructure has also fallen behind the rest of the OECD26. The following chart demonstrates the components of GDP in Scotland since 2008 and shows that investment levels are still well below their pre-recession level.
Source: Scottish Government, ‘SNAP’, February 2013.
22 LSE Growth Commission, ‘Investing for Prosperity’, 2013 23 Scottish Government, ‘Business Enterprise Research and Development Scotland 2011’, 2012 24 LSE Growth Commission, ‘Investing for Prosperity’, 2013 25 Ibid 26 HM Treasury, ‘National Infrastructure Plan 2011’, 2011
80%
90%
100%
110%
120%
Q3Q4Q1Q2Q3Q4Q1Q2Q3Q4Q1Q2Q3Q4Q1Q2Q3
2009 2010 2011 2012
Pre
-rec
essi
on G
DP
pea
k Q
2 20
08=1
00%
Gross Domestic Product by Component of Expenditure, Scotland
Households' Final Consumption Expenditure
Total Exports
Gross Domestic Product (GDP) at Current Market Prices
Gross Capital Formation
SCDI Future Scotland | Macroeconomic and Fiscal Sustainability | April 2013 16
According to the Institution of Civil Engineers only ‘Water and Waste Water’ infrastructure in Scotland is adequate. ‘Energy’, ‘Transport’, ‘Waste’, and ‘Flood Risk Management’ infrastructure, on the other hand, all require attention27. The backlog in maintenance of the physical estate in Scotland has been estimated to stand in excess of £4bn. In addition, local authorities will need to increase waste management spending by £580m per year in order to meet waste management targets28. At a time when the Scottish population has grown to record high figures, the level of all housing completions last year was the lowest since World War Two29. Where possible, housing adaptations represent a cost-effective alternative to residential care for the elderly and can reduce hospital admissions. It is estimated that the number of pensioner households requiring adaptations to make them more suitable for old age will increase from 66,300 in 2008 to over 106,000 in 203330. The UK’s National Infrastructure Investment Plan identifies a pipeline of projects valued at around £310bn to 2015 and beyond31. The Scottish Government’s Infrastructure Investment Plan identifies its plans for investment in the next 20 years. The total cost has of this Plan been, independently, estimated to be around £60bn32. Social - Ageing Demographics Much of the future spending increases projected by the OBR can be attributed to the UK’s ageing population profile. The proportion of the population aged over 65 will rise from 17% in 2012 to an estimated 26% in 206133. In Scotland, the proportion of older people aged 85+ is expected to double in 2010-30 from 1.9% to 3.8%. Between 1951 and 2009 life expectancy increased from 64.4 to 75.8 for males and from 68.7 to 80.3 years for females, 10 to 20 years after the default retirement ages34. The dependency ratio (number of ‘dependants’ per 100 people of working age population) is expected to rise from 60 per 100 to 64 per 100 in 2035, with an increase of pensionable aged people of 2.9% compared with 1.7% for the UK35. Although healthy life expectancy is increasing, it is not improving at the same rate36. An ageing population will incur higher health, care and pension costs. For example, the amount of money spent by Scottish local authorities on providing personal care services to older people in their own homes has more than doubled in the last 7 years, increasing from £133m in 2003-04 to £342m in 2010-1137. Modelling carried out by COSLA forecast a funding gap for local authority services of almost £3bn by 2016-17, with around half attributed to a rising
27 Institution of Civil Engineers, ‘The State of the Nation Briefing, Scotland: Infrastructure Special 2011’, 2011 28 Black, R.W., ‘Unlocking the Potential in Scotland’s Public Services; From Good to Great by 2020’, The David Hume Institute, N.96, 2012 29 Homes for Scotland, ‘Activity Report, 2012’, 2012 30 Scottish Government, ‘Age, home and community: a strategy for housing for Scotland’s Older People: 2012-2021’, 2011 31 HM Treasury and Infrastructure UK, ‘National Infrastructure Plan: update 2012’, 2012 32 Scottish Government, ‘Capital Spending Plans’, 6 December 2012 33 Office for Budget Responsibility, ‘Financial Sustainability Report’, 2012 34 Bell, D., ‘Fiscal Sustainability: Issues for the Finance Committee Work Programme 2012’, 2012 35 Finance Committee, ‘Demographic change and aging population inquiry; submission from The National Records of Scotland’, Scottish Parliament, 2012 36 Scottish Government, ‘Demographic change in Scotland’, 2010 37 Scottish Government, ‘Free Personal and Nursing Care, Scotland, 2010-11’, A National Statistics Publication for Scotland, 2012
SCDI Future Scotland | Macroeconomic and Fiscal Sustainability | April 2013 17
demand for services driven largely by demographics and their needs in the future38. State pensions in Scotland cost over £7bn per year39. Across the UK, it has been estimated that an additional 6% of GDP will be required by 2030 to meet the social costs of ageing and other commitments40. According to a study of 15 developed and developing countries, people in the UK are the worst prepared for retirement, with savings which will run out after a third of the way through the average retirement, leaving a further 12 years with no savings41. Another study suggested that, in 2011, 20% of people were doing nothing at all to prepare for their retirement. Two-thirds of those who could reasonably be expected to save for retirement (i.e. excluding under 30’s and those earning less than £10,000 per year) were preparing adequately, while the remaining third either did not save or made only a ‘token effort’42. Social – Inequality Research by economists at the International Monetary Fund suggests that income inequality slows growth, causes financial crises and weakens demand. A survey for the World Economic Forum pointed to inequality (alongside fiscal imbalances) as the most pressing problem of the coming decade. Bigger income gaps can reduce social mobility and, therefore, future prosperity. Some economists have said that rising income gaps have led to credit booms as those falling behind try to keep up, causing macroeconomic instability, although others have disputed this evidence. The Gini co-efficient aggregates the gaps between people’s incomes into a single measure. The UK has had the most rapid increase in income inequality of the 34 OECD countries since 1975, with a rising share of national income taken by the top 1%43. According to the World Bank, inequality of opportunity accounts for over 20% of total inequality in Britain. This is higher than the US and any European country except Italy. Over half of income differences persist between generations in the UK, reflecting a low level of social mobility44. In 2009 Scotland had the widest gap in educational attainment between the top 20% and bottom 20% in developed Europe. At the age of 15 the bottom 20% performs as if they have received 5 years less schooling than the top 20%45. “Skill-biased technological change” is one of the main determinants of inequality. The London School of Economics Growth Commission stated that improving human capital is arguably the most effective way of encouraging inclusive growth and reversing these trends in rising inequality46. Environmental – Climate Change The Climate Change (Scotland) Act 2009 established a statutory commitment to reduce emissions by 42% by 2020 compared to 1990 levels, and by 80% by 2050. The Scottish
38 Finance Committee, ‘Demographic change and aging population inquiry; submission from COSLA’, Scottish Parliament, 2012 39 Bell, D., ‘Busting the Benefit Budget’, The Scotsman, 19 February 2013 40 2020 Public Services Trust, ‘From social security to social productivity: a vision for 2020 Public Services: The final report of the Commission on 2020 Public Services’, The RSA, 2010 41 HSBC, ‘The Future of Retirement: A new reality - Global report’, 2013 42 Scottish Widows, ‘The Scottish Widows UK Pensions Report; Seventh annual report on the state of retirement savings across the nation’, 2011 43 OECD, ‘Divided We Stand: Why Inequality Keeps Rising’, 2011 44 The Economist, ‘Special Report: For Richer, For Poorer’, 13 October 2012 45 Mair, C., Zdeb, K. and Markie, K., ‘Making Better Places: Making Places Better; the distribution of positive and negative outcomes in Scotland’, The Improvement Service, 2011 46 LSE Growth Commission, ‘Investing for Prosperity’, 2013
SCDI Future Scotland | Macroeconomic and Fiscal Sustainability | April 2013 18
Government has estimated the cost to the Government of implementing its proposals and policies on climate change could amount to £8bn by 202247. However, due to the potential of climate change to disrupt the economy the costs of inaction could be much higher. The UK Government’s Committee on Climate Change has advised that while the 42% reduction target is likely to cost less than 1% of GDP in 2020, the cost of not acting is estimated at 5-20% of GDP48. The Stern Review concluded that tackling climate change is a long-term pro-growth strategy49. Environmental – Resource Constraints Over the last 30 years there has been a large expansion in the global population and the number of people globally who can be defined as ‘middle class’ in terms of consumption has also grown from around 1.1bn to 1.8bn. Over the next 20 years the growth of this resource hungry portion of population is predicted to continue rising to nearly 5bn people, an expansion far faster than at any other time in history50. Resources are also under pressure from rising extraction costs. Forecasts indicate that demand could triple for a series of critical materials by 2030 compared with 2006 levels. The price of copper has already increased 400% between 2000-10. The shortage and instability of supply of these materials is already impacting business. The Scottish Economy Overview In a UK context, the Scottish economy has performed relatively well over the last 30 years, diverging from regions such as North East England. The success of the oil and gas and financial services sectors were two major reasons. GDP per head is now above nearly every English region. Scotland’s gross value added (GVA) per head at 98.7% of the UK average in 2010 is only exceeded by London and the south-east of England. In the 1960s Scotland’s GDP per head was 12% below the UK’s average, making it one of the poorest regions51. Scotland’s average annual growth in GDP over the 30 years to 2006 was 1.9%, well below the UK average of 2.4%, resulting in an underlying GDP growth gap of around 0.5%, but its population has not grown as fast as the rest of the UK either52. The gap in the unemployment rates of England and Scotland fell from almost 4% in the mid-1980s to virtually zero since 200053. In terms of annual average growth of GDP over the last 30 years, Scotland has performed worse than EU countries of a comparable size (i.e. Austria, Denmark, Finland, Ireland, Luxembourg, Portugal and Sweden). Their average was 2.7%, resulting in an underlying GDP growth gap of around 0.9%54. However, the Scottish Government argues that Eurostat GDP per capita figures have shown Scotland would be fifth richest country in the EU while
47 Beveridge, C.W. ,McIntosh, N. and Wilson, R. ‘Independent Budget Review: The Report of Scotland’s Independent Budget Review Panel’, 2010 48 Scottish Government, ‘Low Carbon Scotland: Meeting the Emissions Reduction Targets 2010-2022’, 2011 49 Stern, N, ‘Stern Review: The Economics of Climate Change’, HM Treasury, 2006 50 McKinsey, ‘Mobilizing for a resource revolution’, McKinsey Quarterly, 2012 51 McCrone, G., ‘The Scope for Economic Policy After Independence’, 2012 52 Economic Affairs Committee, ‘The economic implications for the United Kingdom of Scottish Independence’, House of Lords, Evidence Session No.3, Questions 117-187, 2012 53 Economic Affairs Committee, ‘The economic implications for the United Kingdom of Scottish Independence: Oral and Written Evidence’, House of Lords, p.21-30, 2012 54 ‘Technical Notes for Scotland Performs Indicators and Targets – Purpose Target 1’ http://www.scotland.gov.uk/Topics/Statistics/About/NotesSP/TechnicalNotesSPPT1
SCDI Future Scotland | Macroeconomic and Fiscal Sustainability | April 2013 19
the UK would rank 11th55. On the other hand, the Centre for Public Policy for Regions (CPPR) says if the Scottish Government used GNP rather than GDP figures, Scotland’s position would not be as high. It estimates that Scotland would be about the 15th richest country in the world56. According to the CPPR, the fastest growing industrial sectors since 1998 were:
Financial Services; Transport, Storage & Communications; Real Estate and Business Services; Retail & Wholesale (for Scotland); Health & Social Work (for the UK)57.
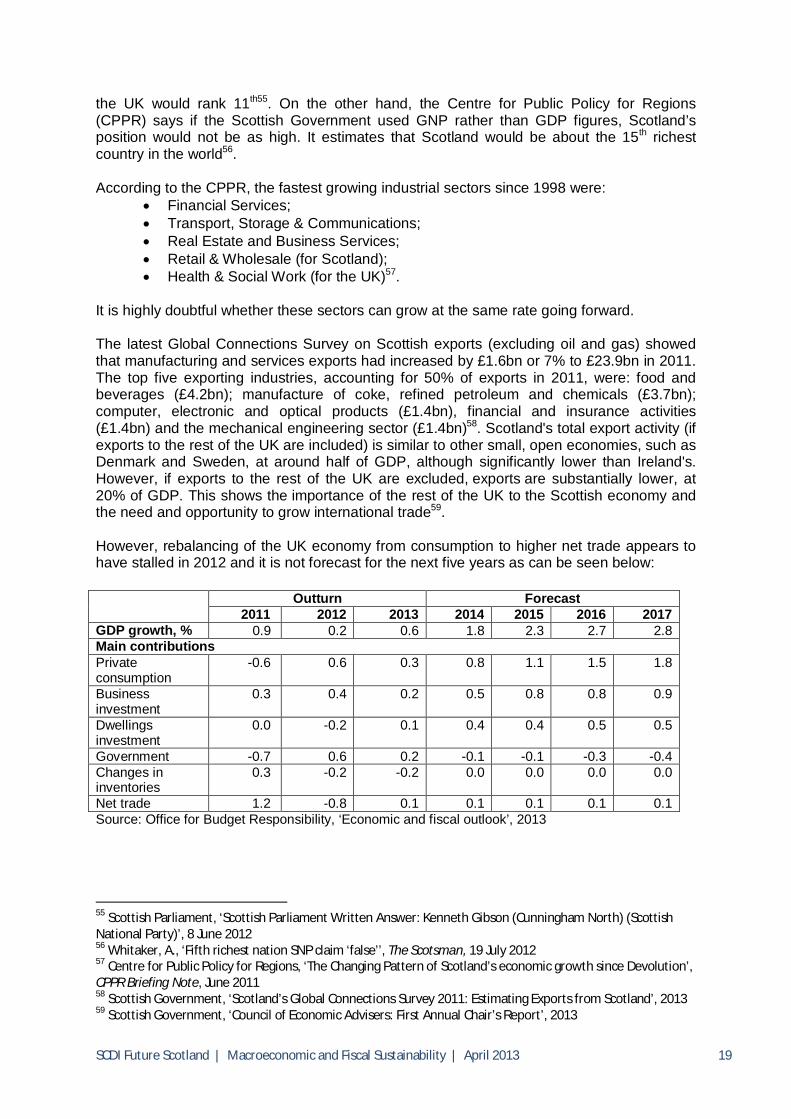
It is highly doubtful whether these sectors can grow at the same rate going forward. The latest Global Connections Survey on Scottish exports (excluding oil and gas) showed that manufacturing and services exports had increased by £1.6bn or 7% to £23.9bn in 2011. The top five exporting industries, accounting for 50% of exports in 2011, were: food and beverages (£4.2bn); manufacture of coke, refined petroleum and chemicals (£3.7bn); computer, electronic and optical products (£1.4bn), financial and insurance activities (£1.4bn) and the mechanical engineering sector (£1.4bn)58. Scotland's total export activity (if exports to the rest of the UK are included) is similar to other small, open economies, such as Denmark and Sweden, at around half of GDP, although significantly lower than Ireland's. However, if exports to the rest of the UK are excluded, exports are substantially lower, at 20% of GDP. This shows the importance of the rest of the UK to the Scottish economy and the need and opportunity to grow international trade59. However, rebalancing of the UK economy from consumption to higher net trade appears to have stalled in 2012 and it is not forecast for the next five years as can be seen below: Outturn Forecast
2011 2012 2013 2014 2015 2016 2017 GDP growth, % 0.9 0.2 0.6 1.8 2.3 2.7 2.8 Main contributions Private consumption
-0.6 0.6 0.3 0.8 1.1 1.5 1.8
Business investment
0.3 0.4 0.2 0.5 0.8 0.8 0.9
Dwellings investment
0.0 -0.2 0.1 0.4 0.4 0.5 0.5
Government -0.7 0.6 0.2 -0.1 -0.1 -0.3 -0.4 Changes in inventories
0.3 -0.2 -0.2 0.0 0.0 0.0 0.0
Net trade 1.2 -0.8 0.1 0.1 0.1 0.1 0.1 Source: Office for Budget Responsibility, ‘Economic and fiscal outlook’, 2013
55 Scottish Parliament, ‘Scottish Parliament Written Answer: Kenneth Gibson (Cunningham North) (Scottish National Party)’, 8 June 2012 56 Whitaker, A., ‘Fifth richest nation SNP claim ‘false’’, The Scotsman, 19 July 2012 57 Centre for Public Policy for Regions, ‘The Changing Pattern of Scotland’s economic growth since Devolution’, CPPR Briefing Note, June 2011 58 Scottish Government, ‘Scotland’s Global Connections Survey 2011: Estimating Exports from Scotland’, 2013 59 Scottish Government, ‘Council of Economic Advisers: First Annual Chair’s Report’, 2013
SCDI Future Scotland | Macroeconomic and Fiscal Sustainability | April 2013 20
In terms of inward investment, Ernst and Young’s UK Attractiveness Survey showed that Scotland topped the UK league in terms of job creation from FDI in 2011 for the second year running and secured 33.3% of all R&D projects investments into UK60.
60 Ernst & Young, ‘UK Attractiveness Survey’, 2011
SCDI Future Scotland | Macroeconomic and Fiscal Sustainability | April 2013 21
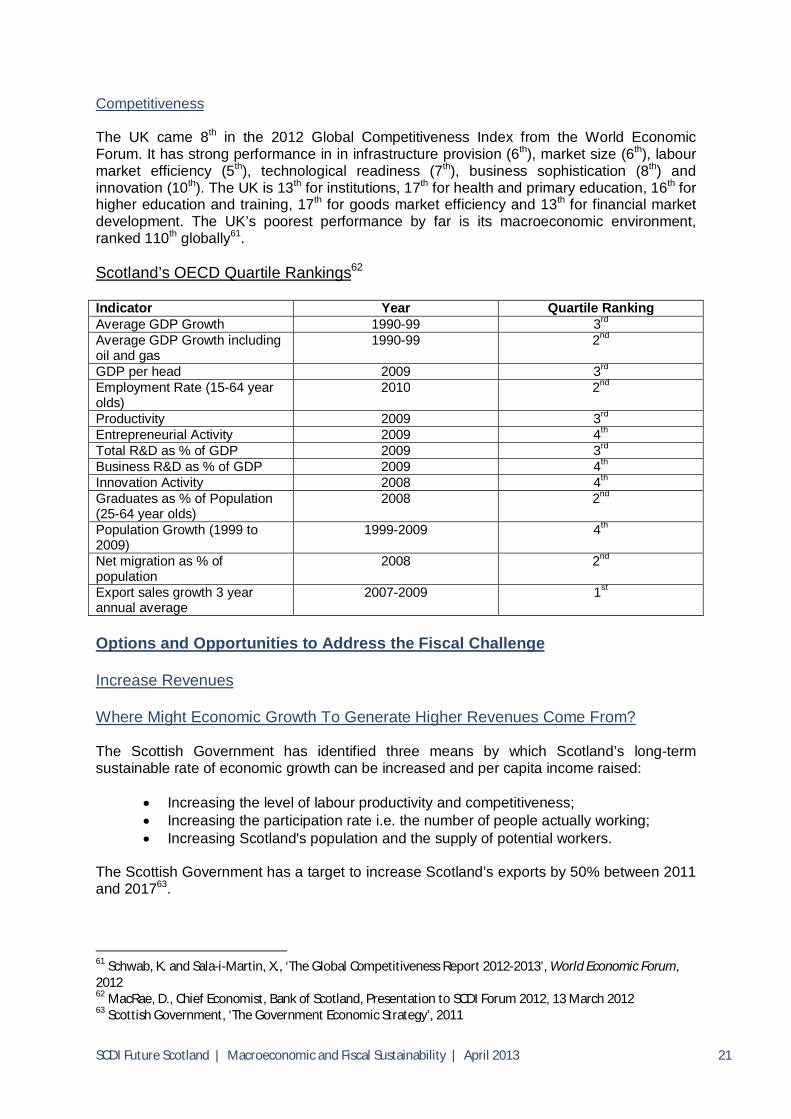
Competitiveness The UK came 8th in the 2012 Global Competitiveness Index from the World Economic Forum. It has strong performance in in infrastructure provision (6th), market size (6th), labour market efficiency (5th), technological readiness (7th), business sophistication (8th) and innovation (10th). The UK is 13th for institutions, 17th for health and primary education, 16th for higher education and training, 17th for goods market efficiency and 13th for financial market development. The UK’s poorest performance by far is its macroeconomic environment, ranked 110th globally61. Scotland’s OECD Quartile Rankings62 Indicator Year Quartile Ranking Average GDP Growth 1990-99 3rd Average GDP Growth including oil and gas
1990-99 2nd
GDP per head 2009 3rd Employment Rate (15-64 year olds)
2010 2nd
Productivity 2009 3rd Entrepreneurial Activity 2009 4th Total R&D as % of GDP 2009 3rd Business R&D as % of GDP 2009 4th Innovation Activity 2008 4th Graduates as % of Population (25-64 year olds)
2008 2nd
Population Growth (1999 to 2009)
1999-2009 4th
Net migration as % of population
2008 2nd
Export sales growth 3 year annual average
2007-2009 1st
Options and Opportunities to Address the Fiscal Challenge Increase Revenues Where Might Economic Growth To Generate Higher Revenues Come From? The Scottish Government has identified three means by which Scotland’s long-term sustainable rate of economic growth can be increased and per capita income raised:
Increasing the level of labour productivity and competitiveness; Increasing the participation rate i.e. the number of people actually working; Increasing Scotland's population and the supply of potential workers.
The Scottish Government has a target to increase Scotland’s exports by 50% between 2011 and 201763.
61 Schwab, K. and Sala-i-Martin, X., ‘The Global Competitiveness Report 2012-2013’, World Economic Forum, 2012 62 MacRae, D., Chief Economist, Bank of Scotland, Presentation to SCDI Forum 2012, 13 March 2012 63 Scottish Government, ‘The Government Economic Strategy’, 2011
SCDI Future Scotland | Macroeconomic and Fiscal Sustainability | April 2013 22
To guide and track progress, the Scottish Government’s Economic Strategy has outlined a number of long term targets.
1. Sustainable Economic Growth –To match the growth rate of small independent EU countries by 2017.
2. Productivity – To rank in the top quartile for productivity amongst our key trading partners in the OECD by 2017 (based on the change in gap between productivity levels in Scotland and the lowest ranking country in the top quartile).
3. Participation – To maintain our position on labour market participation as the top performing country in the UK and to close the gap with the top five OECD economies by 2017.
4. Population – To match the average European population growth over the period from 2007 to 2017, supported by increased life expectancy over this period.
5. Solidarity – To increase overall income and the proportion of income earned by the three lowest income deciles as a group by 2017.
6. Cohesion – To narrow the gap in participation between Scotland's best and worst performing regions by 2017.
7. Sustainability – To reduce emissions over the period to 2011. To reduce emissions by 80 per cent by 2050.
(Further information on progress with each target can be found in Annex A). The Scottish Government’s Economic Strategy identifies seven key sectors in which the Scottish economy has comparative advantages: energy, financial services, life sciences, creative industries, universities, tourism and food and drink. Industry Leadership Groups have prepared growth strategies and associated targets for most of these sectors. Further information on the associated targets can be found in Annex B. Particularly strong growth appears to be anticipated in the following:
1. Oil and gas – £44bn investment in North Sea 2012-16; increase total supply chain sales from £16.3bn to £30bn and exports from £7.6bn to £18bn by 2020.
2. Renewables – 2020 electricity target estimated to be worth up to £30bn investment; offshore wind and marine could generate an extra £11bn GVA.
3. Food and drink – increase exports from £3.7bn to £7.1bn between 2007-17. The wider Low Carbon Economic Strategy64 suggests that the worth of the Scottish sector could increase from £8.5bn to £12bn between 2007-08 and 2015-16, with the number of jobs growing 4% a year to 2020, rising by 130,000 (5% of the workforce). The Cities Strategy65 recognises Scotland’s city-regions as key economic drivers. Scottish Development International expects that there will be a strong increase in demand for Scottish goods and services in the following international markets66:
China: the second largest energy consumer after the USA, and by 2017 the largest importer of food, offering significant opportunities for the energy and food and drink sectors.
The Middle East: significant investment in the energy sector is expected over the next decade.
Norway: high demand for Scottish premium food and drink supported by high disposable incomes, as well as opportunities in oil and gas.
64 Scottish Government, ‘A Low Carbon Economic Strategy for Scotland’, 2011 65 Scottish Government, ‘Scotland’s Cities: Delivering for Scotland’, 2011 66 Scottish Development International, ‘SDI to open seven new international offices’, 27 July 2012
SCDI Future Scotland | Macroeconomic and Fiscal Sustainability | April 2013 23
Brazil: the world’s ninth largest oil producer, offering significant opportunities for Scotland’s oil and gas sector.
West Africa: significant opportunities for the oil and gas sector, including supply chain development and technology collaboration.
South Africa: the 5th largest export market for Scotch Whisky. Canada: rated as the top place to do business in the G7 over the next 3 years by the
Economist Intelligence Unit. South East Asia: the world’s fastest growing student market, expected to account
for 70% of the demand for international higher education by 2025. What Changes to Taxes Might Generate Higher Revenues? Reduce Tax Evasion and Avoidance In 2010-11 the tax gap was estimated to be around £32bn, or 6.7% of tax liabilities. This includes the following: criminal activity (£5bn), undeclared economic activity (£5bn), avoidance (£5bn), evasion (£4bn), legal interpretation (£4bn), non-payment i.e. because of business insolvency (£4bn), failure to take reasonable care i.e. careless/negligent recording and preparation of tax returns (£3bn), and error (£2bn). The largest proportion of the tax gap (45%) arises from Income Tax, National Insurance Contributions and Capital Gains Tax, followed by VAT (30%), Corporation Tax (13%), Excise duties and indirect taxes (10%), and other direct taxes (2%)67. In the 2012 Budget the UK Government announced additional measures to close tax loopholes and bring around £1bn of extra revenue and protect around £10bn over the next five years. It is also planning to introduce a General Anti-Abuse Rule which is aimed at deterring and tackling artificial and abusive tax avoidance schemes68. It has estimated that globally over $21tr has been invested in offshore tax havens. The UK will prioritise the issue of offshoring profits in its G8 Presidency in 201369.
67 HMRC, ‘Measuring tax gaps 2012: tax gap estimates for 2010-11’, 2012 68 HMRC, ‘Issue Briefing: tackling tax avoidance’, 2012 69 Osborne, G, ‘Autumn Statement 2012 to the House of Commons by the Rt Hon George Osborne, MP, Chancellor of the Executive’, 2012
SCDI Future Scotland | Macroeconomic and Fiscal Sustainability | April 2013 24
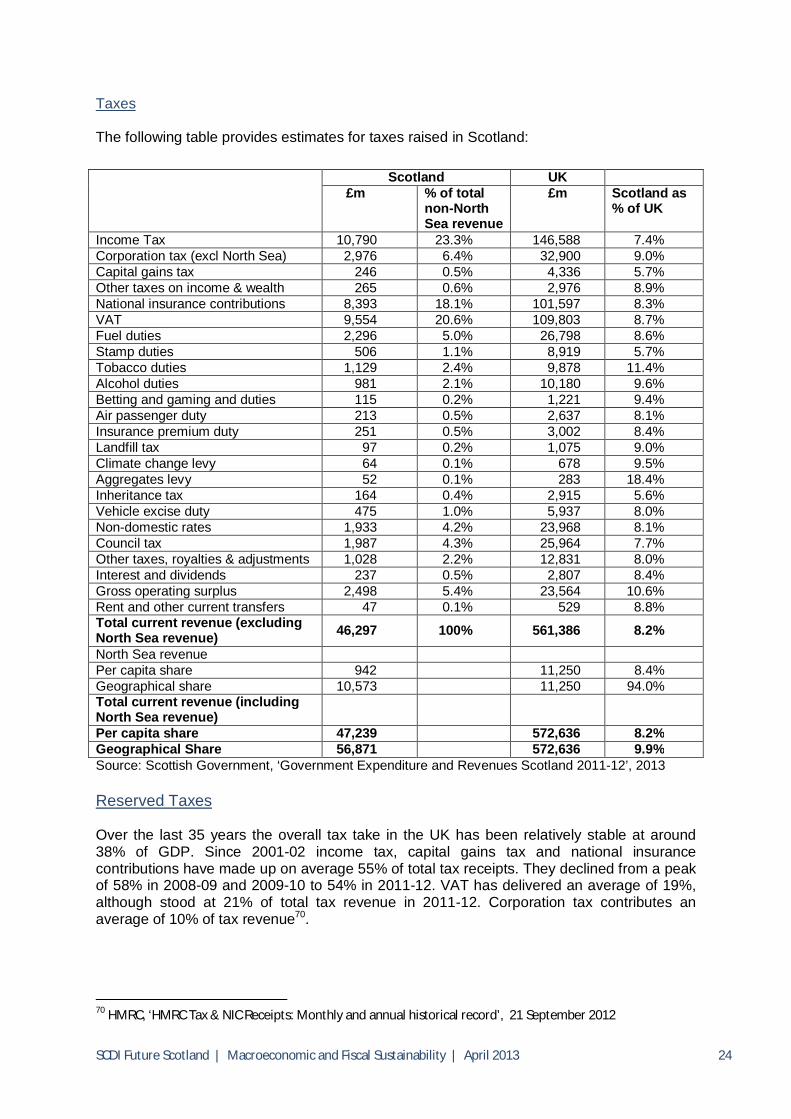
Taxes The following table provides estimates for taxes raised in Scotland: Scotland UK
£m % of total non-North Sea revenue
£m Scotland as % of UK
Income Tax 10,790 23.3% 146,588 7.4% Corporation tax (excl North Sea) 2,976 6.4% 32,900 9.0% Capital gains tax 246 0.5% 4,336 5.7% Other taxes on income & wealth 265 0.6% 2,976 8.9% National insurance contributions 8,393 18.1% 101,597 8.3% VAT 9,554 20.6% 109,803 8.7% Fuel duties 2,296 5.0% 26,798 8.6% Stamp duties 506 1.1% 8,919 5.7% Tobacco duties 1,129 2.4% 9,878 11.4% Alcohol duties 981 2.1% 10,180 9.6% Betting and gaming and duties 115 0.2% 1,221 9.4% Air passenger duty 213 0.5% 2,637 8.1% Insurance premium duty 251 0.5% 3,002 8.4% Landfill tax 97 0.2% 1,075 9.0% Climate change levy 64 0.1% 678 9.5% Aggregates levy 52 0.1% 283 18.4% Inheritance tax 164 0.4% 2,915 5.6% Vehicle excise duty 475 1.0% 5,937 8.0% Non-domestic rates 1,933 4.2% 23,968 8.1% Council tax 1,987 4.3% 25,964 7.7% Other taxes, royalties & adjustments 1,028 2.2% 12,831 8.0% Interest and dividends 237 0.5% 2,807 8.4% Gross operating surplus 2,498 5.4% 23,564 10.6% Rent and other current transfers 47 0.1% 529 8.8% Total current revenue (excluding North Sea revenue) 46,297 100% 561,386 8.2%
North Sea revenue Per capita share 942 11,250 8.4% Geographical share 10,573 11,250 94.0% Total current revenue (including North Sea revenue)
Per capita share 47,239 572,636 8.2% Geographical Share 56,871 572,636 9.9% Source: Scottish Government, ‘Government Expenditure and Revenues Scotland 2011-12’, 2013 Reserved Taxes Over the last 35 years the overall tax take in the UK has been relatively stable at around 38% of GDP. Since 2001-02 income tax, capital gains tax and national insurance contributions have made up on average 55% of total tax receipts. They declined from a peak of 58% in 2008-09 and 2009-10 to 54% in 2011-12. VAT has delivered an average of 19%, although stood at 21% of total tax revenue in 2011-12. Corporation tax contributes an average of 10% of tax revenue70.
70 HMRC, ‘HMRC Tax & NIC Receipts: Monthly and annual historical record’, 21 September 2012
SCDI Future Scotland | Macroeconomic and Fiscal Sustainability | April 2013 25
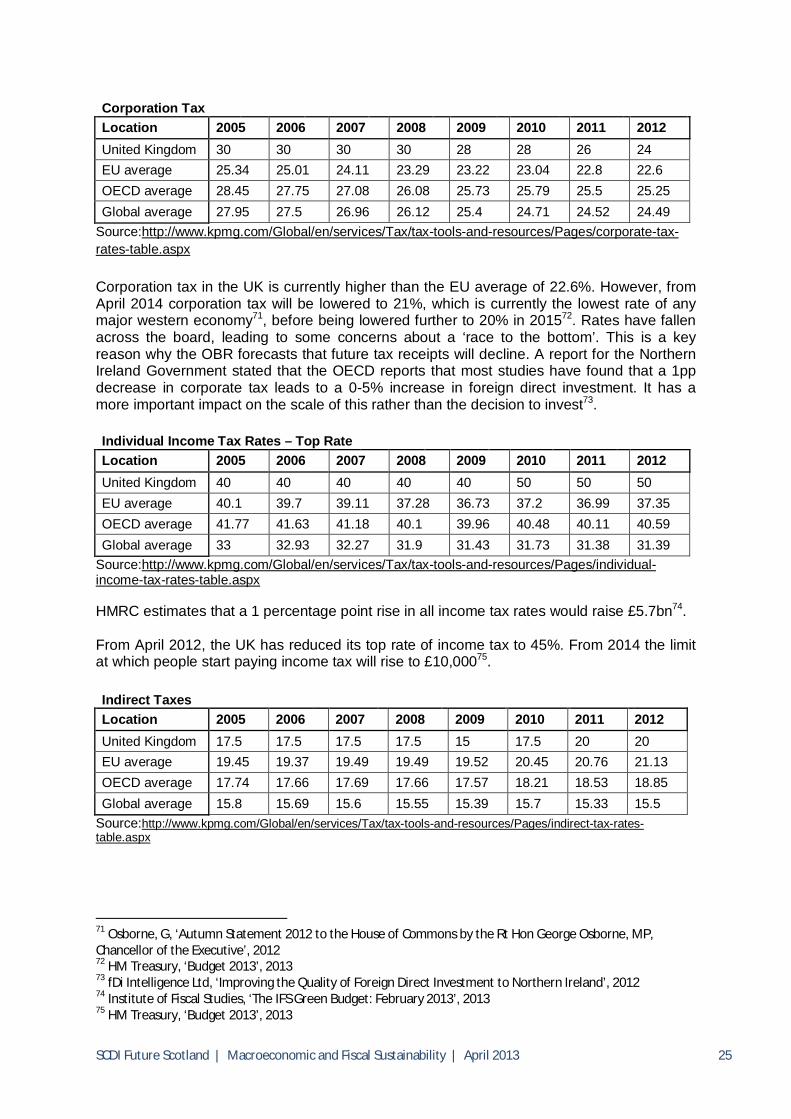
Corporation Tax Location 2005 2006 2007 2008 2009 2010 2011 2012 United Kingdom 30 30 30 30 28 28 26 24 EU average 25.34 25.01 24.11 23.29 23.22 23.04 22.8 22.6 OECD average 28.45 27.75 27.08 26.08 25.73 25.79 25.5 25.25 Global average 27.95 27.5 26.96 26.12 25.4 24.71 24.52 24.49
Source:http://www.kpmg.com/Global/en/services/Tax/tax-tools-and-resources/Pages/corporate-tax-rates-table.aspx Corporation tax in the UK is currently higher than the EU average of 22.6%. However, from April 2014 corporation tax will be lowered to 21%, which is currently the lowest rate of any major western economy71, before being lowered further to 20% in 201572. Rates have fallen across the board, leading to some concerns about a ‘race to the bottom’. This is a key reason why the OBR forecasts that future tax receipts will decline. A report for the Northern Ireland Government stated that the OECD reports that most studies have found that a 1pp decrease in corporate tax leads to a 0-5% increase in foreign direct investment. It has a more important impact on the scale of this rather than the decision to invest73. Individual Income Tax Rates – Top Rate Location 2005 2006 2007 2008 2009 2010 2011 2012 United Kingdom 40 40 40 40 40 50 50 50 EU average 40.1 39.7 39.11 37.28 36.73 37.2 36.99 37.35 OECD average 41.77 41.63 41.18 40.1 39.96 40.48 40.11 40.59 Global average 33 32.93 32.27 31.9 31.43 31.73 31.38 31.39
Source:http://www.kpmg.com/Global/en/services/Tax/tax-tools-and-resources/Pages/individual-income-tax-rates-table.aspx HMRC estimates that a 1 percentage point rise in all income tax rates would raise £5.7bn74. From April 2012, the UK has reduced its top rate of income tax to 45%. From 2014 the limit at which people start paying income tax will rise to £10,00075. Indirect Taxes Location 2005 2006 2007 2008 2009 2010 2011 2012 United Kingdom 17.5 17.5 17.5 17.5 15 17.5 20 20 EU average 19.45 19.37 19.49 19.49 19.52 20.45 20.76 21.13 OECD average 17.74 17.66 17.69 17.66 17.57 18.21 18.53 18.85 Global average 15.8 15.69 15.6 15.55 15.39 15.7 15.33 15.5
Source:http://www.kpmg.com/Global/en/services/Tax/tax-tools-and-resources/Pages/indirect-tax-rates-table.aspx
71 Osborne, G, ‘Autumn Statement 2012 to the House of Commons by the Rt Hon George Osborne, MP, Chancellor of the Executive’, 2012 72 HM Treasury, ‘Budget 2013’, 2013 73 fDi Intelligence Ltd, ‘Improving the Quality of Foreign Direct Investment to Northern Ireland’, 2012 74 Institute of Fiscal Studies, ‘The IFS Green Budget: February 2013’, 2013 75 HM Treasury, ‘Budget 2013’, 2013
SCDI Future Scotland | Macroeconomic and Fiscal Sustainability | April 2013 26
Institute of Fiscal Studies ‘Mirrlees Review’ of UK Tax System (2012) The Institute of Fiscal Studies’ Mirrlees Review brought together, under Professor Sir James Mirlees, a group of international experts, to identify the characteristics of a good tax system for any open developed economy in the 21st century, to assess the extent to which the UK tax system conforms to these ideals, and to recommend how it might realistically be reformed in that direction. Its main recommendations were:
1. Abolish stamp duty and base council tax on up to date values. 2. Simplify the benefit system and increase incentives to work. 3. Improve work incentives for those around the pension age – To increase total
employment by over 200,000 and total earnings by nearly £3bn. 4. Integrate income tax and National Insurance. 5. Impose equivalent to VAT on financial services. Extend VAT. 6. Extend Emissions Trading Scheme and consistently tax emission sources. 7. Work toward a comprehensive system of congestion charging, replacing most of fuel
duty - Protect £38bn of national income from fuel duty as fuel efficiency increases and electric cars become more common and reduce revenues, while more effectively addressing the economic, social and environmental costs of carbon emissions, congestion, noise, accidents.
8. Radically overhaul taxation of savings to improve incentives to savings. 9. Increase attractiveness of equity finance in the corporate tax system - Increase
national income by as much as 1.4% or more than £20bn. The Scottish Government’s Fiscal Commission has agreed that the Review would provide “a helpful starting point” for its consideration of the principles for the design of an effective tax system for an independent Scotland76. Reserved Taxes Clearly, many other proposals are advocated to reduce or increase specific taxes or to create or abolish taxes. A financial transactions tax of 0.1% on bonds and shares and 0.01% on derivatives is to be introduced by 11 EU member states, excluding the UK77. Its claimed benefits include raising €30-35bn per year while at the same time discouraging speculative trading and reducing volatility. Its claimed disbenefits include increasing cost of capital, therefore, reducing the flow of profitable projects, decrease levels of real production, expansion, capital investment and employment78. The so-called Mansion and Bankers’ Bonuses taxes are prominent politically. The Scotch whisky industry is among those to propose equalising excise duty across all alcoholic drinks. It is calculated that this would increase revenue by around £1bn79. Devolved Taxes The Scottish Parliament’s tax revenues-raising powers are relatively limited. It presently has responsibility for two main taxes, council tax and non-domestic rates, as well as the ability, as yet unexercised, to vary the rate of income tax by 3p in the pound. From 2015, the UK rate will be reduced by 10 percentage points for taxpayers in Scotland and the Scottish Parliament will have to determine a Scottish Rate of Income Tax through its own budget. A basket of smaller taxes will also be devolved at the same time. 76 Barnes, E., ‘Scottish Independence: SNP’s Radical Tax Plan’, Scotland on Sunday, 31 March 2013 77 Šemeta, A., ‘The Robin Hood tax takes a step closer’, The Guardian, 21 February 2013 78 Pomeranets, A., ‘Financial Transaction Taxes: International Experiences, Issues and Feasibility’, Bank of Canada Review, Autumn 2012 79 Scotch Whisky Association, ‘Budget Submission 2011’, 2011
SCDI Future Scotland | Macroeconomic and Fiscal Sustainability | April 2013 27
The council tax has been frozen in Scotland since 2007. This has resulted in an income shortfall of around £490m80. Council tax bands are based on the estimated market value of each house on 1 April 1991, and no revaluation exercises have taken place since. This means current tax bills do not account for subsequent price changes. Council tax is a regressive tax. Properties are more heavily concentrated in the tax bands, and the charges rise more slowly than values, meaning that the more a house is worth the less as a proportion of the value is paid as council tax81. Non-domestic rates are projected to generate £2.66bn in 2014-15, with growth of 7.2% and 9.4% over two years. Revenues would have risen by 38% between 2007-08 and 2014-15. This is primarily based on assumptions of higher economic growth generating higher receipts. There has been no economic modelling of the impact of these increases in revenues on businesses. The Scottish poundage rate will be matched with England’s at least until 2014-15. The Scottish Government provides reliefs valued on average at more than £500m, notably the Small Business Bonus. There has been no economic modelling of the impact of these on economic growth82.
80 Black, R.W., ‘Unlocking the Potential in Scotland’s Public Services; From Good to Great by 2020’, The David Hume Institute, N.96, 2012 81 Institute of Fiscal Studies, ‘The IFS Green Budget: February 2013’, 2013 82 STUC, ‘The economic and employment benefits of the Small Business Bonus Scheme’, 2012
SCDI Future Scotland | Macroeconomic and Fiscal Sustainability | April 2013 28
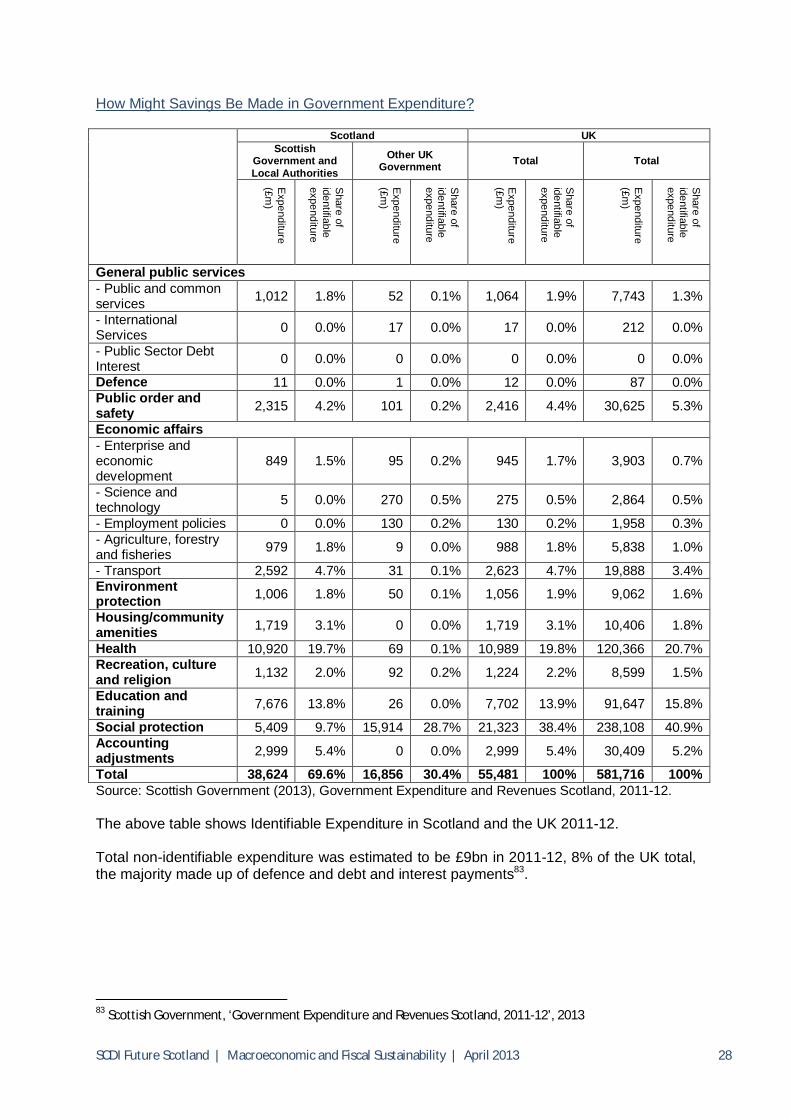
How Might Savings Be Made in Government Expenditure? Scotland UK
Scottish Government and Local Authorities
Other UK Government Total Total
Expenditure
(£m)
Share of
identifiable expenditure
Expenditure
(£m)
Share of
identifiable expenditure
Expenditure
(£m)
Share of
identifiable expenditure
Expenditure
(£m)
Share of
identifiable expenditure
General public services - Public and common services 1,012 1.8% 52 0.1% 1,064 1.9% 7,743 1.3%
- International Services 0 0.0% 17 0.0% 17 0.0% 212 0.0%
- Public Sector Debt Interest 0 0.0% 0 0.0% 0 0.0% 0 0.0%
Defence 11 0.0% 1 0.0% 12 0.0% 87 0.0% Public order and safety 2,315 4.2% 101 0.2% 2,416 4.4% 30,625 5.3%
Economic affairs - Enterprise and economic development
849 1.5% 95 0.2% 945 1.7% 3,903 0.7%
- Science and technology 5 0.0% 270 0.5% 275 0.5% 2,864 0.5%
- Employment policies 0 0.0% 130 0.2% 130 0.2% 1,958 0.3% - Agriculture, forestry and fisheries 979 1.8% 9 0.0% 988 1.8% 5,838 1.0%
- Transport 2,592 4.7% 31 0.1% 2,623 4.7% 19,888 3.4% Environment protection 1,006 1.8% 50 0.1% 1,056 1.9% 9,062 1.6%
Housing/community amenities 1,719 3.1% 0 0.0% 1,719 3.1% 10,406 1.8%
Health 10,920 19.7% 69 0.1% 10,989 19.8% 120,366 20.7% Recreation, culture and religion 1,132 2.0% 92 0.2% 1,224 2.2% 8,599 1.5%
Education and training 7,676 13.8% 26 0.0% 7,702 13.9% 91,647 15.8%
Social protection 5,409 9.7% 15,914 28.7% 21,323 38.4% 238,108 40.9% Accounting adjustments 2,999 5.4% 0 0.0% 2,999 5.4% 30,409 5.2%
Total 38,624 69.6% 16,856 30.4% 55,481 100% 581,716 100% Source: Scottish Government (2013), Government Expenditure and Revenues Scotland, 2011-12. The above table shows Identifiable Expenditure in Scotland and the UK 2011-12. Total non-identifiable expenditure was estimated to be £9bn in 2011-12, 8% of the UK total, the majority made up of defence and debt and interest payments83.
83 Scottish Government, ‘Government Expenditure and Revenues Scotland, 2011-12’, 2013
SCDI Future Scotland | Macroeconomic and Fiscal Sustainability | April 2013 29
In 2011-12 total public expenditure for Scotland was £64.5bn. Scotland accounted for 9.3% of total UK public spending in 2011-12, (slightly) higher than its share of the UK population (8.4%). Total expenditure per capita for Scotland is estimated to have been £12,134 in 2011-12, £1,197 higher than the UK average84. In 2010-11 spending is estimated to be higher in all categories with the exception of defence:
Enterprise and economic development (£157 per person versus £80) Agriculture, fisheries and forestry (£184 versus £84) Transport (£521 versus £345) Housing and community amenities (£340 versus £206) Recreation, culture and religion (£201 versus £209) Social protection (£4,030 versus £3,727)85
It should be noted that Scotland’s different geography and demography, and economic and social needs, may require additional spending in some categories. In addition the scope and remit of the public sector in Scotland differs from the rest of the UK, for example water and sewerage is a public sector responsibility in Scotland86. The Scottish Government’s Public Sector Debt Interest expenditure has increased from £2.67bn in 2007-08 to £4.07bn in 2011-12, a rise of 53%. This is expected to rise to £5.2bn in 2016-17 according to Scottish Government figures, or £6bn according to the OBR87. In the 10 years following devolution, the budget of the Scottish Parliament rose by an average of 5.5% per annum in real terms. This growth ended after the financial crisis and recession. The Scottish Government’s Chief Economic Advisor has advised it may take until 2025-26 for the Scottish Government’s total budget to return to its 2009-10 levels in real terms. The cumulative loss could be £51bn over this period88. In the Budget 2013 the UK Government announced budget cuts of 1% per year for the next two years. Exceptions include the NHS and schools budget, which will remain protected. In addition, a cut to the Scottish budget of 0.2% was announced. The UK Government states that this cut to the resource budget is offset by a £279m increase in capital funding. The Scottish Government has stated that this is replacing ‘hard cash’ with ‘loan facilities’89. The Scottish Government has a target that all public sector bodies will deliver a 3% efficiency target per annum. It is no longer providing an overview. Each public body is to report. It stated it delivered a 3.2% efficiency increase (£64.2m) last year. However, continuing to make such efficiency savings should become progressively more difficult, and it has been suggested that efficiency savings alone will not be enough to fill the immediate gap between Scottish revenue and expenditure90. Although a large amount of data is collected by Scotland’s public sector, it is often not adequate for analysing and comparing performance and productivity91. It has been argued
84 Ibid 85 Johnson, P. and Phillips, D., ‘Scottish independence: the fiscal context’, Institute for Fiscal Studies, 2012 86 Scottish Government, ‘Government Expenditure and Revenues Scotland, 2011-12’, 2013 87 Jamieson, B., ‘Scotland, debt and the moment of truth’, Scotland on Sunday, 10 March 2013 88 Scottish Government, ‘State of the Economy – March 2012’, 2012 89 Black, A., ‘Budget 2013: SNP accuses UK Government of ‘deceit’ over Budget claims’, BBC News, 20 March 2013 90 Beveridge, C.W. ,McIntosh, N. and Wilson, R. ‘Independent Budget Review: The Report of Scotland’s Independent Budget Review Panel’, 2010
SCDI Future Scotland | Macroeconomic and Fiscal Sustainability | April 2013 30
that since the end of 2008 public service output at the UK level has increased 6.5% whereas it has remained constant in Scotland, suggesting a less productive public sector92. This conclusion is contested by the Scottish Government. It has been estimated that as much as 40% of public service spending is directed towards interventions which could have been avoided by prioritising a preventative approach93. Following the work of the Christie Commission, the Scottish Government announced a “decisive shift” to preventative spending with £500m extra to be spent over the Spending Review, focussed on supporting adult social care, early years and tackling re-offending94. The Scottish Government appointed an Independent Budget Review Panel in 2010 to advise on the then forthcoming Spending Review. The Panel emphasised the need for a carefully balanced approach to the options for increasing revenue and for reducing public expenditure (including reconsideration of ring-fencing departments), not least to avoid damaging economic recovery. Among its recommendations were95: Theme Conclusion Public Sector Efficiencies Focus should now be shifted away from recycling efficiency
savings, towards treating such savings as a contribution towards reducing the impending gap in funding. Achieving further efficiencies is likely to require further streamlining and simplification, progressive development of shared services, more outsourcing of services, improvement of procurement practice, and better management of absence. May, in some instances, require radical redesign in the way that services are provided to the public.
Shared Services Urgent examination of additional options will also be necessary. There remain major opportunities to build on existing good practice to develop shared services further and to improve joint working across the public sector.
Public Sector Employment Pay and recruitment freezes have a critical role to play in constraining growth in the pay bill, but they are insufficient on their own. It was estimated that public sector employment would need to fall by approximately 5.7% to 10% by 2014-15.
Universal Services Look again at eligibility, as well as the selective introduction of means testing and user charging. Focus on those with greatest need.
Capital Investment Explore all possible routes to resource and manage the capital investment programme. Significant task in prioritising and maximising the benefits.
Asset Management Urgently review the status of Scottish Water with a view to realising the substantial financial benefits which could arise from a change.
Analysis by PricewaterhouseCoopers in 2010 found that the UK raises a similar amount of revenue from tax when compared to a range of other OECD countries, but (in common with other European countries) a comparatively small percentage of total revenue from non tax sources (i.e. user charging). At that time, had the UK generated comparable levels of non
91 Black, R.W., ‘Unlocking the Potential in Scotland’s Public Services; From Good to Great by 2020’, The David Hume Institute, N.96, 2012 92 Ibid 93 Public Services Commission, ‘Commission on the Future Delivery of Public Services’, 2011 94 Scottish Government, ‘Scottish Spending Review 2011 and Draft Budget 2012-13’, 2011 95 Beveridge, C.W. ,McIntosh, N. and Wilson, R. ‘Independent Budget Review: The Report of Scotland’s Independent Budget Review Panel’, 2010
SCDI Future Scotland | Macroeconomic and Fiscal Sustainability | April 2013 31
tax revenues to Australia or Canada, an extra 1.9% of GDP could potentially have been raised by government, illustratively filling half the then fiscal gap96. Universal benefits (free personal and nursing care, free prescriptions, free eye tests and the national concessionary travel scheme) cost approximately £870m per annum in 2010/1197. For example, the costs of Free Personal and Nursing Care are rising at 15% per year98. National Concessionary Travel costs have been capped at £192m. If they are not capped in the future, Audit Scotland said that they could reach £216-537m by 202599. The Scottish Government has defended the provision of universal benefits on principle, but also on the basis that they represent practical preventative spending which will save public money in the long term100. Professor David Bell’s summary of the benefits of universal services and means testing can be found at Annex C101. The Constitutional Debate This is the fiscal context for the debate on Scotland’s constitutional future. All sides of the debate need to explain what impact, if any, constitutional options will have on the size of the fiscal challenge facing Scotland and on its ability, within or outwith the UK, to address it along with other economic, social and environmental challenges. Scotland’s Fiscal Position The size and shape of the UK’s fiscal challenge have already been considered. Turning to Scotland, the GERS publication provides analysis of Scotland’s fiscal position. It is important to note that its basis is the status quo i.e. Scotland within the UK. It cannot be assumed that everything else would be equal if Scotland became independent. With very different internal and external dynamics, its revenue, expenditure and borrowing would increasingly diverge from those in the status quo. GERS estimated that, in 2011-12, there was a deficit of £14bn in Scotland (11.2% of GDP) excluding North Sea revenue, or a deficit of £3.4bn (2.3% of GDP) including an illustrative geographical share of North Sea revenue102. The IFS has found that in, recent years, excluding oil and gas revenues, or assigning them on a population basis, results in a larger gap between revenues and expenditure in Scotland than in the UK as a whole, but assigning oil and gas revenues geographically results in a similar if not smaller spending gap in Scotland103. The Centre for Public Policy for Region’s (CPPR) forecasts of Scotland’s fiscal balance have predicted that by the year 2016-17 (when excluding North Sea revenues) Scotland would have a deficit of £9.7bn (6.2% of GDP). When North Sea revenue is taken into account, Scotland’s deficit closes to £4.9bn (2.6% of GDP)104.
96 PricewaterhouseCoopers, ‘Time to choose: Decision-making in an age of fiscal austerity’, 2010 97 Audit Scotland, ‘Scotland’s public finances: Addressing the challenges’, 2011 98 Black, R.W., ‘Unlocking the Potential in Scotland’s Public Services; From Good to Great by 2020’, The David Hume Institute, N.96, 2012 99 Audit Scotland, ‘National concessionary travel’, 2010 100 Swinney, J., ‘Free care and tuition will pay off’, The Scotsman, 8 October 2012 101 Bell, D., ‘Meeting the Challenge of Budget Cuts in Scotland: Can Universalism Survive’, Paper for the Scottish Parliament Finance Committee, 2010 102 Scottish Government, ‘Government Expenditure and Revenues Scotland, 2011-12’, 2013 103 Johnson, P. and Phillips, D., ‘Scottish independence: the fiscal context’, Institute for Fiscal Studies, 2012 104 CPPR, ‘Budget 2012: Update of CPPR’s reflection’s on Scotland’s past and future fiscal position', 2012
SCDI Future Scotland | Macroeconomic and Fiscal Sustainability | April 2013 32
Under current constitutional arrangements, 90% of the Scottish Budget is determined by a block grant from the UK Government. Changes to this grant are defined by the Barnett Formula. The Scottish Parliament does not have its own borrowing powers. The advantages of the current system include its simplicity, stability and the absence of ring-fencing. Risks are shared across a larger country so that public services are of a similar standard regardless of what can currently be afforded by local taxation105. However, there is a weak link between expenditure in Scotland and revenue-raising which, arguably, reduces accountability, efficiency and the incentives on the Scottish Parliament to seek to improve the Scottish economy on a ‘systematic basis’106. The Barnett formula is administered by HM Treasury, and its power to define what is and is not included can make it difficult for the Scottish Government to engage in long-term fiscal planning107. It receives no additional assistance from the UK Government for its own exceptional infrastructure projects108. Nor does the Barnett Formula take into account the relative needs of the nations and regions of the UK. Public spending per head in Scotland is well above the average for England and slightly above Wales. It has been suggested that the gap between funding for Scotland on a needs basis and a Barnett basis would be £4.5bn109 and that if the distributional formula for health and education around English regions was applied to Scotland, it would receive 15% less funding110. On the other hand, if the UK deficit is removed from GDP calculations, and the share of North Sea revenue an independent Scotland would expect to receive is included, Scotland receives as much public money as it contributes through taxes111. The Scottish Government states that, at 44.1%, public spending as a share of Scotland’s GDP, when oil and gas output is included, is marginally lower than for the UK as a whole, at 46.5%112. Scotland does have large inequalities and lower life expectancy. It is, therefore, not unreasonable that per capita spending on social protection should be 8% above the UK average and per capita spending on health should be 7% above the average113. Division of Assets and Liabilities To assess the size of the fiscal challenge which an independent Scotland would face, we need to consider the share of assets and liabilities which it would inherit. International Rules There are no international rules or uniform practices on the division of assets and liabilities. Article 40 of the 1983 Vienna Convention on Succession of States in Respect of State Property, Archives and debts presumes that the seceding state should assume an “equitable proportion” of the general debt, also taking into account the assets transferred to that state.
105 McCrone, G., ‘The Scope for Economic Policy After Independence’, 2012 106 Scottish Council of Economic Advisors, ‘Third Annual Report’, 2010 107 Bell, D., ‘Fiscal Sustainability: Issues for the Finance Committee Work Programme 2012’, 2012 108 Ibid 109 Economic Affairs Committee, ‘The economic implications for the United Kingdom of Scottish Independence’, House of Lords, Evidence Session No.1, Questions 1-55, 2012 110 Economic Affairs Committee, ‘The economic implications for the United Kingdom of Scottish Independence’, House of Lords, Evidence Session No.7, Questions 331-367, 2012 111 McWilliams, D., ‘One pound in five earned in London subsidises the rest of the UK’, Centre for Economics and Business Research: Forecasting Eye, 2012 112 Scottish Government, ‘Government Expenditure & Revenue Scotland 2010-2011’, 2012 113 Economic Affairs Committee, ‘The economic implications for the United Kingdom of Scottish Independence: Oral and Written Evidence’, House of Lords, p.21-30, 2012
SCDI Future Scotland | Macroeconomic and Fiscal Sustainability | April 2013 33
The UK has not signed the Convention and it has not yet entered into force, but in some respect it reflects international practice. The Convention does not explain how such an equitable division is to be determined114. The Role of External Creditors – Paper by Dane Rowlands Even informal and partial “repudiation” of debt is rarely countenanced by lenders, and always has painful economic consequences. External creditors have formidable sanctions and can block a voluntarily negotiated settlement if it were not to be in their interests. From the creditors’ perspective, the optimal division of a country’s debt is one that maximises the expected debt-related payments. In deciding what that optimal division will be, creditors will consider both the capacity of each state to make payments, as well as their own ability to enforce the debt contract. There are certain characteristics of a division rule that creditors would prefer, which enhance the ability of a state to pay, as well as the ability of creditors to extract repayment115:
The debt division rule must be forward looking in its evaluation of a debtor’s capacity to repay. What is needed is an estimate of relative GDPs after independence (this may need to take into account any territorial changes.)
The state of each government’s fiscal situation will also affect the ability of each jurisdiction to finance its public debt.
Perceived fairness ensures credibility in terms of public support and the ability of a state to generate revenue from its residents. The public may favour population or GDP etc.
Sovereign debt literature rarely considers the question of assets because those of interest to creditors are those that contribute to a country’s GDP. They are typically location-specific assets such as infrastructure, which presumably are retained116. The potential risk to the two successor economies implies that creditors may be reluctant to agree to a straightforward division rule. If either economy were to “collapse” relative to the other one, then creditors may not wish to be left in a position of having to write off one country’s debts when the other country may be in a position to service them. As a result, creditors may seek to have a debt-division rule that is flexible ex post. The larger/ less risky (re. credit rating) successor state might retain legal liability for the debt. In this scenario, the debts might remain UK debts, but Scotland would take responsibility for their share of servicing and retiring them117. Negotiations Both governments need to regain access to international (and domestic investors). In bargaining, the division rule will reflect the relative penalties endured by each party. The granting of diplomatic recognition and membership of international organisations and treaties to successor states creates an opportunity for foreign governments to penalise countries should they prove reluctant to take on what they consider appropriate international debt obligations or create difficulties for foreign investors118. 114 Tsagourias, N., ‘Sharing the debt burden’, The Scotsman, 7 June 2012 115 Rowlands, D., ‘International Aspects of the Division of Debt Under Secession: The Case of Quebec and Canada’, Canadian Public Policy, Vol:XXIII(1), 1997 116 Ibid 117 Ibid 118 Ibid
SCDI Future Scotland | Macroeconomic and Fiscal Sustainability | April 2013 34
This may suggest that the rest of the UK would have a stronger negotiating position than Scotland. However, it is worth noting that if Scotland and the rest of the UK impose penalties on each other, they would also be damaging the other’s economy and, by implication, their debt-servicing capacity, increasing the share of debt that may be assigned to the side imposing the most effective penalties119. Negotiations on the division of assets and liabilities could take years. Czechoslovakia had 30 treaties and 12,000 legal agreements covering the division of assets and liabilities120, with disputes, such as state pensions, lasting decades121. Debt The proportion of the UK’s debt inherited would have major implications on the amount that an independent Scotland could borrow to cover its existing and any future structural deficit, and to stimulate economic recovery through investment. Three debt-division “rules” have emerged122:
1. Population – Scotland accounts for 8.4% of the UK’s population123. 2. GDP – Scotland accounts for 8.3% of the UK’s GVA124. 3. Historical benefits – net benefits/ fiscal debts over a period e.g. 30 years?
Under the ‘zero-option’, one successor state would take on the entire obligation. Calculating the total size of the UK’s debts is complicated by uncertainty, for example around the future of public sector pension provisions, liabilities from Private Finance Initiative (PFI) contracts (the vast majority of which is off the balance sheet) and the expected, though not certain, costs of nuclear decommissioning. The size of the UK Public Sector Net Debt, which excludes pensions and PFI liabilities, in 2012, and also excluding financial intervention, was stated at £988.7bn or 63% of GDP125.
119 Ibid Economic Affairs Committee, ‘The economic implications for the United Kingdom of Scottish Independence’, House of Lords, Evidence Session No.4, Questions 188-243, 2012 121 Economic Affairs Committee, ‘The economic implications for the United Kingdom of Scottish Independence’, House of Lords, Evidence Session No.2, Questions 56-116, 2012 122 This would exclude international conventions for some assets and liabilities e.g. minerals, social security. 123 Sutton, L., ‘Issues Facing an Independent Scotland – Scotland’s Share of UK Public Debt’, David Hume Institute, Research Paper 1/2012, 2012 124 Ibid 125 Ibid
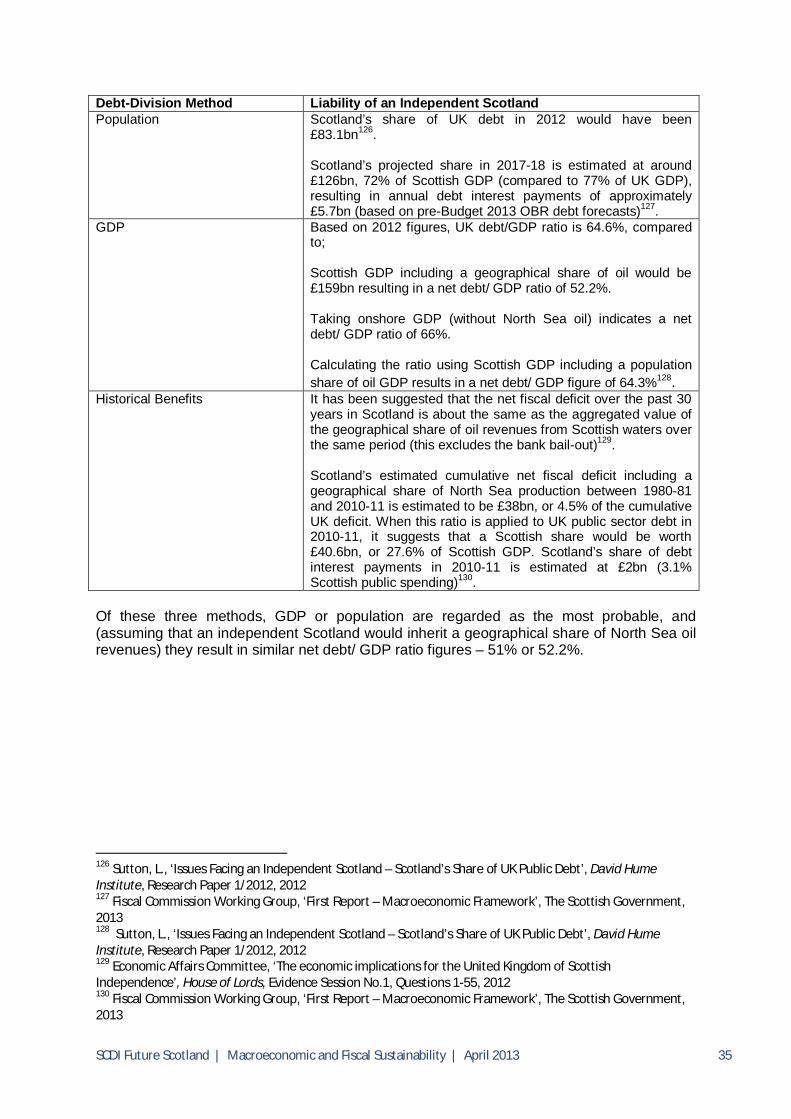
SCDI Future Scotland | Macroeconomic and Fiscal Sustainability | April 2013 35
Debt-Division Method Liability of an Independent Scotland Population Scotland’s share of UK debt in 2012 would have been
£83.1bn126. Scotland’s projected share in 2017-18 is estimated at around £126bn, 72% of Scottish GDP (compared to 77% of UK GDP), resulting in annual debt interest payments of approximately £5.7bn (based on pre-Budget 2013 OBR debt forecasts)127.
GDP Based on 2012 figures, UK debt/GDP ratio is 64.6%, compared to; Scottish GDP including a geographical share of oil would be £159bn resulting in a net debt/ GDP ratio of 52.2%. Taking onshore GDP (without North Sea oil) indicates a net debt/ GDP ratio of 66%. Calculating the ratio using Scottish GDP including a population share of oil GDP results in a net debt/ GDP figure of 64.3%128.
Historical Benefits It has been suggested that the net fiscal deficit over the past 30 years in Scotland is about the same as the aggregated value of the geographical share of oil revenues from Scottish waters over the same period (this excludes the bank bail-out)129. Scotland’s estimated cumulative net fiscal deficit including a geographical share of North Sea production between 1980-81 and 2010-11 is estimated to be £38bn, or 4.5% of the cumulative UK deficit. When this ratio is applied to UK public sector debt in 2010-11, it suggests that a Scottish share would be worth £40.6bn, or 27.6% of Scottish GDP. Scotland’s share of debt interest payments in 2010-11 is estimated at £2bn (3.1% Scottish public spending)130.
Of these three methods, GDP or population are regarded as the most probable, and (assuming that an independent Scotland would inherit a geographical share of North Sea oil revenues) they result in similar net debt/ GDP ratio figures – 51% or 52.2%.
126 Sutton, L., ‘Issues Facing an Independent Scotland – Scotland’s Share of UK Public Debt’, David Hume Institute, Research Paper 1/2012, 2012 127 Fiscal Commission Working Group, ‘First Report – Macroeconomic Framework’, The Scottish Government, 2013 128 Sutton, L., ‘Issues Facing an Independent Scotland – Scotland’s Share of UK Public Debt’, David Hume Institute, Research Paper 1/2012, 2012 129 Economic Affairs Committee, ‘The economic implications for the United Kingdom of Scottish Independence’, House of Lords, Evidence Session No.1, Questions 1-55, 2012 130 Fiscal Commission Working Group, ‘First Report – Macroeconomic Framework’, The Scottish Government, 2013
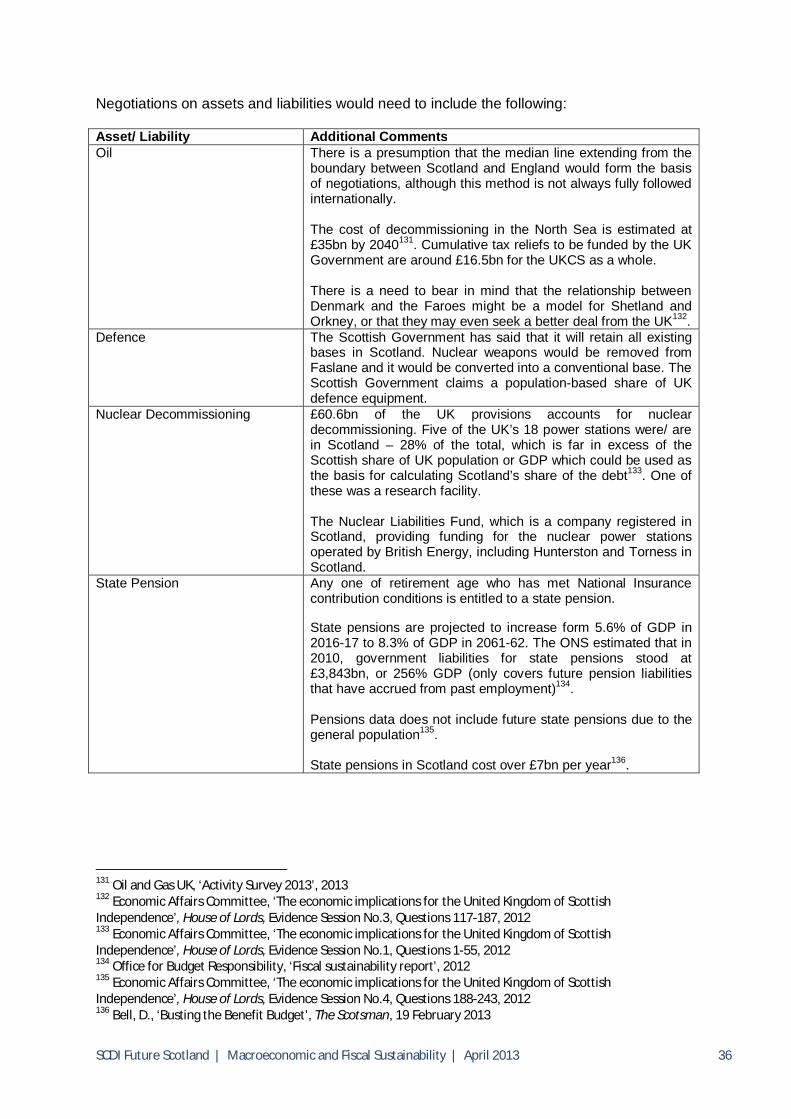
SCDI Future Scotland | Macroeconomic and Fiscal Sustainability | April 2013 36
Negotiations on assets and liabilities would need to include the following: Asset/ Liability Additional Comments Oil There is a presumption that the median line extending from the
boundary between Scotland and England would form the basis of negotiations, although this method is not always fully followed internationally. The cost of decommissioning in the North Sea is estimated at £35bn by 2040131. Cumulative tax reliefs to be funded by the UK Government are around £16.5bn for the UKCS as a whole. There is a need to bear in mind that the relationship between Denmark and the Faroes might be a model for Shetland and Orkney, or that they may even seek a better deal from the UK132.
Defence The Scottish Government has said that it will retain all existing bases in Scotland. Nuclear weapons would be removed from Faslane and it would be converted into a conventional base. The Scottish Government claims a population-based share of UK defence equipment.
Nuclear Decommissioning £60.6bn of the UK provisions accounts for nuclear decommissioning. Five of the UK’s 18 power stations were/ are in Scotland – 28% of the total, which is far in excess of the Scottish share of UK population or GDP which could be used as the basis for calculating Scotland’s share of the debt133. One of these was a research facility. The Nuclear Liabilities Fund, which is a company registered in Scotland, providing funding for the nuclear power stations operated by British Energy, including Hunterston and Torness in Scotland.
State Pension Any one of retirement age who has met National Insurance contribution conditions is entitled to a state pension. State pensions are projected to increase form 5.6% of GDP in 2016-17 to 8.3% of GDP in 2061-62. The ONS estimated that in 2010, government liabilities for state pensions stood at £3,843bn, or 256% GDP (only covers future pension liabilities that have accrued from past employment)134. Pensions data does not include future state pensions due to the general population135. State pensions in Scotland cost over £7bn per year136.
131 Oil and Gas UK, ‘Activity Survey 2013’, 2013 132 Economic Affairs Committee, ‘The economic implications for the United Kingdom of Scottish Independence’, House of Lords, Evidence Session No.3, Questions 117-187, 2012 133 Economic Affairs Committee, ‘The economic implications for the United Kingdom of Scottish Independence’, House of Lords, Evidence Session No.1, Questions 1-55, 2012 134 Office for Budget Responsibility, ‘Fiscal sustainability report’, 2012 135 Economic Affairs Committee, ‘The economic implications for the United Kingdom of Scottish Independence’, House of Lords, Evidence Session No.4, Questions 188-243, 2012 136 Bell, D., ‘Busting the Benefit Budget’, The Scotsman, 19 February 2013
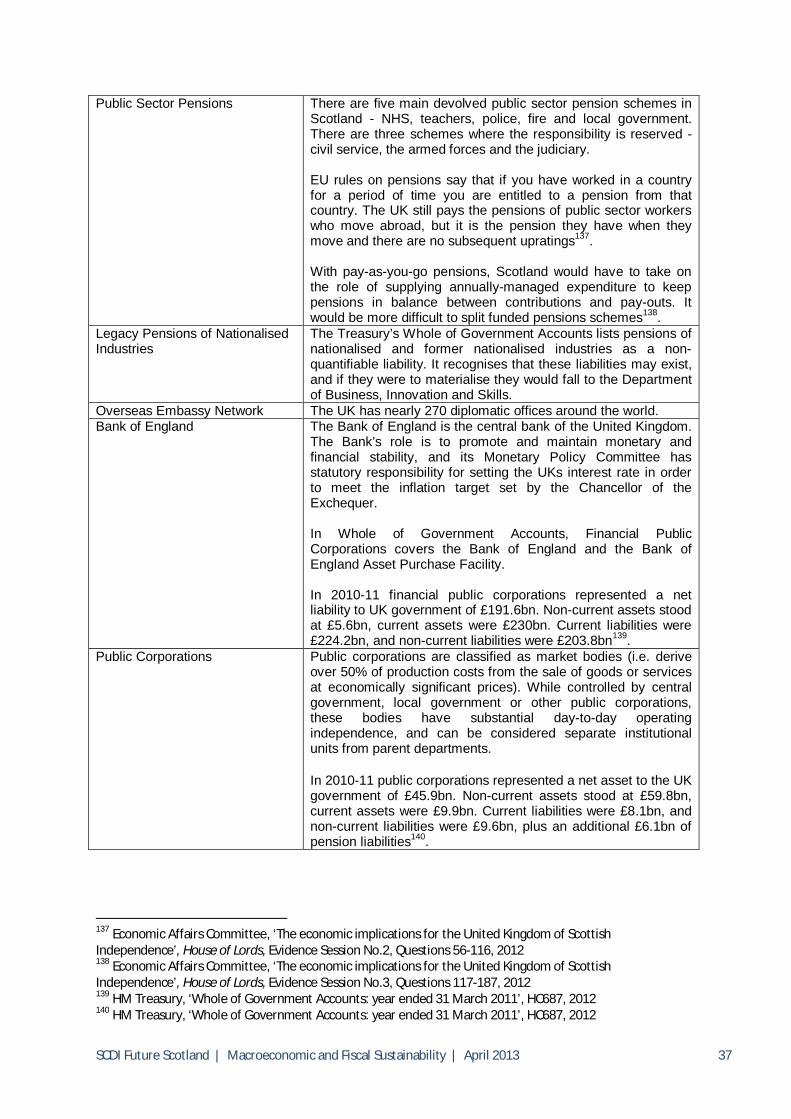
SCDI Future Scotland | Macroeconomic and Fiscal Sustainability | April 2013 37
Public Sector Pensions There are five main devolved public sector pension schemes in Scotland - NHS, teachers, police, fire and local government. There are three schemes where the responsibility is reserved - civil service, the armed forces and the judiciary. EU rules on pensions say that if you have worked in a country for a period of time you are entitled to a pension from that country. The UK still pays the pensions of public sector workers who move abroad, but it is the pension they have when they move and there are no subsequent upratings137. With pay-as-you-go pensions, Scotland would have to take on the role of supplying annually-managed expenditure to keep pensions in balance between contributions and pay-outs. It would be more difficult to split funded pensions schemes138.
Legacy Pensions of Nationalised Industries
The Treasury’s Whole of Government Accounts lists pensions of nationalised and former nationalised industries as a non-quantifiable liability. It recognises that these liabilities may exist, and if they were to materialise they would fall to the Department of Business, Innovation and Skills.
Overseas Embassy Network The UK has nearly 270 diplomatic offices around the world. Bank of England The Bank of England is the central bank of the United Kingdom.
The Bank’s role is to promote and maintain monetary and financial stability, and its Monetary Policy Committee has statutory responsibility for setting the UKs interest rate in order to meet the inflation target set by the Chancellor of the Exchequer. In Whole of Government Accounts, Financial Public Corporations covers the Bank of England and the Bank of England Asset Purchase Facility. In 2010-11 financial public corporations represented a net liability to UK government of £191.6bn. Non-current assets stood at £5.6bn, current assets were £230bn. Current liabilities were £224.2bn, and non-current liabilities were £203.8bn139.
Public Corporations Public corporations are classified as market bodies (i.e. derive over 50% of production costs from the sale of goods or services at economically significant prices). While controlled by central government, local government or other public corporations, these bodies have substantial day-to-day operating independence, and can be considered separate institutional units from parent departments. In 2010-11 public corporations represented a net asset to the UK government of £45.9bn. Non-current assets stood at £59.8bn, current assets were £9.9bn. Current liabilities were £8.1bn, and non-current liabilities were £9.6bn, plus an additional £6.1bn of pension liabilities140.
137 Economic Affairs Committee, ‘The economic implications for the United Kingdom of Scottish Independence’, House of Lords, Evidence Session No.2, Questions 56-116, 2012 138 Economic Affairs Committee, ‘The economic implications for the United Kingdom of Scottish Independence’, House of Lords, Evidence Session No.3, Questions 117-187, 2012 139 HM Treasury, ‘Whole of Government Accounts: year ended 31 March 2011’, HC687, 2012 140 HM Treasury, ‘Whole of Government Accounts: year ended 31 March 2011’, HC687, 2012
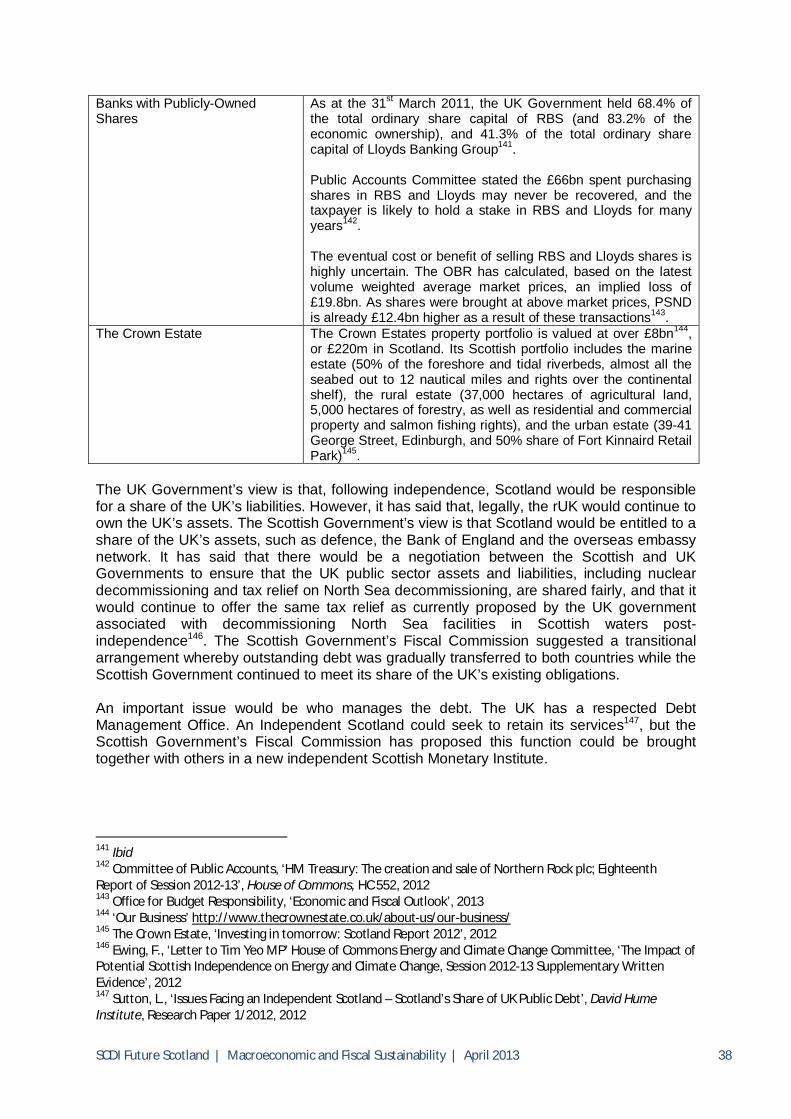
SCDI Future Scotland | Macroeconomic and Fiscal Sustainability | April 2013 38
Banks with Publicly-Owned Shares
As at the 31st March 2011, the UK Government held 68.4% of the total ordinary share capital of RBS (and 83.2% of the economic ownership), and 41.3% of the total ordinary share capital of Lloyds Banking Group141. Public Accounts Committee stated the £66bn spent purchasing shares in RBS and Lloyds may never be recovered, and the taxpayer is likely to hold a stake in RBS and Lloyds for many years142. The eventual cost or benefit of selling RBS and Lloyds shares is highly uncertain. The OBR has calculated, based on the latest volume weighted average market prices, an implied loss of £19.8bn. As shares were brought at above market prices, PSND is already £12.4bn higher as a result of these transactions143.
The Crown Estate The Crown Estates property portfolio is valued at over £8bn144, or £220m in Scotland. Its Scottish portfolio includes the marine estate (50% of the foreshore and tidal riverbeds, almost all the seabed out to 12 nautical miles and rights over the continental shelf), the rural estate (37,000 hectares of agricultural land, 5,000 hectares of forestry, as well as residential and commercial property and salmon fishing rights), and the urban estate (39-41 George Street, Edinburgh, and 50% share of Fort Kinnaird Retail Park)145.
The UK Government’s view is that, following independence, Scotland would be responsible for a share of the UK’s liabilities. However, it has said that, legally, the rUK would continue to own the UK’s assets. The Scottish Government’s view is that Scotland would be entitled to a share of the UK’s assets, such as defence, the Bank of England and the overseas embassy network. It has said that there would be a negotiation between the Scottish and UK Governments to ensure that the UK public sector assets and liabilities, including nuclear decommissioning and tax relief on North Sea decommissioning, are shared fairly, and that it would continue to offer the same tax relief as currently proposed by the UK government associated with decommissioning North Sea facilities in Scottish waters post-independence146. The Scottish Government’s Fiscal Commission suggested a transitional arrangement whereby outstanding debt was gradually transferred to both countries while the Scottish Government continued to meet its share of the UK’s existing obligations. An important issue would be who manages the debt. The UK has a respected Debt Management Office. An Independent Scotland could seek to retain its services147, but the Scottish Government’s Fiscal Commission has proposed this function could be brought together with others in a new independent Scottish Monetary Institute.
141 Ibid 142 Committee of Public Accounts, ‘HM Treasury: The creation and sale of Northern Rock plc; Eighteenth Report of Session 2012-13’, House of Commons, HC 552, 2012 143 Office for Budget Responsibility, ‘Economic and Fiscal Outlook’, 2013 144 ‘Our Business’ http://www.thecrownestate.co.uk/about-us/our-business/ 145 The Crown Estate, ‘Investing in tomorrow: Scotland Report 2012’, 2012 146 Ewing, F., ‘Letter to Tim Yeo MP’ House of Commons Energy and Climate Change Committee, ‘The Impact of Potential Scottish Independence on Energy and Climate Change, Session 2012-13 Supplementary Written Evidence’, 2012 147 Sutton, L., ‘Issues Facing an Independent Scotland – Scotland’s Share of UK Public Debt’, David Hume Institute, Research Paper 1/2012, 2012
SCDI Future Scotland | Macroeconomic and Fiscal Sustainability | April 2013 39
Oil Revenues Projections of oil and gas production revenues and liabilities from decommissioning are central to any debate about the fiscal position of an independent Scotland. There is considerable uncertainty about these as oil and gas is a global commodity market. The volatility of the revenues is a function of (a) oil prices, (b) oil/gas production, (c) new investment and so capital allowances allowed against income for tax purposes. In recent years, there have been wide swings in the price of oil. In mid-2008, prices reached nearly $150 a barrel before collapsing to nearly $35 a barrel in early 2009. This resulted in North Sea revenue falling from £12.9bn in 2008-09 to £6.5bn in 2009-10 (49.8%)148. Looking forward, the US Energy Information Administration forecasts Brent crude oil spot price will fall from $112 a barrel in 2012 to $101 in 2014149 The OBR’s forecast for 2017-18 is $93 compared to DECC’s $120150. How far the rapid growth of unconventional oil and gas production depresses international market prices will be a key – some recent estimates have suggested that they may be 25-40% less than they would otherwise have been in 2035151.
North Sea oil and gas production appears to be more erratic and difficult to predict, with an increasing frequency of unplanned shutdowns. Record capital investment of £13bn152 this year will decrease revenues due to capital allowances. 100% first year allowances for oil and gas firms means that higher investment leads to an immediate decrease in receipts. These uncertainties can be seen in the OBR’s forecasts. In Budget 2011, the OBR estimated tax revenues for 2011-12 at £13.4bn153. In the Budget 2012 they were estimated at £11.2bn154. Between 2012-13 and 2017-18 the OBR has forecast oil and gas revenue to total £33.2bn155, considerably lower that the Scottish Government’s projection of between £41bn and £57bn over the same period156. This makes it difficult to forecast Scotland’s fiscal position. The CPPR has said that the OBR’s 2013 projections suggest that Scotland would have an increasingly larger deficit than rUK, with the gap 2.2% by 2017-18. It also calculates that, under the four scenarios for oil prices and North Sea production suggested by the Scottish Government, one would also result in a larger deficit for Scotland, in two Scotland and rUK would have similarly sized deficits and only the most optimistic would result in a smaller deficit (by 1.2%) for Scotland157. Over the long-term, the uncertainties become even greater. Oil and gas production in Scottish waters is planned to continue for at least another 40 years and the University of Aberdeen has estimated that the wholesale value of the remaining UKCS reserves could be
148 Scottish Government, ‘Government Expenditure and Revenues Scotland, 2011-12’, 2013 149 US Energy Information Administration, ‘Short-term Energy Outlook’, 12 March, 2013 150 Fiscal Commission Working Group, ‘First Report – Macroeconomic Framework’, The Scottish Government, 2013 151 PricewaterhouseCoopers, ‘Shale Oil – The Next Energy Revolution’, 2013 152 Oil & Gas UK, ‘2013 – Activity Survey’, 2013 153 HM Treasury, ‘Budget 2011’, 2011 154 Ibid 155 Office for Budget Responsibility, ‘Economic and Fiscal Outlook’, 2013 156 Scottish Government, ‘Oil and Gas Analytical Bulletin’, March 2013 157 Centre for Public Policy for Regions, ‘Analysis of Scotland’s Past and Future Fiscal Position: Reflections on GERS 2013, the Scottish Government’s Oil and Gas Analytical Bulletin, and the 2013 UK Budget’, March 2013
SCDI Future Scotland | Macroeconomic and Fiscal Sustainability | April 2013 40
up to £1.5tr158. However, oil and gas production is declining and will, generally, continue to do so and, over time, the revenues will also fall. For an independent Scotland, key issues are the volatility and long-term revenues. Estimates which were based on recent figures are that revenues from North Sea oil and gas would be around £7bn of an independent Scotland’s £50bn revenue159. The UK Government’s view is that the volatility of revenues has a bigger impact on a smaller country rather than a bigger country. An independent Scotland would have no insurance from fiscal risk sharing with the UK if oil prices were to fall dramatically. Norway suffered badly from this in 1986 when the oil price collapsed to $10160. The First Minister has said that Scotland has a broad tax base and is not overly reliant on North Sea revenues, and that even when North Sea revenues fell by 50% in 2009-10, Scotland's fiscal position remained stronger than the UK's161. The Scottish Government has also said that Norway has had a consistently higher share of its total taxes revenue derived from oil and gas than Scotland over the last 10 years. For 2010/11, the figures were 15% for Scotland and 26.8% for Norway162. Over the long-term, the OBR projects that oil and gas revenues as a share of UK GDP will fall from 0.1% to 0.05%. Other figures suggest that the revenues will fall to the equivalent of 3% of Scottish GDP. It has been between 5% and 10% over the last 30 years. Other economists believe that revenues can be sustained at 5%163. Maximising the potential of the industry would very obviously be in the interest of both the UK and Scotland, but, perhaps, it would be a higher priority for the Scottish Government. This would involve ensuring that there is no premature decommissioning of infrastructure, but this will depend on confidence in the industry that any Government can afford to fund its future liabilities from decommissioning, which comes back to views on its relative, overall long-term fiscal strength. These issues have important implications for the monetary, fiscal and borrowing policy choices which would face Scotland should it vote “yes” to independence.
158 Energy and Climate Change Committee, ‘The Impact of Potential Scottish Independence on Energy and Climate Change, Session 2012-13 Oral Evidence’, House of Commons, HC 1912-i, 2012 159 Ibid 160 Energy and Climate Change Committee, ‘The Impact of Potential Scottish Independence on Energy and Climate Change – March 2012’, House of Commons, SCO 16, 2012 161 Stafford, J., ‘Making Scotland the Green Energy Capital of Europe – An Interview with Alex Salmond’, Oilprice.com, 8 August, 2012 162 ‘Share of total tax revenue derived from oil and gas: Scotland and Norway’ http://www.snp.org/sites/default/files/news/file/share_of_taxes_from_oil_and_gas_scotland_and_norway.pdf 163 Economic Affairs Committee, ‘The economic implications for the United Kingdom of Scottish Independence’, House of Lords, Evidence Session No.4, Questions 188-243, 2012
SCDI Future Scotland | Macroeconomic and Fiscal Sustainability | April 2013 41
Monetary Policy Options Pound The UK is widely recognised as, at present, an optimal currency area, with very similar economic structures. There is good labour mobility, capital mobility, wage and price flexibility and similar business cycles. Retaining the pound would minimise economic disruption and the cost to the economy of creating the new state164. The Scottish Government’s current position is to support a formal monetary union with the rUK. Its Fiscal Commission Working Group stated that it would be in Scotland’s interests to retain Sterling “immediately” post-independence. The Scottish Government believes that this would also be in rUK’s interests. It points to the impact of oil and gas and whisky exports in reducing the rest of the UK’s trade deficit (oil and gas boosted the UK’s balance of payments by £32bn in 2010, almost halving the UK’s deficit). Its view is that avoiding exchange rate costs for businesses would be in the interests of rUK too because it has about £40bn-worth of trade in Scotland165. Monetary union would preserve the highly-integrated UK financial services network. The Scottish Government’s view is that Scotland has an implicit and historical share of the Bank of England’s asset as a UK institution. The Scottish Government says that the Bank of England (perhaps with a new name) would become the central bank of all of the nations which use sterling. Its Fiscal Commission suggested that shareholder rights should be allocated on a per capita or GDP weighted basis, an independent Scotland would appoint a representative to its Monetary Policy Committee and a Macroeconomic Governance Committee would be established for governmental input166. For example, the US federal open market committee sets US interest rates, and has mandatory representation from its 12 regional affiliates. The Bank of England would be given a mandate to promote growth across the island167. The UK Government’s view is that the UK’s currency arrangements benefit Scotland and that changing them would be risky. It says that the legal position is that rUK would keep the Bank of England and its functions, and objectives would relate to rUK only. It will not pre-negotiate, but it has said that any negotiations would have to cover arrangements on fiscal policy and financial stability. The Scottish Secretary has also stated that, in his view, it would take “an enormous amount of persuasion” for the rUK Government to allow the Bank of England to act as the central bank of an independent Scotland with a place on the Monetary Policy Committee.168 At present, there is no territorial representation on the monetary policy committee. The UK Government states that the Bank of England would set an interest rate for the rUK and an independent Scotland would have less influence than at present. It is expected that the UK Government would only agree to a formal monetary union with an independent Scotland with certain constraints on the Scottish Government’s freedom of 164 Economic Affairs Committee, ‘The economic implications for the United Kingdom of Scottish Independence’, House of Lords, Evidence Session No.1, Questions 1-55, 2012 165 Swinney, J., ‘Scotland’s position in the global economy and vision for capitalising on new opportunities in global markets’, Speech presented at the David Hume Institute, 2 February 2012 166 Fiscal Commission Working Group, ‘First Report – Macroeconomic Framework’, The Scottish Government, 2013 167 Kerevan, G., 'What's in future wallets?', The Scotsman, 17 July 2012 168 Economic Affairs Committee, ‘The economic implications for the United Kingdom of Scottish Independence’, House of Lords, Evidence Session No.20, Questions 901-925, 2012
SCDI Future Scotland | Macroeconomic and Fiscal Sustainability | April 2013 42
action in a number of key areas of economic and financial policy169. While the differences in the economic structure of the UK are far less than the Eurozone’s it would be concerned about the potential for asymmetric shocks to threaten a member of the monetary union, especially if fiscal policies were allowed to diverge170. Euro Seventeen of the twenty-seven Member States of the European Union use the euro, along with a further five European countries. The UK and Denmark negotiated specific opt-outs. All other members of the EU are obliged, in their accession agreements, to adopt the euro. To join the euro, Member States are supposed to meet strict criteria, such as a budget deficit of less than three per cent of their GDP, a debt ratio of less than sixty per cent of GDP, low inflation, and interest rates close to the EU average. Being part of the Exchange Rate Mechanism II (ERM II), in which the Member States’ currency is pegged to the euro, for two years is a required criterion prior to joining the euro. Under the terms of its accession in 1994, Sweden is obliged to join the eurozone when it meets the necessary conditions and it now meets the majority. However, a referendum in 2003 rejected membership of the euro and Sweden has since argued that, because joining ERM II is itself voluntary and it has no plans to do so, Sweden has a de facto opt-out from adopting the euro, until a “Yes” vote in a referendum171. The EU Commission accepts the position. While the criteria for joining the euro were not applied strictly in the past, the eurozone crisis has led to a rethink. It is clear that an independent Scotland would be unlikely to meet the criteria soon, for example in relation to its deficit and debt172, and it would be unlikely that eurozone members would, at least while it is trying to resolve the sovereign debt crisis in a number of eurozone countries, force a country which had not met these criteria to join the euro. The Scottish Government has said that an independent Scotland, like Sweden, would not join the euro until and unless it is in Scotland’s interests to do so and it has satisfied all the criteria for doing so173. The Scottish Government intends to remain in a formal monetary union with rUK and it, therefore, would not join ERM II. The Scottish Government could argue that the UK’s opt-out would continue to apply to an independent Scotland so long as it continues to use sterling174. The UK Government’s view is that an independent Scotland would not automatically inherit the opt-out the UK negotiated from the euro. Scottish Currency – Pegged An independent Scotland could create a separate Scottish currency which would be issued by a Scottish Central Bank and be the sole legal currency in circulation in Scotland175. The Scottish Central Bank would ensure that it had exactly the same value as the rUK pound, effectively importing an independent Scotland’s monetary policy from rUK176. Parity of exchange would have the advantage of supporting intra-UK trade. Banks and businesses requiring Scottish pounds would buy them from the Scottish Central Bank (SCB) in return for sterling. Thus, the total of Scottish pounds in circulation would be backed by a reserve of
169 Quinn, B., ‘Scottish Independence: Issues and Questions’, 2012 170 Economic Affairs Committee, ‘The economic implications for the United Kingdom of Scottish Independence’, House of Lords, Evidence Session No.4, Questions 188-243, 2012 171 Government Offices of Sweden, ‘Sweden’s Convergence programme’, 2012 172 Economic Affairs Committee, ‘The economic implications for the United Kingdom of Scottish Independence’, House of Lords, Evidence Session No.2, Questions 56-116, 2012 173 Scottish Parliament, ‘Official Report, Meeting of the Parliament’, Thursday 13th December 2012 174 Furby, D., ‘Scottish Independence and EU Accession’, Business for New Europe, 175 Kerevan, G., ‘What’s in future wallets?’ The Scotsman, 17 July 2012 176 Economic Affairs Committee, ‘The economic implications for the United Kingdom of Scottish Independence’, House of Lords, Evidence Session No.3, Questions 117-187, 2012
SCDI Future Scotland | Macroeconomic and Fiscal Sustainability | April 2013 43
sterling to an equivalent amount. As reserves accumulated, they could be lent in the sterling money markets to earn interest. The SCB would provide liquidity support to Scottish financial institutions177. There would be significant start-up costs for a Scottish Central Bank. In theory, an independent Scotland using a separate Scottish currency pegged to sterling could do without one. However, its financial institutions could be regarded by the markets as more vulnerable and it may have to pay higher interest rates for sovereign debt. Ireland first issued its own currency, the punt, in the 1930s, at 1:1 parity with the pound, and established its central bank in 1943. UK pounds and punts circulated interchangeably and its monetary policies shadowed the UK’s until the 1970s. The constraints on its economic policies were a factor in decades of slow growth178. Scottish Currency – Unpegged An independent Scotland could create a separate currency with no fixed exchange rate with the pound or which is pegged initially before being allowed to float. A number of small European economies have their own independent currencies. They are able to devalue, boost their money supply and control interest rates in response to conditions. Major problems with setting up an independent currency are the disruption, transition costs and impact on business confidence in the short-term. The uncertainty could create problems for financial institutions and companies in the Scottish economy. Establishing the credibility of the currency in the bond markets would take time. Transaction costs for businesses would, to an extent, impede cross-border trade. If the price of oil soared, the value of a Scottish currency would inflate potentially making other sectors uncompetitive e.g. so-called Dutch disease of the 1960s-70s. To counter this, Norway’s sovereign wealth fund invests its revenues abroad. Financial Stability Financial Regulation The UK has a highly-integrated financial services sector, in which Edinburgh is the largest centre outwith London and Glasgow is also a major centre. Two of the UK’s largest banks, The Royal Bank of Scotland (RBS) and Lloyds Banking Group, both majority-owned by the UK Government, are headquartered in Scotland. RBS currently employs 14,000 people in Scotland out of a total of 100,000 in the UK. NatWest is a wholly owned subsidiary of RBS, with its own licence and balance sheet, and is separately regulated179. Insurers based in Scotland sell 6% of their product to Scottish postcodes and 94% to the rest of the UK while 16% of mortgages sold by Scottish firms were to Scottish postcodes and 84% to the rest of the UK180.
177 Kerevan, G., 'What's in future wallets?', The Scotsman, 17 July 2012 178 Economic Affairs Committee, ‘The economic implications for the United Kingdom of Scottish Independence’, House of Lords, Evidence Session No.3, Questions 117-187, 2012 179 Economic Affairs Committee, ‘The economic implications for the United Kingdom of Scottish Independence’, House of Lords, Evidence Session No.15, Questions 757-793, 2012 180 Economic Affairs Committee, ‘The economic implications for the United Kingdom of Scottish Independence’, House of Lords, Evidence Session No.11, Questions 500-525, 2012
SCDI Future Scotland | Macroeconomic and Fiscal Sustainability | April 2013 44
Following the financial crisis and concerns about the systemic risk which large banks can pose to the public finances and wider economy, regulatory responsibility for the financial services sector in the UK has been transferred back to the Bank of England. Scottish Financial Enterprise (SFE) believes that, implicitly under the EU’s regulatory framework, Scotland would need its own financial regulator (‘competent authority’)181. The Scottish Government’s Fiscal Commission has put forward the view that systemically important banking institutions in the UK should be “supervised on a common and consistent basis”. This could be discharged either by the Bank of England, under an agency agreement with the Scottish Government, or by a Scottish Monetary Institute working in partnership with the Bank. It suggests that such arrangements would also be in the interests of the rUK. A Scottish regulator would, meanwhile, undertake microprudential regulation of financial services companies. The financial stability arrangements should be designed to be capable of evolution. SFE thinks that this is problematic for four main reasons:
1. The EU regulatory framework presupposes that each member state will have a regulator and there is no provision for sharing one between member states and no precedent for doing so.
2. There is no reason to think the European Commission or other member states would allow Scotland to carry on without a regulator of its own, when other member states all have to have one and to bear the costs of doing so.
3. There is no obvious benefit to the rest of the UK in bearing the risks and liabilities of regulating the industry of another member state, so their co-operation cannot be assumed.
4. It seems unlikely that the Parliament in a newly independent Scotland would want to demit a function of government as important as financial regulation to the legislature of another country, or otherwise compromise its freedom to act within the constraints of EU membership, even if that could be done under the EU Treaties182.
The challenges of establishing a separate financial regulator should not be underestimated. It took two years to establish the UK Financial Services Authority and that was an amalgamation of several previously existing agencies. The experience, costs and approach to EU regulations of a Scottish regulator would be considered by financial services groups when deciding where to base themselves183. Lender of Last Resort ‘The lender of last resort’ is not strictly defined. It has been used to apply to lending of money at high rates to deal with short term liquidity needs in otherwise solvent banks. It has also been used to describe bailouts of banks in deeper trouble. The £45bn RBS recapitalisation was about 3% of UK GDP and the total cost of UK Government support was about 21% of GDP. Comparable figures for an independent
181 Johnson, J., ‘SNP pledge on separate Scotland bank regulation illegal, says industry’, The Telegraph, 13 June 2012 182 Kelly, O., ‘Scottish Independence and Financial Services – An Industry Observer’s Perspective’, 2012 183 Quinn, B., ‘Scottish Independence: Issues and Questions’, 2012
SCDI Future Scotland | Macroeconomic and Fiscal Sustainability | April 2013 45
Scotland have been estimated at 37% of GDP184 (with HBOS taking this to £66bn or 45-46% of GDP) for recapitalisation and 211% of GDP for total costs185. The UK Government, rather than the Bank of England, now has the final say over whether to apply public funds. These can only be applied to UK authorised banks186. The Scottish Government’s Fiscal Commission has proposed that, depending upon the nature of the intervention, it could be undertaken jointly by both Governments and co-ordinated through its proposed ‘Macroeconomic Governance Committee’. It points to some examples of and agreements over multinational lender of last resort facilities. This would maintain market confidence in the integrated financial system. It would clearly be in an independent Scotland’s interests to ensure that, if there was a crisis in its large banks, it would not have to meet costs from English subsidiaries187. It would be preferable, but difficult, to agree arrangements before any financial crisis. Governments have generally assessed the impact on capital markets at the time188. The Secretary of State for Scotland has said that: “…the rest of the United Kingdom would have serious doubts over wanting to provide the lender of last resort facility” and that it is “highly unlikely”189. The UK Government has also said that “unless and until the Scottish financial position impacted on the continuing UK’s financial position”, the Bank of England would no longer have to consider it, “in which case it would be relevant “in the same way as any other international trading partner”. Looser regulation could be regarded as threatening overall financial stability190. If the rUK did agree to extend the Bank of England’s lender of last resort facility, there would probably be tight rules on the Scottish Government and banks. The UK supported Ireland when it got into difficulties, but it did not bail it out or take on its debts191. The UK lent capital to Ireland at 6% interest while borrowing itself at 0.5%. There would also be risks for the Scottish-headquartered banks themselves. The Bank of England might require them to pledge higher collateral if it was concerned about the ability of a Scottish Government to guarantee repayments192. Overseas customers may believe that they are less stable due to being headquartered in an independent Scotland rather than the UK. Financial markets themselves may pass some judgment upon the stability and security of RBS and Lloyds and place pressure upon them to move from Scotland. The rUK Government might have concerns, as the majority shareholder, that major assets were headquartered in an independent Scotland which may not have the finances to support them. One way of addressing these concerns and protecting their competitiveness would be
184 Economic Affairs Committee, ‘The economic implications for the United Kingdom of Scottish Independence’, House of Lords, Evidence Session No.2, Questions 56-116, 2012 185 Economic Affairs Committee, ‘The economic implications for the United Kingdom of Scottish Independence’, House of Lords, Evidence Session No.12, Questions 526-640, 2012 186 Quinn, B., ‘Scottish Independence: Issues and Questions’, 2012 187 Economic Affairs Committee, ‘The economic implications for the United Kingdom of Scottish Independence’, House of Lords, Evidence Session No.2, Questions 56-116, 2012 188 Economic Affairs Committee, ‘The economic implications for the United Kingdom of Scottish Independence’, House of Lords, Evidence Session No.8, Questions 368-429, 2012 189 Economic Affairs Committee, ‘The economic implications for the United Kingdom of Scottish Independence’, House of Lords, Evidence Session No.20, Questions 901-925, 2012 190 Economic Affairs Committee, ‘The economic implications for the United Kingdom of Scottish Independence’, House of Lords, Evidence Session No.1, Questions 1-55, 2012 191 Economic Affairs Committee, ‘The economic implications for the United Kingdom of Scottish Independence’, House of Lords, Evidence Session No.2, Questions 56-116, 2012 192 Economic Affairs Committee, ‘The economic implications for the United Kingdom of Scottish Independence’, House of Lords, Evidence Session No.20, Questions 901-925, 2012
SCDI Future Scotland | Macroeconomic and Fiscal Sustainability | April 2013 46
to separate their Scottish and rUK parts193. This may influence the locational and structural decisions of the banks and, therefore, their economic impact in Scotland. Fiscal Policy Credit Rating/ Borrowing A credit rating is an evaluation made by a credit rating agency which evaluates the credit worthiness of a borrower, such as a government. They are used by potential lenders. Credit ratings depend fundamentally on the capacity to meet obligations when they fall due. Standard & Poors analyses a country’s political stability and pressures; its economic growth and structure; its wealth and demographics; its budgetary performance; and its existing debt burden and management. Moodys describes its criteria as a country’s: relative vulnerability to political developments; national monetary and fiscal policies; foreign currency convertability and transfer risk. Credit ratings are, generally, reflected in a government’s cost of borrowing, but it is not necessarily the case that a rating below the highest grade brings higher borrowing costs. Countries which have stronger ratings than the US may pay more. Generally, a private sector borrower does not have a rating better than the country in which it operates, but there are exceptions194. National credit ratings also impact on the rates of borrowing for local authorities and their pension funds. Higher costs of national borrowing may increase mortgage rates, but, again, there are exceptions195. Due to forecasts of lower growth later in this decade, Moodys has recently downgraded the UK’s credit rating for the first time since the 1970s by one notch. Credit Rating Agencies have so far refused to comment on the credit rating of an independent Scotland, which will determine its costs of borrowing, as there are too many variables. Fitch has said that they are not aware of a new country being assigned triple-A, but that the transition of Scotland would be difficult to compare196. The Scottish Government points out that among the few countries with AAA ratings are a number of Scotland’s size, and that the oil revenues of an independent Scotland would be a strong asset against which to borrow. (Annex D includes information on the fiscal sustainability of the Nordic Countries, the UK and Ireland, along with economic, social and governance data.) The UK Government has said that these countries may still have a higher cost of borrowing than the UK and that an independent Scotland would not have the UK’s track record with the markets197. It has been calculated, based on last year’s debt figures, that if an independent Scotland paid a yield on its borrowings which was 4% compared to 3% for the UK, its outlays would be £931m higher198. The OECD has suggested a number of reasons for an additional small country risk premium: “domestic and foreign assets not being perfect substitutes, leading to home-country preferences on the part of large-country investors; the relative depth of financial markets, 193 Economic Affairs Committee, ‘The economic implications for the United Kingdom of Scottish Independence’, House of Lords, Evidence Session No.4, Questions 188-243, 2012 194 Quinn, B., ‘Scottish Independence: Issues and Questions’, 2012 195 Economic Affairs Committee, ‘The economic implications for the United Kingdom of Scottish Independence’, House of Lords, Evidence Session No.2, Questions 56-116, 2012 196 Treasury Committee, ‘Credit Rating Agencies’, House of Commons, HC 1866-iii, 2012 197 Maddox, D., ‘Go-alone Scotland won’t get UK’s triple-A credit rating, Scottish Secretary warns’, The Scotsman, 5 November 2012 198 Ashcroft, B., ‘Scotland’s Fiscal Balance – Forgotten Costs’, Blog, 16 February 2012
SCDI Future Scotland | Macroeconomic and Fiscal Sustainability | April 2013 47
with larger countries perhaps offering more variety in terms of the types of assets available; and greater concern over a smaller country’s policy stability, given their greater exposure to exogenous external shocks”199. The general size of bond issues from smaller countries is not as large, the market is not as big and there are fewer buyers. Therefore, buyers are somewhat more exposed to a liquidity risk that they might not be able to sell their holding to another buyer should they want or need to do so. As a result, they seek a higher yield from the country for holding its bonds200. It may be that an independent Scotland, at least until it establishes a track record, has a higher cost of borrowing than the UK, although this need not be substantial. If an independent Scotland uses sterling it will be effectively borrowing in a foreign currency and financial markets may view it as being at greater risk of default compared to a state that can print its own money201. Depending on their size and headquarter location, the relative size of Scotland’s major banks may be regarded as a systemic risk to the economy. One lesson that some take from the Eurozone crisis is that small countries which rely on foreign investment should pay more to borrow202. The markets may base an initial view on the Scottish Government’s general support for higher social spending203. However, it can point out that, because it is funded by a block grant from the UK Government, it has to balance its budget annually204. The volatility of revenues from oil and gas is often cited as a risk which may entail higher borrowing costs. However, commodity-rich countries manage their income and volatility of income in itself does not normally lead to higher borrowing costs205. However, if the markets thought that an independent Scotland were assuming in its fiscal policy more oil production and higher receipts over the medium and long term than was likely to happen, this could affect an independent Scotland’s credit-rating. The Scottish Government’s Fiscal Commission recommended that an independent Scotland should plan budgets on a “cautious estimate” for North Sea oil revenues and invest any upside volatility in the form of higher tax revenues in a Scottish Oil Fund to guard against unexpected falls in revenue or asymmetric shocks. It added that “with careful management of the public finances over time”, such a fund could evolve into a more general wealth fund to promote inter-generational equity. Given the volatility of the oil price, an independent Scotland may also need to employ cyclical borrowing as an alternative to fiscal transfers within the UK206.
199 Orr, A., Edey, M., and Kennedy, M., ‘Real Long-Term Interest Rates: The Evidence from Pooled-Time-Series’, OECD Economic Studies, No.25(1995111) p.91, 1995 200 Jones, P., ‘Triple A no defence against yield risks’, Scotsman, 2 April 2013 201 Ashcroft, B., ‘It’s the borrowing costs not the flip-flop’, Scottish Economy Watch, 5 October 2012 202 Gay, D. ‘Sterling best Scots option’, The Scotsman, 15 February 2012 203 Economic Affairs Committee, ‘The economic implications for the United Kingdom of Scottish Independence’, House of Lords, Evidence Session No.4, Questions 188-243, 2012 204 Economic Affairs Committee, ‘The economic implications for the United Kingdom of Scottish Independence’, House of Lords, Evidence Session No.7, Questions 331-367, 2012 205 Economic Affairs Committee, ‘The economic implications for the United Kingdom of Scottish Independence’, House of Lords, Evidence Session No.2, Questions 56-116, 2012 206 Economic Affairs Committee, ‘The economic implications for the United Kingdom of Scottish Independence: Oral and Written Evidence’, House of Lords, p.21-30, 2012
SCDI Future Scotland | Macroeconomic and Fiscal Sustainability | April 2013 48
Monetary Policy, Financial Stability and Fiscal Independence All of the currency options for an independent Scotland would involve, to a greater or lesser extent, explicit or implicit constraints on decision-making over fiscal policy. The Eurozone crisis has underlined the systemic risks of a monetary union in which some members have less disciplined fiscal policies than other members. It also showed that even legal agreements stating that one member will not bail out another are disregarded by markets assuming that the need for stability will override them207. The US could be said to illustrate that it is possible to have a currency union without states pursuing the same fiscal policies. However, the majority have budget balance requirements or practice budget balances208. There is agreement between the UK and Scottish Governments that a monetary union between rUK and an independent Scotland would involve some fiscal constraints. If an independent Scotland remains in a sterling zone and wants to borrow using common sterling bonds, this would imply that they would be guaranteed by both the UK and Scottish Governments. For the UK to regard this as acceptable it would have to be satisfied on the sustainability of the Scottish Government’s fiscal policy209. Financial stability arrangements and access to lender of last resort facilities would, statements from the UK Government indicate, also involve fiscal constraints. These constraints may include robustly enforced rules on an independent Scotland’s budget deficit and also on private borrowing (which is what damaged Ireland and Spain). The UK Government has said that any negotiations would be likely to limit any Scottish Government’s control over spending and borrowing in an independent Scotland. The Scottish Government believes that any constraints would still leave far more scope for an independent Scotland to use its tax powers to promote investment, attract foreign capital, advantage particular industrial sectors, or cut VAT to boost consumption, and that this would be preferable to the austerity policy of the UK210. The Scottish Government’s Fiscal Commission has said that, prior to the euro, Belgium and Luxembourg shared a currency, but had different fiscal policies. The Scottish Government’s Fiscal Commission has proposed putting in place a fiscal sustainability agreement, covering both governments, with credible overall objectives for ensuring that net debt and government borrowing do not diverge significantly. The First Minister has previously questioned the need for a full fiscal stabilisation pact between the Scottish Government and rUK authorities because of the similarities in productivity and GDP per head between the rUK and Scotland211. A pact could, however, lower market uncertainty and so Scotland’s borrowing costs212. The current UK Government has two fiscal rules which are adjudicated by the independent OBR. The government has required the OBR to publish (biannually) a judgement on whether current policy is consistent with these two fiscal rules. All eurozone members are members of the Fiscal Stability Treaty. They are required to have enacted laws requiring their national budgets to be in balance (a general budget deficit less than 3% of GDP and a structural deficit of less than 1.0% of GDP if the debt level is below 207 Economic Affairs Committee, ‘The economic implications for the United Kingdom of Scottish Independence’, House of Lords, Evidence Session No.2, Questions 56-116, 2012 208 Ibid 209 McCrone, G., ‘The Scope for Economic Policy After Independence’, 2012 210 Kerevan, G. ‘What’s in future wallets’, The Scotsman, 17 July 2012 211 Sunday Herald, ‘Salmond attacked over flip-flop on pound’, 30 September 2012 212 Ashcroft, B., ‘It’s the borrowing costs not the flip-flop’, Scottish Economy Watch, 5 October 2012
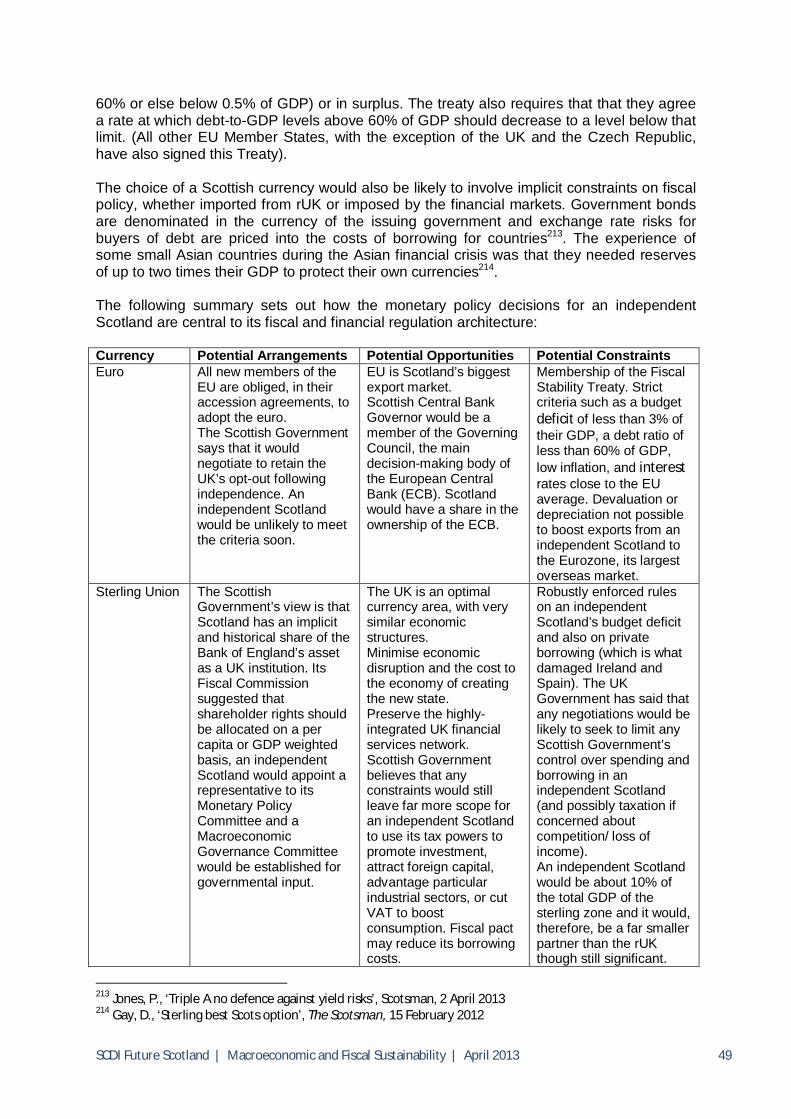
SCDI Future Scotland | Macroeconomic and Fiscal Sustainability | April 2013 49
60% or else below 0.5% of GDP) or in surplus. The treaty also requires that that they agree a rate at which debt-to-GDP levels above 60% of GDP should decrease to a level below that limit. (All other EU Member States, with the exception of the UK and the Czech Republic, have also signed this Treaty). The choice of a Scottish currency would also be likely to involve implicit constraints on fiscal policy, whether imported from rUK or imposed by the financial markets. Government bonds are denominated in the currency of the issuing government and exchange rate risks for buyers of debt are priced into the costs of borrowing for countries213. The experience of some small Asian countries during the Asian financial crisis was that they needed reserves of up to two times their GDP to protect their own currencies214. The following summary sets out how the monetary policy decisions for an independent Scotland are central to its fiscal and financial regulation architecture: Currency Potential Arrangements Potential Opportunities Potential Constraints Euro All new members of the
EU are obliged, in their accession agreements, to adopt the euro. The Scottish Government says that it would negotiate to retain the UK’s opt-out following independence. An independent Scotland would be unlikely to meet the criteria soon.
EU is Scotland’s biggest export market. Scottish Central Bank Governor would be a member of the Governing Council, the main decision-making body of the European Central Bank (ECB). Scotland would have a share in the ownership of the ECB.
Membership of the Fiscal Stability Treaty. Strict criteria such as a budget deficit of less than 3% of their GDP, a debt ratio of less than 60% of GDP, low inflation, and interest rates close to the EU average. Devaluation or depreciation not possible to boost exports from an independent Scotland to the Eurozone, its largest overseas market.
Sterling Union The Scottish Government’s view is that Scotland has an implicit and historical share of the Bank of England’s asset as a UK institution. Its Fiscal Commission suggested that shareholder rights should be allocated on a per capita or GDP weighted basis, an independent Scotland would appoint a representative to its Monetary Policy Committee and a Macroeconomic Governance Committee would be established for governmental input.
The UK is an optimal currency area, with very similar economic structures. Minimise economic disruption and the cost to the economy of creating the new state. Preserve the highly-integrated UK financial services network. Scottish Government believes that any constraints would still leave far more scope for an independent Scotland to use its tax powers to promote investment, attract foreign capital, advantage particular industrial sectors, or cut VAT to boost consumption. Fiscal pact may reduce its borrowing costs.
Robustly enforced rules on an independent Scotland’s budget deficit and also on private borrowing (which is what damaged Ireland and Spain). The UK Government has said that any negotiations would be likely to seek to limit any Scottish Government’s control over spending and borrowing in an independent Scotland (and possibly taxation if concerned about competition/ loss of income). An independent Scotland would be about 10% of the total GDP of the sterling zone and it would, therefore, be a far smaller partner than the rUK though still significant.
213 Jones, P., ‘Triple A no defence against yield risks’, Scotsman, 2 April 2013 214 Gay, D., ‘Sterling best Scots option’, The Scotsman, 15 February 2012
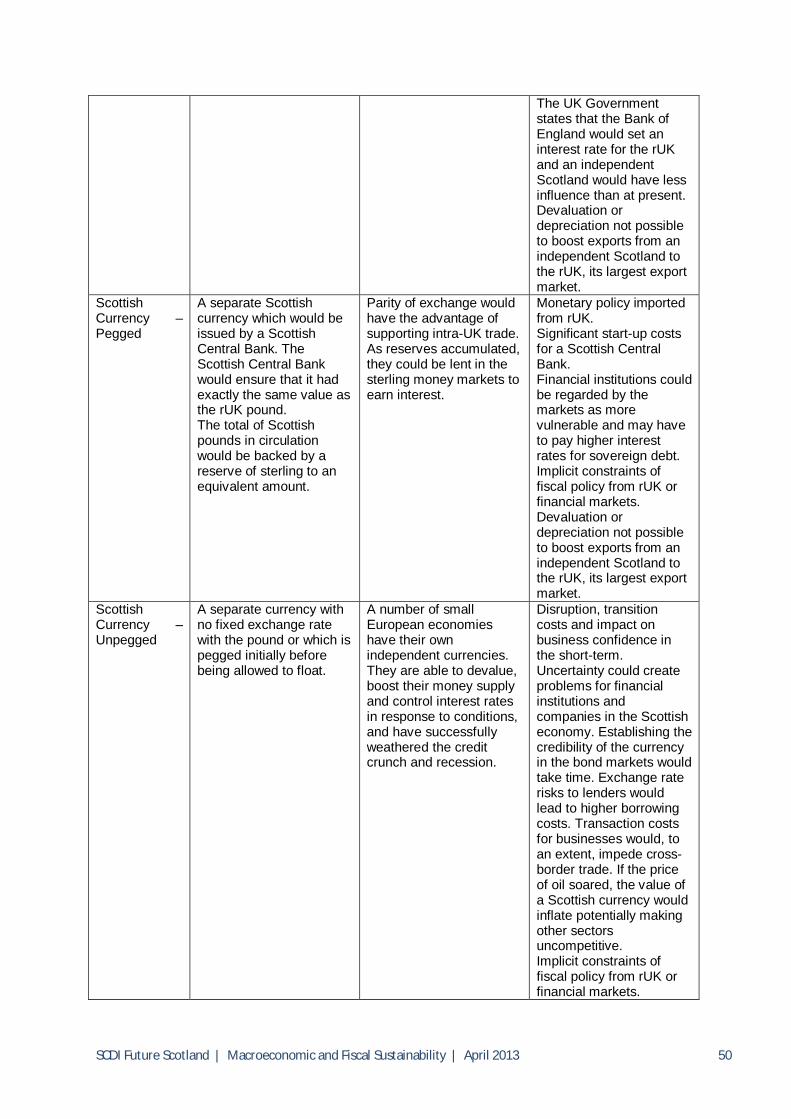
SCDI Future Scotland | Macroeconomic and Fiscal Sustainability | April 2013 50
The UK Government states that the Bank of England would set an interest rate for the rUK and an independent Scotland would have less influence than at present. Devaluation or depreciation not possible to boost exports from an independent Scotland to the rUK, its largest export market.
Scottish Currency – Pegged
A separate Scottish currency which would be issued by a Scottish Central Bank. The Scottish Central Bank would ensure that it had exactly the same value as the rUK pound. The total of Scottish pounds in circulation would be backed by a reserve of sterling to an equivalent amount.
Parity of exchange would have the advantage of supporting intra-UK trade. As reserves accumulated, they could be lent in the sterling money markets to earn interest.
Monetary policy imported from rUK. Significant start-up costs for a Scottish Central Bank. Financial institutions could be regarded by the markets as more vulnerable and may have to pay higher interest rates for sovereign debt. Implicit constraints of fiscal policy from rUK or financial markets. Devaluation or depreciation not possible to boost exports from an independent Scotland to the rUK, its largest export market.
Scottish Currency – Unpegged
A separate currency with no fixed exchange rate with the pound or which is pegged initially before being allowed to float.
A number of small European economies have their own independent currencies. They are able to devalue, boost their money supply and control interest rates in response to conditions, and have successfully weathered the credit crunch and recession.
Disruption, transition costs and impact on business confidence in the short-term. Uncertainty could create problems for financial institutions and companies in the Scottish economy. Establishing the credibility of the currency in the bond markets would take time. Exchange rate risks to lenders would lead to higher borrowing costs. Transaction costs for businesses would, to an extent, impede cross-border trade. If the price of oil soared, the value of a Scottish currency would inflate potentially making other sectors uncompetitive. Implicit constraints of fiscal policy from rUK or financial markets.
SCDI Future Scotland | Macroeconomic and Fiscal Sustainability | April 2013 51
The Fiscal Challenge If Scotland votes to become independent, the Scottish Government has said that independence could be achieved by March 2016, shortly before an election to a new sovereign Scottish Parliament. Decisions about expenditure and revenue would then be taken by the democratically-elected Parliament of an independent Scotland. As previously stated, negotiations with the UK and EU (for example over whether Scotland would inherit the UK’s rebate on the EU Budget or receive more agricultural funding), would potentially have budgetary implications for an independent Scotland. The Scottish Government’s Fiscal Commission has proposed that its role would evolve, following independence, into offering independent advice on economic and fiscal policies, helping to provide credibility to markets and potential investors. Revenue Generation and Collection Scotland has the smallest number of enterprises per head of population of any part of the United Kingdom: 673 per 10,000 Scottish citizens compared to 927 in England215. Some economists, along with the Scottish Government, have suggested that independence for Scotland, supported by appropriately tailored taxation policies, would in itself release entrepreneurial spirit among the Scots. They have attempted to quantify the impact on Scottish GDP. Other economists and businesspeople believe that it would make no difference or could even depress entrepreneurship. The UK is an integrated single market, with a common currency and largely common tax and regulatory systems. Scotland’s exports (excluding oil and gas) to the rest of the UK in 2011 were provisionally estimated at £45.5bn compared to £23.9bn to the rest of the world. Any systemic impact from Scottish independence on intra-UK trade would, thus, make a major difference to the Scottish economy. Continued access to the EU market would also be key for Scottish exports and inward investment216. The Scottish Government is establishing Revenue Scotland to administer taxes which are being devolved to the Scottish Parliament and any future taxes brought under the Scottish Government’s control. It is also introducing a General Anti-Avoidance Rule which will be less narrowly-focussed than the UK equivalent. Scotland and the UK would probably need to enter into a comprehensive double tax treaty and a double contribution agreement. There is a question about whether an independent Scotland and rUK, in relation to anti-avoidance provisions, would treat each other as fully “overseas jurisdictions” or recognise a “special relationship”217. Scottish Government Post-Independence Expenditure Policy The present Scottish Government has commented on some of its own priorities:
Defence spending would be “much lower”218. Defence spending would be 1.7% of GDP compared to the UK’s 2.6%219, however it says that spending within Scotland would be £500m higher than through the UK defence budget;
215 Economic Affairs Committee, ‘The economic implications for the United Kingdom of Scottish Independence’, House of Lords, Evidence Session No.6, Questions 279-330, 2012 216 Ibid 217 Economic Affairs Committee, ‘The economic implications for the United Kingdom of Scottish Independence’, House of Lords, Evidence Session No.8, Questions 368-429, 2012 218 Swinney, J., Scottish Government Cabinet Paper, 2012
SCDI Future Scotland | Macroeconomic and Fiscal Sustainability | April 2013 52
Scotland would aim to have an international aid budget of 1% of gross national income, which would, at present, equate to around £1.5bn. The UK Government is committed to reaching 0.7% of gross national income220;
When possible, it would invest £1bn a year from oil revenues in a fund221. It has opposed the UK Government’s changes to social security and pensions and says that an independent Scotland would be better able to fund this expenditure. The Scottish Government has said that, in 2011-12, 38.4% of tax revenues in Scotland were spent on social protection, compared to 42% for the UK as a whole222. It has pledged to restore the proportion of housing benefit which will be lost by those deemed to have a spare room (the so-called bedroom tax)223. The Scottish Government has said that Ireland and New Zealand are considered examples of international best practice for tax collection and administration, and, based on a comparison with the revenues which they raise and their costs, the annual costs of tax administration in an independent Scotland would be expected to be £575m-625m224. The Scottish Government has stated that the costs of setting up new departments, such as a Scottish Treasury and Department of Foreign Affairs, are small when set against Scotland’s GDP and would be more than offset by the £250m annual saving from no longer contributing to Trident, and the £50m annual saving from not paying a share of costs for politicians in the House of Lords and the House of Commons225. It also predicts efficiencies through a single economic and competition policy regulator. Scottish Government Post-Independence Taxation Policy The Cabinet Secretary for Finance and Sustainable Growth, John Swinney MSP, has stated that he does not envisage personal taxation rising in an independent Scotland and that the Scottish Government supports competitive business taxation. The Scottish Government is strongly in favour of a reduction in corporation tax. It believes that this is necessary to improve the competitiveness of the Scottish economy. In recent times, the Scottish Government has modelled the effects of reducing corporation tax from 23% to 20%, and estimated that, after 20 years, this could increase Scottish GDP by 1.4%, increase employment by 1.1% or 27,000 jobs, increase overall investment in the Scottish economy by 1.1% and boost Scottish exports to the rest of the UK by 1.4% and to the rest of world by 1.3%226. The First Minister has indicated that this is the scale of the cut which is currently intended227. It seems likely that corporation tax policy would form part of any negotiations between an independent Scotland with the rUK on monetary policy and with the EU on membership terms. Both would be concerned that this would shift activity from other regions, particularly the north of England,228 (especially if there was a proposal to cut it to the Irish level of 219 Robertson, A., ‘Resolution to SNP Conference: Foreign, Security and Defence Policy Update’, July 2012 220 Gardham, M., ‘Yousaf plans £1.5bn foreign aid budget’, The Herald, 14 January 2013 221 Fraser, D., ‘Pay now, or trust in the future’, BBC News, 17 April 2012 222 Scottish Government, ‘Government Expenditure and Revenues Scotland, 2011-12’, 2013 223 Sturgeon N, ‘Spring Conference Address’, 24 March 2013 224 Swinney, J., ‘Scottish Government Cabinet Paper’, 2012 225 ‘Get the facts: What about the costs of becoming independent?’ http://www.yesscotland.net/ 226 Scottish Government, ‘The Impact of a Reduction in Corporation Tax on the Scottish Economy’, 2011 227 Fraser, D., ‘How long ‘til independence’, BBC News, 19 June 2012 228 Economic Affairs Committee, ‘The economic implications for the United Kingdom of Scottish Independence: Oral and Written Evidence’, House of Lords, p.86-100, 2012
SCDI Future Scotland | Macroeconomic and Fiscal Sustainability | April 2013 53
12.5%)229. Without a democratically-elected regional assembly, EU state aid rules would prevent it from having lower tax rates than rUK. For an independent Scotland, the potential benefits to businesses and the economy of different rates would need to be weighed against the administrative costs to businesses and the tax system, and the potential risk of a race to the bottom and – at least in the short-term - of lower revenues for public services and investment. Most small and medium-sized Scottish businesses do not pay corporation tax. If they are to benefit from lower rates, this may require a fundamental redesign of the corporation tax system. For larger businesses with operations in Scotland and rUK, there would be costs, though these would not be different from those if they operate internationally. A rUK company operating in Scotland through a branch might be required to prepare branch accounts for Scottish corporation taxation purposes230. At present, it is possible to offset losses in certain parts of a UK organisation against profits in other parts before the preparation of a consolidated UK tax return. It is not thought that any countries operate a form of group relief on a cross-border basis.231 On other areas of taxation, the Scottish Government has stated the following232:
Income tax and national insurance would be used to make starting a business and hiring new employees easier;
VAT rates could be adjusted to support the tourism and hospitality sectors, and encourage investment in repairs and maintenance;
Air Passenger Duty could be adjusted to incentivise key air routes; There would be incentives for the computer games industry; Fuel duty rates should be cut; Tailored incentives for technological development in order to assist sectors with a
high impact on the Scottish economy, and tax credits to support research and development.
The Scottish Government’s plans to replace stamp duty land tax with a land and buildings transaction tax, and landfill tax, show that it is open to different forms of tax. Enhanced Devolution Scotland Act The Scotland Act 2012 will give the Scottish Parliament the power to set a Scottish rate of income tax from April 2016. The rate of income tax set for Scottish taxpayers by the UK Government will be reduced by 10%, and in turn the Scottish Parliament can set a ‘Scottish rate’ on top of this. It may be that they decide to set the rate at 10%, meaning income tax rates in Scotland and the rest of the UK would remain the same, however they will also have the options of raising or lowering the rate. Stamp Duty Tax and Landfill Tax will be devolved from April 2015. In addition the Scotland Act introduces new borrowing powers for the Scottish Parliament worth £5bn. The Scotland Act would also enable new tax raising powers to be devolved to the Scottish Government following approval by both the UK and Scottish Parliaments.
229 Economic Affairs Committee, ‘The economic implications for the United Kingdom of Scottish Independence’, House of Lords, Evidence Session No.2, Questions 56-116, 2012 230 Economic Affairs Committee, ‘The economic implications for the United Kingdom of Scottish Independence: Oral and Written Evidence’, House of Lords, p.86-100, 2012 231 Economic Affairs Committee, ‘The economic implications for the United Kingdom of Scottish Independence’, House of Lords, Evidence Session No.13, Questions 641-724, 2012 232 Swinney, J., ‘Opportunities for Scotland’, Speech presented at Glasgow Caledonian University, 11 June 2012
SCDI Future Scotland | Macroeconomic and Fiscal Sustainability | April 2013 54
The Scotland Act is based on recommendations from the the Calman Commission. It also proposed the devolution of Air Passenger Duty and Aggregates Levy, but these have not yet been devolved. After the measures in the Act come into force, 84% of tax paid in Scotland will remain reserved, while Scottish Parliament will be responsible for 16% of taxes paid in Scotland and 58% of revenue in Scotland. Northern Ireland and Wales The UK Government is still considering the case for devolution of corporation tax to Northern Ireland. It has been reported that this will not take place before the referendum in Scotland233. The Silk Commission, established by the UK Government with the support of the Welsh Government, did not recommend devolving corporation tax but, if the UK Government were to agree to devolve corporation tax to both Scotland and Northern Ireland, it would recommend the same powers be given to Wales234. Party Political Proposals Federalism – Lib Dem Proposals A Scottish Liberal Democrat Commission has published, ‘Federalism: the best future for Scotland’. It proposes that the Scottish Parliament would be allocated:
Powers over income tax, bands and rates. Powers over inheritance tax and capital gains tax. Control of aggregates levy and air passenger duty.
The total tax basket would have generated £18,694m in 2010-11 (Scottish Government spend over this period was £34,234m). The balance between revenue and spending would be funded by an equalisation payment by UK Government funded through VAT, alcohol, tobacco, betting duties and National Insurance. The Scottish Parliament’s borrowing limit would be extended to £1bn to cover shocks to this revenue base, with a fiscal pact to define limits on borrowing and fiscal action. Proceeds of corporation tax, though not control of the rates, would be assigned to Scottish Parliament so that it directly benefits from improved economic performance. The Commission endorses the retention of a single regime for North Sea oil and gas extraction (but encourages the establishment of an UK oil fund once fiscal conditions have improved), as well as reserving welfare benefits and pensions at the UK level. The Commission also proposes to allow Scottish local authorities to raise approximately half of the money they spend, with a grant system funding the remainder. Labour Party Commission Scottish Labour Leader Johann Lamont MSP has created a devolution commission to consider what further powers should be transferred to the Scottish Parliament. Two academics will prepare an interim report for Spring 2013 and a full report before the referendum. It will also consider what further powers local government needs and what should be devolved to local communities. There are no further details on the areas which it will focus on, although Labour Party sources have referred to the devolution of further aspects of the welfare system and of oil and gas tax revenues.
233 The Herald, ‘Cameron delays decision on tax until 2014’, 27 March 2013 234 Commission on Devolution in Wales, ‘Empowerment and Responsibility: Financial Powers to Strengthen Wales’, 2012
SCDI Future Scotland | Macroeconomic and Fiscal Sustainability | April 2013 55
Conservatives Working Group Scottish Conservative Leader Ruth Davidson MSP has said that the Scottish Parliament should raise a “far greater share” of its expenditure in the future and has established a working group which will report before the referendum235. She has highlighted the greater powers of US states in a federal system. Press reports have previously suggested that the Conservatives would consider the balance of powers across the UK Parliament and the three devolved Parliaments, and also across English regions. Think-Tank Proposals Devo More The Institute of Public Policy for Regions has proposed that personal income tax should be devolved and a large proportion of VAT should be assigned. It says that it would be desirable to devolve alcohol and tobacco taxation. All land taxes would be devolved, including the aggregates levy, and air passenger duty, and the Treasury should consider the practicalities of devolving capital gains tax in relation to land. Employer’s national insurance contributions could also be devolved. The Scottish Parliament would be responsible for 55-60% of taxation for devolved spending236. Devo Plus Devo Plus is campaigned for by Reform Scotland237. They believe that Scotland should be given enough tax and borrowing powers to remove the need for a block grant. Income tax, corporation tax, a geographic share of oil and gas revenues and other taxes would be transferred. VAT and National Insurance (and a few minor taxes) would remain reserved to Westminster. Overall, Devo Plus would result in Westminster remaining responsible for raising 36% of all income, and including deficit borrowing, nearly 50% of all funding of Scotland’s expenditure, bringing it into line with the federal systems operated in the USA, Canada and Germany.
Further social protection powers are also proposed, for example devolving major welfare benefits, however leaving state pensions and sickness/maternity pay as reserved areas. Devolving welfare benefits would allow the Scottish Government in Reform Scotland’s opinion to pursue a more concerted agenda on social exclusion. According to Reform Scotland, eight countries in the OECD have devolved systems of corporation. They say that the OECD concluded that there was little tax competition between a sub-central level of government and the national level of Government238. However, critics believe that there would still be a level of tax competition which would be unacceptable to the north of England, Northern Ireland and the Treasury. They also argue that while VAT from Scotland would essentially fund its share of UK functions, social security receipts in Scotland do not equal half of the social security payments, which would turn a £4bn transfer to Scotland into a £13bn transfer239.
235 Davidson, R., Speech, 26 March 2013 236 IPPR, ‘Funding devo more: Fiscal options for strengthening the union’, 2013 237 Devo+, ‘A Stronger Scotland Within The UK: The First Report of the Devo Plus Group’, 2012 238 Scottish Affairs Committee, ‘The Referendum on Separation for Scotland, Session 2012-13: Oral and Written Evidence’, House of Commons, HC 139-I: Ev 88, 2012 239 Economic Affairs Committee, ‘The economic implications for the United Kingdom of Scottish Independence’, House of Lords, Evidence Session No.7, Questions 331-367, 2012
SCDI Future Scotland | Macroeconomic and Fiscal Sustainability | April 2013 56
Devo Max Devo Max involves the transfer of powers to Holyrood, resulting in the Scottish Parliament being responsible for all of its revenue and spending. This would include social security, unemployment benefits, sales taxes, corporation tax, other business taxes, carbon taxes etc. The VAT rate and pensions would remain reserved to the UK Government. Scottish VAT receipts would be assigned between the Scottish and UK Governments. The Scottish Government would make payments to the UK Government to cover Scotland's share of the cost of providing certain UK-wide services, including, at a minimum, defence and the conduct of foreign relations, and for its share of the fiscal adjustment to address the UK budget deficit and public debt. Social security would also be devolved to Scotland to combat social exclusion. Advocates argue that Devo Max is required to provide the levers needed to guide the Scottish economy and improve its performance and the only arrangement consistent with increasing political and economic accountability for Scottish policymakers240. The North of England is worried about the benefits for Scotland and disruptions to the movement of goods, capital and services across the UK’s internal borders241. Some have argued that the fiscal rules which the Treasury would be likely to insist on would be even tighter than with independence, limiting any corporation tax cut. Critics suggest that full fiscal autonomy would reduce the economic and fiscal protection which Scotland currently has as part of a bigger, risk-sharing pool242. Scotland has a worse demographic profile and health characteristics than the rest of the UK, which result in a net fiscal transfer to Scotland. Under Devo Max, some critics have suggested that Scotland would, therefore, be £3bn to £4bn worse off243.
240 Hughes Hallet, A. and Scott, D., ‘Scotland: A New Fiscal Settlement’, Centre for Dynamic Macroeconomic Analysis Working Paper Series CDMA10/09, 2010 241 Economic Affairs Committee, ‘The economic implications for the United Kingdom of Scottish Independence’, House of Lords, Evidence Session No.3, Questions 117-187, 2012 242 Economic Affairs Committee, ‘The economic implications for the United Kingdom of Scottish Independence’, House of Lords, Evidence Session No.7, Questions 331-367, 2012 243 Ibid
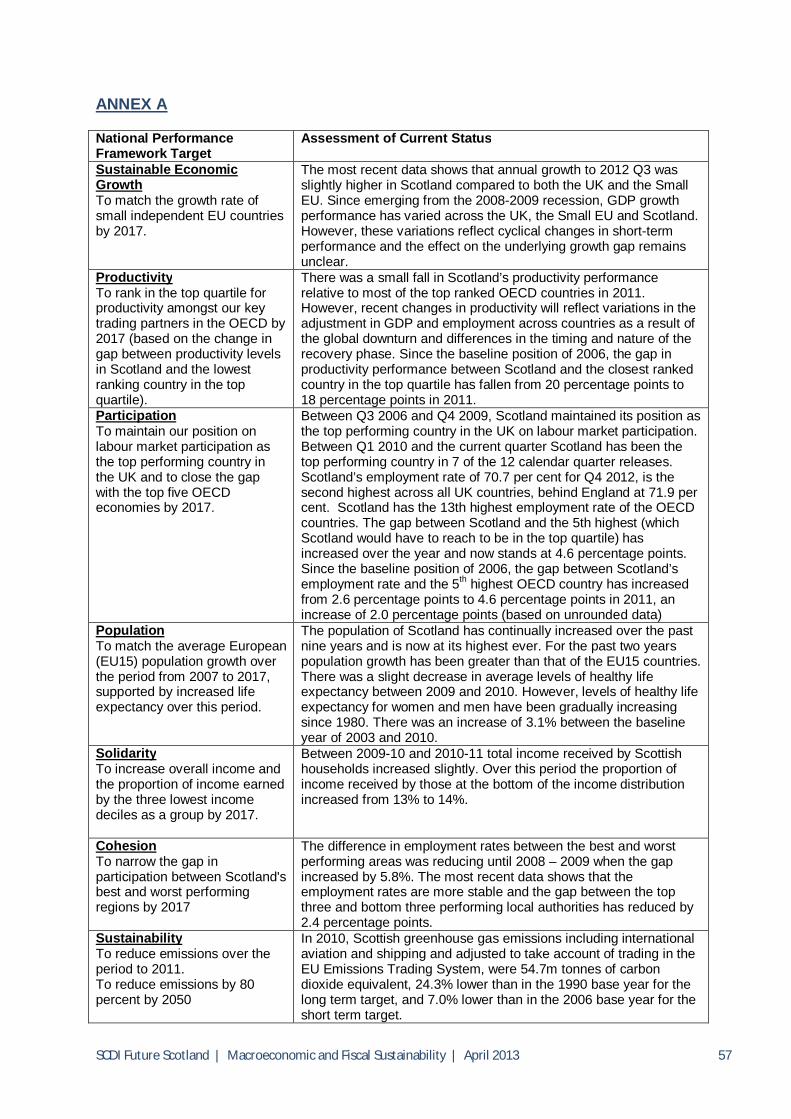
SCDI Future Scotland | Macroeconomic and Fiscal Sustainability | April 2013 57
ANNEX A National Performance Framework Target
Assessment of Current Status
Sustainable Economic Growth To match the growth rate of small independent EU countries by 2017.
The most recent data shows that annual growth to 2012 Q3 was slightly higher in Scotland compared to both the UK and the Small EU. Since emerging from the 2008-2009 recession, GDP growth performance has varied across the UK, the Small EU and Scotland. However, these variations reflect cyclical changes in short-term performance and the effect on the underlying growth gap remains unclear.
Productivity To rank in the top quartile for productivity amongst our key trading partners in the OECD by 2017 (based on the change in gap between productivity levels in Scotland and the lowest ranking country in the top quartile).
There was a small fall in Scotland’s productivity performance relative to most of the top ranked OECD countries in 2011. However, recent changes in productivity will reflect variations in the adjustment in GDP and employment across countries as a result of the global downturn and differences in the timing and nature of the recovery phase. Since the baseline position of 2006, the gap in productivity performance between Scotland and the closest ranked country in the top quartile has fallen from 20 percentage points to 18 percentage points in 2011.
Participation To maintain our position on labour market participation as the top performing country in the UK and to close the gap with the top five OECD economies by 2017.
Between Q3 2006 and Q4 2009, Scotland maintained its position as the top performing country in the UK on labour market participation. Between Q1 2010 and the current quarter Scotland has been the top performing country in 7 of the 12 calendar quarter releases. Scotland’s employment rate of 70.7 per cent for Q4 2012, is the second highest across all UK countries, behind England at 71.9 per cent. Scotland has the 13th highest employment rate of the OECD countries. The gap between Scotland and the 5th highest (which Scotland would have to reach to be in the top quartile) has increased over the year and now stands at 4.6 percentage points. Since the baseline position of 2006, the gap between Scotland’s employment rate and the 5th highest OECD country has increased from 2.6 percentage points to 4.6 percentage points in 2011, an increase of 2.0 percentage points (based on unrounded data)
Population To match the average European (EU15) population growth over the period from 2007 to 2017, supported by increased life expectancy over this period.
The population of Scotland has continually increased over the past nine years and is now at its highest ever. For the past two years population growth has been greater than that of the EU15 countries. There was a slight decrease in average levels of healthy life expectancy between 2009 and 2010. However, levels of healthy life expectancy for women and men have been gradually increasing since 1980. There was an increase of 3.1% between the baseline year of 2003 and 2010.
Solidarity To increase overall income and the proportion of income earned by the three lowest income deciles as a group by 2017.
Between 2009-10 and 2010-11 total income received by Scottish households increased slightly. Over this period the proportion of income received by those at the bottom of the income distribution increased from 13% to 14%.
Cohesion To narrow the gap in participation between Scotland's best and worst performing regions by 2017
The difference in employment rates between the best and worst performing areas was reducing until 2008 – 2009 when the gap increased by 5.8%. The most recent data shows that the employment rates are more stable and the gap between the top three and bottom three performing local authorities has reduced by 2.4 percentage points.
Sustainability To reduce emissions over the period to 2011. To reduce emissions by 80 percent by 2050
In 2010, Scottish greenhouse gas emissions including international aviation and shipping and adjusted to take account of trading in the EU Emissions Trading System, were 54.7m tonnes of carbon dioxide equivalent, 24.3% lower than in the 1990 base year for the long term target, and 7.0% lower than in the 2006 base year for the short term target.
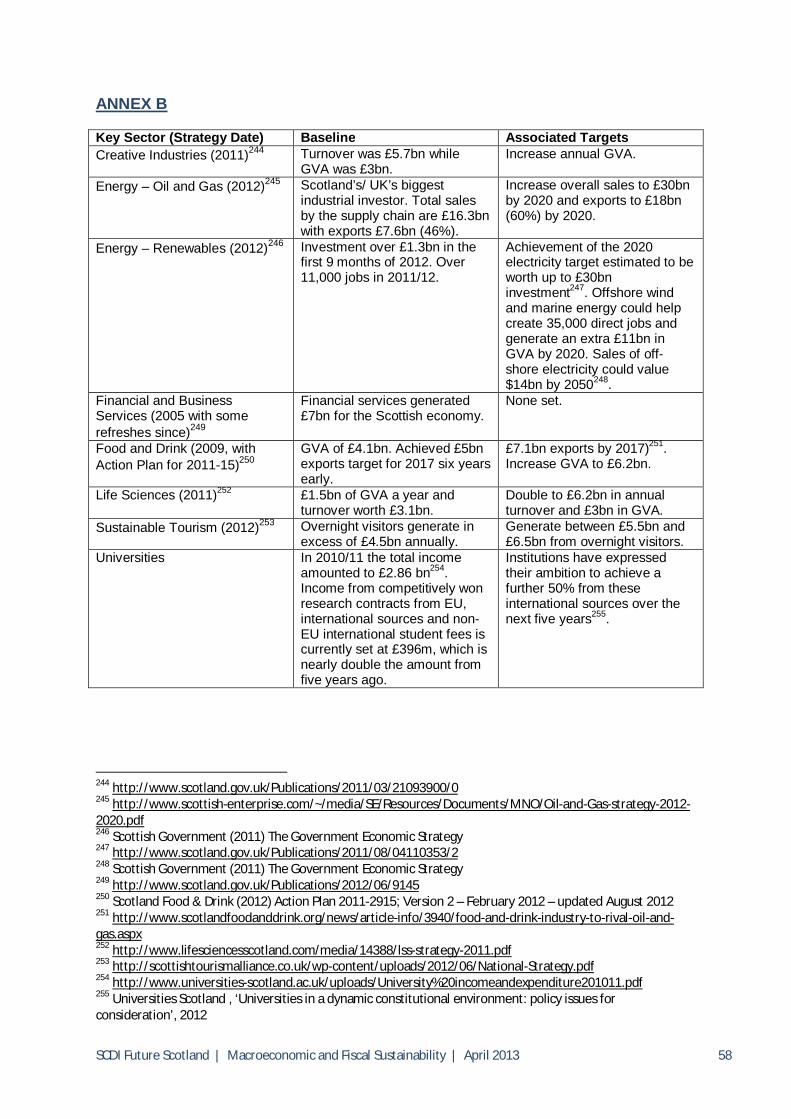
SCDI Future Scotland | Macroeconomic and Fiscal Sustainability | April 2013 58
ANNEX B
Key Sector (Strategy Date) Baseline Associated Targets Creative Industries (2011)244 Turnover was £5.7bn while
GVA was £3bn. Increase annual GVA.
Energy – Oil and Gas (2012)245 Scotland’s/ UK’s biggest industrial investor. Total sales by the supply chain are £16.3bn with exports £7.6bn (46%).
Increase overall sales to £30bn by 2020 and exports to £18bn (60%) by 2020.
Energy – Renewables (2012)246 Investment over £1.3bn in the first 9 months of 2012. Over 11,000 jobs in 2011/12.
Achievement of the 2020 electricity target estimated to be worth up to £30bn investment247. Offshore wind and marine energy could help create 35,000 direct jobs and generate an extra £11bn in GVA by 2020. Sales of off-shore electricity could value $14bn by 2050248.
Financial and Business Services (2005 with some refreshes since)249
Financial services generated £7bn for the Scottish economy.
None set.
Food and Drink (2009, with Action Plan for 2011-15)250
GVA of £4.1bn. Achieved £5bn exports target for 2017 six years early.
£7.1bn exports by 2017)251. Increase GVA to £6.2bn.
Life Sciences (2011)252 £1.5bn of GVA a year and turnover worth £3.1bn.
Double to £6.2bn in annual turnover and £3bn in GVA.
Sustainable Tourism (2012)253 Overnight visitors generate in excess of £4.5bn annually.
Generate between £5.5bn and £6.5bn from overnight visitors.
Universities In 2010/11 the total income amounted to £2.86 bn254. Income from competitively won research contracts from EU, international sources and non-EU international student fees is currently set at £396m, which is nearly double the amount from five years ago.
Institutions have expressed their ambition to achieve a further 50% from these international sources over the next five years255.
244 http://www.scotland.gov.uk/Publications/2011/03/21093900/0 245 http://www.scottish-enterprise.com/~/media/SE/Resources/Documents/MNO/Oil-and-Gas-strategy-2012-2020.pdf 246 Scottish Government (2011) The Government Economic Strategy 247 http://www.scotland.gov.uk/Publications/2011/08/04110353/2 248 Scottish Government (2011) The Government Economic Strategy 249 http://www.scotland.gov.uk/Publications/2012/06/9145 250 Scotland Food & Drink (2012) Action Plan 2011-2915; Version 2 – February 2012 – updated August 2012 251 http://www.scotlandfoodanddrink.org/news/article-info/3940/food-and-drink-industry-to-rival-oil-and-gas.aspx 252 http://www.lifesciencesscotland.com/media/14388/lss-strategy-2011.pdf 253 http://scottishtourismalliance.co.uk/wp-content/uploads/2012/06/National-Strategy.pdf 254 http://www.universities-scotland.ac.uk/uploads/University%20incomeandexpenditure201011.pdf 255 Universities Scotland , ‘Universities in a dynamic constitutional environment: policy issues for consideration’, 2012
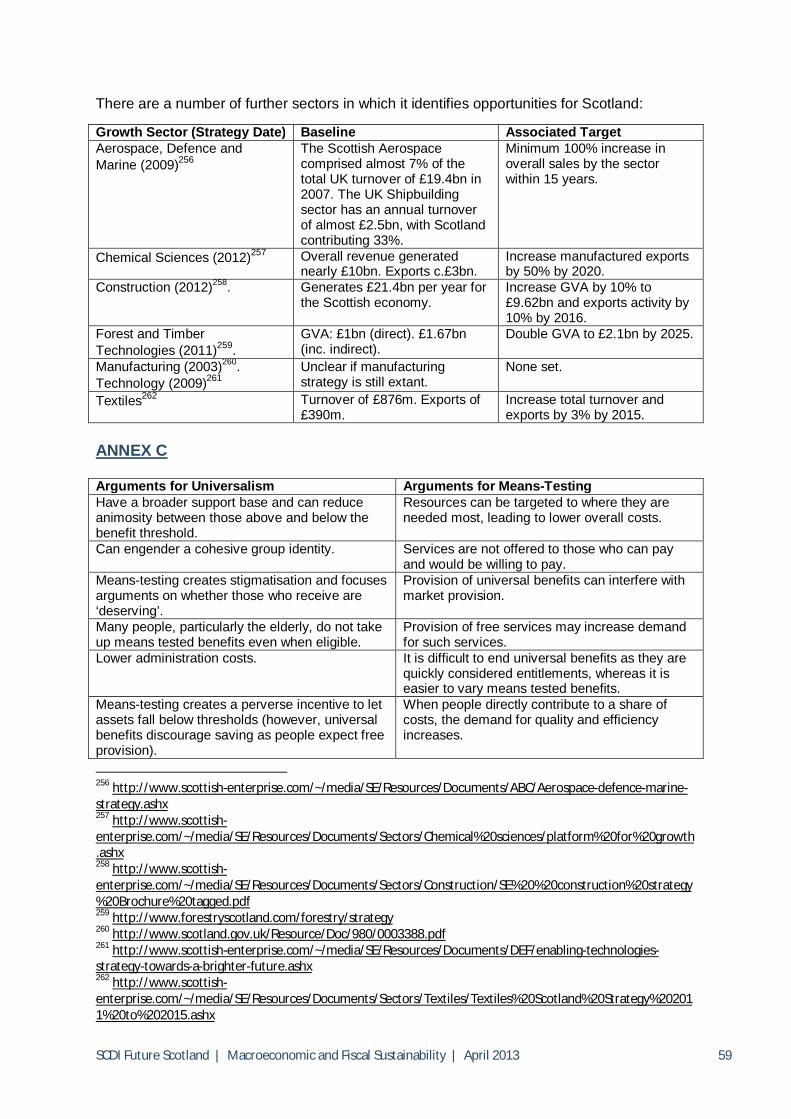
SCDI Future Scotland | Macroeconomic and Fiscal Sustainability | April 2013 59
There are a number of further sectors in which it identifies opportunities for Scotland: Growth Sector (Strategy Date) Baseline Associated Target Aerospace, Defence and Marine (2009)256
The Scottish Aerospace comprised almost 7% of the total UK turnover of £19.4bn in 2007. The UK Shipbuilding sector has an annual turnover of almost £2.5bn, with Scotland contributing 33%.
Minimum 100% increase in overall sales by the sector within 15 years.
Chemical Sciences (2012)257 Overall revenue generated nearly £10bn. Exports c.£3bn.
Increase manufactured exports by 50% by 2020.
Construction (2012)258.
Generates £21.4bn per year for the Scottish economy.
Increase GVA by 10% to £9.62bn and exports activity by 10% by 2016.
Forest and Timber Technologies (2011)259.
GVA: £1bn (direct). £1.67bn (inc. indirect).
Double GVA to £2.1bn by 2025.
Manufacturing (2003)260. Technology (2009)261
Unclear if manufacturing strategy is still extant.
None set.
Textiles262 Turnover of £876m. Exports of £390m.
Increase total turnover and exports by 3% by 2015.
ANNEX C Arguments for Universalism Arguments for Means-Testing Have a broader support base and can reduce animosity between those above and below the benefit threshold.
Resources can be targeted to where they are needed most, leading to lower overall costs.
Can engender a cohesive group identity.
Services are not offered to those who can pay and would be willing to pay.
Means-testing creates stigmatisation and focuses arguments on whether those who receive are ‘deserving’.
Provision of universal benefits can interfere with market provision.
Many people, particularly the elderly, do not take up means tested benefits even when eligible.
Provision of free services may increase demand for such services.
Lower administration costs. It is difficult to end universal benefits as they are quickly considered entitlements, whereas it is easier to vary means tested benefits.
Means-testing creates a perverse incentive to let assets fall below thresholds (however, universal benefits discourage saving as people expect free provision).
When people directly contribute to a share of costs, the demand for quality and efficiency increases.
256 http://www.scottish-enterprise.com/~/media/SE/Resources/Documents/ABC/Aerospace-defence-marine-strategy.ashx 257 http://www.scottish-enterprise.com/~/media/SE/Resources/Documents/Sectors/Chemical%20sciences/platform%20for%20growth.ashx 258 http://www.scottish-enterprise.com/~/media/SE/Resources/Documents/Sectors/Construction/SE%20%20construction%20strategy%20Brochure%20tagged.pdf 259 http://www.forestryscotland.com/forestry/strategy 260 http://www.scotland.gov.uk/Resource/Doc/980/0003388.pdf 261 http://www.scottish-enterprise.com/~/media/SE/Resources/Documents/DEF/enabling-technologies-strategy-towards-a-brighter-future.ashx 262 http://www.scottish-enterprise.com/~/media/SE/Resources/Documents/Sectors/Textiles/Textiles%20Scotland%20Strategy%202011%20to%202015.ashx
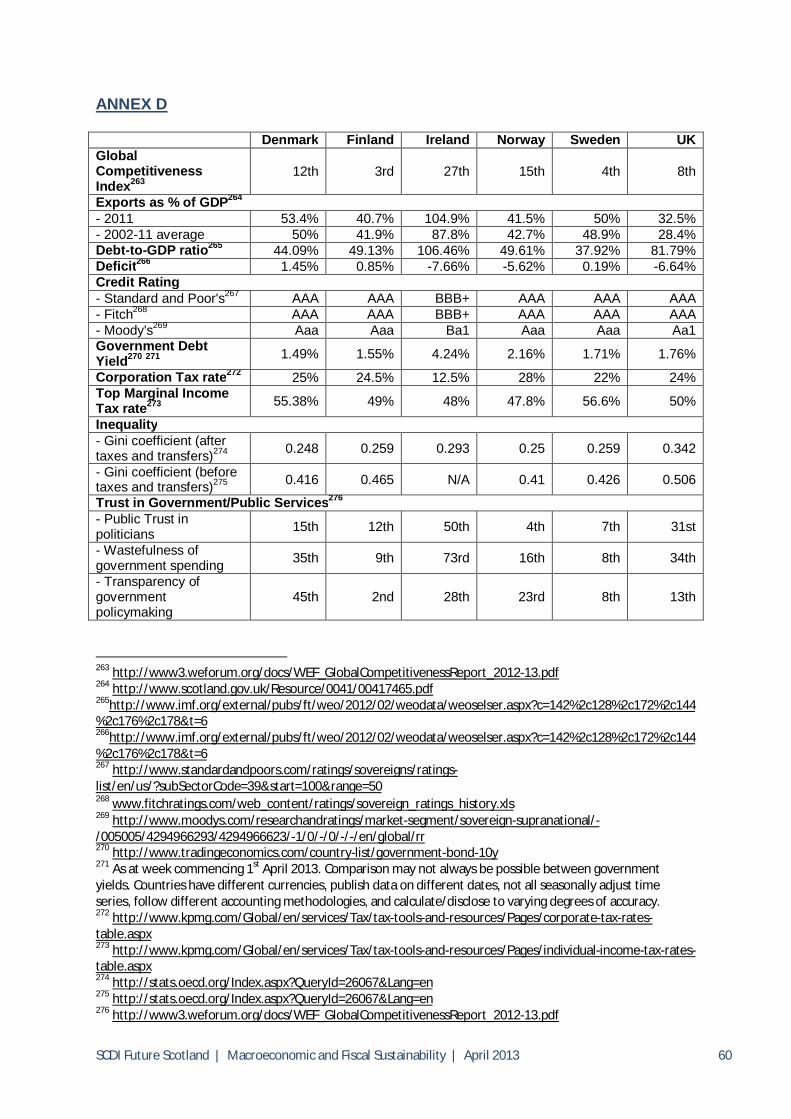
SCDI Future Scotland | Macroeconomic and Fiscal Sustainability | April 2013 60
ANNEX D Denmark Finland Ireland Norway Sweden UK Global Competitiveness Index263
12th 3rd 27th 15th 4th 8th
Exports as % of GDP264 - 2011 53.4% 40.7% 104.9% 41.5% 50% 32.5% - 2002-11 average 50% 41.9% 87.8% 42.7% 48.9% 28.4% Debt-to-GDP ratio265 44.09% 49.13% 106.46% 49.61% 37.92% 81.79% Deficit266 1.45% 0.85% -7.66% -5.62% 0.19% -6.64% Credit Rating - Standard and Poor's267 AAA AAA BBB+ AAA AAA AAA - Fitch268 AAA AAA BBB+ AAA AAA AAA - Moody's269 Aaa Aaa Ba1 Aaa Aaa Aa1 Government Debt Yield270 271 1.49% 1.55% 4.24% 2.16% 1.71% 1.76%
Corporation Tax rate272 25% 24.5% 12.5% 28% 22% 24% Top Marginal Income Tax rate273 55.38% 49% 48% 47.8% 56.6% 50%
Inequality - Gini coefficient (after taxes and transfers)274 0.248 0.259 0.293 0.25 0.259 0.342
- Gini coefficient (before taxes and transfers)275 0.416 0.465 N/A 0.41 0.426 0.506
Trust in Government/Public Services276 - Public Trust in politicians 15th 12th 50th 4th 7th 31st
- Wastefulness of government spending 35th 9th 73rd 16th 8th 34th
- Transparency of government policymaking
45th 2nd 28th 23rd 8th 13th
263 http://www3.weforum.org/docs/WEF_GlobalCompetitivenessReport_2012-13.pdf 264 http://www.scotland.gov.uk/Resource/0041/00417465.pdf 265http://www.imf.org/external/pubs/ft/weo/2012/02/weodata/weoselser.aspx?c=142%2c128%2c172%2c144%2c176%2c178&t=6 266http://www.imf.org/external/pubs/ft/weo/2012/02/weodata/weoselser.aspx?c=142%2c128%2c172%2c144%2c176%2c178&t=6 267 http://www.standardandpoors.com/ratings/sovereigns/ratings-list/en/us/?subSectorCode=39&start=100&range=50 268 www.fitchratings.com/web_content/ratings/sovereign_ratings_history.xls 269 http://www.moodys.com/researchandratings/market-segment/sovereign-supranational/-/005005/4294966293/4294966623/-1/0/-/0/-/-/en/global/rr 270 http://www.tradingeconomics.com/country-list/government-bond-10y 271 As at week commencing 1st April 2013. Comparison may not always be possible between government yields. Countries have different currencies, publish data on different dates, not all seasonally adjust time series, follow different accounting methodologies, and calculate/disclose to varying degrees of accuracy. 272 http://www.kpmg.com/Global/en/services/Tax/tax-tools-and-resources/Pages/corporate-tax-rates-table.aspx 273 http://www.kpmg.com/Global/en/services/Tax/tax-tools-and-resources/Pages/individual-income-tax-rates-table.aspx 274 http://stats.oecd.org/Index.aspx?QueryId=26067&Lang=en 275 http://stats.oecd.org/Index.aspx?QueryId=26067&Lang=en 276 http://www3.weforum.org/docs/WEF_GlobalCompetitivenessReport_2012-13.pdf

Aberdeen | Glasgow | Inverness | London
[email protected] | @scdinews | @scdiglobal | www.scdi.org.uk | www.yecscotland.co.uk
A company registered in Scotland no.24724