Nom 093 Ssa1 1994practsdehigysanidadenlaprepardealimsqueseofrecenenestabfijos

3126 Proteomics 2015, 15, 3126–3139DOI 10.1002/pmic.201400527
RESEARCH ARTICLE
Quantitative proteomics and network analysis of SSA1
and SSB1 deletion mutants reveals robustness of
chaperone HSP70 network in Saccharomyces cerevisiae
Andrew F. Jarnuczak1, Claire E. Eyers2, Jean-Marc Schwartz1, Christopher M. Grant1
and Simon J. Hubbard1
1 Faculty of Life Sciences, Michael Smith Building, Manchester, UK2 Centre for Proteome Research, Department of Biochemistry, Institute of Integrative Biology, University
of Liverpool, Liverpool, UK
Received: November 7, 2014Revised: January 13, 2015
Accepted: February 11, 2015
Molecular chaperones play an important role in protein homeostasis and the cellular responseto stress. In particular, the HSP70 chaperones in yeast mediate a large volume of protein foldingthrough transient associations with their substrates. This chaperone interaction network canbe disturbed by various perturbations, such as environmental stress or a gene deletion. Here,we consider deletions of two major chaperone proteins, SSA1 and SSB1, from the chaperonenetwork in Sacchromyces cerevisiae. We employ a SILAC-based approach to examine changes inglobal and local protein abundance and rationalise our results via network analysis and graphtheoretical approaches. Although the deletions result in an overall increase in intracellularprotein content, correlated with an increase in cell size, this is not matched by substantialchanges in individual protein concentrations. Despite the phenotypic robustness to deletionof these major hub proteins, it cannot be simply explained by the presence of paralogues.Instead, network analysis and a theoretical consideration of folding workload suggest that therobustness to perturbation is a product of the overall network structure. This highlights howquantitative proteomics and systems modelling can be used to rationalise emergent networkproperties, and how the HSP70 system can accommodate the loss of major hubs.
Keywords:
Betweenness centrality / Chaperones / Protein interaction networks / SILAC / Systemsbiology / Quantitative proteomics
� Additional supporting information may be found in the online version of this article atthe publisher’s web-site
1 Introduction
Molecular chaperones, historically known as heat shock pro-teins, play important roles in the cellular stress response,also contributing to cellular protein homeostasis under nor-mal conditions through a variety of mechanisms [1–4].
Correspondence: Professor Simon Hubbard, Faculty of Life Sci-ences, University of Manchester, Michael Smith Building, OxfordRoad, Manchester M13 9PT, UKE-mail: [email protected]
Abbreviations: BC, betweenness centrality; FDR, false discoveryrate; LOESS, locally weighted regression; MA, mean versus aver-age
Chaperone activity is underlined by their ability to form inter-actions with client proteins, as well as other proteins, e.g. co-factors or ribosomal proteins, in order to mediate their correctfolding and subsequent trafficking. Those interactions giverise to a complex protein–protein interaction network that canbe easily graphically visualised and provides a conceptual mapfor interpreting their integrated global function. For example,the yeast chaperone network contains 63 well-known chaper-one proteins, many of which have been extensively studiedfor their biochemical properties, molecular mechanisms ofprotein folding, individual role in stress response and molec-ular aspects of chaperone-mediated proteostasis. However,
Colour Online: See the article online to view Figs. 1–6 in colour.
C© 2015 The Authors. PROTEOMICS published by Wiley-VCH Verlag GmbH & Co. KGaA, Weinheim. www.proteomics-journal.com
This is an open access article under the terms of the Creative Commons Licence, which permits use and distribution in any medium, provided theoriginal work is properly cited.

Proteomics 2015, 15, 3126–3139 3127
a holistic, system-level understanding of the network whereall the elements (chaperones and substrates) are consideredsimultaneously has yet to be defined. Such a model wouldclearly be highly informative. As a prerequisite to buildingsuch a model, the network of chaperone-substrate interac-tions should be defined, to provide a biological framework inwhich the emergent properties of the cell, such as protein-folding homeostasis, can be explained [5]. A system of 20 or30 proteins organised in a network is capable of performingfunctions that an uncoupled collection of proteins cannot;what might be difficult to explain in the context of singleelements becomes ‘obvious’ in a network [6].
Seminal work by Gong et al. [7] using tandem affinity pu-rification followed by MS analysis was the first large scale,targeted identification of protein complexes within Saccha-romyces cerevisiae chaperone networks and delineated whatcan be dubbed as the ‘yeast chaperome’. The chaperome de-fined by Gong et al. [7] contains 63 chaperone proteins and isa system of sub-networks that can be divided into two princi-pal modules: functionally non-selective chaperones (typically> 200 interactions with non-chaperone proteins) and func-tionally specific chaperones (fewer than 200 non-chaperoneinteractions). This classification is based on the number ofinteracting proteins and is the simplest strategy aiming tointerpret the network by finding common parameters (or at-tributes) of chaperones. More fine-grained chaperome func-tional modules have also been identified based on shared in-teractions [7] or by clustering chaperones into groups basedon the target proteins with which they interact [8,9]. This candefine topological clusters, as has been successfully used byBogumil et al. [9] to discover distinctive chaperome commu-nity structure linked to evolutionary properties.
While the entire chaperone network is involved in themany biological processes relating to cellular protein home-ostasis [10], a sub-network of HSP70 molecular chaperonesare thought to be chiefly responsible for mediating de novoprotein folding through a mechanism involving cycles ofbinding and release of substrate proteins, triggered by ATPand HSP40 cofactors [11]. They also have known functionsin protein translocation across biological membranes anddissolution of aggregates [12]. Nascent and newly synthe-sized polypeptides are bound by HSP70, initially stabilis-ing the unfolded state; upon subsequent release into solu-tion they then reach their native folded state [9]. A loss ofpart of this folding mechanism could potentially result in in-creased numbers of misfolded, unfolded or aggregated pro-teins, particularly for proteins that exclusively interact withjust one HSP70 chaperone. The misfolded proteins are thendestined for a number of possible outcomes: vacuolar andnonvacuolar pathways of degradation (resulting in measure-able ‘protein down-regulation’), or aggregation resulting inapparent protein ‘up regulation’. Alternatively, it is possiblethat other mechanisms take over the responsibility of foldingthese proteins (network redundancy, alternative chaperoninand HSP90-mediated folding etc.) and no major phenotypicchanges are visible.
While protein interactions define the chaperome at themolecular systems level, they provide only a static defini-tion of the network under normal growth conditions; we alsowish to characterise how the system changes under perturba-tion (e.g. mutations, gene deletions, environmental stress orprotein up-regulation). Here, we focus on gene deletions inS. cerevisiae, to study how loss of a major chaperone proteincan impact global cellular protein abundance and understandthe attendant changes through network analysis. Our overallexperimental design is shown in Fig. 1. We selected two mu-tants from the HSP70 subfamily of cytosolic chaperones: heatshock protein SSA1 (YAL005C) and heat shock protein SSB1(YDL229W) and compared them to a wild-type strain (WT).As an additional control, we also considered the proteomechanges in the yeast strain lacking peptidyl-prolyl cis-transisomerise (CPR6, YLR216C) (Fig. 1A). This gene is consid-ered as a co-chaperone of HSP90 (to which it binds and canregulate activity), although it was not considered by Gong et al.[7] and is not an HSP70 family chaperone; this strain is usedhere strictly for the cell size/total protein content correlationcomparison.
From the network perspective SSB1 and SSA1 are obvioustargets for analysis as they are the two biggest hub proteinsin the chaperone network, with 3269 and 2489 client-proteinlinks, respectively, as well as interactions observed with over40 other chaperones [7]. They are also highly abundant inunstressed yeast cells, estimated at 8178 ppm for SSA1 and2320 ppm for SSB1 (in the top 5% of yeast proteins by abun-dance according to PaxDB) [13]. The two proteins are highlyhomologous to each other (63% sequence identity) and also totheir closely related paralogues SSA2 and SSB2; SSA1/SSA2sequence identity stands at 98%, while SSB1/SSB2 is 99%[14].
The HSP70 chaperone family, including SSA1/SSA2 andSSB1/SSB2 proteins, has been extensively studied in termsof evolutionary similarity [14–16] and functional similar-ity/redundancy via knock-out models [17–27]. For example,Craig et al. [22] characterised members of the SSA familyin yeast and reported no phenotypic effects when a singlegene, either SSA1 or SSA2 was deleted. The deletant strainsgrew at similar rates to the wild-type and did not show anyobvious phenotypic differences under heat shock (definedin the original publication as the ability to withstand expo-sure to 52�C after a 50-min pre-treatment at 37�C). A dou-ble (SSA1/SSA2) mutant was growth retarded at 30�C andinviable at 37�C. However, despite these similarities, SSA1and SSA2 are differentially regulated [26]; SSA1 expressionis highly increased at 39�C while SSA2 transcript abundanceincreases only marginally in higher temperatures. A numberof other studies have also pointed to functional specificity, asreviewed by Kabani and Martineau [28]. Furthermore, whengrown on a non-fermentable carbon source and at 37�C, theSSA1 mutant strain is inviable whilst cells deleted for SSA2grow normally [27]. Collectively, these results suggest bothphenotypic redundancy between SSA1 and SSA2 and differ-ent molecular and regulatory properties.
C© 2015 The Authors. PROTEOMICS published by Wiley-VCH Verlag GmbH & Co. KGaA, Weinheim. www.proteomics-journal.com
3128 A. F. Jarnuczak et al. Proteomics 2015, 15, 3126–3139
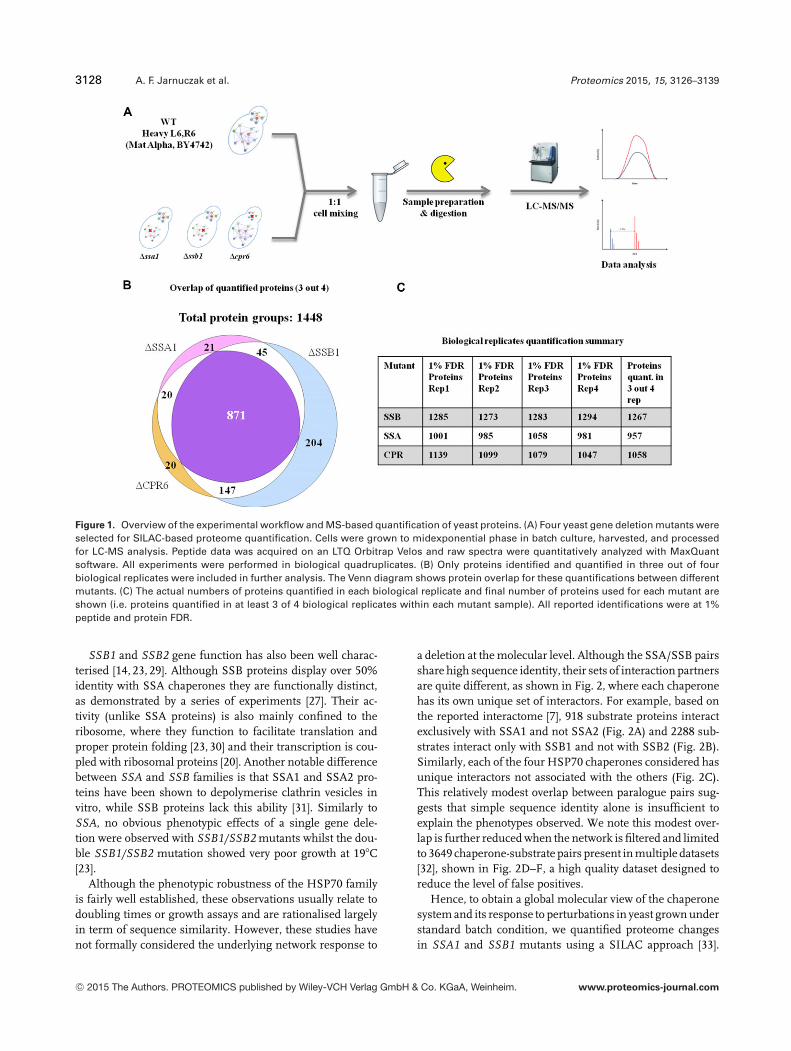
Figure 1. Overview of the experimental workflow and MS-based quantification of yeast proteins. (A) Four yeast gene deletion mutants wereselected for SILAC-based proteome quantification. Cells were grown to midexponential phase in batch culture, harvested, and processedfor LC-MS analysis. Peptide data was acquired on an LTQ Orbitrap Velos and raw spectra were quantitatively analyzed with MaxQuantsoftware. All experiments were performed in biological quadruplicates. (B) Only proteins identified and quantified in three out of fourbiological replicates were included in further analysis. The Venn diagram shows protein overlap for these quantifications between differentmutants. (C) The actual numbers of proteins quantified in each biological replicate and final number of proteins used for each mutant areshown (i.e. proteins quantified in at least 3 of 4 biological replicates within each mutant sample). All reported identifications were at 1%peptide and protein FDR.
SSB1 and SSB2 gene function has also been well charac-terised [14, 23, 29]. Although SSB proteins display over 50%identity with SSA chaperones they are functionally distinct,as demonstrated by a series of experiments [27]. Their ac-tivity (unlike SSA proteins) is also mainly confined to theribosome, where they function to facilitate translation andproper protein folding [23, 30] and their transcription is cou-pled with ribosomal proteins [20]. Another notable differencebetween SSA and SSB families is that SSA1 and SSA2 pro-teins have been shown to depolymerise clathrin vesicles invitro, while SSB proteins lack this ability [31]. Similarly toSSA, no obvious phenotypic effects of a single gene dele-tion were observed with SSB1/SSB2 mutants whilst the dou-ble SSB1/SSB2 mutation showed very poor growth at 19�C[23].
Although the phenotypic robustness of the HSP70 familyis fairly well established, these observations usually relate todoubling times or growth assays and are rationalised largelyin term of sequence similarity. However, these studies havenot formally considered the underlying network response to
a deletion at the molecular level. Although the SSA/SSB pairsshare high sequence identity, their sets of interaction partnersare quite different, as shown in Fig. 2, where each chaperonehas its own unique set of interactors. For example, based onthe reported interactome [7], 918 substrate proteins interactexclusively with SSA1 and not SSA2 (Fig. 2A) and 2288 sub-strates interact only with SSB1 and not with SSB2 (Fig. 2B).Similarly, each of the four HSP70 chaperones considered hasunique interactors not associated with the others (Fig. 2C).This relatively modest overlap between paralogue pairs sug-gests that simple sequence identity alone is insufficient toexplain the phenotypes observed. We note this modest over-lap is further reduced when the network is filtered and limitedto 3649 chaperone-substrate pairs present in multiple datasets[32], shown in Fig. 2D–F, a high quality dataset designed toreduce the level of false positives.
Hence, to obtain a global molecular view of the chaperonesystem and its response to perturbations in yeast grown understandard batch condition, we quantified proteome changesin SSA1 and SSB1 mutants using a SILAC approach [33].
C© 2015 The Authors. PROTEOMICS published by Wiley-VCH Verlag GmbH & Co. KGaA, Weinheim. www.proteomics-journal.com

Proteomics 2015, 15, 3126–3139 3129
Figure 2. Overlap between protein interaction partners for SSA1, SSA2, SSB1, and SSB2 members of the HSP70 chaperone family. TheVenn diagrams shown in panels (A)–(C) show the number of substrates that interact with each given HSP70 protein according to [7]from: (A) the SSA family, (B) the SSB family, and (C) all four proteins. Substantial numbers of substrates are unique to the individualchaperones. Panels (D)–(F) show the same data, restricted to a filtered, high-quality subset of the chaperone network [32], constituted by3649 chaperone-substrate interactions.
Protein content ‘per cell’ was considered in addition tochanges in individual protein concentrations. Our resultsshow that despite being major chaperome hubs, the abun-dance of relatively few substrates appears to be affected.The intracellular chaperome network is apparently remark-ably robust to deletions and able to maintain general pro-tein homeostasis in order to accommodate the loss of thetwo HSP70s. Despite this, phenotypic changes are observedin terms of cell size, which are discussed in terms of to-tal protein abundance and the attendant implications fordata normalisation strategies employed to deal with SILACdata of this nature. Finally, we attempt to rationalise the ob-served experimental changes in terms of network theory, us-ing in silico graph theoretical approaches and considerationsof folding workload. The theory lends good support to the ex-perimental observations; namely, that the network compen-sates through increases in node workload as a mechanism tosustain stability in light of deletions of its two biggest hubproteins.
2 Materials and methods
2.1 Yeast sample preparation and SILAC labelling
The wild-type strain BY4742 (Mat �, his3�1, leu2�0,lys2�0, ura3�0) and its isogenic derivatives deleted forSSA1 (YAL005C), SSB1 (YDL229W), and CPR6 (YLR216C)were purchased from the Thermo Yeast Knockout (YKO)
Collection. Strains were grown in Yeast Nitrogen Base (YNB)medium (20 g/L glucose) supplemented with amino acidsarginine (10 mL/L), leucine (20 mL/L), uracil (10 mL/L), his-tidine (3 mL/L) and lysine (10 mL/L) on a shaker (30�C,300 rpm) in biological quadruplicates. The WT strain wasSILAC-labelled by growing in YNB medium supplementedwith ‘light’ amino acids leucine (20 mL/L), uracil (10 mL/L),histidine (3 mL/L) and ‘heavy’ 13C6-lysine (10 mL/L) and13C6-arginine (10 mL/L). Cells were harvested in exponen-tial growth phase at OD600 = 2 (± 10%) by centrifugation at4000 rpm for 10 min at 4�C, aliquoted and stored at –80�Cuntil further use. Cells were counted for each biological repli-cate using a Cellometer cell counter (Cellometer AUTOM10by Nexcelom. http://www.nexcelom.com).
2.2 Protein extraction and digestion
Cell pellet was re-suspended in 800 �L of ice-cold 50 mMNH4HCO3 (with added Roche Complete mini protease in-hibitor 1 tablet/10 mL of buffer) and transferred to a 2 mLscrew cap vial for bead beating. Two hundred fifty microlitersof acid washed glass beads was added and the pellet under-gone 15 × 30 s cycles of bead-beating with 1 min break in be-tween each cycle in order to break the cell wall. The resultinglysate was centrifuged for 10 min at 16 000 rpm (4�C) and thesupernatant removed and stored on ice. In order to maximiseprotein recovery an additional 250 �L 50 mM NH4HCO3
was added and the remaining pellet was re-suspended by
C© 2015 The Authors. PROTEOMICS published by Wiley-VCH Verlag GmbH & Co. KGaA, Weinheim. www.proteomics-journal.com

3130 A. F. Jarnuczak et al. Proteomics 2015, 15, 3126–3139
vortexing. A hot needle was used to pierce a hole in the bot-tom of the vial that was immediately placed inside a 2 mL Ep-pendorf tube and spun down for 10 min at 16 000 rpm (4�C).The wash and cell debris was collected as flow through andcombined with the supernatant from previous step. The exacttotal volume of the combined fractions was determined andthe volume corresponding to 30 million cells was aliquotedinto low bind Eppendorf tubes. This was stored at –80�C un-til further use. Appropriate volume of SILAC-labelled WTstandard was then mixed with the knock-out strains so thatthey contained equal amounts of cells (30 million each).The combined samples were diluted to a final volume of320 �L with 25 mM ammonium bicarbonate. Proteins weredenatured with RapiGestTM detergent (20 �L of 1% w/v,80�C for 10 min), reduced, and alkylated using 60 mM dithio-threitol (60�C, 400 rpm shaking for 10 min) and 180 mMiodoacetamide (incubation at room temperature in thedark for 30 min). Twenty microliters aliquot of 0.2 �g/�Ltrypsin (Sigma, Poole, UK, proteomics grade) solution in50 mM acetic acid was added and sample incubated at 37�C,400 rpm shaking for 4.5 h followed by further addition oftrypsin and overnight incubation. To quench the digestionreaction and hydrolyse the RapiGest detergent 5 �L of 50%TFA was added to the reaction mixture. The detergent wasprecipitated at 37�C, 400 rpm shaking for up to 2 h. Furthervolume of acetonitrile/water (2:1) was added and sampleswere incubated at 4�C for at least 2 h. RapiGest was then re-moved by centrifugation and samples stored at 4�C and usedwithin a week.
2.3 LC-MS/MS analysis
Tryptic digests (2.5 �L, corresponding to roughly 500 ng ofprotein) were loaded onto a C-18 trap column at a flow rate of5 �L/min. Peptides were separated on a 5 �m × 50-mm C-18ACQUITY analytical column using a gradient of 10 to 60%MeCN over 270 min at a flow rate of 5 �L/min. The columnwas coupled to a LTQ Orbitrap Velos via a nanoelectrospraysource. LTQ Orbitrap was operated in data-dependent modein the scan range of m/z 300–1600 with survey scans acquiredin the FTMS at a resolution of 60 000 at m/z 400. Twenty mostintense precursor ions with charge � 2+ from the surveyscan were selected and fragmented by CID. Ions selected forfragmentation were excluded for 60 s before being consideredfor fragmentation again.
2.4 MaxQuant data processing and bioinformatics
analysis
The resulting raw files were processed with MaxQuant soft-ware [34] (version 1.4) according to an earlier described pro-tocol [35]. Briefly, peptides and proteins were identified fromtandem MS spectra using the Andromeda [36] search engine(UniProt S. cerevisiae database, release: 2013_08). The search
parameters relating to identification were set as follows: cleav-ing enzyme trypsin; fixed modifications: carbamidomethyl(cysteine); variable modifications: deamidation (asparagine,glutamine), methionine oxidation and N-terminal acetylation.Mass shift of +6 Da was selected for arginine and lysine asSILAC heavy labels and ‘filter labeled amino acids’ optionin ‘identification’ window was de-selected. Up to two missedcleavages were allowed. Instrument type was set to Orbitrapand peptide mass tolerance was set to 20 ppm while MS/MStolerance was set to 0.5 Da. The false discovery rate (FDR)for peptide spectral matches was set to 1%. Protein level FDRwas also set to 1% and calculated based on a reverse decoydatabase search. Matching between runs was enabled with a1 min match time window and 20 min retention time align-ment window. The re-quantify option was left de-selected.Matching was only performed between biological replicateswithin each experiment. All other MaxQuant parameters wereleft as default.
For relative protein quantification Raw Heavy and LightIntensities reported by MaxQuant were used. Those wereobtained only for unmodified peptides and proteins were re-quired to have at least one unique or ‘razor’ peptide but to bepresent in at least three out of four biological replicates. Thisin effect resulted in the majority of quantified proteins havingtwo or more peptides. The final reported protein SILAC ratiosare the average of replicate measurements.
The Raw Intensities were further processed with R [37] andDanteR package [38]. Intensities were log2 transformed andfor normalisation, a linear regression to the replicates’ meanwas applied to centre the distributions. The significance of anygiven fold changes was calculated using a ANOVA [39] test ata significance level of 0.05. Multiple testing p-value correctionwas applied using the Benjamini & Hochberg false discoveryrate method [40] in DanteR package [38].
2.5 Network generation and topological parameters
analyses
The original network of chaperone interactions in S. cerevisiaewas obtained from Gong et al. [7]. Mutant networks were gen-erated by removing the deleted node and all attendant links.This often resulted in a number of unconnected components(i.e. nodes that were originally interacting solely with thedeleted node). In �SSA1 there were 64 such nodes (2.5%of all SSA1 interactors) and in �SSB1 269 nodes (8.1%).These nodes were retained and included in the analysis.All network edges were treated as undirected and had thesame weight. This resulted in three principal networks; WTwith 4403 nodes and 21946 undirected edges. �SSA1 net-work with 4402 nodes, and 19373 edges, and the �SSB1 net-work with 4402 nodes and 18585 edges. Network and nodeattributes were calculated within Cytoscape [41] using theNetworkAnalyser [42] plug-in. The calculated parameters to-gether with their definitions are listed below:
C© 2015 The Authors. PROTEOMICS published by Wiley-VCH Verlag GmbH & Co. KGaA, Weinheim. www.proteomics-journal.com
Proteomics 2015, 15, 3126–3139 3131
(1) Node degree; degree of node n is the number of edgesincident to n. Node degree distribution shows the numberof nodes with degree k = 1,2 . . .
(2) Node neighbourhood connectivity; while node connectiv-ity is the total number of its neighbours, neighbourhoodconnectivity of node n is the average connectivity of allneighbours of n.
(3) Average clustering coefficient; the clustering coefficientis a measure to what extent nodes in a network tendto cluster together. It also reflects the probability thattwo randomly selected nodes are linked. The clusteringcoefficient is defined as Cn = 2en/(kn(kn − 1)), where kn
is number of neighbours of n and en is the number ofconnected pairs between all neighbours of n.
(4) Betweenness centrality (BC) is an approximation of howcentral a node is in the network and what influence it hasover the transfer of information through the network.In the context of a chaperone network it indicates theworkload placed on given chaperone (see results sectionfor detailed explanation). BC is defined by the followingequation:
BC(p) =∑
s ,t∈Vp �=s �=t
�s t (p)�s t
(N−1)(N−2)2
where V is the set of all nodes (proteins) in the network, s andt are proteins in the network, �s t is the number of shortestpaths between s and t, �s t (p) is the number of shortest pathsthat pass through p and N is the number of connected pro-teins in the network component. A more detailed descriptionof network parameters together with comprehensive refer-ences to literature is also available from [42] and on the webat http://med.bioinf.mpi-inf.mpg.de/netanalyzer/help/2.7/
Subsequent analysis and visualisation of node attributeswas done in R [37]. Briefly, node attribute distribution plotswere generated by plotting the average value of all nodes ata given degree. Statistical comparison of average attributedistributions was done by comparing their empirical cumu-lative distribution functions with a two-sided Kolmogorov–Smirnov test [43]. The K-S statistic assesses the maximum dif-ference between two empirical cumulative distribution func-tions giving the maximum absolute distance between the two(D-value) and a p-value indicating whether they are equal.Finally, network visualisation diagrams were prepared in Cy-toscape.
2.6 Network workload calculations
Following previous studies, chaperone workload was esti-mated as the sum of folding fluxes attributed to each chap-erone. The folding flux (Fc), of a chaperone (c) in terms of
molecules per min per cell, is calculated over all n substratesas follows:
Fc =n∑
i=1
ks yn,i
where ksyn is calculated from known protein concentrationsand protein degradation rates,
ks yn,i = cpci × kdeg ,i
assuming steady state where protein synthesis and degrada-tion rates are equal ( dC PCi
dt = 0 ). To reduce bias from potentialfalse positives we performed these calculations with the high-quality subset of 3649 interactions defined previously [32]rather than the full network. The substrate flux values wherethen divided equally pro rata among each chaperone. Anymissing kdeg values where replaced by the geometric meanacross the entire turnover dataset; this was to ensure themean kdeg of the dataset remained unchanged. Protein con-centrations were taken from PaxDB [13], using those reportedfrom the de Godoy SILAC dataset [44].
3. Results and discussion
3.1 Quantification of protein content in yeast
chaperone mutants (unnormalised SILAC
intensities)
The Saccharomyces wild-type strain was metabolically labelledwith L-arginine13C6 (Arg6) and L-lysine13C6 (Lys6) to createa heavy reference sample for comparison with all the mu-tant strains. After establishing good labelling efficiency (near100% for lysine peptides and above 90% for arginine pep-tides) verified in a separate experiment (Supporting Infor-mation Fig. 1) the heavy and light samples were mixed inequivalent cell ratios. Peptide data were acquired on an Orbi-trap Velos in biological quadruplicates. Protein identificationand quantification was done with MaxQuant software [34] anddownstream data analysis was performed with R [37] and dan-teR package [38]. A total of 1448 proteins were identified andquantified using MaxQuant (at 1% PSM and 1% protein FDR,see Experimental methods). To obtain the best quantitativeresults and improve performance of the statistical analysis,only proteins quantified in at least three out of four biologicalreplicates (MS1 signal present for either light or heavy pep-tide) were selected for further analysis and are reported here(Fig. 1B, C); this amounted to 1267 proteins in the �SSB1mutant, 957 proteins in the �SSA1 mutant and 1058 pro-teins in the �CPR6 mutant. Considering the strict filteringcriteria, a good overlap of proteins was observed across allsamples and a core of 871 proteins was quantified in at least12 experiments (see Fig. 1B).
Mean versus average (MA) plots illustrating the distribu-tion of unnormalised protein fold changes and their average
C© 2015 The Authors. PROTEOMICS published by Wiley-VCH Verlag GmbH & Co. KGaA, Weinheim. www.proteomics-journal.com
3132 A. F. Jarnuczak et al. Proteomics 2015, 15, 3126–3139
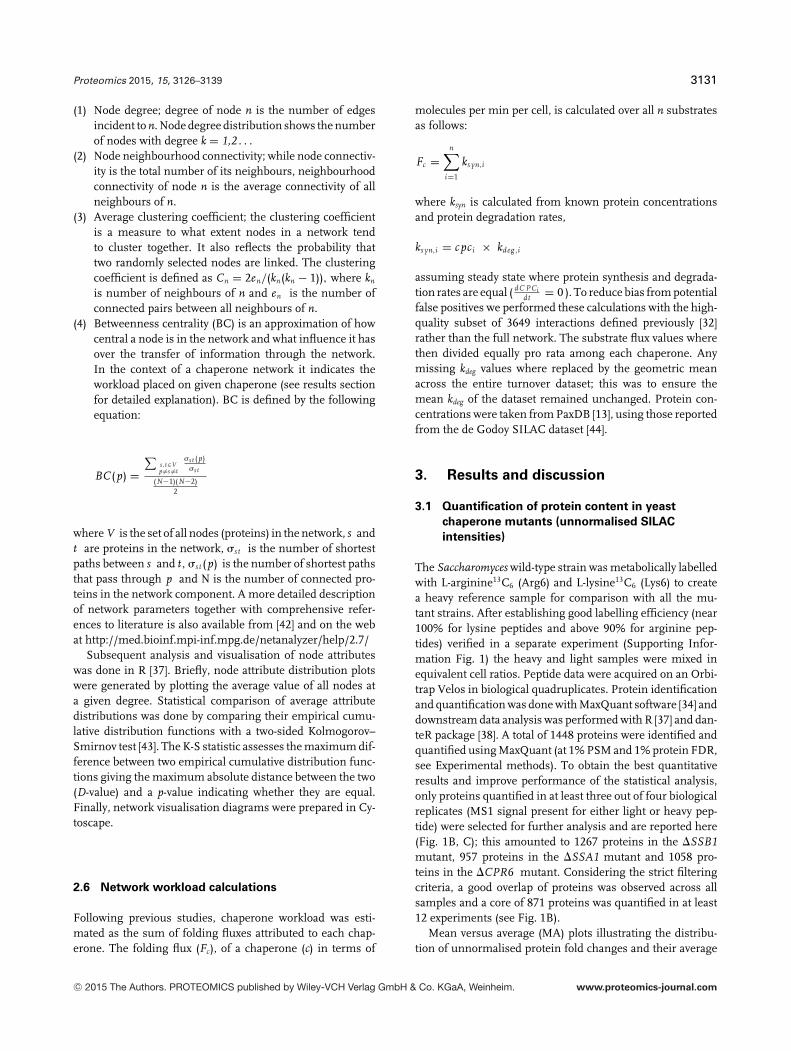
Figure 3. Protein abundance changes in chaperone mutants and cell size effects. (A) Mean versus average (MA) plots of protein abundancelevels derived from MaxQuant raw intensity values in the three different mutant yeast strains. MA plots depict the average proteinintensity (y axis) against the calculated log2 (L/H) protein ratio (x-axis) across four biological replicates. Points below y = 0 representproteins upregulated in wild-type yeast and points above y = 0 are proteins upregulated in a mutant strain. The red line presents a fittednonlinear, locally weighted regression (LOESS) curve, indicates an absence of abundance-dependent bias, though there is a systematicglobal shift (i.e. increase in protein content per cell) in the SSB1 and to a lesser extent in SSA1 mutant; (B) bar chart of cell volumes of yeastmutants based on measurements taken from S. cerevisiae morphological database, and (C), relationship between change in cell volumefor individual mutants and the median fold change in measured heavy/light protein ratios in mutant yeast strains. The median and averagemeasurements of fold changes gave similar results (data not shown).
MS1 signal intensity in the three mutant strains are shown inFig. 3A, highlighting proteins that are considered to be up- ordown-regulated in mutant strains. The fold change depictedin these plots is an average of unnormalised replicate mea-surements (log2(Light Intensity/Heavy Intensity)). The MAplots support assessment of both global expression bias andlocal, non-linear intensity-dependent bias. The systematic bi-ases can be introduced as an artefact of sample preparationor MS data acquisition but could also be due to a real bi-ological difference. Here, the unnormalised protein ratios
show a generally symmetrical distribution with no evidentabundance-dependent bias, as indicated by a fairly uniformlocally weighted regression (LOESS) curve running parallelto the axis. However, the LOESS curve is shifted up and awayfrom the x-axis in the two chaperone mutant strains (SSA1and SSB1) pointing to a global bias in protein abundance.Since the cells were mixed in a 1:1 ratio, such a shift sug-gests an increase in the total protein content in the mutantstrains compared to the wild type. In contrast, negative values(M < 0) would be indicative of a decrease in the overall
C© 2015 The Authors. PROTEOMICS published by Wiley-VCH Verlag GmbH & Co. KGaA, Weinheim. www.proteomics-journal.com
Proteomics 2015, 15, 3126–3139 3133
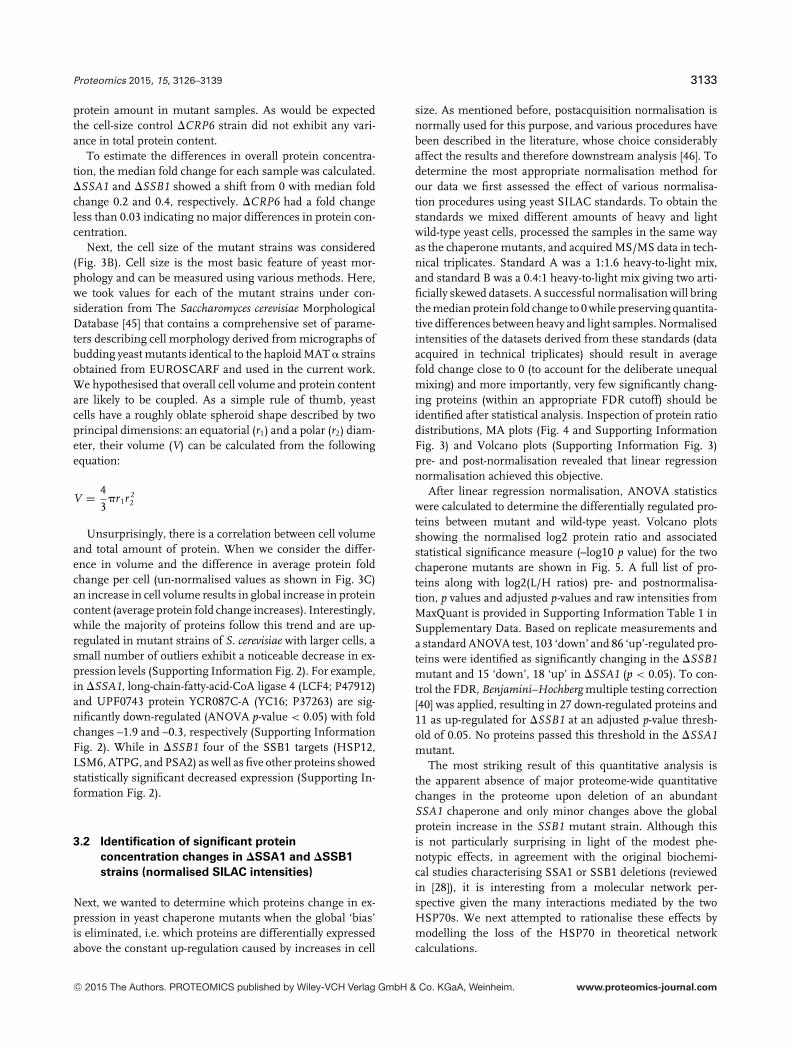
protein amount in mutant samples. As would be expectedthe cell-size control �CRP6 strain did not exhibit any vari-ance in total protein content.
To estimate the differences in overall protein concentra-tion, the median fold change for each sample was calculated.�SSA1 and �SSB1 showed a shift from 0 with median foldchange 0.2 and 0.4, respectively. �CRP6 had a fold changeless than 0.03 indicating no major differences in protein con-centration.
Next, the cell size of the mutant strains was considered(Fig. 3B). Cell size is the most basic feature of yeast mor-phology and can be measured using various methods. Here,we took values for each of the mutant strains under con-sideration from The Saccharomyces cerevisiae MorphologicalDatabase [45] that contains a comprehensive set of parame-ters describing cell morphology derived from micrographs ofbudding yeast mutants identical to the haploid MAT � strainsobtained from EUROSCARF and used in the current work.We hypothesised that overall cell volume and protein contentare likely to be coupled. As a simple rule of thumb, yeastcells have a roughly oblate spheroid shape described by twoprincipal dimensions: an equatorial (r1) and a polar (r2) diam-eter, their volume (V) can be calculated from the followingequation:
V = 4
3�r1r 2
2
Unsurprisingly, there is a correlation between cell volumeand total amount of protein. When we consider the differ-ence in volume and the difference in average protein foldchange per cell (un-normalised values as shown in Fig. 3C)an increase in cell volume results in global increase in proteincontent (average protein fold change increases). Interestingly,while the majority of proteins follow this trend and are up-regulated in mutant strains of S. cerevisiae with larger cells, asmall number of outliers exhibit a noticeable decrease in ex-pression levels (Supporting Information Fig. 2). For example,in �SSA1, long-chain-fatty-acid-CoA ligase 4 (LCF4; P47912)and UPF0743 protein YCR087C-A (YC16; P37263) are sig-nificantly down-regulated (ANOVA p-value < 0.05) with foldchanges –1.9 and –0.3, respectively (Supporting InformationFig. 2). While in �SSB1 four of the SSB1 targets (HSP12,LSM6, ATPG, and PSA2) as well as five other proteins showedstatistically significant decreased expression (Supporting In-formation Fig. 2).
3.2 Identification of significant protein
concentration changes in �SSA1 and �SSB1
strains (normalised SILAC intensities)
Next, we wanted to determine which proteins change in ex-pression in yeast chaperone mutants when the global ‘bias’is eliminated, i.e. which proteins are differentially expressedabove the constant up-regulation caused by increases in cell
size. As mentioned before, postacquisition normalisation isnormally used for this purpose, and various procedures havebeen described in the literature, whose choice considerablyaffect the results and therefore downstream analysis [46]. Todetermine the most appropriate normalisation method forour data we first assessed the effect of various normalisa-tion procedures using yeast SILAC standards. To obtain thestandards we mixed different amounts of heavy and lightwild-type yeast cells, processed the samples in the same wayas the chaperone mutants, and acquired MS/MS data in tech-nical triplicates. Standard A was a 1:1.6 heavy-to-light mix,and standard B was a 0.4:1 heavy-to-light mix giving two arti-ficially skewed datasets. A successful normalisation will bringthe median protein fold change to 0 while preserving quantita-tive differences between heavy and light samples. Normalisedintensities of the datasets derived from these standards (dataacquired in technical triplicates) should result in averagefold change close to 0 (to account for the deliberate unequalmixing) and more importantly, very few significantly chang-ing proteins (within an appropriate FDR cutoff) should beidentified after statistical analysis. Inspection of protein ratiodistributions, MA plots (Fig. 4 and Supporting InformationFig. 3) and Volcano plots (Supporting Information Fig. 3)pre- and post-normalisation revealed that linear regressionnormalisation achieved this objective.
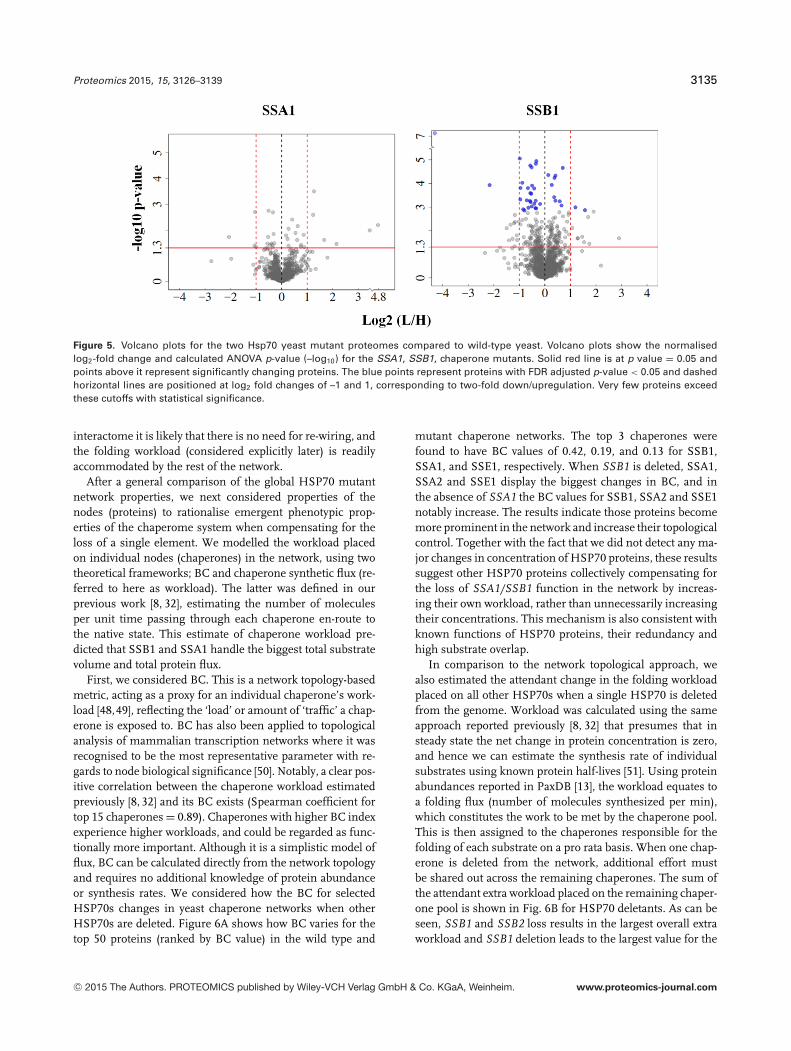
After linear regression normalisation, ANOVA statisticswere calculated to determine the differentially regulated pro-teins between mutant and wild-type yeast. Volcano plotsshowing the normalised log2 protein ratio and associatedstatistical significance measure (–log10 p value) for the twochaperone mutants are shown in Fig. 5. A full list of pro-teins along with log2(L/H ratios) pre- and postnormalisa-tion, p values and adjusted p-values and raw intensities fromMaxQuant is provided in Supporting Information Table 1 inSupplementary Data. Based on replicate measurements anda standard ANOVA test, 103 ‘down’ and 86 ‘up’-regulated pro-teins were identified as significantly changing in the �SSB1mutant and 15 ‘down’, 18 ‘up’ in �SSA1 (p < 0.05). To con-trol the FDR, Benjamini–Hochberg multiple testing correction[40] was applied, resulting in 27 down-regulated proteins and11 as up-regulated for �SSB1 at an adjusted p-value thresh-old of 0.05. No proteins passed this threshold in the �SSA1mutant.
The most striking result of this quantitative analysis isthe apparent absence of major proteome-wide quantitativechanges in the proteome upon deletion of an abundantSSA1 chaperone and only minor changes above the globalprotein increase in the SSB1 mutant strain. Although thisis not particularly surprising in light of the modest phe-notypic effects, in agreement with the original biochemi-cal studies characterising SSA1 or SSB1 deletions (reviewedin [28]), it is interesting from a molecular network per-spective given the many interactions mediated by the twoHSP70s. We next attempted to rationalise these effects bymodelling the loss of the HSP70 in theoretical networkcalculations.
C© 2015 The Authors. PROTEOMICS published by Wiley-VCH Verlag GmbH & Co. KGaA, Weinheim. www.proteomics-journal.com

3134 A. F. Jarnuczak et al. Proteomics 2015, 15, 3126–3139
Figure 4. MA plots showing the effect of lin-ear regression normalisation on SILAC stan-dards of unequal cell (protein) spike in. Twostandards were prepared by mixing ‘heavy’and ‘light’ yeast samples in unequal ratios(1:0.4 and 1:1.6). After acquiring data in tech-nical triplicates, average log2(H/L) ratios areplotted against average intensity, using theraw signal intensity from MaxQuant. Lin-ear regression normalisation is performedby minimising the sum of squares of theerrors (residuals) of the points from pre-dicted straight line through data points (lin-ear least squares fitting). Mean intensity ofall datasets (replicate measurements) wasused as reference set. Normalisation pro-cedure forces the median of each proteinratio distribution to a log2 FC = 0, cor-responding to a ratio of 1:1 protein oncolumn.
3.3 Chaperone mutant network analysis and
workload calculations
In order to maintain cellular protein homeostasis, systemslevel adaptations in the chaperone network are likely to existin the yeast mutants, beyond the simple redundancy expectedfrom the SSA2 and SSB2 paralogues. We explored these po-tential mechanisms to account for the observed biologicalresponse to SSA1 and SSB1 gene deletions by examining thetheoretical network structure in the mutants after removingthe node in question and its attendant edges. We consideredseveral network and node topology metrics [41], includingnetwork degree and node neighbourhood connectivity [47],shown in Supporting Information Fig. 4, and average clus-tering coefficient and BC, shown in Supporting InformationFig. 5.
We observe only modest changes to these metric distri-butions in the mutant networks. In Supporting InformationFig. 4A a small change (p < 0.05, D = 0.24, two sampleKolmogorov–Smirnov test) between neighbourhood connec-tivity distributions is observed when comparing the wild typeand SSB1 mutant networks, but this is the only significant dif-ference. Hence, the network modelling suggests that, overall,
the global chaperome is relatively unaffected by SSA1 dele-tion and only modestly so by SSB1 deletion.
At first glance, this might be surprising when consideringnetwork theory since these two HSP70s are major hubs ofthe chaperone network. However, despite this, even whendeleting such a protein from a densely connected network,only a relatively limited number of nodes are affected. Othernodes retain their links and overall only a small average ef-fect is observed and as a result, the chaperome maintains itscharacteristic scale-free topology. The network is thereforerobust in a topological sense and does not break down due toa single deletion. This is in agreement with our proteomicsdata where few significant changes in protein concentrationare observed. Here, network topology as a whole providesa rationale, although not an immediate explanation for theexperimental observations. All this is underlined by certainassumptions, the most important being that no major net-work re-wiring takes place upon deletion. This is reasonable,since most SSA1/SSB1 interacting proteins are already linkedto other HSP70 chaperones and, as noted before, not just theSSA2/SSB2 paralogues. In the case of SSA1 over 97% of itsinteractors are also linked to other chaperones and for SSB1that number is 92%. In the light of this redundancy in the
C© 2015 The Authors. PROTEOMICS published by Wiley-VCH Verlag GmbH & Co. KGaA, Weinheim. www.proteomics-journal.com
Proteomics 2015, 15, 3126–3139 3135
Figure 5. Volcano plots for the two Hsp70 yeast mutant proteomes compared to wild-type yeast. Volcano plots show the normalisedlog2-fold change and calculated ANOVA p-value (–log10) for the SSA1, SSB1, chaperone mutants. Solid red line is at p value = 0.05 andpoints above it represent significantly changing proteins. The blue points represent proteins with FDR adjusted p-value < 0.05 and dashedhorizontal lines are positioned at log2 fold changes of –1 and 1, corresponding to two-fold down/upregulation. Very few proteins exceedthese cutoffs with statistical significance.
interactome it is likely that there is no need for re-wiring, andthe folding workload (considered explicitly later) is readilyaccommodated by the rest of the network.
After a general comparison of the global HSP70 mutantnetwork properties, we next considered properties of thenodes (proteins) to rationalise emergent phenotypic prop-erties of the chaperome system when compensating for theloss of a single element. We modelled the workload placedon individual nodes (chaperones) in the network, using twotheoretical frameworks; BC and chaperone synthetic flux (re-ferred to here as workload). The latter was defined in ourprevious work [8, 32], estimating the number of moleculesper unit time passing through each chaperone en-route tothe native state. This estimate of chaperone workload pre-dicted that SSB1 and SSA1 handle the biggest total substratevolume and total protein flux.
First, we considered BC. This is a network topology-basedmetric, acting as a proxy for an individual chaperone’s work-load [48,49], reflecting the ‘load’ or amount of ‘traffic’ a chap-erone is exposed to. BC has also been applied to topologicalanalysis of mammalian transcription networks where it wasrecognised to be the most representative parameter with re-gards to node biological significance [50]. Notably, a clear pos-itive correlation between the chaperone workload estimatedpreviously [8, 32] and its BC exists (Spearman coefficient fortop 15 chaperones = 0.89). Chaperones with higher BC indexexperience higher workloads, and could be regarded as func-tionally more important. Although it is a simplistic model offlux, BC can be calculated directly from the network topologyand requires no additional knowledge of protein abundanceor synthesis rates. We considered how the BC for selectedHSP70s changes in yeast chaperone networks when otherHSP70s are deleted. Figure 6A shows how BC varies for thetop 50 proteins (ranked by BC value) in the wild type and
mutant chaperone networks. The top 3 chaperones werefound to have BC values of 0.42, 0.19, and 0.13 for SSB1,SSA1, and SSE1, respectively. When SSB1 is deleted, SSA1,SSA2 and SSE1 display the biggest changes in BC, and inthe absence of SSA1 the BC values for SSB1, SSA2 and SSE1notably increase. The results indicate those proteins becomemore prominent in the network and increase their topologicalcontrol. Together with the fact that we did not detect any ma-jor changes in concentration of HSP70 proteins, these resultssuggest other HSP70 proteins collectively compensating forthe loss of SSA1/SSB1 function in the network by increas-ing their own workload, rather than unnecessarily increasingtheir concentrations. This mechanism is also consistent withknown functions of HSP70 proteins, their redundancy andhigh substrate overlap.
In comparison to the network topological approach, wealso estimated the attendant change in the folding workloadplaced on all other HSP70s when a single HSP70 is deletedfrom the genome. Workload was calculated using the sameapproach reported previously [8, 32] that presumes that insteady state the net change in protein concentration is zero,and hence we can estimate the synthesis rate of individualsubstrates using known protein half-lives [51]. Using proteinabundances reported in PaxDB [13], the workload equates toa folding flux (number of molecules synthesized per min),which constitutes the work to be met by the chaperone pool.This is then assigned to the chaperones responsible for thefolding of each substrate on a pro rata basis. When one chap-erone is deleted from the network, additional effort mustbe shared out across the remaining chaperones. The sum ofthe attendant extra workload placed on the remaining chaper-one pool is shown in Fig. 6B for HSP70 deletants. As can beseen, SSB1 and SSB2 loss results in the largest overall extraworkload and SSB1 deletion leads to the largest value for the
C© 2015 The Authors. PROTEOMICS published by Wiley-VCH Verlag GmbH & Co. KGaA, Weinheim. www.proteomics-journal.com

3136 A. F. Jarnuczak et al. Proteomics 2015, 15, 3126–3139
Figure 6. Betweeness centralityand chaperone workload for mu-tant strains. In (A), the BC val-ues for the top 50 proteins in thewild-type network are shown aswell as their corresponding val-ues in all theoretical HSP70 chap-erone mutant networks. Each col-umn in the figure correspondsto a different mutant. The left-hand y-axis gives the values forBC and right axis shows thenames of top 7 (of 50) proteinsranked by BC. Large changes inBC for the top 7 proteins arevisible in SSA1 and SSB1 mu-tant networks. (B) Barchart illus-trating the total additional work-load placed on other chaperonesin the absence of a given HSP70protein from the theoretical net-work. The estimated additionalworkload is expressed as copiesper cell per minute (cpc/min) andsplit between HSP70s and otherchaperones, when accommodat-ing the absence of a given proteinlisted on the y-axis. In panels (C)and (D), the additional workloadsplit placed on the other HSP70sfor the two chaperones consid-ered here is shown as a pie chart,for the deletions of SSA1 andSSB1 in (C) and (D), respectively.
other HSP70 chaperones, much larger than that attributableto a SSA1 deletion. This is consistent with the observed per-turbations in cell volume and differential protein expressionin the two mutants, where SSB1 elicits the greater effect,consistent with the additional stress we predict is placed onthe chaperone network. The additional workload to be ac-
commodated by specific HSP70s is also shown in Fig. 6c,dfor the two mutants considered experimentally. Interestingly,the model predicts that proteins other than the closest par-alogue picks up the most slack; e.g. SSB1/2 for the SSA1mutant and SSA4/SSC1 for the SSB1 mutant, though SSB2is also important in the latter case.
C© 2015 The Authors. PROTEOMICS published by Wiley-VCH Verlag GmbH & Co. KGaA, Weinheim. www.proteomics-journal.com

Proteomics 2015, 15, 3126–3139 3137
The data demonstrate the utility of the workload model topredict the major effect observed on SSB1 deletion. However,it is also notable that there is not a perfect agreement betweenthe workload and BC calculations, as the latter predicts arelatively modest affect on the HSP70 complement whenSSB2 and SSA4 are deleted, but the workload calculationspredict substantial extra work.
4 Concluding remarks
The strategy adopted here illustrates how quantitative pro-teomics, coupled to simple network modelling, can be usedto observed changes in substrate protein levels in the chap-erome and explain emergent properties of the system. Theproteomics has revealed differences in total protein contentbetween wild type and mutant strains for two exemplars, bothat the global level (total cellular protein content) and local level(relative changes in individual protein concentrations). Theglobal changes in protein amount can clearly be attributedto increased cell size of the mutant strains that we show isindeed the case from a relationship between cell size increaseand normalisation scaling factor (Fig. 3C). However, interest-ingly, as the cell size increases, the relative protein concen-tration (for the majority of proteins) does not change. Theseresults have implications for normalisation of proteomics ingeneral, where users should consider their data carefully.Most normalisation strategies presume that there is no globalchange in the overall distribution of protein abundances, anddetect statistically significant differences on this basis. How-ever, for many reported yeast deletant strains there is clearlya global shift in protein amount, which in turn is placingadditional demands on the proteostatic machinery of the cell.
The network analyses performed here illustrates their po-tential to describe and rationalise complex systems properties.Comparisons of network topology between WT and mutantstrains show a relatively modest impact on most topologi-cal parameters, and hence we presume the networks do notchange a lot. This is an interesting result as it is contraryto naı̈ve expectation from a network perspective, which pre-sumes that deletion of major hub proteins is deleterious andin some cases lethal. As is well known by yeast geneticists,this is clearly not the case for SSA1 and SSB1 [27], despite be-ing the two biggest hubs identified by Gong et al. [7], and theirdeletion does not lead to apparent dramatic changes in rela-tive protein concentrations. In fact, two other HSP70 chaper-ones (SSC1 and KAR2) with fewer network connections areconsidered to be essential according to SGD [52]. These gen-eral conclusions are matched by our workload calculations,which suggest that the additional workload caused by a dele-tion is buffered by the capacity remaining in the network.This functional redundancy in the yeast chaperone networkmay lead to changes in absolute chaperone levels that we werenot able to observe via shotgun proteomic strategies. We in-tend to examine these effects in more detail, as well as underenvironmental stress, with targeted approaches. In parallel,
further sophistications to the model can accommodate morerealistic features such as sub-cellular compartmentalisationto improve its predictive value.
The authors acknowledge support from the Biotechnology andBiological Sciences Research Council in the form of a studentshipto A.J. as part of the Systems Biology Doctorial Training Centre,and grant support to S.J.H, C.M.G., C.E.E. and R.J.B. in theform of a LoLa grant (BB/G009112/1, BB/G009058/1).
The authors have declared no conflict of interest.
5 References
[1] Kim, Y. E., Hipp, M. S., Bracher, A., Hayer-Hartl, M., Hartl,F. U., Molecular chaperone functions in protein folding andproteostasis. Ann. Rev. Biochem. 2013, 82, 323–355.
[2] Vabulas, R. M., Raychaudhuri, S., Hayer-Hartl, M., Hartl, F.U., Protein folding in the cytoplasm and the heat shockresponse. Cold Spring Harbor PerspectivesBiol. 2010, 2,a004390.
[3] Morano, K. A., Grant, C. M., Moye-Rowley, W. S., The re-sponse to heat shock and oxidative stress in Saccharomycescerevisiae. Genetics 2012, 190, 1157–1195.
[4] Hartl, F. U., Hayer-Hartl, M., Protein folding—molecular chap-erones in the cytosol: from nascent chain to folded protein.Science 2002, 295, 1852–1858.
[5] Ferrell, J. E., Jr., Q&A: systems biology. J. Biol. 2009, 8, 2–2.
[6] Bhalla, U. S., Iyengar, R., Emergent properties of networks ofbiological signaling pathways. Science 1999, 283, 381–387.
[7] Gong, Y., Kakihara, Y., Krogan, N., Greenblatt, J. et al., Anatlas of chaperone-protein interactions in Saccharomycescerevisiae: implications to protein folding pathways in thecell. Mol. Syst. Biol. 2009, 5, 275.
[8] Lawless, C., Hubbard, S. J., in: Houry, W. A. (Ed.), The Molec-ular Chaperones Interaction Networks in Protein Folding andDegradation, Springer 2014.
[9] Bogumil, D., Landan, G., Ilhan, J., Dagan, T., Chaperonesdivide yeast proteins into classes of expression level andevolutionary rate. Genome Biol. Evol. 2012, 4, 618–625.
[10] Saibil, H., Chaperone machines for protein folding, unfoldingand disaggregation. Nat. Rev. Mol. Cell Biol. 2013, 14, 630–642.
[11] Hartl, F. U., Bracher, A., Hayer-Hartl, M., Molecular chaper-ones in protein folding and proteostasis. Nature 2011, 475,324–332.
[12] Kampinga, H. H., Craig, E. A., ‘The HSP70 chaperone machin-ery: J proteins as drivers of functional specificity. Nat. Rev.Mol. Cell Biol. 2010, 11, 579–592.
[13] Wang, M., Weiss, M., Simonovic, M., Haertinger, G. et al.,PaxDb, a database of protein abundance averages across allthree domains of life. Mol. Cell. Proteomics 2012, 11, 492–500.
[14] Boorstein, W. R., Ziegelhoffer, T., Craig, E. A., Molecular evo-lution of the Hsp70 multigene family. J. Mol. Evol. 1994, 38,1–17.
C© 2015 The Authors. PROTEOMICS published by Wiley-VCH Verlag GmbH & Co. KGaA, Weinheim. www.proteomics-journal.com
3138 A. F. Jarnuczak et al. Proteomics 2015, 15, 3126–3139
[15] Kominek, J., Marszalek, J., Neuveglise, C., Craig, E. A.,Williams, B. L., The complex evolutionary dynamics ofHsp70s: a genomic and functional perspective. Genome Biol.Evol. 2013, 5, 2460–2477.
[16] Daugaard, M., Rohde, M., Jaattela, M., The heat shock pro-tein 70 family: highly homologous proteins with overlappingand distinct functions. Febs. Lett. 2007, 581, 3702–3710.
[17] Wernerwashburne, M., Stone, D. E., Craig, E. A., Complexinteractions among members of an essential subfamily ofHsp70 genes in Saccharomyces cerevisiae. Mol. Cell. Biol.1987, 7, 2568–2577.
[18] Becker, J., Craig, E. A., Heat-shock proteins as molecularchaperones. Eur. J. Biochem. 1994, 219, 11–23.
[19] Pfund, C., Huang, P., Lopez-Hoyo, N., Craig, E. A., Divergentfunctional properties of the ribosome-associated molecularchaperone Ssb compared with other Hsp70s. Mol. Biol. Cell2001, 12, 3773–3782.
[20] Lopez, N., Halladay, J., Walter, W., Craig, E. A., SSB, encodinga ribosome-associated chaperone, is coordinately regulatedwith ribosomal protein genes. J. Bacteriol. 1999, 181, 3136–3143.
[21] Nelson, R. J., Ziegelhoffer, T., Nicolet, C., Wernerwashburne,M., Craig, E. A., The translation machinery and 70 KD heat-shock protein cooperate in protein-synthesis. Cell 1992, 71,97–105.
[22] Craig, E. A., Jacobsen, K., Mutations of the heat inducible70-kilodalton genes of yeast confer temperature sensitivegrowth. Cell 1984, 38, 841–849.
[23] Craig, E. A., Jacobsen, K., Mutations in cognate genes of Sac-charomyces cerevisiae hsp70 result in reduced growth-ratesat low-temperatures. Mol. Cell. Biol. 1985, 5, 3517–3524.
[24] Young, M. R., Craig, E. A., Saccharomyces cerevisiae Hsp70heat-shock elements are functionally distinct. Mol. Cell. Biol.1993, 13, 5637–5646.
[25] Bukau, B., Horwich, A. L., The Hsp70 and Hsp60 chaperonemachines. Cell 1998, 92, 351–366.
[26] Ellwood, M. S., Craig, E. A., Differential regulation of the70K heat-shock gene and related genes in Saccharomycescerevisiae. Mol. Cell. Biol. 1984, 4, 1454–1459.
[27] Craig, E. A., Ziegelhoffer, T., Nelson, J., Laloraya, S., andHalladay, J., Cold Spring Harbor Symposia on QuantitativeBiology: Protein Kinesis: The Dynamics of Protein Traffick-ing and Stability, Cold Spring Harbor Laboratory, NY 1995,pp. 441–449.
[28] Kabani, M., Martineau, C. N., Multiple Hsp70 isoforms inthe eukaryotic cytosol: mere redundancy or functional speci-ficity? Curr. Genomics 2008, 9, 338–348.
[29] Ingolia, T. D., Slater, M. R., Craig, E. A., Saccharomyces cere-visiae contains a complex multigene family related to themajor heat shock-inducible gene of drosophila. Mol. Cell.Biol. 1982, 2, 1388–1398.
[30] Pfund, C., Lopez-Hoyo, N., Ziegelhoffer, T., Schilke, B. A.et al., The molecular chaperone Ssb from Saccharomycescerevisiae is a component of the ribosome nascent chaincomplex. Embo. J. 1998, 17, 3981–3989.
[31] Gao, B. C., Biosca, J., Craig, E. A., Greene, L. E., Eisenberg,E., Uncoating of coated vesicles by yeast hsp70 proteins. J.Biol. Chem. 1991, 266, 19565–19571.
[32] Philip Brownridge, C. L., Payapilly, A. B., Lanthaler, K., Hol-man, S. W. et al. Quantitative analysis of chaperone networkthroughput in budding yeast. Proteomics 2013, 13, 1276–1291.
[33] Ong, S. E., Blagoev, B., Kratchmarova, I., Kristensen, D. B.et al., Stable isotope labeling by amino acids in cell culture,SILAC, as a simple and accurate approach to expression pro-teomics. Mol. Cell. Proteomics 2002, 1, 376–386.
[34] Cox, J., Mann, M., MaxQuant enables high peptide identi-fication rates, individualized p.p.b.-range mass accuraciesand proteome-wide protein quantification. Nat. Biotechnol.2008, 26, 1367–1372.
[35] Cox, J., Matic, I., Hilger, M., Nagaraj, N. et al., A practicalguide to the MaxQuant computational platform for SILAC-based quantitative proteomics. Nat. Protocols 2009, 4, 698–705.
[36] Cox, J., Neuhauser, N., Michalski, A., Scheltema, R. A. et al.,Andromeda: a peptide search engine integrated into theMaxQuant environment. J. Proteome Res. 2011, 10, 1794–1805.
[37] RDevelopmentCoreTeam, R: A Language and Environmentfor Statistical Computing 2013.
[38] Taverner, T., Karpievitch, Y. V., Polpitiya, A. D., Brown, J. N.et al., DanteR: an extensible R-based tool for quantitativeanalysis of -omics data. Bioinformatics 2012, 28, 2404–2406.
[39] Chambers, J. M., in: Hastie, J. M. C. a. T. J. (Ed.), StatisticalModels in S, Wadsworth & Brooks/Cole, Pacific Grove, CA1992.
[40] Noble, W. S., How does multiple testing correction work?Nat. Biotechnol. 2009, 27, 1135–1137.
[41] Shannon, P., Markiel, A., Ozier, O., Baliga, N. S. et al., Cy-toscape: a software environment for integrated models ofbiomolecular interaction networks. Genome Res. 2003, 13,2498–2504.
[42] Assenov, Y., Ramirez, F., Schelhorn, S.-E., Lengauer, T., Al-brecht, M., Computing topological parameters of biologicalnetworks. Bioinformatics 2008, 24, 282–284.
[43] George Marsaglia, W. W. T., Wang, J., Evaluating Kol-mogorov’s distribution. J. Stat. Software 2003, 8, 1–4.
[44] deGodoy, L. M. F., Olsen, J. V., Cox, J., Nielsen, M. L. et al.,Comprehensive mass-spectrometry-based proteome quan-tification of haploid versus diploid yeast. Nature 2008, 455,U1251–U1260.
[45] Saito, T. L., Ohtani, M., Sawai, H., Sano, F. et al., SCMD:Saccharomyces cerevisiae morphological database. NucleicAcids Res. 2004, 32, D319–D322.
[46] Kultima, K., Nilsson, A., Scholz, B., Rossbach, U. L. et al.,Development and evaluation of normalization methods forlabel-free relative quantification of endogenous peptides.Mol. Cell. Proteomics 2009, 8, 2285–2295.
[47] Maslov, S., Sneppen, K., Specificity and stability in topologyof protein networks. Science 2002, 296, 910–913.
C© 2015 The Authors. PROTEOMICS published by Wiley-VCH Verlag GmbH & Co. KGaA, Weinheim. www.proteomics-journal.com
Proteomics 2015, 15, 3126–3139 3139
[48] Freeman, L. C., Set of measures of centrality based on be-tweenness. Sociometry 1977, 40, 35–41.
[49] Brandes, U., A faster algorithm for betweenness centrality.J. Math. Sociol. 2001, 25, 163–177.
[50] Potapov, A. P., Voss, N., Sasse, N., Wingender, E., Topologyof mammalian transcription networks. Genome Inform. Int.Conf. Genome Informatics 2005, 16, 270–278.
[51] Belle, A., Tanay, A., Bitincka, L., Shamir, R., O’Shea, E. K.,Quantification of protein half-lives in the budding yeast pro-teome. Proc. Nat. Acad. Sci. USA 2006, 103, 13004–13009.
[52] Cherry, J. M., Hong, E. L., Amundsen, C., Balakrishnan, R.et al., Saccharomyces genome database: the genomics re-source of budding yeast. Nucleic Acids Res. 2012, 40, D700–D705.
C© 2015 The Authors. PROTEOMICS published by Wiley-VCH Verlag GmbH & Co. KGaA, Weinheim. www.proteomics-journal.com