
Prediction of the epidemic trends of COVID-19 by the ...
19
Prediction of the epidemic trends of COVID-19 by the improved dynamic SEIR model Jingyi Jiang School of Statistics, Beijing Normal University, Beijing 100875, P. R. China Lei Jiang Department of Emergency, Changhai Hospital, Naval Medical University, Shanghai 200433, P. R. China Gaorong Li ( [email protected] ) School of Statistics, Beijing Normal University, Beijing 100875 Jingxuan Luo School of Statistics, Beijing Normal University, Beijing 100875, P. R. China Meitang Wang ( [email protected] ) Department of Emergency, Changhai Hospital, Naval Medical University, Shanghai 200433, P. R. China Haizhou Xu Department of Emergency, Changhai Hospital, Naval Medical University, Shanghai 200433, P. R. China Research Article Keywords: COVID-19, Improved dynamic SEIR model, Infection prevention and control, Epidemic trend, Expected peak date Posted Date: May 11th, 2020 DOI: https://doi.org/10.21203/rs.3.rs-28192/v1 License: This work is licensed under a Creative Commons Attribution 4.0 International License. Read Full License
Transcript of Prediction of the epidemic trends of COVID-19 by the ...

Prediction of the epidemic trends of COVID-19 bythe improved dynamic SEIR modelJingyi Jiang
School of Statistics, Beijing Normal University, Beijing 100875, P. R. ChinaLei Jiang
Department of Emergency, Changhai Hospital, Naval Medical University, Shanghai 200433, P. R. ChinaGaorong Li ( [email protected] )
School of Statistics, Beijing Normal University, Beijing 100875Jingxuan Luo
School of Statistics, Beijing Normal University, Beijing 100875, P. R. ChinaMeitang Wang ( [email protected] )
Department of Emergency, Changhai Hospital, Naval Medical University, Shanghai 200433, P. R. ChinaHaizhou Xu
Department of Emergency, Changhai Hospital, Naval Medical University, Shanghai 200433, P. R. China
Research Article
Keywords: COVID-19, Improved dynamic SEIR model, Infection prevention and control, Epidemic trend,Expected peak date
Posted Date: May 11th, 2020
DOI: https://doi.org/10.21203/rs.3.rs-28192/v1
License: This work is licensed under a Creative Commons Attribution 4.0 International License. Read Full License

The type of study conducted: original
Title: Prediction of the epidemic trends of COVID-19 by the improved dynamic SEIR model
Running Title: Prediction of COVID-19 by ID-SEIR model
Author: Jingyi Jiang1, MSc
Lei Jiang2, MD
Gaorong Li1*
, PhD
Jingxuan Luo1, MSc
Meitang Wang2*
, MD, PhD
Haizhou Xu2, MD
Junhua Zhang3, PhD
Address: 1School of Statistics, Beijing Normal University, Beijing 100875, P. R. China
2Department of Emergency, Changhai Hospital, Naval Medical University, Shanghai 200433, P. R.
China 3College of Mechanical Engineering, Beijing Information Science and Technology University, Beijing
100192, P. R. China
Corresponding Author:
Gaorong Li, School of Statistics, Beijing Normal University, Beijing 100875, P. R. China (Email:
Meitang Wang, Department of Emergency, Changhai Hospital, Naval Medical University, Shanghai
200433, P. R. China (Tel: 86-21-81873891. Fax: 86-21-81873893. Email: [email protected]).
Funding: The National Natural Science Foundation of China (Grant numbers: 11871001, 81570073
and 11971001), the Beijing Natural Science Foundation (Grant number: 1182003) and the Fundamental
Research Funds for the Central Universities (Grant number: 2019NTSS18).
Author contributions: GR Li and MT Wang contributed equally to this work, and provided the
project administration and designed the study framework; JY Jiang and JX Luo provided the modeling
and data analysis; L Jiang, HZ Xu and JH Zhang collected and assembled data; GR Li and MT Wang
contributed the writing, review and editing for this paper.

1
Prediction of the epidemic trends of COVID-19 by the improved dynamic SEIR
model
Jingyi Jiang, Lei Jiang, Gaorong Li, Jingxuan Luo, Meitang Wang, Haizhou Xu and Junhua Zhang
Abstract
The outbreak of 2019 novel coronavirus disease (COVID-19) has become a public health emergency of
international concern. The purpose of this study was to propose an improved dynamic SEIR (ID-SEIR)
model to predict the epidemic trends of novel COVID-19. Firstly, we obtain the values of parameters in
ID-SEIR model by using the epidemic data of Wuhan as the training sample. Secondly, we predict the
epidemic trends of COVID-19 for the three most serious USA, New York and Italy with our proposed
ID-SEIR model, and we can apply the proposed method to predict the epidemic trends of other
countries and areas. Finally, we find that the proposed ID-SEIR model established in this paper has
strong reliability, which can reasonably reflect the changes in national policies and public behavior
during the epidemic. Also, this model can make predictions in line with the actual development of the
epidemic and provide reference for infection prevention and control.
Keywords: COVID-19; Improved dynamic SEIR model; Infection prevention and control;
Epidemic trend; Expected peak date.
Introduction
In later December 2019, an outbreak of the novel coronavirus (2019-nCoV) pneumonia began in
Wuhan (Hubei, China), and spread throughout the country rapidly. Further, 2019-nCoV pneumonia had
been renamed as 2019 novel coronavirus disease (COVID-19) on February 12, 2020 officially. The
COVID-19 has become a pandemic, and it has spread to more than 190 countries, areas, or territories
beyond China until now. The accumulative 84,341 confirmed cases and 4,643 deaths were reported in
China1, and 2,725,984 confirmed cases with 189,158 death were reported in other countries
2 (including
United States of America (USA), Spain, Italy, France, Germany and United Kingdom as the top six
countries) on April 26, 2020. WHO declared the COVID-19 outbreak as a public health emergency of
international concern on Jan 30, 20203.
To control the spread of the COVID-19, China took unprecedented nationwide interventions on
January 23, 2020. After more than two months of forceful infection prevention and control, China has
basically curbed the spread of local spreading and the new confirmed cases, and new confirmed cases
are mainly from abroad. China has accumulated rich experience to overcome the COVID-19, and Tian
et al. [6] also revealed that the national emergency response appears to have delayed the growth and
limited the size of COVID-19 epidemic in China. However, the epidemic situation in the United States
and European countries is not going well. The cumulative confirmed cases in the United States, Italy
and Spain has exceeded China, respectively.
So far, the characteristics of the virus, as well as the characteristics of patients are gradually known
as the researchers explore COVID-19 constantly. The main mode of transmission of COVID-19 is
1 The data is from the National Health Commission of the People's Republic of China in http://www.nhc.gov.cn. 2 The data is from the WHO in https://www.who.int. 3 World Health Organization. Coronavirus disease 2019 (COVID-19) situation report-47, 2020.

2
person to person spread by respiratory droplets. Therefore, the isolation of patients and susceptible
groups, reducing contact opportunity are the effective ways to suppress the spread of the virus. Li et al.
[3] reveals the patients with the COVID-19 have a relatively long incubation period at an average of
5.2 days while it has the ability to spread the virus, which increases the difficulty of infection control.
According to the symptom analysis of some patients in the early stage in China, most of patients
were ordinary type and 25.5% was severe type, please see the details in Yang et al. [8]. Since the
outbreak, many researchers have developed the dynamic models to analyze and predict the trend of
pandemic changes. For example, Liu et al. [4] proposed a segmented Logistic model to describe
infection, death and cure of COVID-19. Tang et al. [6] proposed a deterministic
“Susceptible-Exposed-Infectious-Recovered” (SEIR) model to show the transmission dynamics of the
novel coronavirus and assess the impact of public health interventions on infection. Yang et al. [9]
proposed the modified SEIR model to predict the COVID-19 epidemic peaks and sizes. Wei et al. [7]
proposed the SEIR+CAQ dynamic model to fit and forecast the trend of COVID-19. Li et al. [3]
proposed a stochastic transmission model to calculate the probability that newly introduced cases might
generate outbreaks in other areas. Zhang et al. [10] estimated the trends in the demographic
characteristics of cases and key time-to-event intervals, and estimated the dynamics of the net
reproduction number at the provincial level using the Bayesian method.
Due to the continuous adjustment of national infection prevention and control measures, however,
the previous references ignored the adjustment of infection prevention and control measures and the
improvement of treatment effect. Therefore, considering the characteristics of novel COVID-19, the
type of infected population, the upgrade of infection prevention and control measures and the
improvement of treatment, the present paper proposes an improved dynamic SEIR (ID-SEIR) model
according to dynamic parameters that change with time. We first fit the ID-SEIR model by using the
real epidemic data of Wuhan City, China, then aim to predict the epidemic moving trend of novel
COVID-19 based on the epidemic data of the USA, New York, Italy and the current situation. Thus, we
will provide the references for infection prevention and control.
Improved dynamic SEIR (ID-SEIR) model
The SEIR model has become an important tool for studying the epidemics, such as Aron and Schwartz
[1], Li et al. [2], Tang et al. [5], Wei et al. [7], Yang et al. [9], and among many others.
For the traditional SEIR model, the total population N S E I R , where S denotes the
susceptible population, E denotes the exposed population, I denotes the infected population and R
denotes the removed or recovered population. However, the epidemic situation of the novel COVID-19
is more complicated, then the epidemic trends of COVID-19 cannot be effectively predicted by using
the traditional SEIR model directly. In order to solve this problem, we propose an improved dynamic
SEIR (ID-SEIR) model by considering the susceptible population S t , quarantined susceptible
population S tq , exposed population E t , quarantined exposed population qE t , asymptomatic
infections A t , infected population I t with different severity, diagnosed infected population qI t ,
cured population R t and dead population D t after infection with COVID-19 at time t , where
1 2 3I t I t I t I t . 1I t denotes the mild infected population, who has been infected with mild
symptoms but not yet diagnosed. 2I t denotes the ordinary infected population, who has been
infected with ordinary symptoms but not yet diagnosed. 3I t denotes the severe infected population,
who has been infected with severe symptoms but not yet diagnosed. To explain the ID-SEIR model
clearly, we put forward the structural diagram of the ID-SEIR model for studying the novel COVID-19

3
in Fig. 1.
Fig. 1 The structural diagram of the improved dynamic SEIR (ID-SEIR) model adopted in the study for
the novel COVID-19
Since the diagnosed infected population qI t has been quarantined, they are not able to contract the
susceptible population. Thus, there are five types of infectious population at any time t , including
E t , A t , iI t , where 1,2,3i . Then the total infectious population is E t I t A t , where
1 2 3I t I t I t I t . We assume that the susceptible population S t is not necessarily infected in
every contact with infectious population, then we let denote the probability of being infected in
each contact, where 0 1. Thus, the number of the infections at time t is S t E t I t A t ,
and the number of population who has been in contact with infectious population but not infected is
1S t E t I t A t , where the definitions of and can be found in Table1.
For the susceptible population who has been in contact with infectious population, whether they are
infected or not, they must be quarantined. Assume that the probability of the susceptible population
being tracked is , where 0 1 , then the number of quarantined susceptible population is
1S t E t I t A t at time t, and the number of exposed infections is
1 S t E t I t A t .
Assume that some exposed infections will be quarantined, and the probability of exposed infections
being tracked is ,where 0 1, then the number of quarantined exposed infections is
S t E t I t A t E t at time .t Assume that the quarantined susceptible population will
be released after a certain period of time, and the rate of release is , then the number of susceptible
population is qS t at time .t
From the above discussions, we can obtain the following equations for the susceptible population
S t and the quarantined susceptible population qS t .
1
1
,
1 .
q
q
q
dS tE t I t A t S t
dt
E t I t A t S t
E t I t A t S t S t
dS tE t I t A t S t S t
dt
After a period of time, the exposed population will be diagnosed, and assume that the proportion of
symptomatic infections among all infected population is . Thus, the number of asymptomatic
infections is 1 E t at time t , the number of infections is E t at time ,t and the
quarantined infections will increase by qE t , where is the incubation rate. Then we have the

4
following equations for the exposed population E t and quarantined exposed population qE t .
1 ,
.q
q
dE tE t I t A t S t E t E t
dt
dE tE t I t A t S t E t E t
dt
Note that the mild, ordinary and severe infected populations in the ID-SEIR model are undiagnosed
infections, and assume that the probabilities of these three types of infections being diagnosed are i
respectively, where 0 1i and 1,2,3.i Thus, the number of the quarantined infections is
1 1 2 2 3 3qE t I t I t I t at time ,t where is transfer rate of undiagnosed infected
population. Note that the infected population will be cured or died after a period of time. For the mild
infected population, 1 1 11 h I t denotes the cured number, and 1 1 11 d I t denotes the number of
deaths at time ,t where 1h is the proportion of cured infections among all undiagnosed mild
infections, 1d is the proportion of dead infections among all undiagnosed mild infections. For the
other cases, we can obtain the following equations for , ,iI t A t R t and D t using the same
technique.
3
1
3
1
3
1
,
, 1, 2,3,
1 ,
1 ,
1 ,
q
q i i q q
i
i
i i
A
A A i i i q q q
i
A A i i i q q q
i
dI tE t I t I t
dt
dI tE t I t i
dt
dA tE t A t
dt
dR tA t h h I t I t h
dt
dD tA t d d I t I t d
dt
where 1 2 3 1, 1 2 3 ,I t I t I t I t 1, 1,A A q qh d h d 1, 1,2,3,i ih d i and the definitions
of parameters in ID-SEIR model are given in Table 1.
Table 1 The definitions of parameters in ID-SEIR model
Parameters Definitions
Probability of the susceptible population being tracked
Probability of being infected in each contact
Contact rate between the susceptible and infectious population
Transmissibility index of exposed infections compared with infected population
Incubation rate
Probability of exposed infections being tracked
Rate of release
Transfer rate of undiagnosed infected population
1 Probability of the mild infections being diagnosed
2 Probability of the ordinary infections being diagnosed
3 Probability of the severe infections being diagnosed
1h
Proportion of cured infections among all undiagnosed mild infections
2h
Proportion of cured infections among all undiagnosed ordinary infections
3h
Proportion of cured infections among all undiagnosed severe infections
1 Proportion of the mild infections among all infected population

5
2 Proportion of the ordinary infections among all infected population
3 Proportion of the severe infections among all infected population
1d
Proportion of dead infections among all undiagnosed mild infections
2d
Proportion of dead infections among all undiagnosed ordinary infections
3d
Proportion of dead infections among all undiagnosed severe infections
Ah
Proportion of cured infections among all asymptomatic infected population
qh
Proportion of cured infections among all diagnosed infected population
A Transfer rate of asymptomatic infected population
q
Transfer rate of diagnosed infected population
Ad
Proportion of dead infections among all asymptomatic infected population
qd
Proportion of dead infections among all diagnosed infected population
Parameter values in ID-SEIR model
In order to predict the epidemic trends of COVID-19 by using our proposed ID-SEIR model, we first
need to determine the values of parameters in Table 1. In what follows, we will discuss how to
determine the values of these parameters in Table 1.
Note that the incubation rate is the rate of exposed population becoming infected population, and Li
et al. [3] shows the average incubation period of COVID-19 is 5.2 days and a whole quarantine cycle is
14 days. Then we take 1/ 5.2 and 1/14. Considering that the dead population comes from
the serious infections, we take 1 2 1.Ah h h Thus, we have 1 2 0Ad d d since 1A Ah d and
1, 1,2,3.i ih d i Since the mortality is about 4.4% in Hubei Province, China, So we set 0.044qd
and 0.956q
h . In this paper, we take 3 0.1d and 3 0.9h , the reason is that the number of dead
population who is undiagnosed cannot be obtained and the morality of severe infections is higher than
that of the total population. For simplicity, we fix 0.04, 0.12A and 0.1q by considering the
pathogenesis, and we further fix 1 2 30.5, 0.8, 0.98, =0.95 and =0.6, respectively.
Except the previous parameters, we need to estimate the parameters , , and . From January
23, 2020, China adopted the strong infectious prevention and control, and China had successfully
curbed the spread of local spreading on March 19, 2020. Therefore, we use the COVID-19 data in
Wuhan from January 23, 2020 to March 19, 2020 (no new confirmed cases for three consecutive days)
as the train sample to obtain the optimal initial values of the parameters , , and . COVID-19
data in Wuhan is available from the official website of Hubei Provincial Health Commission
http://wjw.hubei.gov.cn.
It is worth noting that, on February 12, 2020, Hubei Province confirmed the clinical diagnosis for the
suspected cases with the typical pneumonia imaging characteristics. This makes 13,436 new confirmed
cases in Wuhan City on February 12. Compared with February 11, there is a big difference.
Considering the early stage of the outbreak, the amounts of reagents used for the detection of nucleic
acids in patients are insufficient, and many suspected cases are not included in the confirmed
population in time. In order to better train the proposed ID-SEIR model with the COVID-19 data in
Wuhan, we first need to correct the data for the data from February 5 to 11 so that the calibrated data
can be used to obtain the values of parameters in model. Fig. 2 give the calibrated data and real data of
the cumulative number of confirmed cases.

6
Fig. 2 The calibrated data and real data of the cumulative number of confirmed cases for Wuhan's
COVID-19 data from January 23 to February 20, 2020
Thus, the values of parameters in ID-SEIR model for Wuhan COVID-19 data is given in Table 2.
Table 2 The values of parameters in ID-SEIR model for Wuhan COVID-19 data
Parameters Values Parameters Values
0.66 A 0.12
0.1 0.001t q 0.1
63.23 10 1 0.045
0.6 2 0.7
1/5.2 3 0.255
0.79 1 0.5
1/14 2 0.8
0.04 3 0.98
Ah 1 Ad 0
qh 0.956 q
d 0.044
1h 1 1d 0
2h 1 2d 0
3h 0.9 3d 0.1
0.95
Fitting results of COVID-19 data in Wuhan
We apply our proposed ID-SEIR model to fit the COVID-19 data in Wuhan from January 23 to March
19. The outbreak coincided with chunyun, 4.3 million people left Wuhan city during the Spring Festival
holiday, and more than 7 million people remained in Wuhan city. Therefore, the initial value of the
susceptible population in the ID-SEIR model is taken as 7 million. Considering that the average
incubation period of infections is 5.2 days, the initial value of exposed population is estimated as the
difference between the cumulative number of diagnosed cases on January 28 and that on January 23,
and it is taken as 0 1, 410E . According to the official data of the Health and Health Commission on
January 23, the initial value of quarantined susceptible population is taken as 0 2, 776Sq , and the
initial value of asymptomatic infections is taken as 0 5.A For the other initial values,
1 2 30 22, 0 347, 0 126, 0 500, 0 495, 0 31q qI I I E I R and 0 23,D please refer to the
official data of the Health and Health Commission on January 23. The fitted values of parameters in the
ID-SEIR model are shown in Table 2, and the fitted epidemic trend is given in Fig. 3.

7
Fig. 3 The fitted epidemic trend for Wuhan's COVID-19 data from January 23 to March 19, 2020
It is easy to see that our proposed ID-SEIR model can fit the epidemic trend very well for the
COVID-19 data in Wuhan from January 23, 2020 to March 19, 2020, and the average fitting deviation
rate is about 5.58%.
Prediction of the epidemic trends for overseas COVID-19
Until March 21, 2020, China has achieved great success in infection prevention and control. As the
most severe province of COVID-19 in China, Hubei Province also had no new confirmed cases for six
consecutive days. However, the COVID-19 in other countries and areas around the world shows an
outbreak trend, especially for USA and Italy. The cumulative number of confirmed cases in USA and
Italy has exceeded that of China on March 26 and 27, respectively. On April 26, there were 965,426
confirmed cases in USA (where 288,045 in New York), 197,675 in Italy, and only 84,341 in China4.
In this paper, our proposed ID-SEIR model has a better fit for the COVID-19 data of Wuhan, we will
predict the epidemic trends for overseas COVID-19 by using the ID-SEIR model, and we will provide
the references for infection prevention and control of COVID-19.
In the present paper, we apply the proposed ID-SEIR model to analyze the COVID-19 data of USA,
Italy and New York state since USA and Italy are the “worst-hit area” in the world and New York is “worst-hit area” of USA. Of course, our proposed ID-SEIR model can be similarly used to analyze the
COVID-19 situations in other countries and areas.
Analysis of COVID-19 in USA
Up to April 26, 2020, all 50 states in USA have been approved to make “major disaster” declarations, and the cumulative confirmed cases in New York, New Jersey, Massachusetts, Illinois, California,
Pennsylvania, Michigan, Louisiana, Florida, Connecticut, Texas, Georgia had exceeded 20,000. USA
regarded COVID-19 as the flu in the early stage, and implemented the epidemic prevention and control
relatively later. This causes the COVID-19 rapidly spread in USA recently.
The COVID-19 data of USA is collected from March 11 to April 26, and the data is available from
the official website of Johns Hopkins University. Thus, we apply our proposed ID-SEIR model to
predict the peak of the cumulative infectious cases (PCIC) and the expected peak date (EPD) under
different initial parameters. The prediction results are reported in Table 3 for the different , where
4 The data is from the National Health Commission of the People's Republic of China in http://www.nhc.gov.cn.

8
0S denotes the initial value of susceptible population, “PCIC” denotes the predicted peak of the
cumulative infectious cases, 95% CI denotes the confidence interval of PCIC with the nominal level
0.95, “EPD” denotes the expected peak date. In addition, Fig. 4 reports the dynamic curves for the
cumulative infectious cases with different 0S and .
Table 3 Prediction results of epidemic trends for COVID-19 in USA
0S PCIC 410 95% CI EPD
83.3 10
0.13 131.32 [123.81,138.83] May 20
0.15 146.27 [137.90,154.64] May 23
0.17 163.28 [155.81,170.75] May 24
81.8 10
0.13 119.55 [114.53,124.57] May 16
0.15 124.56 [119.29,129.83] May 17
0.17 132.59 [127.98,137.20] May 18
81 10
0.13 112.31 [108.90,115.72] May 11
0.15 116.39 [112.96,119.82] May 12
0.17 117.13 [114.46,119.80] May 14
Fig. 4 Left plot: dynamic curves for the cumulative infectious cases with different 0S and 0.17 .
Right plot: dynamic curves for the cumulative infectious cases with different and 80 1 10S
From Table 3 and Fig. 4, we have the following results.
(1) For the most extreme case, that is, we take almost all population (330 million) of USA as the
initial value of susceptible population. Thus, 0.13 as an example, the predicted cumulative
infectious cases will reach a peak on May 20, and the predicted value is about 1,313,200 (95% CI:
1,238,100-1,388,300). When increases, the predicted peak of the cumulative infectious cases will
also increase while the expected peak date will postpone. For example, for 0.17, the predicted
cumulative infectious cases are about 1,632,800 (95% CI: 1,558,100-1,707,500), and the expected peak
date is May 24.

9
(2) For the fixed , the predicted cumulative infectious cases will decrease and reach peak quickly
as the initial value of susceptible population decreases. For 0.13 and taking 100 million as the
initial value of susceptible population, thus the predicted cumulative infectious cases will soon reach a
peak on May 11, and the predicted value is about 1,123,100 (95% CI: 1,089,000-1,157,200).
(3) From Fig. 4, we can find that the cumulative infectious cases increase gradually to a peak, and
then it will decrease slowly as the epidemic develops. For the fixed 0.17 in left plot, when the
initial value 0S of susceptible population increases, the cumulative infectious cases will have a
higher growth than that with the small susceptible population. For the fixed 0S , the cumulative
infectious cases will have a lower growth as decreases.
(4) We also find that our proposed ID-SEIR model has a better fit for the real cumulative infectious
cases with 80 1 10S and 0.17 from March 11 to April 26, 2020. Therefore, we consider that the
proposed ID-SEIR model can predict the epidemic trends of COVID-19 very well if we take initial
value 80 1 10S of susceptible population and 0.17 . Thus, the predicted cumulative infectious
cases will soon reach a peak on May 14, and the predicted value is about 1,171,300 (95% CI:
1,144,600-1,198,000).
Analysis of New York's COVID-19
Since the outbreak of novel COVID-19 in New York, the number of new confirmed cases had
increased exponentially recently, and had exceeded that of the whole China. However, the population
of New York is only one third that of Hubei province, China.
The COVID-19 data of New York comes from the official website of New York Government. Thus,
we apply our proposed ID-SEIR model to analyze the COVID-19 data from March 7 to April 26 and
predict the peak of the cumulative infectious cases (PCIC) and the expected peak date (EPD) under
different parameters and . The prediction results are reported in Table 4, and the dynamic curves
for the cumulative infectious cases are reported in Fig. 5 with different and .
Table 4 Prediction results of epidemic trends for COVID-19 in New York
PCIC 410 95% CI EPD
0.1
0.13 32.13 [29.88,34.38] May 9
0.15 37.09 [34.44,39.74] May 11
0.17 41.02 [37.61,44.43] May 12
0.15
0.13 31.38 [29.50,33.26] May 8
0.15 35.54 [33.09,37.99] May 9
0.17 36.24 [33.16,39.32] May 11
0.2
0.13 30.92 [29.29,32.55] May 6
0.15 32.67 [30.79,34.55] May 7
0.17 33.4 [31.36,35.44] May 8
10
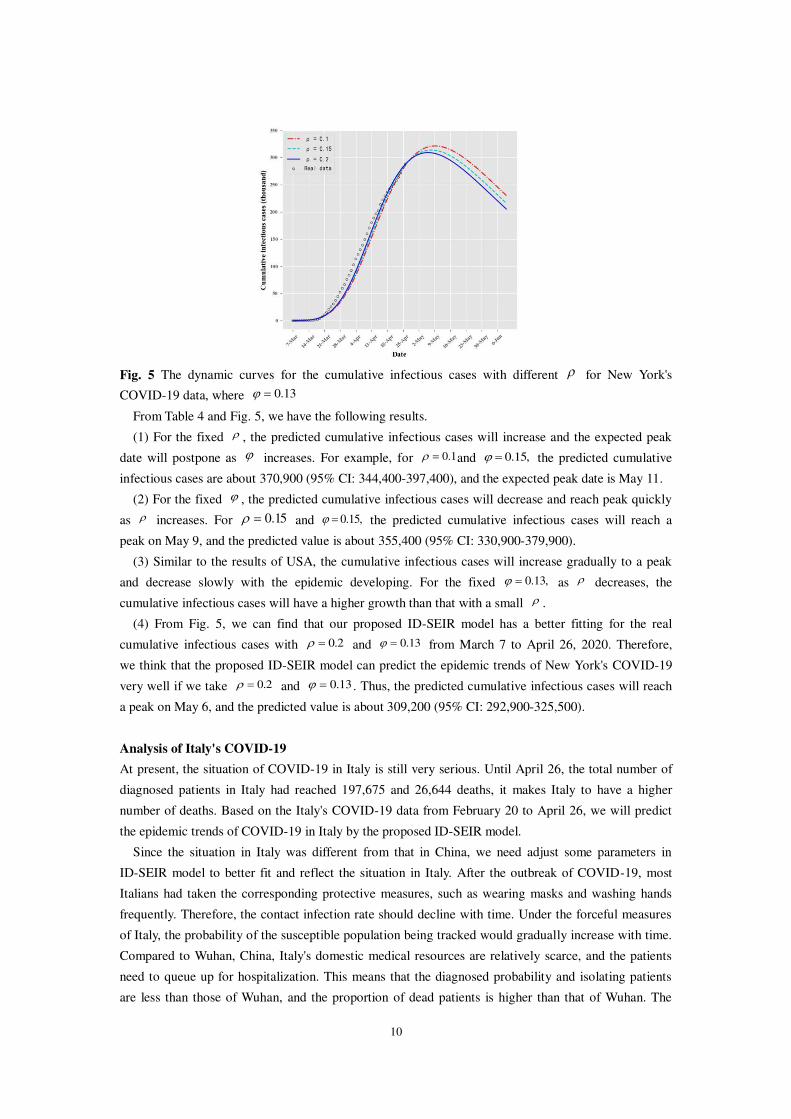
Fig. 5 The dynamic curves for the cumulative infectious cases with different for New York's
COVID-19 data, where 0.13
From Table 4 and Fig. 5, we have the following results.
(1) For the fixed , the predicted cumulative infectious cases will increase and the expected peak
date will postpone as increases. For example, for 0.1 and 0.15, the predicted cumulative
infectious cases are about 370,900 (95% CI: 344,400-397,400), and the expected peak date is May 11.
(2) For the fixed , the predicted cumulative infectious cases will decrease and reach peak quickly
as increases. For 0.15 and 0.15, the predicted cumulative infectious cases will reach a
peak on May 9, and the predicted value is about 355,400 (95% CI: 330,900-379,900).
(3) Similar to the results of USA, the cumulative infectious cases will increase gradually to a peak
and decrease slowly with the epidemic developing. For the fixed 0.13, as decreases, the
cumulative infectious cases will have a higher growth than that with a small .
(4) From Fig. 5, we can find that our proposed ID-SEIR model has a better fitting for the real
cumulative infectious cases with 0.2 and 0.13 from March 7 to April 26, 2020. Therefore,
we think that the proposed ID-SEIR model can predict the epidemic trends of New York's COVID-19
very well if we take 0.2 and 0.13 . Thus, the predicted cumulative infectious cases will reach
a peak on May 6, and the predicted value is about 309,200 (95% CI: 292,900-325,500).
Analysis of Italy's COVID-19
At present, the situation of COVID-19 in Italy is still very serious. Until April 26, the total number of
diagnosed patients in Italy had reached 197,675 and 26,644 deaths, it makes Italy to have a higher
number of deaths. Based on the Italy's COVID-19 data from February 20 to April 26, we will predict
the epidemic trends of COVID-19 in Italy by the proposed ID-SEIR model.
Since the situation in Italy was different from that in China, we need adjust some parameters in
ID-SEIR model to better fit and reflect the situation in Italy. After the outbreak of COVID-19, most
Italians had taken the corresponding protective measures, such as wearing masks and washing hands
frequently. Therefore, the contact infection rate should decline with time. Under the forceful measures
of Italy, the probability of the susceptible population being tracked would gradually increase with time.
Compared to Wuhan, China, Italy's domestic medical resources are relatively scarce, and the patients
need to queue up for hospitalization. This means that the diagnosed probability and isolating patients
are less than those of Wuhan, and the proportion of dead patients is higher than that of Wuhan. The

11
Italian government has actively taken measures to respond the COVID-19 and has continuously
purchased the medical equipment. Therefore, the diagnosed probability and isolating patients should
increase, and the proportion of dead patients will decrease over time. According to the actual situation
in Italy, the parameters of the ID-SEIR model are adjusted in Table 5, and other parameters are same as
that in Table 2.
Table 5 Adjusted parameters of ID-SEIR model for COVID-19 in Italy
Adjusted parameters Values Adjusted parameters Values
90.65 0.125log 1t qh 0.23 0.001t
-5 -71.528 10 +8.53 10 t qd 0.77 0.001t
0.1 0.00102t A 0.05
1 0.5 0.00045t 0.05
2 0.6 0.0005t q 0.01
3 0.71 0.0005t 0.97
Ah 0.18 0.001t 0.48
Ad 0.82 0.001t
Since the COVID-19 outbreak in Italy occurred in late February, there were only 3 confirmed cases
in Italy until February 20. Therefore, we collect the COVID-19 data from the official website of Johns
Hopkins University. Based on the adjusted parameters, we apply the proposed ID-SEIR model to
analyze the COVID-19 data of Italy, and report the prediction results in Table 6 for the different
and , where “PCIC” denotes the predicted peak of the cumulative infectious cases, 95% CI denotes
the confidence interval of PCIC with the nominal level 0.95, “EPD” denotes the expected peak date. Fig. 6 gives predicted curve of COVID-19 for cumulative infectious cases in Italy.
Table 6 Prediction results of epidemic trends for COVID-19 in Italy
PCIC 410 95% CI EPD
0.6
0.095 22.59 [22.36,22.82] May 27
0.1 23.67 [23.29,24.04] June 1
0.105 24.61 [24.18,25.05] June 6
0.65
0.095 22.47 [22.20,22.74] May 27
0.1 23.34 [23.12,23.57] June 1
0.105 24.31 [23.96,24.66] June 6
0.7
0.095 22.23 [21.74,22.72] May 27
0.1 23.26 [22.97,23.55] May 31

12
0.105 24.17 [23.79,24.55] June 5
Fig. 6 The predicted curve of COVID-19 for cumulative infectious cases in Italy with 0.65 and
0.1
From results in Table 6 and Fig. 6, we can find that the results are similar to those of USA and New
York. Further, the proposed ID-SEIR model can fit the real data of Italy very well from February 20 to
April 26 when we take 0.65 and 0.1 . Therefore, the predicted cumulative infectious cases will
reach a peak on June 1, and the predicted value is about 233,400 (95% CI: 231,200-235,700). In
addition, the average fitting deviation rate excluding the first five days was about 6.21% due to the
small number of cumulative cases in the first few days with the relatively large fitting deviation.
Conclusion and Discussion
In later December 2019, an outbreak of the novel COVID-19 began in Wuhan (Hubei, China), and
spread throughout the country rapidly. Then China adopted unprecedented nationwide interventions on
January 23, 2020 to limit the spread of the epidemic. Under the lead of President Jinping Xi, China
took a series of measures, for example, the whole country was quarantined, the masks were required
strictly, the national holiday was extended, strict measures for limiting travel and public gatherings
were introduced, public spaces were closed and rigorous temperature monitoring was implemented
nationwide. Until March 21, 2020, China has achieved great success in infection prevention and control.
As the most severe province of COVID-19 in China, Hubei Province also had no new confirmed cases
for six consecutive days. It can be seen that the measures taken by China have played a key role to
contain the spread of the novel COVID-19.
However, the novel COVID-19 is highly infectious and causes complex epidemics, which has been
spreading in almost all countries in the world. In order to predict the epidemic trends for overseas
COVID-19, we first propose an ID-SEIR model by considering the susceptible population, quarantined
susceptible population, exposed population, quarantined exposed population, asymptomatic infections,
infected population with different severity, diagnosed infected population, cured population and dead
population at any time. Secondly, we obtain the values of parameters in ID-SEIR model by using the
epidemic data of Wuhan as the training sample. Finally, we predict the epidemic trends of COVID-19

13
for the three most serious USA, New York and Italy with our proposed ID-SEIR model, and we can
apply the proposed method to predict the epidemic trends of other countries and areas.
We find that the proposed ID-SEIR model can predict the epidemic trends of COVID-19 very well.
For USA, the predicted cumulative infectious cases will reach a peak on May 14, and the predicted
value is about 1,171,300 (95% CI: 1,144,600-1,198,000) with initial susceptible population 100 million
and 0.17 . For New York, the predicted cumulative infectious cases will reach a peak on May 6,
and the predicted value is about 309,200 (95% CI: 292,900-325,500). For Italy, the predicted
cumulative infectious cases will reach a peak on June 1, and the predicted value is about 233,400 (95%
CI: 231,200-235,700).
We also find that some parameters affect the predicted cumulative infectious cases and the expected
peak date, for example, the initial value of susceptible population, the probability of being infected
in each contact, and the probability of the susceptible population being tracked. For the fixed
and , the predicted cumulative infectious cases will decrease and reach peak quickly as the initial
value of susceptible population decreases. When increases, the predicted peak cumulative
infectious cases will also increase while the expected peak date will postpone. The predicted
cumulative infectious cases will decrease and reach peak quickly as increases. Therefore, we hope
that each country can learn the experiences from Chinese infection prevention and control, and require
to adopt the quarantine, wear the masks strictly, and close public places so that they can reduce the
susceptible population and contact rate.
According to our analysis, the epidemic of several serious countries and areas in the world will
continue for some time, and the elimination of the novel COVID-19 will be a long-term war. The
proposed ID-SEIR model established in this paper has strong reliability, which can reasonably reflect
the changes in national policies and public behavior during the epidemic. Also, this model can make
predictions in line with the actual development of the epidemic and provide reference for infection
prevention and control. However, the proposed ID-SEIR forecast model mainly focuses on the effect of
time to the total infected cases, and fails to reflect the effect of other possible factors or variables, such
as travel, contact and other trajectory data, which will be the focus of the future study.
Acknowledgements: The authors sincerely thank Ms Zhang Yan for English language revisions.
Funding: This work was supported by the National Natural Science Foundation of China (Grant
numbers: 11871001, 81570073 and 11971001), the Beijing Natural Science Foundation (Grant number:
1182003) and the Fundamental Research Funds for the Central Universities (Grant number:
2019NTSS18).
Conflict of interest: The authors declare that they have no conflict of interest.
References
1. Aron JL, Schwartz IB. Seasonality and period-doubling bifurcations in an epidemic model.
Journal of Theoretical Biology, 1984; 110: 665-679.
2. Li MY, Graef JR, Wang LC, Karsai J. Global dynamics of a SEIR model with varying total
population size. Mathematical Biosciences, 1999; 160: 191-213.
3. Li Q, Guan XH, Wu P, Wang XY, Zhou L, Tong YQ et al. Early transmission dynamics in Wuhan,

14
China, of novel coronavirus-infected pneumonia. The New England Journal of Medicine, 2020;
382(13): 1199-1207.
4. Liu S, Wang SC, Xiu ZL. Infectious kinetics of novel coronavirus pneumonia (COVID-19).
Chinese Journal of Virology, 2020; Online, DOI: 10.13242/j.cnki.bingduxuebao.003674.
5. Tang B, Wang X, Li Q, Bragazzi NL, Tang S, Xiao Y, Wu J. Estimation of the transmission risk of
the 2019-nCoV and its implication for public health interventions. Journal of Clinical Medicine,
2020; 9(2): 462; DOI: 10.3390/jcm9020462.
6. Tian HY, Liu YH, Li YD, Wu CH, Chen B et al. An investigation of transmission control
measures during the first 50 days of the COVID-19 epidemic in China. Science, 2020; Published
Online, DOI: 10.1126/science.abb6105.
7. Wei YY, Lu ZZ, Du ZC, Zhang ZJ, Zhao Y et al. Fitting and forecasting the trend of COVID-19
by SEIR+CAQ
dynamic model. Chinese Journal of epidemiology, 2020; 41(4): 470-475.
8. Yang Y, Lu QB, Liu MJ, Wang YX, Zhang AR, Jalali N et al. Epidemiological and clinical
features of the 2019 novel coronavirus outbreak in China. 2020; medRxiv preprint DOI:
10.1101/2020.02.10.20021675.
9. Yang ZF, Zeng ZQ, Wang K, Wong SS, Liang WH, Zanin M et al. Modified SEIR and AI
prediction of the epidemics trend of COVID-19 in China under public health interventions.
Journal of Thoracic Disease, 2020; 12(3): 165-174.
10. Zhang JJ, Litvinova M, Wang W, Wang Y, Deng XW et al. Evolving epidemiology and
transmission dynamics of coronavirus disease 2019 outside Hubei province, China: a descriptive
and modelling study. The Lancet Infectious Diseases, 2020; Published Online, DOI:
10.1016/S1473-3099(20)30230-9.

Figures
Figure 1
The structural diagram of the improved dynamic SEIR (ID-SEIR) model adopted in the study for the novelCOVID-19
Figure 2
The calibrated data and real data of the cumulative number of con�rmed cases for Wuhan's COVID-19data from January 23 to February 20, 2020

Figure 3
The �tted epidemic trend for Wuhan's COVID-19 data from January 23 to March 19, 2020
Figure 4
dynamic curves for the cumulative infectious cases

Figure 5
The dynamic curves for the cumulative infectious cases
Figure 6
The predicted curve of COVID-19 for cumulative infectious cases in Italy


