Social Assistance Amidst the Covid-19 Epidemic in South Africa

01 December 2020 Imperial College COVID-19 response team
DOI: https://doi.org/10.25561/84283 Page 1 of 17
Report 39: Characterising COVID-19 epidemic dynamics and mortality
under-ascertainment in Khartoum, Sudan
Oliver J. Watson,1* Nada Abdelmagid,2,3 Aljaile Ahmed,3,4 Abd Elhameed Ahmed Abd Elhameed,3,4
Charles Whittaker,1 Nicholas Brazeau,1 Arran Hamlet,1 Patrick Walker,1 James Hay,5 Azra Ghani,1
Francesco Checchi,2 Maysoon Dahab2,3
1. MRC Centre for Global Infectious Disease Analysis & WHO Collaborating Centre for Infectious
Disease Modelling, Jameel Institute for Disease and Emergency Analytics, Imperial College
London, London, UK
2. Department of Infectious Disease Epidemiology, Faculty of Epidemiology and Population Health,
London School of Hygiene and Tropical Medicine, London, UK
3. Sudan COVID-19 Research Group, Khartoum, Sudan
4. Sudan Youth Peer Education Network, Khartoum, Sudan
5. Center for Communicable Disease Dynamics, Harvard T. H. Chan School of Public Health, Boston,
MA
* correspondence: [email protected]
SUGGESTED CITATION
OJ Watson, N Abdelmagid, A Ahmed, et al. Characterising COVID-19 epidemic dynamics and mortality under-
ascertainment in Khartoum, Sudan. Imperial College London (01-12-2020), doi: https://doi.org/10.25561/84283.
This work is licensed under a Creative Commons Attribution-NonCommercial-NoDerivatives
4.0 International License.
01 December 2020 Imperial College COVID-19 response team
DOI: https://doi.org/10.25561/84283 Page 2 of 17
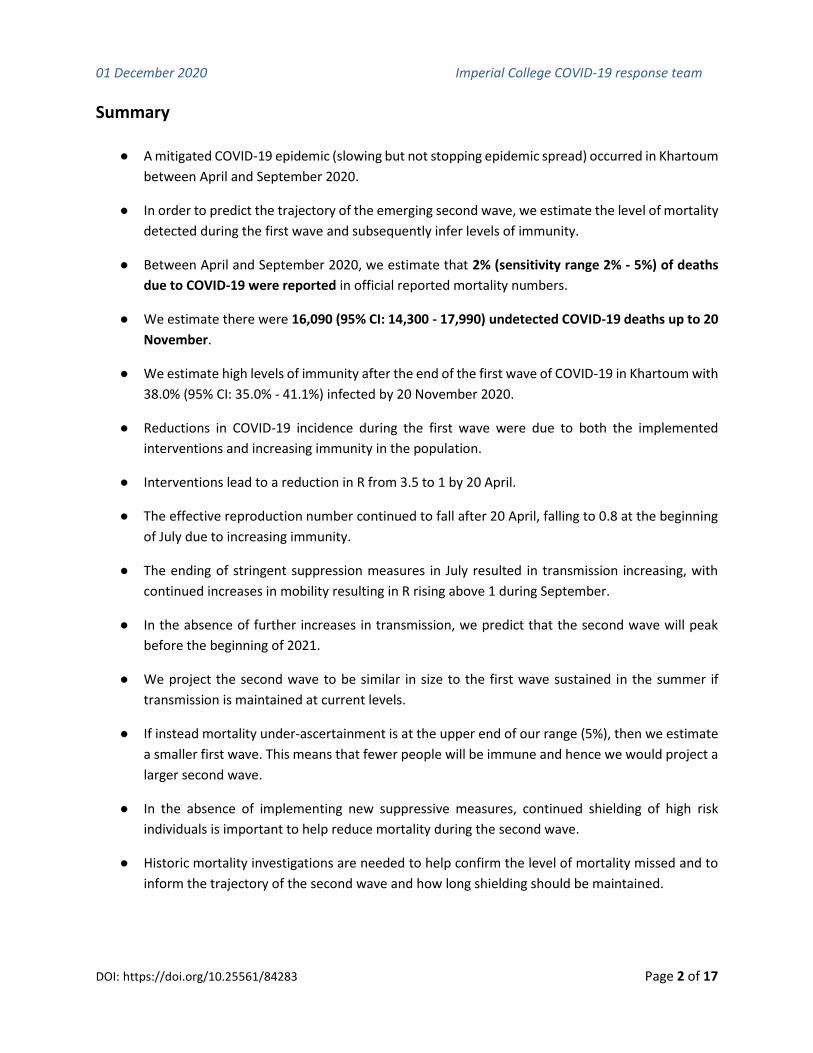
Summary
● A mitigated COVID-19 epidemic (slowing but not stopping epidemic spread) occurred in Khartoum
between April and September 2020.
● In order to predict the trajectory of the emerging second wave, we estimate the level of mortality
detected during the first wave and subsequently infer levels of immunity.
● Between April and September 2020, we estimate that 2% (sensitivity range 2% - 5%) of deaths
due to COVID-19 were reported in official reported mortality numbers.
● We estimate there were 16,090 (95% CI: 14,300 - 17,990) undetected COVID-19 deaths up to 20
November.
● We estimate high levels of immunity after the end of the first wave of COVID-19 in Khartoum with
38.0% (95% CI: 35.0% - 41.1%) infected by 20 November 2020.
● Reductions in COVID-19 incidence during the first wave were due to both the implemented
interventions and increasing immunity in the population.
● Interventions lead to a reduction in R from 3.5 to 1 by 20 April.
● The effective reproduction number continued to fall after 20 April, falling to 0.8 at the beginning
of July due to increasing immunity.
● The ending of stringent suppression measures in July resulted in transmission increasing, with
continued increases in mobility resulting in R rising above 1 during September.
● In the absence of further increases in transmission, we predict that the second wave will peak
before the beginning of 2021.
● We project the second wave to be similar in size to the first wave sustained in the summer if
transmission is maintained at current levels.
● If instead mortality under-ascertainment is at the upper end of our range (5%), then we estimate
a smaller first wave. This means that fewer people will be immune and hence we would project a
larger second wave.
● In the absence of implementing new suppressive measures, continued shielding of high risk
individuals is important to help reduce mortality during the second wave.
● Historic mortality investigations are needed to help confirm the level of mortality missed and to
inform the trajectory of the second wave and how long shielding should be maintained.

01 December 2020 Imperial College COVID-19 response team
DOI: https://doi.org/10.25561/84283 Page 3 of 17
1. Report
The COVID-19 pandemic has impacted modern life, with restrictions being implemented in the majority
of countries to stop the spread of SARS-CoV-2.1 Despite this, large epidemics have been observed in
multiple countries with over a million deaths reported to date. However, whilst the pandemic has strained
health systems to near-capacity in many high income countries, the absence of comparable epidemics in
many African countries is notably perplexing.2 Under-reporting of COVID-19 deaths is a likely explanation
of these patterns, however, it is difficult to measure given that vital registration systems and excess
mortality data are absent in many countries. Understanding the true mortality due to COVID-19 is crucially
important with COVID-19 mortality frequently used to provide a more complete understanding of the size
of epidemics. However, under-ascertainment of deaths will change the outcome of such approaches as
well as altering our understanding of herd-immunity thresholds for COVID-19.
In September, we published a report looking into the COVID-19 epidemic in Damascus, Syria.3 In this, we
estimated that only 1 in 80 deaths due to COVID-19 have likely been reported. This scale of under-
reporting of mortality suggests that a largely unmitigated and unobserved COVID-19 epidemic has
occurred in Damascus. This was hinted at by media reports and anonymous testimonials from within the
country that the health system was at capacity,4 but would likely have remained unconfirmed without
leveraging alternative datastreams. Recently, similar levels of under-ascertainment have been estimated
in Aden, Yemen. In this analysis, satellite images were used to reveal a largely unobserved COVID-19
epidemic during the summer.5 These are just two settings, but there have been numerous media reports
of health systems reaching capacity and large numbers of deaths not being detected.6–8 If these reports
are true, it is likely that early predictions of the global spread of COVID-19 have largely been born out.
Reports of increased burial numbers from gravedigger testimonials9 and documented low testing
capacity10 prompted this investigation to understand whether COVID-19 mortality has been under-
ascertained within Khartoum state, Sudan. This is of particular importance with trends in case incidence
in Sudan during November suggesting the epidemic is entering a second wave. In order to predict the
trajectory of the second wave we need to understand how large the first wave was and the resultant level
of immunity in the population. We fit a previously published11 and recently re-parameterised12 age-
structured COVID-19 transmission model to daily COVID-19 deaths reported in Khartoum state. Using an
analogous modelling framework as in our previous study in Damascus,3 we focus on the assumption that
official reported daily mortality due to COVID-19 is informative of the true epidemic shape. Using this
assumption, the trajectory of officially reported deaths should mirror the shape of the epidemic after
accounting for under-ascertainment. We explore a range of under-ascertainment levels within our
transmission modelling framework to relate the deaths predicted by the model to the official reported
deaths. We evaluate the likelihood of each under-ascertainment fraction by comparing the inferred
epidemic trajectory against two alternative data sources; 1) a social media conducted survey of
symptomatic prevalence13 and 2) a paired serology and molecular diagnostic cross sectional survey.14 We
review the potential biases in the data sets before estimating the proportion of deaths due to COVID-19
that have been reported, which is subsequently used to provide epidemic trajectories of the second wave.

01 December 2020 Imperial College COVID-19 response team
DOI: https://doi.org/10.25561/84283 Page 4 of 17
1.1 COVID-19 Epidemiological Situation in Khartoum State
Sudan reported its first COVID-19 death in Khartoum on 12 March, with a total of 315 deaths recorded in
the city in the period up to 31 August (Figure 1). Across Khartoum and other Sudanese states, both
reported cases and deaths suggest a significant epidemic peaking in early June followed by declines to low
levels of transmission by the beginning of September (Supplementary Figure 1). However, early signs of a
second wave are being observed with cases increasing significantly since November. In order to
understand the likely trajectory of the second wave, we need to understand the true spread of COVID-19
during the first wave. We therefore restrict our initial analyses to this period spanning the first death in
March until September, with the aim of this initial analysis to better understand the transmission
dynamics and burden of COVID-19 experienced in Khartoum during the first wave.
To explore the epidemic dynamics in Khartoum, we initially sought to use case data (Supplementary Figure
1) to infer changes in transmissibility (Rt, the time-varying reproduction number of the virus). However,
limitations in diagnostic capacity make it hard to rely on trends in incidence, with test positivity rates equal
to 55% for tests conducted in Sudan up to 3 July 2020.10 In response, we assume changes in transmission
can be explained by mobility patterns,3 which we infer from the timing and nature of population-level
control measures sourced from the Oxford Government Response Tracker (Figure 1).15 The first lockdown
in Khartoum was announced on 18 April, which included restrictions on accessing shops and suspension
of religious services. Intriguingly, the observed peak in mortality in June is approximately 45 days after the
first lockdown, which is significantly longer than the delay distribution from infection to death from
COVID-19 (typically approximately 20 days). Motivated by both the limitations in testing capacity and the
delay between lockdown implementation and the peak in mortality we sought to characterise the under-
ascertainment of mortality in Khartoum.
Figure 1. Incidence of confirmed deaths due to COVID-19 in Khartoum before September 2020. Reported deaths
in Khartoum are shown in black bars, with the inferred mobility pattern for Sudan shown with the red line. The
timing of government interventions and policy changes is indicated with points at the top of the y-axis, with purple
points indicating when policies were implemented or extended, whereas orange indicate intervention policies
being relaxed. As of 27th August, 315 total deaths had been reported in Khartoum.

01 December 2020 Imperial College COVID-19 response team
DOI: https://doi.org/10.25561/84283 Page 5 of 17
1.2 Estimating the under-ascertainment of deaths
Prompted by these results suggesting an inconsistency between intervention timing in Khartoum and
subsequent declines in mortality, we investigated whether the under-reporting of deaths might help
explain the observed epidemic dynamics. To estimate the under-ascertainment of COVID-19 deaths, we
scan across a range of under-ascertainment levels to relate the deaths predicted by the model to the
officially reported deaths. To evaluate the likelihood of each level of under-ascertainment we compare
outputs from the inferred epidemic curves to two sources of alternative data.
The first source of data is taken from a social media survey conducted in Khartoum. The survey was
circulated as a Google form and collected information on whether participants had suffered any
symptoms associated with COVID-19.13 Symptomatic individuals were asked to report the symptoms they
had suffered and all individuals were asked both i) if they had received a COVID-19 diagnostic test and ii)
the outcome of any test taken. From this survey, the authors created a statistical model to infer the COVID-
19 infection status of survey participants who had not received a COVID-19 test based on reported
symptoms and through this, infer the symptomatic attack rate in the general population by 2 June. We
use three estimates of the symptomatic attack rate in 15+ year olds from the study to reflect the
uncertainty in the inferred attack rates: 8.3%, 11% and 13.7%. Using these estimates, we estimate the
likelihood of different levels of under-ascertainment of deaths by comparing the model predicted
symptomatic attack rate in 15+ year olds on 2 June to the observed attack rate estimated from the social
media survey. We are aware of likely biases in the survey collection, with individuals recruited by voluntary
sign up, which may select for individuals more likely to have been infected. To account for this bias, we
also estimate the level of under-ascertainment under the assumption that people infected with COVID-
19 were twice as likely to complete the survey (see Supplementary Table 2).
The second source of data is a joint serological and molecular survey conducted in Khartoum between
May 22 and July 5 through the Sudan Field Epidemiology Training Program (FETP). In the FETP survey,
participants were tested for both current infection and for antibodies.14 The survey screened 1135
individuals from 22 neighborhoods and eight health facilities across Khartoum using reverse transcription
polymerase chain reaction (RT-PCR, detecting active infections) and rapid antibody
immunochromatography (ICT, detecting prior exposure) tests. Recruitment was via voluntary enrollment,
with community health workers utilising neighborhood groups known as Resistance Committees to
engage with communities. As a result, this survey is likely a biased sample, probably selecting for
individuals who have been infected or are currently infected. Indeed, the observed two-by-two table of
test outcomes (Table 1) reveals a very high prevalence of active infection, with 35% of participants PCR+.
Despite this bias however, joint administration of both RT-PCR ICT tests provides additional information
on epidemic dynamics. Having information on both the kinetics of viral loads and of human antibodies
(which differ in their timescales) allows us to infer when individuals were infected prior to sample
collection. If many individuals are both ICT+ than PCR+, this suggests that most infections have occurred
recently and the epidemic is growing. By contrast, if most individuals are ICT+ but PCR -, this suggests that
comparatively few infections have occurred recently and the epidemic is likely declining.

01 December 2020 Imperial College COVID-19 response team
DOI: https://doi.org/10.25561/84283 Page 6 of 17
Table 1. Joint Serological (ICT) and Molecular (PCR) FETP survey results, May 22 - July 514
PCR
ICT Positive Negative Total
Positive 100 55 155
Negative 191 506 697
Total 291 561 852
To compare the outputs from our transmission model to these data, we construct an observational model
for the serological and molecular data. To estimate the number of infected individuals who would be PCR+
on a given day, we use a previously published relationship between time since infection and the
probability of being detectable by PCR (Figure 2a). To estimate the number of individuals who are
seropositive on a given day, we combine a previously fitted Weibull survival model for seroreversion16
with a delay to seroconversion described by an exponential distribution with mean 13.3 days17 to estimate
the probability of being seropositive on a given day (Figure 2b). These allow us to describe the probability
of a sampled individual being PCR or seropositive. However, relating this and our modelled dynamics to
the conducted surveys remains challenging due to the likely extensive enrollment bias in both studies. To
circumvent this potential enrollment bias, we compare the model predicted mean ratio of PCR+ to
seropositive individuals during the survey period. Whilst this accounts in part for enrollment bias more
generally, additional bias could occur if individuals are more likely to enrol if recently infected. We
therefore additionally estimate the level of under-ascertainment under the assumption that an increased
proportion of individuals PCR+/ICT- (to reflect recent infections) were enrolled, the results of which are
contained in Supplementary Table 2.
Figure 2. Observational assumptions relating infection history to molecular and serological diagnosis. In a) the
assumed probability of being detected by PCR is shown for each day after infection, with PCR detection assumed
to fall to 0 after 35 days. In b) the probability of being seropositive and being detected by rapid antibody
immunochromatography is shown for 200 days after the onset of symptoms. Both distributions are used to relate
the transmission model outputs back to the joint serological and molecular survey.
By the end of August, 315 COVID-19 related deaths were reported in Khartoum state. Using the described
alternative data sources, we estimate that this likely comprises 2-5% of total COVID-19 deaths. This was

01 December 2020 Imperial College COVID-19 response team
DOI: https://doi.org/10.25561/84283 Page 7 of 17
determined by comparing both the model-predicted symptomatic attack rate (calculated using the age-
dependent clinical fraction estimated in Davies et al18) in individuals aged 15+ (Figure 3a) and the model
predicted ratio between PCR+ and ICT+ individuals (Figure 3b) against the related measures in the
symptomatic and FETP surveys respectively. The sensitivity range reported reflects the range of
uncertainty both in our model parameters and the described biases and uncertainty in the two survey
sources (Supplementary Table 2). 2% provided the best fit to the observed data, however, we are aware
that these surveys are susceptible to bias that has likely resulted in the attack rate being overestimated.
In response, we use a conservative estimate of 3% of deaths reported (i.e. a smaller degree of
underascertainment) within our main modelled scenario in which we consider the implications of under-
ascertainment on the inferred epidemic dynamics and the trajectory of the second wave.
Figure 3. Estimates of under-ascertainment of deaths in Khartoum. In a) the cumulative symptomatic attack rate in
individuals older than 15 years is shown for a range of values for the under-ascertainment of COVID-19 deaths. The
range of observed attack rate estimates are shown with the vertical black segment and 3 points, showing 13.7%, 11%
and 8.3% attack rates. In b) the model predicted ratio between PCR+ individuals and seropositive (ICT+) individuals
is shown. Boxplots represent 100 simulation repetitions, with the mean ratio taken across the 23rd May and 2 July.
The horizontal dashed line shows the observed ratio of PCR+ to ICT+ from the FETP survey (conducted 23 May - 2
July). In c) the log likelihood for each reporting fraction is shown for each attack rate in the observed data in b). Model
log likelihoods presented reflect the mean model log likelihood, suggesting that under-ascertainment, without
accounting for upward bias in the survey, is equal to 2% based on the symptomatic survey data in a), which is in
agreement with the results in b).

01 December 2020 Imperial College COVID-19 response team
DOI: https://doi.org/10.25561/84283 Page 8 of 17
1.3 Implications of under-ascertainment for the Khartoum epidemic
The scale of inferred under-ascertainment yields a significantly more mature epidemic than suggested by
reported deaths and has profound implications for our understanding of the epidemic trajectory since
September. To reconstruct the course of the epidemic to date we assumed that 3% of COVID-19 deaths
have been reported in Khartoum. We choose to model 3% rather than the best fitting 2% inferred in Figure
3 in order to account for the perceived upward bias in the surveys that likely increased the enrollment of
infected individuals. As of 20 November 2020, 477 COVID-19 related deaths were reported in Khartoum
state, which incorporates periodic revisions of COVID-19 data made by the Sudan FMOH. Based on this
level of underascertainment, we estimate that during this time 16,090 COVID-19 deaths have been missed
(95% CI: 14,300 - 17,990) (Figure 4c). Consequently, we predict that a cumulative total of 38.0% (95% CI:
35.0% - 41.1%) of the population in Khartoum state had been infected by 20 November 2020 (Figure 4b).
Figure 4. Model-predicted attack rates, deaths, infections and hospital occupancy due to COVID-19 for Khartoum under
an assumed 3% mortality ascertainment. In a) the model predicted 15+ symptomatic attack rate is shown, with the range
calculated using the assumed clinical fraction estimated in Davies et al,18 using the 95% quantile range. In b) the overall
attack rate is shown, with the confidence interval representing the 95% quantile range of 100 simulations. In c) and d)
the reported daily deaths and infections due to COVID-19 respectively are shown, with the individual simulation replicates
shown behind the median prediction in bold.
01 December 2020 Imperial College COVID-19 response team
DOI: https://doi.org/10.25561/84283 Page 9 of 17
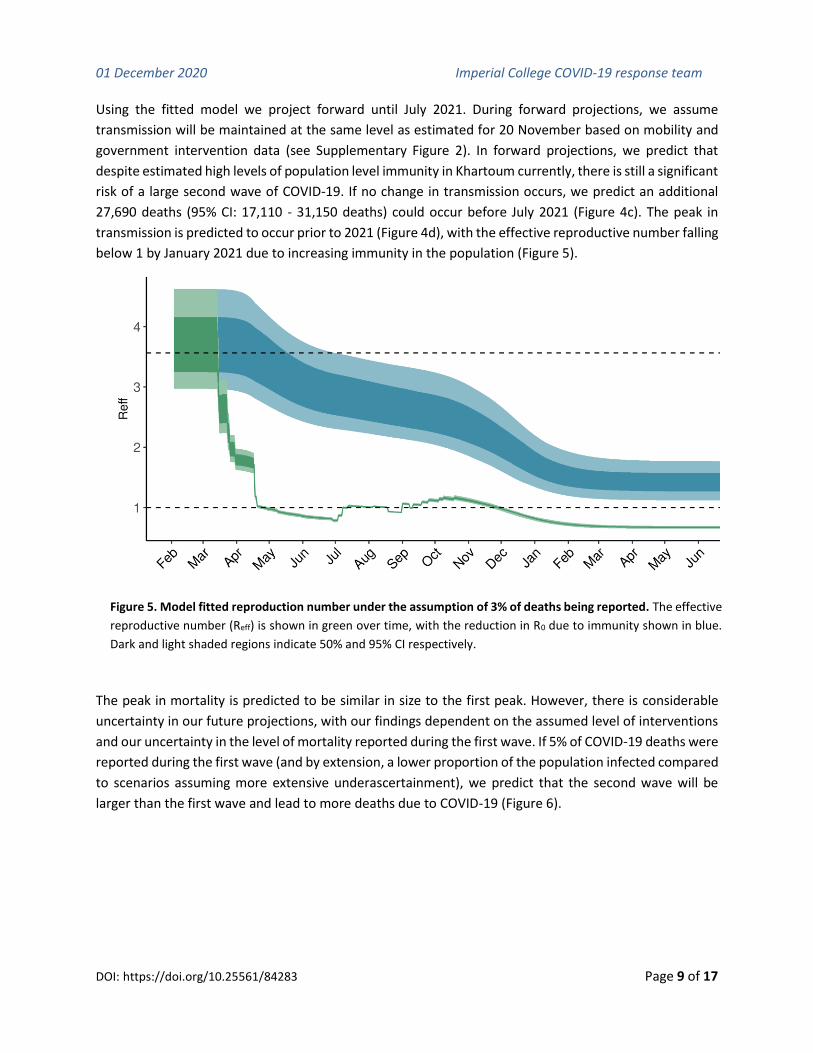
Using the fitted model we project forward until July 2021. During forward projections, we assume
transmission will be maintained at the same level as estimated for 20 November based on mobility and
government intervention data (see Supplementary Figure 2). In forward projections, we predict that
despite estimated high levels of population level immunity in Khartoum currently, there is still a significant
risk of a large second wave of COVID-19. If no change in transmission occurs, we predict an additional
27,690 deaths (95% CI: 17,110 - 31,150 deaths) could occur before July 2021 (Figure 4c). The peak in
transmission is predicted to occur prior to 2021 (Figure 4d), with the effective reproductive number falling
below 1 by January 2021 due to increasing immunity in the population (Figure 5).
Figure 5. Model fitted reproduction number under the assumption of 3% of deaths being reported. The effective
reproductive number (Reff) is shown in green over time, with the reduction in R0 due to immunity shown in blue.
Dark and light shaded regions indicate 50% and 95% CI respectively.
The peak in mortality is predicted to be similar in size to the first peak. However, there is considerable
uncertainty in our future projections, with our findings dependent on the assumed level of interventions
and our uncertainty in the level of mortality reported during the first wave. If 5% of COVID-19 deaths were
reported during the first wave (and by extension, a lower proportion of the population infected compared
to scenarios assuming more extensive underascertainment), we predict that the second wave will be
larger than the first wave and lead to more deaths due to COVID-19 (Figure 6).

01 December 2020 Imperial College COVID-19 response team
DOI: https://doi.org/10.25561/84283 Page 10 of 17
Figure 6. Impact of mortality under-reporting on second wave dynamics. Model predicted a) daily infections and b) daily
deaths for three different reporting fractions. For predictions of future epidemic dynamic, transmission is assumed to
maintain the same as the estimate for the current day. Under the assumption of high mortality reporting (green = 5%
deaths reported) the second wave is predicted to be larger than the first wave due to lower levels of population immunity
and will peak later in the year. Each line shows the median of 100 simulations.
01 December 2020 Imperial College COVID-19 response team
DOI: https://doi.org/10.25561/84283 Page 11 of 17
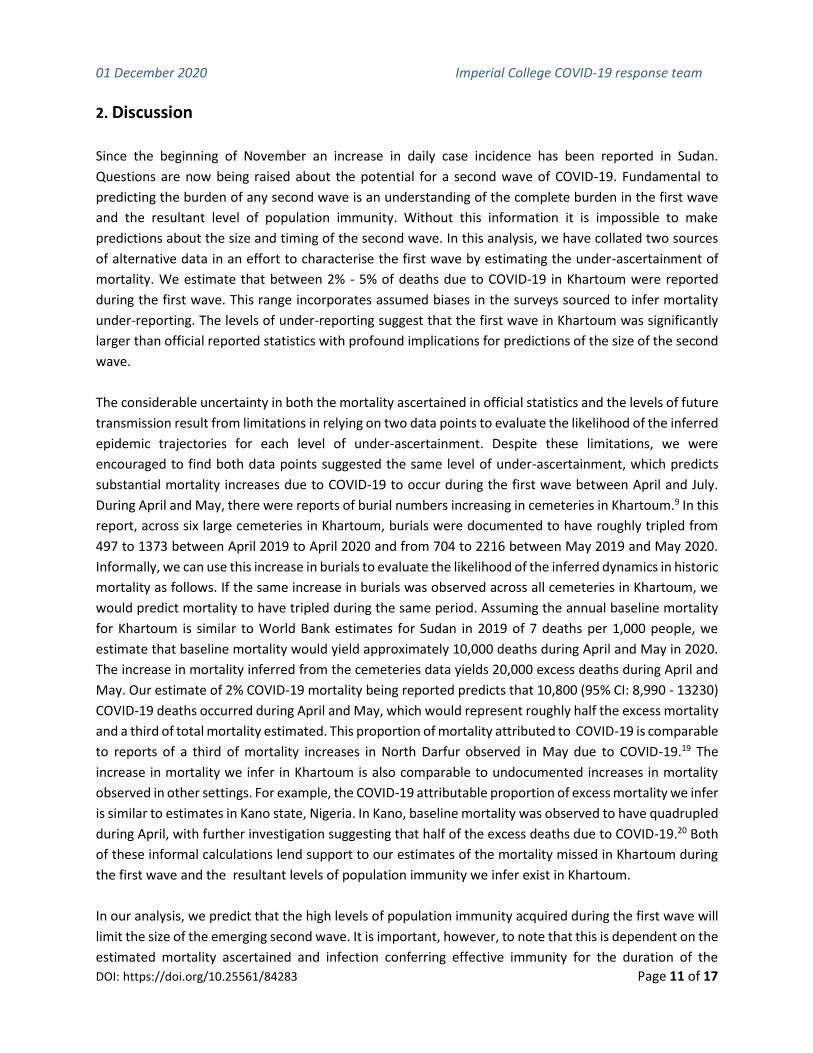
2. Discussion
Since the beginning of November an increase in daily case incidence has been reported in Sudan.
Questions are now being raised about the potential for a second wave of COVID-19. Fundamental to
predicting the burden of any second wave is an understanding of the complete burden in the first wave
and the resultant level of population immunity. Without this information it is impossible to make
predictions about the size and timing of the second wave. In this analysis, we have collated two sources
of alternative data in an effort to characterise the first wave by estimating the under-ascertainment of
mortality. We estimate that between 2% - 5% of deaths due to COVID-19 in Khartoum were reported
during the first wave. This range incorporates assumed biases in the surveys sourced to infer mortality
under-reporting. The levels of under-reporting suggest that the first wave in Khartoum was significantly
larger than official reported statistics with profound implications for predictions of the size of the second
wave.
The considerable uncertainty in both the mortality ascertained in official statistics and the levels of future
transmission result from limitations in relying on two data points to evaluate the likelihood of the inferred
epidemic trajectories for each level of under-ascertainment. Despite these limitations, we were
encouraged to find both data points suggested the same level of under-ascertainment, which predicts
substantial mortality increases due to COVID-19 to occur during the first wave between April and July.
During April and May, there were reports of burial numbers increasing in cemeteries in Khartoum.9 In this
report, across six large cemeteries in Khartoum, burials were documented to have roughly tripled from
497 to 1373 between April 2019 to April 2020 and from 704 to 2216 between May 2019 and May 2020.
Informally, we can use this increase in burials to evaluate the likelihood of the inferred dynamics in historic
mortality as follows. If the same increase in burials was observed across all cemeteries in Khartoum, we
would predict mortality to have tripled during the same period. Assuming the annual baseline mortality
for Khartoum is similar to World Bank estimates for Sudan in 2019 of 7 deaths per 1,000 people, we
estimate that baseline mortality would yield approximately 10,000 deaths during April and May in 2020.
The increase in mortality inferred from the cemeteries data yields 20,000 excess deaths during April and
May. Our estimate of 2% COVID-19 mortality being reported predicts that 10,800 (95% CI: 8,990 - 13230)
COVID-19 deaths occurred during April and May, which would represent roughly half the excess mortality
and a third of total mortality estimated. This proportion of mortality attributed to COVID-19 is comparable
to reports of a third of mortality increases in North Darfur observed in May due to COVID-19.19 The
increase in mortality we infer in Khartoum is also comparable to undocumented increases in mortality
observed in other settings. For example, the COVID-19 attributable proportion of excess mortality we infer
is similar to estimates in Kano state, Nigeria. In Kano, baseline mortality was observed to have quadrupled
during April, with further investigation suggesting that half of the excess deaths due to COVID-19.20 Both
of these informal calculations lend support to our estimates of the mortality missed in Khartoum during
the first wave and the resultant levels of population immunity we infer exist in Khartoum.
In our analysis, we predict that the high levels of population immunity acquired during the first wave will
limit the size of the emerging second wave. It is important, however, to note that this is dependent on the
estimated mortality ascertained and infection conferring effective immunity for the duration of the
01 December 2020 Imperial College COVID-19 response team
DOI: https://doi.org/10.25561/84283 Page 12 of 17
analysis. We have noted that the two surveys used in this analysis are likely upwardly biased, which could
mean that up to 5% of COVID-19 deaths have been reported. If true, the level of immunity in the
population would be lower and there would be greater potential for the emerging second wave to be
larger than the first wave. Crucially, the early signs of a second wave could follow trajectories in mostly
high income countries, which due to effective lockdowns have resulted in low levels of immunity. If this is
the case, the second wave will continue to increase in the absence of new suppression measures.21
Alternatively, the early signs of a second wave could lead to a smaller epidemic which is being sustained
by infection circulating within specific communities who were able to shield effectively during the first
wave. This is a pattern that has been observed in a number of Latin American cities that reached herd
immunity after suffering large, unmitigated epidemics.22 These epidemics were then followed by smaller
second waves with transmission circulating in wealthier individuals who were able to shield and work
from home effectively during the first wave.23 Regardless, effective shielding and epidemic profiling within
Khartoum will help to both reduce ongoing transmission and help identify the more likely of the two
hypothesised epidemic trajectories.

01 December 2020 Imperial College COVID-19 response team
DOI: https://doi.org/10.25561/84283 Page 13 of 17
3. Supplementary Material
3.1 Supplementary Figures
Supplementary Figure 1. Incidence of COVID-19 cases and deaths due to COVID-19 in Khartoum and other
states. The majority of cases and deaths have been reported in Khartoum (shown in blue), with the epidemic
declining after June and fading by September in all states. Each point is a daily recorded number of deaths or
cases, with the weekly average shown as a line. Cases data is only presented between May and October.
Supplementary Figure 2. Inferred mobility trends for Khartoum in 2020. The vertical dashed line was the final
date when conducting model fitting to mortality.

01 December 2020 Imperial College COVID-19 response team
DOI: https://doi.org/10.25561/84283 Page 14 of 17
3.2 Supplementary Methods
3.2.1 Further notes on mobility and parameters assumed for modelling Khartoum
In our work in Damascus, we believed our approach of inferring mobility based on government
intervention was justified due to the strong predictive performance of the model we use for inferring
relative mobility in neighbouring countries. We make the same decision, however only two nearby
countries to Sudan (Egypt and Saudi Arabia) have Google mobility data (Supplementary Figure 1). Of
interest is that of the immediate neighbouring countries, Sudan has a significantly lower mobility inferred,
likely due to their continued use of lockdowns, curfews, travel bans and stricter penalties for non-
adherence between May and July.
Supplementary Figure 1. Performance of Boosted Regression Tree model for predicting mobility in North East
Africa and Saudi Arabia. The points in the Saudi Arabia and Egypt plot show the observed national mobility from
the Google Mobility Reports. The red line shows the prediction of the Boosted Regression Tree model that infers
mobility based on government interventions reported in the ACAPs database. The true mobility profile is only
known for Egypt and Saudi Arabia, with mobility in other countries having to be predicted from intervention data.

01 December 2020 Imperial College COVID-19 response team
DOI: https://doi.org/10.25561/84283 Page 15 of 17
3.2.2 Model Parameters
Model parameters and sensitivity analysis conducted is shown in Supplementary Table 1 below.
Although not a model parameter, uncertainty in the serological survey and the symptomatic social
media survey was explored by altering the observed
Supplementary Table 1: Sensitivity Analysis Details. All combinations of parameters below were
explored. The default parameter values are shown in bold, with % of Deaths ascertained not having
any value in bold as this was the investigated parameter we were scanning across.
Description Values
% of Deaths Ascertained 0.50%, 1.00%, 2.00%, 3.00%, 5.00%, 7.50%, 10.00%
Number of functional hospital beds 2 000, 4 640,24 6 000
Number of functional ICU beds 50, 75,25 100
% of beds occupied by non-COVID-19
patients 35%, 55%,24 75%
Population Size of Khartoum 8,877,14726
Demographic Profile of Damascus
Relative to Sudan Older,26 Same as Sudan
Poorer health outcomes for patients
with oxygen indicated due to
insufficient oxygen supply
True (CFR elevated in individuals with high flow oxygen
indicated as in Walker et al11), False (Same IFR as in Verity
et al.27)
Bias in surveys used as alternative data
source
No bias, 50% reduction in estimated symptomatic attack
rate and a 25% reduction in individuals enrolled in FTEP
survey who are PCR+/ICT- to reflect increased enrollment
in individuals currently infected

01 December 2020 Imperial College COVID-19 response team
DOI: https://doi.org/10.25561/84283 Page 16 of 17
4. References
1. Bo, Y. et al. Effectiveness of non-pharmaceutical interventions on COVID-19 transmission in 190
countries from 23 January to 13 April 2020. Int. J. Infect. Dis. (2020) doi:10.1016/j.ijid.2020.10.066.
2. Mbow, M. et al. COVID-19 in Africa: Dampening the storm? Science 369, 624–626 (2020).
3. Oliver J. Watson, Mervat Alhaffar, Zaki Mehchy, Charles Whittaker, Zack Akil, Mazen Gharibah,
Imperial College COVID-19 Response Team, Francesco Checchi, Neil Ferguson, Azra Ghani, Emma
Beals, Patrick Walker, Anonymous Authors. Report 31 - Estimating under-ascertainment of COVID-
19 mortality: an analysis of novel data sources to provide insight into COVID-19 dynamics in
Damascus, Syria. (2020) doi:10.25561/82443.
4. Syria in Context Investigation: COVID-19 Spreads out of Control in Damascus.
https://tande.substack.com/p/syria-in-context-investigation-covid (2020).
5. Besson, E. K. et al. Excess mortality during the COVID-19 pandemic in Aden governorate, Yemen: a
geospatial and statistical analysis. medRxiv (2020) doi:10.1101/2020.10.27.20216366.
6. Stephanie Findlay, J. S. Delhi accused of under-reporting coronavirus deaths. Financial Times (2020).
7. Briceño, F. Peru probes whether 27,253 coronavirus deaths uncounted. The Washington Post (2020).
8. Tanzeem, A. COVID-19 Deaths, Patients Grossly Under-Reported in Pakistan. Voice of America (2020).
9. ‘Thousands of stories of grief’ ... (Bag News) reveals in an investigation into death figures. (2020).
10. Altayb, H. N., Altayeb, N. M. E., Hamadalnil, Y., Elsayid, M. & Mahmoud, N. E. The current situation
of COVID-19 in Sudan. New Microbes New Infect 37, 100746 (2020).
11. Walker, P. G. T. et al. The impact of COVID-19 and strategies for mitigation and suppression in low-
and middle-income countries. Science 369, 413–422 (2020).
12. Watson, O. J. et al. mrc-ide/squire: v0.5.4. (2020). doi:10.5281/zenodo.4282801.
13. Mohamed, F., Satti, S. S., Maram, Ahmed, A. & Babiker, S. F. Estimation of Coronavirus (COVID-19)
Infections in Khartoum State (Sudan). (2020).
14. Sudan FETP Conducts Targeted Testing for COVID-19 in Khartoum State.
https://www.tephinet.org/sudan-fetp-conducts-targeted-testing-for-covid-19-in-khartoum-state.
15. Hale, Thomas, Noam Angrist, Emily Cameron-Blake, Laura Hallas, Beatriz Kira, Saptarshi Majumdar,
Anna Petherick, Toby Phillips, Helen Tatlow, Samuel Webster (2020). Oxford COVID-19 Government
Response Tracker, Blavatnik School of Government. https://www.bsg.ox.ac.uk/research/research-
projects/coronavirus-government-response-tracker.
16. Report 34 - COVID-19 Infection Fatality Ratio Estimates from Seroprevalence.
https://www.imperial.ac.uk/mrc-global-infectious-disease-analysis/covid-19/report-34-ifr/.
17. Borremans, B. et al. Quantifying antibody kinetics and RNA detection during early-phase SARS-CoV-
2 infection by time since symptom onset. Elife 9, (2020).
18. Davies, N. G. et al. Age-dependent effects in the transmission and control of COVID-19 epidemics.
Nat. Med. 26, 1205–1211 (2020).
19. High mortality rates in North Darfur capital partly due to coronavirus.
https://www.dabangasudan.org/en/all-news/article/high-mortality-rate-in-north-darfur-capital-
partly-caused-by-coronavirus.
20. At least half of mystery deaths in Nigeria’s Kano due to COVID-19 - minister. Reuters (2020).
21. Report 36 - Modelling ICU capacity under different epidemiological scenarios of the COVID-19

01 December 2020 Imperial College COVID-19 response team
DOI: https://doi.org/10.25561/84283 Page 17 of 17
pandemic in three western European countries. https://www.imperial.ac.uk/mrc-global-infectious-
disease-analysis/covid-19/report-36-icu-capacity.
22. Buss, L. F. et al. COVID-19 herd immunity in the Brazilian Amazon. medRxiv 2020.09.16.20194787
(2020).
23. Prowse, T. A. A. et al. Inferred resolution through herd immmunity of first COVID-19 wave in Manaus,
Brazilian Amazon. medRxiv 2020.09.25.20201939 (2020).
24. Statistics on Hospital Sector in Sudan. https://sudannextgen.com/wp-
content/uploads/2019/10/Statistics-on-Hospital-sector-in-Sudan-2.pdf.
25. Sulieman, H., El-Mahdi, W., Awadelkareem, M. & Nazer, L. Characteristics of Critically-Ill Patients at
Two Tertiary Care Hospitals in Sudan. Sultan Qaboos Univ. Med. J. 18, e190–e195 (2018).
26. Ocha, U. N. Sudan: Population Density and Potential COVID-19 Hotspots.
https://reports.unocha.org/en/country/sudan/card/ZXsJqLs913/ (2020).
27. Verity, R. et al. Estimates of the severity of coronavirus disease 2019: a model-based analysis. Lancet
Infect. Dis. 20, 669–677 (2020).