POWER GENERATION - PACRA
36
POWER GENERATION An Overview January 2021 © The Pakistan Credit Rating Agency Limited.
Transcript of POWER GENERATION - PACRA

POWER GENERATIONAn Overview
January 2021© The Pakistan Credit Rating Agency Limited.

TABLE OF CONTENTS
Contents Page No.
Energy Mix | A Comparison 1
Power | An Overview 2
Structure of the Industry 3
Installed Capacity & Utilization 4
Fuel Mix in Installed Capacity 5
Fuel Mix in Electricity Generation 6
Installed Capacity | Entity Wise 8
An Overview of Power Plants 9
Sector Wise Consumption & Tariffs 10
WAPDA | An Overview 11
Contents Page No.
Demand & Supply During Peak Hours 12
Generation License & CODs 13
Upcoming Projects 14
The Risk Matrix 20
Circular Debt 21
IPPs | An Overview 24
Power Tariffs 25
Business Risk 26
Financial Risk 28
Latest Developments 30
SWOT Analysis 31
Rating Curve 32
Outlook 33

Source: BP Statistical Review of World Energy - 2020 1
POWER GENERATION
ENERGY MIX | A Comparison
41% 38% 35% 35%
34% 34%31% 26%
7% 8%13% 15%
3% 6% 9% 11%11% 10% 8% 8%0% 0% 0% 0%
0%
10%
20%
30%
40%
50%
60%
70%
80%
90%
100%
FY16 FY17 FY18 FY19
Pakistan Energy Mix
Gas Oil Coal LNG Import Hydro Nuclear Renewable LPG Imported Electricity
• World Energy Mix is dominated by fossil fuels, particularly oil (~33%) coal (~24%) and natural gas (27%), despite increasing need to shift towards cleaner fuels for environment safety and depleting world oil reserves.
• Pakistan’s energy mix is diversified in comparison to global mix of fuels. Though fossil fuels dominate Pakistan’s mix too, it consists of a fair share of hydel energy (~8%). Moreover, Pakistan has lately been relying on imported LNG for meeting its energy demand whose share has increased to a prominent 11% in total fuel mix of the country.
33% 34% 34% 33%
28% 28% 27% 24%
24% 23% 24% 27%
7% 7% 7% 6%4% 4% 4% 4%4% 4% 4% 5%
0%
10%
20%
30%
40%
50%
60%
70%
80%
90%
100%
CY16 CY17 CY18 CY19
World Energy Mix
Oil Coal Gas Hydro-Electricity Nuclear Energy Renewable Energy

Source: Pakistan Energy Year Book and Pakistan Economic Survey 2
POWER GENERATION
Overview
• Energy is the engine of all Sectors of the economy. Energy consumption needs are directly related to the GDP growth of a country.
• Pakistan’s GDP contracted by ~0.4% in FY20, owing to the unprecedented outbreak of Covid-19 pandemic (~1.2% growth in FY19).
• Pakistan’s primary energy supplies (forms of energy converted to final energy) comprise of oil, gas, coal, nuclear electricity and hydro-electricity net generation, while final energy products (converted from primary energy supplies) consist of gasoline, diesel, purified coal, purified gas, electricity and mechanical energy.
• The Country’s Power Sector is classified into three verticals (i) Generation, (ii) Transmission and (iii) Distribution. This Sector Study shall focus on the statistics and analysis of the Power Generation System.
Source: NEPRA 3
POWER GENERATION
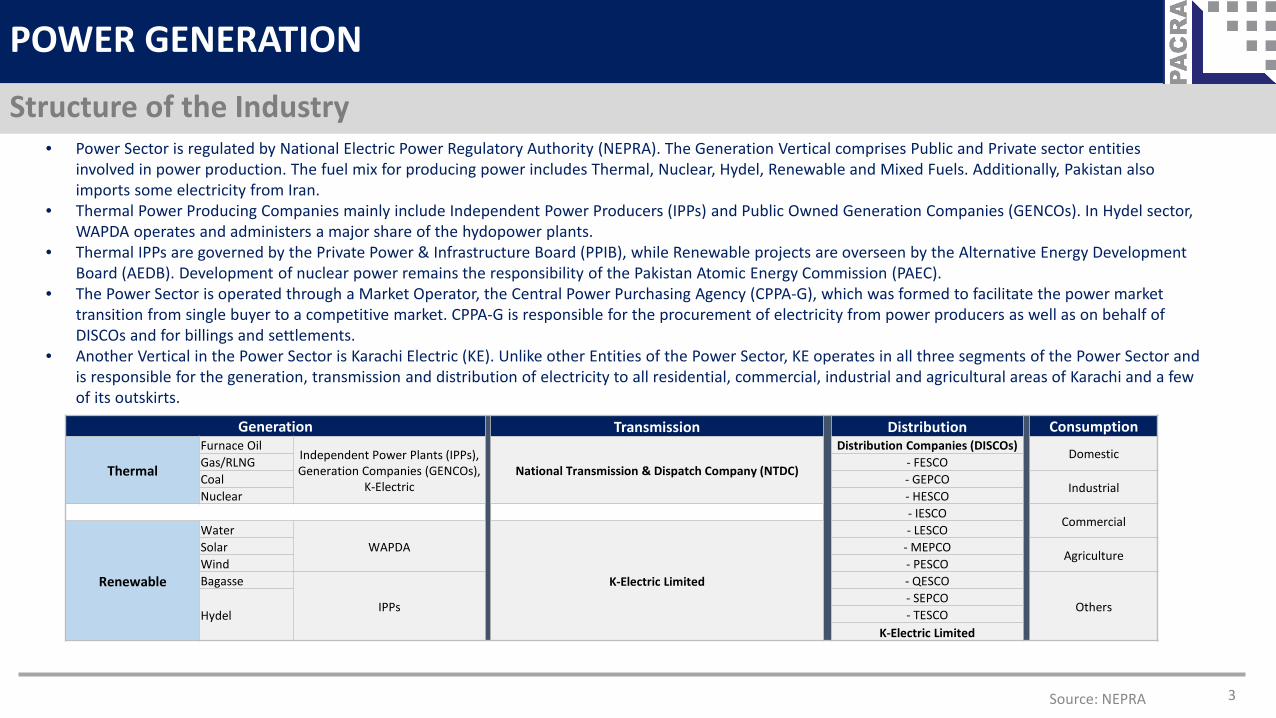
Structure of the Industry• Power Sector is regulated by National Electric Power Regulatory Authority (NEPRA). The Generation Vertical comprises Public and Private sector entities
involved in power production. The fuel mix for producing power includes Thermal, Nuclear, Hydel, Renewable and Mixed Fuels. Additionally, Pakistan also imports some electricity from Iran.
• Thermal Power Producing Companies mainly include Independent Power Producers (IPPs) and Public Owned Generation Companies (GENCOs). In Hydel sector, WAPDA operates and administers a major share of the hydopower plants.
• Thermal IPPs are governed by the Private Power & Infrastructure Board (PPIB), while Renewable projects are overseen by the Alternative Energy Development Board (AEDB). Development of nuclear power remains the responsibility of the Pakistan Atomic Energy Commission (PAEC).
• The Power Sector is operated through a Market Operator, the Central Power Purchasing Agency (CPPA-G), which was formed to facilitate the power market transition from single buyer to a competitive market. CPPA-G is responsible for the procurement of electricity from power producers as well as on behalf of DISCOs and for billings and settlements.
• Another Vertical in the Power Sector is Karachi Electric (KE). Unlike other Entities of the Power Sector, KE operates in all three segments of the Power Sector and is responsible for the generation, transmission and distribution of electricity to all residential, commercial, industrial and agricultural areas of Karachi and a few of its outskirts.
Generation Transmission Distribution Consumption
Thermal
Furnace OilIndependent Power Plants (IPPs), Generation Companies (GENCOs),
K-ElectricNational Transmission & Dispatch Company (NTDC)
Distribution Companies (DISCOs)Domestic
Gas/RLNG - FESCOCoal - GEPCO
IndustrialNuclear - HESCO
- IESCOCommercial
Renewable
WaterWAPDA
K-Electric Limited
- LESCOSolar - MEPCO
AgricultureWind - PESCOBagasse
IPPs
- QESCO
OthersHydel
- SEPCO- TESCO
K-Electric Limited
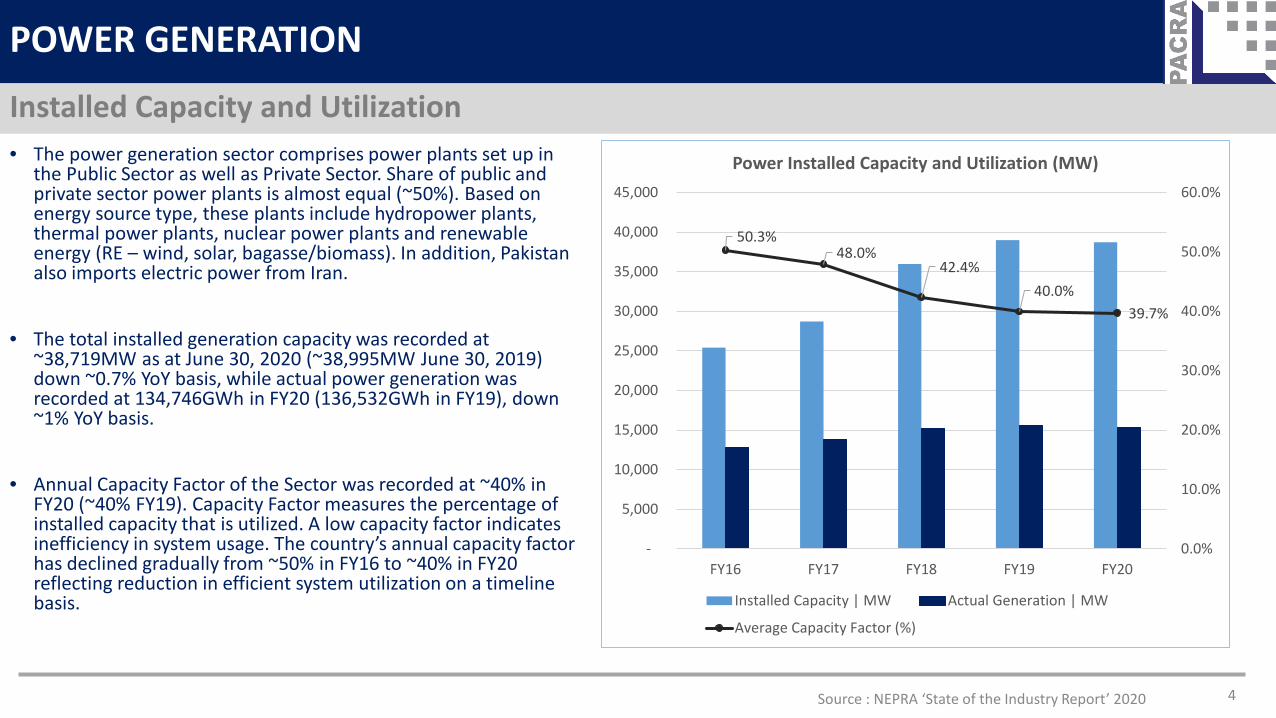
• The power generation sector comprises power plants set up in the Public Sector as well as Private Sector. Share of public and private sector power plants is almost equal (~50%). Based on energy source type, these plants include hydropower plants, thermal power plants, nuclear power plants and renewable energy (RE – wind, solar, bagasse/biomass). In addition, Pakistan also imports electric power from Iran.
• The total installed generation capacity was recorded at ~38,719MW as at June 30, 2020 (~38,995MW June 30, 2019) down ~0.7% YoY basis, while actual power generation was recorded at 134,746GWh in FY20 (136,532GWh in FY19), down ~1% YoY basis.
• Annual Capacity Factor of the Sector was recorded at ~40% in FY20 (~40% FY19). Capacity Factor measures the percentage of installed capacity that is utilized. A low capacity factor indicates inefficiency in system usage. The country’s annual capacity factor has declined gradually from ~50% in FY16 to ~40% in FY20 reflecting reduction in efficient system utilization on a timeline basis.
Source : NEPRA ‘State of the Industry Report’ 2020 4
POWER GENERATION
Installed Capacity and Utilization
50.3%48.0%
42.4%40.0%
39.7%
0.0%
10.0%
20.0%
30.0%
40.0%
50.0%
60.0%
-
5,000
10,000
15,000
20,000
25,000
30,000
35,000
40,000
45,000
FY16 FY17 FY18 FY19 FY20
Power Installed Capacity and Utilization (MW)
Installed Capacity | MW Actual Generation | MW
Average Capacity Factor (%)

5
POWER GENERATION
Fuel Mix in Installed Capacity• Thermal Energy Mix continues to contribute the highest to the installed power generation capacity of the country, followed by hydel
electricity capacity which now stands at ~25% of the total Installed Capacity of the country.
66% 66% 67% 66% 65%
28% 25% 24% 25% 25%
3% 4% 4% 4% 4%3% 5% 5% 5% 6%
0%10%20%30%40%50%60%70%80%
FY16 FY17 FY18 FY19 FY20
Country Installed Capacity | Mix
Thermal Hydel Nuclear Renewable Energy
Source : NEPRA ‘State of the Industry Report’ 2020

6
POWER GENERATION
Fuel Mix in Electricity Generation
26%20%
23%28%
65%69%
65%61%
5% 7% 7% 7%2% 3% 4% 3%1% 1% 2% 1%
0%
10%
20%
30%
40%
50%
60%
70%
80%
FY17 FY18 FY19 FY20
Overall Electricity Generation Mix (%)
Hydel Thermal Nuclear Renewable Energy Others
49%
1%
47%
1% 2%
32%
23%
31%
13%
1%
31% 34%
15%19%
0%
25%
33%
10%
32%
0%0%
10%
20%
30%
40%
50%
60%
Gas RLNG RFO Coal HSD
Thermal Fuels Mix (%)
FY17 FY18 FY19 FY20
• Like Installed capacity, thermal energy also contributes the highest to the generation mix. However, a recent increase in hydel power generation has led to a drop in thermal mix from ~65% in FY19 to ~61% in FY20 . Likewise, Within the thermal segment, a shift is being observed from Gas and RFO to alternate fuels, i.e., RLNG and Coal, the first due to its depleting reserves and the latter due to high cost of generation.
Source : NEPRA State of the Industry Report

*Others include import from Iran and mixed fuels 7
POWER GENERATION
Fuel Wise Generation Mix and Cost
0%
10%
20%
30%
40%
50%
60%
70%
80%
90%
100%
FY17 FY18 FY19 FY20
31%21%
10% 6%
32%
22%
21%15%
1%
16%
23%
20%
1% 9%12%
19%
5%7% 7%
8%
26% 20% 23% 28%
3% 4% 4% 4%
Fuel Mix in Power Generation
RFO Gas RLNG Coal HSD Nuclear Hydel Others*
FY17 FY18 FY19 FY20
8.1 10.3
14.3 14.5
7.2 8.1 9.6
11.5
5.4 7.9
9.8 9.5
4.3 5.2 6.4 6.1
13.7 13.8 14.0
22.7
1.01 1 0.98 1.02
Average Fuel Cost | PKR/kWh
RFO Gas RLNG Coal HSD Nuclear
• Share of RFO in total power generation has dropped significantly from ~31% in FY17 to ~6% in FY20.• The country’s depleting natural gas reserves are necessitating a shift of fuel from gas to imported RLNG and coal, first imported in 2015. Additionally.
Imported RLNG has a comparatively lower fuel cost as compared to other costlier fuels, i.e., RFO and HSD.• HSD is the most expensive source of fuel for electricity supply. Its share in country generation mix is restricted to ~1% and lower.• The cheapest source of fuel are renewable energy sources followed by hydel energy. The fuel cost component in these energy sources is almost
negligible. While hydel power contributes around ~28% to the electricity generation, renewable energy sources together (solar, wind, bagasse) make up a nominal share of ~3%.
Source : NEPRA ‘State of the Industry Report
8
POWER GENERATION
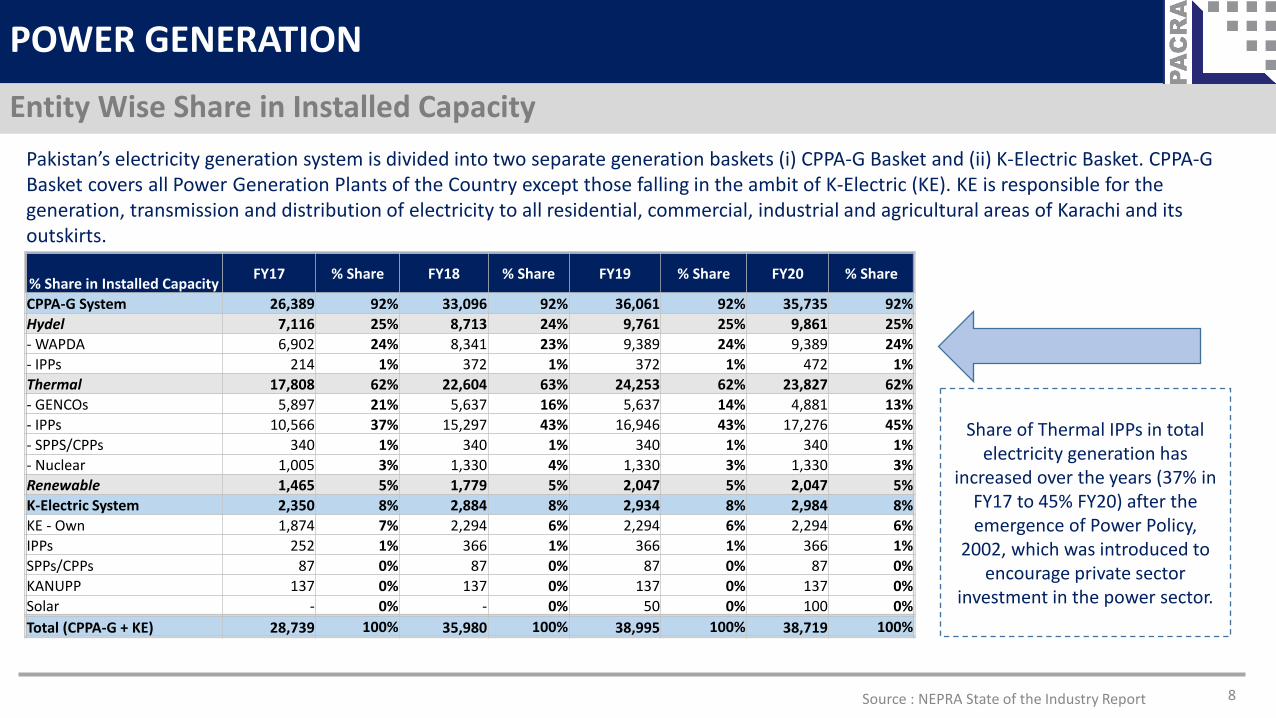
Entity Wise Share in Installed CapacityPakistan’s electricity generation system is divided into two separate generation baskets (i) CPPA-G Basket and (ii) K-Electric Basket. CPPA-G Basket covers all Power Generation Plants of the Country except those falling in the ambit of K-Electric (KE). KE is responsible for the generation, transmission and distribution of electricity to all residential, commercial, industrial and agricultural areas of Karachi and its outskirts.
% Share in Installed Capacity FY17 % Share FY18 % Share FY19 % Share FY20 % Share
CPPA-G System 26,389 92% 33,096 92% 36,061 92% 35,735 92%Hydel 7,116 25% 8,713 24% 9,761 25% 9,861 25%- WAPDA 6,902 24% 8,341 23% 9,389 24% 9,389 24%- IPPs 214 1% 372 1% 372 1% 472 1%Thermal 17,808 62% 22,604 63% 24,253 62% 23,827 62%- GENCOs 5,897 21% 5,637 16% 5,637 14% 4,881 13%- IPPs 10,566 37% 15,297 43% 16,946 43% 17,276 45%- SPPS/CPPs 340 1% 340 1% 340 1% 340 1%- Nuclear 1,005 3% 1,330 4% 1,330 3% 1,330 3%Renewable 1,465 5% 1,779 5% 2,047 5% 2,047 5%K-Electric System 2,350 8% 2,884 8% 2,934 8% 2,984 8%KE - Own 1,874 7% 2,294 6% 2,294 6% 2,294 6%IPPs 252 1% 366 1% 366 1% 366 1%SPPs/CPPs 87 0% 87 0% 87 0% 87 0%KANUPP 137 0% 137 0% 137 0% 137 0%Solar - 0% - 0% 50 0% 100 0%Total (CPPA-G + KE) 28,739 100% 35,980 100% 38,995 100% 38,719 100%
Share of Thermal IPPs in total electricity generation has
increased over the years (37% in FY17 to 45% FY20) after the emergence of Power Policy,
2002, which was introduced to encourage private sector
investment in the power sector.
Source : NEPRA State of the Industry Report

9
POWER GENERATION
An Overview of Power PlantsGeneration Type
Nature of Entities -Public/Private
Sector
No. of Power Plants
% Share in Country Installed Capacity* Major Power Plants
HYDEL
WAPDA Public 22 24%Major Hydropower units include Tarbela, Ghazi Barotha, Mangla Warsak and Chashma units
IPPs Private 8 1%30 25%
THERMALGENCOs Public 12 14% Major GENCOs include TPS Muzaffargarh and Jamshoro
IPPs Private 37 46%Major IPPs include KAPCO, Hub Power, Huaneng Shandong Ruyi, NPPMCL, Port Qasim Electric and China Power Hub
KE-Own Public 5 6% Major plant includes Bin Qasim TPS-I54 65%
NUCLEARCHASHNUPP & KANUPP Public 5 4%
5 4%RENEWABLE
Wind IPPs Private 24 3%Currently, all Wind Power projects have individual installed capacities of less than 100MWs.
Solar IPPs Private 6 1%Currently, all Solar Power projects have individual installed capacities of 100MWs or less.
Bagasse/BiomassPrivate
9 1%Currently, all Solar Power projects have individual installed capacities of 100MWs or less except Fatima Energy (installed capacity of 120MWs).
39 6%TOTAL INSTALLED POWER PLANTS 128 100%
*as at June 30, 2020
Source : NEPRA State of the Industry Report

Sector wise consumption includes CPPA-G + KE Average, while tariff chart includes PEPCO only.Others refer to ‘public lighting and bulk supply’
10
POWER GENERATION
Sector Wise Power Consumption Share & Average Tariffs
FY17 FY18 FY19 FY20
49% 50% 49% 51%
10% 10% 10% 9%
27% 27% 28% 26%
6% 6% 5% 5%8% 8% 9% 10%
Sector Wise Power Consumption (%)
Domestic Commercial Industries Agriculture Others
FY17 FY18 FY19 FY20
10.44 11.14 9.54
13.62
19.69 21.04
25.58
29.77
14.37 14.92 12.96
22.37
11.50 11.25 10.40 10.35
13.52 14.66
18.49
24.22
Sector Wise Average Tariffs Per Unit
Domestic Commercial Industries Agriculture Others
• Pakistan’s overall electricity consumption was recorded at ~112,069GWh for FY20 (~113,142GWh in FY19), down ~1% YoY basis. This is equivalent to ~83% of the total electricity generated for FY20 (~134,746GWh). Almost 87% of the Energy Sales is made through the CPPA-G System while the remaining ~13% is sold to the KE System. Pakistan’s average per capita electricity consumption hovers around ~4,000GWh.
• The household sector contributes the highest towards electricity consumption (~51% in FY20) while its tariff structure is on a fairly lower side, due to its dependence on hydro-electricity.
Source : NEPRA State of the Industry Report

Source: WAPDA 11
POWER GENERATION
WAPDA – What you need to know
A Brief History• Pakistan Water & Power Development Authority (WAPDA) was established through an Act of
Parliament in 1958. It is an autonomous and statutory body under the control of the Federal Government.
• WAPDA has four verticals – (i) Power Wing (ii) Water Wing (iii) Finance Wing and (iv) Administration Wing. WAPDA was unbundled in 2007 whereby the functions of its Power Wing were redefined as Hydel Power Generation and Operation & Maintenance (O&M) of power houses.
• Following this unbundling, WAPDA’s mandate is now focused on the development of water and hydropower resources in an efficient manner. The Power Wing of WAPDA is now split up into 15 different companies, i.e., NTDC, 10 DISCOs and 4 GENCOs, each having separate management.
• Currently WAPDA is operating 22 Hydel Power Plants with an installed capacity of ~9,861MW (~24% share overall). Hydro-electricity is a cheaper source of fuel in relevance to thermal generation. Therefore, thw GoP is keenly focused on undertaking new hydel power projects in order to supply electricity at cheaper rates.
• Several New Hydro Power Projects are under construction while some are ready to be constructed including Mohmand Dam, Diamer Basha Dam and Tarbela 5th Extension.

12
POWER GENERATION
Demand & Supply During Peak Hours
*‘Generation capability’ is the maximum generation capability of any day recorded during the year and ‘Demand’ is the maximum demand of any day recorded during the year.- NTDC only.
Year Generation capability (MW)
Demand during peak hours (MW)
Surplus / (Deficit) (MW)
ActualFY16 17,261 22,559 -5,298FY17 19,020 25,117 -6,097FY18 23,766 26,741 -2,975FY19 24,565* 25,627* -1,062FY20 27,780* 26,252* 1,528
Projected
FY21 30,582 29,325 1,257FY22 32,989 30,921 2,068FY23 35,896 31,953 3,943FY24 37,918 33,696 4,222FY25 39,157 35,422 3,735
• Pakistan’s total generation capacity has surpassed the country’s total electricity consumption need in recent times. In FY20, the country’s “generation capability, i.e., the maximum electricity that could be generated in a day has also gone into surplus as against the highest demand that could peak in a day. This means, that the country’s generation system is now sufficient enough to meet requirements of the highest demand of a day. This is true for NTDC Network.
• It is projected that by FY25, the Country’s NTDC Generation capability will exceed the demand during peak hours by ~3,735MW and by FY30.
• On the K-Electric front, there is still a supply deficit of ~402MW in generation capability and peak demand. This deficit is expected to turn into surplus in 2022.
Source : NEPRA State of the Industry Report

13
POWER GENERATION
Generation License & CODs | FY20 and 1HFY21
5%
93%
2%
Power Plants | COD in FY20 and 1HFY21
Hydel
Coal
Wind
• During FY20 and 1HFY21, the following power plants achieved Commercial Operations Date (COD):
Hydel: Gulpir Hydropower Project – Capacity 102MW – COD 10th March, 20 Coal” Engro Powergen Thar Coal Power Project – Capacity 660MW – COD – 10th July, 19. HUBCO Imported Coal Power Project –
Capacity 1,320MW – COD 17th Aug,19. Wind: Master Green Energy Limited – Capacity 50MW – COD Nov’20.
Capacity – Generation Licenses
TypeFY18 FY19 FY20
No. of Licenses Capacity No. of
Licenses Capacity No. of Licenses Capacity
Thermal - - 4 316Hydel 6 30 1 11.8 2 117Wind 8 410 1 50 4 138.7Solar 6 450 3 66.2 16 621.4Nuclear - - 1 1145Bagasse 8 237 4 148 - -Coal 2 65 2 336.5 - -
Solid waste - 1 40 - -RLNG 1 1279 - - -
31 2,471 12 653 27 2,338
Source : NEPRA State of the Industry Report

14
POWER GENERATION
Upcoming Projects | Hydel | WAPDA
Power Plants in Operation
FY20No.of Power
PlantsInstalled
Capacity (MW)WAPDA Hydel Power Plants 22 9,389
IPPs Hydel Plants 8 472
TOTAL 30 9,861
WAPDA Hydel Power Plants | Under Construction
Under Construction No.of Power Plants
Expected Capacity (MW) Location Expected Completion
Date Status
Dasu Hydropower Project 1 4,320 Dasu Town, Indus River Feb'23 Under Construction -
Physical Progress 3.25%
Kurram Tangi 1 83 Kurram River, Waziristan June'21 Under Construction -
Physical Progress 46%TOTAL 2 4,403
*Other Upgradations in process include Warsak Power Rehabiliation and Mangla Rehabilitation
WAPDA Hydel Power Plants | Ready for Construction
Ready for ConstructionNo. of
Dams/Project
Expected Capacity (MW) Location Expected Completion
Date Status
Mohmand Dam 1 800 Swat River,Mohmand District KP May'25 Ready For Construction
Diamer Basha Dam 1 4,500 Indus River, Chilas KP 9 Years after commencement To be commenced
Bunji 1 7,100 Indus River, Gilgit 9 Years after commencement To be commenced
Harpo 1 35 Harpo Nullah, Indus River
Phase-1: June'21Phase-II: 48 months
after Phase-IReady For Construction
Tarbela Extension 1 1,410 Swabi, KP 4.5 Years Ready For Construction5 13,845
• Currently, Hydel power contributes ~25% to the total Installed Capacity, of which WAPDA has almost ~95% of the share. WAPDA further envisages to increase installed hydropower capacity by ~18,248MWs of which projects worth ~4,403MWs are already under construction.
Source : WAPDA

15
POWER GENERATION
Upcoming Projects | Hydel | IPPsIPPs | Upcoming Projects
Projects No. of Plants Expected Capacity (MW) Location Expected Completion Date Status
Karot Hydropower Project** 1 720 Jehlum River, Rawalpindi Dec'21 Financial Close Achieved - Under Construction
Suki Kinari Hydropower 1 884 Kunhar River, Mansehra KP Dec'22 Financial Close Achieved - Under Construction
Raili - II Hydropower 1 7 Ghori Wala Nullah, Muzafarrabad AJK Jan'23 LOS issued under Financial Close -
Under Construction
Kathai-II Hydropower 1 8 Kathai Nullah Hattian, AJK May'24 LOS issued - FC in progress
Azad Pattan Hydropower 1 701 Jhelum River, Sudhnoti, AJK Sep'26 LOS issued - FC in progress
Kohala Hydropower 1 1,124 Jhelum River, Kohala, AJK Dec'27 LOS issued - FC in progress
Athmuqam Hydropower 1 450 Neelum River, AJK Dec'28 LOI Issued - Tariff determination process
Turtonas- Uzghor Hydropower 1 82 Golen Gol River, Chitral, KP Dec'28 LOI Issued - Tariff determination process
Mahi Hydropower 1 640 Jhelum River, AJK/PUNJAB June'29 LOI Issued - LOS in progress- Tariff determination process
Ashkot Hydropower 1 300 Neelum River, AJK Dec'30 Under Evaluation10 4,916
**CPEC ProjectDated: Dec, 04 -2020
• Alongside WAPDA, Hydel IPPs also embark on significant additions to their installed capacity in the next 10 years. Most of the projects are located in the KP and AJK regions.
• Together, WAPDA and Hydel IPPs are projecting to uplift the Hydel Installed Capacity of the country to ~33,025MWs in the next 10 years.
Source : PPIB

16
POWER GENERATION
Upcoming Projects | Thermal | IPPs
Thermal Power Plants | Under Construction
Under Construction Sponsor Expected Capacity Location Fuel Expected Completion Status
Thar Coal Based Power Project
Lucky Electric Company Limited 660 Port Qasim, Khi Coal Mar'21 FC Achieved - Under Construction
1263 MW RLNG based Project PTPL 1,263 Trimmu Barrage,
Jhang RLNGOpen Cycle by June'21
Combined Cycle by Dec'21
FC Achieved - Under Construction
Thar Coal Based Power Project Thar Energy Limited 330 Thar Block-II Sindh Coal Dec'21 FC Achieved - Under Construction
Thar Coal Based Power Project
Thar Coal Block-I Power Generation Co. Ltd. 1,320 Thar Block-I Sindh Coal May'22
FC Achieved - Under Construction
Thar Coal Based Power Project
Thal Nova Power Thar (Pvt.) Ltd. 330 Thar Block-II Sindh Coal June'22 FC Achieved - Under Construction
300 MW Imported Coal Based Power Project CIHC Pak Power Co. Ltd 300 Gwadar, Balochistan Coal June'23 LOS issued, FC In progress
330 MW Coal Based Power Project
SiddiqSons Energy Limited 330 Thar Block-I Sindh Coal July'23 LOS issued, FC In progress
1320 MW Coal Based Power Project
Oracle Coal Fields PLC England 1,320 Thar Block-VI Sindh Coal Dec'26 Project Proposal Under Evaluation
TOTAL 5,853
• Thermal IPPs contribute around 46% to the Country’s total Installed Capacity for power generation.• Pakistan has the 5th largest coal reserves in the world, i.e., total ~185bln tons and around ~176bln tons in the Tharparkar District of Sindh. The
Thar Blocks possess an immense potential for electricity generation. Therefore, almost ~78% of the Upcoming Thermal Power Projects are coal based.
Source : PPIB

Source: AEDB 17
POWER GENERATION
Upcoming Projects | Renewable | Solar IPPsSolar Power Plants | Under Construction
Project Name Expected Capacity (MW) Location Status
M/S Access Electric Pvt. Ltd. 10 Pind Dadan Khan Process of Achieving FC UnderwayM/S Bukhsh Solar Pvt. Ltd. 10 Lodhran Process of Achieving FC UnderwayM/S Safe Solar Pvt. Ltd. 10.28 Bahawalnagar Process of Achieving FC UnderwayM/S Access Solar Pvt. Ltd. 11.52 Pind Dadan Khan Process of Achieving FC UnderwayTOTAL 41.8
Solar Power Plants | To be Constructed
Project Name Expected Capacity (MW) Location Status
IPS Solar Park - IPS 22 Pvt. Ltd. 50 Nooriabad, Sindh Project DevelopmentIPS Solar Park - JA 23 Pvt. Ltd. 50 Nooriabad, Sindh Project DevelopmentIPS Solar Park - SB 24 Pvt. Ltd. 50 Nooriabad, Sindh Project DevelopmentR.E Solar I Pvt. Ltd 20 Dadu, Sindh Project DevelopmentR.E Solar II Pvt. Ltd 20 Dadu, Sindh Project DevelopmentET Solar Pvt. Ltd. 25 Thatta, Sindh Project DevelopmentACT Solar Pvt. Ltd. 50 Thatta, Sindh Project DevelopmentJanpur Energy Limited 12 Sultanabad, RYK Project DevelopmentLalpir Solar Energy Limited 12 Mehmood Kot, Muzzafargarh Project DevelopmentSiddiqsons Solar Ltd. 50 Kalar Kahar, Chakwal Project DevelopmentET Solar Pvt. Ltd. 50 Fateh Jang, Attock Project DevelopmentAsia Petroleum Limited 30 Bahawalnagar Project DevelopmentTOTAL 419

Source: AEDB 18
POWER GENERATION
Upcoming Projects | Renewable | Wind IPPsWind Power Plants | Under Construction
Project Name Expected Capacity (MW) Location StatusLakeside Energy (Pvt.) Ltd. 50 Jhampir District, Thatta FC Achieved in Nov'19 - Under Construction
Artistic Wind Power (Pvt.) Ltd. 50 Jhampir District, Thatta FC Achieved in Nov'19 - Under ConstructionLiberty Wind Power 1 (Pvt.) Ltd. 50 Jhampir District, Thatta FC Achieved in Nov'19 - Under Construction
Indus Wind Energy Limited 50 Jhampir District, Thatta FC Achieved in Nov'19 - Under ConstructionAct2 Wind (Pvt.) Limited 50 Jhampir District, Thatta FC Achieved in Nov'19 - Under Construction
Metro Power Company Ltd. 50 Jhampir District, Thatta FC Achieved in Nov'19 - Under ConstructionLiberty Wind Power 2 (Pvt.) Ltd. 50 Jhampir District, Thatta FC Achieved in Nov'19 - Under Construction
Master Green Energy Ltd. 50 Jhampir District, Thatta FC Achieved in Nov'19 - Under ConstructionGul Ahmed Electric Limited 50 Jhampir District, Thatta FC Achieved in Nov'19 - Under Construction
Din Energy Limited 50 Jhampir District, Thatta FC Achieved in Nov'19 - Under ConstructionNasda Green Energy (Pvt.) Ltd. 50 Jhampir District, Thatta FC Achieved in Nov'19 - Under ConstructionTricom Wind Power (Pvt.) Ltd. 50 Jhampir District, Thatta FC Achieved in Nov'19 - Under Construction
TOTAL 600
Wind Power Plants | To be Constructed
Project Name Expected Capacity (MW) Location Status
Western Energy Pvt. Ltd. 50 Jhampir District, Thatta Project DevelopmentBurj Wind Energy Pvt. Ltd 14 Gujju District, Thatta Project DevelopmentShaheen Foundation 51 Jhampir District, Thatta Project DevelopmentTrans Atlanstis Energy Pvt. Ltd 50 Jhampir District, Thatta Project Development
TOTAL 165

Source: AEDB 19
POWER GENERATION
Upcoming Projects | Renewable | Bagasse IPPsBagasse/Bio-mass Plants | To be Constructed
Project Name Expected Capacity (MW) Expected COD Status
Shahtaj Sugar Mills Ltd. 32 FY22
LOS Stage
Hunza Power (Pvt.) Ltd. 49.8 FY22Bahawalpur Energy Limited 31.2 FY22Indus Energy Limited 31 FY22Ittefaq Power (Pvt.) Ltd. 31.2 FY22Kashmir Power (Pvt.) Ltd. 40 FY22Alliance Sugar Mills Ltd. 30 FY22RYK Energy Limited 25 FY22Two Star Industries (Pvt.) Ltd. 48.9 FY22Mirpur Khas Energy Ltd. 26 FY22TAY Powergen Co. Pvt. Ltd. 30 FY22Hamza Sugar Mills Unit-II 30 FY22Faran Power (Pvt.) Ltd. 26.5 FY22Shiekhoo Power Ltd. 30 FY22Mehran Energy Ltd. 26.5 FY22Habib Sugar Mills Ltd. 26.5 FY22Sadiqabad Power (Pvt.) Ltd. 45 FY22 Tariff and Generation License requiredGothki Power (Pvt.) Ltd. 45 FY22TOTAL 604.6
Expected COD of Bagasse based Power Projects is subject to the outcomes of the Court decision as the projects are sub-judice and subject to review of the Tariff Determination by NEPRA.
• Pakistan is the fifth largest sugarcane producer in the world and has a potential to generate more than ~2,000MW of electricity through Co-Generation.

20
POWER GENERATION
THE RISK MATRIX• High Cost of Electricity: With the induction of substantial amount of generation capacity during last few years, though the availability of electricity
has improved significantly but the cost of electricity for end-consumers has increased owing to various reasons like high T&D losses, low recovery, circular debt, huge capacity payments, currency devaluation, fuel cost, under-utilization of efficient power plants etc.
• Circular Debt: (Covered in detail in the next sheet).
• Inefficiency in Power Generation: The availability factor of gas/RLNG power plants is 92%, coal power plants is 85% and RFO power plants is 88%. Under utilization of efficient power plants increases the cost of electricity and also spikes the burden of capacity payments for un-utilized capacity. The efficiency of GENCO power plants has also deteriorated over time which increases burning of more fuel and thus cost of generation.
• Non-Availability of RLNG to Power Plants: RLNG is a cheaper source of fuel being imported in the country due to depleting gas reserves. Non-availability of RLNG to gas based plants results in under-utilization or non-utilization of power plants.
• Centralized Control of DISCOs and GENCOs:
• Transmission Constraints: Overloading of transmission lines, insufficient transformation capacity of transformers, outages and faults are a few of the constraints in transmission system.
• Two Generation baskets in the Country: CPPA-G and KE. Efficiency can be achieved through one generation basket.
• Transmission & Distribution Losses: Transmission and Distribution (T&D) losses are not unusual in electrical power system but losses exceeding the acceptable limits increase the price of electricity unnecessarily for consumers.
Source : NEPRA State of the Industry Report

21
POWER GENERATION
CIRCULAR DEBT | THE UNFORTUNATE MENACE
What is Circular Debt?
Fuel Suppliers
Import Bill
DISCOs (CPPA-G)
CPPA-G on Behalf of
NTDC
Power Generation Companies
(IPPs, GENCOs
• The Power Generation Companies produce electric power which is sold to CPPA-G on behalf of DISCOs through the transmission Company – NTDC. The DISCOs supply the electric power to the end consumers.
• The CPPA-G has to make payments to the power producing Companies and NTDC on behalf of DISCOs within a given timeframe.
• The problem stems from the DISCOs being unable to make timely payments due to reasons including low recoveries from end consumers and T&D losses. This in turn hinders CPPA-G in making payments to power producing Companies and transmission Companies. The cycle goes on as the power producing Companies are unable to make payments to fuel suppliers. Under the PPAs, the delayed payments to power companies bears mark-up and increases financial liability.
Consumers Bills
Recoveries
Source : NEPRA State of the Industry Report

22
POWER GENERATION
Accumulation of Circular Debt
688,996 817,989
1,126,761
1,618,189
2,150,425
9%
19%
38%
44%
33%
0%
5%
10%
15%
20%
25%
30%
35%
40%
45%
50%
-
500,000
1,000,000
1,500,000
2,000,000
2,500,000
FY16 FY17 FY18 FY19 FY20
Circular Debt YoY Growth
TOTAL CIRCULAR DEBT (PKR mln) | LHS YoY Increase (%) | RHS
0%10%20%30%40%50%60%70%80%90%
100%
FY16 FY17 FY18 FY19 FY20
32% 35% 39% 43% 46%0% 0%
1% 1% 2%14% 11% 8% 6% 5%
53% 54% 52% 50% 47%
Components of Circular Debt | YoY
Payable to IPPs Payable to GENCOs
Payable to Fuel Suppliers by GENCOs PHPL Payables
• The total amount of circular debt has increased to PKR~2.3trn as at End-Nov’20, representing an increase of PKR~156bln in 5MFY21, a monthly run rate of PKR~32bln addition to the misnomer pile.
Source : NEPRA State of the Industry Report

23
POWER GENERATION
Circular Debt – Initiatives to stop accumulation
Major Components of Circular Debt - PKR bln FY20
Operational Inefficiencies 752Non-Payment by QESCO Agriculture Tubewell 306Limitations & Delays in Regulatory Approval 270Non-payment of subsidies 260Non-Payment by K-Electric 212Outstanding Amounts by AJK 144Others 140
Interest Payment on Power Sector Debt by PHPL 66Total Debt 2,150
In recent years, the major build-up in the circular debt has been caused by capacity payments to large power projects set up since 2015, primarily as part of the multibillion-dollar CPEC initiative, with Chinese money.
Circular debt is not only affecting the liquidity of the fuel supplier, generation, transmission and distribution companies but also increasing the cost of electricity for the end-consumer.
Higher T&D losses, low recoveries from DISCO’s, delay is subsidy payments, increasing receivables from public and private consumers are some of the major reasons contributing to mounting circular debt.
The strategies listed in the adjacent table are in consideration by the GoP to address the circular debt menace.
Issue Way ForwardExcess/expensive generationcapacity
-Negotiation with IPPs-Reduction of RoE of govt. owned power plants-Shut down of inefficient GENCOs-CPEC projects
Non-payment by K-Electric Early signing of PPA by K-Electric based on commercially viableterms
Outstanding amount of AJK Removal of GaP of AJ&K tariff differential-summary initiatedDelay tariff determinations Tariff rebasing to be announced by NEPRA to reduce the gapQuetta Agriculture tube wells Provincial govt. support required for recovery drive and
installationNon-payment of subsidies Full amount of summary to be budgeted and releasedPHPL interest charges Amendments of NEPRA Act
Source : NEPRA State of the Industry Report

24
POWER GENERATION
IPPs – What you need to know
A Brief History• Until 1980s, Pakistan was continually facing the chronic issue of
power shortage due to rapidly increasing power demand (7-8% YoY) and lower supply. The disruption in power supply was impeding the industrial progress of the country. This situation called for an immediate intervention by the GoP.
• Considering the fact that developing power generation capacity is capital intensive and could absorb a high portion of the allocated federal budget, the GoP made in principle decision to seek private sector investment in Power Generation. For this purpose, a dedicated organization – PPIB, was created as a one window facilitator for attracting private investment in the power sector.
• HUBCO was the first private power generation project in Pakistan, founded in 1994.
• Currently, there are 84 IPPs operational in the country. Private Power Projects include Foreign-Local partnerships, including groups like Nishat, Saphhire, Attock, Engro and Fauji group from the local side.
Key Features• Minimum Equity Requirement: The minimum equity requirement
for IPPs is 20% of the total project cost.
• Bulk Power Tariff: A Bulk Power Tariff of US Cents 6.5/kWh (in PKR) is offered to the IPPs by the GoP as an average for the first 10 years of sale of electricity. Additionally, a minimum levelized tariff of US Cents 5.9/kWh (PKR1.776/kWh) is set as the final parameter for the acceptance of the tariff. The tariff is indicative and is calculated on an annual plant factor of ~60%. The actual tariff has two components: Capacity Price & Energy Price.
• Capacity Price is paid to the IPPs on a monthly basis: it covers the debt servicing cost, fixed O&M costs, insurance expense and ROE. This monthly capacity price keeps the IPPs’ investors insulated against variations in energy purchased (‘Take or Pay’).
• The Energy Price is paid in PKR/kWh on actual energy sold by IPPs. • Moreover, a mechanism has been provided for
indexation/adjustment of the certain tariff components based on Rupee/Dollar exchange rate, fuel price variations and inflation.
Source : PPIB

Note: This is a general overview of the tariff structure and does not include details such as prior year adjustments, NEPRA fuel price benchmarking, etc. Source: https://www.sbp.org.pk/reports/quarterly/fy19/Third/Special-Section-1.pdf 25
POWER GENERATION
Power Tariffs – How they are determined
Generation:• At the generation level, the tariff is determined based on the
power purchase agreements (PPAs) between power producers (IPPs and GENCOs) and a single buyer – Central Power Purchasing Agency (CPPA-G).
• This tariff has three components: (1) Capacity Charge (CC) –majorly including construction and design costs of power units, debt financing charges and ROE (2) Energy Charge (EC) – majorly including price of fuel and (3) Variable Operations & Maintenance Costs (O&M).
• The Capacity Charge is indexed with parameters such as exchange rates and interest rates. Also, the capacity charge is based on ‘take or pay’ method, which implies that power producers are allowed to impose it irrespective of the amount of electricity produced and sold, unlike variable charges which are based on the amount of electricity produced and sold, reference fuel mix and their price.
In accordance with NEPRA Tariff Standard & Procedure Rules, 1998, NEPRA is responsible for determining the tariffs for all generation, transmission and distribution companies of the Sector. In order to understand the tariff system, it is divided into three levels (i) the generation level (ii) transmission level and (iii) distribution level.
Transmission:• At the transmission level, the tariff includes the ‘Use of System
Charge (UoSC) payable to NTDC. This amount is calculated using NTDC’s required revenue (after incorporating certain permissible expenses) divided by the sum of maximum demand index of all DISCOs and bulk power consumers connected to the NTDC transmission network.
Distribution• Finally, the retail tariff is determined at the distribution stage.
This includes tariff determined at the generation and transmission levels (CC + EC + O&M + UoSC) as well as fixed distribution margins of the DISCOs. Additionally, this tariff also includes allowed transmission and distribution losses.
• While the end-user tariff is determined by NEPRA, the actual tariff is notified by the Government to unify tariff across all DISCOs.
• This Sector Study focuses on the Business & Financial Risk of Independent Power Producers (IPPs).
• IPPs are Special Purpose Companies that operate in a firmly regulated environment, which shields them from multiple business and financial risks. Some cushions available against business risk are listed below:
IPPs enjoy tax-free status.
All IPPs are governed by project agreements (Implementation Agreement (IA), Power Purchase Agreement (PPA) and fuel/gas supply agreements), by way of which they are protected against multiple business and financial uncertainties.
The long term nature of PPAs spanning over a period of 25-30 years shields the IPPs from economic vicissitudes. Also, the underlying take-or-pay mechanism in the PPAs insulates them from the risk arising due to variations in the quantity of power purchased from them (through capacity charges).
IPPs operate in a single buyer market – the CPPA-G (and KE in its respect geography). Under the IA between the GoP and the IPPs, a Guarantee is provided by the GoP of the payment obligations of the Power Purchaser. Any failure of the Power Purchaser to fulfill its payment obligations towards the IPPs is secured by the Government Guarantee.
• The business risk of IPPs is largely linked to qualitative issues which can impede their operational performance. One of the key risks is the fuel supply risk. In the latest PPAs, the GoP does not guarantee the fuel supplier’s obligations underlying in the Fuel Supply Arrangement (FSA). In the event of non-performance of an FSA, the IPPs may be subject to operational risks due to underutilization or even closure of plants.
• Completion & Performance Risk: Completion Risk is the pre-COD risk related to the physical construction of the power plant and process parameters. Performance Risk, although begins even before COD, generally refers to the challenges relating to the operations & maintenance of the power plant post-COD.
Source: PACRA Database 26
POWER GENERATION
Business Risk – An Overview

Source: PACRA Database 27
POWER GENERATION
Business Risk | Latest Developments• Pakistan has been able to achieve power capacity surplus by far but at a very heavy cost of growing Circular Debt (CD) mammoth. IPPs,
the foreign-local partnerships, have historically been awarded guaranteed returns, fixed capacity payments and dollar indexation of the tariff. These increased capacity payments (specially on idle power plants), difficulty in cost pass through to end consumers and delayed tariff adjustments have resulted in a drastic spike to the CD menace. In order to arrest the growing concern, the GoP in Aug’20, had signed MoUs with 47 IPPs to address issues relating to mechanism of their payments, terms of tariff structure and other pertinent modalities. A snapshot of the major amendments to the PPAs with reference to tariff structure is given below:
Impact Revision Original
Tariff Component – ROE andROEDC | Local Investment
17% per annum (PKR)Current USD Equity shall be convertedto PKR @ an exchange rate ofPKR/USD 148.
15% (USD)
Tariff Component – ROE andROEDC | Foreign Equity
12% USD per annum
Tariff USD Indexation No YesLate Payment Surcharge (LPS)(Revised Rates shall beeffective only subject toensuring that payments followthe PPA mandated FIFOpayment principles)
Reduce to KIBOR + 2.0% for the first sixty days and then revert to KIBOR +
4.5% as per the PPA.KIBOR + 4.5%
O&M Savings**To be shared with the Power
PurchaserRetained by the
IPP
Receivables of the IPPs EssentialNot an essential
feature
NEPRA Tariff Components – IPPs Impact
Capacity Charges > Downward Impact on IPPs’ Incomes dueto:- Tariff delink with USD.- Revised Rates of ROE and ROEDC.> Positive Impact on IPPs’ cash flow due to:- Payments of IPPs’ receivables made anessential feature of the MoUs.
Fixed O&M – Foreign and Local
Working Capital CostsReturn on Equity (ROE)
Return on Equity During Construction (ROEDC)
Variable O&M
O&M – Foreign and Local
• Tariff delink with USD is expected to lower the income of the IPPs. On the contrary, the amendment obliging the payment of IPPs’ receivables is a positive development for the cashflows of the IPPs. According to news sources, the GoP has agreed to pay PKR~450bln outstanding dues to IPPs within a year, the modalities of which are being worked out.

Source: PACRA Database 28
POWER GENERATION
Financial Risk – An Overview
• Off-taker Risk: Unlike most other Corporates, IPPs operate in a single buyer market (CPPA-G/K-Electric). The off-taker for the IPPs is this single buyer. Although, dependence is concentrated on one Entity, the obligations of the off-taker are protected by a Sovereign Guarantee through the IA. This acts as a mitigant to the financial risk relating to the off-taker.
• Liquidity Risk: The financial discipline of the Power Sector is relatively weak. The DISCOs are subject to risk of non-payment by consumers which results in delayed payments to power purchaser ultimately creating volatility in cash payments to the IPPs. Any extended delays in payments compels the IPPs to obtain Sponsor Loan or external funding (short term borrowings (STBs)).
• Working Capital Financing: This risk emanates from the same factor as for liquidity risk. Volatility in recoveries from the off-taker balloons the receivable days for the IPPs – a component of the CD. Resultantly, IPPs are forced to obtain STBs to manage their Working Capital Needs, exerting pressure on their debt burden.
• Coverages & Capital: The minimum equity requirement for IPPs is ~20% of the project cost, the other component being debt. The IPPs, therefore, have a high exposure to External Funding. Financing Structure, including Minimum Debt Service Coverage Ratio, debt to equity movement and debt repayment schedule is critical.

Source: PACRA Database 29
POWER GENERATION
Financial Risk – An Insight
2.5 2.4 2.1 1.71.7
5.9 5.64.8
4.5
3.8
01234567
FY16 FY17 FY18 FY19 FY20
Coverages (x times)
Debt service coverage Interest coverage
0%
10%
20%
30%
40%
50%
0
50
100
150
200
250
FY16 FY17 FY18 FY19 FY20
IPPs | Working Capital & Circular Debt
Average Net Working Capital Days | IPPs (LHS)
Circular Debt YoY Growth (%) 9RHS)
• The Working Capital Cycle of IPPs is largely a function of their receivables which is one component of the CD. As witnessed in the first table, the annual percentage increase in CD has a direct correlation with the Net Working Capital days of the IPPs.
• The debt servicing capacity of the IPPs has reduced over the years due to increasing finance expense resulting from the need to manage larger receivables on the backdrop of blocked recoveries in the power sector. The coverages are, however, expected to improve going forward due to lower interest charge on account of policy rate cut by 625 bps.

• Covid-19 Response: 2020 has been a tough year for the local and global economy owing to the outbreak of unprecedented pandemic Covid-19 across the globe. Many major economies have trembled over the shocks caused by the virus and faced downturns like never before. Pakistan, has too absorbed the adversity but with a relatively lesser intensity than the developed countries. Being responsive to the crisis, the GoP, through the Power Division, provided relief measures to the masses to ensure provision of affordable power supply to the consumers.
A stimulus package of PKR~381bln was provided to ease the financial burden of residential consumers at the start of pandemic. Furthermore, the government launched another package recently to cater the SMEs. Some salient features of the new package for SMEs are: 1) Peak hours have been removed 2) Small and medium industries using additional power — as compared to their previous bills — will be provided electricity at a discount of 50pc till June 30, 2021 3) For next three years, all industries will be given a discount of 25pc for using additional units as compared to their previous bills. Additionally, bill deferments were allowed to masses to protect against financial crunch.
• IPPs | Amendments to the PPAs:
19 IPPs out of the 47 who signed the MoUs in Aug’20 have agreed to enter into the legally binding contracts with the GoP, the first of which were Solar and Bagasse IPPs. The development may still take time to become fully effective in shape of new agreements. Nevertheless, once the legal agreements are signed, it would be a turning point for the power sector. The ‘take-or-pay’ method of tariff structure will be revised as the O&Ms Savings shall be shared with the Power Purchaser. On the other hand, delinking components of tariff to USD index will also reduce the burden of capacity payments and related mounting debt financing costs. The other silo of this transaction - clearance of IPPs dues considered essential, is expected to resolve the circular debt issue to an extent. Meanwhile, this will also improve liquidity position of IPPs.
• Progress towards Hydel & Renewable Energy:
With sufficient resources available, the GoP is focused on increasing proportion of cleaner and cheaper fuel in the power generation of the country. Resultantly, 22 out of 27 licenses issued during FY20 pertained to Renewable and Hydropower plants. The mix of Power generation from Hydel energy has also improved during FY20. Mohmand Dam and Diamer Basha Dam, two of the mega projects in the hydel power, are also ready for construction.
Source: PACRA Database 30
POWER GENERATION
Latest Developments

Rating Curve
POWER GENERATION
− PACRA rates 27 entities in thePakistan’s Power industry
AAA AA+ AA AA- A+ A A- BBB+ BBB BBB- BB+ BB
PACRA 0 2 3 7 3 5 3 0 0 4 0 0VIS 0 2 4 3 2 2 6 0 0 0 0 0
0
1
2
3
4
5
6
7
8Rating Curve
31

32
POWER GENERATION
SWOT Analysis
• Single Buyer Market with two generation baskets,creating inefficiency in the generation system.
•Under-utilization of efficient plants: GENCOsefficiency scale has deteriorated over the years.
• Low Available Capacity Factor.•Use of High Cost fuels (RFO) results in increased
cost of generation.
•Backbone of the Economy•Players operate in a regulated environment.• Low Business Risk due to Risk Mitigants such as
Sovereign Guarantees on payment by purchaserand Performance Guarantees by theContractors.
Strengths
Threats Opportunities
Weaknesses
•Rising Circular Debt• Increased T&D Losses weakening the
financial discipline of power supply chain(Power Purchase Price accounts for only~65% of the end-consumer tariff).
• Liquidity Damages (LDs) on account of non-performance of FSA
•Change in regulatory environment leadingto lower/or no guaranteed off take for newplants and change of terms for existing ones
•Revival in Industrial Activity resulting inincreased demand.
•Amendment to PPAs in process to revise thepayment and tariff structure for powerpurchase from IPPs.
•Exploration of Coal reserves leading tosignificant coal based power projects; coal is acheaper fuel of energy.
• Investments in the Hydel and RenewableEnergy Power plants.

• Pakistan’s Power Sector is confronting deep-routed issues since long. The key risks being weak financial discipline and inefficiencies in all three verticals of the System. The Sector is, however, considered the backbone of economy and the GoP is keen on developing long term sustainable solutions to the ingrained power issues. Apart from the rising circular debt, some positive developments have surfaced on the economic and power sector level in the recent times.
• Industrial activity has picked up in various sectors with the Large Scale Manufacturing Industries output increasing ~5.46% YoY during the first four months of FY21. The sectors which have contributed to this growth are textiles, food & beverages, pharmaceuticals and chemicals.
• 19 IPPs out of the 47 who signed the MoUs in Aug’20 have agreed to enter into the legally binding contracts with the GoP, the first of which were Solar and Bagasse IPPs. The development may still take time to become fully effective in shape of new agreements. Meanwhile, payment of circular debt related dues under this agreement will improve liquidity position of IPPs.
• The decision taken by the State Bank of Pakistan (SBP) to lower the policy rate by 625bps to 7% in the last quarter of FY20 has lowered the finance costs incurred by power producers for financing availed to bridge liquidity gap.
• The inflation level in the country has also declined. The average inflation rate during the 1HFY21 stood at ~8.74% as compared to an average inflation rate of ~10.7% during FY20. Moreover, the exchange rate is also expected to remain stable in the near future.
• With sufficient resources available, the GoP is focused on increasing proportion of cleaner and cheaper fuel in the power generation of the country. Resultantly, 22 out of 27 licenses issued during FY20, pertained to Renewable and Hydropower plants. The mix of Power generation from Hydel energy has also improved during FY20. Mohmand Dam and Diamer Basha Dam, two of the mega projects in the hydel power, are also ready for construction.
33
POWER GENERATION
Outlook: Watch

• State Bank of Pakistan (SBP)• Water & Power Development Authority (WAPDA)• National Electric Power Regulatory Authority (NEPRA)• Private Power and Infrastructure Board (PPIB)• Alternative Energy Development Board (ADB)• BP Statistical Review of World Energy 2020• Pakistan Energy Year Book• Pakistan Economic Survey• PACRA Database
POWER GENERATION| BIBLIOGRAPHY
Research Team Saniya TauseefTeam Lead R&[email protected]
Qurat-ul-AinSenior [email protected]
Contact Number: +92 42 35869504
DISCLAIMERPACRA has used due care in preparation of this document. Our information has beenobtained from sources we consider to be reliable but its accuracy or completeness is notguaranteed. The information in this document may be copied or otherwise reproduced, inwhole or in part, provided the source is duly acknowledged. The presentation should not berelied upon as professional advice.