Photoemission study of in diluted magnetic semiconductor...
46
Photoemission study of room-temperature ferromagnetism in diluted magnetic semiconductor ZnGeP 2 :Mn Master Thesis Yukiaki Ishida Department of Physics, University of Tokyo January, 2003
Transcript of Photoemission study of in diluted magnetic semiconductor...

Photoemission study of
room-temperature
ferromagnetism
in diluted magnetic
semiconductor
ZnGeP2:Mn
Master Thesis
Yukiaki Ishida
Department of Physics, University of Tokyo
January, 2003

2

Contents
1 Introduction 5
2 Physical properties of ZnGeP2:Mn 13
2.1 Ternary chalcopyrite semiconductor ZnGeP2 . . . . . . . . . 13
2.2 Novel II-IV-V2 chalcopyrite-based DMS . . . . . . . . . . . . 15
2.3 Synthesis of II-IV-V2:Mn . . . . . . . . . . . . . . . . . . . . 17
2.4 Magnetization of II-IV-V2:Mn and bulk Zn1−xMnxGeP2 . . . 18
3 Results and discussions 23
3.1 Experimental . . . . . . . . . . . . . . . . . . . . . . . . . . 23
3.2 Photoemission spectra of ZnGeP2 substrate . . . . . . . . . 25
3.3 Mn deposition on ZnGeP2 . . . . . . . . . . . . . . . . . . . 25
3.4 Depth profile of ZnGeP2:Mn interface . . . . . . . . . . . . . 30
3.5 ZnGeP2:Mn prepared at
low temperatures . . . . . . . . . . . . . . . . . . . . . . . . 33
3.6 Photoemission spectra of MnP . . . . . . . . . . . . . . . . . 37
3.7 Magnetization measurements of
ZnGeP2:Mn . . . . . . . . . . . . . . . . . . . . . . . . . . . 38
4 Summary 43

4 Contents

Chapter 1
Introduction
The remarkable development currently made in the field of semiconductor
physics and nanotechnology is the manipulation of spins. During the past
decade, various types of spin polarization and its control have been made:
carrier spins, spins in magnetic ions, spins in superlattices, and even nuclear
spins, which were either injected, transported, changed of their spin states,
or exploited of their unique quantum nature [1.1, 2, 3, 4, 5]. The rapid devel-
opment of these spin manipulation is strongly associated with the progress
of semiconductor crystal growth and superstructure fabrication techniques.
In the field of crystal growth, one of the major impact was the develop-
ment of molecular beam epitaxy (MBE). MBE was a powerful technique for
the fabrication of diluted magnetic semiconductors (DMSs). This method,
which is a non-equilibrium growth technique, has allowed the incorporation
of transition and rare-earth metals into the host semiconductors beyond its
solubility limit [1.6, 7], that is, synthesis of products which were formerly
forbidden in the bulk has become possible. This led to the discovery of
III-V-based In1−xMnxAs [1.8] and Ga1−xMnxAs [1.9] films, which were the
first DMSs showing ferromagnetism. Furthermore, MBE has made possible
to prepare heterostructures of DMSs and semiconductors, allowing one to
explore over quasi-two-dimensional quantum wells of DMSs, as well as to
introduce artificial strain in layered DMSs.
DMS itself is already attractive because of its unique physical prop-
erties. The presence of localized magnetic ions in the semiconductor alloys
leads to the exchange interaction between the electrons constituting the local
moments of magnetic ions and the sp band electrons. This results in a large
Zeeman splittings of electronic (band and impurity) levels, effects of which
are manifested in the giant Faraday rotation [see Fig. 1.1 showing the en-
hanced magnetic circular dichroism (MCD) spectrum of Ga1−xMnxAs com-
pared to nonmagnetic GaAs] and the magnetic-field-induced metal-insulator

6 Chapter 1. Introduction
Figure 1.1: Enhanced magneto-optical effect observed in typical DMS
Ga1−xMnxAs. (a) MCD spectra of nondoped semi-insulating GaAs sub-
strate. (b)(c) MCD spectra of epitaxial Ga1−xMnxAs films at T = 5 K and
H = 1 T. Note that spectrum of GaAs has been magnified by a factor of
ten because of the weak signal (almost two orders weak) compared to that
of Ga1−xMnxAs.
transition. Particularly, the giant Faraday rotation in Cd1−xMnxTe and
Cd1−x−yHgyMnxTe are already utilized in commercial optical isolators.
The advent of the ferromagnetic DMSs In1−xMnxAs and Ga1−xMnxAs
added new possibilities to DMSs. Some newly fabricated devices are shown
in the following figures. Figure 1.2 shows the photoinduced ferromagnetism
realized in (In,Mn)As [1.1]. The photogenerated electron-hole pairs in the
GaSb substrate are split by the internal electrical field, so that the holes ac-
cumulate in the (In,Mn)As film on the surface [Fig. 1.2(a)]. Since (In,Mn)As
exhibits hole-induced ferromagnetism, the InMnAs film, which was formerly
a paramagnet, became a ferromagnet after light exposure [Fig. 1.2(b)(c)].
Another tactic device controlling the magnetic phase by an electrical
field is a field-effect transistor (FET) structure using (In,Mn)As [Fig. 1.3(a)]
[1.4]. The hole concentration in the (In,Mn)As layer is controlled by the
gate voltage. Through the hole-induced mechanism, the ferromagnetic phase
of InMnAs in the vicinity of TC was switched on and off by changing the
gate voltage. Figure 1.4 shows the p-n juction using magnetic semicon-

7
Figure 1.2: Photoinduced ferromagnetism in In1−xMnxAs [1.1]. (b) Magne-
tization curves at 5 K before (open circles) and after (soild circles) the light
irradiation. (c) Hall resistivity before (dashed line) and after (solid line) the
light irradiation. (b) and (c) show hysteritic curves after exposure to the
light.
Figure 1.3: Electric-field control of ferromagnetism in (In,Mn)As [1.4]. (a)
FET device using In1−xMnxAs. Negative bias (VG < 0) increases holes in
(In,Mn)As. (b) Hall resistance (RHall) showing hysterisis under negative
bias.

8 Chapter 1. Introduction
Figure 1.4: Electrical spin injection in ferromagnetic semiconductor het-
erostructure [1.3]. (a) Spin-polarized holes from p-(Ga,Mn)As (top) and
unpolarized electrons from n-GaAs substrate (bottom) are injected into
the quantum well (hatched region) under forward bias. (b) Electrolumi-
nescence intensity (solid curve) from the quantum well and its polarization
(red curve). The temperature is 6 K.
ductors, which succeeded in the injection of polarized spins into semicon-
ductors. Since the ferromagnetic (Ga,Mn)As is already highly resistive, it
was expected to render effective spin injection into semiconductors when
used as a spin polarizer. In fact, the p-i-n photodiode shown in Fig. 1.4 us-
ing (Ga,Mn)As as a p-type ferromagnetic semiconductor emitted a polarized
light through the recombination of polarized holes and unpolarized electrons
[1.3].
However, there were hampers for the use of the III-V-based ferromag-
netic DMSs, namely, the low Curie temperature (TC) and the difficulty in
controlling the carrier type and its density. As for Ga1−xMnxAs, the max-
imum TC has been ∼ 110 K and materials that show ferromagnetism is
restricted only to p-type doping. Achiving higher TC hopefully above room
temperature with controllable carrier types and densities have been one of
the strong driving forces for the fabrication of new ferromagnetic DMSs.
Particularly for the search of high-TC ferromagnetic DMSs, there has
been an interesting interplay between the theoretical calculations and ex-
periments. Dietl et al. [1.10] predicted, based on the mean field calculation

9
Figure 1.5: Prediction of TC for various DMSs. 2.5 % of Mn atoms in divalent
charge state and 3.5 × 10²⁰ holes per cm3 had been assumed [1.10].
(fig. 1.5), that high TC can be achieved in wide-gap semiconductors such
as ZnO and GaN, Katayama-Yoshida et al. [1.11] have also predicted the
same tendancy from ab initio calculations based on local spin-density ap-
proximation. Motivated by such material designing, there came issues of
the fabrication of new ferromagnetic DMSs, such as ZnO:Co [1.12], ZnO:V
[1.13], and GaN:Mn [1.14], whose TC exceeded room temperature.
An upheaval from the experimental side was the discovery of room-
temperature ferromagnetic DMSs based on ternary chalcopyrite semiconduc-
tors [1.15]. They were a group of interfacial copounds where Mn ions were
densely incorporated in the surface region of the chalcopyrite semiconductor
substrates (cf. Section 2.3). It includes ZnGeP2:Mn, which is the subject of
this thesis. After this discovery of high-TC chalcopyrite-based semiconductor
alloys, there was another report of bulk Zn1−xMnxGeP2, which also showed
room-temperature ferromagnetism [1.16]. Consequently, chalcopyrite-based
DMSs became a hot issue in the field of DMS and attracted many researchers.
In fact, many theoretical calculations followed after these fascinating discov-
eries (see Section 2.2). The charm of the chalcopyrite-based DMSs seems
to root in the inherent structure and chemistry of the ternary chalcopyrite
semiconductors. The novel idea of using the chalcopyrites will be discussed

10 Chapter 1. Introduction
in Chapter 2, together with the physical properties of chalcopyrite-based
DMSs.
There seems to be little doubt that further advances will be made in
the near future for the high-TC ferromagnetic DMSs, yet, the newly fabri-
cated semiconductor alloys have to undergo the survays whether it can be
strictly categorized as DMSs. One of the properties of DMSs that must be
reminded is the strong sp-d exchange interaction that results in the large
Zeeman splittings, as aready discussed (cf. fig. 1.1) [1.17]. The confirmation
of this exchange interaction in each newly discovered ferromagnetic semi-
conductor alloys is necessary. One also has to be careful of the percipitation
of ferromagnetic clusters in the magnetic-ion-doped semiconductors, which
could possibly be the origin of ferromagnetism. As for ZnGeP2:Mn, the
percipitation of MnP, whose TC is 290K [1.18], is suspected.
This thesis is dedicated to the study of the interface of ZnGeP2:Mn
showing room-temperature ferromagnetism. We adopted photoemission spec-
troscopy and magnetization measurements bu SQUID magnetometer for this
study. PES is a powerful tool to investigate chemical reactions near the sur-
face region. Particulary for studying the interfacial compound of Mn-doped
chalcopyrites, where the Mn density varies as a function of the depth (cf. fig.
2.3(b), PES combined with sputter-etching provides us with the depth pro-
file of the interfacial compound. Chemical analysis of ZnGeP2:Mn is made
for both the surface region and the deep region using PES and Ar+-ion sput-
tering. At the same time, the use of Mn 3p-3d resonant PES, one can have
information of the degree of localization of Mn 3d electrons in ZnGeP2:Mn.
The confirmation of the localized nature of Mn 3d electrons will be the start-
ing point to discuss exchange interactions of these localized electrons and the
sp-band electrons, which is thought to be the important property of DMS.
Special care will be taken if there are any traces of MnP in the photoemission
spectra of ZnGeP2. After the study of ZnGeP2:Mn by PES, magnetization
measurements combined with sputter-etching will be performed to investi-
gate where the ferromagnetism comes from: the densely Mn incorporated
surface region of the interface, or the dilutely Mn scattered deep region of
the interface. Finally, I would like to discuss the features seen in the pho-
toemission spectra which could possibly be related to the mechanism that
strongly stabilizes the ferromagnetism above the room temperature.

References
[1.1] S. Koshihara, A. Oiwa, M. Hirasawa, S. Katsumoto, Y. Iye, C. Urano,
H. Takagi, and H. Munekata, Appl. Phys. Lett. 78, 4617 (1997).
[1.2] R. Fiederling, M. Keim, G. Reuscher, W. Ossau, G. Schmidt, A.
Waag, and L.W. Molenkamp, Nature 402, 787 (1999).
[1.3] Y. Ohno, D.K. Young, B. Beschoten, F. Matsukura, H. Ohno, and
D.D. Awschalom, Nature 402, 790 (1999).
[1.4] H. Ohno, D. Chiba, F. Matsukura, T. Ohmiya, E. Abe, T. Dietl, Y.
Ohno, and K. Ohtani, Nature 408, 944 (2000).
[1.5] K. Ono, D.G. Austing, Y. Tokura, and S. Tarucha, Science 297, 1313
(2002).
[1.6] L.A. Kolodziejski, R.L. Gunshor, T.C. Bonsett, R. Venkatasubrama-
nian, S. Datta, R.B. Bylsma, W.M. Becker, and N. Otsuka, Appl.
Phys. Lett. 47, 169 (1985).
[1.7] H. Munekata, H. Ohno, S. von Molnar, A. Segmuller, L.L. Chang,
and L. Eisaki, Phys. Rev. Lett. 63, 1849 (1989).
[1.8] H. Ohno, H. Munekata, S. von Molnar, and L.L. Chang, J. Appl.
Phys. 69, 6103 (1991).
[1.9] H. Ohno, A. Shen, F. Matsukura, A. Oiwa, A. Endo, S. Katsumoto,
and Y. Iye, J. Appl. Phys. Lett. 69, 363 (1996).
[1.10] T. Dietl, H. Ohno, F. Matsukura, J. Cibert, and D. Ferrand, Science
287, 1019 (2000); T. Dietl, H. Ohno, and F. Matsukura, Phys. Rev.
B 63, 195205 (2001).
[1.11] H. Katayama-Yoshida, K. Sato, and T. Yamamoto, JSAP Interna-
tional 6, 20 (2002) and references therein.
[1.12] K. Ueda, H. Tabata, and T. Kawai, Appl. Phys. Lett. 79, 988 (2001).

12 References
[1.13] H. Saeki, H. Tabata, and T. Kawai, Solid State Commun. 120, 439
(2001).
[1.14] S. Sonoda, S. Shimizu, T. Sasaki, Y. Yamamoto, and H. Hori, J.
Cryst. Growth 237-239, 1358 (2002).
[1.15] G.A. Medvedkin, T. Ishibashi, T. Nishi, K. Hayata, Y. Hasegawa, and
K. Sato, Jpn. J. Appl. Phys. 39 L949 (2000).
[1.16] S. Cho, S. Choi, G.-B. Cha, S.C. Hong, Y. Kim, Y.-J. Zhao, A.J.
Freeman, J.B. Ketterson, B.J. Kim, Y.C. Kim, and B.-C. Choi, Phys.
Rev. Lett. 88, 257203 (2002).
[1.17] K. Ando, cond-mat/0208010.
[1.18] E.E. Huber Jr. and D.H. Ridgley, Phys. Rev. 135 A 1033.

Chapter 2
Physical properties of
ZnGeP2:Mn
2.1 Ternary chalcopyrite semiconductor ZnGeP2
Zinc germanium diphosphide (ZnGeP2) has been attracting interest due to
its promising applications for non-linear optical parametric oscillator laser
systems in the mid-infrared. It can provide continuous laser output over the
range from 3 to 8 µm at conversion efficiency above 50 % when used as an
optical parametric oscillator pumped at 2 µm. It shows a large nonlinear op-
tical coefficient, an appropriate birefringence, a wide range of transparency,
and high thermal conductivity, which are suitable for its applications. How-
ever, there is a broad optical absorption around 1 µm limiting the perfor-
mance of optical parametric oscillator (Fig. 2.1). This absorption center is
attributed to the point defects present in all bulk-grown ZnGeP2. Consid-
erable efforts are being made to reduce the magnitude of this absorption by
controlling the synthesis and growth procedures, as well as identifying the
responsible defects by electron paramagnetic resonance (EPR) and electron-
nuclear double resonance (ENDOR) studies.
The chalcopyrite structure of ZnGeP2 is shown in Fig. 2.2. It differs
from the zinc blend structure in doubling of the unit cell along a fourfold axis,
rendering the system body-centered tetragonal. The II-IV-V2 chalcopyrites
are easily seen as an extension of the III-V zinc-blende compounds. The
combination of group-II and group-IV atoms plays the role of two group-
III atoms and jointly supplies three valence electrons per atom, to combine
with five electrons provided by each group-V ion. The lattice parameters
for ZnGeP2 are a = 10.31791 A, η = 0.9800, and u = 0.25816, where η ≡c/a is the distortion parameter and u is the anion displacement parameter
[2.1]. ZnGeP2 shows slight tetragonal compression leading to a nonideal

14 Chapter 2. Physical properties of ZnGeP2:Mn
6
5
4
3
2
1
01086420
#1 #2 #3 #4
ZnGeP2A
bsor
ptio
n co
effic
ient
(cm
-1)
Wavelength (µm)
transparent region
defect related absorption
Figure 2.1: Optical absorption in ZnGeP2. Spectra are shown for single crys-
tals of ZnGeP2 treated under various conditions: (1) as-grown; (2) annealed
in the presence of ZnGeP2 powder; (3) annealed in vacuum; (4) annealing
under a P atmosphere of 0.5 atm [2.2]. The annealing temperature was
600◦C.
η = c / 2a= 0.9800
u = 0.25816
a = 10.31791 (a.u)
a
c
Zn Ge P
Figure 2.2: Crystal structure of ZnGeP2. The structure parameters are from
ref. [2.1].

2.2. Novel II-IV-V2 chalcopyrite-based DMS 15
tetragonal distortion parameter η < 1. Besides there is a distortion of
the anion sublattice involving a shift by each anion away from its nearest
neighbors of one cation and towards those of other kind of cation, leading to
the nonideal anion displacement parameter u �= 1/4. This anion sublattice
shift is primarily the consequence of the atomic size difference between the
group-II atom (Zn) and the group-IV atom (Ge) (Zn is larger than Ge).
2.2 Novel II-IV-V2 chalcopyrite-based DMS
Recently, a new function was proposed by Medvedkin et al. by incorporating
Mn into the chalcopyrite semiconductors including ZnGeP2, which starts to
show ferromagnetism above room temperature [2.3, 4, 5, 6]. The develop-
ment of this series of new materials were motivated by the novel idea that,
while the II-IV-V2 chalcopyrite semiconductors have similar electrical prop-
erty to III-V semiconductors, the large amaount of Mn may be incorporated
due to the presence of the group II cations at the same time. (cf. Section
2.1)
III-V-based DMSs, In1−xMnxAs and Ga1−xMnxAs, were the first DMSs
to show ferromagnetism [2.8, 9, 7]. It is generally thought that the divalent
Mn ions substituting for the group III sites generate holes (e.g., Ga3+ + Mn
→ Ga + Mn2+ + hole) which are responsible for the hole-meditated ferro-
magnetism. However, the hetero-valence substitution hampers the ability to
dope high concentration of Mn ions in III-V semiconductors (maximum of ∼7 % in GaAs), which results in the relatively low TC of ∼ 110 K. Overcoming
this limited ability of doping was the key in realizing III-V-based high-TC
DMSs (one can find an interseting work of Mn δ-doped GaAs which resulted
in the nominal Mn concentration of ∼ 15 % and TC as high as 172 K [2.8]).
On the other hand, a high concentrarion of Mn ions can be incorporated
in II-VI semiconductors. For example, CdTe can accomodate Mn ions up
to 77 % [2.9]. This is owing to the ease of isovalent substitution of Mn2+
for the group II site. However, without the presence of carriers meditating
the local magnetic moments, superexchange interaction between the mag-
netic moments becomes significant in the ground state, leading either to
paramagnetic, antiferromagnetic, or spinglass for these II-VI-based DMSs.
Theoretical calculations have predicted that ferromagnetism can be achieved
by sufficient hole doping in the II-VI-based DMSs [2.10]. Realization of such
ferromagnetic DMSs were achieved in modulation-doped CdMnTe quantum
well [2.11] and in p-Zn1−xMnxTe:N [2.12], although the TC has been limited
to ∼ 3 K.
The advantage of using II-IV-V2 chalcopyrites as the host semiconduc-

16 Chapter 2. Physical properties of ZnGeP2:Mn
tors of DMSs is therefore the following. First, Mn could easily substitute
the group II site, resulting in a high concentration of magnetic ions. Sec-
ond, when a portion of the incorporated Mn substitutes for the group IV
site, it will readily act as dopants. Then, through the hole-meditated mecha-
nisms, ferromagnetism is expected. Based on this postulation, there followed
the successful fabrication of CdGeP2:Mn [2.3, 4], ZnGeP2:Mn [2.5, 6], and
CdSnP2:Mn, all of which show ferromagnetism above room temperature.
Considering this idea from a more general point of view, one realizes
that this is the unique character achieved in the ternary chalcopyrite semi-
conductors but not in binary semiconductors. The latter has only one cation
site, while the former has two cation sites. This is the distinct property of
the ternaries that allows the possibility to functionalize each cation site in
a different way, e.g., magnetic ion doping at the group II site and acceptor
doping at the group IV site.
In addition to this fascinating property of the chalcopirites, they have
many natural defects as discussed in section 2.1. As for ZnGeP2, these de-
fects were the hamper in the performance of optical parametric oscilator,
but when used as a host semiconductor of DMS, these formerly unwanted
defects may act as hole producing centers which provide a favorable mech-
anism for the realization of ferromagnetic DMS. To this end, it is clear that
the ternary chalcopyrite-based DMSs are not just an extension of the con-
ventional binary-based DMSs, but rather, have their own new possibilities.
All these rich and interesting possibilities in the chalcopyrite-based
DMSs have attracted considerable interest as a result. In fact, many the-
oretical calculations on the chalcopyrite-based DMSs have come into issue
[2.13, 14, 15, 16] after the first report of ferromagnetism in CdGeP2:Mn.
The main conclusions from the calculations are summarized below.
• The ground state is antiferromagnetic for Cd1−xMnxGeP2 [2.13].
• Mn doped CdGeP2 would be ferromagnetic when Mn atoms partially
occupy the Ge site as well as the Cd site [2.14].
• Substitution of P for S (correspinding to electron doping) would sta-
bilize the ferromagnetic state [2.15]. The importance of the carriers
meditating the Mn impurites is indicated.
• Under the presence of hole-producing defects (cation vacancies and Zn
on Ge site), ferromagnetic state is always preferred in (Zn,Mn)GeP2
[2.16].
All the calculations above seems to converge into the general conclusion that,
simultaneous carrier doping with the Mn incorporation into the chalcopyrites

2.3. Synthesis of II-IV-V2:Mn 17
stabilizes ferromagnetism. However, the detailed mechanism of carrier dop-
ing is still controversial whether it is the MnGe (Mn on Ge site), the cation
vacancy, the anion substitution of some group-IV ions, or its complex.
2.3 Synthesis of II-IV-V2:Mn
Figure 2.3(a) shows the synsthesis of chalcopyrite-based DMSs following
Medvedkin et al.[2.3, 4, 5, 6] The schematic illustration of the Mn incorpo-
ration into II-IV-V2 chalcopyrite semiconductors is carried out by depositing
Mn metal on the annealed surface of the host semiconductors in an ultrahigh
vacuum (UV) chamber. This results in the diffusion of Mn atoms into the
substrate, yielding a densely Mn incorporated interface II-IV-V2:Mn. Fig.
2.3(b) shows the concentration profile of the CdGeP2:Mn as a function of
depth, clearly showing Mn atoms diffusing into the bulk. The optimum an-
nealing temperature for the preparation of ZnGeP2:Mn was reported to be
400◦C.
Figure 2.3: Mn incorporation into chalcopyrite semiconductors. (a)
Schematic illustration of the sample preparation. (b) Depth profile of the
atomic concentrations in CdGeP2:Mn obtained by SEM [2.3]. Hatched re-
gion is the sample surface.
The host chalcopyrite semiconductors can be either a single crystal or
polycrystalline powder. Surprisingly, it was reported that, when the sin-
gle crystal chalcopyrites were used as the substrate, reflection high-energy

18 Chapter 2. Physical properties of ZnGeP2:Mn
electron diffraction (RHEED) pattern of the host semiconductor preserved
even after the sample synthesis [2.5, 6]. This indicates that the densly Mn
incorporated II-IV-V2:Mn interface retains the chalcopyrite structure. Such
preservation of the RHEED pattern was not observed in the Mn deposition
on InP, which is a zinc-blende binary semiconductor [2.6]. Therefore, the
Mn incorporation process introduced above seems to be a unique method
realized in the chalcopyrite semiconductors.
2.4 Magnetization of II-IV-V2:Mn and bulk
Zn1−xMnxGeP2
After the Mn incorporation into chalcopyrite semiconductors, the interface
shows ferromagnetism above the room temperature. Some of the reported
magnetization curves of the II-IV-V2:Mn interface are shown in Fig. 2.4.
Figure 2.4(a) and (b) show the M(T ) curve and the M −H curve at 298 K,
respectively, of the Mn-containing polycrystalline CdGeP2 powders. They
clearly show the ferromanetism in CdGeP2:Mn above room temperature.
Figure 2.4(c) is the M -H curve of ZnGeP2:Mn single crystal showing hyster-
sis at 350 K. It should be noted that InP:Mn prepared in a similar method
did not show ferromagnetism, corresponding to the disappearance of the
RHEED pattern after the sample preparation. In Fig. 2.4(b), the diamag-
netic behaviour of the undoped CdGeP2 is also shown. As is characteristic
of wide-gap semiconductors, undoped ZnGeP2 also shows a diamagnetic be-
haviour.
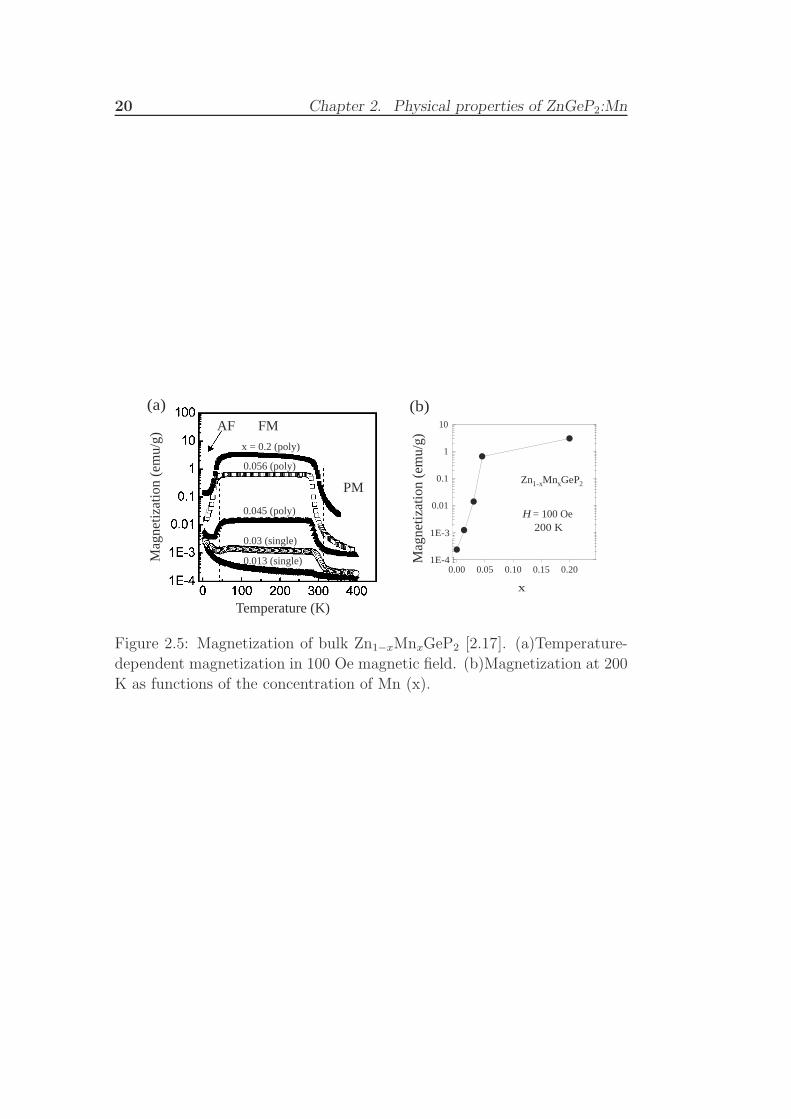
Recently, ferromagnetism in bulk Zn1−xMnxGeP2 was reported by Cho
et al. [2.17] The single crystal (x = 0.013 and 0.03) and policrystalline sam-
ples (x = 0.045, 0.056, and 0.2) were synthesized by loading the chemical
composition of each sample in to walled quartz ampoules, and then heated
up to 1130◦C. This temperature was above the optimum preparation tem-
perature of ZnGeP2:Mn (400◦C) and even above the melting temperature
of ZnGeP2 (1022◦C). These samples also showed ferromagnetism above the
room temperature (TC = 312 K, Fig. 2.5) However, at temperatures below
47 K, the samples with x = 0.056 and 0.2 (polycrystalline samples) were
antiferromagnetic. The antiferromagnetic ground state of Zn1−xMnxGeP2 is
consistent with the theoretical calculations by Zhao, et al. [2.13] though the
relation between the ZnGeP2:Mn interfacial compound is unclear. All the
samples of bulk Zn1−xMnxGeP2 were insulators, which is consistent with the
isovalent substitution of Mn2+ for Zn2+.

2.4. Magnetization of II-IV-V2:Mn and bulk Zn1−xMnxGeP2 19
(a)
(c)
CdMnGeP powder
2
CdGeP2
CdMnGeP powder
2
ZnMnGePsingle crystal
2
(b)
Figure 2.4: Magnetization curves of II-IV-V2:Mn interface. (a) Magneti-
zation of Mn-containing polycrystalline materials of CdGeP2:Mn. Average
Mn concentration is 20 %. (b) Magnetization of polycrystalline CdGeP2:Mn
and undoped CdGeP2 at 298 K. Undoped CdGeP2 shows diamagnetic be-
haviour, while CdGeP2:Mn shows clear hysterisis [2.6]. (c) Magnetization of
Mn incorporated ZnGeP2 single crystal at 350 K. Inset shows the magnified
plot indicating a hysterisis behaviour [2.5].
20 Chapter 2. Physical properties of ZnGeP2:Mn
Temperature (K)
Mag
netiz
atio
n (e
mu/
g)
AF FM
PM
x = 0.2 (poly)
0.056 (poly)
0.045 (poly)
0.03 (single)
0.013 (single)
x
0.0001
0.001
0.01
0.1
1
10
0.200.150.100.050.00
1E-3
1E-4
H = 100 Oe200 K
Zn1-xMnxGeP2
Mag
netiz
atio
n (e
mu/
g)(a) (b)
Figure 2.5: Magnetization of bulk Zn1−xMnxGeP2 [2.17]. (a)Temperature-
dependent magnetization in 100 Oe magnetic field. (b)Magnetization at 200
K as functions of the concentration of Mn (x).

References
[2.1] M.D. Lind and R.W. Grant, J. Chem. Phys. 52, 5607 (1970).
[2.2] G.A. Verozubova, A.I. Gribenyukov, V.V. Korotkova, O. Semchinova,
and D. Uffmann, J. Cryst. Growth 213, 334 (2000).
[2.3] G.A. Medvedkin, T. Ishibashi, T. Nishi, K. Hayata, Y. Hasegawa, and
K. Sato, Jpn. J. Appl. Phys. 39 L949 (2000).
[2.4] K. Sato, G.A. Medvedkin, T. Nishi, Y. Hasegawa, R. Misawa, K.
Hirose, T. Ishibashi, J. Appl. Phys. 88, 7027 (2001).
[2.5] G.A. Medvedkin, K. Hirose, T. Ishibashi, T. Nishi, V.G. Voevodin,
and K. Sato, J. Cryst. Growth 236, 609 (2002).
[2.6] K. Sato, G.A. Medvedkin, and T. Ishibashi, J. Cryst. Growth 237-
239, 1363 (2002).
[2.7] H. Ohno, Science 281, 951 (1998); H. Ohno, J. Mag. Mag. Mat. 200,
110 (1999).
[2.8] A.M. Nazmul, S. Sugahara, and M. Tanaka, preprint, cond-
mat/0208299.
[2.9] J.K. Furdyna, J. Appl. Phys. 64, R29 (1988).
[2.10] T. Dietl, A. Haury, and Y. Merle d’Aubigne, Phys. Rev. B 55, R3347
(1997).
[2.11] A. Haury, A. Wasiela, A. Arnoult, J. Cibert, S. Tatarenko T. Dietl,
and Y. Merle d’Aubigne, Phys. Rev. Lett. 79, 511 (1997).
[2.12] D. Ferrand, J. Cibert, A. Wasiela, C. Bourgognon, S. Tatarenko, G.
Fishman, T. Andrearczyk, J. Jaroszynski, S. Kolesnik, T. Dietl, B.
Barbara, and D. Dufeu, Phys. Rev. B 63, 085201.
[2.13] Y.-J. Zhao, W.T. Geng, A.J. Freeman, and T. Oguchi, Phys. Rev. B
63, 201202 (2001).

22 References
[2.14] P. Mahadevan and A. Zunger, Phys. Rev. Lett. 88, 047205 (2002).
[2.15] Y.-J. Zhao, S. Picozzi, A. Continenza, W.T. Geng, and A.J. Freeman,
Phys. Rev. B 65, 094415 (2002).
[2.16] T. Kamatani and H. Akai, Phase Transition, in press.
[2.17] S. Cho, S. Choi, G.-B. Cha, S.C. Hong, Y. Kim, Y.-J. Zhao, A.J.
Freeman, J.B. Ketterson, B.J. Kim, Y.C. Kim, and B.-C. Choi, Phys.
Rev. Lett. 88, 257203 (2002).

Chapter 3
Results and discussions
3.1 Experimental
Ultraviolet photoemission (UPS) and x-ray photoemission (XPS) measure-
ments were performed at BL-18A of Photon Factory, Institute for Material
Structure Studies, National High Energy Accerelator Reserch Organization.
Photoelectrons were collected using a VG CLAM hemispherical analyzer in
the angle-integrated mode. The overall energy resolution was 800 meV for
XPS and 200 meV for UPS at room temperature.
The schematic illustration of the experimental setup is shown in Fig.
3.1. The photoemission spectrometer was equipped with a Mn evaporator, a
quartz thickness monitor, and an ion gun, together with the annealing sys-
tem at the sample mount. This setup allowed Mn deposition onto ZnGeP2 in
situ in the photoemission spectrometer. In situ preparation of ZnGeP2:Mn
is desirable for photoemission experiments, since it is less bothered with
unwanted contamination by gases which severely damages the surface and
hence the photoemission spectra. Mn incorporation was carried out by evap-
orating Mn metal (99.999 %) from the Mn evaporator onto the (001) surface
of single crystal ZnGeP2. The pre-synthesized ZnGeP2 substrate was cleaned
by Ar+-ion sputtering at 1.5 kV before the Mn deposition. Surface cleanli-
ness of the substrate was checked by core-level XPS. During Mn deposition,
the substrate temperature was kept at 400◦C following the sample synthesis
of Medvedkin et al. [3.1, 2] The Mn deposition rate was 3 A/min, which
was determined by the quartz thickness monitor. After the Mn deposition,
the sample was post-annealed for 5 min and then cooled down to room
temperature.
In order to see the depth profile, the in situ prepared ZnGeP2:Mn was
sputter-etched by Ar+-ion at 1.5 kV. The incidence angle of the ion beam
was set to 45◦ relative to the substrate surface normal in order to reduce

24 Chapter 3. Results and discussions
VG CLAM analyzer
Mn evaporator(Mn 99.999 %)
Ion gun(1.5 kV Ar-ion sputtering)
Quartz thickness monitorO
hmic heater
1 cmTherm
ocouple
Synchrotron radiation (hν = 30 - 70 eV)Mg Kα x-ray
Figure 3.1: Experimental setup at BL18-A of Photon Factory
the Ar+-ion implantation during the sputtering. Sputter-etching rate was
approximately 2 A/min under this configuration.
All the spectra, except the annealed substrate surface spectra, were
taken at room temperature. During the collection of photoelectrons at the
elevated temperatures, the heater voltage was switched off in order to avoid
the voltage fluctuations of the substrate which was in electrical contact with
the heater. The pressure was below 7 × 10⁻¹⁰ Torr during the measurements,
and the photoemission spectra did not change while collecting the data under
this condition. The magnetization of the sample was measured ex situ using
a SQUID magnetometer (Quantum design). For comparison, photoemission
spectra of polycrystalline MnP (TC = 290 K [3.3]) was measured by in situ
scraping.

3.2. Photoemission spectra of ZnGeP2 substrate 25
3.2 Photoemission spectra of ZnGeP2 sub-
strate
Prior to the Mn deposition, the effect of annealing and sputtering on the
ZnGeP2 substrate surface was studied. Figure 3.2(a) shows the UPS spectra
(hν = 60 eV) of ZnGeP2 covering the valence-band region and the shallow
core levels of Zn 3d (EB ∼ 10 eV) and Ge 3d (EB ∼ 30 eV). Figure 3.2(b)
shows the core-level intensity of Zn 3d and Ge 3d as functions of substrate
temperature. Starting from the as-sputtered surface, the temperature of
ZnGeP2 was gradually elevated up to ∼ 400◦C. When the temperature ex-
ceeded ∼ 300◦C, the Zn 3d intensity started to decrease rapidly, while that
of Ge 3d slightly increased. At 400◦C the Zn 3d intensity was ∼ 30 % of
the initial intensity. When cooling the sample from ∼ 400◦C down to room
temperature, on the other hand, there was no change in the core-level inten-
sities. Then after 3 min Ar+-ion sputtering (corresponding to ∼ 6 A removal
of the surface region), the spectrum recovered the as-sputtered one. [See also
Fig. 3.3(b), where the core-level intensities for the as-sputtered surface have
been normalized to Zn:Ge:P = 1:1:2 and the deviation from this is seen for
the 400◦C-annealed surface before the Mn deposition.]
The decrease of Zn content by annealing is attributed to the diffusion of
Zn atoms from the surface region and some Ge atoms to the surface region
above 300◦C. The reported optimum substrate temperature during the Mn
deposition 400◦C is thus plausible since the Mn may easily diffuse into the
sufficiently Zn-deficient surface region at this temperature. The Zn-depleted
layer in the surface region in ZnGeP2 resembles the cases reported for I-III-
VI2 chalcopyrite surfaces, e.g., CuInSe2, where the surface layer generally
exhibits CuIn3Se5 stoichiometry [3.4].
Further sputtering after the removal of Zn-depleted layer in the surface
region did not change the core-level intensities of the substrate within the
accuracy of 3 %, indicating the selective sputtering of the light P atoms
compared to the heavy Zn and Ge atoms can be ignored. Therefore, we refer
to the core-level intensities of this as-sputtered ZnGeP2 as revealing the bulk
chemical composition of Zn:Ge:P = 1:1:2 in the following normalizations of
the core-level intensities.
3.3 Mn deposition on ZnGeP2
Next we show a series of spectra for Mn deposition on the 400◦C-annealed
substrate. The surface with the nominal Mn thickness up to 500 A was
studied sequentially. Each time after having taken a set of spectra for one

26 Chapter 3. Results and discussions
30 25 20 15 10 5 0
Room temp.(after sputtering)
218 - 187oC
110 - 93oC
312 - 296oC
410 - 387oC
385 - 363oC
353 - 328oC
377 - 358oC
400 - 373oC
Ge 3d Zn 3d
Valence band
Binding energy (eV)
Int
ensi
ty (
arb.
uni
ts)
ZnGeP2 hν = 60 eV(a)
(b)1.5
1.0
0.5
04003002001000
Temperature (°C)
Inte
nsity
(ar
b. u
nits
)
Ge 3d Zn 3d
Figure 3.2: Photoemission spectra of ZnGeP2 (hν = 60 eV) at elevated tem-
peratures. (a) Raw spectra at elevated temperatures. Spectrum at room
temperature is the as-sputtered ZnGeP2. The intensities have been nor-
malized to the photon flux. (b) Core-level intensities of Zn 3d and Ge 3d
as functions of substrate temperatures. The finite temperature ranging for
each spectrum is the consequence of cooling down while switching off the
heater.

3.3. Mn deposition on ZnGeP2 27
Mn coverage, the deposited Mn was completely sputtered out and then Mn
was newly deposited.
Figure 3.3(a) shows the core-level spectra of the Mn-deposited sur-
face, and Fig. 3.3(b) shows their intensities normalized to the as-sputtered
ZnGeP2. The Mn 2p intensity has been normalized using the Mn 2p and P
2p intensity ratio of MnP. In the region of Mn thickness d < 64 A, one can
see a monotonic increase and decrease of the Mn and Zn signals, respectively,
without significant changes in the Ge and P intensities. This behaviour sug-
gests that Mn atoms primarily substitutes for Zn. In the Mn 2p3/2 spectra
below d = 16 A, one can see some signal on the higher binding energy side of
the dominant metallic peak at EB. = 638.7 eV. This indicates that a portion
of the incorporated Mn atoms have chemically reacted with the substrate
and presumably became Mn2+, which is the isovalent substitution of Zn2+.
In going from d = 64 to 130 A, the Ge and P intensities suddenly changed.
The saturation in the Mn intensity with the sizable signals of Ge and P
above d = 130 A is a clear signature of atomic diffusion associated with the
chemical reaction for such a thick Mn overlayer. The surface region above d
= 130 A consists of Ge-rich, ternary metallic compound(s) of Mn, Ge, and
P with possible inhomogeneities and/or phase mixture.
The valence-band spectra taken in the Mn 3p-3d core-excitation region
are shown in Fig. 3.4. The spectra have been normalized to the post focusing
Au mirror current. The Mn 3d-derived spectra were obtained in the follow-
ing way: the on- (51 eV) and off-resonance (48 eV) spectra were further
normalized to the valence band intensities of d = 0 A (undoped substrate)
at the corresponding photon energies. Then the subtraction was carried out
for these normalized spectra to obtain the Mn 3d-drived difference spectra.
This way of subtraction virtually eliminates the effect of the photon en-
ergy dependence of the host sp3 band and allows us to obtain the correct
representation of the Mn 3p partial density of states (PDOS). In fact, as
demonstrated in Fig. 3.3(a), using this method, the difference spectrum of
the undoped substrate (which should be ideally zero) is minimized.
In the valence band spectra for d = 4 and 16 A, one can see a clear peak
located ∼ 4 eV below EF in going through hν = 48 to 51 eV. This spectral
behaviour is similar to the previous results of the Mn incorporated II-VI- and
III-V-based DMSs [3.5, 6, 7, 8] and thus is attributed to the localized nature
of Mn 3d electrons. Surprisingly, however, strong Mn M3L45L45 Auger peak
above the core-excitation energy replaces the ∼ 4 eV peak for further Mn
deposition above d = 32 A. This indicates that the Mn 3d electrons became
itinerant in the surface region. The difference in the decay processes after
the 3p-3d core absorption, whether it leads to Auger-electron emission or
the direct recombination leading to resonance enhancement of the ∼ 4 eV

28 Chapter 3. Results and discussions
2.5
2.0
1.5
1.0
0.5
0.0
12 3 4 5 6
102 3 4 5 6
1002 3 4 5
Mn 2p
Zn 2p3/2
Ge 3d P 2p
656 652 648 644 640 636
Mn 2p1/2
Mn 2p3/2
02
48
1632
64130
260
d(Å)= 510
32 28
Ge 3d
1024 1020
Zn 2p3/2
132 128 124 120 116
P 2p Ge 3p
Binding energy (eV)
Inte
nsity
(ar
b. u
nits
)
Rel
ativ
e ch
emic
al c
ompo
sitio
n
Deposited Mn thickness (Å)
(a)
(b)
0
Figure 3.3: Core-level spectra of ZnGeP2:Mn for various Mn thickness de-
posited at 400◦C. (a) Raw spectra. Ther vertical scale is counts per second.
0 A corresponds to the spectra of the sputtered and annealed ZnGeP2 sub-
strate. (b) Core-level intensities as functions of deposited Mn thickness. For
normalization, see text.

3.3. Mn deposition on ZnGeP2 29
10 5 0
d = 0Å
difference
47
48
49
50
51on-
off-
Zn 3d
hν=52
(a)
10 5 0
d = 16Å
51
50
49
48
47
difference
off-
on-
Zn 3d
hν=52
(c)
10 5 0
d = 32Å
hν=54
53
5251
48
47
49
difference
Zn 3d
off-
on-
50
(d)
10 5 0
d = 4Å
difference
47
48
49
50
51on-
off-
Zn 3d
hν=52
(b)
Binding energy (eV)
Inte
nsity
(ar
b. u
nits
)
Figure 3.4: Valence-band spectra of ZnGeP2:Mn in the 3p-3d core excitation
region. On- and off-resonance energies are 51 eV and 48 eV, respectively.
Arrows in (d) indicate the constant kinetic energy of the Mn M3L4,5L4,5
signal. See also Fig. 3.6 (a) for d = 150A.
peak, reflects the different degrees of the 3d electron localozation. Strictly
speaking, however, it does not directly reflect the degree of localization in the
ground state, but rather the degree of localization in the intermediate state
after the 3p-3d core excitation. In other words, it depends on the lifetime
of the core exiton-like intermediate state, i.e., the state which the excited
electron is bound to the core hole at 3p. If the photoexcited electron from
the 3p orbital resides in the localized 3d orbital due to the strong interaction
between the excited electron and the core-hole, the core-hole excitation is
followed by the direct recombination of the excited electron with the 3p core-
hole, hence the ∼ 4 eV peak. The extinction of the ∼ 4 eV peak above d
= 32 A is in accordance with the Mn 2p core-level spectrum [Fig. 3.3(a)],
where the (localized) divalent Mn signal disappeared above d = 32 A and
the highly asymmetric line shape characteristic of a metallic Mn compound
appeared. As for the d = 16 A spectrum, both a clear Fermi edge and the
∼ 4 eV peak is observed. The line shape of the difference spectrum of d
= 16 A is almost a superposition of d = 4 A and 32 A difference spectra.
Together with the fact that Mn 2p core-level spectrum was showing metallic

30 Chapter 3. Results and discussions
and divalent signals simultaneously at d = 16 A [Fig. 3.3(a)], it is plausible
that the localized divalent Mn species and the metallic Mn compound(s)
coexisted at d = 16 A.
3.4 Depth profile of ZnGeP2:Mn interface
So far, the surface region of ZnGeP2:Mn interface has been studied exten-
sively, and we have seen that the surface region became metallic after a
sizable amount of Mn was deposited and diffused. Now, interest arises on
the chemical and electronic states formed underneath the surface metal-
lic compound(s) (cf. Fig. 2.3). In order to clarify the depth profile of the
interface, ZnGeP2:Mn of the nominal Mn thickness of 150 A was repeat-
edly sputter-etched and studied by PES until the core-level signal of Mn 2p
disappeared. In this series, the sputter-etched surface was not annealed be-
fore taking the photoemission spectrum, otherwise the exposed surface after
sputtering quickly became Zn depleted, which is the similar behaviour to
that observed in the surface region of the ZnGeP2 substrate (Section 3.2).
Figure 3.5(a) shows core-level spectra taken in the sputter-etching se-
ries and Fig. 3.5(b) shows their intensities [same normalization as in Fig.
3.3(b)] as function of sputtering time. The dramatic change in the first 20
min sputtering is attributed to the removal of the Zn-depeted layer of the
as-grown outer-surface. Subsequently, the Mn 2p3/2 core level starts to show
a shoulder structure at EB. = 641.7 eV, attributed to ionic Mn (Mn2+ most
likely). The systematic increase of this shoulder structure and the decrease
of the metallic main peak at EB = 638.7 eV between 20 to 70 min sput-
tering indicate that these signals are originated from chemically different
Mn species. After 100 min sputtering, the relative chemical composition
became Zn:Ge:P ∼ 1:1:2 suggesting the chalcopyrite-type matrix of Zn, Ge,
and P plus dilute Mn was exposed [Fig. 3.5 (b)]. After 230 min sputter-
ing, the Mn signal became totally of the ionic one [Fig. 3.5 (a)], indicating
that the Mn-diluted phase finally appeared. Now since the binding energy
of the ionic Mn 2p signal in 20 -100 min sputtering (in the intermediate
phase) corresponds to those after 230 min sputtering, the ionic Mn com-
pounds in the intermediate region may be attributed to precursors of the
Mn-diluted phase exposed after 230 min sputtering. However, around 200
min sputtering, there is a thin layer separating the intermediate phase and
the Mn-diluted phase. This may indicate that Mn diffusion from the surface
to bulk regions took place during the fabrication of this interface. However,
the origin of this discontinuity is unclear and further elaboration may be
necessary.

3.4. Depth profile of ZnGeP2:Mn interface 31
2.0
1.5
1.0
0.5
05004003002001000
P 2p
Mn 2p3/2
Zn 2p3/2
Ge 3d
× 5
656 652 648 644 640 636
Mn 2p3/2Mn 2p1/2t(min) =
20406070
230270330390450540
100130190210
0
132 128 124 120 116
P 2p Ge 3p
1024 1020
Zn 2p3/2
34 32 30 28 26
Ge 3d
Binding energy (eV)
Inte
nsity
(ar
b. u
nits
) (a)
(b)
Sputtering time (min)
Rel
ativ
e ch
emic
al c
ompo
sitio
n
Figure 3.5: Core-level spectra of ZnGeP2:Mn in the depth profile. (a) Raw
spectra. The vertical scale is counts per second. (b) Core-level intensities as
functions of sputtering time.

32 Chapter 3. Results and discussions
10 5 0
40
4648
49.5
51
hν=54(a)
ZnGeP2:Mnd = 150 Å, t = 0 min
10 5 0
404648
51
hν=54
Zn 3d
t = 130 min
difference
(x3)
on-
off-
(c)
10 5 0
(b)
Zn 3d
40
46
49.5
48
51
52
hν=54
t = 40 min
10 5 0
40
5148
hν=54
t = 330 min
Zn 3d difference
(x3)
on-
off-
(d)
Inte
nsity
(ar
b. u
nits
)
Binding energy (eV)
1.0 0.5 0Binding energy (eV)
Inte
nsity
(a.
u.)
hν = 48 eV
t(min) = 230330450
540510
Figure 3.6: Valence-band spectra of ZnGeP2:Mn (150 A) in the sputter-
etching series. Arrows in (a) and (b) denote the M3L4,5L4,5 Auger peak.
Inset shows the valence-band spectra near EF after 230 min sputtering.
Figure 3.6 shows the valence-band spectra in the sputter etching series
for photon energies in the Mn 3p-3d core excitation region. There was a
change in the decay process following the Mn 3p-3d core-hole decay process at
80 min sputtering, before which the M3L4,5L4,5 Auger process was dominant
[Fig. 3.6 (a) and (b)] and after which resonant photoemission is dominant
[Fig. 3.6 (c) and (d)]. This indicates again that the Mn 3d states changed
their character from the itinerant to localized states along the depth profile.
A peak at ∼ 4 eV peak was seen after 80 min sputtering, and hence Mn
was divalent deep below the surface. This is consistent with the recent EPR
measurements (6-fold degeneracy of Mn2+ being split by Zeeman effect was
observed) [3.9], suggesting that the diffused Mn is predominantly divalent.
However, the Mn 3d-drived intensity near EF in the difference spectra is
weak compared to those in Fig. 3.4 (b) and (c). This indicates that the Mn
3d states are more strongly localized in the deep region than the 3d states
of Mn substituting Zn in the early stage of the series of Mn deposition
(Fig. 3.4(b)). It also indicates that there is less coexisting metallic Mn
compound(s) compared to Fig. 3.4(c) where the spectral weight in the Mn-
drived difference spectra near EF was attributed to the coexisting metallic

3.5. ZnGeP2:Mn prepared at low temperatures 33
Mn compound(s). Inset of Fig. 3.6 shows valence-band spectra near EF
after 230 min sputtering, where Mn has fully reacted with the substrate
[Fig. 3.5 (a)]. They clearly show a Fermi edge. Since the Mn 3d-drived
spectra was supressed near EF , this Fermi edge comes from the valence band
of the host semiconductor which was somehow doped with metallic charge
carriers. Since isovalent substitution of Mn2+ for Zn2+ cannot dope the
system with carriers, Mn2+ may have substituted for the Ge site and/or Mn
incorporation simultaneously induced defects such as, e.g., VZn and ZnGe,
all of which produce hole carriers. The Fermi edge became obsecure after
540 min sputtering, in accordance with the diminishing Mn 2p core-level
intensity (Fig. 3.5).
3.5 ZnGeP2:Mn prepared at
low temperatures
So far, ZnGeP2:Mn prepared at 400◦C, the reported optimum temperature,
has been studied. It will be interesting to study ZnGeP2:Mn prepared un-
der other conditions. In this section, results from Mn deposition at room
temperature and a sputtering series of ZnGeP2:Mn prepared at 200◦C is
presented.
Figure 3.7(a) shows the Mn deposition series on the substrate kept at
room temperature. As Mn metal was deposited, the Mn 2p signal monoton-
ically increased while the other core-level signals decreased. The line shape
of Mn 2p was highly asymmetric, which is characteristic of the core-level
spectrum of a metallic sample. Correspondingly, no satellite structure was
observed on the higher binding energy side of the metallic Mn 2p peak. This
behaviour is simply interpreted as the accumulation of Mn metal on top of
the substrate. The incorporation of Mn atoms into the substrate was not
appreciable at this temperature. This is consistent with the results of the
surface study of ZnGeP2 (Section 3.2), where the ZnGeP2 surface was inert
at room temperature. One can still see some weak signals of Zn, Ge, and P
even at d = 60 A. These are attributed to the photoelectron signals from the
ZnGeP2 substrate below the Mn metal coverage (the photoelectron escape
depth in the XPS region is ∼ 20 A). It is expected that these signals are on
way of vanishing with some more Mn metal coverage. However, there are
no further data.
Figure 3.7(b) shows the Mn 2p3/2 core-level intensities as functions of
the deposited amount of Mn. Both Mn deposition at room temperature (RT
series) and 400◦C (400◦C series) are plotted. One can see the rapid rise of
the Mn signal in the early stage of RT series compared to that in the 400◦C

34 Chapter 3. Results and discussions
650 640
Mn 2p1/2
Mn 2p3/2
32 28
Ge 3d
130 120
P 2p Ge 3p
1028 1020
Zn 2p3/2
0 2468
1015
30
d (Å) =60
20
Binding energy (eV)
Inte
nsity
(ar
b. u
nits
)
ZnGeP2:MnMg Kα
1
0806040200
Mn
2p3/
2 in
tens
ity (
arb.
uni
ts)
Deposited Mn thickness (Å)
ZnGeP2:Mn
RT
400ºC
(a)
(b)
Figure 3.7: Mn deposition series on ZnGeP2 at room temperature (RT).
(a) Core-level spectra. Intensities in each window are counts per second.
Relative intensities between different windows are arbitrary. (b) Mn 2p3/2
intensity of Mn deposited at RT and 400◦C. Solid circles and open circles are
the Mn 2p3/2 intensities when Mn was deposited on RT and 400◦C substrate,
respectively. Abcissa is in the linear scale of the deposited Mn thickness.
Broken line is the expected saturation behaviour at RT.

3.5. ZnGeP2:Mn prepared at low temperatures 35
series. This strongly supports the diffusion of Mn atoms at 400◦C in the
surface region of the ZnGeP2 aubstrate but not at room temperature (cf.
Section 3.3). The apparent saturaton behaviour in the RT series at d = 60
A indicates that the thickness of the Mn coverage reached the photoelectron
escape depth. For Mn coverage above d = 60 A, the Mn signal intensity is
expected to saturate, as is drawn by the broken line in Fig. 3.7(b).
650 640
t(min)= 0
10507090110130170230270290310350390610650
770730
850890
Mn 2p1/2
Mn 2p3/2
1024 1020
Zn 2p3/2
32 28
Ge 3d
132 128 124 120 116
Ge 3p P 2pZnGeP2:Mn
Figure 3.8: Core-level spectra in the sputter-etching series of ZnGeP2:Mn (d
= 200 A) prepared at 200◦C. (a) Raw spectra. (b) Core-level intensities as
functions of sputtering time.
Next, the depth profile is shown for ZnGeP2:Mn of the 200 A nominal
thickness Mn synthesized at 200◦C. Figure 3.8 (a) shows core-level spectra
taken in the sputter-etching series. The change in the line shape in the
first 10 min sputtering (particularly the shift of the Ge 3d peak position
to the lower binding energy side) is again attributed to the removal of the

36 Chapter 3. Results and discussions
30 20 10 0
ZnGeP2:Mn(d = 200 Å)
hν (eV) = 47
4849
5051
54
60
70
Ge 3d
0 min
30 20 10 0
hν (eV) = 48
51
54
60
70
770 min
Ge 3d Zn 3d
30 20 10 0
hν (eV) = 48
51
60
70
350 min
Ge 3d
Zn 3d
Binding energy (eV)
Inte
nsity
(ar
b. u
nits
)
Figure 3.9: Valence-band spectra in the sputter-etching series of ZnGeP2:Mn
(d = 200 A) prepared at 200◦C. The triangles trace the constant kinetic
energy of M3L4,5L4,5 Auger electrons.
surface compound which is different from the sub-surface region. Up to
800 min sputtering, Mn signal was observed together with Zn, Ge, and P
signals, indicating that the Mn atoms diffused into the substrate already
at 200◦C. Surprisingly, however, the Mn 2p3/2 signal always appeared at
EB = 638.7 eV (the position of the metallic peak) and no divalent signal
was observed [compare the Mn 2p spectra of fig. 3.5(a)]. The valence-band
spectra in the sputtering series is shown in Fig. 3.9. Corresponding to the
Mn 2p spectra showing only the metallic signal, no localized nature of Mn
3d was observed in the behaviour of the valence-band spectra, and only
the Mn M3L4,5L4,5 Auger peak was observed. It is therefore concluded that
the annealing temperature of 200◦C was insufficient for the Mn atoms to be
chemically incorporated as divalent ions in the deep region of the ZnGeP2:Mn
interface, although the thermal diffusion of Mn atoms did take place.

3.6. Photoemission spectra of MnP 37
3.6 Photoemission spectra of MnP
In this section, we describe the PES results of a policrystalline MnP. MnP is
an itinerant-electron ferromagnet, whose TC is as high as 290 K [3.3]. Since
its percipitation is suspected as the origin of the room-temperature ferro-
magnetism in ZnGeP2:Mn, its photoemission spectra is worthy to evaluate.
15 10 5 0
40
43
44
45
46
47
48
49
50
51
53
55
60
hν(eV) = 70
AB
C D
Binding energy (eV)
'Inte
nsity
(ar
b. u
nits
)
135 130 125 120 115
P 2p
660 655 650 645 640 635
Mn 2p3/2
Mn 2p1/2
Binding energy (eV)
Inte
nsity
(ar
b. u
nits
) (a) MnP (c) MnP
(b) MnP
DO
S (s
tate
s/eV
cel
l)
PES
inte
nsity
(ar
b. u
nits
)
Binding energy (eV)
20
15
10
5
015 10 5 0
PES (hν = 45 eV) DOS
AB
CD
Figure 3.10: Photoemission spectra of polycrystaline MnP. (a) Core-level
spectra of Mn 2p and P 2p. (b) Valence-band spectrum obtained by Kak-
izaki et al. [3.10], and its comparison with the density-of-states curve calucu-
lated by Hasegawa and Yanase [3.11]. Major structures in the photoemission
spectrum is designated by A through D. (c) Valence-band spectra in the Mn
3p-3d core excitation region. Vertical dotted lines indicate the major struc-
tures in the valence-band spectra. Triangles indicate the constant kinetic
energy of the M 2,3L4,5L4,5 Auger signal.
Figure 3.10(a) shows the Mn 2p3/2 core-level spectrum of MnP. Mn
2p3/2 core level appeared at EB = 639.2 eV, which is different from the
observed Mn 2p3/2 core-level peak positions in ZnGeP2:Mn either in the Mn
deposition series or in the sputtering series. The valence-band spectra of
MnP in the 3p-3d core excitation region is shown in Fig. 3.10(c). The four

38 Chapter 3. Results and discussions
peak structures in the valence-band spectra (indicated by the vertical dotted
lines A to D) correspond to those in the previous MnP spectra by Kakizaki et
al. [Fig. 3.10(b)] [3.10]. These structures designated by A, B, C, and D were
assigned as the P 3s band, the bonding state of P 3p and Mn 3d orbitals, the
Mn 3d majority-spin band, and the Mn 3d minority-spin band, respectively,
through comparison with the calculated DOS [Fig. 3.10(b)] [3.11]. One can
see in Fig. 3.10 the M 2,3L4,5L4,5 Auger signal moving through the valence
band for photon energies larger than 50 eV. Correspondingly, there is no
signal of the EB ∼ 4 eV peak which was observed in the lightly Mn-doped
surface region [Fig. 3.4(a), (b)] and the Mn-diluted phase in the deep region
[Fig. 3.6(c), (d)] of ZnGeP2:Mn interface.
The spectral feature of MnP mentioned above was never observed in
the present study of ZnGeP2:Mn prepared at 400◦C. We therefore exclude
the possibility that MnP is dominant in the interface of ZnGeP2:Mn.
3.7 Magnetization measurements of
ZnGeP2:Mn
The magnetization of ZnGeP2:Mn of the 150 A nominal Mn thickness pre-
pared at 400◦C was studied ex situ using a SQUID magnetometer. Suc-
cessive removal of surface layer by Ar+-ion sputtering from the synthesized
sample was performed to see the depth profile of the magnetization. These
measurements serve for both the cross-check of our sample synthesis, and
the determination of where the magnetization comes from, i.e., the surface
metallic Mn compound or the from the Mn-diluted phase deep in the deep
region.
Figure 3.11(a) shows the magnetization of the synthesized ZnGeP2:Mn
(d = 150 A at 400◦C) and the one after sputtering for 200 min to remove
the surface metallic Mn compound. In the 200 min-sputtered spectra, only
the divalent Mn signal was observed in the core-level spectra. First, one
can clearly see the hysterisis in the M -H curve at room temperature (RT),
indicating that the present sample is a RT ferromagnet, and that our sample
systhesis was in good agreement with the previous works [3.1, 2]. After 200
min sputtering, surprisingly, one can still see nearly the same RT hysterisis.
This suggests that the Mn-diluted phase in the deep region is a RT ferromag-
net. The marginal drop of the saturation magnetization indicates that the
magnetization from the surface region was relatively small. The magnetic
moment per Mn atom in the Mn-diluted phase deep in the interface was
crudely estimated 1.5 ± 0.5 µB . The extimation was made in the following
way. First, we know the nominal volume of the deposited Mn on the 15 mm2

3.7. Magnetization measurements of ZnGeP2:Mn 39
-0.4
0
0.4
150-150
-0.4-0.2
00.20.4
150-150-2
-1
0
1
2
T = 330 K 10 K
-3
-2
-1
0
1
2
3
T = 330 K 10 K T = 330 K 10 K
Field (x 10-4
T)
Mag
netiz
atio
n (x
10-4
em
u / 1
5 m
m2 )
M (x
10-4
em
u / 1
5 m
m2 )
M (x
10-4
em
u / 1
5 m
m2 )
Field (x 10-4
T)0
0
Field (T)
t = 0 min
t = 200 min
(a) ZnGeP2:Mn (d = 150 Å)
-2
-1
0
1
2
-0.6 -0.4 -0.2 0 0.2 0.4 0.6
T = 330 K 10 K
t = 400 min
-0.4-0.2
00.20.4
150-150Field (x 10
-4 T)M
(x10
-4em
u/15
mm
2 )
1.5
1.0
0.5
300200100
Temperature (K)
H = 0.001 T
100 min
200 min
Mag
netiz
atio
n (x
10-4
em
u / 1
5 m
m2 )
(b)
t = 0 min
ZnGeP2:Mn (d = 150 Å)
400 min
Figure 3.11: Magnetization curves of ZnGeP2:Mn (d = 150 A) prepared at
400◦C. (a) Magnetization curves at T = 10 K and 330 K of as-prepared
ZnGeP2:Mn (upper), those after having removed the surface metallic Mn
compound (middle), and further sputtering of total 400 min. (b) Magneti-
zation versus temperature in the sputtering series.
substrate surface (let it be X) using the quartz thickness monitor. Second,
from Fig. 3.5, we calculate the area of Mn chemical composition inbetween
0 - 200 min (corresponding to 0 - 600 A thickness of the interface). This
leeds to the volume of Mn incorporated in this region (let it be Y ). Then
X - Y makes the nominal volume of Mn in the dilute Mn phase deep in the
interface. Assuming that this volume corresponds to that of Mn metal, we
estimate the magnetic moment of Mn per atom. We note that Y / X was
∼ 0.2. Therefore the error bar of the magnetic moment of Mn per atom
mainly comes from the estimation of X , and the contribution of the surface

40 Chapter 3. Results and discussions
metallic Mn compound to the magnetization is, if at all, small.
Figure 3.11(b) shows the temperature dependence of mangetization,
clearly showing ferromagnetism up to 400 K. One can see a kink at ∼ 300
K, which seems to be slightly enhanced by the removal of the surface layer by
sputtering. This may correspond to the TC = 312 K of bulk Zn1−xMnxGeP2
[3.12] (Fig. 2.5). Another anomaly at 20 - 50 K may also correspond to
the 47 K anomaly of bulk Zn1−xMnxGeP2. It is therefore possible that
the present sample is a multiphase one, containing Zn1−xMnxGeP2 as one
component. Recently, ZnGeP2:Mn prepared at 550◦C was studied and the
M(T ) curve showed pronounced singularities at ∼ 318 K and 20 - 50 K,
and small magnetization taling above 318 K the behaviour of which is more
similar to bulk Zn1−xMnxGeP2 than the present sample [3.13]. We note
that Zn1−xMnxGeP2 was electrically insulating [3.12], while the sample in
the present study showed a metallic Fermi edge, which was attributed to the
hole-producing defects and/or antisites. From these works, it is conjectured
that the increase of the preparation temperature of ZnGeP2:Mn above 400◦Cwill supress the hole-producing defects and/or antisites, which makes the
interfacial compound insulating, supresses the magnetization above 320 K,
and makes the ∼ 310 K and 20 - 50 K anomalies in the M -T curve more
pronounced. Further studies are necessary, in particular to understand the
relationship between the magnetic behaviour, the carrier density, and the
preparation temperature.

References
[3.1] G.A. Medvedkin, K. Hirose, T. Ishibashi, T. Nishi, V.G. Voevodin,
and K. Sato, J. Cryst. Growth 236, 609 (2002).
[3.2] K. Sato, G.A. Medvedkin, and T. Ishibashi, J. Cryst. Growth 237-
239 1363 (2002)
[3.3] E.E. Huber Jr. and D.H. Ridgley, Phys. Rev. 135 A 1033.
[3.4] U. Rao and H.W. Schock, Appl. Phys. A: Mater. Sci. Process. 69,
131 (1999) and references therein; I.M. Kotschau and H.W. Schock,
ICTMC13, Paris France (2002).
[3.5] L. Ley, M. Taniguchi, J. Ghijsen, R. L. Johnson, and A. Fujimori,
Phys. Rev. B 35, 2839 (1987).
[3.6] J. Okabayashi, A. Kimura, T. Mizokawa, A. Fujimori, T. Hayashi and
M. Tanaka, Phys. Rev. B 59, R2486 (1999).
[3.7] J. Okabayashi, T. Mizokawa, D. D. Sarma, A. Fujimori, T. Slupinski,
A. Oiwa, and H. Munekata, Phys. Rev. B 65 R161203 (2002).
[3.8] T. Mizokawa, T. Nambu, A. Fujimori, T. Fukumura and M. Kawasaki,
Phys. Rev. B 65 085209 (2002).
[3.9] P.G. Baranov, S.I. Goloshchapov, G.A. Medvedkin, T. Ishibashi, and
K. Sato, Abstract of 2nd Int. Conf. PASPS, Wurtzburg Germany
(2002); J. Superconductivity (special issue Incorporating Novel Mag-
netism) 2003 (in press).
[3.10] A. Kakizaki, H. Sugawara, I. Nagakura, and T. Ishii, J. Phys. Soc.
Jap., 49 2183 (1980)
[3.11] A. Yanase and A. Hasegawa, J. Phys. C 13 1899 (1980)
[3.12] S. Cho, S. Choi, G.-B. Cha, S.C. Hong, Y. Kim, Y.-J. Zhao, A.J.
Freeman, J.B. Ketterson, B.J. Kim, Y.C. Kim, and B.-C. Choi, Phys.
Rev. Lett. 88, 257203 (2002).

42 References
[3.13] G.A. Medvedkin, P.G. Baranov, and S.I. Goloshchapov, J. Phys.
Chem. Solids, in press.
Chapter 4
Summary
ZnGeP2:Mn interface was studied by photoemission spectroscopy. We ob-
served spectral features of localized Mn 3d states incorporated into the host
ZnGeP2 in the lightly Mn-doped surface region and in deep bulk below the
surface metallic Mn compound. A metallic Fermi edge of non-Mn 3d char-
acter was observed in the deep dilute Mn phase. This indicates that the
carrier doping ability in the dilute Mn phase of ZnGeP2:Mn is sufficiently
high compared to the II-VI and III-V-based DMSs, although the detailed
mechanism of doping is still unknown. Room-temperature ferromagnetism
was observed after removing the metallic Mn compound in the surface and
subsurface regions. This indicates that the ferromagnetism in ZnGeP2:Mn
is due to the dilute Mn phase deep in the deep region. No secondary phase
of MnP was observed in the photoemission spectra.

44 Chapter 4. Summary

Acknowledgements
First of all, I would like to express my deepest gratitude to Prof. Atsushi
Fujimori who introduced me into the field of photoemission spectroscopy.
His gentle and heartful advices, together with his deep insight into physics,
always encouraged me in a delightful way. Words for showing my gratitudes
to him always become insufficient, but I really thank him.
I was very lucky to collaborate with Prof. D.D. Sarma from my early
stage of the master course. Particularly, the opportunities that I partici-
pated in the synchrotron experiments together with him, and the exciting
discussions over the interpretation of the data, how to proceed to the next
step, how to extract the maximum results from the limited beamtime, etc.,
have definitely become my heritage. I really learned a lot from him. Besides,
it was his strong initiative that I started the study of ZnGeP2:Mn. Not to
mention of his charms, I had a very pleasurable time with him. I thank him
so much.
The experiments at the synchrotron were supported by a number of
people. I am particulary indebted to the members of Kinoshita group, Dr.
T. Okuda, Ms. A. Harasawa, Dr. T. Wakita, and Prof. T. Kinoshita, for
their valuable technical help during the beamtime. Prof. K. Ono and Prof.
M. Oshima have kindly provided us with pure Mn metal, Prof. M. Okusawa
and Prof. T. Komatsubara have let us measure MnP. All these supports were
indispensable and essential for the present thesis. Gratitude is expressed for
all of them.
Let me also thank Prof. K. Sato and his colleagues, Prof. G.A. Medved-
kin and Dr. T. Ishibashi. They provided us with such an interesting and
excellent samples of ZnGeP2 togeter with the valuable advice and discus-
sions. Not just the offer of ZnGeP2, but it was the kind advice on the op-
tical measurements of ferromagnets, which have provided me another new
enthusiasm. I also thank them for their heartful support during my stay in
Paris. The lonely journy became a wonderful one.
The life during the master course is commemorated with the joyful
members of the Fujimori group: Dr. J. Okabayashi, Dr. T. Yoshida, Mr. K.
Okazaki, Mr. K. Tanaka, Mr. S. Nawai, Mr. H. Yagi, Mr. J.I. Hwang, Mr.

46 Chapter 4. Summary
H. Wadachi, and Ms. Y. Shimazaki. From each of these members, I was
taught a lot ranging from physics to common sense, and strong interaction
with each of them lead to either the stimulating discussions, new ideas, or
the share of passion. I thank each of them for adding pleasures to my life.
I cannot miss the contribution of Mr. H. Ott during his short stay in
the Fujimori group. Especially, I would like to acknowledge the support and
the constructive suggestions during the beamtime. I learned from him the
German common-sence in performing experiments. The ideas were always
refreshing, and surely have broadened my point of view.
I gratefully acknowledge the valuable comments of Prof. T. Mizokawa.
It was one of the most pleasurable time when having stimulating disscussions
with him. I have been deeply inspired by his view of physics and his sincere
attitude towards research.
The following people have contributed either their magic, faith, time,
energy, vision, passion, support, or friendship in an important and appreci-
ated way: R. Anraku, H. Sakai, Y. Tanaka, J. Quilty, J.Y. Son, Y. Hitsuda,
D. Asakura, M. Ikeda, N. Ueda, M. Kurokawa, T. Tran, S. Hirata, Y. Aisaka,
K. Ideguchi, T. Otsuki, R. Kumazawa, H. Yoshida. K. Abe, and A. Ito. I
thank each of them very much.
Finally, I would like to express my special thanks to my brother and
my parents. This is more than special thanks.
January 2002,
Yukiaki Ishida