
Performance Benchmarking Locality Aware Runtime...
14
http://www.cse.wustl.edu/~jain/cse567-17/ftp/numaeval/index.html 1 Performance Benchmarking Locality Aware Runtime for NUMA Architecture Justin Deters [email protected] (A paper written under the guidance of Prof. Raj Jain) Download Abstract Non-Uniform Memory Access architectures introduce a new level of difficulty to programmers. Without the knowledge of the underlying runtime the performance of programs can suffer because they are unaware of the difference in memory latencies in NUMA systems. We seek to alleviate this issue by implementing a runtime that schedules computations on individual NUMA nodes, hopefully countering this problem. This study specifically uses the systematic approach to performance evaluation and a full factorial experimental design. We implemented our solution within the Cilk runtime and performed our experiments on a 4 socket NUMA machine. Keywords: parallel computing, NUMA, locality, runtime, Cilk, remote memory, caching Table of Contents • 1. Introduction • 2. Experimental Design • o 2.1 System and Goals o 2.2 Services and Outcomes o 2.3 Metrics o 2.4 Parameters and Factors o 2.5 Statistical Methodology • 3. Experiment and Analysis • o 3.1 Experiment o 3.2 Analysis • 4. Summary • References • List of Acronyms 1. Introduction Non-Uniform Memory Architectures (NUMA) are systems that have more than one CPU and therefore more than one bank of main memory. Accessing memory that is non-local to a particular CPU has a higher memory latency, introducing non-uniform access times and paths to memory [Lameter13]. The NUMA architecture introduces some difficulty into programming. If
Transcript of Performance Benchmarking Locality Aware Runtime...
http://www.cse.wustl.edu/~jain/cse567-17/ftp/numaeval/index.html 1
Performance Benchmarking Locality Aware Runtime for NUMA Architecture Justin Deters [email protected] (A paper written under the guidance of Prof. Raj Jain) Download
Abstract Non-Uniform Memory Access architectures introduce a new level of difficulty to programmers. Without the knowledge of the underlying runtime the performance of programs can suffer because they are unaware of the difference in memory latencies in NUMA systems. We seek to alleviate this issue by implementing a runtime that schedules computations on individual NUMA nodes, hopefully countering this problem. This study specifically uses the systematic approach to performance evaluation and a full factorial experimental design. We implemented our solution within the Cilk runtime and performed our experiments on a 4 socket NUMA machine.
Keywords: parallel computing, NUMA, locality, runtime, Cilk, remote memory, caching
Table of Contents • 1. Introduction • 2. Experimental Design
• o 2.1 System and Goals o 2.2 Services and Outcomes o 2.3 Metrics o 2.4 Parameters and Factors o 2.5 Statistical Methodology
• 3. Experiment and Analysis • o 3.1 Experiment o 3.2 Analysis
• 4. Summary • References • List of Acronyms
1. Introduction Non-Uniform Memory Architectures (NUMA) are systems that have more than one CPU and therefore more than one bank of main memory. Accessing memory that is non-local to a particular CPU has a higher memory latency, introducing non-uniform access times and paths to memory [Lameter13]. The NUMA architecture introduces some difficulty into programming. If

http://www.cse.wustl.edu/~jain/cse567-17/ftp/numaeval/index.html 2
the programmers do not account for the underlying hardware, they may not achieve their expected performance. This is due to the execution suffering from the use of non-local memory.
Several systems have been suggested to conquer the locality problem. Drebes et al. suggest dynamically grouping computations together on nodes using "work pushing". The process takes tasks that have data that depend on each other and place them on the same NUMA nodes [Drebes16]. Majo and Gross suggest a more hands on approach. They directly modify algorithms and use OS tools to increase data locality [Majo13]. Our solution was to modify a parallel runtime to pin computations to single CPUs, hopefully increasing the locality overall.
2. Experimental Design In order to determine if our modified runtime system actually improves performance and increases locality we must first define what we want to measure. In this section, we strictly define our system, outline what data we will collect, and establish the statistical methodology employed to analyze our data.
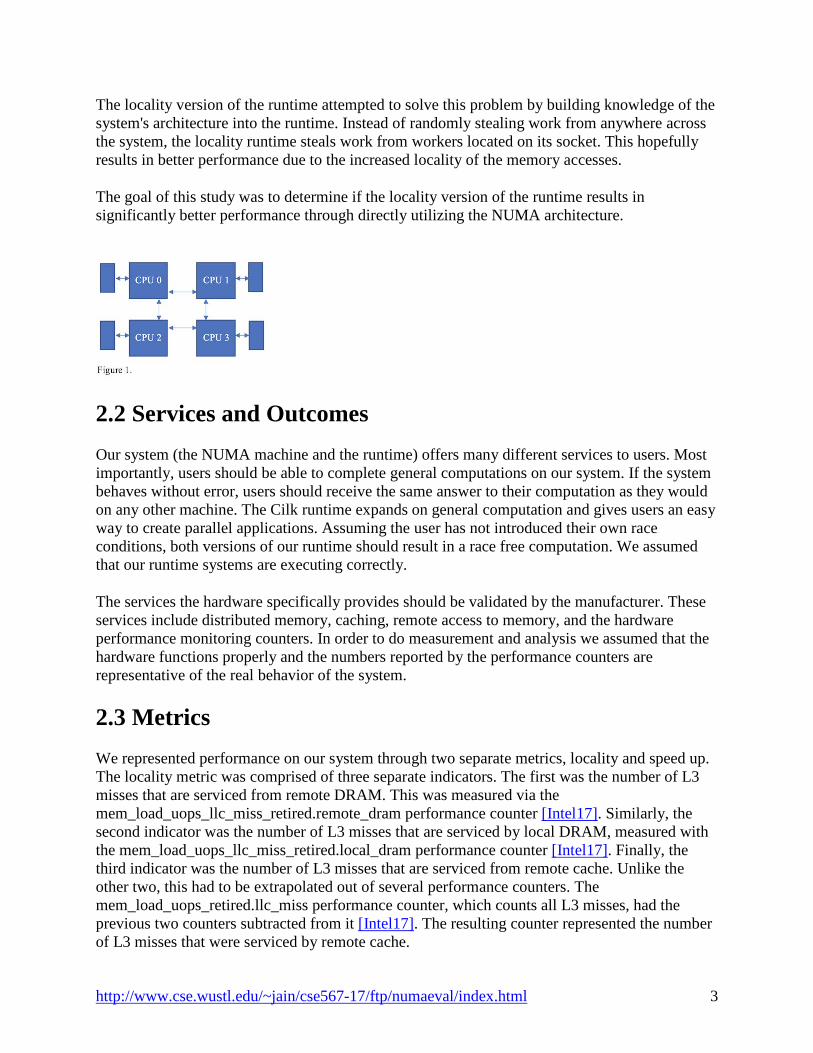
2.1 System and Goals Our system was comprised of two separate pieces, the hardware architecture and the software runtime that specifically targets the architecture. Our hardware consisted of a four socket NUMA machine. Each socket had an Intel SandyBridge EP E5-4620 with 8 cores running at 2.20GHz. Every core had a private L1 cache of 32 kB, a private L2 cache of 256 kB, and a shared L3 cache of 16 MB. Sockets then had a local DRAM of 132 GB. The piece of the system that introduces the non-uniform aspect of the NUMA was the inclusion of the Intel QuickPath Interconnects (QPI) between each socket. The QPIs allowed for the sockets to access remote memory and transmit other information [Intel09]. Figure 1 shows the topology of the system.
The software side of our system consists of two separate runtimes, a "vanilla" non-NUMA aware runtime, and a "locality" NUMA aware runtime. In general, it is not an issue if a programmer is unaware of the NUMA architecture of their system. The operating system will allocate memory and schedule the computation on as many cores as needed, even across sockets. However, this lack of knowledge can lead to significant performance degradation. The vanilla version of our runtime behaves in this way.
The Cilk runtime works using the fork-join parallelism model. When the runtime encounters the keyword "cilk_spawn" it creates new work for the runtime to complete, forking the computation. If a worker runs out of work, it will randomly steal work from another victim worker and continue the computation. When the runtime encounters the "cilk_sync" keyword, it waits for all the workers to finish before executing more computation, joining the computation [Frigo98]. Because the runtime is not aware of the NUMA architecture, it may randomly steal work from a worker on another socket resulting in performance degradation due to the expense of remote memory accesses.
http://www.cse.wustl.edu/~jain/cse567-17/ftp/numaeval/index.html 3
The locality version of the runtime attempted to solve this problem by building knowledge of the system's architecture into the runtime. Instead of randomly stealing work from anywhere across the system, the locality runtime steals work from workers located on its socket. This hopefully results in better performance due to the increased locality of the memory accesses.
The goal of this study was to determine if the locality version of the runtime results in significantly better performance through directly utilizing the NUMA architecture.
2.2 Services and Outcomes Our system (the NUMA machine and the runtime) offers many different services to users. Most importantly, users should be able to complete general computations on our system. If the system behaves without error, users should receive the same answer to their computation as they would on any other machine. The Cilk runtime expands on general computation and gives users an easy way to create parallel applications. Assuming the user has not introduced their own race conditions, both versions of our runtime should result in a race free computation. We assumed that our runtime systems are executing correctly.
The services the hardware specifically provides should be validated by the manufacturer. These services include distributed memory, caching, remote access to memory, and the hardware performance monitoring counters. In order to do measurement and analysis we assumed that the hardware functions properly and the numbers reported by the performance counters are representative of the real behavior of the system.
2.3 Metrics We represented performance on our system through two separate metrics, locality and speed up. The locality metric was comprised of three separate indicators. The first was the number of L3 misses that are serviced from remote DRAM. This was measured via the mem_load_uops_llc_miss_retired.remote_dram performance counter [Intel17]. Similarly, the second indicator was the number of L3 misses that are serviced by local DRAM, measured with the mem_load_uops_llc_miss_retired.local_dram performance counter [Intel17]. Finally, the third indicator was the number of L3 misses that are serviced from remote cache. Unlike the other two, this had to be extrapolated out of several performance counters. The mem_load_uops_retired.llc_miss performance counter, which counts all L3 misses, had the previous two counters subtracted from it [Intel17]. The resulting counter represented the number of L3 misses that were serviced by remote cache.
http://www.cse.wustl.edu/~jain/cse567-17/ftp/numaeval/index.html 4
Increased locality was indicated by a decrease in L3 misses being serviced by remote DRAM and remote caches. Inversely, L3 misses being served local DRAM would increase. If the work is being done locally, there would be less access remote memory and more access local memory, thus higher locality.
Speed up was indicated by taking the execution time of the work being done on a single core and dividing it by the execution time of the work being done on all cores (in our case 32 total cores). Perfect linear speed up would result in 32 times faster than the single core execution. The closer each runtime got to perfect linear speed up, the better the indicated performance. This indicator allowed us to better compare the runtimes rather than directly comparing the execution times of programs. To use the locality runtime, programs had to be modified with new structures. This un-paired the programs from their execution on each of the runtimes. As long as the single core runs of the programs had similar execution times, the indicator was still valid.
2.4 Parameters and Factors In our experiment, we held many system parameters constant. The clock speed of the processors was kept at a constant rate. The logical cores were disabled, so only physical cores were being executed upon. Both versions of the runtime were compiled using the same complier and run on CentOS 7. Every experiment (except for determining speed up) was run on all 32 cores of our system. All hardware pre-fetching remained in place during our experiments. None of the underlying hardware parameters were modified between experiments. Holding these parameters constant allowed us to isolate the behavior of our runtimes.
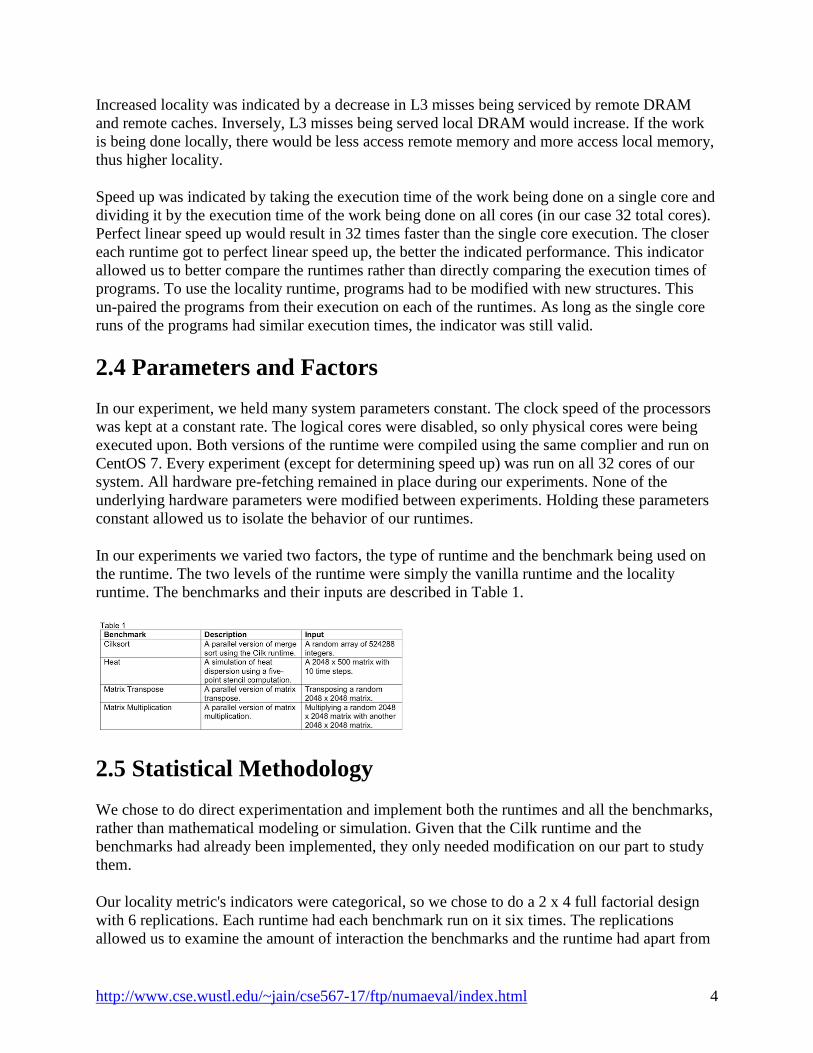
In our experiments we varied two factors, the type of runtime and the benchmark being used on the runtime. The two levels of the runtime were simply the vanilla runtime and the locality runtime. The benchmarks and their inputs are described in Table 1.
2.5 Statistical Methodology We chose to do direct experimentation and implement both the runtimes and all the benchmarks, rather than mathematical modeling or simulation. Given that the Cilk runtime and the benchmarks had already been implemented, they only needed modification on our part to study them.
Our locality metric's indicators were categorical, so we chose to do a 2 x 4 full factorial design with 6 replications. Each runtime had each benchmark run on it six times. The replications allowed us to examine the amount of interaction the benchmarks and the runtime had apart from

http://www.cse.wustl.edu/~jain/cse567-17/ftp/numaeval/index.html 5
the main effects. All of the replications were averaged using the arithmetic mean before computing the effects.
For the speed up metric we had to use a slightly different experimental design. We still used a 2 x 4 full factorial design, but we did not include any replications. Due to the fact that the metric is comprised of two separate indicators, replicating the experiment itself did not make sense. The sequential run was completely independent from the 32-core run. Instead we ran each benchmark and using a single core and 32 cores for each runtime, and then repeated that 6 times. Then using the arithmetic mean, we created an average runtime for each benchmark. Using this we could then create our speed up metric and do our analysis on it.
3. Experiment and Analysis In this section, we describe the implementation of the runtime system as well as the modified benchmarks. We then analyze the experimental data. For the locality metric, we analyze the data indicator by indicator. For the speed up metric, we analyze the metric as a whole.
3.1 Experiment The locality runtime was implemented by modifying the existing Intel Cilk Plus runtime. It added new keywords that allowed the user to specifically "pin" the portions of the computation to certain nodes. This required us to then modify the existing benchmarks to take advantage of these new keywords. In each of the benchmarks, the computation was split over the four NUMA nodes as best as possible. In addition to this, the data structures had to be modified to be distributed over the four nodes rather than contiguous on one.
Likwid
To measure our runtimes, we utilized the Likwid performance monitoring suite. Likwid allows users to easily access the Intel performance counter registers [Treibig10]. Normally, reading the Intel performance counters would be a very involved process of setting specific bits to read very specific events [Intel17]. Likwid elevates this issue by having many of the performance counters pre-configured in the application. All users have to do it build their own custom "performance group" in a plain text file to access these counters and display their metrics [Treibig10].
Likwid also provides the ability to have fine grained monitoring via their programming interface. Users add a series of function calls to their programs and Likwid only monitors the sections of code in between the function calls [Treibig10]. Both of our runtimes were modified to utilize the fine-grained monitoring.
The measuring markers were inserted in the portions of the runtime that pass execution to the user code. By doing this we accomplished two things. First, we ensured that the performance counters are only being read during serial parts of the execution. The worker that evokes the start function would be the same worker that evoked the stop function. Second, we isolated the monitoring to just the change in performance of the benchmarks themselves. We could then be

http://www.cse.wustl.edu/~jain/cse567-17/ftp/numaeval/index.html 6
certain that changes in our metrics were due to user code execution, rather than reflecting the changes made in the runtime.
Intel Performance Counters
The assumption that all the performance counters were functioning properly turned out to be invalid. Within the SandyBridge EP architecture, the performance counters we had chosen to monitor our program turned out to have bugs. This was documented by Intel in their specification update [Intel1702]. Luckily, Intel provided a fix for their counters so that they would collect the right numbers. However, this fix resulted in worse performance for other metrics, such as memory latency [Intel1702]. Because of this they were only enabled during the testing for our locality indicators. After we confirmed that the fix worked with micro-benchmarks, we continued our experiment with our original assumption in place.
3.2 Analysis In order to determine if our runtime has any effect on the performance of the benchmarks, we perform our 2 x 4 full factorial experiments. In this section, we analyze the L3 misses serviced by remote cache, the L3 misses serviced by remote DRAM, L3 misses serviced by local DRAM, and the speed up of each of the benchmarks.
L3 Misses Serviced by Remote Cache
Our analysis beings with an examination of the L3 misses serviced by remote cache. Due to space constraints, we do not show each individual experiment, but only the average of the trials. The calculation of the effects is shown in Table 2.
It is immediately apparent that the locality runtime is responsible for some sort of reduction in the L3 misses being serviced by remote caches. However, to what extent cannot be determined with this evaluation alone. We continue our examination with an ANOVA analysis in Table 3.

http://www.cse.wustl.edu/~jain/cse567-17/ftp/numaeval/index.html 7
All three of our effects pass the F test. However, the effect we are most interested in, the type of runtime used, only accounts for 9% of the total variation in the model. We also see that the errors make up a larger amount of the explained variation. To determine if our locality runtime is any better than the vanilla runtime for this indicator, we perform a contrast between the two in Table 4.
The confidence interval shows that this contrast is indeed significant at the 90% confidence level. So, the locality runtime does account for some reduction in the L3 misses serviced by remote cache. However, due to the low amount of variation explained by these effects the performance improvement is unimportant. We then perform visual tests on our model to validate assumptions in Figure 3 and Figure 4.
Figure 3 and Figure 4 clearly show trends in the residuals of our analysis. This means our model and our results are not accurate. In order to alleviate this issue, we performed a transformation using the natural log on our data and performed our analysis again. This is shown below starting with Table 5.

http://www.cse.wustl.edu/~jain/cse567-17/ftp/numaeval/index.html 8
Luckily, the negative effect remains the same in our transformed analysis. Again, in Table 6 we perform an ANOVA analysis to determine how much variation is explained by our runtime.
Once again, our effects pass the F test. Through applying our transformation, we have reduced the variation explained by the error from 13% to 1%. But, our runtime explains even less of the variation at 6%, down from 9%. We perform our contrast again in Table 10.
The locality runtime is significantly different than the vanilla runtime. This does not mean much because the runtime as a whole is unimportant to our model. Figure 5 and Figure 6 confirm that our transformations have indeed improved our model.

http://www.cse.wustl.edu/~jain/cse567-17/ftp/numaeval/index.html 9
There does not seem to be any trend in the residuals and the residuals are normally distributed. Our new model is sound and the results are representative. For our other locality indicators, we found the same trends in the data. For brevity, we will apply the natural log transformation at the beginning of our analysis.
L3 Misses Serviced by Remote DRAM
Our next indicator is the L3 cache misses serviced by remote DRAM. We begin again with the calculation of effect, this time applying a natural log transformation. This calculation is done in Table 8.
The locality runtime does result in fewer L3 cache misses serviced by remote DRAM. The ANOVA analysis in Table 9 will tell us if the runtime is important to this model.
The effects pass the F tests. Unfortunately, our runtime is not important in this model, only explaining 8% of the total variation. The contrast test in Table 10 shows that the two runtimes are significantly different than each other.
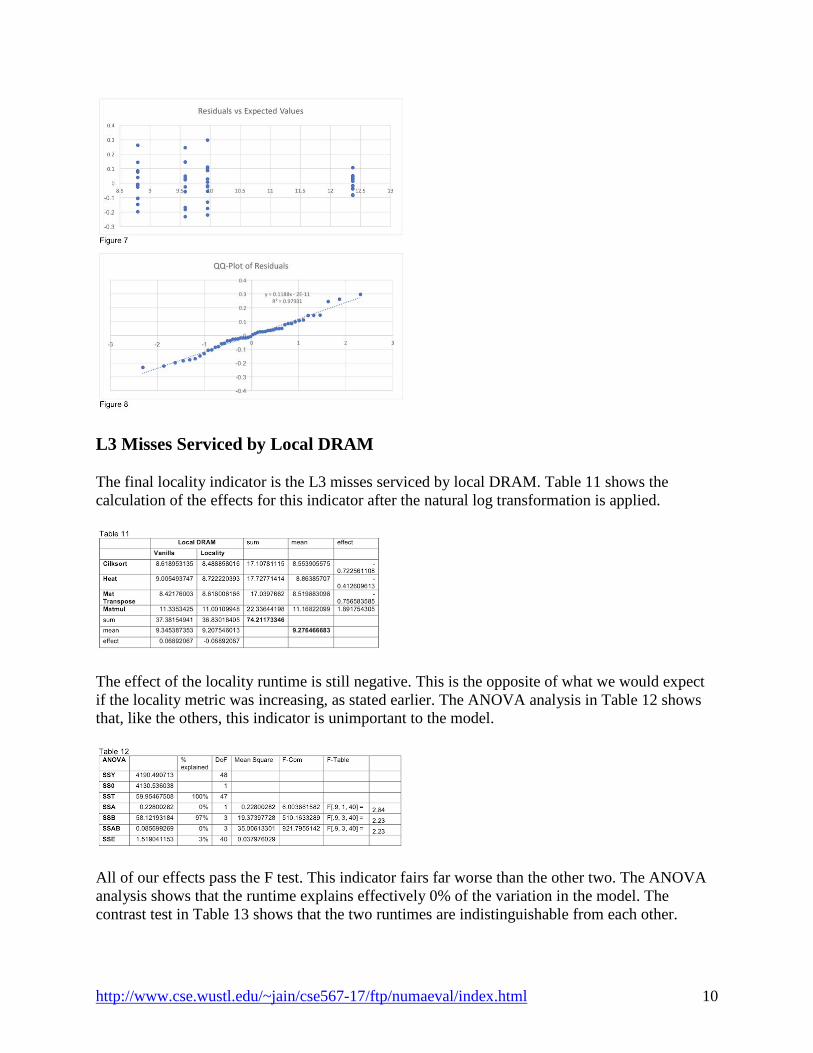
The visual tests in Figure 7 and Figure 8 show no trends in the residuals and the residuals are normally distributed, so we may be confident in this model.
http://www.cse.wustl.edu/~jain/cse567-17/ftp/numaeval/index.html 10
L3 Misses Serviced by Local DRAM
The final locality indicator is the L3 misses serviced by local DRAM. Table 11 shows the calculation of the effects for this indicator after the natural log transformation is applied.
The effect of the locality runtime is still negative. This is the opposite of what we would expect if the locality metric was increasing, as stated earlier. The ANOVA analysis in Table 12 shows that, like the others, this indicator is unimportant to the model.
All of our effects pass the F test. This indicator fairs far worse than the other two. The ANOVA analysis shows that the runtime explains effectively 0% of the variation in the model. The contrast test in Table 13 shows that the two runtimes are indistinguishable from each other.

http://www.cse.wustl.edu/~jain/cse567-17/ftp/numaeval/index.html 11
The visual test for this model in Figure 9 and Figure 10 show that there are no trends in the residuals and the residuals are normally distributed. We can trust this model is representative.
Two out of the three indicators for our locality metric moved in the direction that we expected them to, albeit that they are not important to the models. It is possible that the third indicator is showing an increase in locality as well. If the pre-fetchers are aggressively pulling in cache lines from the local memory, there might be an overall reduction in cache misses, explaining the trend we see. However, we do not have enough information to know if this effect is occurring. Ergo, it is inconclusive if we are increasing locality using our modified runtime.
Speed Up
Our second indicator, speed up, shows whether or not our runtime has any effect on the overall performance of the computation. If this metric turns out to be important and significant, it means that our runtime does actually contribute to a performance increase. The calculation of the effects is shown in Table 14.
http://www.cse.wustl.edu/~jain/cse567-17/ftp/numaeval/index.html 12
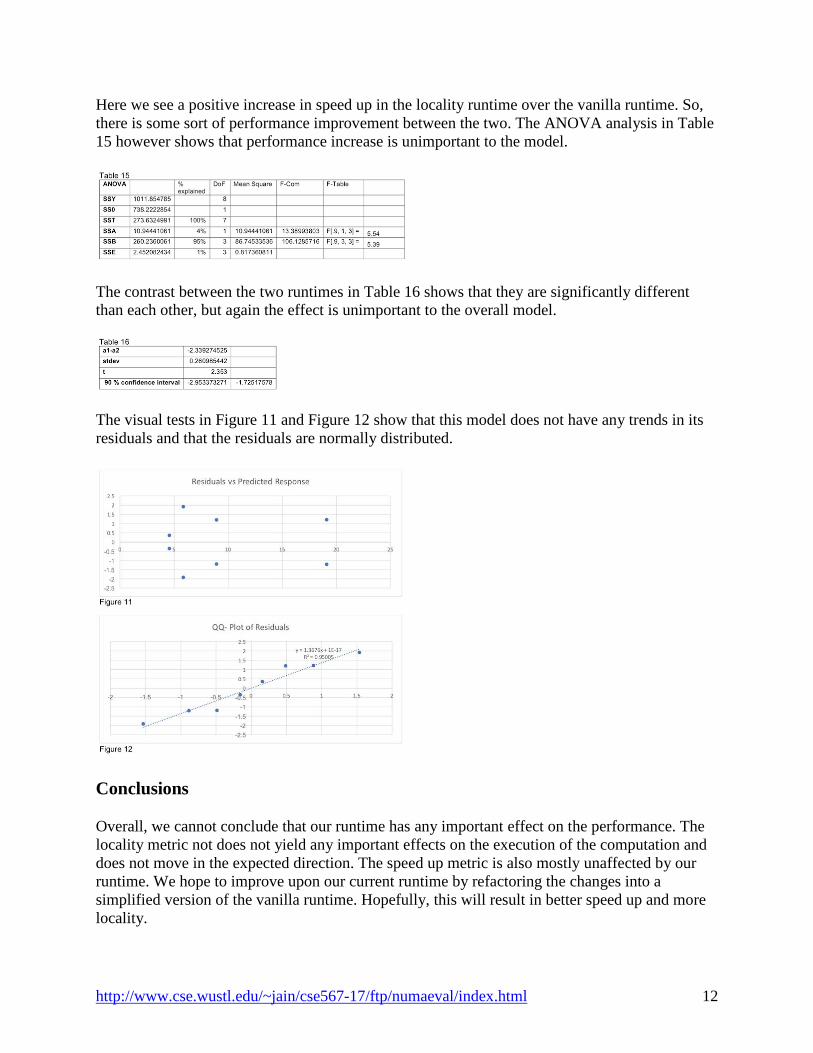
Here we see a positive increase in speed up in the locality runtime over the vanilla runtime. So, there is some sort of performance improvement between the two. The ANOVA analysis in Table 15 however shows that performance increase is unimportant to the model.
The contrast between the two runtimes in Table 16 shows that they are significantly different than each other, but again the effect is unimportant to the overall model.
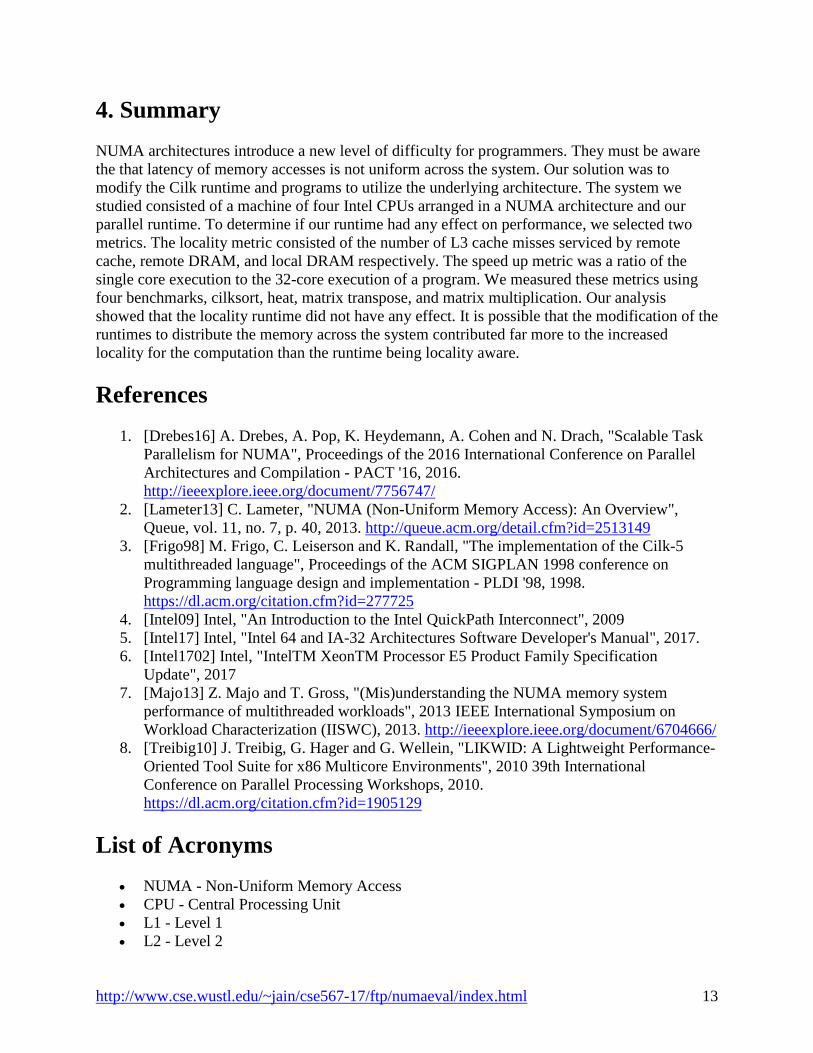
The visual tests in Figure 11 and Figure 12 show that this model does not have any trends in its residuals and that the residuals are normally distributed.
Conclusions
Overall, we cannot conclude that our runtime has any important effect on the performance. The locality metric not does not yield any important effects on the execution of the computation and does not move in the expected direction. The speed up metric is also mostly unaffected by our runtime. We hope to improve upon our current runtime by refactoring the changes into a simplified version of the vanilla runtime. Hopefully, this will result in better speed up and more locality.
http://www.cse.wustl.edu/~jain/cse567-17/ftp/numaeval/index.html 13
4. Summary NUMA architectures introduce a new level of difficulty for programmers. They must be aware the that latency of memory accesses is not uniform across the system. Our solution was to modify the Cilk runtime and programs to utilize the underlying architecture. The system we studied consisted of a machine of four Intel CPUs arranged in a NUMA architecture and our parallel runtime. To determine if our runtime had any effect on performance, we selected two metrics. The locality metric consisted of the number of L3 cache misses serviced by remote cache, remote DRAM, and local DRAM respectively. The speed up metric was a ratio of the single core execution to the 32-core execution of a program. We measured these metrics using four benchmarks, cilksort, heat, matrix transpose, and matrix multiplication. Our analysis showed that the locality runtime did not have any effect. It is possible that the modification of the runtimes to distribute the memory across the system contributed far more to the increased locality for the computation than the runtime being locality aware.
References 1. [Drebes16] A. Drebes, A. Pop, K. Heydemann, A. Cohen and N. Drach, "Scalable Task
Parallelism for NUMA", Proceedings of the 2016 International Conference on Parallel Architectures and Compilation - PACT '16, 2016. http://ieeexplore.ieee.org/document/7756747/
2. [Lameter13] C. Lameter, "NUMA (Non-Uniform Memory Access): An Overview", Queue, vol. 11, no. 7, p. 40, 2013. http://queue.acm.org/detail.cfm?id=2513149
3. [Frigo98] M. Frigo, C. Leiserson and K. Randall, "The implementation of the Cilk-5 multithreaded language", Proceedings of the ACM SIGPLAN 1998 conference on Programming language design and implementation - PLDI '98, 1998. https://dl.acm.org/citation.cfm?id=277725
4. [Intel09] Intel, "An Introduction to the Intel QuickPath Interconnect", 2009 5. [Intel17] Intel, "Intel 64 and IA-32 Architectures Software Developer's Manual", 2017. 6. [Intel1702] Intel, "IntelTM XeonTM Processor E5 Product Family Specification
Update", 2017 7. [Majo13] Z. Majo and T. Gross, "(Mis)understanding the NUMA memory system
performance of multithreaded workloads", 2013 IEEE International Symposium on Workload Characterization (IISWC), 2013. http://ieeexplore.ieee.org/document/6704666/
8. [Treibig10] J. Treibig, G. Hager and G. Wellein, "LIKWID: A Lightweight Performance- Oriented Tool Suite for x86 Multicore Environments", 2010 39th International Conference on Parallel Processing Workshops, 2010. https://dl.acm.org/citation.cfm?id=1905129
List of Acronyms • NUMA - Non-Uniform Memory Access • CPU - Central Processing Unit • L1 - Level 1 • L2 - Level 2

http://www.cse.wustl.edu/~jain/cse567-17/ftp/numaeval/index.html 14
• L3 - Level 3 • DRAM - Dynamic Random-Access Memory • ANOVA - Analysis of Variation
Last modified: December 15, 2017 This and other papers on performance analysis of computer systems are available online at http://www.cse.wustl.edu/~jain/cse567-17/index.html Back to Raj Jain's Home Page


![Performance Analysis of IoT Security scheme employing an …jain/cse567-17/ftp/iot_sec.pdf · 2.1. Image Steganography Combined with DES Encryption Pre-processing [Ren14] Researchers](https://static.fdocuments.net/doc/165x107/5f9d9c6e0c953c37646b8880/performance-analysis-of-iot-security-scheme-employing-an-jaincse567-17ftpiotsecpdf.jpg)