People Analytics Technology · Introduction The people analytics space is hot and growing fast....
42
People Analytics Technology: The Market Authors: Stacia Sherman Garr, Priyanka Mehrotra
Transcript of People Analytics Technology · Introduction The people analytics space is hot and growing fast....

People Analytics Technology: The Market
Authors: Stacia Sherman Garr, Priyanka Mehrotra

RedThread Research © 2019 People Analytics Technology: The Market | 2
Contents
A Note from our Sponsor 3
About RedThread 5
Introduction 6
Key findings 9
Defining Our Terms 11
The State of the People Analytics Market 13
Classifying the Market 15
How Vendors are Helping Customers 20
Talent Management Areas of Focus 23
Challenges in the Market 27
The Business Side of People Analytics Technology Vendors 33
Conclusion 39
Appendices 40
Appendix I: Demographics 40
Appendix II: Research Methodology 41
About the Authors 42

RedThread Research © 2019 People Analytics Technology: The Market | 3
A Note from our Sponsor
People data, analytics, and their uses have evolved rapidly and significantly over the past 20 years. Particularly over the past ten years the discipline has expanded from research-centric, event-driven approaches to product-centric approaches that are ongoing, sustainable, and scalable. The ingenuity of start-ups, scale-ups, established services providers, as well as people analytics teams themselves have all contributed to fantastic advancements, and the use cases and success stories keep rolling in. This is great. Significant challenges have emerged, however; and several legacy challenges still won’t go away.
This study, led by the world-renowned research team at RedThread Research, points to some of these challenges and offers new ways of thinking about the discipline and the solutions within it. With better clarity, key decision-points and trade-offs can be identified and considered. In turn, organizations can make wiser and faster decisions, decisions that consciously mitigate risk and increase the likelihood that talent-related technology investments reap the desired return.
Now, to be clear, to effectively analyze the People Analytics Technology space required definitions and boundaries be set. This is an imperfect challenge with imperfect results as People Analytics itself has numerous definitions. Couple this with the reality that most every solution provider in the HR or talent space purports to do People Analytics to some measure. Even so, when considering well understood business needs and the solutions designed to meet those needs, clear distinctions did emerge. For example, the concept of data aggregators versus data creators. The former facilitates on-demand analysis and the democratization of insight while the latter actually collects new data, sometimes actively (e.g., via survey) and sometimes passively (e.g., email metadata). Other worthwhile considerations include data sources (internal or external to the HR and/or the org), the frequency of use, and the scope of users, etc. In the end, this study is meant to help educate and clarify. It’s meant to facilitate meaningful discussion on People Analytics and related

RedThread Research © 2019 People Analytics Technology: The Market | 4
technologies. It is not meant to be the last word. The last word is reserved for you and those making key buying or scoping decisions for their organizations.
Finally, a thank you! Thank you to the RedThread Research team. What they’ve produced is groundbreaking in scope, detail, and actionability. I, for one, applaud their creativity and commitment, as without these qualities this study would not have been possible. More valuable insights lie ahead, certainly; and such insights will be made in partnership with you and others like you, so please keep your perspectives and ideas coming. To continuing to make great things happen!
Al Adamsen Founder & CEO, PAFOW Co-Founder & Executive Director, Insight222
About People Analytics and Future of Work
The People Analytics & Future of Work Community & Conference Series is the world’s premier network of professionals promoting the ethical and responsible use of people data and analytics. From GDPR to innovative organizational, team, and individual insights, we’re dedicated to seeing people data used transparently, creatively, and with an unwavering commitment to protecting the rights and well-being of individuals. We share insights, ideas, and proven methods through a series of conferences, roadshows, videos, podcasts, and other media. Ultimately, we’re about People Data for Good. As such, it’s our mission to educate business professionals, and people in general, on the risks, opportunities, and responsibilities inherent in analyzing and acting upon people data. Learn more at pafow.net.

RedThread Research © 2019 People Analytics Technology: The Market | 5
About Insight222
Insight222 is an education, advisory, and consulting firm devoted to helping organizations put People Analytics & Insights at the center of their business strategies. Home of the People Analytics Program, Insight222 facilitates peer group meetings, co-creation projects, content development and curation, training, and the Global Executive Retreat (GER). The GER is a unique experience that helps People Analytics Leaders formulate and pressure test their strategies, budget, technology ecosystem, and innovative ideas in a confidential, high-trust environment. This experience, along with ongoing advisory and facilitation, helps People Analytics Leaders and their teams create sustainable and scalable solutions that are high-impact, ethically responsible, and that benefit both organizations and workers. Insight222 is also home to myHRfuture, the online learning experience platform that provides timely, relevant, and actionable educational experiences at scale. From micro-learning to customized educational experiences for organizations, myHRfuture helps individuals and organizations build the skills of the future. Learn more at insight222.com and myHRfuture.com.
About RedThread
Sure, we’re experts in performance, people analytics, learning, and D&I – and we’re well-versed in the technologies that support them. But we’re also truth-seekers and storytellers in an industry often short on substance, and too full of @#$%. Our mission (indeed, our very reason for existing) is to cut through the noise and amplify what’s good. We look for the connections (or red threads) between people, data, and ideas – even among seemingly unrelated concepts. The result is high-quality, unbiased, transformative foresight that helps you build a stronger business. If you want to learn more, reach out to us at [email protected] or visit www.redthreadresearch.com.

RedThread Research © 2019 People Analytics Technology: The Market | 6
Introduction
The people analytics space is hot and growing fast. According to LinkedIn, the number of HR professionals who listed analytics skills and keywords on their profiles1 increased 3x in the last five years in North America. Further, the number of people analytics conferences – a potentially crude but useful measure of interest – nearly doubled between just 2018 and 2019, going from approximately 70 to more than 120.2 In addition, our analysis reveals this interest was matched by the number of people analytics vendors, which nearly doubled in the last five years.
There are many reasons for this growth. First, there is the rise in the concept of the “quantified self”—the idea that if we can measure and track activities (in both our personal and professional lives), we can improve overall performance. Many of us have experienced this personally (hello Fitbits and Apple Health monitors), had our imaginations captured by it through movies such as Moneyball, and been at least a bit worried by scandals such as that involving Cambridge Analytica. It is now a truth universally acknowledged that there are data and analysis capabilities that can tell us much more than we knew before about people’s behaviors and activities.
It really is just a short step to apply this truth to organizations. While industrial organizational (I/O) psychologists have worked in organizations for decades, new technologies have made access to data much easier, increased storage capacities, and improved analysis capabilities, transforming what is possible. With this shift, leaders realize the importance of applying data analytics to every aspect of their business functions – and especially those that involve people – with an aim to improve productivity and performance.
While a “the sky’s the limit” mentality pervades the people analytics space, the rapid rise of new vendors has caused confusion and
1 “The Rise of Analytics in HR,” LinkedIn report, 20182 “100+ Conferences to Attend in 2019 on People Analytics, the Future of Work and Data-Driven HR,” David
Green, myHRfuture, 2019.

RedThread Research © 2019 People Analytics Technology: The Market | 7
frustration among practitioners trying to understand what is possible and who can help them do it. With overlapping capabilities and a wide range of functionalities available from most vendors, practitioners face a dilemma when it comes to understanding the market and selecting technology.
Given this reality, we wanted to better understand one critical question:
What does the current people analytics technology market landscape look like?
This includes an examination of:
• How big is the market and how quickly is it growing?
• How should we think about classifying the market?
• What types of data do vendors analyze and for whom?
To understand the answers to these questions, we spent approximately a year studying the market by:3
• Polling practitioners and vendors on the questions they most wanted answered
• Reviewing more than 50 articles on people analytics4
• Surveying 37 people analytics vendors and completing briefings with 30 of them
• Conducting an online roundtable with people analytics practitioners
• Interviewing people analytics practitioners
We concluded that the current people analytics technology market is somewhat like a teenager: growing and changing fast, unsure of what it wants to be when it grows up, and needing to think beyond the conventional. We hope that the insights from this report will help not just vendors and practitioners by providing clarity about the landscape but also help the market grow up into a capable, responsible adult.
3 See Appendix for full methodology.4 “People Analytics Technology Literature Review,” Stacia Garr, RedThread Research, March 2019

RedThread Research © 2019 People Analytics Technology: The Market | 8
The end result of our research is more than 100 pages of insights and images, which we decided to publish in two parts. In this report, the first part, we share with you our framework of the market and crucial findings on the market from our survey results. In the the second part of the report, we focus on vendors and highlight the differentiators between them, categorize them, and provide descriptions, technology screenshots, and case studies.
Finally, before we dive into this report, we want to clear that while we have shared our best thinking here, we know we are just at the beginning of understanding the full depth and breadth of this market. As you read it, if you have thoughts and suggestions, we encourage you to reach out to us at hello@redthreadresearch. We welcome your insights.

RedThread Research © 2019 People Analytics Technology: The Market | 9
Key findings
1. The people analytics technology market needs a framework that can help practitioners and vendors navigate the market. We developed a 2x2 model which categorizes vendors based on how frequently the solutions are used and the data sources from which they pull. This model provides meaningful insights into critical points of differentiation between the vendors (See Figure 1):
Figure 1: People Analytics Technology Market Classification Matrix
Data Aggregator
Data Creator
FrequentAnalysis
Continuous Analysis
Guiding Analytics
Snapshot Analytics
Targeted Analytics
Accumulated Analytics
Data aggregated from multiplesystems (e.g., workforce,learning, external data),
analyzed frequently
Data aggregated from multiplesystems (e.g., cross-functional,employee life-cycle/experience
data), analyzed continuously
Data gathered from one or more primary sources
(e.g., employee perspective data),analyzed frequently
Data gathered from one or more primary sources (e.g., employee
engagement or experience, diversity & inclusion, or well-being
data), analyzed continuously
Source: RedThread Research, 2019.

RedThread Research © 2019 People Analytics Technology: The Market | 10
2. The people analytics technology market is comprised of ~90 vendors with an estimated annual revenue of $1.7 billion in 2019.
3. The market is growing rapidly with a 220% compound annual growth rate (CAGR) from 2016 to 2018. Vendors’ customer CAGR for the same period was 23%.
4. Vendors are focused on a range of talent activities including employee engagement, employee experience, and diversity and inclusion.
5. People analytics technology is primarily used by HR and people analytics practitioners, who have independent use cases/needs.
6. HRIS is the primary data source for 90% of vendors, while 78% think talent management data will be more frequently used in the near future.
7. Buyers come from all sizes and specifically hail from knowledge industries, representing a significant addressable market for vendors.

RedThread Research © 2019 People Analytics Technology: The Market | 11
Defining Our Terms
Before we dive into this research, we need to define our terms, so we have a common understanding for everything that comes after.
When we looked for a definition of people analytics, we identified a range of options:
• “People analytics brings together a company’s employee-related data to solve specific business problems in such areas as sales productivity, retention, fraud, and customer satisfaction.”5
• “People analytics, also known as talent analytics or HR analytics, refers to the method of analytics that can help managers and executives make decisions about their employees or workforce.”6
• “Using data about human behavior, relationships, and traits as the basis for making business decisions.”7
• "People Analytics is the process by which insights are generated into the existing or prospective thoughts, feelings, and behaviors of individuals, teams, groups, organizations, and/or broader talent markets."8
Every organization has a different definition of people analytics that works for it, so we aren’t going to focus on defining it here. However, what really matters to us for the sake of this study is the question:
What is a people analytics technology vendor?
We define it as:
People analytics technology vendor: A company offering software that enables people analytics, designed intentionally to use data about people
5 “10 Things We Know About People Analytics,” Josh Bersin, The Wall Street Journal, CIO Journal, December 2015.
6 “People Analytics,” Cornerstone, 2019. 7 “How We Do People Analytics,” Katerina Berg, Spotify HR Blog, March 2019 8 Al Adamsen, Co-Founder, Executive Director, Insight 222.

RedThread Research © 2019 People Analytics Technology: The Market | 12
The crucial distinction between analytics technology vendors and people analytics technology vendors is that the latter specialize in people data. It is certainly true that generic analytics technologies (e.g., PowerBI, Tableau) can be used to analyze people data. However, those are not people analytics technology vendors – they are analytics technology vendors with people data use cases.

RedThread Research © 2019 People Analytics Technology: The Market | 13
The State of the People Analytics Market
One of our primary questions for this study was how big is the people analytics technology market? Through a combination of a thorough review of articles and by querying a number of folks in the industry, we identified a total of 87 people analytics technology vendors. We plotted these vendors by their founding year (accessed via publicly available data) in Figure 2, which shows the recent rapid rise in vendors. According to our estimates, the market grew more than 30% over the last five years, with more than 20 new vendors emerging during that time.
Figure 2: Number of Known Vendors in the People Analytics Technology Market, by Year Founded
0
10
20
30
40
50
60
70
80
90
100
1969 1974 1979 1984 1989 1994 1999 2004 2009 2014 2019
87vendorsthat we know of
# of Vendors by Founding Year
Source: RedThread Research, 2019.
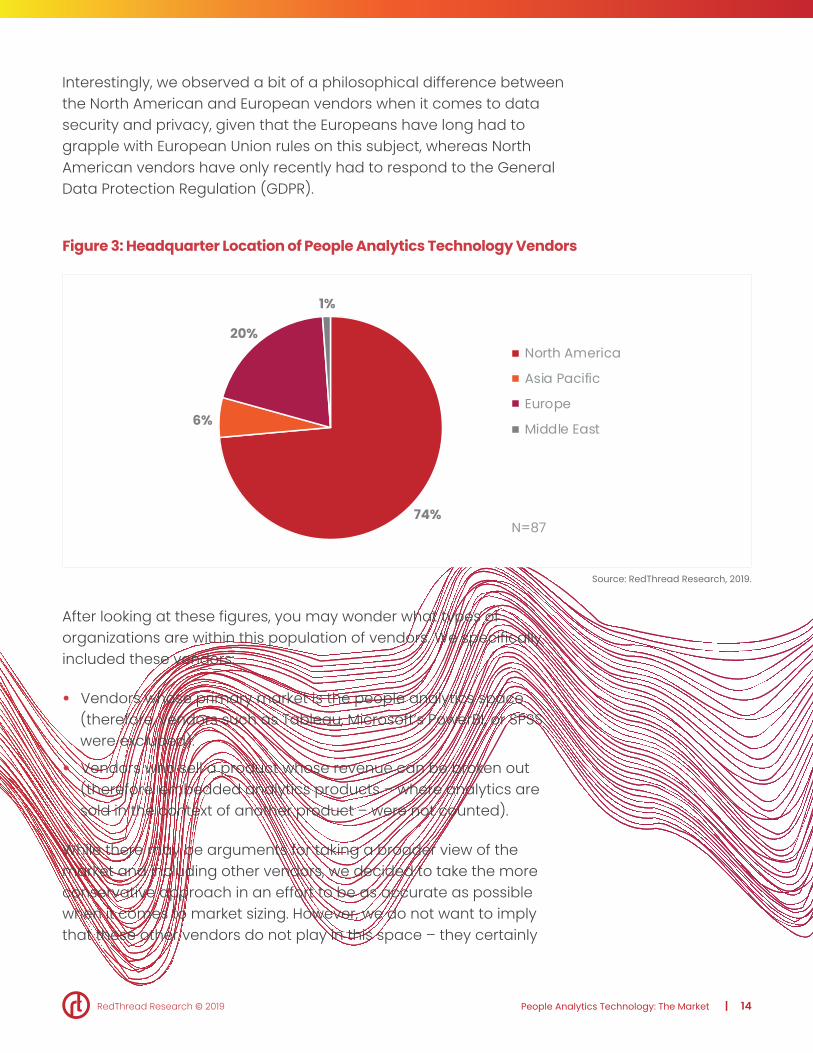
We also wanted to understand if the rise of these vendors is specific to certain geographies and found that most of them – almost 75% – are based in North America (see Figure 3). Another 20% are based in Europe, with the remainder being headquartered in Asia-Pacific (just one organization in the Middle East). The heavy dominance by North America and Europe reflects the overall market geographical distribution we see in HR technology providers.
The market grew more than 30% over the last five years, with more than 20 new vendors emerging during that time.
RedThread Research © 2019 People Analytics Technology: The Market | 14
Interestingly, we observed a bit of a philosophical difference between the North American and European vendors when it comes to data security and privacy, given that the Europeans have long had to grapple with European Union rules on this subject, whereas North American vendors have only recently had to respond to the General Data Protection Regulation (GDPR).
Figure 3: Headquarter Location of People Analytics Technology Vendors
74%
6%
20%
1%
North America
Asia Pacific
Europe
Middle East
N=87
Source: RedThread Research, 2019.
After looking at these figures, you may wonder what types of organizations are within this population of vendors. We specifically included these vendors:
• Vendors whose primary market is the people analytics space (therefore, vendors such as Tableau, Microsoft’s PowerBI, or SPSS were excluded).
• Vendors who sell a product whose revenue can be broken out (therefore, embedded analytics products – where analytics are sold in the context of another product – were not counted).
While there may be arguments for taking a broader view of the market and including other vendors, we decided to take the more conservative approach in an effort to be as accurate as possible when it comes to market sizing. However, we do not want to imply that these other vendors do not play in this space – they certainly

RedThread Research © 2019 People Analytics Technology: The Market | 15
are a part of the people analytics technology stack. Yet, given the nature of their businesses, it is hard to count them accurately from a revenue perspective.
In the course of our research, 37 of the 87 vendors took our survey. Using the data from that survey, plus publicly available data, we estimate the current size of the people analytics technology market to be $1.7 billion. This number is in line with estimates from other firms.9,10
Classifying the Market
Over the course of this research, we had a range of ideas for how to classify the market but found that most of them failed to create meaningful differentiation.11 Ultimately, we arrived at Figure 4, which compares two aspects of vendors’ capabilities: usage frequency and data sources. While we recognize that this may not be the perfect framework for understanding the market, it does allow us to identify some points of differentiation and categorize vendors in different meaningful segments.
9 ”Global HR Analytics Market Size is Expected to Grow from USD 1.9 Billion in 2019 to USD 3.6 Billion by 2024, at a CAGR of 13.7%,“ Cision, PR Newswire, June 2019
10 “Workforce Analytics Market 2019-2023: Key Findings, Global Trends, Regional Study, Industry Growth, Top Key Players Profiles and Future Prospects,” Reuters Plus, August 2019.
11 For example, one idea was to classify vendors by the type of talent activity they typically supported – but while that worked for some vendors, it didn’t work for all because many of the vendors’ capabilities stretched across many talent activities. Another idea was to look at the level of complexity of analysis, but we found that inadequate as many vendors offer a range of complex analyses. Further, there could be other types of complexity, such as data integration from multiple systems or complex global data sets, which has little to do with analysis complexity.
We estimate the current people analytics market to be $1.7 billion.

RedThread Research © 2019 People Analytics Technology: The Market | 16
Figure 4: People Analytics Technology Market Solution Matrix – Simplified
Data Aggregator
Data Creator
FrequentAnalysis
Continuous Analysis
Source: RedThread Research, 2019.
Let’s examine this matrix in more detail, starting with the X axis (see Figure 5). Moving from left to right, we range from solutions that users tend to use/access on a frequent basis (e.g., quarterly, monthly, or bi-monthly) to solutions that are used on a continuous/always-on basis (e.g., weekly, bi-weekly, or daily). Please note, we are specifically thinking about how frequently users tend to use the tool, not the frequency with which the tool is updated or can give insights.
We focused on user frequency because it allows us to understand, from a practitioner’s perspective, how frequently a solution tends to be used – which can help us understand how and by whom it is used. For example, the tools on the left side of the model tend to be used to consistently check-in on specific areas of interest and
We focused on user frequency because it allows us to understand, from a practitioner’s perspective, how frequently a solution tends to be used – which can help us understand how and by whom it is used.

RedThread Research © 2019 People Analytics Technology: The Market | 17
are leveraged by HR, people analytics, and other business leaders looking to make strategic talent decisions.
As we move to the right, we see tools that are both trying to provide analysis for strategic organizational decision-making and inform users about themselves or their team. Many of these solutions’ typical primary users are people analytics or HR, but they have expanded or are in the process of expanding their users to senior leaders, managers, and employees.
On the far right side of the graphic are solutions that tend to be used more continuously, which lend themselves to more operational (non-strategic) adjustments and alerting individuals about their or their teams’ behavior. Obviously, when this type of data is pulled together and analyzed longitudinally, it could inform strategic decision-making as well. These vendors tend to focus much more on providing greater accessibility to data and sharing insights directly with employees in the form of nudges, individual reports and dashboards, and notifications.
Figure 5: Details of X Axis—People Analytics Technology Market Solution Matrix
FrequentAnalysis
Continuous Analysis
Users tend to use / access the solution frequently (quarterly,
monthly, or bi-monthly)
Users tend to use / accessthe solution continuously / always
on (weekly, bi-weekly, daily)
Strategic organizational
decisions
Strategic organizational
decisions
Informing individuals about
self / teams
Primaryuse
Secondaryuse
Informing individuals about self / teams
Strategic organizational
decisions
Source: RedThread Research, 2019.
RedThread Research © 2019 People Analytics Technology: The Market | 18
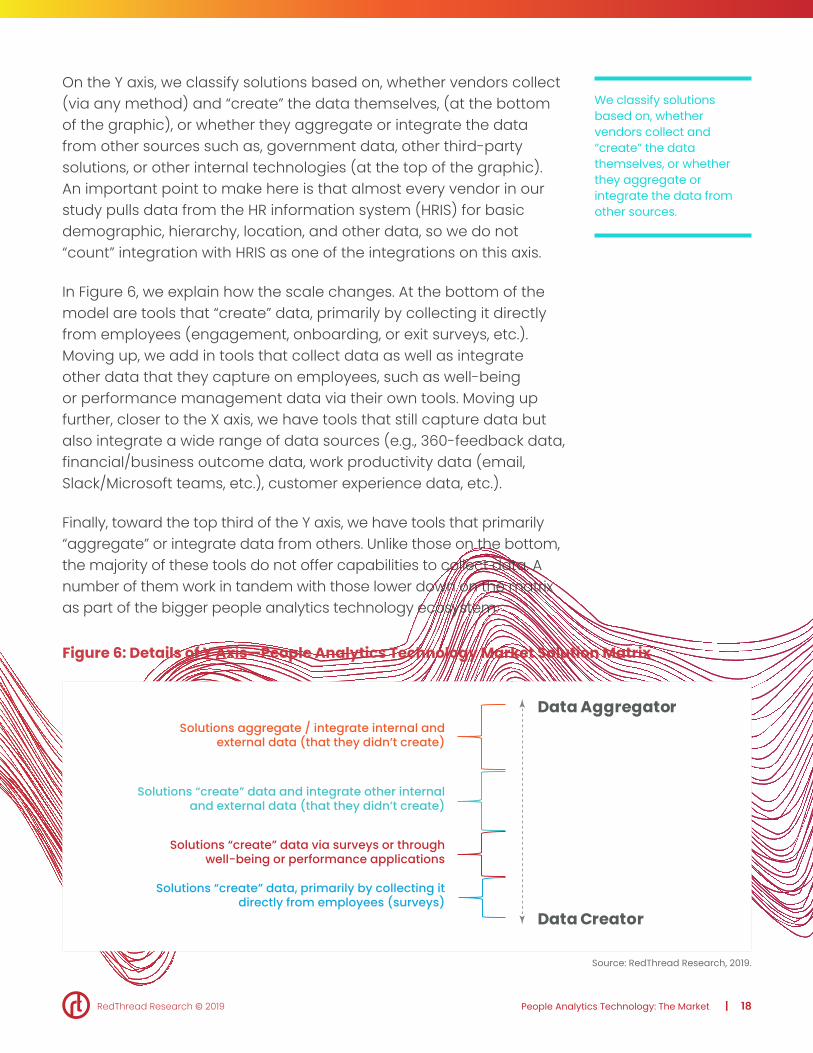
On the Y axis, we classify solutions based on, whether vendors collect (via any method) and “create” the data themselves, (at the bottom of the graphic), or whether they aggregate or integrate the data from other sources such as, government data, other third-party solutions, or other internal technologies (at the top of the graphic). An important point to make here is that almost every vendor in our study pulls data from the HR information system (HRIS) for basic demographic, hierarchy, location, and other data, so we do not “count” integration with HRIS as one of the integrations on this axis.
In Figure 6, we explain how the scale changes. At the bottom of the model are tools that “create” data, primarily by collecting it directly from employees (engagement, onboarding, or exit surveys, etc.). Moving up, we add in tools that collect data as well as integrate other data that they capture on employees, such as well-being or performance management data via their own tools. Moving up further, closer to the X axis, we have tools that still capture data but also integrate a wide range of data sources (e.g., 360-feedback data, financial/business outcome data, work productivity data (email, Slack/Microsoft teams, etc.), customer experience data, etc.).
Finally, toward the top third of the Y axis, we have tools that primarily “aggregate” or integrate data from others. Unlike those on the bottom, the majority of these tools do not offer capabilities to collect data. A number of them work in tandem with those lower down on the matrix as part of the bigger people analytics technology ecosystem.
Figure 6: Details of Y Axis—People Analytics Technology Market Solution Matrix
Data Aggregator
Data Creator
Solutions “create” data and integrate other internaland external data (that they didn’t create)
Solutions “create” data, primarily by collecting itdirectly from employees (surveys)
Solutions “create” data via surveys or throughwell-being or performance applications
Solutions aggregate / integrate internal andexternal data (that they didn’t create)
Source: RedThread Research, 2019.
We classify solutions based on, whether vendors collect and “create” the data themselves, or whether they aggregate or integrate the data from other sources.

RedThread Research © 2019 People Analytics Technology: The Market | 19
When we put all of this together, we end up with Figure 7.
Figure 7: People Analytics Technology Market Classification Matrix
Data Aggregator
Data Creator
FrequentAnalysis
Continuous Analysis
Guiding Analytics
Snapshot Analytics
Targeted Analytics
Accumulated Analytics
Data aggregated from multiplesystems (e.g., workforce,learning, external data),
analyzed frequently
Data aggregated from multiplesystems (e.g., cross-functional,employee life-cycle/experience
data), analyzed continuously
Data gathered from one or more primary sources
(e.g., employee perspective data),analyzed frequently
Data gathered from one or more primary sources (e.g., employee
engagement or experience, diversity & inclusion, or well-being
data), analyzed continuously
Source: RedThread Research, 2019.
The characteristics of each quadrant include the following:
• Accumulated Analytics: Vendors in this quadrant rank high in their ability to provide users with a longitudinal view of data with insights that enable strategic talent decisions. Data tends to be aggregated and integrated from several sources, including external data sources. The insights from these vendors can be used by teams on a frequent basis to track specific areas of interest.
• Snapshot Analytics: Vendors in this quadrant are data collectors and provide insights that are reviewed for strategic talent decisions on an event-driven basis. The vendors are primarily
It’s important to note that none of these quadrants is superior to the others – they are all part of the people analytics tech ecosystem.

RedThread Research © 2019 People Analytics Technology: The Market | 20
focused on active data collection, though they may also have some newly-introduced data integration capabilities.
• Targeted Analytics: This quadrant includes vendors who are focused on a specific talent area (e.g., engagement/experience, performance management, wellness). They collect data directly from the employees, which can allow for quicker deployment and adoption, and have their insights and analysis accessed by multiple teams on a very frequent or continuous basis. Several of them push insights directly to employees for faster action-taking.
• Guiding Analytics: This quadrant includes solutions that integrate data from several different sources and are used very frequently to continuously. The combination of these elements means that users can frequently access deep and broad information that can guide strategic organizational decisions, operational decisions, and individuals’ decisions about themselves or their team. Our mental model for solutions in this section is like a guided missile – they can give insights that can change trajectory quickly.
It’s important to note that none of these quadrants is superior to the others. In fact, there is likely a place for all of them in an organization’s people analytics technology ecosystem. However, by putting technologies into these boxes, we can start to think about what that ecosystem might look like and how organizations might begin to build them.
Now that we have provided a classification of the market, we turn to our findings from the survey results which we discuss in detail in the sections below.
How Vendors are Helping Customers
Let’s move on to discussing how people analytics technology vendors are helping organizations. Our data shows us that the primary reasons customers buy people analytics technologies are the following:
• Answer specific talent questions (e.g., about employee engagement, performance, or productivity)
• Augment technological capabilities (e.g., make disparate data available and provide predictive insights)
By putting technologies into these boxes, we can start to think about what a people analytics technology ecosystem might look like and how organizations might begin to build it.
More than 75% of vendors indicated that they have an impact on efficiency and 54% indicated that they impact collaboration.

RedThread Research © 2019 People Analytics Technology: The Market | 21
People analytics practitioners told us they turn to vendors so they can do their work more efficiently or scale people data more broadly across the organization. This was reinforced by vendors: more than 75% of them indicated that they have an impact on efficiency and 54% indicated that they impact collaboration (See Figure 8). Our conversations with customers indicate that much of the innovation (the third business outcome) results from vendors bringing updated people analytics technical capabilities to organizations that had little to no people analytics capabilities in the past.
Figure 8: People Analytics Technology’s Impact on Business Outcomes
26%
34%
53%
54%
78%
Sales improvement
Margin improvement
Innovation
Collaboration
Efficiency
Note: The data reflects the percentage of vendors who responded that they influenced these outcomes to a “significant” or “very great” extent.
Source: RedThread Research, 2019.
We also asked vendors about the talent outcomes they are able to impact (see Figure 9), and we see an interesting trend – which we expand upon more in the next section – where vendors indicate they are most able to influence employee engagement, retention, and D&I – and that they are less involved in talent acquisition.
Vendors indicate they are most able to influence employee engagement, performance, and D&I – and that they are less involved in talent acquisition.

RedThread Research © 2019 People Analytics Technology: The Market | 22
Figure 9: People Analytics Technology’s Impact on Talent Outcomes
38%Recruiting efficiency
38%Quality of hire
43%Learning
44%Career development
62%Employee experience
63%Other
68%Employee efficiency
77%Performance / productivity
79%Diversity, inclusion & belonging
82%Retention
82%Employee engagement
n= 37
Note: The data reflects the percentage of vendors who responded that they influenced these outcomes to a “significant” or “very great” extent.
Source: RedThread Research, 2019.
When we turn to HR outcomes, we see that much of the impact from people analytics technology comes from better insights (94%), greater confidence in data (86%), and improved reporting quality (86%) (Figure 10).

RedThread Research © 2019 People Analytics Technology: The Market | 23
Figure 10: People Analytics Technology’s Impact on HR Outcomes
65%
68%
82%
86%
86%
94%
Improved HR / talent management / talentacquisition process efficiency
Improved employee / manager user experience
Improved experience for HR professionals
Improved reporting quality
More confident strategic planningdecisions with data-based insights
Improved insights into thecurrent workforce
n= 37
Note: The data reflects the percentage of vendors who responded that they influenced these outcomes to a “significant” or “very great” extent.
Source: RedThread Research, 2019.
Talent Management Areas of Focus
One of the major differences between people analytics technologies and other types of technologies is that the technology does not neatly align to one area of HR such as performance management or talent acquisition. Instead, all data is data and can be used across different talent processes. Therefore, generally speaking, it doesn’t make much sense to talk about a “performance management people analytics vendor” or a “talent acquisition people analytics vendor.”
That said, we still tried to get a sense for how customers are using people analytics vendors across different talent activities. As you can see from Figure 11 vendors are focused on a range of talent activities. Employee engagement was the topic most focused on in our data set, with employee experience (related but different) coming in third place. The second most common focus was diversity and inclusion, reflecting the recent intense interest in this space, post #MeToo and other movements.12
12 “Diversity and Inclusion Technology: The Rise of a Transformative Market,” Garr, Stacia Sherman, and Jackson, Carole, RedThread Research in partnership with Mercer, February 2019
Vendors are most focused on employee engagement, with employee experience (related but different) coming in third place. The second most common focus was diversity and inclusion.

RedThread Research © 2019 People Analytics Technology: The Market | 24
Figure 11: Talent Areas of Focus for People Analytics Vendors
5%Labor market analysis
11%Employment branding
16%Sourcing
19%Selection
22%Recognition
24%Onboarding
24%HIPO selection
24%Compensation / benefits
30%Career management
30%Talent mobility
35%Employee communications
38%Learning & development
38%Employee voice
38%Employee well-being
41%Leadership development
41%Performance management
43%Employee experience
54%Diversity and inclusion
60%Employee engagement
n= 37
Note: The data reflects the percentage of vendors who responded that their customers do analysis on this type of data to a “very great” extent.
Source: RedThread Research, 2019.

RedThread Research © 2019 People Analytics Technology: The Market | 25
Interestingly, nearly all the external talent acquisition activities are near the bottom of this list. Our hypothesis is that this is due to the silos of talent acquisition and talent management/development remaining strong, and much of the talent acquisition analysis taking place within systems that are not connected to those in our survey population. That said, we have not heard of a single people analytics technology that effectively integrates only talent acquisition data (including sourcing, selection, and – potentially – labor market data) into one place. This leaves us to conclude that there is a real area of opportunity for systems to create more holistic insight into what’s happening in talent acquisition and – critically – to connect that information to what we see happening with people once they join an organization.
The information above is even more interesting when we put it in context with the data sources people analytics technologies use to provide their insights. In Figure 12, we share the most common data sources today and how vendors expect this to change in three years.
Figure 12: Data Sources for People Analytics Technologies
n= 37
89
76
56
50
33
33
32
27
24
24
19
14
65
68
78
76
70
68
68
51
51
25
57
46
HRIS / core HR systems
Employee / candidate surveys*
Talent management tech
Learning tech
Talent acquisition tech
Compensation tech
Work productivity tech*
Recognition tech*
Financial tech
Other
Sales / CRM*
External labor market
Current data source Future data source
Note: The data reflects the percentage of vendors who responded that they use this type of data to a “very great” extent.
* Data sources from employees Source: RedThread Research, 2019.
HRIS is the most common source of data used by people analytics technology vendors to drive their insights.

RedThread Research © 2019 People Analytics Technology: The Market | 26
HRIS is the most common source of data used by people analytics technology vendors to drive their insights. This finding was unsurprising, since the HRIS is the common system of record that holds basic information about all employees, including information critical to detailed analyses such as title, department, location, pay, basic demographic information, etc. After that, vendors use surveys such as employee engagement/experience surveys. Then we get into a number of HR systems such as talent management technology (e.g., performance or succession management), learning technology (e.g., learning management systems), and then talent acquisition technology (e.g, applicant tracking systems).
There are several interesting insights from this data. First is the fact that the non-HR data sources are so low on the list. Work productivity technology – which includes email, calendars, Slack/Microsoft Teams, and other technology people use to get work done – is the most used data source (32%) outside of HR technology. This situation likely speaks to HR’s challenges in getting access to data outside its own function as well as a potential lack of imagination in terms of what could be learned from other data sources, which includes external data sources such as external labor market data and data from social channels.
External labor market data is the lowest in the list (14%) reflecting that very few vendors are leveraging external data, which when integrated with internal data, could lead to greater and better insights. Thankfully, we see a significant growth in the number of vendors (46%) who foresee using it more frequently in the future.
This brings us to our second point: the vast majority of these data sources are using data about employees, not data from employees (which we have indicated with an asterisk). We can likely gain more insights if we combine both of these data sources into our analyses. Right now, the general bias is to use data about employees and not much from employees – and we encourage vendors and practitioners to shift their approach.
We also asked vendors how frequently they thought these data sources would be used three years from now (right side of Figure 12), and we see that, in addition to using HR technology more, they also plan to use some of these data sources from employees more. We would encourage even more vendors to make this shift.
Work productivity technology – which includes email, calendars, Slack/Microsoft Teams, and other technology people use to get work done – is the most used data source (32%) outside of HR technology.
Right now, the general bias is to use data about employees and not much from employees.

RedThread Research © 2019 People Analytics Technology: The Market | 27
Challenges in the Market
While there is clearly a lot of growth in the market, there are challenges that both vendors and practitioners face when it comes to implementing, adopting, and using people analytics technology. In this section, we cover what vendors told us, what we observed based on the briefings and demos we received from vendors, and the interviews we conducted with practitioners.
In our survey, we asked vendors to identify the top three barriers to implementation for their average customers. Unlike in some of the questions we discuss later in this section, we allowed them to write in the barriers they face. We conducted a qualitative analysis to identify the major themes and grouped the barriers together under those themes. We did this because we think it is important to highlight the nuances that vendors wanted to share. The results of this analysis are in Figure 13.
Figure 13: Barriers to Implementation of PA Technology
16%
16%
15%
10%
9%
7%
6%
6%
Security, legal, privacy, and risk
Data access/integration from multiple systems
Data quality and integrity
Existing culture
Resources and partnership w/other functions
Clarity of strategy, project, and communication
Competing priorities
Budgets
n= 67
Source: RedThread Research, 2019.

RedThread Research © 2019 People Analytics Technology: The Market | 28
Let’s spend some time on the top barrier, security, legal, privacy, and risk, by analyzing it in two groups:
• Security and legal concerns – This category includes the challenges around data security, levels of access to data, and compliance with laws such as the General Data Protection Regulation (GDPR). While there are certainly very real challenges around complying with these various policies and laws, all enterprise-ready vendors are able to handle them. The difficulty comes in doing this in an efficient, quick, and (relatively) pain-free manner. Nearly every vendor we talked to indicated that they can respond quickly to customers’ information security questions and requirements, but the process of working through those requirements with customers’ teams and getting everyone comfortable can be time consuming. That said, customers shared that they felt there surely must be more that vendors can do to make the process simpler (but exactly what, they struggled to identify).
• Privacy and risk – We think there is a clear opportunity for vendors to improve in this category. As we all know, there is a keen societal concern about the extent to which organizations are “spying” on employees through new people analytics technology (when the Wall Street Journal13 writes an article on the topic, you know it’s not a niche thing anymore). Employees are concerned about their own privacy and what is being done with their data. Further, employers, thinking beyond legal risk, are worried about the reputational risk of what others might think about how data is being used in their organization.
Turning first to employees, most vendors offer the capability for employees to see the information collected on them and to opt-in or-out of data collection (Figure 14). Much more concerning, though, is that 50% or fewer vendors allow employees to access insights on themselves, correct data, or understand how their data is analyzed. At a minimum, this can result in a lack of trust by employees. Further, it can also represent a real missed opportunity. A recent study showed that organizations that provide employees with some
13 “Why Companies Are Failing at Reskilling,“ Lauren Weber, Wall Street Journal, April 19, 2019.
50% or fewer vendors allow employees to access insights on themselves, correct data, or understand how their data is analyzed.

RedThread Research © 2019 People Analytics Technology: The Market | 29
benefits from the data collected on them are much more accepting of that data being collected.14
Figure 14: Availability of Features to Give Employees More Control Over their Data at Work
41%
50%
50%
68%
71%
74%
Alert employees to the types of analysesbeing run on data about them
Allow employees to correct databeing collected on them
Provide employees with accessto insights about them
Allow employees to opt-in todata collection
Allow employees to opt-out ofdata collection
Allow employees to see all of theinformation collected on them
n= 37
Source: RedThread Research, 2019.
This situation provides an opportunity for vendors to lead – yet most of them don’t seem prepared to do so. We asked vendors what they saw as their role in data ethics, privacy, and ownership (see Figure 15). Thankfully, only 3% of vendors indicated they have no role. However, a majority (55%) of vendors indicated their role is limited, implying that others are primarily responsible for establishing data ethics, privacy, and ownership norms.
Approximately one-third (31%) of vendors saw themselves as having an opportunity to take a lead on this topic, indicating their role is to design a system that protects employees as well as educates HR and other leaders. We believe that these vendors have a chance to differentiate themselves and to teach the market how to think about this critical, hot-button topic. Whenever a vendor gets to influence or craft new market norms, they are more likely to win. Therefore,
14 “How Companies Can Use Employee Data Responsibly,” Shook, E., Sage-Gavin, E., Cantrell, S.; Harvard Business Review, February 2019

RedThread Research © 2019 People Analytics Technology: The Market | 30
we think this issue of people ethics and data represents a real opportunity – one with no clear leader yet.
Figure 15: Vendors’ Perceptions of their Role in Data Ethics, Privacy, and Ownership
We have no role
3%
We have a role in designing systemsthat enable customers to manage data ethically
33% Our role is to create a technology system that protects individual employees, withinlimits, from corporate over-reach
22%
Our role is to design a system that protects employees as well as educates HR and other leaders31%
Other
11%
n= 37
Source: RedThread Research, 2019.
Let’s move on from implementation to adoption of new people analytics technologies within organizations. We asked vendors about the barriers they face that prevent broader adoption of their solutions for both their “average” customers and their most “challenging” or resistant customers (Figure 16). While it is not surprising that the lack of a culture that embraces data was the top barrier to adoption across both customer types, it is astounding how much more of a barrier to adoption this represented in the “challenging” organizations. This barrier was selected more than twice as often as any of the other barriers, underscoring the oft-stated point that if an organization’s culture is unwilling to embrace data, simply implementing a new tool is not going to make the situation better.

RedThread Research © 2019 People Analytics Technology: The Market | 31
Figure 16: Barriers to Adoption, “Challenging” vs. “Average” Customers
79%
0%
0%
0%
3%
6%
6%
8%
11%
14%
14%
17%
19%
33%79%
9%
6%
3%
9%
15%
12%
12%
15%
32%
32%
32%
33%
Lengthy implementation process
Additional pricing for additionaldata sources
Lack of necessary customersupport
Analysis capabilities toosimple
Complex user interface
Lack of a robust usercommunity
Per-seat price for yoursolution
Inadequate learningresources
Learning curve too steep
Lack of perceived value
Data integration too difficult
Analysis capabilities toocomplex
Culture that failsto embrace data
Challenging Customers Average Customers
n= 37
Note: The data shown are for responses of “to a moderate,” “significant,” and “very significant” extent (the top three options on a five-point scale). We chose the top three options – versus the top two, which is a more standard practice – because the respondents have an incentive to under-report negative information (and “barriers to implementation” could be construed as negative), and we saw this negative bias in the data. To better capture what we believed to be the real challenges, we included the “moderate extent” response in these calculations.
Source: RedThread Research, 2019.

RedThread Research © 2019 People Analytics Technology: The Market | 32
Another interesting insight from this chart is the contrast between the barriers of “analysis capabilities are too complex” (33% and 19% for challenging and average customers, respectively) and “analysis capabilities are too simple” (9% and 3%, respectively). This dichotomy – where the tools, by and large, are too complex for most users, but not complex enough for a few – is reflective of the fundamental challenge vendors experience in creating effective product/market fit.
We believe this is mainly because as people analytics technology has become more accessible, available, and desired by functions across organizations, there is no one primary user of it. The technology and solutions were, in many instances, built to simplify and scale capabilities that organizations usually found difficult to build in-house. The challenge arose when people analytics practitioners tried to scale these solutions across their organizations so other leaders such as HR business partners, C-suite leaders, and managers could use them as self-service tools. Unfortunately, many of those users found the capabilities too complex for their comparatively lower analytics skills.
This resulted in a number of vendors trying to cater to those less-sophisticated users by building solutions that included analyses simple enough for novices, which wasn't necessarily what people analytics leaders needed. Hence, we now have a situation where a lot of vendors recognize that their systems are too complex in many instances and not complex enough in some others.
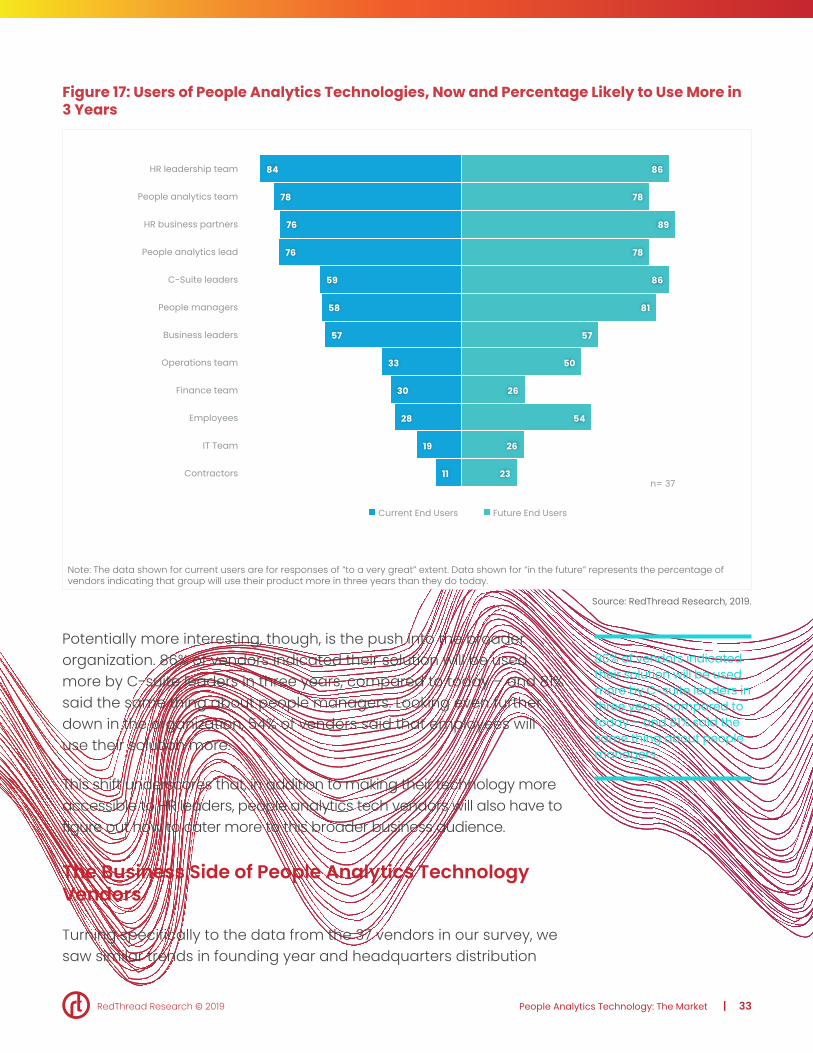
This duality is well-represented when we look at the primary users of the people analytics technology – both now and in the future. As you can see in Figure 17, most of the survey respondents list the HR leadership team and the people analytics team as their current primary users. Looking to the future, more than 85% of survey respondents indicate they believe HR Business Partners (HRBPs) and HR leadership teams will use their solution more frequently in three years compared to now. This is indictive of the trend we mentioned above, of trying to use people analytics technologies to scale across organizations.
Most vendors list the HR leadership team and the people analytics team as their current primary users. More than 85% of vendors indicate they believe HR Business Partners (HRBPs) and HR leadership teams will use their solution more frequently in three years.
RedThread Research © 2019 People Analytics Technology: The Market | 33
Figure 17: Users of People Analytics Technologies, Now and Percentage Likely to Use More in 3 Years
84
78
76
76
59
58
57
33
30
28
19
11
86
78
89
78
86
81
57
50
26
54
26
23
HR leadership team
People analytics team
HR business partners
People analytics lead
C-Suite leaders
People managers
Business leaders
Operations team
Finance team
Employees
IT Team
Contractors
Current End Users Future End Users
n= 37
Note: The data shown for current users are for responses of “to a very great” extent. Data shown for “in the future” represents the percentage of vendors indicating that group will use their product more in three years than they do today.
Source: RedThread Research, 2019.
Potentially more interesting, though, is the push into the broader organization. 86% of vendors indicated their solution will be used more by C-suite leaders in three years, compared to today – and 81% said the same thing about people managers. Looking even further down in the organization, 54% of vendors said that employees will use their solution more.
This shift underscores that, in addition to making their technology more accessible to HR leaders, people analytics tech vendors will also have to figure out how to cater more to this broader business audience.
The Business Side of People Analytics Technology Vendors
Turning specifically to the data from the 37 vendors in our survey, we saw similar trends in founding year and headquarters distribution
86% of vendors indicated their solution will be used more by C-suite leaders in three years, compared to today – and 81% said the same thing about people managers.

RedThread Research © 2019 People Analytics Technology: The Market | 34
(see Appendix for exact figures). More importantly, though, we gained a much better understanding of the customer growth rate, revenue growth rate, and details on customer profiles for these vendors.
Let’s start with customers. We asked vendors two questions:
• How many customers did you have in 2016, 2017, and 2018?
• How many of the customers in 2016, 2017, and 2018 were new customers?
We then analyzed this data to understand the year-over-year growth rate of customers. We can see in Figure 18 that from 2016 to 2017, vendors experienced reasonably strong growth (16%), but truly outstanding growth (60%) from 2017 to 2018. To smooth out this variation, it is useful to look at the compound annual growth rate for the 2016 to 2018 period, which is a healthy 23%.
As we look to what we can expect from 2019, our briefings with vendors make us optimistic: they told us they expect 2019 to be an even better year than 2018, indicating a very strong market indeed.
Figure 18: Overall Customer Growth Rate for People Analytics Tech Market
2016n=23
2017n=28
2018n=31
16%
60%
Source: RedThread Research, 2019.
The compound annual growth rate for the 2016 to 2018 period is 23%.

RedThread Research © 2019 People Analytics Technology: The Market | 35
Where it gets interesting, though, is when we looked at how overall growth compared to new customer growth and specifically, at how many new customers vendors had to acquire to grow or at least maintain their overall customer counts.
Between 2016 and 2017, our analysis shows that vendors had a new customer growth rate of 36%, which is quite a bit higher than the overall customer growth rate of 16%. This indicates that a certain percentage of old customers left vendors who then replaced them with a larger percentage of new customers. This customer turnover suggests that there was still a meaningful search for product/market fit at this time. However, between 2017 and 2018, the new customer growth rate was almost exactly equal to the overall customer growth rate (61% vs. 60%, respectively). This indicates that vendors were able to effectively retain customers and add to their customer counts. This could be a reflection of customer satisfaction with the product received, given that far fewer of them left their vendors.
When we turn to revenue growth rates, we see a similar story as that shown in the customer growth rate data. Figure 19 shows that the revenue growth rate (the total amount of revenue brought in by vendors in the space) for 2016 to 2017 was a very healthy 80%. However, from 2017 to 2018, it shot up a significant amount – to a staggering 420%. The compound annual growth rate (CAGR) for the market was 211%. This CAGR is significantly larger than the figure reported by other research organizations and may be reflective of the larger number of relatively young organizations in our data set.
In our conversations with vendors, this substantial increase was attributed to the following reasons:
• Shifting from free or nearly-free beta customers to fully paying customers
• Expanding from pilots within existing customers to a broader swath of the organization
• Significant vendor investments in sales and marketing organizations that resulted in new customers
• Greater appetite from organizations to purchase a people analytics solution
The compound annual growth rate (CAGR) for the market was 211% between 2016-2018.

RedThread Research © 2019 People Analytics Technology: The Market | 36
Figure 19: Revenue Growth Rate for People Analytics Technology Market
2016n=18
2017n=21
2018n=29
420%
80%
Source: RedThread Research, 2019.
Finally, we asked vendors to tell us about who was buying their solutions. In Figure 20, we have identified, overall, the top customer industries reported by vendors. As you can see, the industries purchasing people analytics technologies tend to be those with a heavy focus on knowledge workers (where they face stiff competition for talent) and are required to meet industry standards such as in finance/banking/insurance, and healthcare. The largest industry is, in fact, the finance/banking/insurance industry: 54% of vendors report that industry as being one of their top three.
The largest industry is the finance/banking/insurance industry: 54% of vendors report that industry as being one of their top three.

RedThread Research © 2019 People Analytics Technology: The Market | 37
Figure 20: Top Customer Industries, as Reported by PAT Vendors (select top three)
Financial/Banking/Insurance
Technology
Healthcare
Professional Services
Pharma/Chemical/Life Sci.
n= 108
54%
49%
43%
38%
22%
Note: Each of the 37 vendors could select their three top customer industries. Results displayed show the percentage that selected that industry as a top three. The “n” is the number of industries selected.
Source: RedThread Research, 2019.
Pleasantly surprising, though, was the finding that it is not just the big players who are adopting people analytics solutions. Figure 21 shows the average, across all vendors, of different customers’ organization sizes. As you can see, smaller organizations are, on average, buying analytics technologies just as much as the ones with a large number of employees. For example, vendors reported that 18% of their customers are organizations with fewer than 100 employees, but they also reported that 26% of their customers have 50,0001 employees or more.
Vendors reported that while 18% of their customers are organizations with fewer than 100 employees, 26% of their customers have 50,0001 employees or more.

RedThread Research © 2019 People Analytics Technology: The Market | 38
Figure 21: Average Customer Size, as Reported by PAT Vendors
n= 37
18%
16%
16%
28%
24%
19%
26%
Below 100 employees
100-500 employees
501-1,000 employees
1,001-10,000 employees
10,001-25,000 employees
25,001-50,000 employees
50,001 employees or more
Note: Each of the 37 vendors identified the percentage of customers in each industry size. We averaged these to get to the numbers shown. While each vendor’s individual total equaled 100%, the averages of all vendors for each customer size do not add up to 100%.
Source: RedThread Research, 2019.

RedThread Research © 2019 People Analytics Technology: The Market | 39
Conclusion
As we mentioned in the introduction, this is the first part of our study on the state of people analytics technology. The purpose of this section was to share our thinking and understanding of the market and the crucial findings from our survey. With the help of the model that we introduced above, we hope to lay the foundations for a) how practitioners understand the capabilities offered by the vendors, and b) how vendors differentiate themselves when they go to market. As the market matures and expands, we think, nay expect, our approach to also evolve which will be reflected in future iterations of our model.
The second part of the study focuses on and provide deeper insights on the market differentiators for the vendors. We also provide a comprehensive categorization of the vendors that participated in our study, along with a brief description for every vendor, a screenshot of their technology, and a short case study (if provided by the vendor).
RedThread Research © 2019 People Analytics Technology: The Market | 40
Appendices
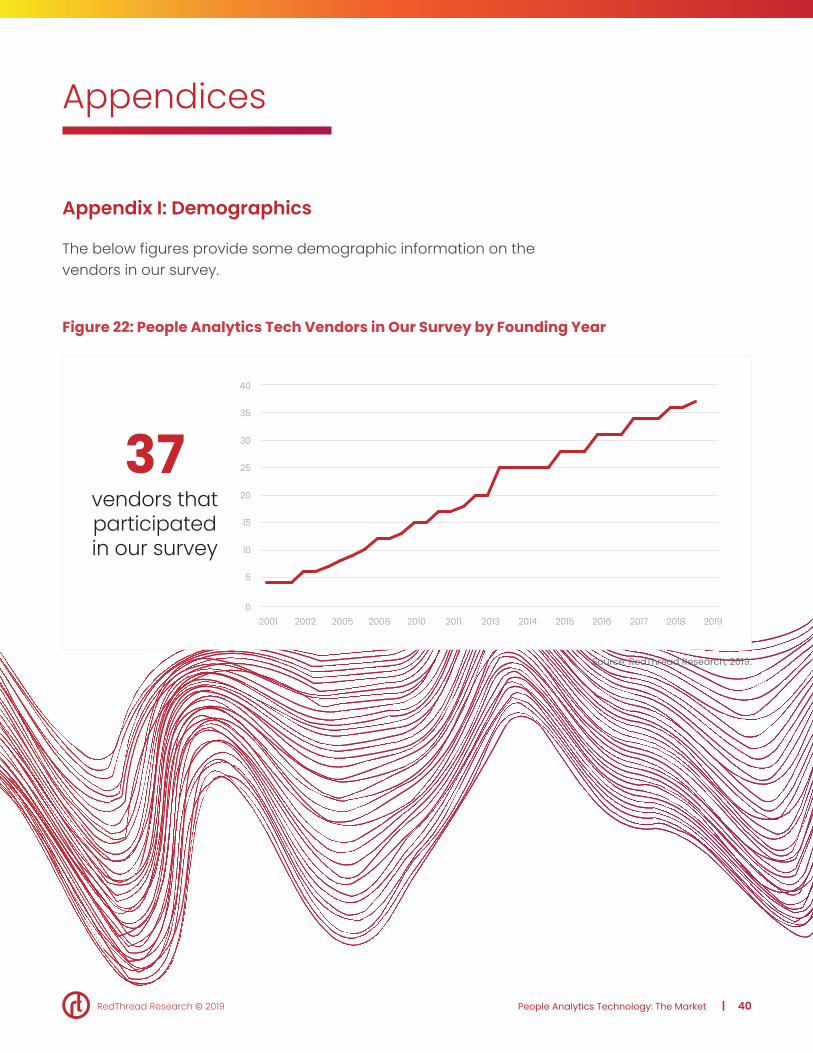
Appendix I: Demographics
The below figures provide some demographic information on the vendors in our survey.
Figure 22: People Analytics Tech Vendors in Our Survey by Founding Year
200520022001 2008 2010 2011 2013 2014 2015 2016 2017 2018 20190
5
10
15
20
25
30
35
40
Growth in vendor space
37vendors thatparticipatedin our survey
Source: RedThread Research, 2019.

RedThread Research © 2019 People Analytics Technology: The Market | 41
Figure 23: People Analytics Tech Vendors in Our Survey by Headquarters Location
North America
Europe
Asia Pacific
70%
22%
8%
n=37
Source: RedThread Research, 2019.
Appendix II: Research Methodology
This report is a culmination of 10 months of qualitative and quantitative research that summarizes our findings on the state of the people analytics technology market. The research includes a round of interviews with practitioners as well an online poll and a roundtable to understand the challenges, concerns, and what they want to know most about the market. This was followed by a vendor survey which was completed by 37 people analytics vendors. We also conducted briefings with those vendors that participated in the survey which included a demo of the solutions. Based on our findings from the survey results, briefings, and publicly available information we created a model in order to provide a better understanding of the market.
We collected all of this information from February to November 2019.

RedThread Research © 2019 People Analytics Technology: The Market | 42
About the Authors
Stacia Sherman Garr, Co-founder & Principal Analyst
Stacia is a researcher and thought leader on talent management, leadership, D&I, people analytics, and HR technology. A frequent speaker and writer, her work has been featured in Fortune, Forbes, The New York Times, and The Wall Street Journal as well as in numerous HR trade publications. Stacia co-founded RedThread Research in 2018, after leading talent and workforce research for eight years at Bersin by Deloitte. Before Bersin, Stacia spent approximately five years conducting research and creating learning content for the Corporate Leadership Council, part of CEB/Gartner. She has an MBA from the University of California, Berkeley, and a master’s degree from the London School of Economics.
Priyanka Mehrotra, Research Lead
Priyanka Mehrotra is a Research Lead at RedThread Research. Before joining the company in 2018, she was part of the research team at Bersin by Deloitte where she worked on talent management, leadership, and people analytics as well as conducted research and contributed content for Bersin’s Mid-market study. Prior to Bersin by Deloitte, Priyanka worked at several non-profits, think-tanks, and international organizations where she published and co-authored several articles and conducted research on international relations, conflict, and development.