USD 253 Emporia - Kansas State Department of Educationksde.org/Portals/0/School...
40
USD 253 Emporia
Transcript of USD 253 Emporia - Kansas State Department of Educationksde.org/Portals/0/School...

USD 253 Emporia

i
• Budget General Information (characteristics of district)
• Supplemental Information for Tables in Summary of Expenditures
• KSDE Website Information Available
• Summary of Expenditures (Sumexpen.xlsx)

1
2014-15 Budget General Information USD #: 253
Introduction
Superintendent's Message: New Budget Will Support District Mission
July 1, 2014
Superintendent Theresa Davidson
I would like to share with readers some proud moments from the past school year. My goal is to highlight the critical importance of our work in preparing students for college and career ambitions and to recognize teachers and support staff for their hard work in living this mission each day.
Preparing students for tomorrow's opportunities is the essence of why our schools exist and the cornerstone for our budget planning this month.
We put great emphasis on making data-driven decisions, especially in recent years. Indeed, we must be efficient with dollars and time and precise in the delivery of instruction more than at any time in history. Our budget for the new school year will strive to provide for long-overdue materials and resources for mathematics from kindergarten through Algebra and secondary English Language Arts.
Updated textbooks, curriculum and assessments alone will not guarantee the goal of preparing college- and career-ready graduates, although these pieces certainly contribute. School systems are people-driven. Nearly 84 percent of our annual operating budget is related to personnel in some way.
Salary increases are one way we recognize teachers and support staff for hard work and success and help us to retain good people. School employees have, as many Kansas families, lived the burden of the recent economic challenge in our state. For three years, salaries for Emporia Public School employees were frozen. None of our staff received cost-of-living adjustments and salary schedule advancements for years of service. A year ago, the district sacrificed other needs to restore the delayed experience increments to the salary schedules. However, funds were not available to improve our base teacher salary and benefits, which last year, ranked 111th among the 286 Kansas districts.

2
In a people-focused organization, it is also important to attract and retain high-quality teachers, administrators and support staff. Kansas ranks 17th in the nation in eighth grade reading proficiency and 10th in eighth grade math proficiency (on the National Assessment of Educational Progress). Yet, the state ranks only 42nd among the 50 states in terms of salaries. A priority in our 2014-15 budget is a 2.24 percent salary and benefits package for all employee groups.
In addition, we believe that our students’ school experience must anticipate the digital work environments of tomorrow. We hope to continue the plan to integrate more technology devices into our children's education.
Providing a world-ready education in the 21st century requires us to address aging facilities and equipment that served us well in a 20th century mission. The cost of repairs to roofs and mechanical systems can be much greater if delayed too long. Moreover, the cost of improvements to instructional equipment and resources can make the difference for today’s learners. We believe our proposed budget reflects what we value: our students and the staff members whose passion and commitment prepares them for college and careers. At the next board of education meeting, July 9, we will present a preliminary budget for the board's consideration. A study session to learn about the budget in more detail is scheduled at 6 pm. July 23. The public hearing on the budget is scheduled for Aug. 13. These meetings will be conducted at Mary Herbert Education Center and will provide opportunities for interested community members to learn and provide input for allocating funds next year.
School finance legislation has provided challenges for our district in recent years. But the equalization measures resulting from the Supreme Court case has brought a mixed bag of reduced funding for at risk youth and measurable restoration in terms of equalization funding. It is our hope that the new budget can capitalize on the state and local recognition of challenges related to language and socio-economic struggle and that future economic policy will support our mission to prepare all students for tomorrow's opportunities.
Board Members
Susan Brinkman, 1768 Trowman Way, Emporia, KS 66801, 620 342-2204 [email protected] Michael Crouch, 1908 Flint Road, Emporia, KS 66801, 620 342-8006 [email protected] Doug Epp, 1474 Road E, Emporia, KS 66801, 620 342-2817
[email protected] Michael Helbert, 2816 Lakeridge Road, Emporia, KS 66801, 620 343-2688 [email protected] Grant Riles, 1515 Williby Ave., Emporia, KS 66801, 620 343-3833 [email protected] Angie Schreiber, 1722 Yucca Lane, Emporia, KS 66801, 620 342-6954 [email protected] Brent Windsor, 2010 Briarcliff Lane, Emporia, KS 66801, 785 554-6056 [email protected]

3
Key Staff
Superintendent: Theresa Davidson Clerk of the Board: Dana Witten
Associate Superintendent for Human Resources: Dr. Andy Koenigs Assistant Superintendent for Business: Rob Scheib Assistant Superintendent for Teaching & Learning: Dr. George Abel Executive Director of Elementary Education: Vicki Schweinler
Executive Director of Secondary Education: Dr. Kristen Kuhlmann Executive Director of Special Services: Elena Rettiger-Lincoln JD Associate Executive Director – Assessments & Accountability: Ryan Karjala
Director of Budgets & Accounting: Karen Flood Director of Community Relations: Nancy Horst Director of Food Service: Jill Vincent
Director of Infrastructure & Security Chris Harvel Director of Maintenance: Bob Fancher Director of Network Operations Paul Beadles
Director of Transportation: Shelby Harvel .
The District’s Accomplishments and Challenges Accomplishments:
Much work has been done on curriculum alignment and design; we will continue this work at all grade levels including use of the ewalkthrough tool.
Sheltered instruction, co-teaching and other research-based instructional tools are common in our classrooms.
We are developing formative assessments to determine if our students are learning the curriculum components as they are being taught at each grade level. The district has purchased access to the 75,000 question ETS item test bank which is aligned to the Kansas College and Career Ready Standards. Tests developed by teachers using this Pearson Schoolnet for PowerSchool system and the test generator will merge results to the PowerSchool dashboard.
Measures of Academic Progress (MAP) assessments given multiple times a year provide teachers with valuable student data with which to monitor and adjust instruction.
Literacy First will support instructional practices to span pre-school through 12th grade; all teachers have been trained.
Our teachers have time to meet in Professional Learning Communities (PLC) to understand the core curriculum, implement a continuum of instructional strategies, employ multiple measures of progress and analyze individual student data to make sound educational decisions.
Multi-Tiered Systems of Support (MTSS) help teachers prescribe lessons and supports much like doctors use medical test data to make treatment plans for our health care. This system creates opportunities for better alignment and collaboration between regular and special education.

4
Interventionists who specialize in special education, English language learning strategies, and instruction for reading and math support our core curriculum.
A K-5 foreign language program provides instruction in both English and Spanish for students whether their first language is Spanish or English.
Starting at seventh grade, students can enroll in AVID – Advancement Via Individual Determination – a program that prepares them to enroll in advanced courses and to see college study as a real option.
Emporia High School has joined the Jobs for American Graduates (JAG) Kansas program, which provides another vehicle for students to become college and career ready.
Technology Rich Classroom instruction is expanding to more students and grade levels through training and shared expertise of our staff. We are in the process of implementing 1 to 1 chrome books in the middle grades.
Career Pathways is coming into greater focus as we define the sequence and content of courses primarily at the middle and high schools.
Turning Point Academy continues to provide options for students to learn through a project-based model that is uniquely different at K-5, 6-8 and 9-12 grade levels.
Flint Hills Learning Center is poised to provide instructional services unique to each individual high school and adult student and to assure that each one is college and career ready.
A unique staffing formula supports staffing ratios according to student needs in Emporia schools.
Partnerships with Flint Hills Technical College and Emporia State University provide post-secondary coursework and credit to high school students.
Collaboration with ESU for placing pre-service teachers in the classroom makes possible our contribution to a generation of teachers equipped to meet the challenges ahead and adds instructional support in our classrooms.
Challenges:
The Board of Education has set challenging goals for the district that cause us to look at student data in bold new ways that go beyond rising test scores.
The School Community: The Emporia School district includes the City of Emporia and adjacent rural areas. We are located in east-central Kansas at the junction of U.S. 50 Highway, the Kansas Turnpike and Interstate 35, mid-way between Wichita and Topeka. Emporia, Kansas, has a population of approximately 25,700 people and a diverse economy supported by manufacturing, retail business, agriculture, and education. The city is home to the National Teacher’s Hall of Fame, Flint Hills Technical College and Emporia State University. The community’s largest employers are Emporia State University, Tyson Fresh Meats, Hostess Bakery, Newman Regional Health and the Emporia Public Schools. The District Profile:
• The district has approximately 1,200 employees in district and federal programs preK-12, including the Flint Hills Special Education Cooperative (FHSEC).

5
• The district employs highly qualified teachers, administrators and professional support staff to serve the approximately 4,600 students in grades preK-12. Close to half of our teachers have advanced degrees and many have been recognized at the state and national level for their professional achievements and contributions to public education.
• The school district consists of 11 school buildings: one high school (9-12), one middle school (6-8), six elementary schools (K-5), one early childhood center for three and four-year olds, one alternative high school and a charter school (K-12). All are fully accredited. They are:
• Emporia High School • Emporia Middle School • Logan Avenue Elementary • Timmerman Elementary • Riverside Elementary • Village Elementary • Walnut Elementary • William Allen White Elementary • Maynard Early Childhood Center • Flint Hills Learning Center • Turning Point Academy
• The district organization has self-contained classrooms in the elementary schools. • A transitional organization has been established at the middle school with a combination of departmentalization and teaming. • A departmental organization with a block schedule has been established at the high school level. The high school offers over 350 courses annually. • USD 253 serves as the sponsoring district for the Flint Hills Special Education Cooperative, which
provides special services in seven school districts for children birth to age 21. • The charter school offers limited virtual and on-site instruction for students in grades K-12. • Six elementary schools offer unique learning environments by which all students can excel. Our schools have neighborhood boundaries, but transfer policies give parents choices. • The Emporia schools offer accelerated and advanced-placement classes, as well as, assistance for
students at risk of failing. Test scores on state and national assessments are consistent with state and national averages and showing improvement. Emporia students continue to score well on the ACT exam and there are more Emporia students taking this challenging exam. More than two-thirds of the graduating seniors go on to post-high school training at universities, colleges and technical schools. (See the Kansas State Department of Education web site for achievement data and demographic information about the district and individual schools.)
• The district’s curricular program offers instruction in the areas of art, business, driver’s education, health, family and consumer science, industrial technology, language arts, mathematics, music, physical education, science, social studies, special education, and technology. Career education, wellness, social/emotional learning and human sexuality are integrated into appropriate curricular programs. Emporia High School and Emporia Middle School are developing career pathways in several fields of interest to students.
• The district has a comprehensive vocational education program. Students begin exploring career interests in middle school and are afforded the opportunity for technically advanced courses throughout high school and at the Flint Hills Technical College. • The district has an extensive high school co-curricular program, which provides many opportunities
for social, physical, and intellectual growth. This program includes activities in forensics, debate, music, intramural activities, special interest clubs, interscholastic athletics, and organized class and student government.
• The district provides a well-balanced program for students with special needs. With emphasis on inclusion, this program includes classes for the gifted, the mentally and physically handicapped, at-risk students, and those requiring homebound instruction, bilingual, remedial reading, or educational enhancement.

6
• The district provides student support programs in addition to the academic program. These include guidance and counseling, standardized testing, field trips, health services, centralized media centers, after-school care/activities and alternative school choices.
• The district’s operational services include business, technology, nutrition, maintenance, central supply and transportation services. • The school district consists of approximately 135 square miles. • The district contracts with the Flint Hills Technical College to provide adult basic education classes
and other adult education courses on a demand basis. • The district food service department provides hot breakfast and lunch at all schools each day with the
food prepared at a central kitchen and delivered to the schools. Approximately 4,200 meals are served each day. The department is an active partner in the District Wellness Policy and Action Plan, which focuses on nutrition and nutrition education. The district also participates in the Federal summer meals program serving breakfast and lunch at five school sites for children age 18 and under.
• The district has an approved state professional development plan which allows for teacher recertification. • The district provides transportation to and from school for all students who live 2.5 miles or more from school in addition to areas identified for safety considerations. • The schools benefit from partnerships with parents, businesses and community groups. Parent
organizations are active from the elementary to the high school level. Businesses, community foundations, just to name a few.
• Emporia teachers support teacher training by supervising teacher education students as observers, student teachers and teacher interns. Emporia teachers also are frequent speakers in university classrooms. University faculty members serve as resources for our teachers as well. • Emporia USD 253 does not discriminate on the basis of race, color, national origin, sex, religion, handicap/disability or age. Persons having inquiries may contact the school district's coordinator, 1700 West 7th Avenue, Emporia, KS 66801, 620-341-2330.

7
Supplemental Information for the Following Tables 1. Summary of Total Expenditures by Function (All Funds) 2. Summary of General Fund Expenditures by Function 3. Summary of Supplemental General Fund Expenditures by Function 4. Summary of General and Supplemental General Fund Expenditures by Function 5. Summary of Special Education Fund by Function 6. Instruction Expenditures (1000) 7. Student Support Expenditures (2100)
8. Instructional Support Expenditures (2200) 9. General Administration Expenditures (2300) 10. School Administration Expenditures (2400)
11. Central Services Expenditures (2500) 12. Operations and Maintenance Expenditures (2600)
13. Transportation Expenditures (2700) 14. Other Support Services Expenditures (2900)
15. Food Service Expenditures (3100)
16. Community Services Operations (3300) 17. Capital Improvements (4000) 18. Debt Services (5100)
19. Miscellaneous Information – Transfers (5200) 20. Miscellaneous Information Unencumbered Cash Balance by Fund 21. Reserve Funds Unencumbered Cash Balance 22. Other Information – Enrollment Information 23. Miscellaneous Information Mill Rates by Fund 24. Other Information – Assessed Valuation and Bonded Indebtedness

8
Note: The FTE (full time equivalency) used in this report to calculate the “Amount Per Pupil” is defined as following: Enrollment (FTE) includes the enrollment of the district used for state aid and budget authority, and all other preschool enrollment and kindergarten students attending full time. KSDE Website Information Available K-12 Statistics (Building, District or State Totals) http://svapp15586.ksde.org/k12/k12.aspx
• Attendance / Enrollment Reports • Staff Reports • Graduates / Dropouts Reports • Crime / Violence Reports
School Finance Reports and Publications http://www.ksde.org/Agency/FiscalandAdministrativeServices/SchoolFinance/ReportsandPublications.aspx
• Assessed Valuation • Cash Balances • Headcount Enrollment • Mill Levies • Personnel (Certified/Non-Certified) • Salary Reports
Kansas Building Report Card http://svapp15586.ksde.org/rcard/
• Attendance Rate • Graduation Rate • Dropout Rate • School Violence • Assessments
o Reading o Mathematics o Writing
• Graduates Passing Adv. Science Courses • Graduates Passing Adv. Math Courses

USD# 253
Summary of Total Expenditures By Function (All Funds)
% % % % %
2012-2013 of 2013-2014 of inc/ 2014-2015 of inc/
Actual Tot Actual Tot dec Budget Tot dec
Instruction 34,135,294 59% 37,197,710 61% 9% 39,500,029 60% 6%
Student Support Services 3,663,443 6% 3,600,221 6% -2% 3,928,679 6% 9%
Instructional Support Services 3,780,844 7% 3,847,751 6% 2% 4,022,956 6% 5%
Administration & Support 4,478,905 8% 4,593,167 8% 3% 5,235,159 8% 14%
Operations & Maintenance 3,930,886 7% 4,132,863 7% 5% 4,290,686 6% 4%
Transportation 1,909,321 3% 1,923,175 3% 1% 2,180,339 3% 13%
Food Services 2,372,220 4% 2,290,721 4% -3% 2,432,378 4% 6%
Capital Improvements 48,964 0% 70,574 0% 44% 887,953 1% 1158%
Debt Services 3,843,288 7% 3,464,486 6% -10% 3,725,613 6% 8%
Other Costs 0 0% 0 0% 0% 0 0% 0%
Total Expenditures* 58,163,165 100% 61,120,668 100% 5% 66,203,792 100% 8%
Amount per Pupil $12,522 $13,187 5% $14,283 8%
Current Expenditures** 54,056,711 100% 56,593,959 100% 5% 59,946,144 100% 6%
Amount per Pupil $11,638 $12,210 5% $12,933 6%
Instruction*** (Total Expenditures) 34,007,957 58% 36,228,205 59% 1% 38,165,483 58% -1%
Instruction*** (Current Expenditures) 34,007,957 63% 36,228,205 64% 1% 38,165,483 64% 0%
Note: Percentages on charts are within +-1% due to rounding used. Pie graph percentages may differ from charts for this reason also.
Further definition of what goes into each category:
Instruction - 1000 Transportation - 2700
Student Support Services - 2100 Food Service - 3100
Instructional Support Services - 2200 Other Costs - 2900 and 3300
Administration & Support - 2300, 2400 and 2500 Capital Improvements - 4000
Operations & Maintenance - 2600 Debt Services - 5100
Transfers - 5200
Percent of Expenditures
* The funds that are included in the categories above are: General, Supplemental General, Bilingual Education, At Risk(4yr Old), At Risk(K-12), Virtual Education, Capital
Outlay, Driver Education, Extraordinary School Program, Summer School, Special Education, Vocational Education, Professional Development, Bond & Interest #1, Bond &
Interest #2, No-Fund Warrant, Special Assessment, Parent Education, School Retirement, Student Materials Revolving & Textbook Rental, Tuition Reimbursement,
Gifts/Grants, KPERS Special Retirement Contribution, Contingency, Special Liability Expense, Federal Funds, Adult Education, Adult Supplemental Education, Activity Fund
and Special Education Coop Fund.
*** Instruction excludes Capital Outlay and Bond Debt expenditures (Code 16, Code 62, Code 63)
** Current Spending excludes Capital Outlay and Bond Debt expenditures (Code 16, Code 62, Code 63)
0
5,000,000
10,000,000
15,000,000
20,000,000
25,000,000
30,000,000
35,000,000
40,000,00039,500,029
3,928,679 4,022,956 5,235,159 4,290,686 2,180,339 2,432,378 887,953
3,725,613 0
Summary of Total Expenditures by Function (All Funds)
2012-2013
2013-2014
2014-2015
Instruction 60%
Student Support Services 6%
Instructional Support 6%
Administration & Support 8%
Operations & Maintenance 6%
Transportation 3%
Food Services 4%
Capital Improvements
1%
Debt Services 6%
Other Costs 0%
2014-15 Summary of Total Expenditures by Function
Instruction
Student Support Services
Instructional Support
Administration & Support
Operations & Maintenance
Transportation
Food Services
Capital Improvements
Debt Services
Other Costs
9/17/2014 3:20 PM Sumexpen.xlsx Page 1 of 30

USD# 253
Summary of General Fund Expenditures
by Function
% % % % %
2012-2013 of 2013-2014 of inc/ 2014-2015 of inc/
Actual Tot Actual Tot dec Budget Tot dec
Instruction 9,069,608 56% 9,523,647 56% 5% 9,409,368 55% -1%
Student Support 14,804 0% 12,812 0% -13% 17,880 0% 40%
Instructional Support 595,446 4% 665,935 4% 12% 602,387 3% -10%
Administration & Support 2,471,501 15% 2,554,857 15% 3% 2,953,875 17% 16%
Operations & Maintenance 2,917,841 18% 2,965,607 17% 2% 3,037,934 18% 2%
Transportation 1,238,700 8% 1,297,637 8% 5% 1,243,109 7% -4%
Capital Improvements 0 0% 0 0% 0% 0 0% 0%
Other Costs 0 0% 0 0% 0% 0 0% 0%
Total Expenditures 16,307,900 100% 17,020,495 100% 4% 17,264,553 100% 1%
Amount per Pupil $3,511 $3,672 5% $3,725 1%
The Summary of General Fund Expenditures chart information comes from pages 6-13 and only uses the 'General Fund' line items.
0
1,000,000
2,000,000
3,000,000
4,000,000
5,000,000
6,000,000
7,000,000
8,000,000
9,000,000
10,000,000
Instruction StudentSupport
InstructionalSupport
Administration& Support
Operations &Maintenance
Transportation CapitalImprovements
Other Costs
9,409,368
17,880
602,387
2,953,875 3,037,934
1,243,109
0 0
Summary of General Fund Expenditures
2012-2013
2013-2014
2014-2015
Instruction 55%
Student Support
0%
Instructional Support 3%
Administration & Support
17%
Operations & Maintenance 18%
Transportation 7%
Capital Improvements 0%
Other Costs 0%
2014-15 Summary of General Fund Expenditures by Function
Instruction
Student Support
Instructional Support
Administration & Support
Operations & Maintenance
Transportation
Capital Improvements
Other Costs
9/17/2014 3:20 PM Sumexpen.xlsx Page 2 of 30

USD# 253
Summary of Supplemental General Fund Expenditures
by Function
% % % % %
2012-2013 of 2013-2014 of inc/ 2014-2015 of inc/
Actual Tot Actual Tot dec Budget Tot dec
Instruction 3,833,062 46% 3,756,554 44% -2% 4,620,000 48% 23%
Student Support 1,582,384 19% 1,550,192 18% -2% 1,621,671 17% 5%
Instructional Support 1,018,451 12% 1,222,301 14% 20% 1,161,764 12% -5%
Administration & Support 1,075,544 13% 1,169,563 14% 9% 1,311,705 14% 12%
Operations & Maintenance 740,114 9% 841,788 10% 14% 935,800 10% 11%
Transportation 0 0% 0 0% 0% 0 0% 0%
Capital Improvements 7,040 0% 350 0% -95% 37,953 0% 10744%
Other Costs 0 0% 0 0% 0% 0 0% 0%
Total Expenditures 8,256,595 100% 8,540,748 100% 3% 9,688,893 100% 13%
Amount per Pupil $1,778 $1,843 4% $2,090 13%
The Summary of Supplemental General Fund Expenditures chart information comes from pages 6-13 and only uses the 'Supplemental
General Fund' line items.
0
500,000
1,000,000
1,500,000
2,000,000
2,500,000
3,000,000
3,500,000
4,000,000
4,500,000
5,000,000
Instruction StudentSupport
InstructionalSupport
Administration& Support
Operations &Maintenance
Transportation CapitalImprovements
Other Costs
4,620,000
1,621,671
1,161,764 1,311,705
935,800
0 37,953 0
Summary of Supplemental General Expenditures by Function
2012-2013
2013-2014
2014-2015
Instruction 48%
Student Support 17%
Instructional Support 12%
Administration & Support 13%
Operations & Maintenance 10%
Transportation 0%
Capital Improvements
0%
Other Costs 0%
2014-15 Summary of Supplemental General Fund Expenditures by Function
Instruction
Student Support
Instructional Support
Administration & Support
Operations & Maintenance
Transportation
Capital Improvements
Other Costs
9/17/2014 3:20 PM Sumexpen.xlsx Page 3 of 30

USD# 253
Summary of General and Supplemental General Fund
Expenditures by Function
% % % % %
2012-2013 of 2013-2014 of inc/ 2014-2015 of inc/
Actual Tot Actual Tot dec Budget Tot dec
Instruction 12,902,670 53% 13,280,201 52% 3% 14,029,368 52% 6%
Student Support 1,597,188 7% 1,563,004 6% -2% 1,639,551 6% 5%
Instructional Support 1,613,897 7% 1,888,236 7% 17% 1,764,151 7% -7%
Administration & Support 3,547,045 14% 3,724,420 15% 5% 4,265,580 16% 15%
Operations & Maintenance 3,657,955 15% 3,807,395 15% 4% 3,973,734 15% 4%
Transportation 1,238,700 5% 1,297,637 5% 5% 1,243,109 5% -4%
Capital Improvements 7,040 0% 350 0% -95% 37,953 0% 10744%
Other Costs 0 0% 0 0% 0% 0 0% 0%
Total Expenditures 24,564,495 100% 25,561,243 100% 4% 26,953,446 100% 5%
Amount per Pupil $5,288 $5,515 4% $5,815 5%
The Summary of General and Supplemental General Fund Expenditures chart information comes from pages 6-13 and adds together
the 'General Fund' and 'Supplemental General Fund' line items.
0
2,000,000
4,000,000
6,000,000
8,000,000
10,000,000
12,000,000
14,000,000
16,000,000
Instruction StudentSupport
InstructionalSupport
Administration& Support
Operations &Maintenance
Transportation CapitalImprovements
Other Costs
12
,90
2,6
70
1,5
97
,18
8
1,6
13
,89
7
3,5
47
,04
5
3,6
57
,95
5
1,2
38
,70
0
7,0
40
0
13
,28
0,2
01
1,5
63
,00
4
1,8
88
,23
6
3,7
24
,42
0
3,8
07
,39
5
1,2
97
,63
7
35
0
0
14
,02
9,3
68
1,6
39
,55
1
1,7
64
,15
1
4,2
65
,58
0
3,9
73
,73
4
1,2
43
,10
9
37
,95
3
0
Summary of General and Supplemental General Fund Expenditures by Function
2012-2013
2013-2014
2014-2015
Instruction 52%
Student Support 6%
Instructional Support 6%
Administration & Support 16%
Operations & Maintenance 15%
Transportation 5%
Capital Improvements 0%
Other Costs 0%
2014-15 Summary of General and Supplemental General Fund Expenditures by Function
Instruction
Student Support
Instructional Support
Administration & Support
Operations & Maintenance
Transportation
Capital Improvements
Other Costs
9/17/2014 3:20 PM Sumexpen.xlsx Page 4 of 30

USD# 253
Summary of Special Education Fund
by Function
% % % % %
2012-2013 of 2013-2014 of inc/ 2014-2015 of inc/
Actual Tot Actual Tot dec Budget Tot dec
Instruction 3,609,102 91% 3,794,347 92% 5% 4,301,715 91% 13%
Student Support 0 0% 0 0% 0% 0 0% 0%
Instructional Support 0 0% 0 0% 0% 0 0% 0%
Administraton & Support 0 0% 0 0% 0% 0 0% 0%
Operations & Maintenance 0 0% 0 0% 0% 0 0% 0%
Transportation 347,019 9% 329,685 8% -5% 408,500 9% 24%
Capital Improvements 0 0% 0 0% 0% 0 0% 0%
Other Costs 0 0% 0 0% 0% 0 0% 0%
Total Expenditures 3,956,121 100% 4,124,032 100% 4% 4,710,215 100% 14%
Amount per Pupil $852 $890 4% $1,016 14%
The Summary of Special Education Fund Expenditures chart information comes from pages 6-13 and only uses the 'Special Education Fund'
line items. (Total expenditures excludes Special Ed Coop Fund because it would include expenditures for all schools participating in the Coop.)
0
500,000
1,000,000
1,500,000
2,000,000
2,500,000
3,000,000
3,500,000
4,000,000
4,500,000
Instruction StudentSupport
InstructionalSupport
Administraton& Support
Operations &Maintenance
Transportation CapitalImprovements
Other Costs
3,6
09
,10
2
0
0
0
0
34
7,0
19
0
0
3,7
94
,34
7
0
0
0
0
32
9,6
85
0
0
4,3
01
,71
5
0
0
0
0
40
8,5
00
0
0
Summary of Special Education Fund Expenditures by Function
2012-2013
2013-2014
2014-2015
Instruction 91%
Student Support
0%
Instructional Support
0%
Administraton & Support 0%
Operations & Maintenance
0%
Transportation 9%
Capital Improvements 0%
Other Costs 0%
2014-15 Summary of Special Education Fund by Function
Instruction
Student Support
Instructional Support
Administraton & Support
Operations & Maintenance
Transportation
Capital Improvements
Other Costs
9/17/2014 3:20 PM Sumexpen.xlsx Page 5 of 30

USD# 253
Instruction Expenditures (1000)
% %
2012-2013 2013-2014 inc/ 2014-2015 inc/
Actual Actual dec Budget dec
General 9,069,608 9,523,647 5% 9,409,368 -1%
Federal Funds 842,548 1,619,149 92% 1,415,137 -13%
Supplemental General 3,833,062 3,756,554 -2% 4,620,000 23%
At Risk (4yr Old) 403,770 396,576 -2% 408,730 3%
At Risk (K-12) 4,731,753 4,746,661 0% 5,196,521 9%
Bilingual Education 1,777,673 1,757,366 -1% 1,840,970 5%
Virtual Education 34,082 18,513 -46% 41,871 126%
Capital Outlay 127,337 969,505 661% 1,334,546 38%
Driver Education 0 0 0% 0 0%
Declining Enrollment 0 0 0% 0 0%
Extraordinary School Program 16,790 2,879 -83% 3,000 4%
Food Service 0 0 0% 0 0%
Professional Development 0 0 0% 0 0%
Parent Education Program 0 0 0% 0 0%
Summer School 7,740 5,082 -34% 100,285 1873%
Special Education 3,609,102 3,794,347 5% 4,301,715 13%
Cost of Living 0 0 0% 0 0%
Vocational Education 408,315 434,312 6% 433,352 0%
Gifts/Grants 0 0 0% 0 0%
Special Liability 0 0 0% 0 0%
School Retirement 0 0 0% 0 0%
Extraordinary Growth Facilities 0 0 0% 0 0%
Special Reserve 0 0 0%
KPERS Spec. Ret. Contribution 2,036,001 2,293,574 13% 2,810,527 23%
Contingency Reserve 0 0 0%
Text Book & Student Material 13,713 183,971 1242%
Activity Fund 256,138 188,093 -27% 0 -100%
Bond and Interest #1 0 0 0% 0 0%
Bond and Interest #2 0 0 0% 0 0%
No-Fund Warrant 0 0 0% 0 0%
Special Assessment 0 0 0% 0 0%
Temporary Note 0 0 0% 0 0%
SUBTOTAL 27,167,632 29,690,229 9% 31,916,022 7%
Enrollment (FTE)* 4,645.0 4,635.0 0% 4,635.0 0%
Amount per Pupil 5,849 6,406 10% 6,886 7%
Adult Education 91,083 100,793 11% 101,419 1%
Adult Supplemental Education 0 0 0% 0 0%
Tuition Reimbursement 0 0 0% 0 0%
Special Education Coop 6,876,579 7,406,688 8% 7,482,588 1%
TOTAL 34,135,294 37,197,710 9% 39,500,029 6%
NOTE: Gifts/Grants includes private grants and grants from nonfederal sources.
Amount per pupil excludes the following funds: Adult Education, Adult Supplemental Education, Special Education Coop
and Tuition Reimbursement.
*Enrollment (FTE) includes the enrollment of the district used for state aid and budget authority, and all other preschool enrollment
and kindergarten students attending full time.
0
2,000,000
4,000,000
6,000,000
8,000,000
10,000,000
2012-2013 2013-2014 2014-2015
9,069,608 9,523,647 9,409,368
3,833,062 3,756,554 4,620,000
3,609,102 3,794,347 4,301,715
Instruction Expenditures
GeneralSupplemental GeneralSpecial Education
31,000,000
32,000,000
33,000,000
34,000,000
35,000,000
36,000,000
37,000,000
38,000,000
39,000,000
40,000,000
2012-2013 2013-2014 2014-2015
34,135,294
37,197,710
39,500,029
Instruction Expenditures
9/17/2014 3:20 PM Sumexpen.xlsx Page 6 of 30

USD# 253
Student Support Expenditures (2100)
% %
2012-2013 2013-2014 inc/ 2014-2015 inc/
Actual Actual dec Budget dec
General 14,804 12,812 -13% 17,880 40%
Federal Funds 226,042 236,885 5% 207,037 -13%
Supplemental General 1,582,384 1,550,192 -2% 1,621,671 5%
At Risk (4yr Old) 275 0 -100% 0 0%
At Risk (K-12) 80,611 54,025 -33% 55,795 3%
Bilingual Education 0 0 0% 0 0%
Virtual Education 0 0 0% 0 0%
Capital Outlay 0 0 0% 15,000 0%
Driver Training 0 0 0% 0 0%
Declining Enrollment 0 0 0% 0 0%
Extraordinary School Program 150,418 170,243 13% 190,000 12%
Food Service 0 0 0% 0 0%
Professional Development 0 0 0% 0 0%
Parent Education Program 0 0 0% 0 0%
Summer School 0 0 0% 0 0%
Special Education 0 0 0% 0 0%
Cost of Living 0 0 0% 0 0%
Vocational Education 0 0 0% 0 0%
Gifts/Grants 4,166 2,700 -35% 20,000 641%
Special Liability 0 0 0% 0 0%
School Retirement 0 0 0% 0 0%
Extraordinary Growth Facilities 0 0 0% 0 0%
Special Reserve 0 0 0%
KPERS Spec. Ret. Contribution 204,057 234,661 15% 271,294 16%
Contingency Reserve 0 0 0%
Text Book & Student Material 0 0 0%
Activity Fund 0 0 0% 0 0%
Bond and Interest #1 0 0 0% 0 0%
Bond and Interest #2 0 0 0% 0 0%
No-Fund Warrant 0 0 0% 0 0%
Special Assessment 0 0 0% 0 0%
Temporary Note 0 0 0% 0 0%
SUBTOTAL 2,262,757 2,261,518 0% 2,398,677 6%
Enrollment (FTE)* 4,645.0 4,635.0 0% 4,635.0 0%
Amount per Pupil 487 488 0% 518 6%
Adult Education 0 0 0% 0 0%
Adult Supplemental Education 0 0 0% 0 0%
Tuition Reimbursement 0 0 0% 0 0%
Special Education Coop 1,400,686 1,338,703 -4% 1,530,002 14%
TOTAL 3,663,443 3,600,221 -2% 3,928,679 9%
Amount per Pupil $877 $855 -2% $935 9%
NOTE: Gifts/Grants includes private grants and grants from nonfederal sources.
Amount per pupil excludes the following funds: Adult Education, Adult Supplemental Education, Special Education Coop
and Tuition Reimbursement.
*Enrollment (FTE) includes the enrollment of the district used for state aid and budget authority, and all other preschool enrollment
and kindergarten students attending full time.
3,400,000
3,450,000
3,500,000
3,550,000
3,600,000
3,650,000
3,700,000
3,750,000
3,800,000
3,850,000
3,900,000
3,950,000
2012-2013 2013-2014 2014-2015
3,663,443
3,600,221
3,928,679
Student Support Expenditures
9/17/2014 3:20 PM Sumexpen.xlsx Page 7 of 30

USD# 253
Instructional Support Expenditures (2200)
% %
2012-2013 2013-2014 inc/ 2014-2015 inc/
Actual Actual dec Budget dec
General 595,446 665,935 12% 602,387 -10%
Federal Funds 892,267 812,991 -9% 710,554 -13%
Supplemental General 1,018,451 1,222,301 20% 1,161,764 -5%
At Risk (4yr Old) 0 0 0% 0 0%
At Risk (K-12) 207,717 209,001 1% 388,299 86%
Bilingual Education 0 0 0% 0 0%
Virtual Education 0 0 0% 0 0%
Capital Outlay 0 0 0% 15,000 0%
Driver Training 0 0 0% 0 0%
Declining Enrollment 0 0 0% 0 0%
Extraordinary School Program 0 0 0% 0 0%
Food Service 0 0 0% 0 0%
Professional Development 279,214 95,920 -66% 355,049 270%
Parent Education Program 0 0 0% 0 0%
Summer School 0 0 0% 0 0%
Special Education 0 0 0% 0 0%
Cost of Living 0 0 0% 0 0%
Vocational Education 17,200 11,574 -33% 17,739 53%
Gifts/Grants 38,248 31,195 -18% 60,581 94%
Special Liability 0 0 0% 0 0%
School Retirement 0 0 0% 0 0%
Extraordinary Growth Facilities 0 0 0% 0 0%
Special Reserve 0 0 0%
KPERS Spec. Ret. Contribution 202,863 245,886 21% 254,083 3%
Contingency Reserve 0 0 0%
Text Book & Student Material 0 0 0%
Activity Fund 0 0 0% 0 0%
Bond and Interest #1 0 0 0% 0 0%
Bond and Interest #2 0 0 0% 0 0%
No-Fund Warrant 0 0 0% 0 0%
Special Assessment 0 0 0% 0 0%
Temporary Note 0 0 0% 0 0%
SUBTOTAL 3,251,406 3,294,803 1% 3,565,456 8%
Enrollment (FTE)* 4,645.0 4,635.0 0% 4,635.0 0%
Amount per Pupil 700 711 2% 769 8%
Adult Education 0 0 0% 0 0%
Adult Supplemental Education 0 0 0% 0 0%
Tuition Reimbursement 0 0 0% 0 0%
Special Education Coop 529,438 552,948 4% 457,500 -17%
TOTAL 3,780,844 3,847,751 2% 4,022,956 5%
Amount per Pupil $814 $830 2% $868 5%
NOTE: Gifts/Grants includes private grants and grants from nonfederal sources.
Amount per pupil excludes the following funds: Adult Education, Adult Supplemental Education, Special Education Coop
and Tuition Reimbursement.
*Enrollment (FTE) includes the enrollment of the district used for state aid and budget authority, and all other preschool enrollment
and kindergarten students attending full time.
3,650,000
3,700,000
3,750,000
3,800,000
3,850,000
3,900,000
3,950,000
4,000,000
4,050,000
2012-2013 2013-2014 2014-2015
3,780,844
3,847,751
4,022,956
Instructional Support Expenditures
9/17/2014 3:20 PM Sumexpen.xlsx Page 8 of 30

USD# 253
General Administration Expenditures (2300)
% %
2012-2013 2013-2014 inc/ 2014-2015 inc/
Actual Actual dec Budget dec
General 833,139 785,149 -6% 625,604 -20%
Federal Funds 92,115 155,959 69% 136,309 -13%
Supplemental General 40,287 134,634 234% 220,000 63%
At Risk (4yr Old) 0 0 0% 0 0%
At Risk (K-12) 0 0 0% 0 0%
Bilingual Education 0 0 0% 0 0%
Virtual Education 0 0 0% 0 0%
Capital Outlay 8,246 15,338 86% 20,000 30%
Driver Training 0 0 0% 0 0%
Declining Enrollment 0 0 0% 0 0%
Extraordinary School Program 0 0 0% 0 0%
Food Service 0 0 0% 0 0%
Professional Development 0 0 0% 0 0%
Parent Education Program 0 0 0% 0 0%
Summer School 0 0 0% 0 0%
Special Education 0 0 0% 0 0%
Cost of Living 0 0 0% 0 0%
Vocational Education 0 0 0% 0 0%
Gifts/Grants 0 0 0% 0 0%
Special Liability Expense 0 0 0% 0 0%
School Retirement 0 0 0% 0 0%
Extraordinary Growth Facilities 0 0 0% 0 0%
Special Reserve 0 0 0%
KPERS Spec. Ret. Contribution 80,683 85,311 6% 62,420 -27%
Contingency Reserve 0 0 0%
Text Book & Student Material 0 0 0%
Activity Fund 0 0 0% 0 0%
Bond and Interest #1 0 0 0% 0 0%
Bond and Interest #2 0 0 0% 0 0%
No-Fund Warrant 0 0 0% 0 0%
Special Assessment 0 0 0% 0 0%
Temporary Note 0 0 0% 0 0%
SUBTOTAL 1,054,470 1,176,391 12% 1,064,333 -10%
Enrollment (FTE)* 4,645.0 4,635.0 0% 4,635.0 0%
Amount per Pupil 227 254 12% 230 -10%
Adult Education 0 0 0% 0 0%
Adult Supplemental Education 0 0 0% 0 0%
Tuition Reimbursement 0 0 0% 0 0%
Special Education Coop 253,814 259,378 0% 312,016 20%
TOTAL 1,308,284 1,435,769 10% 1,376,349 -4%
NOTE: Gifts/Grants includes private grants and grants from nonfederal sources.
Amount per pupil excludes the following funds: Adult Education, Adult Supplemental Education, Special Education Coop
and Tuition Reimbursement.
*Enrollment (FTE) includes the enrollment of the district used for state aid and budget authority, and all other preschool enrollment
and kindergarten students attending full time.
1,240,000
1,260,000
1,280,000
1,300,000
1,320,000
1,340,000
1,360,000
1,380,000
1,400,000
1,420,000
1,440,000
2012-2013 2013-2014 2014-2015
1,308,284
1,435,769
1,376,349
General Administration Expenditures
9/17/2014 3:20 PM Sumexpen.xlsx Page 9 of 30

USD# 253
School Administration Expenditures (2400)
% %
2012-2013 2013-2014 inc/ 2014-2015 inc/
Actual Actual dec Budget dec
General 1,638,362 1,769,708 8% 2,082,017 18%
Federal Funds 0 0 0% 0 0%
Supplemental General 512,089 527,210 3% 555,066 5%
At Risk (4yr Old) 20,922 0 -100% 0 0%
At Risk (K-12) 29,818 30,869 4% 31,840 3%
Bilingual Education 0 0 0% 0 0%
Virtual Education 0 0 0% 0 0%
Capital Outlay 0 1,296 0% 20,000 1443%
Driver Training 0 0 0% 0 0%
Declining Enrollment 0 0 0% 0 0%
Extraordinary School Program 0 0 0% 0 0%
Food Service 0 0 0% 0 0%
Professional Development 0 0 0% 0 0%
Parent Education Program 0 0 0% 0 0%
Summer School 0 0 0% 0 0%
Special Education 0 0 0% 0 0%
Cost of Living 0 0 0% 0 0%
Vocational Education 2,098 814 -61% 800 -2%
Gifts/Grants 0 0 0% 0 0%
Special Liability Expense 0 0 0% 0 0%
School Retirement 0 0 0% 0 0%
Extraordinary Growth Facilities 0 0 0% 0 0%
Special Reserve 0 0 0%
KPERS Spec. Ret. Contribution 197,487 222,669 13% 250,632 13%
Contingency Reserve 0 0 0%
Text Book & Student Material 0 0 0%
Activity Fund 0 0 0% 0 0%
Bond and Interest #1 0 0 0% 0 0%
Bond and Interest #2 0 0 0% 0 0%
No-Fund Warrant 0 0 0% 0 0%
Special Assessment 0 0 0% 0 0%
Temporary Note 0 0 0% 0 0%
SUBTOTAL 2,400,776 2,552,566 6% 2,940,355 15%
Enrollment (FTE)* 4,645.0 4,635.0 0% 4,635.0 0%
Amount per Pupil 517 551 7% 634 15%
Adult Education 0 0 0% 0 0%
Adult Supplemental Education 0 0 0% 0 0%
Tuition Reimbursement 0 0 0% 0 0%
Special Education Coop 35,700 45,584 28% 42,119 -8%
TOTAL 2,436,476 2,598,150 7% 2,982,474 15%
NOTE: Gifts/Grants includes private grants and grants from nonfederal sources.
Amount per pupil excludes the following funds: Adult Education, Adult Supplemental Education, Special Education Coop
and Tuition Reimbursement.
*Enrollment (FTE) includes the enrollment of the district used for state aid and budget authority, and all other preschool enrollment
and kindergarten students attending full time.
0
500,000
1,000,000
1,500,000
2,000,000
2,500,000
3,000,000
2012-2013 2013-2014 2014-2015
2,436,476 2,598,150
2,982,474
School Administration Expenditures
9/17/2014 3:20 PM Sumexpen.xlsx Page 10 of 30
USD# 253
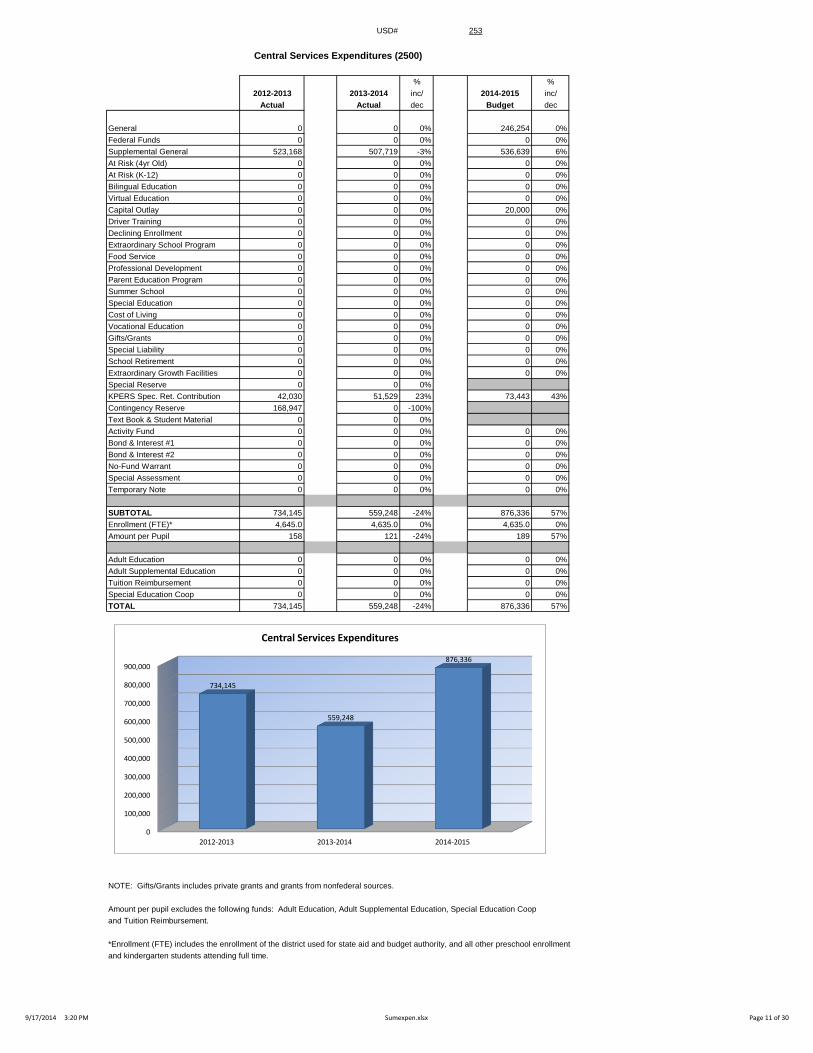
Central Services Expenditures (2500)
% %
2012-2013 2013-2014 inc/ 2014-2015 inc/
Actual Actual dec Budget dec
General 0 0 0% 246,254 0%
Federal Funds 0 0 0% 0 0%
Supplemental General 523,168 507,719 -3% 536,639 6%
At Risk (4yr Old) 0 0 0% 0 0%
At Risk (K-12) 0 0 0% 0 0%
Bilingual Education 0 0 0% 0 0%
Virtual Education 0 0 0% 0 0%
Capital Outlay 0 0 0% 20,000 0%
Driver Training 0 0 0% 0 0%
Declining Enrollment 0 0 0% 0 0%
Extraordinary School Program 0 0 0% 0 0%
Food Service 0 0 0% 0 0%
Professional Development 0 0 0% 0 0%
Parent Education Program 0 0 0% 0 0%
Summer School 0 0 0% 0 0%
Special Education 0 0 0% 0 0%
Cost of Living 0 0 0% 0 0%
Vocational Education 0 0 0% 0 0%
Gifts/Grants 0 0 0% 0 0%
Special Liability 0 0 0% 0 0%
School Retirement 0 0 0% 0 0%
Extraordinary Growth Facilities 0 0 0% 0 0%
Special Reserve 0 0 0%
KPERS Spec. Ret. Contribution 42,030 51,529 23% 73,443 43%
Contingency Reserve 168,947 0 -100%
Text Book & Student Material 0 0 0%
Activity Fund 0 0 0% 0 0%
Bond & Interest #1 0 0 0% 0 0%
Bond & Interest #2 0 0 0% 0 0%
No-Fund Warrant 0 0 0% 0 0%
Special Assessment 0 0 0% 0 0%
Temporary Note 0 0 0% 0 0%
SUBTOTAL 734,145 559,248 -24% 876,336 57%
Enrollment (FTE)* 4,645.0 4,635.0 0% 4,635.0 0%
Amount per Pupil 158 121 -24% 189 57%
Adult Education 0 0 0% 0 0%
Adult Supplemental Education 0 0 0% 0 0%
Tuition Reimbursement 0 0 0% 0 0%
Special Education Coop 0 0 0% 0 0%
TOTAL 734,145 559,248 -24% 876,336 57%
NOTE: Gifts/Grants includes private grants and grants from nonfederal sources.
Amount per pupil excludes the following funds: Adult Education, Adult Supplemental Education, Special Education Coop
and Tuition Reimbursement.
*Enrollment (FTE) includes the enrollment of the district used for state aid and budget authority, and all other preschool enrollment
and kindergarten students attending full time.
0
100,000
200,000
300,000
400,000
500,000
600,000
700,000
800,000
900,000
2012-2013 2013-2014 2014-2015
734,145
559,248
876,336
Central Services Expenditures
9/17/2014 3:20 PM Sumexpen.xlsx Page 11 of 30

USD# 253
Operations and Maintenance Expenditures (2600)
% %
2012-2013 2013-2014 inc/ 2014-2015 inc/
Actual Actual dec Budget dec
General 2,917,841 2,965,607 2% 3,037,934 2%
Federal Funds 0 0 0% 0 0%
Supplemental General 740,114 841,788 14% 935,800 11%
At Risk (4yr Old) 0 0 0% 0 0%
At Risk (K-12) 0 0 0% 0 0%
Bilingual Education 0 0 0% 0 0%
Virtual Education 0 0 0% 0 0%
Capital Outlay 3,149 5,860 86% 20,000 241%
Driver Training 0 0 0% 0 0%
Declining Enrollment 0 0 0% 0 0%
Extraordinary School Program 0 0 0% 0 0%
Food Service 105,151 128,993 23% 112,910 -12%
Professional Development 0 0 0% 0 0%
Parent Education Program 0 0 0% 0 0%
Summer School 0 0 0% 0 0%
Special Education 0 0 0% 0 0%
Cost of Living 0 0 0% 0 0%
Vocational Education 0 0 0% 0 0%
Gifts/Grants 0 0 0% 0 0%
Special Liability 0 0 0% 0 0%
School Retirement 0 0 0% 0 0%
Extraordinary Growth Facilities 0 0 0% 0 0%
Special Reserve 0 0 0%
KPERS Spec. Ret. Contribution 162,711 188,005 16% 180,542 -4%
Contingency Reserve 0 0 0%
Text Book & Student Material 0 0 0%
Activity Fund 0 0 0% 0 0%
Bond and Interest #1 0 0 0% 0 0%
Bond and Interest #2 0 0 0% 0 0%
No-Fund Warrant 0 0 0% 0 0%
Special Assessment 0 0 0% 0 0%
Temporary Note 0 0 0% 0 0%
SUBTOTAL 3,928,966 4,130,253 5% 4,287,186 4%
Enrollment (FTE)* 4,645.0 4,635.0 0% 4,635.0 0%
Amount per Pupil 846 891 5% 925 4%
Adult Education 0 0 0% 0 0%
Adult Supplemental Education 0 0 0% 0 0%
Tuition Reimbursement 0 0 0% 0 0%
Special Education Coop 1,920 2,610 36% 3,500 34%
TOTAL 3,930,886 4,132,863 5% 4,290,686 4%
NOTE: Gifts/Grants includes private grants and grants from nonfederal sources.
Amount per pupil excludes the following funds: Adult Education, Adult Supplemental Education, Special Education Coop
and Tuition Reimbursement.
*Enrollment (FTE) includes the enrollment of the district used for state aid and budget authority, and all other preschool enrollment
and kindergarten students attending full time.
3,700,000
3,800,000
3,900,000
4,000,000
4,100,000
4,200,000
4,300,000
2012-2013 2013-2014 2014-2015
3,930,886
4,132,863
4,290,686
Operations and Maintenance Expenditures
9/17/2014 3:20 PM Sumexpen.xlsx Page 12 of 30

USD# 253
Transportation Expenditures (2700)
% %
2012-2013 2013-2014 inc/ 2014-2015 inc/
Actual Actual dec Budget dec
General 1,238,700 1,297,637 5% 1,243,109 -4%
Federal Funds 2,319 12,909 457% 11,339 -12%
Supplemental General 0 0 0% 0 0%
At Risk (4yr Old) 0 138,924 0% 145,470 5%
At Risk (K-12) 128,749 6,114 -95% 0 -100%
Bilingual Education 0 0 0% 0 0%
Virtual Education 0 0 0% 0 0%
Capital Outlay 82,510 0 -100% 237,489 0%
Driver Training 0 0 0% 0 0%
Declining Enrollment 0 0 0% 0 0%
Extraordinary School Program 0 0 0% 0 0%
Food Service 0 0 0% 0 0%
Professional Development 0 0 0% 0 0%
Parent Education Program 0 0 0% 0 0%
Summer School 0 0 0% 0 0%
Special Education 347,019 329,685 -5% 408,500 24%
Cost of Living 0 0 0% 0 0%
Vocational Education 0 0 0% 0 0%
Gifts/Grants 0 0 0% 0 0%
Special Liability 0 0 0% 0 0%
School Retirement 0 0 0% 0 0%
Extraordinary Growth Facilities 0 0 0% 0 0%
Special Reserve 0 0 0%
KPERS Spec. Ret. Contribution 107,647 122,969 14% 134,432 9%
Contingency Reserve 0 0 0%
Text Book & Student Material 0 0 0%
Activity Fund 1,972 14,937 657%
Bond and Interest #1 0 0 0% 0 0%
Bond and Interest #2 0 0 0% 0 0%
No-Fund Warrant 0 0 0% 0 0%
Special Assessment 0 0 0% 0 0%
Temporary Note 0 0 0% 0 0%
SUBTOTAL 1,908,916 1,923,175 1% 2,180,339 13%
Enrollment (FTE)* 4,645.0 4,635.0 0% 4,635.0 0%
Amount per Pupil 411 415 1% 470 13%
Adult Education 0 0 0% 0 0%
Adult Supplemental Education 0 0 0% 0 0%
Tuition Reimbursement 0 0 0% 0 0%
Special Education Coop 405 0 -100% 0 0%
TOTAL 1,909,321 1,923,175 1% 2,180,339 13%
NOTE: Gifts/Grants includes private grants and grants from nonfederal sources.
Amount per pupil excludes the following funds: Adult Education, Adult Supplemental Education, Special Education Coop
and Tuition Reimbursement.
*Enrollment (FTE) includes the enrollment of the district used for state aid and budget authority, and all other preschool enrollment
and kindergarten students attending full time.
1,750,000
1,800,000
1,850,000
1,900,000
1,950,000
2,000,000
2,050,000
2,100,000
2,150,000
2,200,000
2012-2013 2013-2014 2014-2015
1,909,321 1,923,175
2,180,339
Transportation Expenditures
9/17/2014 3:20 PM Sumexpen.xlsx Page 13 of 30
USD# 253
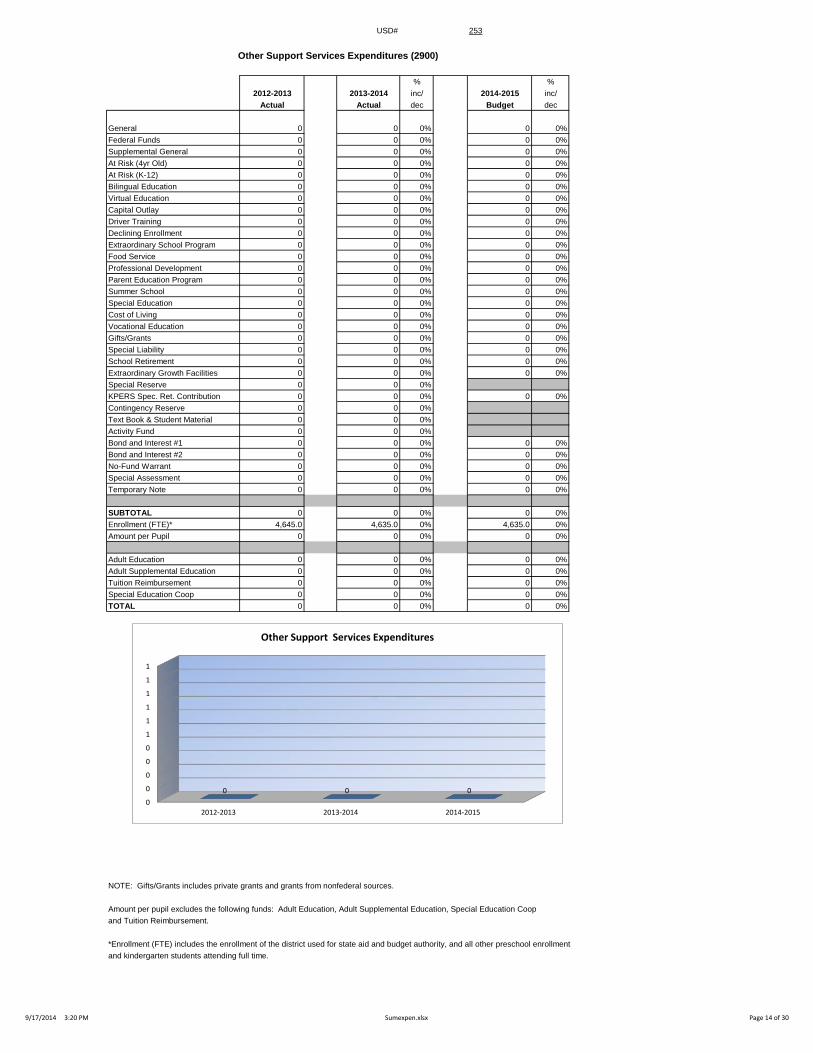
Other Support Services Expenditures (2900)
% %
2012-2013 2013-2014 inc/ 2014-2015 inc/
Actual Actual dec Budget dec
General 0 0 0% 0 0%
Federal Funds 0 0 0% 0 0%
Supplemental General 0 0 0% 0 0%
At Risk (4yr Old) 0 0 0% 0 0%
At Risk (K-12) 0 0 0% 0 0%
Bilingual Education 0 0 0% 0 0%
Virtual Education 0 0 0% 0 0%
Capital Outlay 0 0 0% 0 0%
Driver Training 0 0 0% 0 0%
Declining Enrollment 0 0 0% 0 0%
Extraordinary School Program 0 0 0% 0 0%
Food Service 0 0 0% 0 0%
Professional Development 0 0 0% 0 0%
Parent Education Program 0 0 0% 0 0%
Summer School 0 0 0% 0 0%
Special Education 0 0 0% 0 0%
Cost of Living 0 0 0% 0 0%
Vocational Education 0 0 0% 0 0%
Gifts/Grants 0 0 0% 0 0%
Special Liability 0 0 0% 0 0%
School Retirement 0 0 0% 0 0%
Extraordinary Growth Facilities 0 0 0% 0 0%
Special Reserve 0 0 0%
KPERS Spec. Ret. Contribution 0 0 0% 0 0%
Contingency Reserve 0 0 0%
Text Book & Student Material 0 0 0%
Activity Fund 0 0 0%
Bond and Interest #1 0 0 0% 0 0%
Bond and Interest #2 0 0 0% 0 0%
No-Fund Warrant 0 0 0% 0 0%
Special Assessment 0 0 0% 0 0%
Temporary Note 0 0 0% 0 0%
SUBTOTAL 0 0 0% 0 0%
Enrollment (FTE)* 4,645.0 4,635.0 0% 4,635.0 0%
Amount per Pupil 0 0 0% 0 0%
Adult Education 0 0 0% 0 0%
Adult Supplemental Education 0 0 0% 0 0%
Tuition Reimbursement 0 0 0% 0 0%
Special Education Coop 0 0 0% 0 0%
TOTAL 0 0 0% 0 0%
NOTE: Gifts/Grants includes private grants and grants from nonfederal sources.
Amount per pupil excludes the following funds: Adult Education, Adult Supplemental Education, Special Education Coop
and Tuition Reimbursement.
*Enrollment (FTE) includes the enrollment of the district used for state aid and budget authority, and all other preschool enrollment
and kindergarten students attending full time.
0
0
0
0
0
1
1
1
1
1
1
2012-2013 2013-2014 2014-2015
0 0 0
Other Support Services Expenditures
9/17/2014 3:20 PM Sumexpen.xlsx Page 14 of 30

USD# 253
Food Services Expenditures (3100)
% %
2012-2013 2013-2014 inc/ 2014-2015 inc/
Actual Actual dec Budget dec
General 0 0 0% 0 0%
Federal Funds 0 0 0% 0 0%
Supplemental General 0 0 0% 0 0%
At Risk (4yr Old) 0 0 0% 0 0%
At Risk (K-12) 0 0 0% 0 0%
Bilingual Education 0 0 0% 0 0%
Virtual Education 0 0 0% 0 0%
Capital Outlay 0 0 0% 0 0%
Driver Training 0 0 0% 0 0%
Declining Enrollment 0 0 0% 0 0%
Extraordinary School Program 0 0 0% 0 0%
Food Service 2,287,921 2,199,961 -4% 2,333,375 6%
Professional Development 0 0 0% 0 0%
Parent Education Program 0 0 0% 0 0%
Summer School 0 0 0% 0 0%
Special Education 0 0 0% 0 0%
Cost of Living 0 0 0% 0 0%
Vocational Education 0 0 0% 0 0%
Gifts/Grants 0 0 0% 0 0%
Special Liability 0 0 0% 0 0%
School Retirement 0 0 0% 0 0%
Extraordinary Growth Facilities 0 0 0% 0 0%
Special Reserve 0 0 0%
KPERS Spec. Ret. Contribution 84,299 90,760 8% 99,003 9%
Contingency Reserve 0 0 0%
Text Book & Student Material 0 0 0%
Activity Fund 0 0 0%
Bond and Interest #1 0 0 0% 0 0%
Bond and Interest #2 0 0 0% 0 0%
No-Fund Warrant 0 0 0% 0 0%
Special Assessment 0 0 0% 0 0%
Temporary Note 0 0 0% 0 0%
SUBTOTAL 2,372,220 2,290,721 -3% 2,432,378 6%
Enrollment (FTE)* 4,645.0 4,635.0 0% 4,635.0 0%
Amount per Pupil 511 494 -3% 525 6%
Adult Education 0 0 0% 0 0%
Adult Supplemental Education 0 0 0% 0 0%
Tuition Reimbursement 0 0 0% 0 0%
Special Education Coop 0 0 0% 0 0%
TOTAL 2,372,220 2,290,721 -3% 2,432,378 6%
NOTE: Gifts/Grants includes private grants and grants from nonfederal sources.
Amount per pupil excludes the following funds: Adult Education, Adult Supplemental Education, Special Education Coop
and Tuition Reimbursement.
*Enrollment (FTE) includes the enrollment of the district used for state aid and budget authority, and all other preschool enrollment
and kindergarten students attending full time.
2,200,000
2,250,000
2,300,000
2,350,000
2,400,000
2,450,000
2012-2013 2013-2014 2014-2015
2,372,220
2,290,721
2,432,378
Food Service Expenditures
9/17/2014 3:20 PM Sumexpen.xlsx Page 15 of 30

USD# 253
Community Services Operations (3300)
% % chart and graph checked
2012-2013 2013-2014 inc/ 2014-2015 inc/
Actual Actual dec Budget dec
General 0 0 0% 0 0%
Federal Funds 0 0 0% 0 0%
Supplemental General 0 0 0% 0 0%
At Risk (4yr Old) 0 0 0% 0 0%
At Risk (K-12) 0 0 0% 0 0%
Bilingual Education 0 0 0% 0 0%
Virtual Education 0 0 0% 0 0%
Capital Outlay 0 0 0% 0 0%
Driver Training 0 0 0% 0 0%
Declining Enrollment 0 0 0% 0 0%
Extraordinary School Program 0 0 0% 0 0%
Food Service 0 0 0% 0 0%
Professional Development 0 0 0% 0 0%
Parent Education Program 0 0 0% 0 0%
Summer School 0 0 0% 0 0%
Special Education 0 0 0% 0 0%
Cost of Living 0 0 0% 0 0%
Vocational Education 0 0 0% 0 0%
Gifts/Grants 0 0 0% 0 0%
Special Liability 0 0 0% 0 0%
School Retirement 0 0 0% 0 0%
Extraordinary Growth Facilities 0 0 0% 0 0%
Special Reserve 0 0 0%
KPERS Spec. Ret. Contribution 0 0 0% 0 0%
Contingency Reserve 0 0 0%
Text Book & Student Material 0 0 0%
Activity Fund 0 0 0% 0 0%
Bond and Interest #1 0 0 0% 0 0%
Bond and Interest #2 0 0 0% 0 0%
No-Fund Warrant 0 0 0% 0 0%
Special Assessment 0 0 0% 0 0%
Temporary Note 0 0 0% 0 0%
SUBTOTAL 0 0 0% 0 0%
Enrollment (FTE)* 4,645.0 4,635.0 0% 4,635.0 0%
Amount per Pupil 0 0 0% 0 0%
Adult Education 0 0 0% 0 0%
Adult Supplemental Education 0 0 0% 0 0%
Tuition Reimbursement 0 0 0% 0 0%
Special Education Coop 0 0 0% 0 0%
TOTAL 0 0 0% 0 0%
NOTE: Gifts/Grants includes private grants and grants from nonfederal sources.
Amount per pupil excludes the following funds: Adult Education, Adult Supplemental Education, Special Education Coop
and Tuition Reimbursement.
*Enrollment (FTE) includes the enrollment of the district used for state aid and budget authority, and all other preschool enrollment
and kindergarten students attending full time.
0
0
0
0
0
1
1
1
1
1
1
2012-2013 2013-2014 2014-2015
0 0 0
Community Services Operations (3300)
9/17/2014 3:20 PM Sumexpen.xlsx Page 16 of 30

USD# 253
Capital Improvements Expenditures (4000)
% %
2012-2013 2013-2014 inc/ 2014-2015 inc/
Actual Actual dec Budget dec
General 0 0 0% 0 0%
Federal Funds 0 0 0% 0 0%
Supplemental General 7,040 350 -95% 37,953 10744%
At Risk (4yr Old) 0 0 0% 0 0%
At Risk (K-12) 0 0 0% 0 0%
Bilingual Education 0 0 0% 0 0%
Virtual Education 0 0 0% 0 0%
Capital Outlay 41,924 70,224 68% 850,000 1110%
Driver Training 0 0 0% 0 0%
Declining Enrollment 0 0 0% 0 0%
Extraordinary School Program 0 0 0% 0 0%
Food Service 0 0 0% 0 0%
Professional Development 0 0 0% 0 0%
Parent Education Program 0 0 0% 0 0%
Summer School 0 0 0% 0 0%
Special Education 0 0 0% 0 0%
Cost of Living 0 0 0% 0 0%
Vocational Education 0 0 0% 0 0%
Gifts/Grants 0 0 0% 0 0%
Special Liability 0 0 0% 0 0%
School Retirement 0 0 0% 0 0%
Extraordinary Growth Facilities 0 0 0% 0 0%
Special Reserve 0 0 0%
KPERS Spec. Ret. Contribution 0 0 0% 0 0%
Contingency Reserve 0 0 0%
Text Book & Student Material 0 0 0%
Activity Fund 0 0 0% 0 0%
Bond and Interest #1 0 0 0% 0 0%
Bond and Interest #2 0 0 0% 0 0%
No-Fund Warrant 0 0 0% 0 0%
Special Assessment 0 0 0% 0 0%
Temporary Note 0 0 0% 0 0%
SUBTOTAL 48,964 70,574 44% 887,953 1158%
Enrollment (FTE)* 4,645.0 4,635.0 0% 4,635.0 0%
Amount per Pupil 11 15 44% 192 1158%
Adult Education 0 0 0% 0 0%
Adult Supplemental Education 0 0 0% 0 0%
Tuition Reimbursement 0 0 0% 0 0%
Special Education Coop 0 0 0% 0 0%
TOTAL 48,964 70,574 44% 887,953 1158%
NOTE: Gifts/Grants includes private grants and grants from nonfederal sources.
Amount per pupil excludes the following funds: Adult Education, Adult Supplemental Education, Special Education Coop
and Tuition Reimbursement.
*Enrollment (FTE) includes the enrollment of the district used for state aid and budget authority, and all other preschool enrollment
and kindergarten students attending full time.
0
100,000
200,000
300,000
400,000
500,000
600,000
700,000
800,000
900,000
2012-2013 2013-2014 2014-2015
48,964 70,574
887,953
Capital Improvements (4000)
9/17/2014 3:20 PM Sumexpen.xlsx Page 17 of 30

USD# 253
Debt Services Expenditures (5100)
% %
2012-2013 2013-2014 inc/ 2014-2015 inc/
Actual Actual dec Budget dec
General 0 0 0% 0 0%
Federal Funds 0 0 0% 0 0%
Supplemental General 0 0 0% 0 0%
At Risk (4yr Old) 0 0 0% 0 0%
At Risk (K-12) 0 0 0% 0 0%
Bilingual Education 0 0 0% 0 0%
Virtual Education 0 0 0% 0 0%
Capital Outlay 497,946 509,173 2% 530,000 4%
Driver Training 0 0 0% 0 0%
Declining Enrollment 0 0 0% 0 0%
Extraordinary School Program 0 0 0% 0 0%
Food Service 0 0 0% 0 0%
Professional Development 0 0 0% 0 0%
Parent Education Program 0 0 0% 0 0%
Summer School 0 0 0% 0 0%
Special Education 0 0 0% 0 0%
Cost of Living 0 0 0% 0 0%
Vocational Education 0 0 0% 0 0%
Gifts/Grants 0 0 0% 0 0%
Special Liability 0 0 0% 0 0%
School Retirement 0 0 0% 0 0%
Extraordinary Growth Facilities 0 0 0% 0 0%
Special Reserve 0 0 0%
KPERS Spec. Ret. Contribution 0 0 0% 0 0%
Contingency Reserve 0 0 0%
Text Book & Student Material 0 0 0%
Activity Fund 0 0 0% 0 0%
Bond and Interest #1 3,345,342 2,955,313 -12% 3,195,613 8%
Bond and Interest #2 0 0 0% 0 0%
No-Fund Warrant 0 0 0% 0 0%
Special Assessment 0 0 0% 0 0%
Temporary Note 0 0 0% 0 0%
SUBTOTAL 3,843,288 3,464,486 -10% 3,725,613 8%
Enrollment (FTE)* 4,645.0 4,635.0 0% 4,635.0 0%
Amount per Pupil 827 747 -10% 804 8%
Adult Education 0 0 0% 0 0%
Adult Supplemental Education 0 0 0% 0 0%
Tuition Reimbursement 0 0 0% 0 0%
Special Education Coop 0 0 0% 0 0%
TOTAL 3,843,288 3,464,486 -10% 3,725,613 8%
NOTE: Gifts/Grants includes private grants and grants from nonfederal sources.
Amount per pupil excludes the following funds: Adult Education, Adult Supplemental Education, Special Education Coop
and Tuition Reimbursement.
*Enrollment (FTE) includes the enrollment of the district used for state aid and budget authority, and all other preschool enrollment
and kindergarten students attending full time.
3,200,000
3,300,000
3,400,000
3,500,000
3,600,000
3,700,000
3,800,000
3,900,000
2012-2013 2013-2014 2014-2015
3,843,288
3,464,486
3,725,613
Deb Services (5100)
9/17/2014 3:20 PM Sumexpen.xlsx Page 18 of 30

USD# 253
Transfers (5200)
% %
2012-2013 2013-2014 inc/ 2014-2015 inc/
Actual Actual dec Budget dec
General 12,564,796 11,994,169 -5% 11,554,917 -4%
Federal Funds 0 0 0% 0 0%
Supplemental General 512,946 314,312 -39% 205,119 -35%
At Risk (4yr Old) 0 0 0% 0 0%
At Risk (K-12) 0 0 0% 0 0%
Bilingual Education 0 0 0% 0 0%
Virtual Education 0 0 0% 25,000 0%
Capital Outlay
Driver Training 0 0 0% 0 0%
Declining Enrollment 0 0 0% 0 0%
Extraordinary School Program 0 0 0% 0 0%
Food Service 0 0 0% 0 0%
Professional Development 0 0 0% 0 0%
Parent Education Program 0 0 0% 0 0%
Summer School 100,000 0 -100% 0 0%
Special Education 0 0 0% 0 0%
Cost of Living 0 0 0% 0 0%
Vocational Education 0 0 0% 0 0%
Gifts/Grants 0 0 0% 0 0%
Special Liability 0 0 0% 0 0%
School Retirement 0 0 0% 0 0%
Extraordinary Growth Facilities 0 0 0% 0 0%
Special Reserve 0 0 0%
KPERS Spec. Ret. Contribution 0 0 0% 0 0%
Contingency Reserve 0 0 0% 0 0%
Text Book & Student Material 0 0 0% 0 0%
Activity Fund 0 0 0% 0 0%
Bond and Interest #1 0 0 0% 0 0%
Bond and Interest #2 0 0 0% 0 0%
No-Fund Warrant 0 0 0% 0 0%
Special Assessment 0 0 0% 0 0%
Temporary Note 0 0 0% 0 0%
SUBTOTAL 13,177,742 12,308,481 -7% 11,785,036 -4%
Enrollment (FTE)* 4,645.0 4,635.0 0% 4,635.0 0%
Amount per Pupil 2,837 2,656 -6% 2,543 -4%
Adult Education 0 0 0% 0 0%
Adult Supplemental Education 0 0 0% 0 0%
Tuition Reimbursement 0 0 0% 0 0%
Special Education Coop 0 0 0% 0 0%
TOTAL 13,177,742 12,308,481 -7% 11,785,036 -4%
NOTE: Gifts/Grants includes private grants and grants from nonfederal sources.
Amount per pupil excludes the following funds: Adult Education, Adult Supplemental Education, Special Education Coop
and Tuition Reimbursement.
*Enrollment (FTE) includes the enrollment of the district used for state aid and budget authority, and all other preschool enrollment
and kindergarten students attending full time.
11,000,000
11,500,000
12,000,000
12,500,000
13,000,000
13,500,000
2012-2013 2013-2014 2014-2015
13,177,742
12,308,481
11,785,036
Transfers (5200)
9/17/2014 3:20 PM Sumexpen.xlsx Page 19 of 30

USD# 253
Miscellaneous Information
Unencumbered Cash Balance by Fund
July 1, 2012 July 1, 2013 July 1, 2014
General 0 0 0
Federal Funds -193,322 -211,950 -145,272
Supplemental General 239,596 115,929 311,492
At Risk (4yr Old) 100,000 100,000 50,000
At Risk (K-12) 100,000 100,000 100,000
Bilingual Education 100,000 100,000 50,000
Virtual Education 0 50,000 46,455
Capital Outlay 2,309,867 2,468,936 2,079,078
Driver Training 0 0 0
Declining Enrollment 0 0 0
Extraordinary School Program 243,077 242,164 71,881
Food Service 324,481 254,080 219,291
Professional Development 450,183 450,969 355,049
Parent Education Program 0 0 0
Summer School 211,277 105,042 100,285
Special Education 1,640,762 1,679,225 1,358,339
Cost of Living 0 0 0
Vocational Education 100,000 105,060 17,891
Gifts/Grants 97,236 69,454 50,581
Special Liability 0 0 0
School Retirement 0 0 0
Extraordinary Growth Facilities 0 0 0
Special Reserve 0 0 0
KPERS Spec. Ret. Contribution 0 0 0
Contingency Reserve 2,106,814 1,937,867 1,937,867
Text Book & Student Material 272,681 407,682 411,682
Activity Fund 41,381 34,214 38,605
Bond and Interest #1 2,132,437 2,112,909 2,454,298
Bond and Interest #2 0 0 0
No Fund Warrant 0 0 0
Special Assessment 0 0 0
Temporary Note 0 0 0
SUBTOTAL 10,276,470 10,121,581 9,507,522
Enrollment (FTE)* 4,645.0 4,635.0 4,635.0
Amount per Pupil 2,212 2,184 2,051
Adult Education 0 1,591 3,241
Adult Supplemental Education 0 0 0
Tuition Reimbursement 0 0 0
Special Education Coop 881,870 516,608 314,002
TOTAL 11,158,340 10,639,780 9,824,765
NOTE: Gifts/Grants includes private grants and grants from nonfederal sources.
Amount per pupil excludes the following funds: Adult Education, Adult Supplemental Education, Special Education Coop
and Tuition Reimbursement.
*Enrollment (FTE) includes the enrollment of the district used for state aid and budget authority, and all other preschool enrollment
and kindergarten students attending full time.
0
2,000,000
4,000,000
6,000,000
8,000,000
10,000,000
12,000,000
July 1, 2012 July 1, 2013 July 1, 2014
11,158,340 10,639,780
9,824,765
Unencumbered Cash Balances by Fund
9/17/2014 3:20 PM Sumexpen.xlsx Page 20 of 30

USD# 253
Reserve Funds
Unencumbered Cash Balance
July 1, 2012 July 1, 2013 July 1, 2014
Special Reserve 0 0 0
TOTAL OTHER 0 0 0
Amount per Pupil $0 $0 $0
*School districts are authorized by law to self insure rather than purchase insurance for the following categories: Worker's Comp,
Health Insurance, Life Insurance, Property and Casualty (Risk Management) and Disability Income Insurance. Monies are placed
in the Self Insured Fund to pay for claims which may arise from the categories listed above.
0
0
0
0
0
1
1
1
1
1
1
July 1, 2012 July 1, 2013 July 1, 2014
0 0 0
Unencumbered Cash Balances by Fund (Reserve Funds Only)
9/17/2014 3:20 PM Sumexpen.xlsx Page 21 of 30
USD# 253
2010-2011 2011-2012 % 2012-2013 % 2013-2014 % 2014-2015 %
Actual Actual inc/ Actual inc/ Actual inc/ Budget inc/
dec dec dec dec
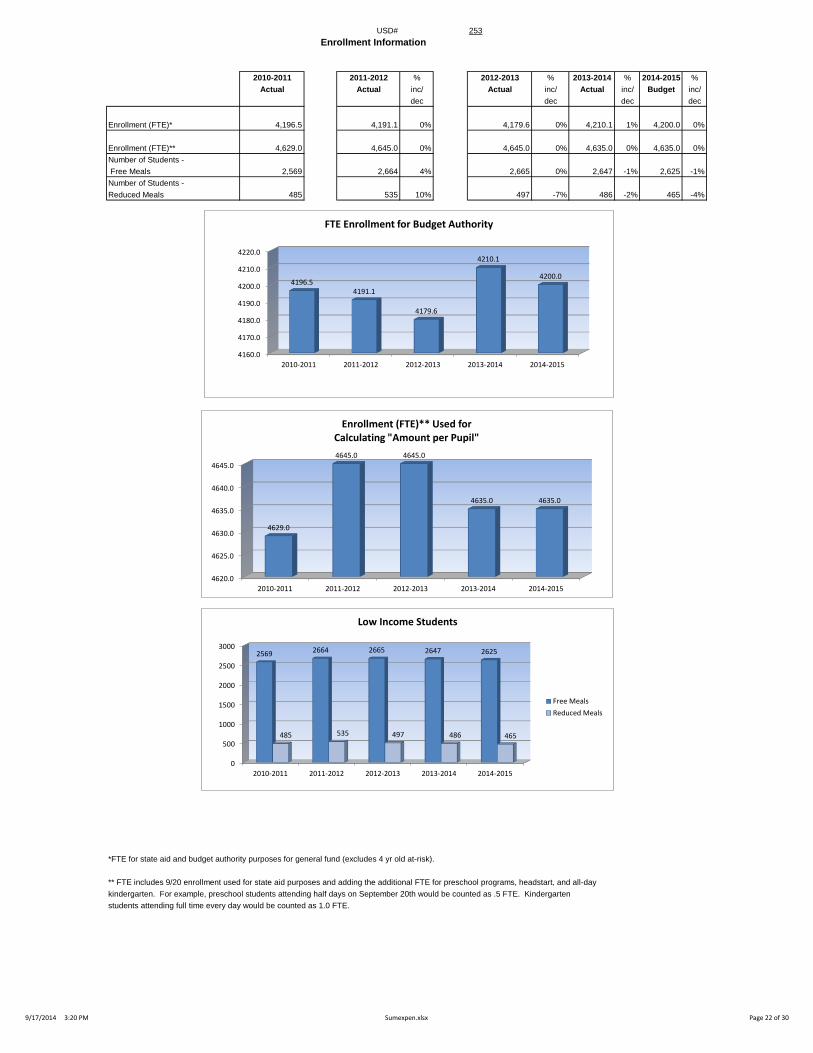
Enrollment (FTE)* 4,196.5 4,191.1 0% 4,179.6 0% 4,210.1 1% 4,200.0 0%
Enrollment (FTE)** 4,629.0 4,645.0 0% 4,645.0 0% 4,635.0 0% 4,635.0 0%
Number of Students -
Free Meals 2,569 2,664 4% 2,665 0% 2,647 -1% 2,625 -1%
Number of Students -
Reduced Meals 485 535 10% 497 -7% 486 -2% 465 -4%
*FTE for state aid and budget authority purposes for general fund (excludes 4 yr old at-risk).
** FTE includes 9/20 enrollment used for state aid purposes and adding the additional FTE for preschool programs, headstart, and all-day
kindergarten. For example, preschool students attending half days on September 20th would be counted as .5 FTE. Kindergarten
students attending full time every day would be counted as 1.0 FTE.
Enrollment Information
4620.0
4625.0
4630.0
4635.0
4640.0
4645.0
2010-2011 2011-2012 2012-2013 2013-2014 2014-2015
4629.0
4645.0 4645.0
4635.0 4635.0
Enrollment (FTE)** Used for Calculating "Amount per Pupil"
0
500
1000
1500
2000
2500
3000
2010-2011 2011-2012 2012-2013 2013-2014 2014-2015
2569 2664 2665 2647 2625
485 535 497 486 465
Low Income Students
Free Meals
Reduced Meals
4160.0
4170.0
4180.0
4190.0
4200.0
4210.0
4220.0
2010-2011 2011-2012 2012-2013 2013-2014 2014-2015
4196.5 4191.1
4179.6
4210.1
4200.0
FTE Enrollment for Budget Authority
9/17/2014 3:20 PM Sumexpen.xlsx Page 22 of 30

USD# 253
Miscellaneous Information
Mill Rates by Fund
2012-2013 2013-2014 2014-2015
Actual Actual Budget
General 20.000 20.000 20.000
Supplemental General 22.480 24.022 15.693
Adult Education 0.500 0.000 0.500
Capital Outlay 0.000 0.000 4.000
Declining Enrollment 0.000 0.000 0.000
Cost of Living 0.000 0.000 0.000
Special Liability 0.000 0.000 0.000
School Retirement 0.000 0.000 0.000
Extraordinary Growth Facilities 0.000 0.000 0.000
Bond and Interest #1 10.033 9.585 13.404
Bond and Interest #2 0.000 0.000 0.000
No Fund Warrant 0.000 0.000 0.000
Special Assessment 0.000 0.000 0.000
Temporary Note 0.000 0.000 0.000
TOTAL USD 53.013 53.607 53.597
Historical Museum 0.000 0.000 0.000
Public Library Board 0.000 0.000 0.000
Public Library Brd & Emp Benf 0.000 0.000 0.000
Recreation Commission 6.500 6.500 6.500
Rec Comm Employee Bnfts 0.890 1.274 1.273
TOTAL OTHER 7.390 7.774 7.773
0.000
10.000
20.000
30.000
40.000
50.000
60.000
70.000
80.000
2012-2013 2013-2014 2014-2015
53.013 53.607 53.597
Total USD Mill Rates
General 37%
Supplemental General 29%
Adult Education 1%
Capital Outlay 8%
Bond and Interest #1
25%
2014-15 Miscellaneous Information Mill Rates by Fund (Total USD)
General
Supplemental General
Adult Education
Capital Outlay
Special Liability
School Retirement
Declining Enrollment
Cost of Living
Bond and Interest #1
Bond and Interest #2
Extraordinary Growth Facilities
No Fund Warrant
Special Assessment
Temporary Note
9/17/2014 3:20 PM Sumexpen.xlsx Page 23 of 30

USD# 253
Other Information
2012-2013 2013-2014 2014-2015
Actual Actual Budget
Assessed Valuation $167,747,311 $171,045,128 $173,742,248
Bonded Indebtedness $25,275,000 $22,800,000 $20,640,000
$164,000,000
$165,000,000
$166,000,000
$167,000,000
$168,000,000
$169,000,000
$170,000,000
$171,000,000
$172,000,000
$173,000,000
$174,000,000
2012-2013 2013-2014 2014-2015
$167,747,311
$171,045,128
$173,742,248
Assessed Valuation
$0
$5,000,000
$10,000,000
$15,000,000
$20,000,000
$25,000,000
$30,000,000
2012-2013 2013-2014 2014-2015
$25,275,000
$22,800,000 $20,640,000
Bonded Indebtedness
9/17/2014 3:20 PM Sumexpen.xlsx Page 24 of 30

USD 253
2014-15 Estimated Sources of Revenue--2014-15 Estimated
Amount July 1, 2014 State Federal Local July 1, 2015
Fund Budgeted Cash Balance Interest Transfers Other Cash Balance
General 28,819,470 0 28,794,470 0 25,000 0 XXXXXXXX
Supplemental General 9,894,012 311,492 6,534,006 3,048,514 XXXXXXXX
Adult Education 101,419 3,241 0 0 0 15000 83,178 0
At Risk (4yr Old) 554,200 50,000 0 0 504,200 0 0
Adult Supplemental Education 0 0 0 0 0 0
At Risk (K-12) 5,672,455 100,000 0 0 5,572,455 0 0
Bilingual Education 1,840,970 50,000 0 0 1,790,970 0 0
Virtual Education 66,871 46,455 0 20,416 0 0
Capital Outlay 3,062,035 2,079,078 361,384 0 10,000 0 611,573 0
Driver Training 0 0 0 0 0 0 0 0
Declining Enrollment 0 0 0 0 XXXXXXXX
Extraordinary School Program 193,000 71,881 0 0 118,119 3,000 0
Food Service 2,446,285 219,291 21,455 1,665,616 0 0 539,923 0
Professional Development 355,049 355,049 0 0 0 0 0
Parent Education Program 0 0 0 0 0 0 0 0
Summer School 100,285 100,285 0 0 0 0 0
Special Education 4,710,215 1,358,339 0 0 0 3,351,876 0 0
Vocational Education 451,891 17,891 0 47,000 0 387,000 0 0
Special Liability Expense Fund 0 0 0 0 0
Special Reserve Fund 0 XXXXXXXX
Gifts and Grants 80,581 50,581 30,000 0
Textbook & Student Materials Revolving 411,682 XXXXXXXX
School Retirement 0 0 0 0 0
Extraordinary Growth Facilities 0 0 0 0 XXXXXXXXX
KPERS Special Retirement Contribution 4,136,376 0 4,136,376 XXXXXXXXX
Contingency Reserve 1,937,867 XXXXXXXXX
Activity Funds 38,605 XXXXXXXXX
Tuition Reimbursement 0 0 0 0 0
Bond and Interest #1 3,195,613 2,454,298 1,661,719 0 0 2,350,535 3,270,939
Bond and Interest #2 0 0 0 0 0 0 0
No Fund Warrant 0 0 0 0
Special Assessment 0 0 0 0
Temporary Note 0 0 0 0 0
Coop Special Education 9,827,725 314,002 0 2,168,459 0 7,345,264 0
Federal Funds 2,480,376 -145,272 xxxxxxxxxxx 2,625,648 xxxxxxxxxxxx xxxxxxxxxxxx xxxxxxxxxxx 0
Cost of Living 0 0 xxxxxxxxxxx xxxxxxxxxxx xxxxxxxxxxxx 0 0 XXXXXXXXX
SUBTOTAL 77,988,828 9,824,765 41,509,410 6,506,723 10,000 11,785,036 14,011,987 3,270,939
Less Transfers 11,785,036
TOTAL Budget Expenditures $66,203,792
2012-2013 2013-2014 2014-2015
State Revenues 34,794,914 35,305,243 41,509,410
Federal Revenues 6,039,710 7,298,284 6,506,723
Local Revenues 29,945,223 30,010,524 25,807,023
Total Revenues 70,779,847 72,614,051 73,823,156
Revenues Per Pupil 15,238 15,666 15,927
Sources of Revenue and Proposed Budget for 2014-15
Sources of Revenue - - State, Federal, Local

USD 253 - Emporia - Summary
0
5,000,000
10,000,000
15,000,000
20,000,000
25,000,000
30,000,000
35,000,000
40,000,000
Summary of Total Expenditures by Function (All Funds)
0
2,000,000
4,000,000
6,000,000
8,000,000
10,000,000
12,000,000
14,000,000
16,000,000
General and Supplemental General Fund Expenditures by Function
31,000,000
32,000,000
33,000,000
34,000,000
35,000,000
36,000,000
37,000,000
38,000,000
39,000,000
40,000,000
2012-2013 2013-2014 2014-2015
Instruction Expenditures
4160.0
4170.0
4180.0
4190.0
4200.0
4210.0
4220.0
2010-2011 2011-2012 2012-2013 2013-2014 2014-2015
FTE Enrollment for Budget Authority
0.0002.0004.0006.0008.000
10.00012.00014.00016.00018.00020.000
2014-2015 Mill Levies by Fund
010,00020,00030,00040,00050,00060,00070,00080,00090,000
100,000
Average Salary
0.000
10.000
20.000
30.000
40.000
50.000
60.000
70.000
80.000
2012-2013 2013-2014 2014-2015
Total USD Mill Rates
0
2,000
4,000
6,000
8,000
10,000
12,000
14,000
16,000
Amount Per Pupil By Function (All Funds)

Intentionally left blank

Intentionally left blank

Intentionally left blank

Intentionally left blank