On-line measurement of uranium in ores using XRF … activity of uranium-containing liquid and...
29
On-line measurement of uranium in ores using XRF analyzer P2 Con-X D. Docenko, V. Gostilo, A. Sokolov, A. Rozite Bruker Baltic, LV-1005, Riga, Latvia E-mail address of main author:[email protected] Abstract. We describe various possibilities of application of the conveyor belt X-ray fluorescence (XRF) analyzer P2 Con-X for on-line analysis of uranium in various raw materials. Quantitative analysis is shown to be possible from 100 ppm up to 80% of uranium and more. Specific examples are given. Rapid ore separation based on uranium composition is also possible with P2 Con-X. 1. Introduction It is known, that activity of uranium raw materials is rather low - several hundred quanta per second at 2-4% enrichment [1][2]. On this reason, equipment for control of such materials by natural radioactivity should be very sensitive. In [3] we reported about development of high sensitive HPGe gamma-spectrometer with high energy resolution which provides control of the equitable distribution of uranium in mixed powders and tablets before putting them into fuel rods and the final quality inspection of the completed fuel rods. High sensitivity gamma spectrometers [3][4][5] can also be used for technological controls on the natural activity of uranium-containing liquid and gaseous flows for the intermediate stages of the uranium raw materials reprocessing. X-Ray fluorescence analysis (XRF) is another technique which can be used for control of uranium raw materials. The on-line XRF analysis is currently a rapidly developing field thanks to recent technological and computational advances that allows use of the traditional, well-tested techniques in harsh industrial conditions [6]. Nowadays, on-line XRF analysis offers: - simultaneous measurement of concentrations of many elements (up to 20 and more); - quantitative analysis from tens of ppm to 95% and more; - sub-percent analysis precision and accuracy; - non-contact analysis that does not disturb the material stream; - high representativity of the analysis; - measurement time from tens of milliseconds to several minutes; - operation in a wide range of external conditions; - safety and simplicity in operation and service. On-line analysis of material composition becomes possible only if the results are independent on variations of external parameters, such as temperature and humidity of the analyzed material and the analyzer environment, variations of the material lump size and height, etc. The P2 Con-X 02 analyzer has been created accounting for all these features [7]. Its probe is situated in a hermetic enclosure with stabilized temperature inside the detection system that ensures reliable measurement results at most environmental conditions (Fig.1). Specially designed software uses the
Transcript of On-line measurement of uranium in ores using XRF … activity of uranium-containing liquid and...
On-line measurement of uranium in ores using XRF analyzer P2
Con-X
D. Docenko, V. Gostilo, A. Sokolov, A. Rozite
Bruker Baltic, LV-1005, Riga, Latvia
E-mail address of main author:[email protected]
Abstract. We describe various possibilities of application of the conveyor belt X-ray fluorescence (XRF)
analyzer P2 Con-X for on-line analysis of uranium in various raw materials.
Quantitative analysis is shown to be possible from 100 ppm up to 80% of uranium and more. Specific examples are given. Rapid ore separation based on uranium composition is also possible with P2 Con-X.
1. Introduction
It is known, that activity of uranium raw materials is rather low - several hundred quanta per second at 2-4% enrichment [1][2]. On this reason, equipment for control of such materials by natural
radioactivity should be very sensitive.
In [3] we reported about development of high sensitive HPGe gamma-spectrometer with high energy resolution which provides control of the equitable distribution of uranium in mixed powders and
tablets before putting them into fuel rods and the final quality inspection of the completed fuel rods.
High sensitivity gamma spectrometers [3][4][5] can also be used for technological controls on the natural activity of uranium-containing liquid and gaseous flows for the intermediate stages of the
uranium raw materials reprocessing.
X-Ray fluorescence analysis (XRF) is another technique which can be used for control of uranium raw materials. The on-line XRF analysis is currently a rapidly developing field thanks to recent
technological and computational advances that allows use of the traditional, well-tested techniques in
harsh industrial conditions [6]. Nowadays, on-line XRF analysis offers:
- simultaneous measurement of concentrations of many elements (up to 20 and more);
- quantitative analysis from tens of ppm to 95% and more;
- sub-percent analysis precision and accuracy; - non-contact analysis that does not disturb the material stream;
- high representativity of the analysis;
- measurement time from tens of milliseconds to several minutes;
- operation in a wide range of external conditions; - safety and simplicity in operation and service.
On-line analysis of material composition becomes possible only if the results are independent on
variations of external parameters, such as temperature and humidity of the analyzed material and the analyzer environment, variations of the material lump size and height, etc.
The P2 Con-X 02 analyzer has been created accounting for all these features [7]. Its probe is situated
in a hermetic enclosure with stabilized temperature inside the detection system that ensures reliable measurement results at most environmental conditions (Fig.1). Specially designed software uses the

X-ray spectra to account for changes in the distance to the measured material, thus providing the user
with the correct results irrespectively of the material flow level. Variations in the humidity levels are
also accounted for, if they are found to affect the measurement results.
FIG. 1. On-line analyzer P2 Con-X 02 in operation.
2. Analysis of uranium as trace element
Uranium is rather widely distributed as a trace element with an average crust content around 1.8 ppm,
but for economically effective beneficiation much higher uranium concentrations are needed.
The P2 Con-X on-line XRF analyzer is able to detect and estimate uranium content in various
materials, even if it is only moderately concentrated compared to the average crust composition.
For example, in five minutes of measurement, Th and U spectral lines are clearly visible in a rutile sample (consisting of mostly TiO2 sand), where the uranium concentration is of the order of 100 ppm
(Fig.2). The detection limit in this case is about 60 ppm. Also in other sample types (e.g., in zircon,
ZrSiO4) detection limits are roughly the same.

FIG. 2. Rutile XRF spectrum showing main components (left) and trace elements, including Th and U (right).

To collect this spectrum, an XFlash® SDD detector was used (P2 Con-X 02 analyzer modification).
Its excellent energy resolution and throughput significantly increases the signal-to-noise ratio at fixed
measurement time. In its turn, this increases sensitivity to the trace elements, including uranium.
3. Analysis of uranium as a minor element
Normally, uranium ores, even before beneficiation contain much higher amount of U, typically at least 0.1%, or 1 000 ppm. Measurement of U concentration with the P2 Con-X analyzer in this case
becomes both faster and more accurate.
For example, in monazite ores, uranium content is typically about 0.2%, but amount of thorium may reach up to 4-7%. An XRF spectrum of such monazite ore is shown on the Fig. 3.
Fe
La, Ce, Pr, Nd
Th
U
Y La
Th
ThMo
Ce
Pr Nd
Energy of photons
FIG. 3. XRF spectrum of a monazite ore sample.
In this measurement, a Si(Li) detector was used (P2 Con-X 01 modification) to enhance high-energy detection efficiency needed for analysis of rare-earth elements (La, Ce, Pr, Nd, etc.) using their K-
series lines.
Despite inferior energy resolution of the Si(Li) detectors, the uranium XRF lines are clearly visible besides much stronger Th lines. Their partial overlap does not affect significantly the analysis
precision thanks to use of a spectral deconvolution algorithm in the software.
Despite presence of strong neighboring Th lines, high quality of the analysis is reached. The U measurement precision is about 150 ppm (on 2σ level) and the detection limit is about 200 ppm.
4. Analysis of uranium from associated minerals
Often, uranium content is correlated to amount of other minerals that occur in higher amounts, or are
easier to detect with XRF method. In different ore bodies, these may be minerals of Pb, Mo, Cu, Co,
Ni, Bi, Sn, Ag and other elements.
Then a faster analysis may be performed using X-ray signatures of these associated minerals. In some
cases, the semi-quantitative analysis time may be as low as 10-100 ms, allowing ore separation before
leaching, secondary crushing or even before ore transportation from the mine. This greatly reduces expenses needed for ore chemical treatment and transportation.
However, one should keep in mind that XRF is effectively a surface technique and probes only up to
1 mm inside the material. Therefore mechanical material separation will be effective only if the ore lumps are more or less chemically homogeneous.

5. Analysis of uranium as the major element
Determination of uranium concentration with the P2 Con-X system is possible also in a concentrated product. In this case, U concentration may be determined both from strength of its XRF spectral lines
(Fig.4), and from intensities of the main admixture element spectral lines. Combination of both
methods, implemented in the P2 Con-X software, allows reaching the best accuracy, that is typically below 1% relative.
Energy of photons
Num
ber
of
photo
ns
Fe
U
Mo U U
U
U U
FIG. 4. XRF spectrum of a pure uranium oxide.
6. Conclusions
The on-line X-ray fluorescence analyzer P2 Con-X is able to determine uranium content in various
ores and materials. Quantitative and semi-quantitative analysis is possible from 100 ppm level up to
80% of uranium and more.
When uranium is present in concentrations below about 1%, its detection limit in 5 minutes of
measurement time is about 60-200 ppm even in the worst cases (presence of strong neighboring Th
XRF lines). Precision of its content determination in the same conditions is about 50-150 ppm.
When uranium concentration is higher, relative precision of its content determination decreases. It
becomes better than 1% (relative) in the concentrated product.
On-line determination of uranium content with P2 Con-X analyzer provides fast and reliable results, thus helping to optimize the separation and concentration processes and cut down the end product
costs.
REFERENCES
[1] REILLY, D., ENSSLIN, N., SMITH, H., KREINER, S., Passive Nondestructive Assay of
Nuclear Materials, Los Alamos National Laboratory, US NRC (1991).
[2] GILMORE, G., “Practical Gamma-Ray Spectrometry”, John Wiley & Sons, 2nd
ed. (2008). [3] SOKOLOV, A., KUZMENKO, V., GOSTILO, V., "Flow-Type HPGe Detector with
Through Channel", to be published in the Proceedings of 31st ESARDA Annual Meeting
2009, Vilnius, Lithuania, 26-28 May, 2009. [4] SOKOLOV, A., KUZMENKO, V., PCHELINTSEV, A., “Automated Spectrometer for
Radionuclide Analysis of Liquid and Gaseous Flows”, NSS Conference Record 2006, IEEE

1 (2006) 518-521.
[5] www.bruker-baltic.lv.
[6] TSUJI, K., J.INJUK, J., VAN GRIEKEN, R., X-ray Spectrometry: Recent Technological Advances, John Wiley & Sons Ltd (2004).
[7] SOKOLOV, A., et al., On-line Analysis of Chrome-Iron Ores on a Conveyor Belt Using X-
Ray Fluorescence Analysis, X-Ray Spectrometry 34 (2005) 456-459.

Elaboration of uranium ore concentrate by direct precipitation
A. Becis, H. Guettaf, K. Ferhat, T. Semaoune, K. Hanou, F. Ferrad, K. Yacoubi
Research Department of Chemical Process, CRND, COMENA, Algiers, Algeria.
Abstract. The production of a uranium ore concentrate (yellow cake) is an essential stage in the preparation of
fuels used in the nuclear power reactor. In this work, we have studied the elaboration of a uranium ore
concentrate from the ore of Tahaggart by testing the direct precipitation process. This choice was justified not
only by the physicochemical characteristics of the ore, but also by other important factors such as: capacity of
the deposit, geographical situation (desert), availability of water and lowest investment. Samples of uranium ore
from Tahaggart, were crushed and leached by percolation with a diluted sulphuric acid solution to solubilize uranium. A rate of 95% was reached. The experiments were carried out with sample extracted from different
locations in the deposit. The results indicate that the classical direct precipitation process is still valid only for 5
% of the samples. For the majority of samples treated, we noticed that by precipitation of uranium at very low
pH, one precipitation step was sufficient to obtain a concentrate of 65% of U3O8. The concentrate obtained is
easily soluble in nitric acid. The chemical characteristics of the ore allow us to produce a concentrate using a
process simpler than the classical double precipitation process.
1. Introduction
Uranium is a metal so reactive that it is found in nature under a multitude of mineral associations
[1][2][3]. The ore of Tahaggart is characterized by the exclusive presence of secondary uranium minerals. The various spectral analyses and microscopic observations allow the identification of
phosphate minerals: autunite Ca(UO2)2PO4.10-12H2O and torbernite Cu(UO2)2(PO4)2.10.H2O [4]
Several processes of treatment were tested to extract uranium from the ore of Tahaggart [5]. These processes considered a certain number of physicochemical parameters such as the nature of the
mineral species, the reagents used and their concentration, the size of particles, and particular
conditions of mining in Hoggar, particularly the constraints imposed by the distance, the scarcity of water and the lack of qualified local labour.
• The ore of Tahaggart is a deposit of low capacity. It is located in an isolated arid area.
• The direct precipitation process is suitable for such ores [6], because they satisfy or approach
the following conditions:
• A high uranium concentration of the leaching solutions.
• Ore reserves are too low to justify investments for the installation of ion exchange or solvent
extraction units.
• The final product sufficiently satisfies the specifications without significant penalties due to the
impurities.
• The objective of our study is to evaluate the direct precipitation flowsheet in order to produce a
uranium concentrate from Tahaggart ore.

1.1. The classical direct precipitation flowsheet
This flowsheet is composed by the following operations (Fig. 1).
Percolation
solution
Partial neutralisation
pH 3-4
Filtration
Prégnant solution
Uranium précipitation
pH 7-8
Filtration and washing of
uranium precipitate
Drying
Uranium ore concentrate
Iron cake
lime
memwater
Washing
solution
Barren
solution
FIG. 1. Classical direct precipitation flow sheet.
Five percent of the sample collected, after the sulphuric acid percolation, provide a uranium solution
which can be treated by this classical flow sheet. The content of the uranium concentrate obtained was [U] = 40%.
Figures 2 and 3 show the iron cake and the uranium ore concentrate obtained at laboratory scale by the
classical direct precipitation flow sheet. The concentration of uranium in the iron cake is 5 % and in the concentrate is 40%.

FIG. 2. Iron cake.
FIG. 3. Uranium ore concentrate。
1.2. The direct precipitation flow sheet with only one precipitation step
Ninety-five percent of the uranium ore sample cannot be processed using the classical flow sheet
because in the first precipitation step at pH = 1.8, precipitation of a uranium concentrate occurs. For these samples, we applied the following one step precipitation flow sheet (Fig 4).

Uranium ore
Acid percolation
leaching
Uranium precipitation
pH 1.8
Filtration
Washing
Drying
Uranium ore concentrate
Sulphuric
acid
Barren solids
Ammonia
Barren solution
Distilled
water
FIG. 4. Direct one step precipitation flow sheet.
2. Experimental
2.1. Physical treatment
The ore was crushed at a particle size up to 0.8 mm.
2.2. Chemical treatment
Percolation leaching
Weight of the ore in the column: 77 kg
Ore size: d < 80 mm Percolation agent [H2SO4]: 50g/l
Percolation mode: Discontinuous
Mode of sprinkling: Siphoning Duration of sprinkling: 173 hours (~ 8 days)
Duration of drying: 34 days
Characteristics of the leaching solution
Eh = 540 mV
Uranium concentration : 13.5g/l
Iron concentration: 2.85g/l Sulphate concentration: 49.13g/l
pH: 1.1, T= 27.3°C
Leaching solution processed by batch of 5 litters

Precipitation parameters
Precipitant agent: Ammonia 28% R.P Normalized pure Prolabo
Ammonia flow rate: 0.48 ml/min with peristaltic pump
Agitation speed of the Pulp: 500 rpm /min
Agitator: Standard agitator anchors in Teflon
3. Results and discussions
3.1. Leaching
The uranium contents in the treated ore and the residue of leaching are summarized in Table 1.
Table 1. Uranium concentration in the ore treated and the leaching residue
Nature of the sample Uranium content* (%) Uranium content** (%)
Uranium ore 0.6 0.63 Sterile 0.027 0.028 * Analysis by the delayed neutron counting method (DNC)
** Analysis by volumetry
The operation of leaching on a pilot semi scale proceeded without major problems. The
recovery of uranium extraction reaches 95%.
Figure 5 shows the evolution of the quantity of uranium extracted in each successive fraction
of 2 litres.
0 5 10 15 20 25 30 0
10
20
30
40
50 Uranium
recovered
(g)
Fraction number
FIG. 5. Quantity of uranium extracted in each fraction.
The quantity of uranium is small at the beginning of the percolation. After the 5eme
fraction the quantity of extracted uranium increases considerably reaching a maximum of 46 g.
Figure 6 shows the recovery of uranium versus the liquid/solid ratio.
0,0 0,1 0,2 0,3 0,4 0,5 0,6 0,7 0,80
10
20
30
40
50
60
70
80
90
100
110
Liquid/solid ratio
Recovery (%)
FIG. 6. Variation of uranium recovery with liquid/solid ratio.
The recovery rate reaches 90% for L/S ratio of 0.5. The quantity of water used is very low.
0 5 10 15 20 25 30 35 40 45 50 55 60
0
20
40
60
80
100R (%) pH
R.
Volume (litres)
0,5
1,0
1,5
2,0
2,5
3,0 pH
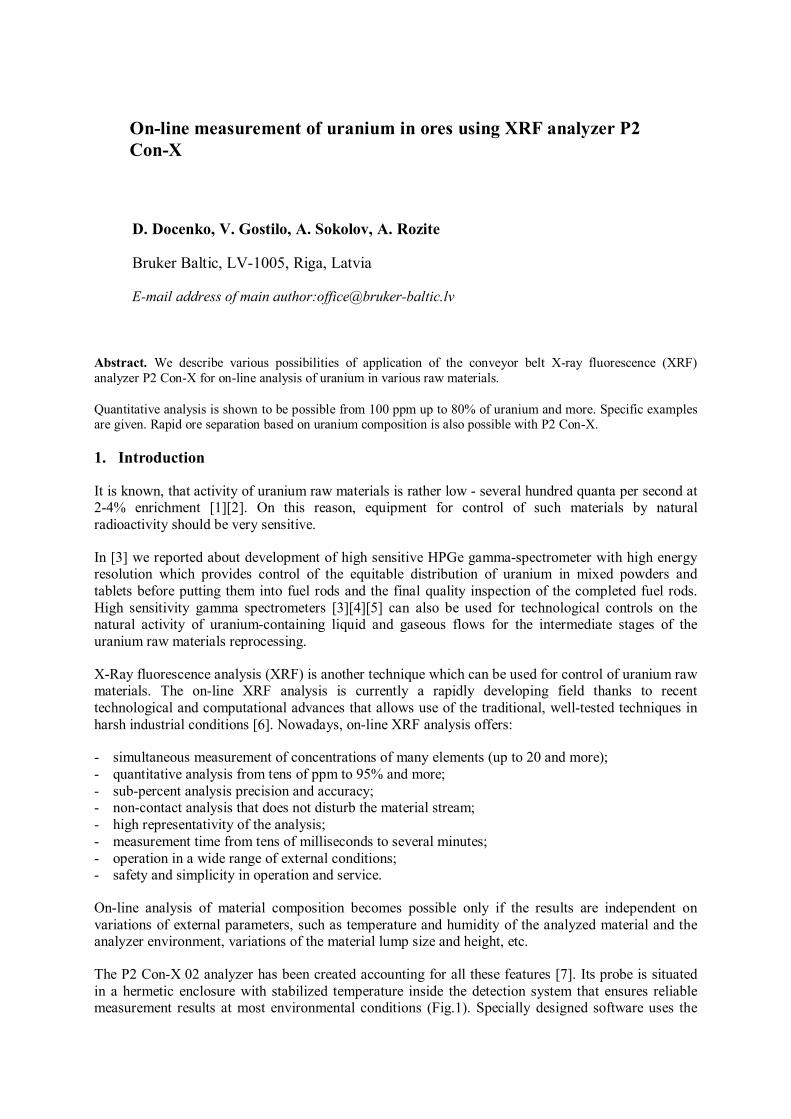
FIG. 7. Evolution of pH and recovery rate of uranium during acid percolation leaching
The initial pH of the leaching solution is about 1.When this solution flows through the ore
bed, the acid is first consumed by alkaline compounds. This fact explains the pH increase in
the first solutions. The breakthrough occurs for a pH value of about 1.4 (Fig 7).
3.2. Precipitation
In the classical direct precipitation flow sheet, the precipitation occurs in two steps. The first step occurs at pH = 3.5 to eliminate many impurities such as iron and aluminium and the second step at pH
7 that allows the precipitation of uranium. The concentration of uranium in the percolation solution is:

13.5 g/l. This concentration is convenient to apply the direct precipitation flow sheet. We noticed that
when we add soda, lime or ammonia to the leaching solution produced, a precipitate occurs at a very
low pH. This precipitate begins to appear at pH 1.4 and 99% of the uranium precipitates at pH 1.8. We also noted that when phosphorus is present in the leaching solution, it reacts with uranium at low pH
to give a uranium phosphate compound such: U(HPO4)2.H2O.
The analytical results of the uranium concentrate produced show effectively the presence of phosphorus (Table 2) (Fig 8).
Table 2. Analysis of uranium ore concentrate by XRF
Uranium concentrate produced Standard uranium concentrate [3]
Element Content (%) Content (%)
U 55 55.11
Fe 7.2 1.0 S 0.8 1.1
Ca 0.003 1.0
Ti 0.38 0.05 Si 0.04 1.0
Al 0.15 ―
P 8 0.15
FIG. 8. Uranium ore concentrate produced by one step direct precipitation flow sheet.
4. Conclusions
Leaching percolation of Tahaggart ore is efficient. We obtained a good recovery rate of uranium
without addition of oxidant and at very low L/S ratio. The unit operation of conventional filtration is
not necessary. The leaching solution flows through the ore bed and are recovered as clear pregnant solution. The ore bed presents a good permeability. The one step direct precipitation flow sheet is
simpler than the classical direct precipitation process. It minimizes plant footprint.
The advantage in the case of Tahaggart ore is the possibility to obtain a concentrate titrating 65% U3O8, using only one concentration-purification operation. This concentrate is easy to dissolve by
diluted nitric acid. Preliminary purification tests are positive.
REFERENCES
[1] INTERNATIONAL ATOMIC ENRGY AGENCY, Uranium Extraction
Technology, IAEA-TRS-359, IAEA, Vienna (1993).

[2] INTERNATIONAL ATOMIC ENRGY AGENCY, Significance of Mineralogy in
the Development of Flowsheets for Processing Uranium Ores; IAEA, Vienna
(1980). [3] INTERNATIONAL ATOMIC ENRGY AGENCY, Manual of Laboratory Testing
for Uranium Ore Processing, IAEA, Vienna (1990). [4] MINISTRY OF INDUSTRY, Geology of Uranium Tahaggart Ore, Rep. Algeria,
(1972). [5] GUETTAF, H., et al., Concentration-purification of uranium from an acid leaching
solution, Physics Procedia Journal (in press). [6] QUAN, C.H., RING, R.J., McNAUGHTON, S.J., Environmental design of a
uranium mill, IAEA. International Symposium held in Vienna, 2-6 October 2000.
Phosphoric ore treatment by roasting it with sodium carbonate and
leaching it with ammonium citrate for the recovery of soluble
phosphate and uranium
E. de la Torre, A. Guevara
National Polytechnic University, Chemical Engineering and Agro industry Faculty,
Extractive Metallurgy Department, Quito, Ecuador
E-mail address of main author: [email protected]
Abstract. By thermal treatment of phosphoric ore, with low phosphorus contents and iron, aluminum, and silicon impurities, basic fertilizers with P2O5 soluble in citric acid or ammonium citrate, can be produced. The
phosphoric ore lightly grinded with alkaline salts like CO3Na2 y SiO2 is roasted between 800 to 1 000˚C in rotary
kilns. The roasted material contains from 25–30% of alkaline phosphates soluble in citrates. Phosphoric ore
from the province of Napo-Ecuador with 24% of P2O5, 40% CaO in form of apatite, 20% of SiO2 and 7 g/ton U is
tested by thermic differential analysis, roasting at 800˚C for 2 hours with 50% w/w of sodium carbonate and 2%
w/w of SiO2 by using a Nichols pilot furnace with 15 L of capacity which uses gas (propane-butane) as fuel, and
agitated leaching with ammonium citrate (5% w/w). The initial ore and products are characterized by using
atomic absorption spectrophotometry (Perkin Elmer AA400) and x-ray diffraction (Bruker D8 Advance). In the
best conditions, 32% of phosphorus soluble in water is obtained as well as 40% of phosphorus and 56% uranium
soluble in ammonium citrate.
1. Introduction
Pyrogenic treatment of the raw phosphate fertilizers permits the manufacture of basic P2O5 soluble in
citric acid or ammonium citrate. These procedures deserve great interest because they permit the processing of raw phosphate with low concentration of phosphorus, as well as those containing iron
and alumina, or with high levels of silicic acid impurities, which constitute the main part of the
phosphatic minerals.
Several researchers such as Wiborg, Kraut, Knoop, Wolters [1] have proposed the production of alkaline phosphates and lime soluble in ammonium citrate, by the use of rotary kilns. However, the
industrial practice of these procedures was not efficient due to the highly corrosive action of the
masses of phosphates which can corrode almost any furnance material.
The industrial production of phosphates of alkali and lime, using rotary kiln, was not achieved until
Messerschmitt, [1][2] found the conditions under which it was possible to agglutinate tri-calcium
phosphate, lime and alkali silicates. This process has to deal with a complicated balance between the
two fire-resistant acids P2O5 and SiO2 on the one hand, and, on the other hand, between the alkaline and alkali non soil bases, resulting in the formation of an alkaline phosphate P2O5(CaO)2Na2O with
calcium silicates and aluminum silicates.
The pyrogenic treatment reactions in combination with alkaline core can be represented by the following equations:
• phosphate ore with soda or caustic potash
P2O5(CaO)8 + CO3Na2 � P2O5(CaO)2Na2O + CaO + CO2

• phosphate ore with alkali silicate
P2O5(CaO)8 + SiO2 Na2O � P2O5(CaO)2Na2O + SiO2 CaO
• phosphate ore with leucite
P2O5(CaO)8 + (SiO2)4 K2O Al2O3 + 4 CO3Ca � P2O5(CaO)2K2O + 4 SiO2 CaO + Al2O3 CaO + 4 CO2
Raw phosphate ore is finely grinded and then, by the addition of alkaline salts and sometimes some SiO2, are mixed in special blend facilities. The “raw powder" is calcinated at a temperature of 800 to
1 000oC in tabular rotary kiln. By this method, the transformation of the insoluble tri calcium
phosphate in an alkaline phosphate of lime is proved. The alkaline phosphate of lime is the bearer of phosphoric acid [1][2][3][4].
The mixture, that in the roasting furnace has been agglutinated, is in the form of a porous material
called “clinca”. This material is transferred to great refrigerating drums for final grinding. The obtained phosphate is a very fine, gray powder which spreads easily and which contains 25-30%
phosphoric acid-soluble citrates [4][5].
2. Experimental Methodology
Phosphate ore from the province of Napo - Ecuador is tested, by differential thermal analysis and
different roasting times and temperatures, with the addition of 50% w/w of sodium carbonate, and
2% w/w SiO2, in a Nichols pilot furnace heated by gas (propane-butane), and agitated leaching with
ammonium citrate, 5% w/w. The initial material and the final products are characterized by atomic absorption spectrophotometry (Perkin Elmer AA400) and x-ray diffraction (Bruker D8 Advance)
[6][7][8][9].
The methodology used considers experimental stages working at laboratory and pilot scale, all this, trying to establish operational criteria and control for the investigated processes. The tests were
conducted at laboratory scale in flasks with fixed bed of material (5 to 8 g) and in pilot scale with a
furnace hearth mono Nichols, who reproduce the operating conditions of the multi hearth furnace stack.
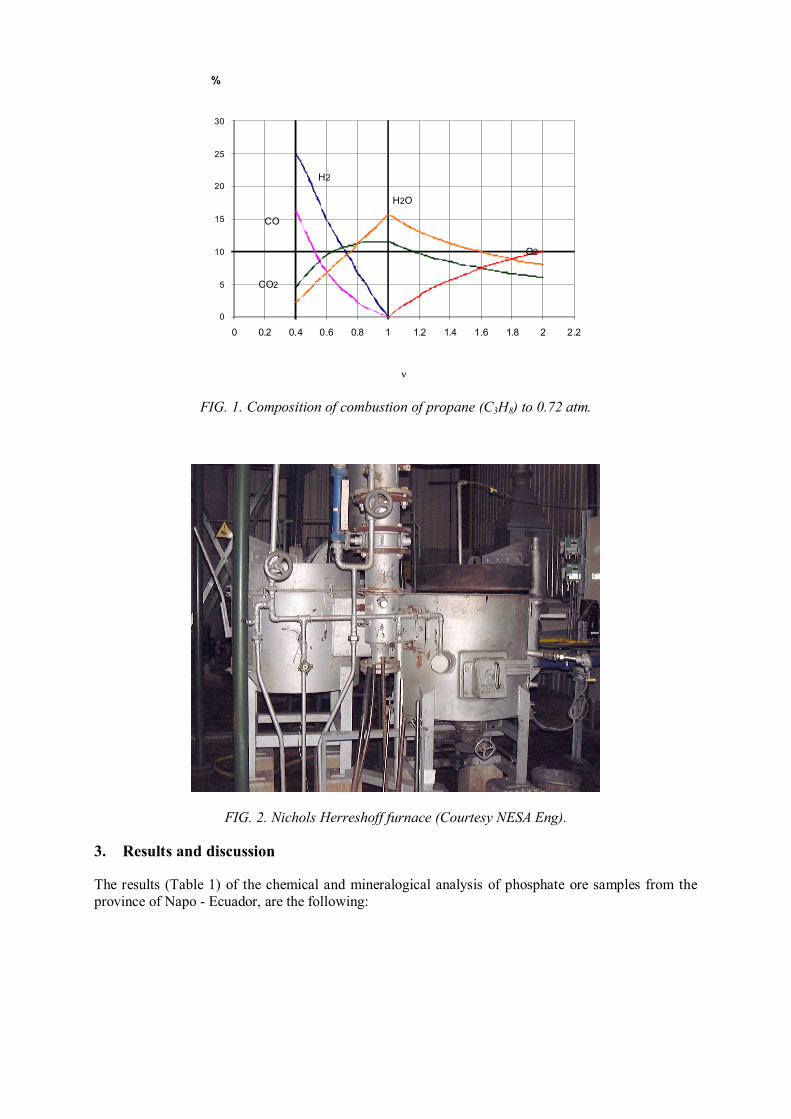
Nichols mono hearth furnace uses liquefied petroleum gas (LPG) and can operate in fixed bed or
stirred bed material with 15 liters of material and controlled air based in the λ lambda factor, which establish the relationship between air fed to the burner and the air required for complete combustion of
liquefied petroleum gas. Therefore λ>1 involves an operation in oxidating atmosphere, and 0.4 <λ<1 corresponds to an operation in reducing atmosphere. The composition of combustion gases from the
furnace as a function of λ for propane (C3H8) to 0.72 atm. (atmospheric pressure in Quito) is shown in Fig. 1. The furnace design allows systematic sampling in order to assess the kinetics of the tested processes. Figure 2 shows a panoramic view of the furnace.
0
5
10
15
20
25
30
0 0.2 0.4 0.6 0.8 1 1.2 1.4 1.6 1.8 2 2.2
%
ν
H2
CO
CO2
H2O
O2
FIG. 1. Composition of combustion of propane (C3H8) to 0.72 atm.
FIG. 2. Nichols Herreshoff furnace (Courtesy NESA Eng).
3. Results and discussion
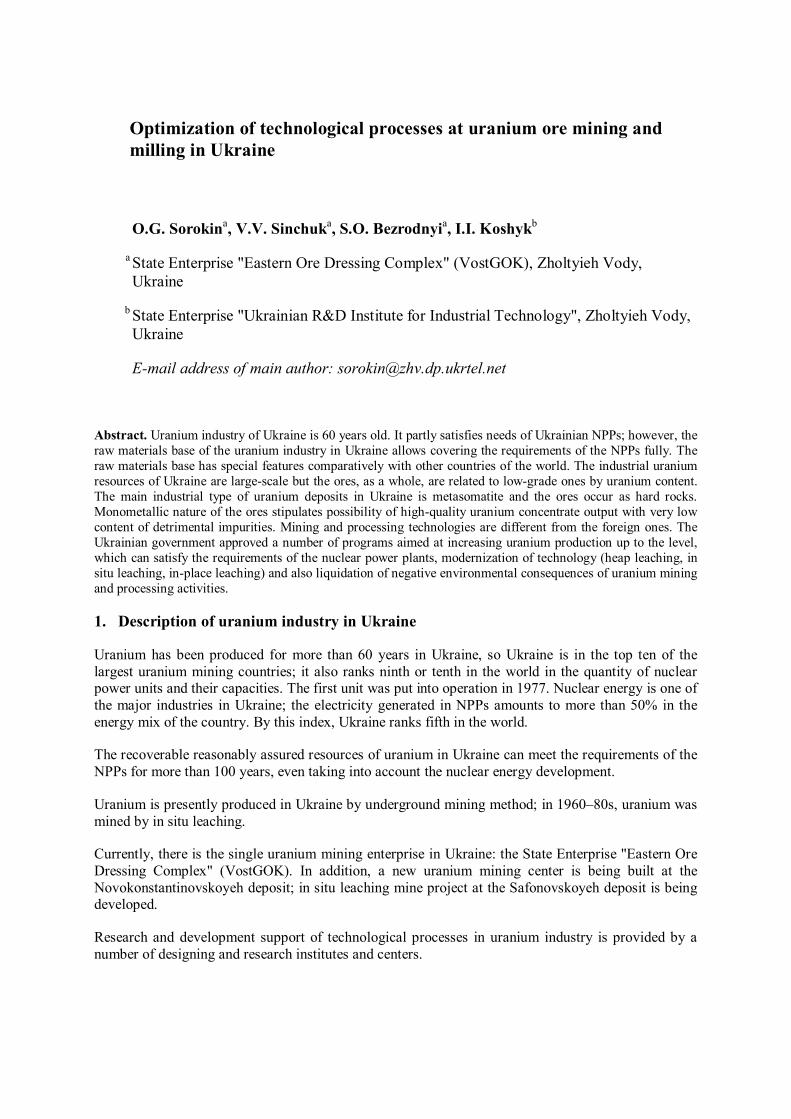
The results (Table 1) of the chemical and mineralogical analysis of phosphate ore samples from the
province of Napo - Ecuador, are the following:
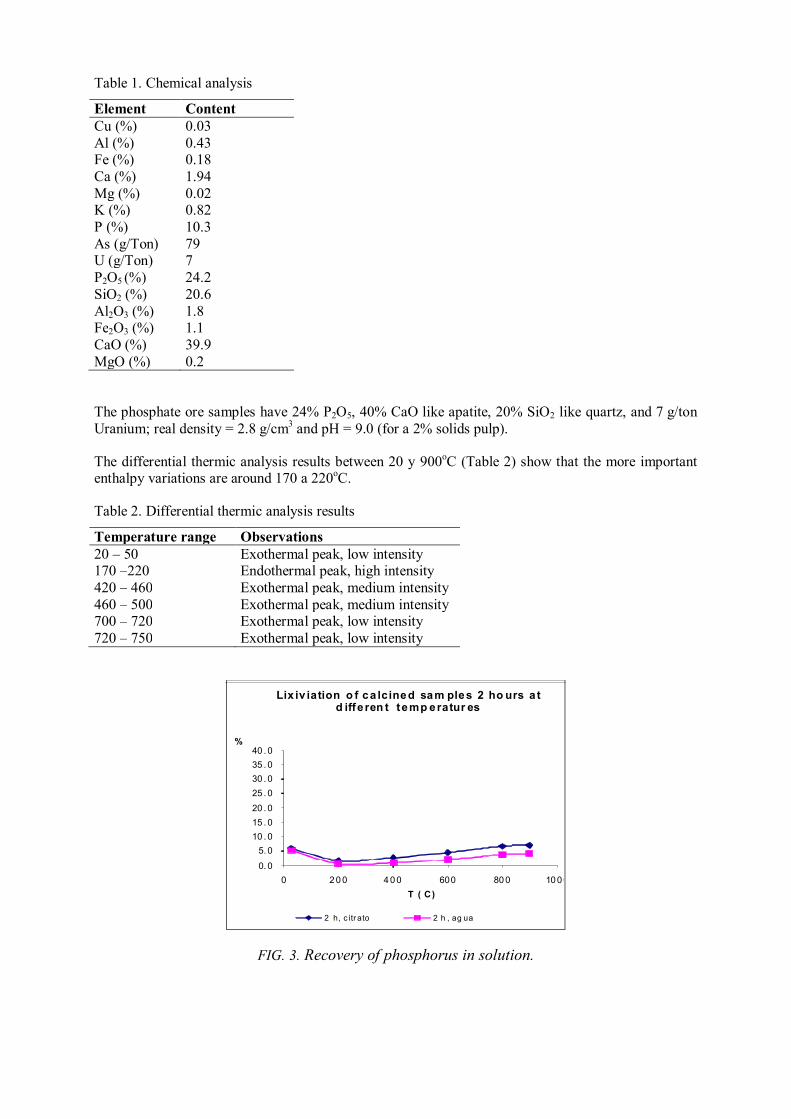
Table 1. Chemical analysis
Element Content
Cu (%) 0.03
Al (%) 0.43 Fe (%) 0.18
Ca (%) 1.94
Mg (%) 0.02 K (%) 0.82
P (%) 10.3
As (g/Ton) 79 U (g/Ton) 7
P2O5 (%) 24.2
SiO2 (%) 20.6
Al2O3 (%) 1.8 Fe2O3 (%) 1.1
CaO (%) 39.9
MgO (%) 0.2
The phosphate ore samples have 24% P2O5, 40% CaO like apatite, 20% SiO2 like quartz, and 7 g/ton
Uranium; real density = 2.8 g/cm3 and pH = 9.0 (for a 2% solids pulp).
The differential thermic analysis results between 20 y 900oC (Table 2) show that the more important
enthalpy variations are around 170 a 220oC.
Table 2. Differential thermic analysis results
Temperature range Observations
20 – 50 Exothermal peak, low intensity 170 –220 Endothermal peak, high intensity
420 – 460 Exothermal peak, medium intensity
460 – 500 Exothermal peak, medium intensity 700 – 720 Exothermal peak, low intensity
720 – 750 Exothermal peak, low intensity
0. 0
5. 0
10 . 0
15 . 0
20 . 0
25 . 0
30 . 0
35 . 0
40 . 0
0 2 0 0 4 0 0 600 80 0 10 0 0
%
T ( C)
Lix iv iation o f ca lcined sam ples 2 ho urs a t d iffe ren t temp eratur es
2 h, c itr ato 2 h , ag ua
FIG. 3. Recovery of phosphorus in solution.

In Figure 3, the results of tests to determine the variation of the solubility of phosphorus leaching in
water and ammonium citrate samples previously calcined for 2 hours at 200, 400, 600, 800, 900°C are
shown.
It can be seen that when the sample is calcined at 200°C, the percentage of recovery of phosphorus in
solution decreases significantly from the value obtained for the original sample (without calcinations),
both for leaching in water and in ammonium citrate. From 400°C this value increases slightly, but for the leaching in water it is always lower than the value of the original sample. In the case of leaching in
ammonium citrate, when the sample is calcined at 800°C and 900°C, higher values are obtained
compared with the original sample; however the increase is not quite significant.
0,0
5,0
10,0
15,0
20,0
25,0
30,0
35,0
40,0
0 20 40 60 80
%
g NaCO3
%Soluble species recovered
Uranio Fosforo
FIG. 4. Leaching of ammonium citrate, with Na2CO3 calcined sample at 800°C, 2 h.
The use of sodium carbonate in the roasting, as shown in Figure 4, promotes the solubility of phosphorus and uranium in a solution of ammonium citrate. When operating under the best conditions,
recoveries of 32% water soluble phosphorus and 40% phosphorus and 56% of soluble uranium in
ammonium citrate can be obtained.
The results presented in Fig. 5, show that the addition of silica in form of sodium silicate increases the
solubility of phosphorus to 43% when the samples of phosphoric ore are roasted with sodium
carbonate.

05
10
15202530
354045
0 1 2 3 4 5
%
g Sí lice
Lixiviation of ca lc ined samples 2 hours with
sodium ca rbo nate and síl ice
2 h, citra to 2 h, agua
FIG. 5. Recovery of phosphorus, in solution, calcined sample at 800°C, 2 h.
4. Conclusions
• The samples of phosphoric ore from the province of Napo - Ecuador, with contents of 24% P2O5,
40% CaO, as apatite, 20% SiO2 and quartz, and 7 g / ton U, treated by roasting, with the addition of 40 g sodium carbonate, 3 g silica and 30 g of sample, and then calcined at 800°C for 2h., can
achieve a recovery of 40% of phosphorus and 56% of soluble uranium in ammonium citrate.
• Tests of direct calcinations of the samples are not justified due to the low solubility of phosphorus obtained. Nevertheless, tests on the fluxes of sodium carbonate, potassium carbonate and silica
present an interesting alternative to establish the behavior of the material with furnaces with direct
flame in order to obtain sufficient quantities of product to be tested in agricultural application.
ACKNOWLEDGEMENTS
This is a contribution of Escuela Politécnica Nacional (Quito, Ecuador). The financial support came
from the Foundation for Science and Technology (Fundacyt) through the project Fundacyt BID-099.
Our thanks to Professor Christian Lucion of the Catholic University of Louvain, Belgium, for his valuable observations for this research. To Eng. Geovana Lucio R. of Ministerio de Electricidad y
Energía Renovable (MEER) - Ecuador.
REFERENCES
[1] ULLMANN, F., Enciclopedia de Química Industrial, Ed. Gustavo Gili S.A., Segunda
Edición, BarcelonaVolumen X (1953) 46 – 55.
[2] WEINIG, A., SCHODER, W., Technical Methods of ore analysis for chemist and colleges, Ed. John Wiley & Sons, London (1939) 203 – 205.
[3] PECOITS, E., AUBET, N., “Minerales para la agricultura en latinoamérica”,
Manifestaciones fosfáticas de Uruguay” 2009,
http://www.unsam.edu.ar/publicaciones/tapas/cyted/parte3.pdf [4] IN S.S.S. RAJAN Y S.H. CHIEN (Eds.), “Direct application of phosphate rock and related
technology: latest developments and practical experiences”, Proc. Int. Meeting, Kuala
Lumpur, 16-20 July 2001, Muscle Shoals, USA. [5] ZAPATA, E.Y., ROY, R.N., Use of phosphate rocks for sustainable agriuculture, Bulletin
Nº 13, FAO Fertilizer and plant nutrition division, FAO, Roma (2004).
[6] JOHNSEN, O., Guide Delachaux des minéraux, Delacahux et Niestlé S.A., Paris (2002).
[7] SCHUMAN, W., Guide des Pierres et Minéraux, Delacahux et Niestlé S.A., Paris (2000).

[8] CORNELIUS, K., CORNELIUS, K., ”Manual of Mineralalogy”, John Wiley& Sons, Inc,
USA (1998).
[9] http://fosfatos.gl.fcen.uba.ar/sedimentologia.php http://www.ceniap.gov.ve/publica/divulga/fd53/fertilizantes.htm
Optimization of technological processes at uranium ore mining and
milling in Ukraine
O.G. Sorokina, V.V. Sinchuk
a, S.O. Bezrodnyi
a, I.I. Koshyk
b
a State Enterprise "Eastern Ore Dressing Complex" (VostGOK), Zholtyieh Vody,
Ukraine
b State Enterprise "Ukrainian R&D Institute for Industrial Technology", Zholtyieh Vody,
Ukraine
E-mail address of main author: [email protected]
Abstract. Uranium industry of Ukraine is 60 years old. It partly satisfies needs of Ukrainian NPPs; however, the
raw materials base of the uranium industry in Ukraine allows covering the requirements of the NPPs fully. The
raw materials base has special features comparatively with other countries of the world. The industrial uranium
resources of Ukraine are large-scale but the ores, as a whole, are related to low-grade ones by uranium content.
The main industrial type of uranium deposits in Ukraine is metasomatite and the ores occur as hard rocks.
Monometallic nature of the ores stipulates possibility of high-quality uranium concentrate output with very low
content of detrimental impurities. Mining and processing technologies are different from the foreign ones. The
Ukrainian government approved a number of programs aimed at increasing uranium production up to the level,
which can satisfy the requirements of the nuclear power plants, modernization of technology (heap leaching, in
situ leaching, in-place leaching) and also liquidation of negative environmental consequences of uranium mining
and processing activities.
1. Description of uranium industry in Ukraine
Uranium has been produced for more than 60 years in Ukraine, so Ukraine is in the top ten of the
largest uranium mining countries; it also ranks ninth or tenth in the world in the quantity of nuclear power units and their capacities. The first unit was put into operation in 1977. Nuclear energy is one of
the major industries in Ukraine; the electricity generated in NPPs amounts to more than 50% in the
energy mix of the country. By this index, Ukraine ranks fifth in the world.
The recoverable reasonably assured resources of uranium in Ukraine can meet the requirements of the
NPPs for more than 100 years, even taking into account the nuclear energy development.
Uranium is presently produced in Ukraine by underground mining method; in 1960–80s, uranium was
mined by in situ leaching.
Currently, there is the single uranium mining enterprise in Ukraine: the State Enterprise "Eastern Ore
Dressing Complex" (VostGOK). In addition, a new uranium mining center is being built at the
Novokonstantinovskoyeh deposit; in situ leaching mine project at the Safonovskoyeh deposit is being developed.
Research and development support of technological processes in uranium industry is provided by a
number of designing and research institutes and centers.
2. Short historical review on uranium mining and milling in Ukraine
Uranium ore mining in Ukraine began in 1948 at the Pervomayskoyeh deposit. In 1951, the Eastern Ore Dressing Complex was created to develop the Pervomayskoyeh and Zheltorechenskoyeh uranium
deposits.
For milling of the mined uranium ore and uranium material from the countries of Eastern Europe a
processing plant in Dnieprodzerzhinsk city was put into operation in 1949. The capacity of the plant amounted to 5 000 tonnes of uranium per annum. In 1959, the second plant for uranium ore milling
was built in Ukraine in Zholtyieh Vody town.
In 1960-70s, uranium mining moved to Kirovograd region. Development of the Michurinskoyeh, Vatutinskoyeh and Tsentral'noyeh uranium deposits began there and are currently operating.
In 1989, as conversion began in the USSR, the work on uranium mining by in situ leaching was
suspended, as well as the work on commercial development of the Novokonstantinovskoyeh and Severinskoyeh deposits. In 2004, construction of the uranium mining center at the
Novokonstantinovskoyeh deposit was recommenced.
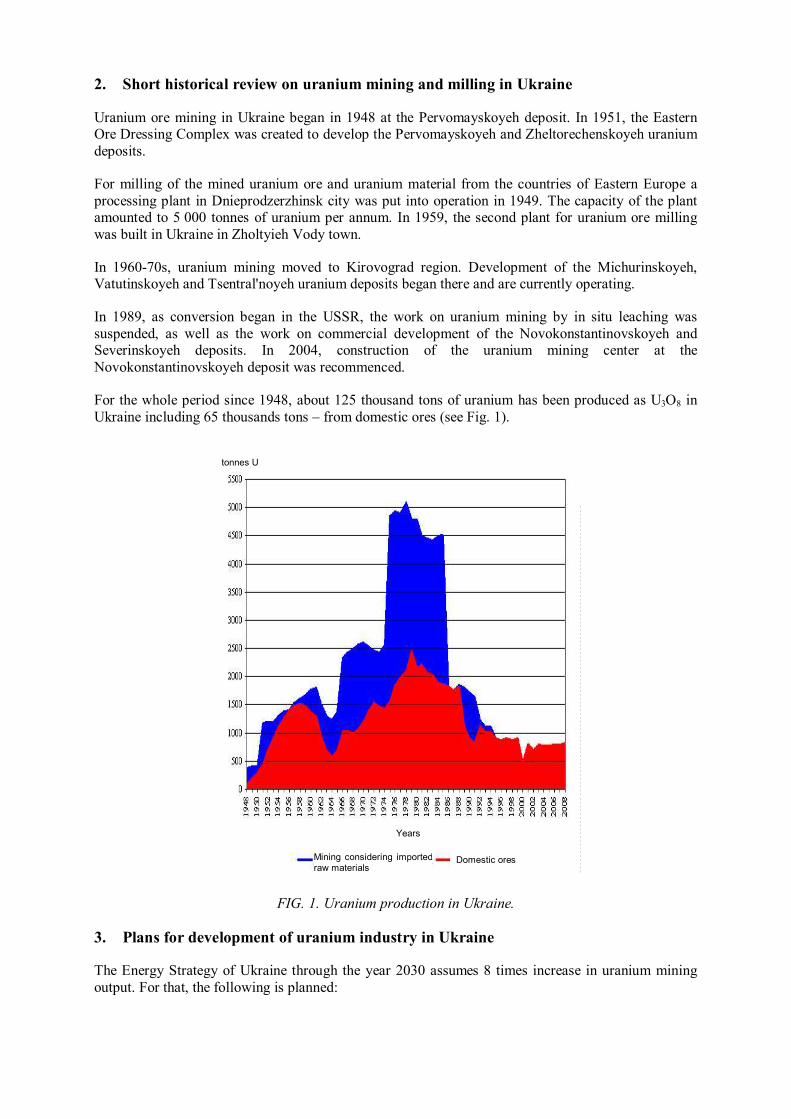
For the whole period since 1948, about 125 thousand tons of uranium has been produced as U3O8 in
Ukraine including 65 thousands tons – from domestic ores (see Fig. 1).
FIG. 1. Uranium production in Ukraine.
3. Plans for development of uranium industry in Ukraine
The Energy Strategy of Ukraine through the year 2030 assumes 8 times increase in uranium mining
output. For that, the following is planned:
Years
Domestic ores Mining considering imported
raw materials
tonnes U

- development of the operated mining facilities at VostGOK;
- putting into operation of uranium mining enterprises on the basis of five deposits to be mined by
underground method;
- putting into operation of uranium mining enterprises on the basis of five deposits to be mined by
in situ leaching;
- reconstruction and expansion of the hydrometallurgical plant operated currently;
- expansion of the volume of the tailings storage pond of the hydrometallurgical plant;
- construction of a new milling complex at the Novokonstantinovskoyeh deposit.
4. Features of raw materials base of uranium industry in Ukraine
The main industrial type of uranium deposits in Ukraine is metasomatite: 98% of the total resources.
Sandstone deposits make up 2% of the resources. Thus, the strategy of the uranium industry
development in Ukraine is built on uranium mining of the metasomatite deposits; the sandstone deposits are expected to play an auxiliary role.
All the industrial deposits of metasomatite type are concentrated on the territory measuring 80 by
20 km within Kirovograd region.
The ore is delivered to the milling plant by railway at a distance of to 100-300 km from the operated mines.
Layout of uranium industry's facilities in Ukraine is shown in Fig. 2.
FIG. 2. Layout of uranium industry's facilities in Ukraine.

The industrial uranium deposits of Ukraine are large-scale by uranium reserves that allow creating
high-capacity mining enterprises. The low boundary of the industrial ores is set at a depth of up to
1 300 m. It stipulates the possibility of their mining by exceptionally underground method – far more expensive than open-pit method.
The ores, as a whole, are low-grade; the content of uranium varies near 0.1%; it increases up to 1% on
individual local areas. It should be noted that nowhere else in the world, such low-grade ores are mined by underground method.
Geological sections at Severinskoyeh and Vatutinskoyeh deposits are shown in Fig. 3.
FIG. 3. Geological sections at the Severinskoyeh and Vatutinskoyeh deposits.
High dilution reaching 30% when the ore is mined is stipulated by large quantity of waste rock spots
within the ore contour.
Considerable differentiation of the ore beds by thickness (it varies from 2 to 100 m) calls for using different mining methods – high-performance methods with mass ore breaking for thick ore beds and
selective mining methods for low-thick shallow ore beds.
The ores occur as hard rocks that call for drilling-and-blasting operations for drifting and ore breaking. At the same time, it allows drifting without support and creating considerable outcrop areas when the
ore is broken.
The day surface of Ukrainian uranium deposits, as a rule, is presented by valuable fertile black earth,
occasionally – by urban areas. It results in a number of requirements to mining methods: deformation of the earth surface must be prevented and seismic load of drilling-and-blasting operations on the
surface buildings must be minimized.
As contents of uranium and other components are increased, the mine water can not be discharged into the drainage network and must be cleaned.
Low content of uranium, weak emanation ability of the ores make it possible to provide normal
hygiene-and-sanitary labour conditions for the mine personnel by arrangement of sufficient
ventilation.
Ore mineralization occurs, mainly, as uraninite, pitchblende and brannerite.
The Severinskoyeh deposit
geological section
The Vatutinskoyeh deposit
Characteristic geological section of the operational block

Uranium minerals are dissipated in the ore mass and have ultrafine sizes: nearly 90% of uranium is
concentrated in grains sizing less than 70 µm. As a result, the hydrometallurgical processing of the
whole mined ore is required instead of conventional physical methods.
Monometallic nature of the ores stipulates possibility of high-quality uranium concentrate output with
very low content of detrimental impurities.
By radiometric dressability, the ores are related to weakly- and medium-contrasting that requires the perfect process flowsheet of radiometric concentration.
The deposits are located in the well developed region, with the developed traffic network, arranged
power supply systems, favourable climate and high supply of labour.
5. Description of the operated technological process of uranium ore mining and milling
The technological process of uranium ore mining and milling in Ukraine consists of the following
basic operations:
• Ore mining by underground method – sublevel drifts (crossdrifts) with backfilling
worked-out mine voids using solid backfill
• Ore crushing and screening at a mine
• Radiometric separation of +40 mm size
• Piling of tailings from the radiometric separation
• Ore milling at the plant with production of oxide uranium concentrate containing 84% of
natural uranium. The process of the ore milling is different from the foreign technologies.
The full capacity of the plant is 1800 tonnes of uranium annually as UOC (90%UO2;
10%UO3).
• Ore grinding to 95% of -0.25 mm
• Sulfuric acid leaching
• Sorption from the pulp to anionite
• Sulfuric acid desorption
• Extraction and re-extraction
• Drying and calcination
• Storing of the end product
6. Basic areas of optimization of technological processes
The analysis of the operated flowsheet of uranium ore mining and milling in Ukraine reveals the number of problems which require optimization of the whole process.
The first problem is use of out-of-date domestic equipment in the mining production that once or twice
yields to the up-to-date equipment from leading world producers by efficiency and hygiene-and-
sanitary characteristics. Its use leads to high dilution.
The second problem is availability of considerable volume of ore fines (-40 mm size) which presently
can not be exposed to radiometric separation and are shipped directly to the plant, sharply reducing the
grade in the end ore product.
The third problem is an out-of-date power-consuming flowsheet at the hydrometallurgical plant.
Thus, a new flowsheet and basic areas of optimization of the technological processes are developed:
• Technical re-equipment of the production (Slide 20). Through the year 2012, it is planned to
purchase 25 mining production units and 41 milling production units.
• Application of the optimal mining methods taking into account the specific mining and
geological conditions of the mined beds and economics of the production.
• Control of the grain-size distribution of broken ore to diminish the output of ore fines and to
increase the efficiency of separation. It is to be achieved by increase in accuracy of blasthole
drilling and more exact calculation of drilling-and-blasting parameters.
• Radiometric separation advancement by development of multi-stage separators with automatic
adjustment of separation thresholds depending on properties of delivered ore.
• Construction of underground radiometric separation plants with tailings utilization as a
constituent of combined backfill for backfilling worked-out mine voids of exhausted blocks that
will allow increase in capacities of available ore hoists.
• Construction of heap leaching plots on the sites of mines to carry out sulfuric acid leaching of
ore fines, as well as of radiometric separation end product crushed to -10 mm. The processed material will be in the volume enabling its placing, after leaching and neutralization, completely
as a constituent of solid backfill to backfill worked-out mine voids of exhausted blocks.
• Application of sulfuric acid in situ leaching to low-grade ores with creation of artificial
permeability of ore massif by drilling-and-blasting.
• Reducing the cost of natural uranium concentrate production, the operation of sandstone
deposits by acid in situ leaching is planned to begin through two years.
• The hydrometallurgical plant reconstruction to produce uranium oxide concentrate of nuclear
quality for its direct conversion into uranium hexafluoride, as well as expansion of the effective
volume of the operated tailings storage pond.
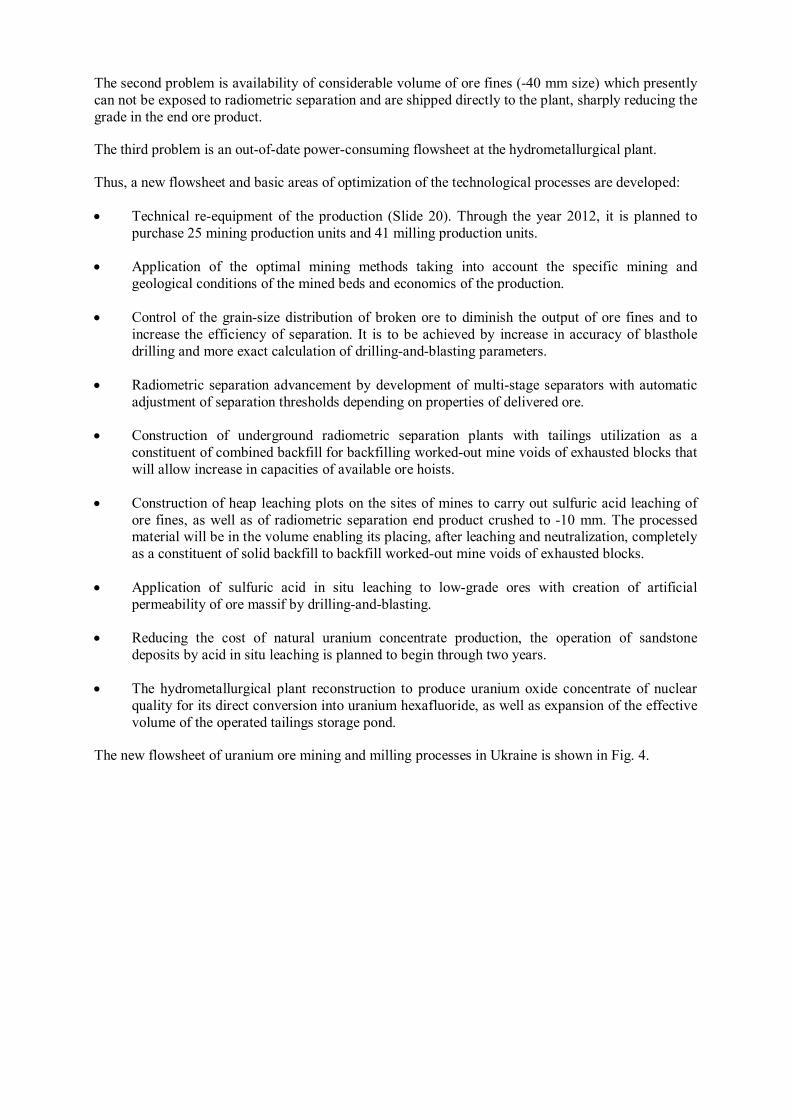
The new flowsheet of uranium ore mining and milling processes in Ukraine is shown in Fig. 4.

Ore mining by underground method
Ore crushing and screening
+40 mm size –40 mm size
Concentrate Clean
tailings
Ore storage
Radiometric separation
Ore loading into rail transport and transporting to the plant
Ore milling at the plant
Semiautogenous crushing at MMS mills
Acid pressure leaching
Sorption from solutions on anionite
Acid desorption
Extraction and re-extraction
Drying and calcination
End product storage area
Heap leaching
complex
Industrial
product
Block leaching
Tailings Crude
concentrate
Solid
backfill
To the plant Pile
New
flowsheet
Ball crushing at MShR mills in combination with classifier
Underflow Overflow
Heat recovery
FIG. 4. New process flowsheet.
7. Utilization of solid wastes from mining production
To improve the environmental condition and mitigate radiation exposure on the environment and
public, works on diminishing volumes and activity of mining wastes were started in the region of uranium mining.
For this purpose, mobile complex of radiometric separation was developed, manufactured and
mounted at the Smolinskaya mine (see Fig. 5).
Up-to-date separators allowing to separate a low-grade ore concentrate from piles, clean tailings and
the end product with uranium content of 0.06 to 0.011%, were installed at the complex.
The radiation load on the environment has been 17% reduced.
It is planned to build the same complex at the Ingul'skaya mine in 2010.

FIG. 5. Complex of radiometric separation of the Smolinskaya mine's piles.
8. Conclusions
• The raw materials base of uranium industry in Ukraine requires unconventional engineering
solutions to develop optimal flowsheet of ore mining and milling.
• Implementation of research and experimental-industrial efforts by VostGOK makes it possible to
create complex mining-and-chemical technology of economically efficient mining of low-grade
uranium ore in Ukraine.
• Taking into account the growing interest to uranium mining at low-grade deposits throughout the
world, the approaches developed in Ukraine can be used in other countries where low-grade uranium deposits are available.