Passion toxcel e driving experience and safety performance are being redefined in the automotive...
169
Transcript of Passion toxcel e driving experience and safety performance are being redefined in the automotive...

Passion to e xcel
Annual Report 2016-17LumAx IndustRIes LImIted

In this annual report, we have disclosed forward looking information to enable investors to comprehend our prospects and take
informed investment decisions. This report and other statements, written and oral, that we periodically make contain forward looking
statements that set out anticipated performance/results based on the management’s plan and assumptions. We have tried wherever
possible to identify such statements by using words such as ‘anticipate’, ‘estimate’, ‘expects’, ‘project’, ‘intends’, ‘plans’, ‘believes’ and
words of similar substance in connection with any discussion of future performance. We cannot guarantee that these forward looking
statements will be realised, although we believe we have been prudent in assumptions. The achievement of results is subject to
risks, uncertainties and realization of assumptions. Should known or unknown risks or uncertainties materialise or should underlying
assumptions prove inaccurate, actual results could vary materially from those anticipated, estimated or projected. Readers should bear
this in mind.
1CorPorate overview
01-20Group / Corporate Snapshot ................................................ 02Business Model ................................................................... 06Management Message ......................................................... 16Board of Directors ...................................................................... 18
2statutory rePorts
21-71Directors’ Report .................................................................. 21Annexures to Directors’ Report ............................................ 27
3FinanCial statements
72-164Standalone Financial Statements ......................................... 72Consolidated Financial Statements ...................................... 118
Scan the code toread this report
To view our online reportsplease log on towww.lumaxindustries.com
wHat's insiDe

Aesthetics, driving experience and safety performance are being redefined in the automotive industry. Vehicle lighting, an important aspect of every automobile - be it a two, three or a four-wheeler, is steadily witnessing a change from conventional lighting to LED lighting - a safer, stylish and sustainable lighting solution. Lumax is aligned to this change and through our excellent technological and manufacturing capabilities, which enable us to deliver end-to-end solutions; we are confident about making the most of these opportunities.
Our passion to excel is founded on inherent strengths – successful collaboration with our global partners, readiness to embrace new technology, sustained investments in capacity expansion and technology augmentation, staying lean and fit by continually improving operations and continued stable relationships with our suppliers and customers. Our capabilities and determination to excel will enable us to make new inroads in the products we offer and the customers we serve.
The automotive industry is at the forefront of technological growth and innovation and we are excited and energised about where we are headed, driven by this passion to excel.
AT LumAx InDusTrIEs LImITED, wE ArE DrIVEn by ThE pAssIOn TO ExcEL.
ThIs InspIrEs Our EVEry AcTIOn AnD Is bEhInD Our EVEry AccOmpLIshmEnT.
about US
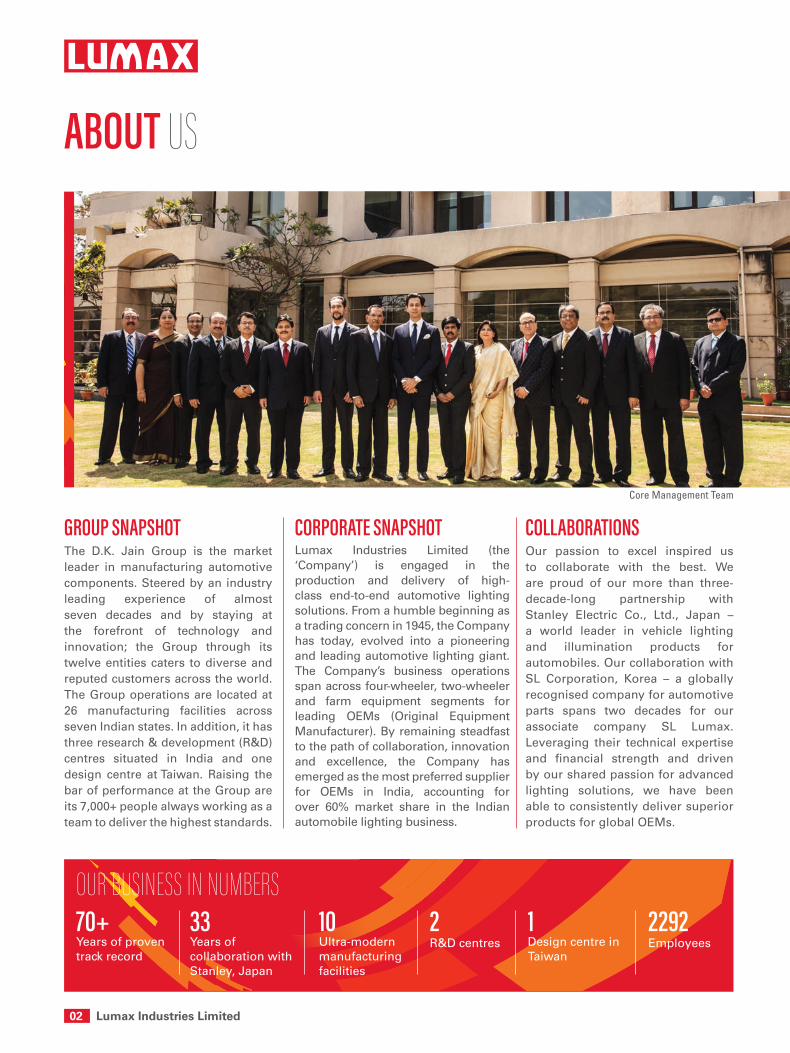
oUr BUSineSS in nUmBerS33Years of collaboration with Stanley, Japan
70+ Years of proven track record
2R&D centres
1 Design centre in Taiwan
10Ultra-modern manufacturing facilities
2292Employees
CollaborationsOur passion to excel inspired us to collaborate with the best. We are proud of our more than three-decade-long partnership with Stanley Electric Co., Ltd., Japan – a world leader in vehicle lighting and illumination products for automobiles. Our collaboration with SL Corporation, Korea – a globally recognised company for automotive parts spans two decades for our associate company SL Lumax. Leveraging their technical expertise and financial strength and driven by our shared passion for advanced lighting solutions, we have been able to consistently deliver superior products for global OEMs.
CorPorate snaPsHotLumax Industries Limited (the ‘Company’) is engaged in the production and delivery of high-class end-to-end automotive lighting solutions. From a humble beginning as a trading concern in 1945, the Company has today, evolved into a pioneering and leading automotive lighting giant. The Company’s business operations span across four-wheeler, two-wheeler and farm equipment segments for leading OEMs (Original Equipment Manufacturer). By remaining steadfast to the path of collaboration, innovation and excellence, the Company has emerged as the most preferred supplier for OEMs in India, accounting for over 60% market share in the Indian automobile lighting business.
GrouP snaPsHotThe D.K. Jain Group is the market leader in manufacturing automotive components. Steered by an industry leading experience of almost seven decades and by staying at the forefront of technology and innovation; the Group through its twelve entities caters to diverse and reputed customers across the world. The Group operations are located at 26 manufacturing facilities across seven Indian states. In addition, it has three research & development (R&D) centres situated in India and one design centre at Taiwan. Raising the bar of performance at the Group are its 7,000+ people always working as a team to deliver the highest standards.
core management Team
02 Lumax Industries Limited

ProDuCt PortFolio‘Lumax’ stands for Luminosity Maxima. Embodying this attribute, the products of the Company take automotive lighting to an entirely new level, meeting the customer requirements in today’s highly competitive business environment. The Company’s product portfolio comprises a wide array of complete automobile lighting systems and solutions and includes stellar quality Headlamps, Rear lamps, Sundry and Auxiliary lamps for four wheelers, two wheelers, trucks, buses, earthmovers, tractors and a variety of diverse applications.
GeoGraPHiCal PresenCe
Dharuhera, Gurugram, Bawal (Haryana) (3)
Pantnagar, Haridwar (Uttarakhand) (2)
Sanand (Gujarat) (1)
Corporate Office (Gurugram) (1)
Chakan, Chinchwad (2)R&D Centre (Chakan) (1)(Maharashtra)
R&D Centre (Gurugram) (1)
Bidadi (Karnataka) (1)
SL Lumax, Chennai (Tamil Nadu) (1)
Design Centre (Taiwan) (1)
manuFaCturinG FaCilities anD Quality CertiFiCationsOur ability to excel is powered by our nine state-of-the-art manufacturing facilities located across the country. All the facilities comply with the Quality Management Standard: ISO/TS 16949:2009 as well as to the Environmental Management System standard: ISO 14001:2004.
Note: Map not to scale
we are ProuD oF our more tHan tHree-DeCaDe-lonG PartnersHiP witH stanley eleCtriC Co., ltD.
- Manufacturing Units
- R&D Centre
- Corporate Office
Annual Report 2016-17 03
Co
rpo
rate Overview
Statu
tory R
epo
rtsFin
ancial S
tatemen
ts
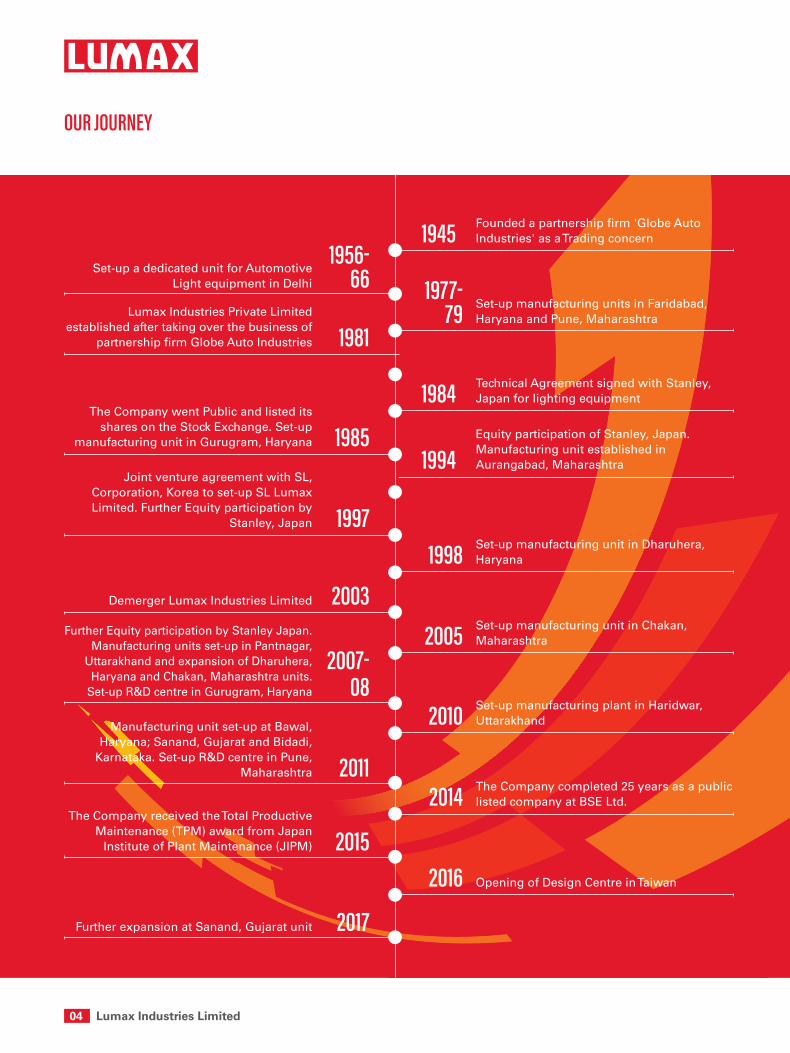
our Journey
Set-up a dedicated unit for Automotive Light equipment in Delhi
1956- 66
Founded a partnership firm 'Globe Auto Industries' as a Trading concern1945
Set-up manufacturing units in Faridabad, Haryana and Pune, Maharashtra
1977- 79
Technical Agreement signed with Stanley, Japan for lighting equipment 1984
Set-up manufacturing unit in Dharuhera, Haryana1998
Set-up manufacturing unit in Chakan, Maharashtra2005
Set-up manufacturing plant in Haridwar, Uttarakhand2010
The Company completed 25 years as a public listed company at BSE Ltd.2014
Opening of Design Centre in Taiwan2016
The Company went Public and listed its shares on the Stock Exchange. Set-up
manufacturing unit in Gurugram, Haryana 1985Joint venture agreement with SL,
Corporation, Korea to set-up SL Lumax Limited. Further Equity participation by
Stanley, Japan 1997
Demerger Lumax Industries Limited 2003Further Equity participation by Stanley Japan.
Manufacturing units set-up in Pantnagar, Uttarakhand and expansion of Dharuhera,
Haryana and Chakan, Maharashtra units. Set-up R&D centre in Gurugram, Haryana
2007- 08
Manufacturing unit set-up at Bawal, Haryana; Sanand, Gujarat and Bidadi,
Karnataka. Set-up R&D centre in Pune, Maharashtra 2011
The Company received the Total Productive Maintenance (TPM) award from Japan
Institute of Plant Maintenance (JIPM) 2015
Further expansion at Sanand, Gujarat unit 2017
Lumax Industries Private Limited established after taking over the business of
partnership firm Globe Auto Industries 1981
Equity participation of Stanley, Japan. Manufacturing unit established in Aurangabad, Maharashtra1994
04 Lumax Industries Limited

Customer PortFolio
two-wHeeler Four-wHeeler
traCtor/FesexPorts
CommerCial veHiCle
Annual Report 2016-17 05
Co
rpo
rate Overview
Statu
tory R
epo
rtsFin
ancial S
tatemen
ts

business model
unDerstanDinG Customers’ neeDsA deep understanding of our customer's specifications and the ability to design and engineer products to meet these specific needs is a non-negotiable attribute for success in our business. Guided by our deep domain expertise and experience of over 70 years, we are able to deliver the right products to global OEMs for their vehicles.
invest in ProDuCt DeveloPmentUnerring commitment to product development - both of the existing range and of new products - is crucial as a supplier to the automotive industry, which is always driving new designs and technology. Supported by our two in-house R&D centres and one overseas design centre in Taiwan, we are ahead of the curve in developing the perfect automotive lighting solution. Our investments in new product development, R&D, enables us to stay at the forefront of technology and develop products that meet our customers’ evolving needs.
Passion to exCel at meetinG Customers’ neeDsAt the heart of our business model is the constant endeavour of meeting customers' needs. Starting from understanding their specific requirements to manufacturing world-class products through advanced processes and robust supply chain, we believe that we can create sustainable business value, only when we create enhanced value for our customers.
06 Lumax Industries Limited

stronG suPPly CHainEnsuring an efficient and reliable supply chain is critical to providing the levels of quality and service our customers expect. Keeping this in perspective, we have laid strong emphasis in selecting the right suppliers for our raw material procurement. Not only does this ensure uninterrupted supply of quality inputs but also ensures a smoother ride through lower operational costs and risk, and most importantly increases our speed to market.
leveraGinG teCHnoloGyTo stay relevant and demonstrate efficiencies in business operations, embracing technology is undisputable, especially when serving the ever-evolving automobile industry. We recognised that long before, when almost three decades ago we entered into a Technical Assistance Agreement with Stanley Electric Co. Ltd., Japan, a world leader in vehicle lighting and illumination products for automobiles. Today, through this collaboration and by embedding cutting-edge technical solutions at our facilities, we are pioneers in bringing advanced automotive lighting solutions to the market.
stronG Customer relationsIn a business like ours, there is an imperative need to keep abreast of customer feedback, new technologies, new trends, etc. Through well-defined processes which regularly evaluate customer expectations, response and satisfaction for our products, we are able to develop strong relations with our customers. This high degree of customer understanding enables us to foster long-term relationship and provide access to new customers.Our reduced response time through process efficiency is another vital reason why we are able to maintain our competitive edge in this dynamic industry.
state-oF-tHe-art manuFaCturinGWe are continually investing in our capabilities and capacities to improve our manufacturing performance for our customers. Our ten state-of-the-art manufacturing facilities located across six states in India are in compliance with internationally recognised benchmarks. These facilities are well-equipped with latest international machinery and equipment for testing (with the latest engineering software) and simulation facilities, enabling us to deliver on our promise of quality products.
Annual Report 2016-17 07
Co
rpo
rate Overview
Statu
tory R
epo
rtsFin
ancial S
tatemen
ts
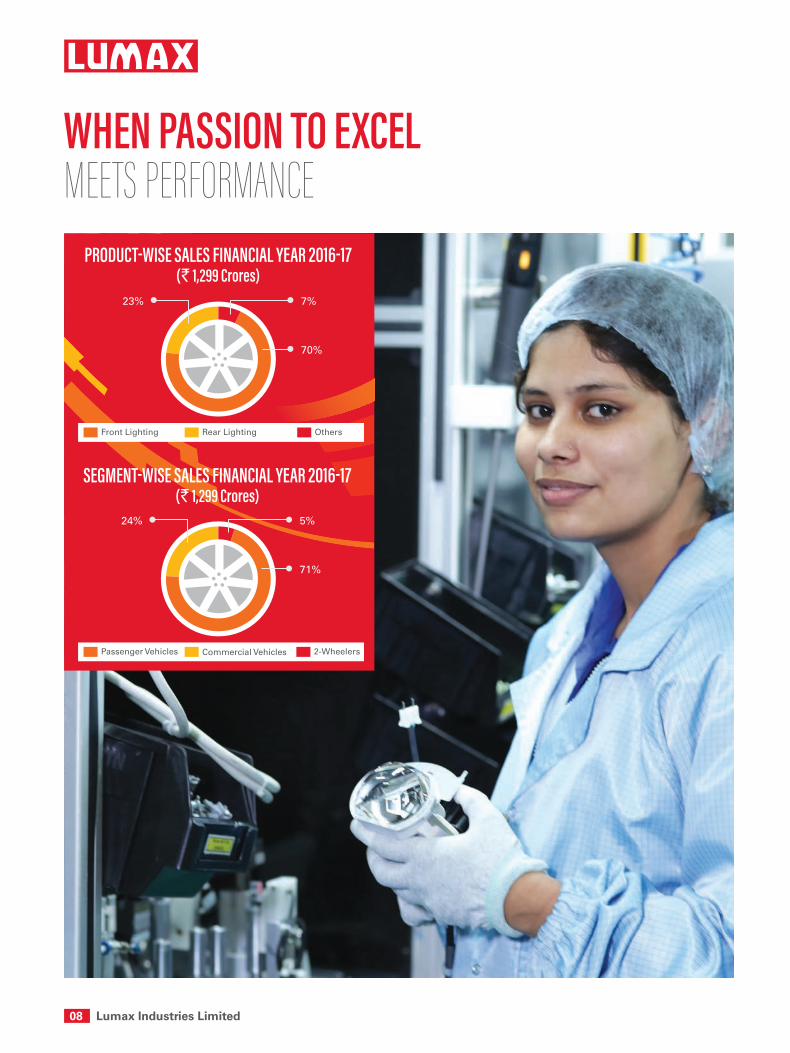
wHen Passion to exCel meetS Performance
ProDuCt-wise sales FinanCial year 2016-17(` 1,299 Crores)
seGment-wise sales FinanCial year 2016-17(` 1,299 Crores)
23% 7%
70%
24% 5%
71%
Front Lighting Rear Lighting Others
Passenger Vehicles Commercial Vehicles 2-Wheelers
08 Lumax Industries Limited
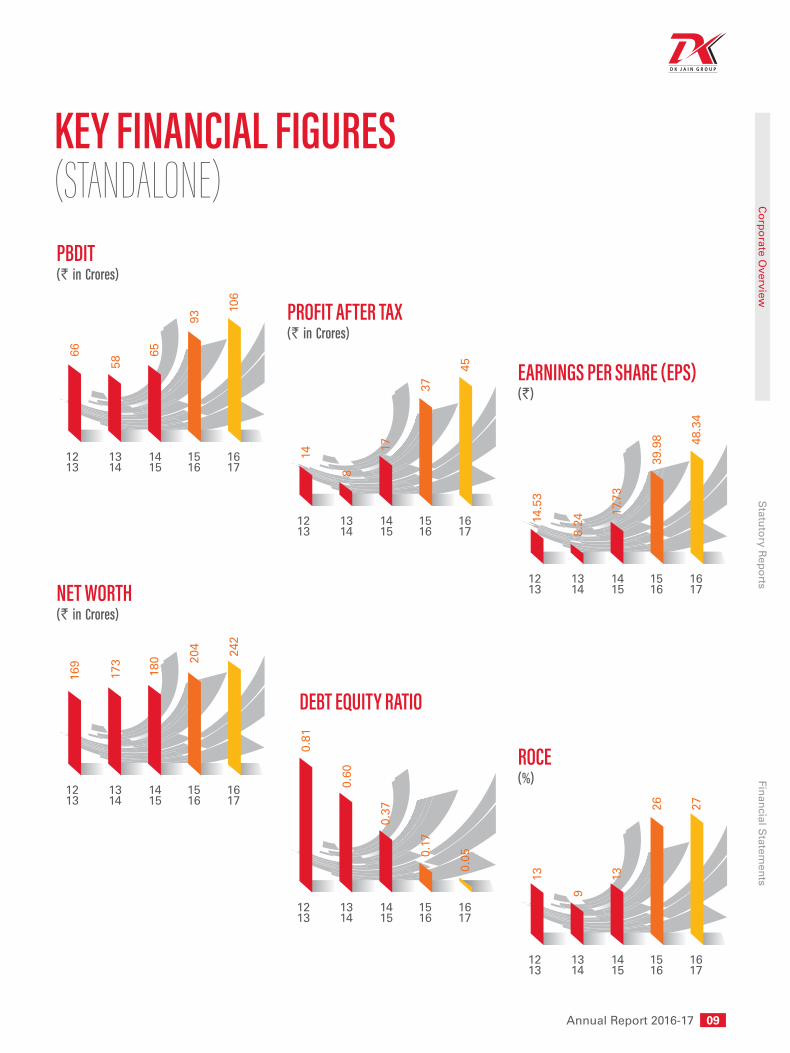
earninGs Per sHare (ePs)(`)
12 13
13 14
14 15
15 16
16 17
14.5
3
8.24
17.7
3
39.9
8 48.3
4
roCe(%)
12 13
13 14
14 15
15 16
16 17
9
26 27
13 13
PbDit (` in Crores)
12 13
13 14
14 15
15 16
16 17
66
58 65
93
106
net wortH (` in Crores)
12 13
13 14
14 15
15 16
16 17
169
173
180 20
4 242
ProFit aFter tax (` in Crores)
12 13
13 14
14 15
15 16
16 17
14
8
17
37
45
Debt eQuity ratio
12 13
13 14
14 15
15 16
16 17
0.81
0.60
0.37
0.17
0.05
key FinanCial FiGures(Standalone)
Annual Report 2016-17 09
Co
rpo
rate Overview
Statu
tory R
epo
rtsFin
ancial S
tatemen
ts

Passion to exCel by adoPting advanced technology
Fast replacing the traditional incandescent and halogen lamps, LED lighting is gathering momentum the world over. Not only are LED lights more energy-efficient, they are also far more durable. Their higher
The technological advancement and increasing integration of lighting products into vehicle styling is providing a great opportunity to Indian manufacturers and this scenario shall drive the future of automotive lighting. We are well equipped and ahead of the curve as we have already embraced and embedded the latest technology in automotive lighting.
energy efficiency translates into lower fuel consumption. LED light sources have a much longer lifetime that can outlast that of the vehicle. They also offer an unprecedented level of design versatility that is
essential for manufacturers, allowing them to differentiate their vehicles from the competition. Further, the manufacturing processes are getting more streamlined with the increased demand and economies of scale.
The automotive industry has always been a sector of swift changes triggered by technological advancements and changing consumer preferences. Today, in the field of automotive lighting, the industry is witnessing a steady shift towards LED-based systems from conventional lighting. The reasons are many and significant.
10 Lumax Industries Limited

aliGneD to tHe aDvantaGes oF leDs vs HaloGen bulbs, tHe automotive inDustry is witnessinG tHe Future moDels oF HeaDlamPs beinG rePlaCeD witH eitHer ProJeCtor HeaDlamP or leD
Aligned to the advantages of LEDs Vs Halogen Bulbs, the automotive industry is witnessing the future models of Headlamps being replaced with either Projector Headlamp or LED. Tail or Rear Lamps and interior lighting are also being developed by using LEDs.
The Company is well-positioned to capitalise on the evolving market opportunities. Through our partnership with Stanley, Japan, the only global auto lighting company to manufacture LED worldwide, we are at a vantage point in bringing to the market lamps developed by using LED technology. To reinforce our competitive edge, we depute our engineers every year at Stanley, Japan for enhancing their technical know-how and expertise.
Our strengths in rapid prototype development find their roots in our dedicated technology centre at Pune. Providing the highest level of technology to our non-Japanese customers, engineers at this centre benchmark processes to international standards and undertake designing, prototyping and product development. This indigenous operation by the Company introduces the latest technology to India and enables OEMs to optimise costs and get faster delivery of products.
liGHtinG FlexibilityLED automotive lighting will enable automakers to greatly improve night-time visibility as well as reduce glare for drivers of oncoming vehicles. LEDs through their adaptive lighting systems also increase illumination in areas that would otherwise be dark under traditional lighting systems.
eFFiCienCyLEDs are energy-efficient lighting, which reduce the load on the engine and this translates into lower fuel consumption. While a typical halogen headlight uses 55 watts of power to produce 350 lumens of light, an LED-headlight system uses only about 17 watts to produce far more light of 600 lumens.
DurabilityLED lights are extremely durable. With proper care, LEDs usually outlive the lifetime of the vehicle.
DesiGn FlexibilityA lot of attention is being given to aesthetics while deciding on the automotive to be purchased. Stylish exteriors and interiors are extremely important. With the growing emphasis on attractive lighting within the vehicle, the demand for LEDs is on the rise, thanks to their warm light, small size, and availability in different shapes to match the requirements of different automobile models. Also, the lighting content within a vehicle, especially in a car, is increasing.
Annual Report 2016-17 11
Co
rpo
rate Overview
Statu
tory R
epo
rtsFin
ancial S
tatemen
ts
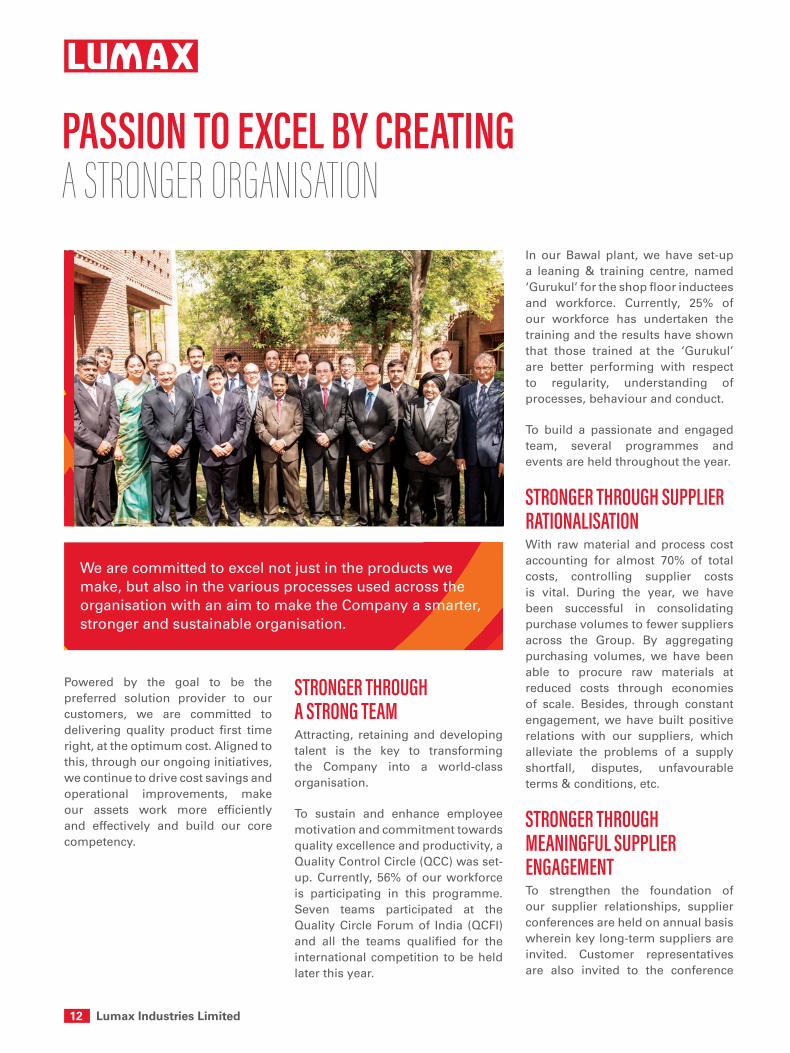
Passion to exCel by CreatinG a Stronger organiSation
Powered by the goal to be the preferred solution provider to our customers, we are committed to delivering quality product first time right, at the optimum cost. Aligned to this, through our ongoing initiatives, we continue to drive cost savings and operational improvements, make our assets work more efficiently and effectively and build our core competency.
stronGer tHrouGH a stronG team Attracting, retaining and developing talent is the key to transforming the Company into a world-class organisation.
To sustain and enhance employee motivation and commitment towards quality excellence and productivity, a Quality Control Circle (QCC) was set-up. Currently, 56% of our workforce is participating in this programme. Seven teams participated at the Quality Circle Forum of India (QCFI) and all the teams qualified for the international competition to be held later this year.
In our Bawal plant, we have set-up a leaning & training centre, named ‘Gurukul’ for the shop floor inductees and workforce. Currently, 25% of our workforce has undertaken the training and the results have shown that those trained at the ‘Gurukul’ are better performing with respect to regularity, understanding of processes, behaviour and conduct.
To build a passionate and engaged team, several programmes and events are held throughout the year.
stronGer tHrouGH suPPlier rationalisationWith raw material and process cost accounting for almost 70% of total costs, controlling supplier costs is vital. During the year, we have been successful in consolidating purchase volumes to fewer suppliers across the Group. By aggregating purchasing volumes, we have been able to procure raw materials at reduced costs through economies of scale. Besides, through constant engagement, we have built positive relations with our suppliers, which alleviate the problems of a supply shortfall, disputes, unfavourable terms & conditions, etc.
stronGer tHrouGH meaninGFul suPPlier enGaGementTo strengthen the foundation of our supplier relationships, supplier conferences are held on annual basis wherein key long-term suppliers are invited. Customer representatives are also invited to the conference
We are committed to excel not just in the products we make, but also in the various processes used across the organisation with an aim to make the Company a smarter, stronger and sustainable organisation.
12 Lumax Industries Limited
so that they can get a ringside view of the technologies the Company is planning to embed across its processes. Future prospects, industry developments, challenges and expectations are discussed which enables a systematic approach to collaboration and cost reduction. The two-way communication is further given a fillip with suppliers, where an opportunity of a one-to-one interaction with the senior management is provided. Both open and written feedback is shared by the suppliers. Leveraging our suppliers’ strong pulse of the market and industry, a SWOT analysis of the Company is done by the suppliers. These insights enable us to gauge the perception of Lumax as a brand and the areas that need to be worked upon. Finally, outstanding suppliers are recognised by the management for their commitment to quality, service, cost and delivery. This recognition programme creates stronger partnerships.
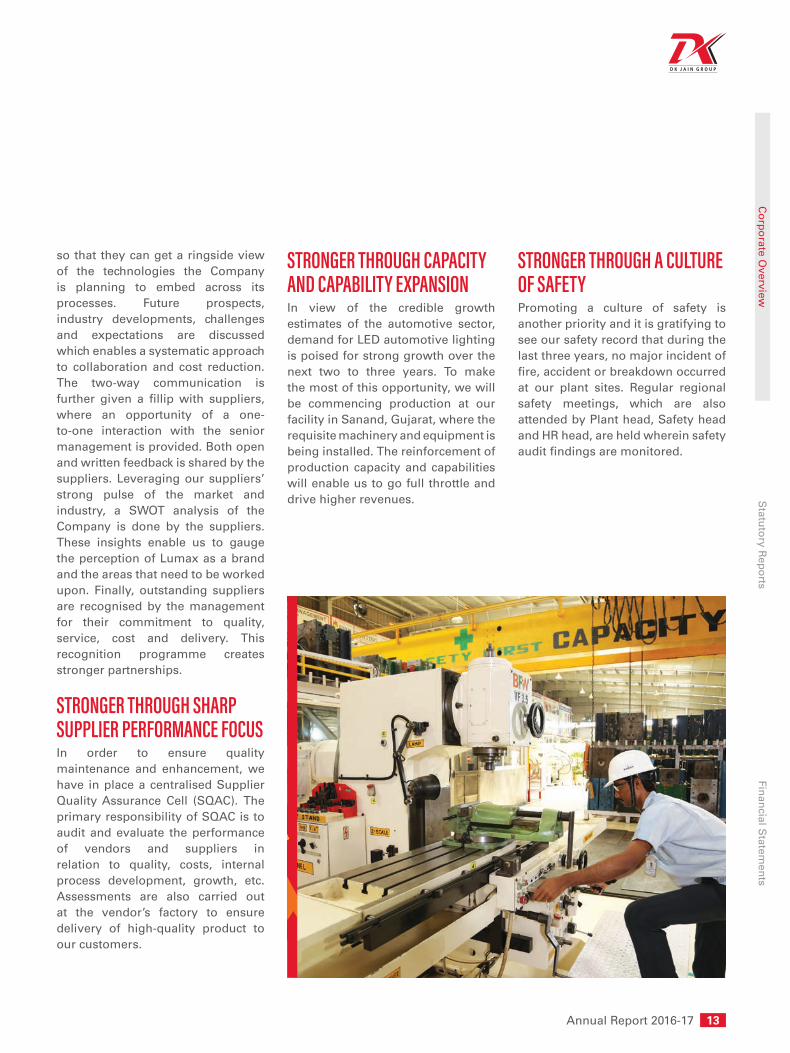
stronGer tHrouGH sHarP suPPlier PerFormanCe FoCusIn order to ensure quality maintenance and enhancement, we have in place a centralised Supplier Quality Assurance Cell (SQAC). The primary responsibility of SQAC is to audit and evaluate the performance of vendors and suppliers in relation to quality, costs, internal process development, growth, etc. Assessments are also carried out at the vendor’s factory to ensure delivery of high-quality product to our customers.
stronGer tHrouGH CaPaCity anD CaPability exPansionIn view of the credible growth estimates of the automotive sector, demand for LED automotive lighting is poised for strong growth over the next two to three years. To make the most of this opportunity, we will be commencing production at our facility in Sanand, Gujarat, where the requisite machinery and equipment is being installed. The reinforcement of production capacity and capabilities will enable us to go full throttle and drive higher revenues.
stronGer tHrouGH a Culture oF saFetyPromoting a culture of safety is another priority and it is gratifying to see our safety record that during the last three years, no major incident of fire, accident or breakdown occurred at our plant sites. Regular regional safety meetings, which are also attended by Plant head, Safety head and HR head, are held wherein safety audit findings are monitored.
Annual Report 2016-17 13
Co
rpo
rate Overview
Statu
tory R
epo
rtsFin
ancial S
tatemen
ts

Passion to exCel enDorseD by awardS
Best Supplier Award received from TAFE
Won Bronze Award for Excellence in Technology - Large Category from ACMA
Supplier Business Capability Award received from Mahindra & Mahindra Limited
Award received for Quality Improvement from Maruti Suzuki India Limited
14 Lumax Industries Limited
CorPorate soCial reSPonSiBility
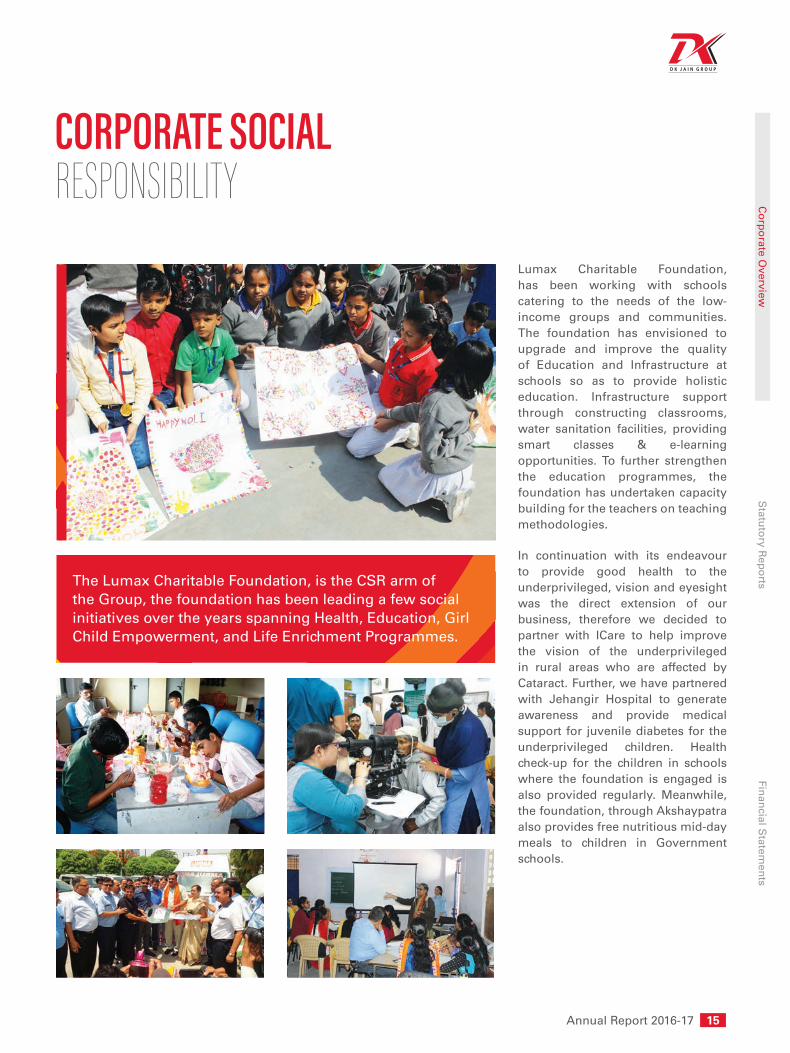
Lumax Charitable Foundation, has been working with schools catering to the needs of the low-income groups and communities. The foundation has envisioned to upgrade and improve the quality of Education and Infrastructure at schools so as to provide holistic education. Infrastructure support through constructing classrooms, water sanitation facilities, providing smart classes & e-learning opportunities. To further strengthen the education programmes, the foundation has undertaken capacity building for the teachers on teaching methodologies.
In continuation with its endeavour to provide good health to the underprivileged, vision and eyesight was the direct extension of our business, therefore we decided to partner with ICare to help improve the vision of the underprivileged in rural areas who are affected by Cataract. Further, we have partnered with Jehangir Hospital to generate awareness and provide medical support for juvenile diabetes for the underprivileged children. Health check-up for the children in schools where the foundation is engaged is also provided regularly. Meanwhile, the foundation, through Akshaypatra also provides free nutritious mid-day meals to children in Government schools.
The Lumax Charitable Foundation, is the CSR arm of the Group, the foundation has been leading a few social initiatives over the years spanning Health, Education, Girl Child Empowerment, and Life Enrichment Programmes.
Annual Report 2016-17 15
Co
rpo
rate Overview
Statu
tory R
epo
rtsFin
ancial S
tatemen
ts

manaGement meSSage
Dear Shareholders,
The global economy has thrown up a new set of challenges during the Financial Year 2016-17, however, the Indian economy continues to strengthen, notwithstanding the temporary slowdown in business activities due to the surprise demonetisation in November 2016. The Government’s strong intent and focus towards digitalising the economy, financial inclusion, infrastructure development, enhancing ease of doing business and reducing the share of the parallel cash economy is expected to usher in a new era of economic growth. The expected rollout of the Goods and Services Tax later this year, which initially may lead to a dip in growth and revenues due to teething troubles, is expected to raise India’s GDP growth rate.
The automotive sector, often regarded as the bellwether of economic growth, witnessed satisfactory performance during the year under review. With the two-wheeler segment predominantly driven by demand from the rural market, the improved performance of the agriculture sector on the back of good monsoon helped to revive demand. The four-wheeler segment also showed traction with car sales in financial year 2016-17 increasing despite demonetisation move. The sector still has considerable potential for achieving even higher figures of growth in the coming years. India’s low per capita vehicle ownership across segments vis-à-vis advanced and major developing economies,
16 Lumax Industries Limited
rise of the middle-class leading to increased availability of income for more discretionary spending, favourable demographic profile and the Government’s continued thrust to infrastructure development for improving connectivity and to its flagship programme ‘Make in India’, all provide an exciting backdrop for growth of the sector and the ancillary industries.
While there is no ambiguity on the growth potential of the Indian automotive sector, it is also certain that new technologies and trends will provide a new dimension to the nature of demand. Growing focus towards a greener and sustainable world is fuelling the demand for energy-efficient transportation. The automotive lighting industry, is seeing a steady shift towards the use of LED lamps - a lighting option, which is energy-efficient, gives vehicle a premium look and instant recognition on the road, even in low light conditions. As a leading Company in the automotive lighting industry with the latest technology and expertise to manufacture LED lamps, we are confident that we are positioned to make the most of these opportunities.
your ComPany is steereD by tHe vision oF beCominG tHe Globally-PreFerreD suPPlier For automotive liGHtinG solutions
During Financial Year 2016-17, your Company’s profitability grew by 21% as compared to previous year despite marginal increase in turnover of about 4%. This became possible due to our concerted focus on reducing raw material cost and sharp focus on quality. Your Company’s debts have reduced considerably as reflected in our improved debt equity ratio of 0.05. Also, the improved credit rating of A1+ is further proof of your Company’s strengthened financial stability. Driven by the goal of enhancing shareholder value, we are pleased to share that your Company’s market capitalisation has crossed `1300 Crores during the year under review.
Your Company is steered by the vision of becoming the globally preferred supplier for automotive lighting solutions. With our vision etched out, we are investing in infrastructure, technology, product development, processes and of course, in human capital. We are revamping and augmenting our existing facility at Sanand to cater to the requirements of leading automotive manufacturers. For improving our speed-to-market, we
are strengthening our design office in Taiwan and relationship with suppliers. Leveraging our sustained relationship with Stanley Electric Co., Ltd., Japan, global leader in the automotive lighting sector, we are confident that we will gain access to advanced technologies that few select players in the country have.
Going forward, we will continue to keep an eagle eye on quality through innovative and proactive quality control systems. Our zero defect & zero effect initiative will reinforce the confidence of our customers for our products and drive greater business opportunities. Our people across all locations have consistently risen to the challenges of this dynamic industry and have delivered beyond expectations driven by their passion to excel.
Last but not the least, we would like to thank all our employees, partners, vendors and shareholders for their continued support and our customers for their confidence in our products. We are ready for the road ahead and to build greater value for all our stakeholders.
Regards,
D.K. Jain Deepak Jain Anmol JainChairman Managing Director Joint Managing Director
Annual Report 2016-17 17
Co
rpo
rate Overview
Statu
tory R
epo
rtsFin
ancial S
tatemen
ts

1. Mr. Rattan Kapur (Independent Director)
2. Mr. Rajeev Kapoor (Independent Director)
3. Mr. M.C. Gupta (Independent Director)
4. Mr. Koji Sawada (Executive Director)
5. Mr. Anmol Jain (Joint Managing Director)
6. Mr. D.K. Jain (Non-Executive Chairman)
From left to right
boarD oF directorS
18 Lumax Industries Limited

7. Mr. Deepak Jain (Managing Director)
8. Mr. A.P. Gandhi (Independent Director)
9. Mr. Eiichi Hirooka (Senior Executive Director)
10. Mr. Dhiraj Dhar Gupta (Independent Director)
11. Mrs. Pallavi Dinodia Gupta (Independent Director)
12. Mr. Toru Tanabe (Non-Executive Director)
Annual Report 2016-17 19
Co
rpo
rate Overview
Statu
tory R
epo
rtsFin
ancial S
tatemen
ts

our business strenGtHs
FinanCial stabilityConsistent financial performance with improving return ratios
enDurinG PartnersHiPsOver 3 decades of collaboration with global auto lighting company Stanley, Japan
Proximity to CustomersFacilities located at key automotive hubs in the country which provide a logistical advantage
robust ProDuCt PortFolio Among the few select companies to have a comprehensive range of lighting solutions
teCHniCal exPertiseCutting-edge processes at facilities which enable flawless execution
inFrastruCtural exCellenCe 10 state-of-the-art manufacturing facilities, 2 R&D centres & 1 overseas design centre
20 Lumax Industries Limited
Annual Report 2016-17 21
Co
rpo
rate Overview
Statu
tory R
epo
rtsFin
ancial S
tatemen
ts
To The Members,
Your Directors are pleased to present the 36th Annual Report on the business and operations together with Audited Balance Sheet and Profit & Loss Account of your Company for the year ended March 31, 2017.
Financial Results
Your Company’s performance during the year as compared with the previous year is summarized below:
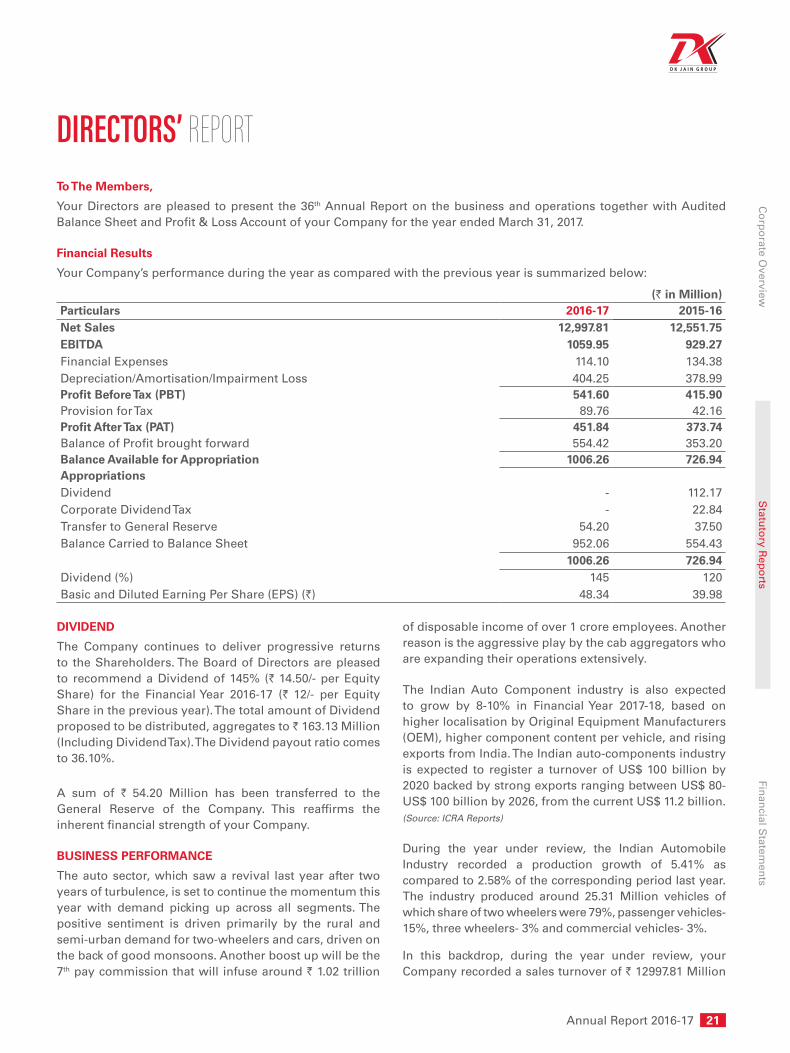
(` in Million)Particulars 2016-17 2015-16Net Sales 12,997.81 12,551.75EBITDA 1059.95 929.27Financial Expenses 114.10 134.38Depreciation/Amortisation/Impairment Loss 404.25 378.99Profit Before Tax (PBT) 541.60 415.90Provision for Tax 89.76 42.16Profit After Tax (PAT) 451.84 373.74Balance of Profit brought forward 554.42 353.20Balance Available for Appropriation 1006.26 726.94AppropriationsDividend - 112.17Corporate Dividend Tax - 22.84Transfer to General Reserve 54.20 37.50Balance Carried to Balance Sheet 952.06 554.43
1006.26 726.94Dividend (%) 145 120Basic and Diluted Earning Per Share (EPS) (`) 48.34 39.98
DIVIDEND
The Company continues to deliver progressive returns to the Shareholders. The Board of Directors are pleased to recommend a Dividend of 145% (` 14.50/- per Equity Share) for the Financial Year 2016-17 (` 12/- per Equity Share in the previous year). The total amount of Dividend proposed to be distributed, aggregates to ` 163.13 Million (Including Dividend Tax). The Dividend payout ratio comes to 36.10%.
A sum of ` 54.20 Million has been transferred to the General Reserve of the Company. This reaffirms the inherent financial strength of your Company.
BUSINESS PERFORMANCE
The auto sector, which saw a revival last year after two years of turbulence, is set to continue the momentum this year with demand picking up across all segments. The positive sentiment is driven primarily by the rural and semi-urban demand for two-wheelers and cars, driven on the back of good monsoons. Another boost up will be the 7th pay commission that will infuse around ` 1.02 trillion
of disposable income of over 1 crore employees. Another reason is the aggressive play by the cab aggregators who are expanding their operations extensively.
The Indian Auto Component industry is also expected to grow by 8-10% in Financial Year 2017-18, based on higher localisation by Original Equipment Manufacturers (OEM), higher component content per vehicle, and rising exports from India. The Indian auto-components industry is expected to register a turnover of US$ 100 billion by 2020 backed by strong exports ranging between US$ 80- US$ 100 billion by 2026, from the current US$ 11.2 billion.(Source: Icra reports)
During the year under review, the Indian Automobile Industry recorded a production growth of 5.41% as compared to 2.58% of the corresponding period last year. The industry produced around 25.31 Million vehicles of which share of two wheelers were 79%, passenger vehicles- 15%, three wheelers- 3% and commercial vehicles- 3%.
In this backdrop, during the year under review, your Company recorded a sales turnover of ` 12997.81 Million
Directors’ RepoRt

22 Lumax Industries Limited
as against ` 12551.75 Million in the corresponding year registering a growth of 3.56%. The profit for the year after tax recorded at ` 451.84 Million as compared to ` 373.74 Million during the previous year registering an excellent growth of 20.90%.
CAPACITY EXPANSION / MODERNISATION OF FACILITIES
During the year under review, the Company has made investment to the tune of ` 654 million towards up-gradation of its Research and Development facilities, modernisation of its existing manufacturing facilities including Bawal, Dharuhera and Chakan plants.
The Company has set-up its first international state-of-the-art Design centre in Taiwan in May, 2016, as a strategic move to expand its presence across the globe and strengthen the synergies of cost and technology.
During the year under review, the Company has also approved investment of about ` 120 crores to its existing plant at Sanand, which was set-up in the year 2011 for supplies to Tata Nano and which was non-operational due to subdued volumes of Tata Nano. The plant is expected to commence operations from November 2017, for supplies to Suzuki Motors, Gujarat and will also cater to Tata Motors Limited and Honda Motorcycle and Scooter India Limited, at a later stage. The investment will spread over a period of 2 years i.e. Financial Year 2017-18 and Financial Year 2018-19.
A detailed discussion on the business performance and future outlook is provided in the Chapter on Management Discussion & Analysis Report (MDA).
TECHNOLOGY AND QUALITY
Your Company continues to excel in Design, Development and New Product launches, in line with its strategy towards delivering competitive advantage to the customer and to meet its business objectives. The management ensures that the engineers of your Company are fully aligned with the organisation’s strategy and towards this end, the Company has started to celebrate September 15th as Innovation day, as a tribute to the greatest engineer Bharat Ratna, Late Shri M. Visvesvaraya. This step will ensure building in-house engineering and design capability.
In order to continuously create value for our customers in today’s intense competitive environment, your Company has launched Zero Defect & Zero Effect initiative to deliver products, first time right to its customers. This will help in improvement in quality, reduction in rejection cost and thereby optimise cost structures across your Company.
DIRECTORS & KEY MANAGERIAL PERSONNEL
In accordance with the Articles of Association of the Company and the Companies Act, 2013, Mr. Eiichi Hirooka, Director is retiring by rotation at the ensuing Annual General Meeting and being eligible, offers himself for re-appointment.
The tenure of Mr. Eiichi Hirooka, Senior Executive Director is expiring on July 26, 2017. The Board recommends to reappoint Mr. Eiichi Hirooka as Senior Executive Director for a further period of 3 years w.e.f. July 27, 2017, subject to the approval of the members in the ensuing Annual General Meeting.
Stanley Electric Co., Ltd. (Stanley) had withdrawn the nomination of Mr. Norihisa Sato, Executive Director from the Board of the Company. Consequently, Mr. Norihisa Sato resigned from the Board of the Company w.e.f. 08-08-2016. The Board of Directors places on record its appreciation for the valuable services rendered by Mr. Norihisa Sato during his tenure as Executive Director.
Stanley nominated Mr. Koji Sawada in place of Mr. Norihisa Sato. Pursuant to his nomination, the Board of Directors have appointed Mr. Koji Sawada, as additional Director as well as Executive Director w.e.f. 09-08-2016, for the time being, on the Board of the Company at their meeting held on August 8, 2016, subject to his regular appointment in the Annual General Meeting.
Mr. Koji Sawada, aged 54 years, is a Graduate from Osaka Institute of Technology, Japan, having over 30 years of rich experience in Quality Control and Lamp assembly. He joined Stanley, Japan in 1986 and has abundant experience and knowledge in the automobile lighting field.
In accordance with the Articles of Association of the Company and the Companies Act, 2013, Mr. Koji Sawada holds office till the ensuing Annual General Meeting. The Company has received Notice in respect of Mr. Koji Sawada from a member under Section 160 of the Companies Act, 2013 proposing his appointment as Director of the Company liable to retire by rotation.
Mr. Gursaran Singh, Independent Director on the Board of the Company since January, 2003 has resigned from the position of Independent Director due to his other commitments w.e.f. April 19, 2017. His resignation was accepted and taken on record by the board in its meeting held on May 13, 2017.
The Board places on record its sincere appreciation and gratitude for the valuable guidance received from Mr. Gursaran Singh during his tenure as Independent Director on the board of your Company.

Annual Report 2016-17 23
Co
rpo
rate Overview
Statu
tory R
epo
rtsFin
ancial S
tatemen
ts
The Board has appointed Mr. Rajeev Kapoor as an additional director, w.e.f. May 13, 2017 designated as an Independent Director, for the time being, on the Board of the Company at their meeting held on May 13, 2017, subject to his regular appointment in the Annual General Meeting.
Mr. Rajeev Kapoor, aged 65 years, is a B.E. (Mechanical) (Hons.) from NIT, Kurukshetra, having extensive experience of over 40 years in Automotive, Engineering and FMCG, Corporations with specific skills in General Management, Marketing / Brand Management, Performance Analysis, HRD, Business Development, Innovation and Change Management. He is credited with Launch of Fiat and Copart Businesses from Greenfield stage and developing them to sustainable level.
In accordance with the Articles of Association of the Company and the Companies Act, 2013, Mr. Rajeev Kapoor holds office till the ensuing Annual General Meeting. The Company has received a Notice in respect of Mr. Rajeev Kapoor, from a member under Section 160 of the Companies Act, 2013 proposing his appointment as Director of the Company for five consecutive years w.e.f. May 13, 2017, not liable to retire by rotation.
Your Directors recommend the re-appointment/ appointment of the above Directors at the ensuing Annual General Meeting.
The Independent Directors have given declarations that they meet the criteria of independence as laid down under Section 149(6) of the Companies Act, 2013.
EXTRACT OF ANNUAL RETURN
In accordance with the requirement of Section 92 of Companies Act, 2013 read with Rule 12 of the Companies (Management and Administration) Rules, 2014, the extract of the annual return in Form MGT 9 is annexed as Annexure - A.
INVESTOR EDUCATION AND PROTECTION FUND (IEPF)
Pursuant to the applicable provisions of the Companies Act, 2013, read with the IEPF Authority (Accounting, Audit, Transfer and Refund) Rules, 2016 (‘the Rules’), all unpaid or unclaimed dividends are required to be transferred by the Company to the IEPF established by the Central Government, after the completion of seven years. Further, according to the Rules, the shares in respect of which dividend has not been paid or claimed by the shareholders for seven consecutive years or more shall also be transferred to the demat account of IEPF authority. Accordingly, all such shares shall be transferred as per the requirement of IEPF Rules. The details of such
shares is available on the Company’s website http://www.lumaxindustries.com/investor/iepf-investor-details.html.
NUMBER OF BOARD MEETINGS
The Board of Directors met 5 (Five) times in the Financial year 2016-17. The details of the board meetings and the attendance of the Directors are provided in the Corporate Governance Report.
DIRECTORS RESPONSIBILITY STATEMENT
As required under Section 134(5) of the Companies Act, 2013 the Directors state:
(i) that in the preparation of the Annual Accounts for the Financial Year ended March 31, 2017, the applicable Accounting Standards have been followed along with proper explanation relating to material departures in the Auditor Report and Notes to Accounts;
(ii) that the Directors have selected such accounting policies and applied them consistently and made judgments and estimates that are reasonable and prudent so as to give a true and fair view of the state of affairs of the company at the end of the financial year and of the profit and loss of the company for that period;
(iii) that the Directors have taken proper and sufficient care for the maintenance of adequate accounting records in accordance with the provisions of the Companies Act, 2013 for safeguarding the assets of the company and for preventing and detecting fraud and other irregularities;
(iv) that the Directors have prepared the Annual Accounts on a “going concern” basis.
(v) that the Directors had laid down internal financial controls to be followed by the company and that such internal financial controls are adequate and were operating effectively.
(vi) that the Directors had devised proper systems to ensure compliance with the provisions of all applicable laws and that such systems were adequate and operating effectively.
REMUNERATION POLICY
The Company follows a policy on remuneration of Directors and Senior Management Employees. The Policy is approved by the Nomination & Remuneration Committee and the Board. The Remuneration Policy is stated in the Corporate Governance Report.

24 Lumax Industries Limited
FIXED DEPOSITS
During the year under review, the Company has not accepted any Deposit under Section 73 of the Companies Act, 2013 read with the Companies (Acceptance of Deposits) Rules, 2014.
AUDITORS
STATUTORY AUDITORS
The members in their meeting held on August 22, 2014 had appointed M/s S.R. Batliboi & Co. LLP, Chartered Accountants, as Statutory Auditors of the Company for a period of 3 consecutive years in terms of the provisions of Section 139 of the Companies Act, 2013 read with the Companies (Audit and Auditors) Rules, 2014, to hold the office of auditors till the conclusion of the fourth consecutive Annual General Meeting of the Company to be held in the year 2017. The tenure of M/s S.R. Batliboi & Co. LLP, Chartered Accountants, as Statutory Auditors is expiring in the ensuing Annual General Meeting proposed to be held on July 22, 2017.
In terms of the provisions of Section 139 of Companies Act, 2013 and the Rules made thereunder regarding mandatory retirement of statutory auditors, your Directors proposed to appoint BSR & Associates LLP, Chartered Accountants (Firm Registration No. 116231W/ W-100024) as the Statutory auditors of the Company. BSR & Associates LLP will hold office of auditors for a period of 5 consecutive years from the conclusion of 36th Annual General Meeting of the Company scheduled to be held on July 22, 2017, till the conclusion of the 41st Annual General Meeting of the Company to be held in the year 2022, subject to the approval of shareholders of the Company. They have given their consent to act as Auditors of the Company and have further confirmed that their appointment, if made, would be in conformity with the provisions of Section 141 of the Companies Act, 2013. The Audit Committee in its meeting held on May 13, 2017 has also recommended the appointment of BSR & Associates LLP, as Statutory Auditors of the Company. Your Directors also recommend for appointment in the ensuing Annual General Meeting.
During the year, all the recommendations of the Audit Committee were accepted by the Board. Hence, there is no need for disclosure of the same in this Report.
COST AUDITORS
The Board has re-appointed M/s Jitender, Navneet & Co. as the Cost Auditors of the Company in accordance with Section 148 and other applicable provisions, if any, of the Companies Act, 2013, for the audit of the cost accounts of the Company for the Financial Year 2016-17. The Cost Audit Report for the Financial Year 2015-16 has been filed
with the Central Government within the stipulated time on September 6, 2016.
SECRETARIAL AUDITOR
Pursuant to the provisions of Section 204 of the Companies Act, 2013 read with the Companies (Appointment and Remuneration of Managerial Personnel) Rules, 2014, the Company has appointed Mr. Maneesh Gupta, Practising Company Secretary as the Secretarial Auditor of the Company to undertake the Secretarial Audit for the financial year 2016-17. The Report of the Secretarial Audit is annexed herewith as Annexure - B.
PARTICULARS OF LOANS, GUARANTEES AND INVESTMENTS
The particulars of loans, guarantees and investments covered under the provisions of Section 186 of Companies Act, 2013 are given in the Notes to financial statements.
CONSOLIDATED FINANCIAL STATEMENTS
The company has consolidated the Financial Statements of its Associate Company SL Lumax Limited with its financials in accordance with the provisions of Companies Act, 2013. The Consolidated Financial Statements of the Company are prepared in accordance with the Accounting Standards, Companies Act, 2013, SEBI (Listing Obligations and Disclosure Requirements) Regulations 2015 and all other applicable laws for the time being in force and the same forms part of this Annual Report.
The Audited Financial Statements, including the Consolidated Financial Statements and related information are available on the website of the Company i.e. www.lumaxindustries.com. These documents shall also be available for inspection by any shareholder at the registered office of the Company.
RELATED PARTY TRANSACTION AND POLICY
In accordance with the provisions of the Companies Act, 2013 and SEBI (Listing Obligations And Disclosure Requirements) Regulations, 2015 the company has formulated a policy on Related Party Transactions, which is available on the Company’s website at http://www.lumaxindustries.com/pdf/related-party-transaction-policy.pdf. All Related Party Transactions, which are foreseen and repetitive in nature, are placed before the Audit Committee on a yearly basis for obtaining prior omnibus approval of the committee. The transactions entered into pursuant to the omnibus approval are placed before the Audit Committee for review and approval. All Related Party Transactions are subjected to independent review by a reputed accounting firm to establish compliance with the provisions of Companies Act, 2013 and Listing Regulations.

Annual Report 2016-17 25
Co
rpo
rate Overview
Statu
tory R
epo
rtsFin
ancial S
tatemen
ts
All related party transactions entered during the financial year were in the ordinary course of business and on arm’s length basis. There have been no material related party transactions undertaken by the Company during the year. Accordingly, no transactions are being reported in Form No. AOC-2 in terms of Section 134 of the Companies Act, 2013.
VIGIL MECHANISM
The Company has established a vigil mechanism named Whistle Blower Policy, for directors, employees and business associates to report to the management, concerns about unethical behaviour, actual or suspected fraud or violation of the Company’s code of conduct or ethics policy, in accordance with the provisions of Companies Act, 2013 and SEBI (Listing Obligations And Disclosure Requirements) Regulations, 2015. The mechanism provides for adequate safeguards against unfair treatment of whistle blower who wishes to raise a concern and also provides for direct access to the Chairman of the Audit committee in appropriate/ exceptional cases. The Whistle Blower Policy is uploaded on the website of the Company.
MATERIAL CHANGES AND COMMITMENTS
No other material changes and commitments affecting the Financial position of the Company have occurred between April 1, 2017 and the date on which this Report has been signed.
INFORMATION ON CONSERVATION OF ENERGY, TECHNOLOGY ABSORPTION, FOREIGN EXCHANGE EARNINGS AND OUTGO
Disclosure of information regarding Conservation of Energy, Research & Development, Technology Absorption and Foreign Exchange Earning and Outgo etc. under Section 134(3)(m) of the Companies Act, 2013 read with the Companies (Accounts) Rules, 2014, is annexed separately as Annexure – C.
RISK MANAGEMENT POLICY
The Company has adopted an enterprise risk management policy and established a risk management framework with an objective of timely identification, mitigation and control of the risks, which may threaten the existence of the Company, in accordance with the provisions of Companies Act, 2013 and SEBI (Listing Obligations And Disclosure Requirements) Regulations, 2015. The Company has also constituted a Risk Management Committee to review the risk trend, exposure, potential impact and their mitigation plans and periodically the key risks are also discussed at the Audit Committee.
CORPORATE SOCIAL RESPONSIBILITY (CSR) POLICY AND INITIATIVES
Your Company’s Corporate Social Responsibility (CSR) initiative is about achieving organisation excellence in ways that honor ethical values and respect people and communities. The Company’s CSR programmes are being implemented through its CSR arm Lumax Charitable Foundation. The key focus areas of your Company are education, promotion of girl chid and the healthcare, for disadvantaged section of the society. During the year, your Company’s spend on CSR activities is 1.80% of the average net profits during the three immediately preceding financial years. Your Company endeavoured to meet the budgeted expenditure in its CSR activities and has committed to incur expenditure for CSR initiatives, however, discontinuance of support to one school has resulted into a shortfall as such in the CSR expenditure as compared to the stipulated 2% of the average net profits of the last three financial years. The Company is committed to spend 2% of the average net profits of the last three financial years on CSR activities and it shall ensure compliance of the same going forward.
The Company has constituted a CSR Committee of the Board and also developed & implemented a CSR Policy in accordance with the provisions of Companies Act, 2013. The Committee monitors and oversees various CSR initiatives and activities of the Company. The details of CSR Policy is available on the Company’s website http://www.lumaxindustries.com/pdf/CSR-policy.pdf. The annual report on Corporate Social Responsibility activities is annexed herewith as Annexure-D.
PERFORMANCE EVALUATION OF BOARD, COMMITTEE AND DIRECTORS
During the year, the evaluation of the Board as a whole, committees and all the Directors conducted, as per the internally designed evaluation process approved by the Board. The evaluation tested key areas of the Board’s work including strategy, business performance, risk and governance processes. The evaluation considers the balance of skills, experience, independence and knowledge of the management and the Board, its overall diversity, and analysis of the Board and its Directors’ functioning. The feedback of the evaluation exercise was collated and presented to the Board.
MANAGEMENT DISCUSSION & ANALYSIS REPORT
Pursuant to the provisions of Regulation 34 of the SEBI (Listing Obligations And Disclosure Requirements) Regulations, 2015, Management Discussion & Analysis Report is annexed as part of this report separately as Annexure – E.

26 Lumax Industries Limited
SIGNIFICANT AND MATERIAL ORDERS PASSED BY THE REGULATORS OR COURTS
There are no significant and material orders passed by the Regulators / Courts / Tribunals, which would impact the going concern status of the Company and its future operations.
INTERNAL FINANCIAL CONTROL
The Company has a comprehensive internal control system in place for ensuring reliability of financial reporting, orderly and efficient conduct of business, compliance with policies, procedures, safeguarding of assets and economical and efficient use of resources. Appropriate review and control mechanisms are built in place to ensure that such control systems are adequate and operate effectively.
The monitoring and reporting of finance systems is supported by a web-based system SAP, which helps in obtaining accurate and complete accounting records and timely preparation of reliable financial disclosures.
CORPORATE GOVERNANCE
The report on Corporate Governance together with the Auditor’s Certificate regarding the Compliance of conditions of Corporate Governance as stipulated in SEBI (Listing Obligations And Disclosure Requirements) Regulations, 2015 is annexed and forms part of this Annual Report as Annexure – F.
PARTICULARS OF EMPLOYEES
Information on Particulars of Employees as required under Section 197 of the Companies Act, 2013 read with Rule 5(1) of the Companies (Appointment and Remuneration of Managerial Personnel) Rules, 2014 forms an integral part
of this report as Annexure-G. The information required pursuant to Section 197 of the Companies Act, 2013 read with Rules 5(2) and 5(3) of the Companies (Appointment and Remuneration of Managerial Personnel) Rules, 2014 in respect of employees of your Company is available for inspection by the members at the registered office of the Company during business hours on working days up to the date of ensuing Annual General Meeting. If any member is interested in obtaining a copy thereof, such member may write to the Company Secretary, whereupon a copy would be sent.
ACKNOWLEDGEMENT
It is our belief that we have a leadership team with the right experience and skills to take us into the next decade of growth. We continue to build our skills and add appropriate resources, which will help the company deliver solid results in the years to come. We want to recognize employees at all levels for their efforts, which has allowed us to successfully navigate a tough economy and continue to achieve growth. Your Directors wish to place on record their sincere thanks to all its highly valued customers, its Technical and Financial Collaborator- M/s Stanley Electric Co., Ltd., Japan, all other business partners, all the shareholders, financial institutions, banks, vendors and various Government agencies for their continued support and patronage.
For and on behalf of the Board of Directors
D.K. JainPlace : Gurugram ChairmanDated : May 13, 2017 DIN: 00085848

Annual Report 2016-17 27
Co
rpo
rate Overview
Statu
tory R
epo
rtsFin
ancial S
tatemen
ts
ANNEXURE - A
Form No. MGT -9EXTRACT OF ANNUAL RETURN
as on the financial year ended on 31st March, 2017[(Pursuant to Section 92(3) of the Companies Act, 2013 and rule 12(1) of the Companies
(Management and Administration) Rules, 2014)]
I. REGISTRATION AND OTHER DETAILS:
i) CIN L74899DL1981PLC012804
ii) Registration Date 10-12-1981
iii) Name of the Company Lumax Industries Limited
iv) Category/sub-category of the Company Public listed Company having Share Capital
v) Address of the Registered office and contact details
B-85-86, Mayapuri Industrial Area, Phase-1, New Delhi – 110064Ph. +91 11 28116990
vi) Whether listed company Yes
viii) Name, Address and Contact details of Registrar and Transfer Agent, if any
M/s Karvy Computershare Pvt. Ltd.Karvy Selenium Tower B,Plot 31-32, Gachibowli, Financial District, Nanakramguda, Hyderabad – 500 032.E-mail id : [email protected]
II. PRINCIPAL BUSINESS ACTIVITIES OF THE COMPANY
All the business activities contributing 10% or more of the total turnover of the company shall be stated:-
Sl. No.
Name and Description of main Products/Services NIC Code of the Product/ Service
% total turnover of the Company
1 Automotive Lamp 2740 91.16%
III. PARTICULARS OF HOLDING, SUBSIDIARY AND ASSOCIATE COMPANIES
Sl. No.
Name and Address of the Company
CIN/GLN Holding/Subsidiary/Associate
% of shares held
ApplicableSection
1 SL Lumax LimitedG-15, Sipcot Industrial Park, Irungattukottai,Sriperumbudur-602 105
U34300TN1997PLC048136 Associate 21.28% 2(6)
IV. SHARE HOLDING PATTERN (EQUITY SHARE CAPITAL BREAKUP AS PERCENTAGE OF TOTAL EQUITY)
i) Category-wise Share Holding
Category of Shareholders No. of Shares held at the beginning of the year (As on April 01, 2016)
No. of Shares held at the end of the year (As on March 31, 2017)
% Change during
the year Demat Physical Total % of Total Shares
Demat Physical Total % of Total Shares
A. Promoters
(1) Indian
a) Individual/ HUF 2427555 - 2427555 25.97 2425997 - 2425997 25.95 (0.02)*
b) Central Govt - - - - - - - - -

28 Lumax Industries Limited
Category of Shareholders No. of Shares held at the beginning of the year (As on April 01, 2016)
No. of Shares held at the end of the year (As on March 31, 2017)
% Change during
the year Demat Physical Total % of Total Shares
Demat Physical Total % of Total Shares
c) State Govt (s) - - - - - - - - -
d) Bodies Corp. 944233 - 944233 10.10 942253 - 942253 10.08 (0.02)*
e) Banks / FI - - - - - - - - -
f) Any Other…. - - - - - - - - -
Sub-total (A) (1) 3371788 - 3371788 36.07 3368250 - 3368250 36.03 (0.04)*
(2) Foreign
a) NRIs - Individuals - - - - - - - - -
b) Other – Individuals - - - - - - - - -
c) Bodies Corp. 3505399 - 3505399 37.50 3505399 - 3505399 37.50 -
d) Banks / FI - - - - - - - - -
e) Any Other…. - - - - - - - - -
Sub-total (A) (2): 3505399 - 3505399 37.50 3505399 - 3505399 37.50 -
Total shareholding of Promoter (A) = (A)(1)+(A)(2)
6877187 - 6877187 73.57 6873649 - 6873649 73.53 (0.04)*
B. Public Shareholding 1. Institutions
a) Mutual Funds - 1740 1740 0.02 118417 1740 120157 1.29 1.27
b) Banks / FI 5840 270 6110 0.06 2362 270 2632 0.03 (0.03)
c) Central Govt - - - - - - - - -
d) State Govt(s) - - - - - - - - -
e) Venture Capital Funds - - - - - - - - -
f) Insurance Companies - - - - - - - - -
g) Foreign Institutional Investors /Foreign Portfolio Investors
155003 200 155203 1.66 205348 200 205548 2.20 0.54
h) Foreign Venture Capital Funds
- - - - - - - - -
i) Others (specify) - - - - - - - - -
Sub-total (B)(1): 160843 2210 163053 1.74 326127 2210 328337 3.52 1.77
2. Non-Institutions
a) Bodies Corp.
i) Indian 688135 1899 690034 7.38 411253 1874 413127 4.42 (2.96)
ii) Overseas - 80 80 - - 80 80 - -
b) Individuals - - - - - - - - -
i) Individual shareholders holding nominal share capital upto ` 1 lakh
1199552 266825 1466377 15.69 1088294 257262 1345556 14.39 (1.30)
ii) Individual shareholders holding nominal share capital in excess of ` 1 lakh
122407 - 122407 1.31 348717 - 348717 3.73 2.42
c) Others (specify)
i NRI Reptriation - 150 150 0 - 150 150 0 -
ii. Non resident indians 24494 90 24584 0.26 35797 90 35887 0.39 0.13
iii. Clearing Members 3860 - 3860 0.04 2229 - 2229 0.02 (0.02)
Sub-total (B)(2): 2038448 269044 2307492 24.68 1886290 259456 2145746 22.95 (1.73)
Total Public Shareholding (B)=(B)(1)+ (B)(2)
2199291 271254 2470545 26.43 2212417 261666 2474083 26.47 0.04*
C. Shares held by Custodian for GDRs & ADRs
- - - - - - - - -
Grand Total (A+B+C) 9076478 271254 9347732 100 9086066 261666 9347732 100 -
* Changes in shareholding of Indian Promoters is due to the Reclassification of Mr. Umesh Kumar Jain, Lumax Automotive Systems Ltd & Vardhman Agencies Pvt. Ltd from Promoter Category to Public Category.
Annual Report 2016-17 29
Co
rpo
rate Overview
Statu
tory R
epo
rtsFin
ancial S
tatemen
ts
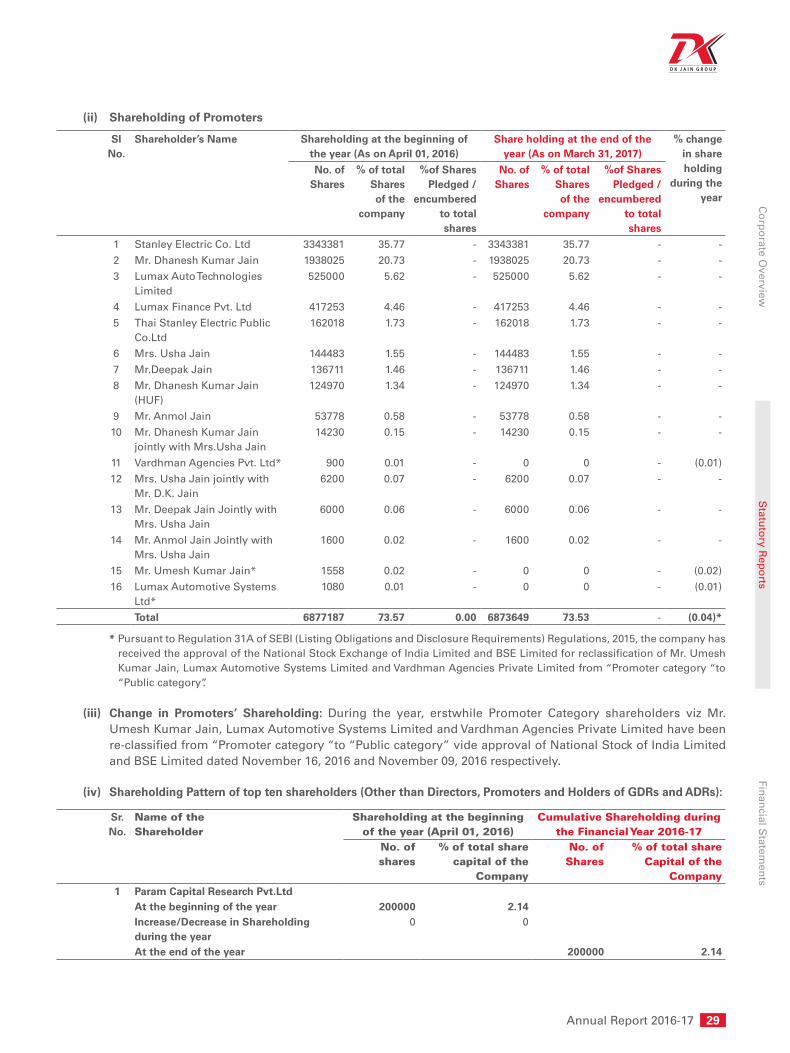
(ii) Shareholding of Promoters
Sl No.
Shareholder’s Name Shareholding at the beginning of the year (As on April 01, 2016)
Share holding at the end of the year (As on March 31, 2017)
% change in share holding
during the year
No. of Shares
% of total Shares of the
company
%of Shares Pledged /
encumbered to total shares
No. of Shares
% of total Shares of the
company
%of Shares Pledged /
encumbered to total shares
1 Stanley Electric Co. Ltd 3343381 35.77 - 3343381 35.77 - -
2 Mr. Dhanesh Kumar Jain 1938025 20.73 - 1938025 20.73 - -
3 Lumax Auto Technologies Limited
525000 5.62 - 525000 5.62 - -
4 Lumax Finance Pvt. Ltd 417253 4.46 - 417253 4.46 - -
5 Thai Stanley Electric Public Co.Ltd
162018 1.73 - 162018 1.73 - -
6 Mrs. Usha Jain 144483 1.55 - 144483 1.55 - -
7 Mr.Deepak Jain 136711 1.46 - 136711 1.46 - -
8 Mr. Dhanesh Kumar Jain (HUF)
124970 1.34 - 124970 1.34 - -
9 Mr. Anmol Jain 53778 0.58 - 53778 0.58 - -
10 Mr. Dhanesh Kumar Jain jointly with Mrs.Usha Jain
14230 0.15 - 14230 0.15 - -
11 Vardhman Agencies Pvt. Ltd* 900 0.01 - 0 0 - (0.01)
12 Mrs. Usha Jain jointly with Mr. D.K. Jain
6200 0.07 - 6200 0.07 - -
13 Mr. Deepak Jain Jointly with Mrs. Usha Jain
6000 0.06 - 6000 0.06 - -
14 Mr. Anmol Jain Jointly with Mrs. Usha Jain
1600 0.02 - 1600 0.02 - -
15 Mr. Umesh Kumar Jain* 1558 0.02 - 0 0 - (0.02)
16 Lumax Automotive Systems Ltd*
1080 0.01 - 0 0 - (0.01)
Total 6877187 73.57 0.00 6873649 73.53 - (0.04)*
* Pursuant to Regulation 31A of SEBI (Listing Obligations and Disclosure Requirements) Regulations, 2015, the company has received the approval of the National Stock Exchange of India Limited and BSE Limited for reclassification of Mr. Umesh Kumar Jain, Lumax Automotive Systems Limited and Vardhman Agencies Private Limited from “Promoter category “to “Public category”.
(iii) Change in Promoters’ Shareholding: During the year, erstwhile Promoter Category shareholders viz Mr. Umesh Kumar Jain, Lumax Automotive Systems Limited and Vardhman Agencies Private Limited have been re-classified from “Promoter category “to “Public category” vide approval of National Stock of India Limited and BSE Limited dated November 16, 2016 and November 09, 2016 respectively.
(iv) Shareholding Pattern of top ten shareholders (Other than Directors, Promoters and Holders of GDRs and ADRs):
Sr. No.
Name of the Shareholder
Shareholding at the beginning of the year (April 01, 2016)
Cumulative Shareholding during the Financial Year 2016-17
No. of shares
% of total share capital of the
Company
No. of Shares
% of total share Capital of the
Company1 Param Capital Research Pvt.Ltd
At the beginning of the year 200000 2.14Increase/Decrease in Shareholding during the year
0 0
At the end of the year 200000 2.14

30 Lumax Industries Limited
Sr. No.
Name of the Shareholder
Shareholding at the beginning of the year (April 01, 2016)
Cumulative Shareholding during the Financial Year 2016-17
No. of shares
% of total share capital of the
Company
No. of Shares
% of total share Capital of the
Company2 Fidelity Northstar Fund
At the beginning of the year 150000 1.60Increase/Decrease in Shareholding during the year
0 0
At the end of the year 150000 1.603 Vanaja Sundar Iyer*
At the beginning of the year 0 0Increase/Decrease in Shareholding during the year30/09/2016 38630 0.41 38630 0.4107/10/2016 747 0.01 39377 0.4214/10/2016 2432 0.03 41809 0.4521/10/2016 8191 0.09 50000 0.5328/10/2016 28 0.00 50028 0.5413/01/2017 5432 0.06 55460 0.5920/01/2017 52402 0.56 107862 1.1510/02/2017 17960 0.19 125822 1.3503/03/2017 1347 0.01 127169 1.3624/03/2017 2500 0.03 129669 1.39At the end of the year 129669 1.39
4 L and T Mutual Fund Trustee Ltd-L and T monthly Income Plan*At the beginning of the year 0 0Increase/Decrease in the shareholding during the year28/10/2016 1930 0.02 1930 0.0213/01/2017 21563 0.23 23493 0.2520/01/2017 45437 0.49 68930 0.7427/01/2017 3120 0.03 72050 0.7724/02/2017 19570 0.21 91620 0.9803/03/2017 16016 0.17 107636 1.1524/03/2017 10781 0.12 118417 1.27At the end of the year 118417 1.27
5 Navinchandra Shah*At the beginning of the year 0 0Increase/Decrease in the shareholding during the year17/02/2017 61400 0.66 61400 0.66At the end of the year 61400 0.66
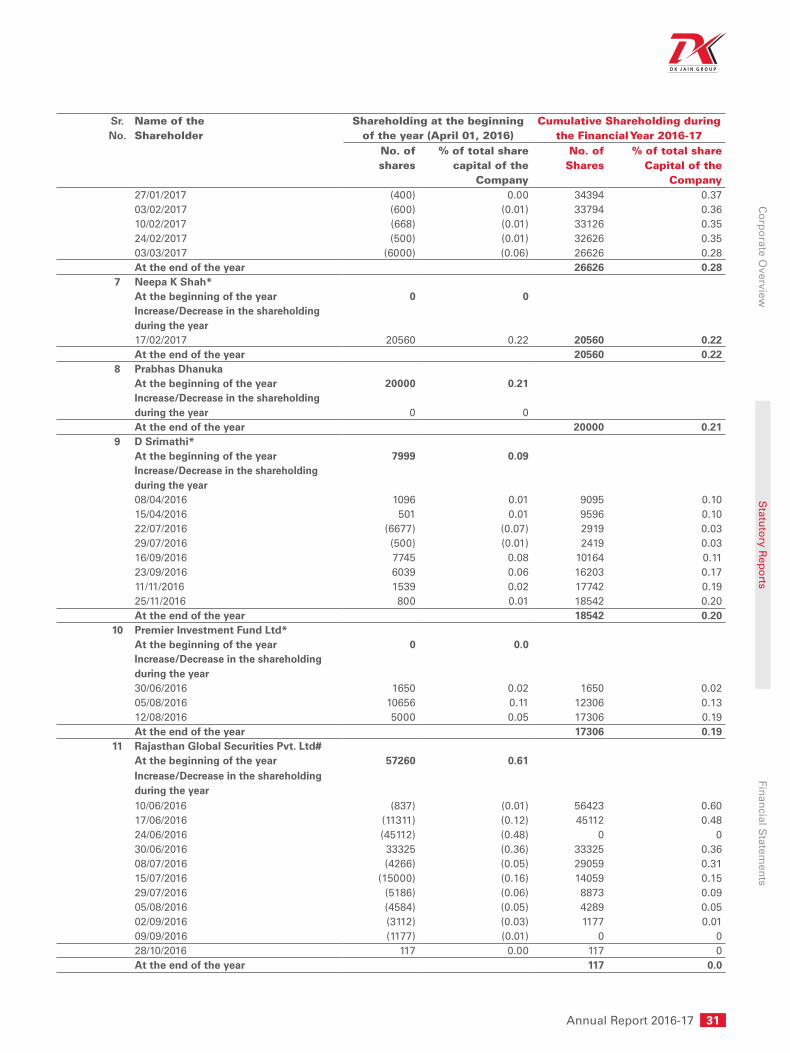
6 Kriner Services Pvt. LtdAt the beginning of the year 58270 0.62Increase/Decrease in the shareholding during the year20/05/2016 (2500) (0.03) 55770 0.6010/06/2016 (3084) (0.03) 52686 0.5617/06/2016 (6392) (0.07) 46294 0.5024/06/2016 (500) (0.01) 45794 0.4915/07/2016 (900) (0.01) 44894 0.4829/07/2016 (5000) (0.05) 39894 0.4305/08/2016 (1000) (0.01) 38894 0.4230/09/2016 (600) (0.01) 38294 0.4128/10/2016 (2000) (0.02) 36294 0.3913/01/2017 (1500) (0.02) 34794 0.37
Annual Report 2016-17 31
Co
rpo
rate Overview
Statu
tory R
epo
rtsFin
ancial S
tatemen
ts
Sr. No.
Name of the Shareholder
Shareholding at the beginning of the year (April 01, 2016)
Cumulative Shareholding during the Financial Year 2016-17
No. of shares
% of total share capital of the
Company
No. of Shares
% of total share Capital of the
Company27/01/2017 (400) 0.00 34394 0.3703/02/2017 (600) (0.01) 33794 0.3610/02/2017 (668) (0.01) 33126 0.3524/02/2017 (500) (0.01) 32626 0.3503/03/2017 (6000) (0.06) 26626 0.28At the end of the year 26626 0.28
7 Neepa K Shah*At the beginning of the year 0 0Increase/Decrease in the shareholding during the year17/02/2017 20560 0.22 20560 0.22At the end of the year 20560 0.22
8 Prabhas DhanukaAt the beginning of the year 20000 0.21Increase/Decrease in the shareholding during the year 0
0
At the end of the year 20000 0.219 D Srimathi*
At the beginning of the year 7999 0.09Increase/Decrease in the shareholding during the year08/04/2016 1096 0.01 9095 0.1015/04/2016 501 0.01 9596 0.1022/07/2016 (6677) (0.07) 2919 0.0329/07/2016 (500) (0.01) 2419 0.0316/09/2016 7745 0.08 10164 0.1123/09/2016 6039 0.06 16203 0.1711/11/2016 1539 0.02 17742 0.1925/11/2016 800 0.01 18542 0.20At the end of the year 18542 0.20
10 Premier Investment Fund Ltd*At the beginning of the year 0 0.0Increase/Decrease in the shareholding during the year30/06/2016 1650 0.02 1650 0.0205/08/2016 10656 0.11 12306 0.1312/08/2016 5000 0.05 17306 0.19At the end of the year 17306 0.19
11 Rajasthan Global Securities Pvt. Ltd#At the beginning of the year 57260 0.61Increase/Decrease in the shareholding during the year10/06/2016 (837) (0.01) 56423 0.6017/06/2016 (11311) (0.12) 45112 0.4824/06/2016 (45112) (0.48) 0 030/06/2016 33325 (0.36) 33325 0.3608/07/2016 (4266) (0.05) 29059 0.3115/07/2016 (15000) (0.16) 14059 0.1529/07/2016 (5186) (0.06) 8873 0.0905/08/2016 (4584) (0.05) 4289 0.0502/09/2016 (3112) (0.03) 1177 0.0109/09/2016 (1177) (0.01) 0 028/10/2016 117 0.00 117 0At the end of the year 117 0.0
32 Lumax Industries Limited
Sr. No.
Name of the Shareholder
Shareholding at the beginning of the year (April 01, 2016)
Cumulative Shareholding during the Financial Year 2016-17
No. of shares
% of total share capital of the
Company
No. of Shares
% of total share Capital of the
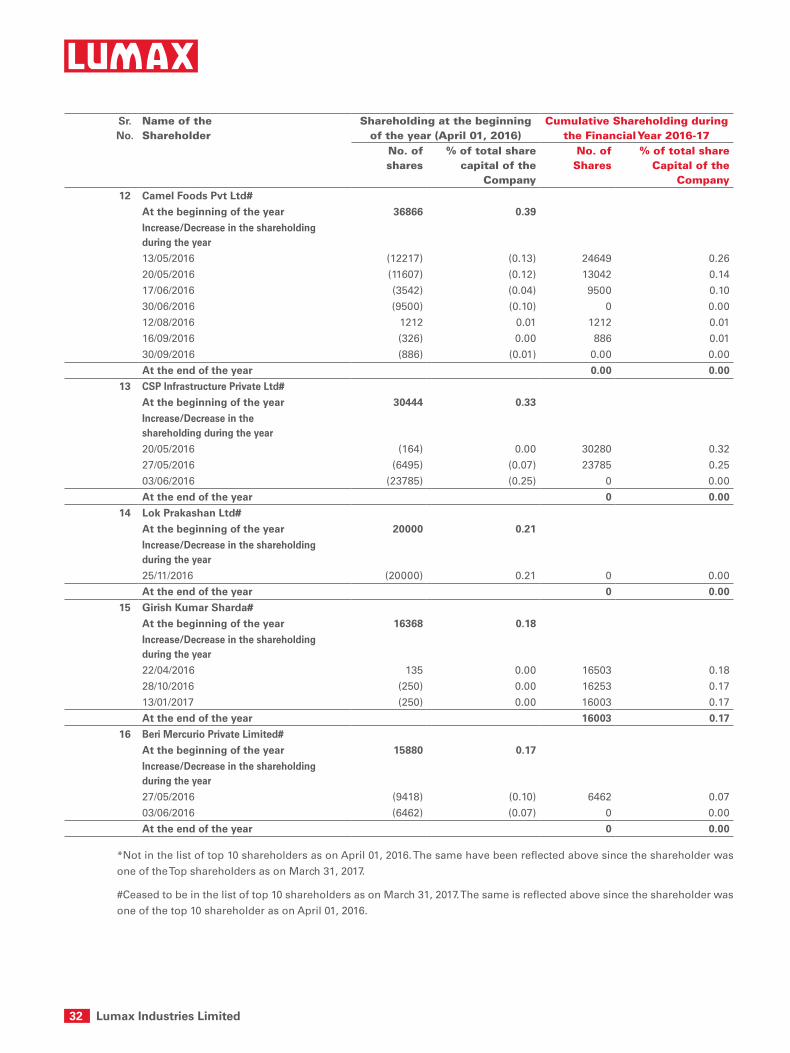
Company12 Camel Foods Pvt Ltd#
At the beginning of the year 36866 0.39
Increase/Decrease in the shareholding during the year
13/05/2016 (12217) (0.13) 24649 0.26
20/05/2016 (11607) (0.12) 13042 0.14
17/06/2016 (3542) (0.04) 9500 0.10
30/06/2016 (9500) (0.10) 0 0.00
12/08/2016 1212 0.01 1212 0.01
16/09/2016 (326) 0.00 886 0.01
30/09/2016 (886) (0.01) 0.00 0.00
At the end of the year 0.00 0.00
13 CSP Infrastructure Private Ltd#
At the beginning of the year 30444 0.33
Increase/Decrease in the shareholding during the year
20/05/2016 (164) 0.00 30280 0.32
27/05/2016 (6495) (0.07) 23785 0.25
03/06/2016 (23785) (0.25) 0 0.00
At the end of the year 0 0.00
14 Lok Prakashan Ltd#
At the beginning of the year 20000 0.21
Increase/Decrease in the shareholding during the year
25/11/2016 (20000) 0.21 0 0.00
At the end of the year 0 0.00
15 Girish Kumar Sharda#
At the beginning of the year 16368 0.18
Increase/Decrease in the shareholding during the year
22/04/2016 135 0.00 16503 0.18
28/10/2016 (250) 0.00 16253 0.17
13/01/2017 (250) 0.00 16003 0.17
At the end of the year 16003 0.17
16 Beri Mercurio Private Limited#
At the beginning of the year 15880 0.17
Increase/Decrease in the shareholding during the year
27/05/2016 (9418) (0.10) 6462 0.07
03/06/2016 (6462) (0.07) 0 0.00
At the end of the year 0 0.00
*Not in the list of top 10 shareholders as on April 01, 2016. The same have been reflected above since the shareholder was
one of the Top shareholders as on March 31, 2017.
#Ceased to be in the list of top 10 shareholders as on March 31, 2017. The same is reflected above since the shareholder was
one of the top 10 shareholder as on April 01, 2016.
Annual Report 2016-17 33
Co
rpo
rate Overview
Statu
tory R
epo
rtsFin
ancial S
tatemen
ts
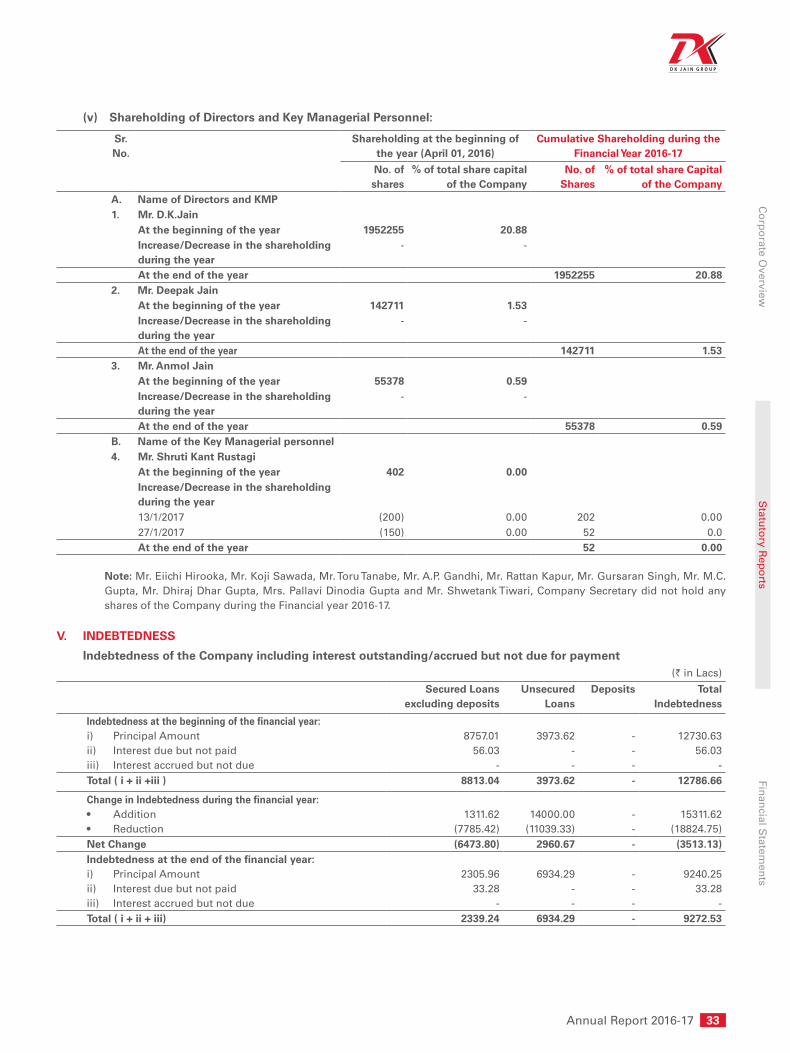
(v) Shareholding of Directors and Key Managerial Personnel:
Sr. No.
Shareholding at the beginning of the year (April 01, 2016)
Cumulative Shareholding during the Financial Year 2016-17
No. of shares
% of total share capital of the Company
No. of Shares
% of total share Capital of the Company
A. Name of Directors and KMP1. Mr. D.K.Jain
At the beginning of the year 1952255 20.88Increase/Decrease in the shareholding during the year
- -
At the end of the year 1952255 20.882. Mr. Deepak Jain
At the beginning of the year 142711 1.53Increase/Decrease in the shareholding during the year
- -
At the end of the year 142711 1.533. Mr. Anmol Jain
At the beginning of the year 55378 0.59Increase/Decrease in the shareholding during the year
- -
At the end of the year 55378 0.59B. Name of the Key Managerial personnel4. Mr. Shruti Kant Rustagi
At the beginning of the year 402 0.00Increase/Decrease in the shareholding during the year13/1/2017 (200) 0.00 202 0.0027/1/2017 (150) 0.00 52 0.0At the end of the year 52 0.00
Note: Mr. Eiichi Hirooka, Mr. Koji Sawada, Mr. Toru Tanabe, Mr. A.P. Gandhi, Mr. Rattan Kapur, Mr. Gursaran Singh, Mr. M.C. Gupta, Mr. Dhiraj Dhar Gupta, Mrs. Pallavi Dinodia Gupta and Mr. Shwetank Tiwari, Company Secretary did not hold any shares of the Company during the Financial year 2016-17.
V. INDEBTEDNESS
Indebtedness of the Company including interest outstanding/accrued but not due for payment(` in Lacs)
Secured Loansexcluding deposits
UnsecuredLoans
Deposits TotalIndebtedness
Indebtedness at the beginning of the financial year: i) Principal Amount ii) Interest due but not paid iii) Interest accrued but not due
8757.0156.03
-
3973.62--
---
12730.6356.03
- Total ( i + ii +iii ) 8813.04 3973.62 - 12786.66
Change in Indebtedness during the financial year: • Addition • Reduction
1311.62(7785.42)
14000.00(11039.33)
--
15311.62(18824.75)
Net Change (6473.80) 2960.67 - (3513.13) Indebtedness at the end of the financial year: i) Principal Amount ii) Interest due but not paid iii) Interest accrued but not due
2305.9633.28
-
6934.29--
---
9240.2533.28
- Total ( i + ii + iii) 2339.24 6934.29 - 9272.53
34 Lumax Industries Limited
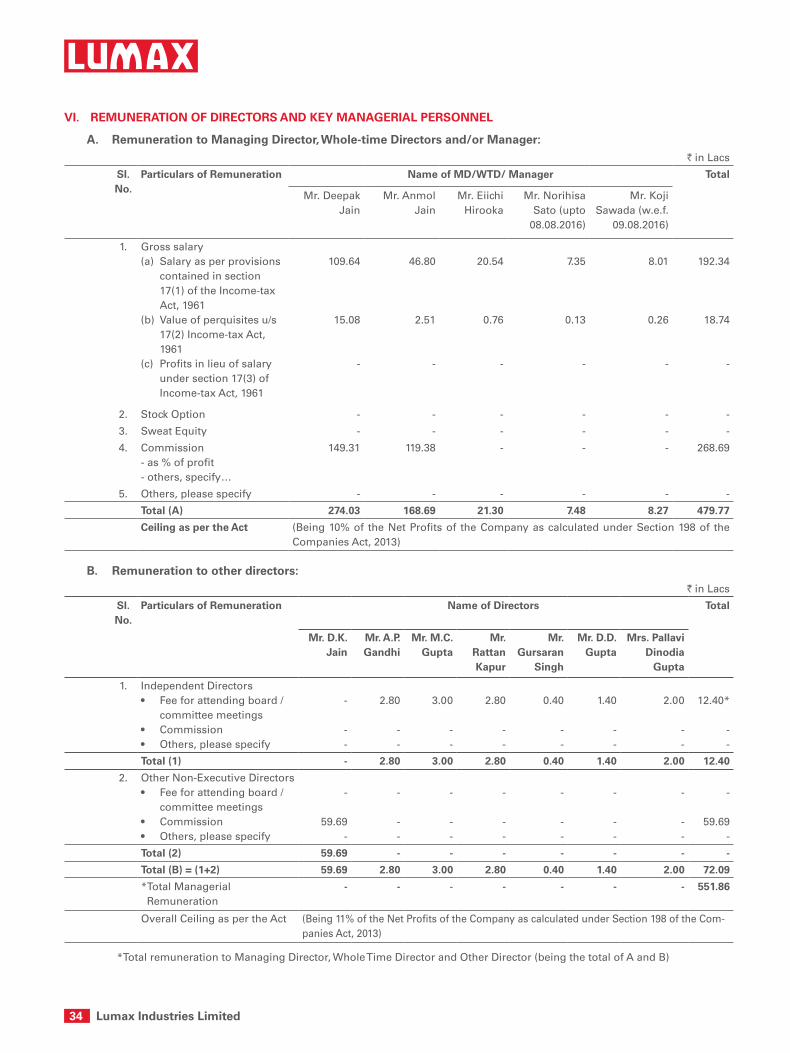
VI. REMUNERATION OF DIRECTORS AND KEY MANAGERIAL PERSONNEL
A. Remuneration to Managing Director, Whole-time Directors and/or Manager: ` in Lacs
Sl. No.
Particulars of Remuneration Name of MD/WTD/ Manager Total
Mr. Deepak Jain
Mr. Anmol Jain
Mr. Eiichi Hirooka
Mr. Norihisa Sato (upto
08.08.2016)
Mr. Koji Sawada (w.e.f.
09.08.2016)
1. Gross salary (a) Salary as per provisions
contained in section 17(1) of the Income-tax Act, 1961
(b) Value of perquisites u/s 17(2) Income-tax Act, 1961
(c) Profits in lieu of salary under section 17(3) of Income-tax Act, 1961
109.64
15.08
-
46.80
2.51
-
20.54
0.76
-
7.35
0.13
-
8.01
0.26
-
192.34
18.74
-
2. Stock Option - - - - - -
3. Sweat Equity - - - - - -
4. Commission - as % of profit - others, specify…
149.31 119.38 - - - 268.69
5. Others, please specify - - - - - -
Total (A) 274.03 168.69 21.30 7.48 8.27 479.77
Ceiling as per the Act (Being 10% of the Net Profits of the Company as calculated under Section 198 of the Companies Act, 2013)
B. Remuneration to other directors:` in Lacs
Sl. No.
Particulars of Remuneration Name of Directors Total
Mr. D.K. Jain
Mr. A.P. Gandhi
Mr. M.C. Gupta
Mr. Rattan Kapur
Mr. Gursaran
Singh
Mr. D.D. Gupta
Mrs. Pallavi Dinodia
Gupta
1. Independent Directors • Feeforattendingboard/
committee meetings • Commission• Others,pleasespecify
-
--
2.80
--
3.00
--
2.80
--
0.40
--
1.40
--
2.00
--
12.40*
--
Total (1) - 2.80 3.00 2.80 0.40 1.40 2.00 12.40
2. Other Non-Executive Directors • Feeforattendingboard/
committee meetings • Commission• Others,pleasespecify
-
59.69-
-
--
-
--
-
--
-
--
-
--
-
--
-
59.69-
Total (2) 59.69 - - - - - - -
Total (B) = (1+2) 59.69 2.80 3.00 2.80 0.40 1.40 2.00 72.09
* Total Managerial Remuneration
- - - - - - - 551.86
Overall Ceiling as per the Act (Being 11% of the Net Profits of the Company as calculated under Section 198 of the Com-panies Act, 2013)
*Total remuneration to Managing Director, Whole Time Director and Other Director (being the total of A and B)

Annual Report 2016-17 35
Co
rpo
rate Overview
Statu
tory R
epo
rtsFin
ancial S
tatemen
ts
C. Remuneration to Key Managerial Personnel other than MD/Manager/WTD` in Lacs
Sl. No.
Particulars of Remuneration Key Managerial Personnel
Company Secretary (Mr. Shwetank Tiwari)
Chief Financial Officer(Mr. Shruti Kant Rustagi)
Total
1 Gross salary (a) Salary as per provisions contained in section
17(1) of the Income-tax Act, 1961 (b) Value of perquisites u/s 17(2) Income-tax Act,
1961 (c) Profits in lieu of salary under section 17(3)
Income-tax Act, 1961
14.24
0.65
-
48.94
3.47
-
63.18
4.12
-
2 Stock Option - - -
3 Sweat Equity - - -
4 Commission - as % of profit - Others, specify…
--
--
--
5 Others, please specify - - -
Total 14.89 52.41 67.30
VII. PENALTIES / PUNISHMENT/ COMPOUNDING OF OFFENCES:
Against the Company, Directors and other Officers in Default under the Companies Act, 2013: NONE
36 Lumax Industries Limited
To, The Members, Lumax Industries Limited B-85-86, Mayapuri Industrial Area, Phase-I, New Delhi-110064
We were appointed by the Board of Directors of Lumax Industries Limited (hereinafter called the Company) to conduct Secretarial Audit for the financial year of the Company ended March 31, 2017.
We have conducted the Secretarial Audit of the compliance of applicable statutory provisions and the adherence to good corporate practices by the Company. Secretarial Audit was conducted in a manner that provided us with a reasonable basis for evaluating the corporate conducts/ statutory compliances and expressing our opinion thereon.
Management’s Responsibility for Secretarial Compliances
The Company’s management is responsible for preparation and maintenance of secretarial records and for devising proper systems to ensure compliance with the provisions of applicable laws and regulations
Auditors Responsibility
Our responsibility is to express an opinion on these secretarial records, standards and procedures followed by the Company with respect to secretarial compliances
We believe that audit evidence and information obtained from the Company’s management is adequate and appropriate for us to provide a basis for our opinion.
We have followed the audit practices and processes as were appropriate to obtain reasonable assurance about the correctness of the contents of the secretarial records. The verification was done on test basis to ensure that correct facts are reflected in secretarial records. We believe that the processes and practices, we followed provide a reasonable basis for our opinion.
The secretarial audit report is neither an assurance to the future viability of the company nor of the efficacy or effectiveness with which the management has conducted the affairs of the Company.
Opinion
We have examined the books, papers, minute books, forms and returns filed and other records maintained by the Company for the financial year ended on March 31, 2017 according to the provisions of:
(i) The Companies Act, 2013 (the Act) and the rules made thereunder;
(ii) The Securities Contracts (Regulation) Act, 1956 (‘SCRA’) and the rules made thereunder;
(iii) The Depositories Act, 1996 and the Regulations and Bye-laws framed thereunder;
(iv) Foreign Exchange Management Act, 1999 and the rules and regulations made thereunder to the extent of Foreign Direct Investment and External Commercial Borrowings;
(v) The following Regulations and Guidelines prescribed under the Securities and Exchange Board of India Act, 1992 (‘SEBI Act’):-
(a) The Securities and Exchange Board of India (Substantial Acquisition of Shares and Takeovers) Regulations, 2011,
(b) The Securities and Exchange Board of India (Prohibition of Insider Trading) Regulations, 2015;
(c) The Securities and Exchange Board of India (Issue of Capital and Disclosure Requirements) Regulations, 2009 – Not applicable as the Company has not issued any fresh equity during the year under review;
(d) The Securities and Exchange Board of India (Employee Stock Option Scheme and Employee Stock Purchase Scheme) Guidelines, 1999 – Not applicable as the Company has not granted any employee stock option;
(e) The Securities and Exchange Board of India (Issue and Listing of Debt Securities) Regulations, 2008 – Not applicable as the Company has not issued any debt securities during the year under review;
ANNEXURE - B
SECRETARIAL AUDIT REPORTFOR THE FINANCIAL YEAR ENDED MARCH 31, 2017
[Pursuant to section 204(1) of the companies act, 2013 and rule No.9 of the companies (appointment and remuneration Personnel) rules, 2014]
Annual Report 2016-17 37
Co
rpo
rate Overview
Statu
tory R
epo
rtsFin
ancial S
tatemen
ts
(f) The Securities and Exchange Board of India (Registrars to an Issue and Share Transfer Agents) Regulations, 1993 regarding the Companies Act and dealing with client – Not applicable;
(g) The Securities and Exchange Board of India (Delisting of Equity Shares) Regulations, 2009 – Not applicable as the Company has not delisted its shares from any stock exchange during the year under review; and
(h) The Securities and Exchange Board of India (Buyback of Securities) Regulations, 1998 – Not applicable as the Company has not bought back its securities during the year under review;
We have also examined compliance with the applicable clauses of the following:
(i) Secretarial Standards issued by The Institute of Company Secretaries of India.
(ii) SEBI (Listing Obligations and Disclosure Require-ments) Regulation, 2015.
Based on our verification of the Company’s books, papers, minutes books, forms and returns filed and other records maintained by the Company and also the information provided by the Company, its officers, agents and authorised representatives during the conduct of Secretarial Audit, we hereby report that in our opinion, the Company has, during the financial year ended March 31, 2017, complied with the aforesaid laws, material compliances are listed in the Annexure attached to this report.
Based on information received and records maintained, we further report that:
1. The Board of Directors of the Company is duly constituted with proper balance of Executive Directors, Non-Executive Directors and Independent Directors. The changes in the composition of the Board of Directors that took place during the financial year under review were carried out in compliance with the provisions of the Act.
2. Adequate notice is given to all directors to schedule the Board Meetings. Agenda and detailed notes on agenda were sent at least seven days in advance, and a system exists for seeking and obtaining further information and clarifications on the agenda items before the meeting and for meaningful participation at the meeting.
3. The Company has proper Board processes.
Based on the compliances mechanism established by the Company and on the basis of the Compliance Certificate(s) issued by the Company Secretary and taken on records by the Board of Directors at their meeting(s), we are of the opinion that the management has:
a) adequate systems and processes in the company commensurate with the size and operations of the company to monitor and ensure compliance with applicable laws, rules, regulations and guidelines.
b) Complied with the following laws applicable to the Company:
(i) Factories Act, 1948
(ii) Standing Order Act, 1946
(iii) The Industries (Development and Regulation) Act, 1951
(iv) The Contract Labour (Regulation and Abolition) Act, 1970,
(v) The Child Labour (Prohibition and Regulation) Act, 1986,
(vi) The Workmen’s Compensation Act, 1923,
(vii) The Environment (Protection) Act, 1986,
Maneesh GuptaPlace : New Delhi FCS No. 4982Date : May 11, 2017 C P No. 2945
ANNEXURE TO SECRETARIAL AUDIT REPORT
In our opinion and to the best of our information and according to the examinations carried out by us and explanations furnished and representations made to us by the Company, its officers and agents, we report that the Company has during the financial year under review, complied with the provisions of the Acts, Rules made thereunder and the Memorandum and Articles of Association of the Company with regard to:
1. Maintenance of various statutory registers and documents and making necessary entries therein:
2. Contracts, Common Seal and Registered Office and publication of name of the Company;
3. Forms, returns, documents and resolutions required to be filed with the Registrar of Companies, Regional Director, Central Government, Company Law Board or such other authorities;
4. Service of documents by the Company on its Members, Directors, Stock Exchanges, Auditors and Registrar of Companies;

38 Lumax Industries Limited
5. Constitution of the Board of Directors, Audit Committee, Nomination and Remuneration Committee, Share Transfer/ Stakeholder Relationship Committee, Corporate Social Responsibility Committee;
6. Appointment, re-appointment and Retirement of Directors including Managing Director and Executive Directors and payment of remuneration to them;
7. Disclosure of interest and concerns in contracts and arrangements, shareholdings and directorships in other companies and interest in other entities by Directors;
8. Disclosure requirements in respect to their eligibility for appointment, declaration of their independence, compliance with code of conduct for Directors and Senior Management Personnel;
9. Established a policy on related party transactions. All transactions with related parties were in the ordinary course of business and on arms-length basis and were placed before the Audit Committee periodically;
10. Established a vigil mechanism and providing to complainants, if any, unhindered access to the Chairman of the Audit Committee.
11. Constituted the Corporate Social Responsibility Committee formulating and adopting Corporate Social Responsibility Policy indicating the activities to be undertaken by the Company;
12. Appointment of persons as Key Managerial Personnel;
13. Appointment and remuneration of Statutory Auditor and Cost Auditor;
14. Appointment of Internal Auditor;
15. Notice of meetings of the Board and Committee thereof;
16. Minutes of meetings of the Board and Committees thereof including passing of resolutions by circulations;
17. Notice convening annual general meeting held on August 8, 2016 and holding of the meeting on that date;
18. Minutes of General meeting;
19. Approval of members, Board of Directors, Committee of Directors and government authorities, wherever required;
20. Form of balance sheet as at March 31, 2016 as prescribed under the Companies Act, 2013;
21. Report of the Board of Directors for the financial year ended March 31, 2016;
22. Borrowings and registration of charges;
Maneesh GuptaPlace : New Delhi FCS No. 4982Date : May 11, 2017 C P No. 2945
Annual Report 2016-17 39
Co
rpo
rate Overview
Statu
tory R
epo
rtsFin
ancial S
tatemen
ts
A. CONSERVATION OF ENERGY
Though the Company does not come under the category of power intensive unit, adequate measures have been taken for energy conservation and thereby reducing energy cost.
(i) Steps taken for conservation of energy:
a) Moulding Machine with Servo Motor:
The Company has further replaced Moulding Machine induction motor with Servo Motor in its Chakan, Dharuhera and Pant Nagar Plants in nine machines, thereby expecting to save electricity consumption approximately by 25% to 30%.
b) Air Compressor Optimisation:
The Company has optimized air compressor pressure and Variable Frequency Drive setting in its Bawal Plant, thereby expecting to save electricity consumption approximately by 18%.
c) Monitoring of Specific Energy Consumption (SEC):
The Company has started monitoring of Specific energy consumption in various machines in its Bawal Plant, thereby expecting to reduce energy consumption by 6%.
d) Power Factor improvement:
The Company has improved Power Factor in its Dharuhera Plant from 0.984 to 0.989, thereby expecting to reduce its annual cost of power by 0.50%.
(ii) Steps taken by the Company for utilizing alternate sources of energy :
The Company has initiated activity to implement Solar Power system with a target installed capacity of 1-1.5 MW for its different plants located in Haryana, Gujarat, Maharashtra and Karnataka, which will help in energy conservation and reduction of overall cost of energy.
It is difficult to quantify the impact of individual energy reduction measures on the Cost of
Production. The above measures of Energy conservation and reduction will reduce the overall cost of energy.
(iii) The capital investment on energy conservation equipments :
Your Company encourages capital investment in energy saving equipments, plants or machinery, and this year the Company has spent approximately ̀ 20 Lacs towards replacement of Moulding Machine induction motor with Servo Motor.
(B) Technology absorption :
(i) The efforts made towards technology absorption:
a. For the first time in house design and development of LED Head Lamp (Low, High & Position function in one reflector).
b. In house design and development of LED Tail Lamp for 2W in a remarkable time period.
c. Design in challenging size to meet the optical requirement in 4W LED daytime running light (DRL).
d. Achievement in meeting the regulatory requirements with 12 Nos. of LEDs in 4W DRL function.
e. In house design of sleek CHMSL with LED light source and length of 190 mm with combination of Fresnel and micro optics.
f. In house design and development for 2W Tail Lamp with Light guide for Tail function and 6 Nos. LEDs for for stop function.
g. First time LED Head Lamp for 2W.
h. First time design of Tail Lamp of very small size with bulb, which appearance wise look like LED.
i. In house design of LED Tail Lamp for 4W.
j. In house design of LED Winker Lamp with very small size for 2W.
ANNEXURE - C
Information as per Section 134(3)(m) of the Companies Act, 2013 read with Companies (Accounts) Rules, 2014 and forming part of Directors’ Report for the year ended March 31, 2017.
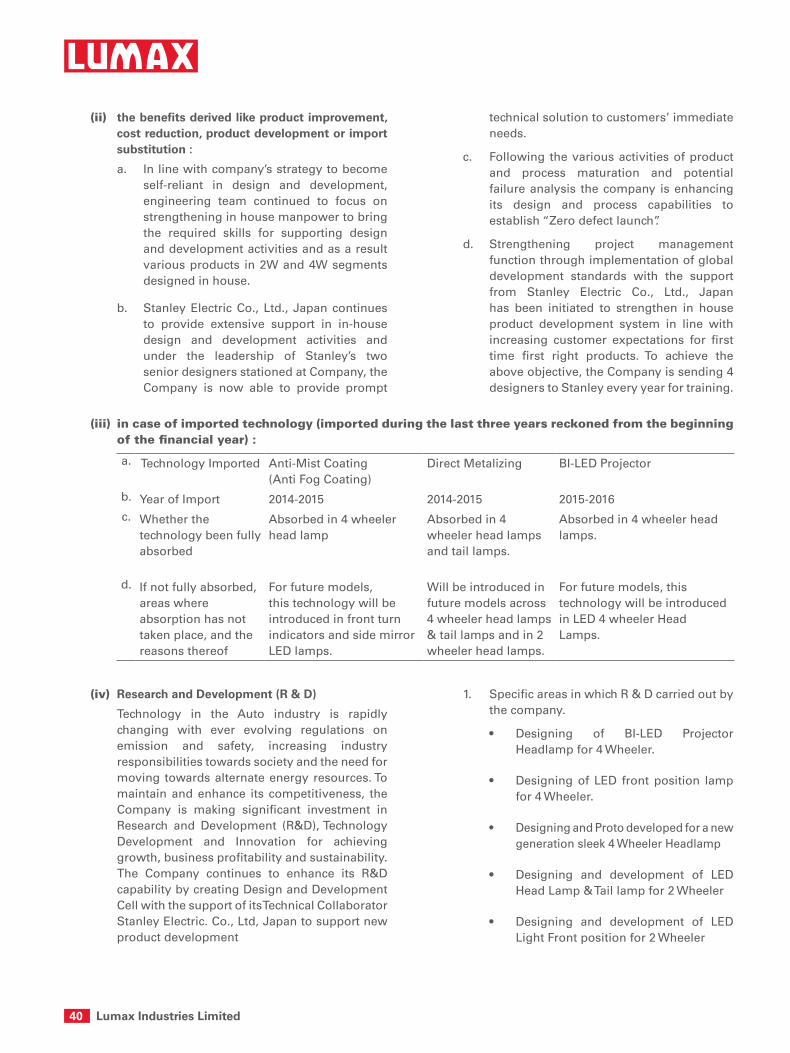
40 Lumax Industries Limited
(iii) in case of imported technology (imported during the last three years reckoned from the beginning of the financial year) :
a. Technology Imported Anti-Mist Coating (Anti Fog Coating)
Direct Metalizing BI-LED Projector
b. Year of Import 2014-2015 2014-2015 2015-2016c. Whether the
technology been fully absorbed
Absorbed in 4 wheeler head lamp
Absorbed in 4 wheeler head lamps and tail lamps.
Absorbed in 4 wheeler head lamps.
d. If not fully absorbed, areas where absorption has not taken place, and the reasons thereof
For future models, this technology will be introduced in front turn indicators and side mirror LED lamps.
Will be introduced in future models across 4 wheeler head lamps & tail lamps and in 2 wheeler head lamps.
For future models, this technology will be introduced in LED 4 wheeler Head Lamps.
(iv) Research and Development (R & D)
Technology in the Auto industry is rapidly changing with ever evolving regulations on emission and safety, increasing industry responsibilities towards society and the need for moving towards alternate energy resources. To maintain and enhance its competitiveness, the Company is making significant investment in Research and Development (R&D), Technology Development and Innovation for achieving growth, business profitability and sustainability. The Company continues to enhance its R&D capability by creating Design and Development Cell with the support of its Technical Collaborator Stanley Electric. Co., Ltd, Japan to support new product development
1. Specific areas in which R & D carried out by the company.
• Designing of BI-LED ProjectorHeadlamp for 4 Wheeler.
• Designingof LED frontposition lampfor 4 Wheeler.
• DesigningandProtodevelopedforanewgeneration sleek 4 Wheeler Headlamp
• Designing and development of LEDHead Lamp & Tail lamp for 2 Wheeler
• Designing and development of LEDLight Front position for 2 Wheeler
(ii) the benefits derived like product improvement, cost reduction, product development or import substitution :
a. In line with company’s strategy to become self-reliant in design and development, engineering team continued to focus on strengthening in house manpower to bring the required skills for supporting design and development activities and as a result various products in 2W and 4W segments designed in house.
b. Stanley Electric Co., Ltd., Japan continues to provide extensive support in in-house design and development activities and under the leadership of Stanley’s two senior designers stationed at Company, the Company is now able to provide prompt
technical solution to customers’ immediate needs.
c. Following the various activities of product and process maturation and potential failure analysis the company is enhancing its design and process capabilities to establish “Zero defect launch”.
d. Strengthening project management function through implementation of global development standards with the support from Stanley Electric Co., Ltd., Japan has been initiated to strengthen in house product development system in line with increasing customer expectations for first time first right products. To achieve the above objective, the Company is sending 4 designers to Stanley every year for training.

Annual Report 2016-17 41
Co
rpo
rate Overview
Statu
tory R
epo
rtsFin
ancial S
tatemen
ts
• Designing and development for newgeneration Headlamp and Tail lamp for new styled 2 Wheeler
2. Benefits derived as a result of the above R&D
• Complete in house designing of LEDheadlamp, which reduces company’s dependency on Stanley.
• Strengthening in-house designingcapabilities, in line with Company’s strategy to become self-reliant.
• Thermal simulation done duringdesign validation stages.
3. Future plan of action
Further enhancing the technology gained after working on BI-LED and LED based Lamps. Understanding the technology, especially for 4 wheelers using different HID sources for Low beam and High beam.
• Introduction of LED for License platelamp.
• IntroductionofLEDBlinker
• Introduction of head lamps with LEDprojector
• Introduction of head lamps with dualbeam LED functions
• Alignment with Stanley designprocedures.
4. The expenditure incurred on research and Development:
(` in Million)(i) Capital 41.49(ii) Recurring 301.91
Total 343.40(iii) Total R&D Expendi-
ture as a percentage of Total Turnover (%)
2.64
(C) The Foreign Exchange earned in terms of actual inflows during the year ` 268.58 million and the Foreign Exchange outgo during the year in terms of actual outflows is ` 1736.26 million.
Activities relating to exports; initiatives taken to increase exports; development of new export markets for products and services; and export plans ;
Your Company is continuously striving for growth in business in the export market. During the year under review, the following export development and promotion measures were taken:
- Securing new business with Audi AG for development of Q2 LED High Mounted Stop Lamp as a global single source.
- Discussions with Truck-Lite Europe for introduction of LED products as the replacement or upgrade version of their existing products.
- Discussions with Audi to increase the share of business in small lamps with LED applications.
- Sustaining the current business in small lamps with Nissan Europe.
- Sustaining the current business in Head Lamps and Tail Lamps with John Deere USA.
- Discussions with John Deere USA for introduction of LED tail lamps as the replacement of their existing running products.
- Continuous conversation with major OEMs in Central Europe and USA to introduce Lumax brand with the target of increasing our OEM Export in 2017.

42 Lumax Industries Limited
1. A brief outline of the Company’s CSR policy, including overview of projects or programmes proposed to be undertaken and a reference to the web-link to the CSR policy and projects or programmes.
The Company through its CSR initiatives is committed to enhance the social and economic development of communities and geographical areas, particularly in the vicinity of the plants location. This will include education, skill building for livelihood of people, health, and social welfare etc., particularly targeting at disadvantaged sections of society. CSR activities of the Company are carried out through Lumax Charitable Foundation.
The Company has framed a CSR Policy in compliance with the provisions of the Companies Act, 2013 and the same is placed on the Company’s website and the web link for the same is http://www.lumaxindustries.com/pdf/CSR-policy.pdf
ANNEXURE - D
CSR ANNUAL REPORT
2. The Composition of the CSR Committee.
S. No Name Category
1 Mr. M.C Gupta Chairman
2 Mr. A.P Gandhi Member
3 Mr. D K Jain Member
4 Mr. Deepak Jain Member
5 Mr. Anmol Jain Member
3. Average net profit of the Company for last three financial years : ` 1871.10 Lacs
4. Prescribed CSR Expenditure (two per cent of the amount as in item 3 above) : ` 37.42 Lacs
5. Details of CSR spent during the financial year.
(a) Total amount spent for the financial year : ` 33.62 Lacs
(b) Amount unspent, if any : ` 3.80 Lacs
(c) Manner in which the amount spent during the financial year is detailed below:` in Lacs
Sl. No CSR Project or activity identified
Sector in which the project is covered
Projects or Programmes1. Local area or Other2. Specify the State and
district where proj-ects or programmes was undertaken
Amount outlay (budget) project or pro-grammes wise
Amount spent on the projects or programmesSub heads:1. Direct ex-
penditure on projects or programmes.
2. Overheads
Cumulative expenditure upto to the reporting period.
Amount spent: Direct or through implementing agency
(1) (2) (3) (4) (5) (6) (7) (8)1.
2.
Education Sponsorship/ Infrastructure support to School
Healthcare support to hospitals for under-privileged
a) Education b) Healthc) Overheads
Manufacturing sites of the Company
1. Gurgaon, Haryana
2. Dharuhera, Haryana
3. Pune, Maharashtra
4. Pantnagar, Uttarakhand
5. Bangalore, Karnataka
a) 14.78b) 11.50c) 4.21
a) 14.78b) 11.50c) 4.21
30.49 1. Spent through the CSR arm of the Company namely Lumax Charitable Foundation – ` 28.97 Lacs.
2. Spent directly by the Company - ` 1.52 Lacs
TOTAL - - 30.49 30.49 30.49 -
* The CSR arm of the company has also spent ` 1.72 Lacs on education of employees’ children/ one time expenditure, which as per the Company is CSR. However, these expenses are not classifiable as CSR expenditure in terms of Companies Act, 2013 and Rules made thereunder and therefore the same are not included in the above details of CSR expenditure. Further, out of the funds contributed by the Company to Lumax Charitable Foundation (LCF) an amount of ` 1.41 Lacs remained unspent with LCF.

Annual Report 2016-17 43
Co
rpo
rate Overview
Statu
tory R
epo
rtsFin
ancial S
tatemen
ts
6. Reasons for not spending the 2% of the average net profit of the last three financial years.
The Company endeavored to meet the budgeted expenditure in its CSR activities and was committed to incur expenditure for CSR initiatives, however, discontinuance of support to one school has resulted into a shortfall in the CSR expenditure as compared to the stipulated 2% of the average net profits of the last three financial years.
7. The CSR Committee confirms that the implementation and monitoring of the CSR Policy is in Compliance with the CSR objectives and Policy of the Company.
Deepak Jain M.C. GuptaManaging Director Chairman-CSR Committee

44 Lumax Industries Limited
ECONOMIC OVERVIEW
Global Economy
In 2016, the global economy is projected to witness its slowest growth since 2009 registering a growth of 3.1% (3.2% in 2015) driven by market volatility, policy uncertainties and weak trade. Though, the growth among advanced economies was stronger than expected driven by reduced inventory drag and moderate recovery in manufacturing it was offset by unexpected slowdown among the emerging nations. Inspite of stronger market confidence during the second half of the year led by revival in the economic activities, the growth in consumption, trade, investments and productivity is still likely to remain at subpar levels. The USA, Euro area and key emerging nations (especially China and India) witnessed slower than expected growths leading to overall slowdown. Further, the key events of Mr. Donald Trump being appointed as the President of the USA and the UK’s decision to exit the European Union have the potential to impact global market sentiments.
In 2016, the advanced economies were expected to grow by 1.6% compared to 2.1% in 2015. In USA, the low investments, dollar appreciation negatively impacting exports, potential policy uncertainties and declining energy spend dragged down growth to 1.6% compared to 2.6% in 2015. However, towards the end of the year activities rebounded with economy approaching full employment. Also, Mr. Donald Trump’s USA first approach, and focus on various reforms has the potential to further improve the country’s outlook.
In the Euro area, output remained below potential, across a number of advanced economies, resulting in likely decline in growth from 2% in 2015 to 1.7%. Low demand and capital formation, weak investments, and high unemployment continue to be a major hindrance to growth in the region. In Japan, the weak external demand and corporate investments during H2 2016 slowed down growth to 0.9% compared to 1.2% in 2015.
Among the Emerging Market and Developing Economies, though the growth in 2016 remained at same level of 2015 at 4.1%, the scenario across various economies remained diverse. In China, despite revival in activities since rebalancing, it was the weak private investments and declining productivity that impacted performance. However, save for the continued policy stimulus and
strong real estate investments that the economy is expected to witness a growth of 6.7%. In Russia, the economy is slowly coming out of recession with firming oil prices. However, the scenario in Brazil, Turkey and Argentina remained bleak.
The Brent crude oil prices during 2016 averaged USD 43.74, after undergoing significant correction during 2014 and 2015. The oil prices are further expected to strengthen to USD 52.69 in 2017 and USD 55.61 in 2018 driven by OPEC and non-OPEC members decision to cut oil production. (Source: Energy Information administration, EIa, the Guardian)
Outlook
Going forward the global economic scenario is likely to improve, on the back of better manufacturing, reducing inventory drags, normalisation of conditions among advanced economies, and primarily the expectation of strengthening scenario among the EMDEs. Besides, the firming oil prices and stable interest rates are likely to strengthen financial market sentiments. During 2017 and 2018, the global economic growth is likely to pick up to 3.4% and 3.6% respectively. (Source: IMF economic outlook, 2017)
INDIAN ECONOMY
Output growth
The growth across the three primary sectors of the economy is likely to remain diverse. While the gross value added by the industrial and services is likely to decline from 8.2% and 9.9% respectively in 2015-16 to 5.2% and 8.8% respectively in 2016-17, that from the agricultural sector is likely to grow from 0.76% in 2015-16 to 4.1%, driven by normal monsoon post two years of deficit. (Source: http://www.livemint.com/Industry/fOtMe4T3PN8ctLaeoO3E8M/Indias-GDP-growth-rate-for-201516-revised-to-79-from-76.html)
Macro-economic fundamentals
The macro-economic fundamentals of the country remain strong driven by favourable initiatives by the government which include focus on digitalising the economy, financial inclusion, enhancing ease of doing business and reducing the share of parallel cash economy. The interest rates scenario in the country became more favourable with RBI further cutting repo rates by 50 basis points to 6.25%, during Financial Year 2016-17. Fiscal deficit at the end of the Financial Year
ANNEXURE - E
ManageMent Discussion and analysis

Annual Report 2016-17 45
Co
rpo
rate Overview
Statu
tory R
epo
rtsFin
ancial S
tatemen
ts
17 fiscal stood at 3.5%, inflation at 4.7% while foreign exchange reserves rose to ` 24,102.8 bn.
Government initiatives
One of the most crucial step undertaken by the government has been the withdrawing of ` 500 and ` 1,000 currency notes amounting to ` 15.44 lakh cr in November 2016, in a bid to curb corruption, tax evasion, counterfeiting and put a check on the parallel cash economy. Post demonetisation, the Government’s primary focus has been on reducing cash transactions in the country and undergoing a major digital transformation to enhance the country’s efficiency. The move is likely to enhance tax collections and boost GDP growth over the long run.
Other critical initiatives by the Government include FDI norm relaxation, passing of GST bill, reducing bureaucracy levels, fast-tracking stalled projects, enhancing budgetary allocations to infrastructure sector, ease of doing business, and promoting growth of the small and medium businesses. The development of the agriculture sector has been another important focus area for the Government, whereby it has introduced various measures that would boost agriculture sector and revitalise the rural economy.
Crucial elections
The present Central Government’s victory in the 2017 assembly elections across the states of Uttar Pradesh, Goa, Uttarakhand and Manipur reiterated the notion of it being an investor friendly and development focused government. Moreover, this shall in all likelihood pace up clearances of pending various bills and bring political stability in the country, which is important for building up investor sentiments.
Outlook
With strong macro fundamentals and governance, the Indian economy is expected to remain the fastest growing major economy in the world. IMF predicts the country to grow at the rate of 7.2% in 2017-18 and 7.7% in 2018-19 driven by enhanced investor confidence in the Indian markets, improving financial stability, and projected infrastructural development.
INDUSTRY OVERVIEW
Automobile industry
The Automobile industry is amongst the key industries in India accounting for nearly 7.1% of its GDP. The country is one of the largest automobile manufactures in the world and the second largest in two wheeler segment.
Segment-wise key industry players
Passenger vehicles
Maruti Suzuki, Hyundai Motors and Mahindra & Mahindra
Commercial vehicles
Ashok Leyland, Tata Motors, Mahindra & Mahindra, and VECV
Three wheelers Bajaj Auto, Piaggio Vehicles, Mahindra & Mahindra
Two wheelers Hero Motorcorp, Honda Motorcycle, Bajaj Auto, TVS Motors
Production and sales
In 2016-17, the total vehicles (passenger vehicles, commercial vehicles, three wheelers, two wheelers and quadricycle) production in India increased by 5.41% from 24.02 Million vehicles in 2015-16 to 25.32 Million vehicles.
The sales of passenger vehicles rose by 9.23%, commercial vehicles by 4.16% and two wheelers 6.89% while that of three wheelers declined by 4.93%. The various sub-segments viz. utility vehicles, mopeds, goods carriers and scooters recorded highest growth of 29.91%, 23.02%, 12.75% and 11.39% respectively. The revival in demand from the rural markets and rise in infrastructure spending has been a key factor driving the growth of the automobile sector.
Growth in sales of various segments of vehicle industry
Growth (in %)Passenger vehicle segmentPassenger cars 3.85Utility vehicles 29.91Vans 2.37Commercial vehicle segmentMedium & heavy commercial vehicles 0.04Light commercial vehicles 7.41Three wheelers segment Passenger carriers -8.83Goods carriers 12.75Two wheelers segment Scooters 11.39Motorcycles 3.68Mopeds 23.02
Exports
In 2016-17, the overall automobile exports declined by (-)4.50% to 3.48 mn vehicles compared to 3.64 mn in 2015-16. The exports of passenger vehicles and commercial vehicles segment witnessed growth of 16.20% and 4.99% respectively, while that of three wheelers and two wheelers declined by (-)32.77% and (-)5.78% respectively. (Source: Society of Indian automobile Manufacturers, SIaM)

46 Lumax Industries Limited
Automobile production, sales and export trend(in Million)
Production Domestic Sales Export
2012-13 2013-14 2014-15 2015-16 2016-17
20.6
5
21.5
0
23.3
6
24.0
2
25.3
2
17.7
9
18.4
2
19.7
2
20.4
7
21.8
62.90
3.11 3.57
3.64
3.48
Outlook
India’s automobile industry has come a long way over the years with the outburst of middle class population. The country is also an important export destination for automobiles. The past few years have witnessed the industry undergoing significant changes with rising importance of aesthetics, policies getting more supportive, emission norms getting more stringent, and increasing use of new technologies. Globally, the new technologies that are redefining the industry in the short to medium term include reverse parking guide, in car infotainment system, anti-lock braking system, driver information system, immobilisers, body control module, telematics, tyre pressure monitoring system, fully automated temperature control, and LED based head lamps.
Over the past ten years, India has emerged as one of the most preferred locations in the world for manufacturing high quality automotive components and vehicles of all kinds, narrowing its gap over several established locations in the process. Over the next decade, the Automotive industry at a global level is likely to see significant transformation. Principal ones that are expected include the shift of growth in demand for automobiles from developed nations to developing nations (mainly BRICS); a dramatic increase in the share of electronics in automobiles making them a “computer on wheels”; a relentless pursuit of economies of scale and scope in design and engineering of automobiles and components, while also pursuing low cost manufacturing destinations. (Source: AMP 2016-26)
Automotive lighting industry
Automotive lighting components constitute a significant proportion of the overall automotive component industry and play a vital role in road safety. Modern day vehicles are geared with various types of lighting for purposes like visibility, bad weather conditions and fog. Apart from its traditional use, the automotive lighting is increasingly gaining importance as an aesthetic attribute. The lighting system comprises lighting and signalling devices that are placed in the front, rear, side and interiors. (Source: allied Market research)
Market Segmentation
Indian Automotive Lighting Market
By lighting technology
• Halogen
• Xenon
• LED
By vehicle type
• Passenger
• Commercial
• Two-wheelers
• Three-wheelers
• Tractors
By application
• Frontlighting
• Rearlighting
• Sidelighting
• Foglamps
• Interiorlighting
By sales channel type
• OEM
• Aftermarket
(Source: allied Market research)
Comparison of Automotive Lighting Technologies
Parameters Halogen lamps Xenon lamps LED lights
Basic operating elements Tungsten filament Electrodes and xenon gas Diodes
Average luminous efficacy 11‐20 lumen per watt 70‐100 lumen per watt 80‐110 lumen per watt
Life span Nearly 3,000 hours Nearly 20,000 hours Nearly 50,000 hours
(Source: allied Market research)
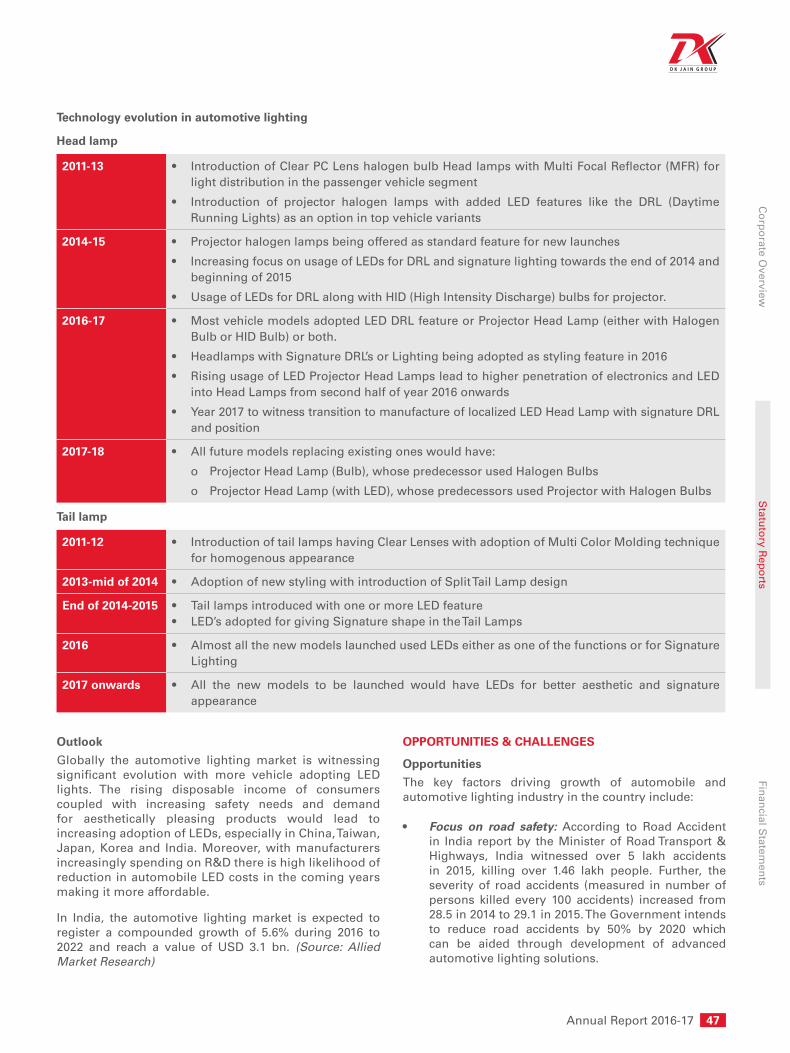
Annual Report 2016-17 47
Co
rpo
rate Overview
Statu
tory R
epo
rtsFin
ancial S
tatemen
ts
Technology evolution in automotive lighting
Head lamp
2011-13 • IntroductionofClearPCLenshalogenbulbHeadlampswithMultiFocalReflector(MFR)forlight distribution in the passenger vehicle segment
• Introduction of projector halogen lamps with added LED features like the DRL (DaytimeRunning Lights) as an option in top vehicle variants
2014-15 • Projectorhalogenlampsbeingofferedasstandardfeaturefornewlaunches
• IncreasingfocusonusageofLEDsforDRLandsignaturelightingtowardstheendof2014andbeginning of 2015
• UsageofLEDsforDRLalongwithHID(HighIntensityDischarge)bulbsforprojector.
2016-17 • MostvehiclemodelsadoptedLEDDRLfeatureorProjectorHeadLamp(eitherwithHalogenBulb or HID Bulb) or both.
• HeadlampswithSignatureDRL’sorLightingbeingadoptedasstylingfeaturein2016
• RisingusageofLEDProjectorHeadLampsleadtohigherpenetrationofelectronicsandLEDinto Head Lamps from second half of year 2016 onwards
• Year2017towitnesstransitiontomanufactureoflocalizedLEDHeadLampwithsignatureDRLand position
2017-18 • Allfuturemodelsreplacingexistingoneswouldhave:
o Projector Head Lamp (Bulb), whose predecessor used Halogen Bulbs
o Projector Head Lamp (with LED), whose predecessors used Projector with Halogen Bulbs
Tail lamp
2011-12 • IntroductionoftaillampshavingClearLenseswithadoptionofMultiColorMoldingtechniquefor homogenous appearance
2013-mid of 2014 • AdoptionofnewstylingwithintroductionofSplitTailLampdesign
End of 2014-2015 • TaillampsintroducedwithoneormoreLEDfeature• LED’sadoptedforgivingSignatureshapeintheTailLamps
2016 • AlmostallthenewmodelslaunchedusedLEDseitherasoneofthefunctionsorforSignatureLighting
2017 onwards • All the new models to be launched would have LEDs for better aesthetic and signatureappearance
Outlook
Globally the automotive lighting market is witnessing significant evolution with more vehicle adopting LED lights. The rising disposable income of consumers coupled with increasing safety needs and demand for aesthetically pleasing products would lead to increasing adoption of LEDs, especially in China, Taiwan, Japan, Korea and India. Moreover, with manufacturers increasingly spending on R&D there is high likelihood of reduction in automobile LED costs in the coming years making it more affordable.
In India, the automotive lighting market is expected to register a compounded growth of 5.6% during 2016 to 2022 and reach a value of USD 3.1 bn. (Source: allied Market research)
OPPORTUNITIES & CHALLENGES
Opportunities
The key factors driving growth of automobile and automotive lighting industry in the country include:
• Focus on road safety: According to Road Accident in India report by the Minister of Road Transport & Highways, India witnessed over 5 lakh accidents in 2015, killing over 1.46 lakh people. Further, the severity of road accidents (measured in number of persons killed every 100 accidents) increased from 28.5 in 2014 to 29.1 in 2015. The Government intends to reduce road accidents by 50% by 2020 which can be aided through development of advanced automotive lighting solutions.

48 Lumax Industries Limited
• Aesthetics & luminosity: LED lamps are more aesthetically pleasing and provide scope for enhancing design quality. Moreover, the average luminous efficacy of these lamps is higher than traditional lamps which enhances its effectiveness in dark.
• Favourable industry scenario: In India, the automobile sector is all set to grow driven by rising affluence (proportion of spending from affluent household expected to rise to 40% by 2025 from 26% in 2015), low vehicle penetration (32 vehicles per 1,000 population compared an average of 192 globally), declining interest rates (repo rates declined from highs of 8% in 2014 to 6.25% currently) and Government’s strong focus towards development of roads and highways in the country.
• Decline in LED prices: One of the key detriments to shifting to LEDs in automotive lighting is its high cost. However, as the technology is evolving, the prices of automotive LED lighting are expected to decline in future, which will result in increasing acceptability in the market.
Challenges
• High manufacturing costs: The Indian automotive lighting industry faces a key challenge of high cost of manufacturing.
• Availability of low-cost alternative: The easy availability of low-cost imported products, primarily from China, significantly impacts the sales volume of domestic players
• Technology: Most of the domestic players lack the matured technology that is essential for, manufacturing quality products and reducing cost of production.
PRODUCT WISE PERFORMANCE
The Company is engaged only in one segment of products viz. manufacture of Auto Components, mainly Automotive Lighting Systems. The Product wise performance during the year is as follows:
(in ` Millions)
Product Turnover Automotive lamps 11848.21Tools 1055.95Miscellaneous items 93.65Total 12997.81
RISKS & CONCERNS
Technology risk
Lack of appropriate technological competence could hinder the Company’s ability to develop competitive products and reduce costs.
Mitigation:
• The Company’s JV with Stanley, a world-leader inautomotive lighting products, provides it access to advanced technologies.
• The Company has state-of-the-art R&D facilities,advanced equipment, and rich intellectual capital which further enhances its technological competence.
Quality risk
Inability of the Company to adhere to quality standards, essential for supplying products to OEMs, can lead to loss of customers.
Mitigation:
• The Company has skilled workforce who areperiodically provided job skill enhancement training. It has also adopted various quality and productivity enhancing initiatives like Kaizen, Total Productivity Maintenance, Quality Circles, Total Quality Management, 5-S, 6 sigma, and 7-W processes.
• Itregularlyinteractswithitssuppliers,supervisesthemand conducts periodical audits at their plants to ensure the raw materials meet the required quality standards.
• TheCompanyhasfocusedonrationalisingsupplierswhereby it decides to stop doing business with suppliers if they do not improve quality standards after repeated communications.
Competition risk
Inability of the Company to manufacture relevant products catering to requirements of OEMs would result in loss of market share.
Mitigation:
• The Company undertakes various research anddevelopment activities to ensure that its products match client specification for newer models.
• It enjoys long term relationships with leadingautomobile manufacturers in the country owing to years of unmatched quality and service standards.
• Ability of the Company tomodify auto-componentdesigns along with undertaking initiatives to reduce costs enables it to be a leading player in the segment.
INTERNAL CONTROL SYSTEMS AND THEIR ADEQUACY
The internal control system of the Company is commensurate to the size of its business and the nature of industry it operates in. These well-defined and adequately documented systems focuses on safeguarding the Company’s assets, ensuring reliability of financials and maintaining effectiveness of organisation along with ensuring adherence to the procedures, laws, rules and statues that applies on it. The compliance activities are being strictly monitored by the Legal & Secretarial Department headed by the Senior Vice-President (Legal) and the Group Company Secretary.

Annual Report 2016-17 49
Co
rpo
rate Overview
Statu
tory R
epo
rtsFin
ancial S
tatemen
ts
The Company has also appointed an Independent firm of Internal Auditor, who work under the overview of Audit Committee, to ensure all transactions are recorded and reported under the guidelines of the Accounting Standards. The Audit Committee makes sure that all activities are regularly monitored. Further, the top management along with the Audit Committee review the findings and recommendations of the Internal Auditors. Besides, the Company’s robust MIS systems ensure that all expenses are within budget and any mismatch is immediately flagged off for corrective actions.
Discussion on Financial Performance with reference to Operational Performance
The auto industry in India has seen a revival last year after two years of turbulence. The production of Automobiles in the financial year 2016-17 has grown by 5.41% as compared to the last financial year ended on March 31, 2016. Your Company clocked a growth of 3.56% year on year.
REVENUE
Your company’s business is directly dependent on the Original Equipment Manufacturer(s) of Automobiles (OEM’s). Your company has achieved Net Sales of ` 12997.81 Million for the year ended March 31, 2017 as compared to ` 12551.75 Million in the previous year.
PROFITS
Your Company has recorded a Profit before Tax (PBT) of ` 541.60 Million for the year ended March 31, 2017 as compared to Profit before Tax (PBT) of ` 415.90 Million in the previous year.
DIVIDEND
The Company has been declaring dividend for the last 32 years continuously. Therefore, keeping in view of the philosophy of the Company to reward its shareholders and to continue the tradition of recommending dividend for the last 32 years, your Directors are pleased to recommend a Dividend of 145% (` 14.50/- per Equity Share) for the Financial Year 2016-17 (` 12/- per Equity share in the previous year).
The total amount of Dividend proposed to be distributed is ` 135.54 Million (excluding Dividend Tax).
SIGNIFICANT DEVELOPMENT IN HUMAN RESOURCES
Human resources are the most critical element at Lumax Industries contributing to the organisation’s growth over the years and charting its long term business sustainability. The Company’s human resource policies revolve around the areas of developing a professional, productive and dedicated workforce. The employees are time and again provided with various skill and personal development trainings to ensure a continuous growth in their competencies. The Company focuses on providing employees a conducive and safe work environment for
enhancing employee morale and aligning individual goals with that of the organisation.
Engaging programmes, are being undertaken to ensure higher satisfaction levels. Further, the Company’s Quality Control Circles (QCC), whereby nearly 56% of the blue collared employees are registered, provides a significant scope of enhancing job skills. The Company has also adopted several international shop floor improvement initiatives which include Kaizen, Quality Circles, Total Productivity Maintenance, Total Quality Management, 5-S, 6 sigma, 7-W processes focused on enhancing processes and productivity.
GURUKUL, Lumax’s training school in Bawal plant, is another important initiative by the Company whereby fresh individuals hired by the Company have to attend a 10-day training programme that provides practical training experience for better understanding of job and skill development. These trained individuals are then allocated across various plants where their activities, performances, job skills, behaviour, and mannerism are monitored and found to be more effective than those who have not attended this training. The Company has also identified trainers who can visit different plants to provide these trainings in case the employees are unable to visit the same.
One of the key achievements of the Company during the year has been the success of its seven QCC teams in the national level Quality Circle Forum of India (QCFI) contest and their qualification in the international level contest to be held in Philippines. The Company undertakes regional safety meeting at regular defined periods, whereby ensuring that each of the plants are thoroughly conducting safety audits and monitoring the findings. In addition to this, the Company also provides KY training, which is a kind of danger prediction training whereby key areas of hazards in the workplace are identified and effective solutions developed.
In 2016-17, the Company ensured healthy relationship with the workforce. The Company’s total employee strength as on March 31, 2017 stood at 2292.
CAUTIONARY STATEMENT
The statements made in the Management Discussion and analysis report that describes your company’s projections, estimates and expectations may be interpreted as “forward looking statements” which are within the scope of applicable securities laws and regulations. The company’s actual performance could differ from those expressed or implied. Important factors like on-going economic scenario, price conditions in the domestic and international markets in which the company operates, regulatory changes, taxation laws and other statutes have the potential to impact its operations. The company assumes no responsibility to publicly amend, modify or revise these forward looking statements on the basis of any subsequent development, information or events.

50 Lumax Industries Limited
The Securities and Exchange Board of India (SEBI) regulates Corporate Governance Practices of Companies Listed on the Indian Stock Exchanges. The Corporate Governance framework has been referred to in Regulation 15(2) of SEBI (Listing Obligations and Disclosure Requirements) Regulations, 2015. These Regulations specifies the standards that Indian Companies have to Comply and the disclosures that they have to make with regards to Corporate Governance. Your Company has established systems and procedures to comply with the amended provisions of the Corporate Governance and is complying with the same in its letter and spirit.
1. COMPANY’S PHILOSOPHY:
The Company remains committed to high standards of Corporate Governance. The Company believes that Corporate Governance is based on the principle of integrity, fairness, equity, transparency, accountability and commitment to values. Good Governance Practices stem from the culture and mindset of the organisation.
We believe that sound Corporate Governance is critical to enhance and retain investors trust. Accordingly, we always seek to ensure that, we attain our performance rules with integrity. Our Board exercises its fiduciary responsibilities in the widest sense of the term. We also endeavor to enhance long term shareholder value and respect minority rights in all our business decisions.
Our Corporate Governance philosophy is based on the following principles:
• Satisfythespiritofthelawandnotjusttheletterof the law.
• Corporate Governance standards should gobeyond the law.
• Be transparent andmaintain a high degree ofdisclosure levels.
• Have a simple and transparent corporatestructure driven solely by business needs.
• Managementisthetrusteeoftheshareholders’capital and not the owner.
2. BOARD OF DIRECTORS, MEETINGS OF THE BOARD, PROCESS AND PROCEDURES AT THE MEETING:
The Board of Directors is the apex body constituted by the shareholders for overseeing the overall
functioning of the Company. The Board provides and evaluates the strategic direction of the Company, management policies and their effectiveness and ensures that the long-term interests of the shareholders are being served.
The Company’s Board of Directors consists of twelve (12) Directors. Out of these twelve (12) Directors, Four (4) Directors are Executive Director(s), Two (2) including the Chairman are Non Executive Directors and Six (6) are Non Executive Independent Director(s) including one women Director. The Managing Director is assisted by Joint Managing Director, Senior Executive Director, Executive Director and Senior Managerial Personnel in overseeing the functional matters of the Company. The Board of Directors have met five times during the year. The Company follows the following process and procedures for the Board Meetings.
A. Scheduling and Selection of Agenda Items for Board Meetings:
(i) Minimum four pre-scheduled Board meetings are held every year. Apart from the above, additional Board meetings are convened by giving appropriate notice to address the specific needs of the Company. In case of business exigencies or urgency of matters, resolutions are passed by circulation.
(ii) The meetings are usually held at the Company’s office at Plot No. 16, Sector-18, Maruti Complex, Gurgaon, Haryana-122015.
(iii) All divisions/departments of the Company are advised to schedule their work plans well in advance, particularly with regard to matters requiring discussion/ approval/decision at the Board meetings. All such matters are communicated to the Company Secretary in advance so that the same could be included in the Agenda for the Board meetings.
(iv) The Board is given presentations by the Statutory Auditors, Internal Auditors and Head Finance covering Finance, Sales, major business segments and operations of the Company, all business areas of the Company including business opportunities, business strategy and the risk management practices and Internal Audit issues before
ANNEXURE - F
CORPORATE GOVERNANCE REPORT
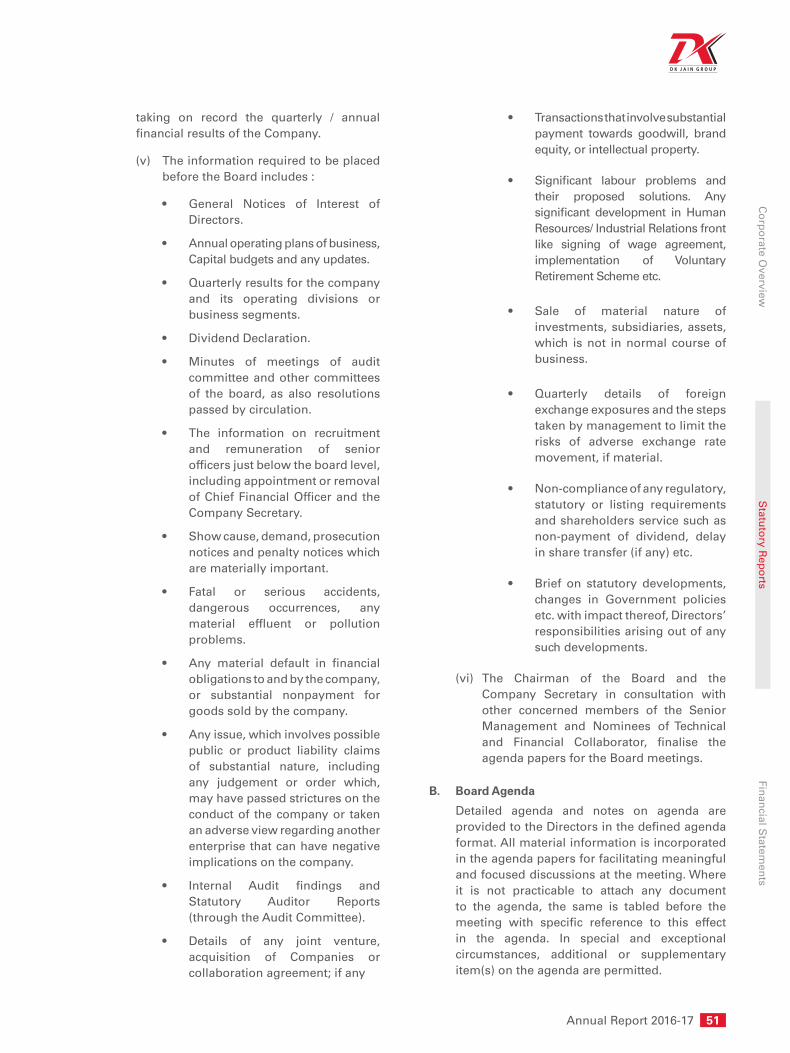
Annual Report 2016-17 51
Co
rpo
rate Overview
Statu
tory R
epo
rtsFin
ancial S
tatemen
ts
taking on record the quarterly / annual financial results of the Company.
(v) The information required to be placed before the Board includes :
• General Notices of Interest ofDirectors.
• Annualoperatingplansofbusiness,Capital budgets and any updates.
• Quarterlyresultsforthecompanyand its operating divisions or business segments.
• DividendDeclaration.
• Minutes of meetings of auditcommittee and other committees of the board, as also resolutions passed by circulation.
• The information on recruitmentand remuneration of senior officers just below the board level, including appointment or removal of Chief Financial Officer and the Company Secretary.
• Showcause,demand,prosecutionnotices and penalty notices which are materially important.
• Fatal or serious accidents,dangerous occurrences, any material effluent or pollution problems.
• Any material default in financialobligations to and by the company, or substantial nonpayment for goods sold by the company.
• Anyissue,whichinvolvespossiblepublic or product liability claims of substantial nature, including any judgement or order which, may have passed strictures on the conduct of the company or taken an adverse view regarding another enterprise that can have negative implications on the company.
• Internal Audit findings andStatutory Auditor Reports (through the Audit Committee).
• Details of any joint venture,acquisition of Companies or collaboration agreement; if any
• Transactionsthatinvolvesubstantialpayment towards goodwill, brand equity, or intellectual property.
• Significant labour problems andtheir proposed solutions. Any significant development in Human Resources/ Industrial Relations front like signing of wage agreement, implementation of Voluntary Retirement Scheme etc.
• Sale of material nature ofinvestments, subsidiaries, assets, which is not in normal course of business.
• Quarterly details of foreignexchange exposures and the steps taken by management to limit the risks of adverse exchange rate movement, if material.
• Non-complianceofanyregulatory,statutory or listing requirements and shareholders service such as non-payment of dividend, delay in share transfer (if any) etc.
• Brief on statutory developments,changes in Government policies etc. with impact thereof, Directors’ responsibilities arising out of any such developments.
(vi) The Chairman of the Board and the Company Secretary in consultation with other concerned members of the Senior Management and Nominees of Technical and Financial Collaborator, finalise the agenda papers for the Board meetings.
B. Board Agenda
Detailed agenda and notes on agenda are provided to the Directors in the defined agenda format. All material information is incorporated in the agenda papers for facilitating meaningful and focused discussions at the meeting. Where it is not practicable to attach any document to the agenda, the same is tabled before the meeting with specific reference to this effect in the agenda. In special and exceptional circumstances, additional or supplementary item(s) on the agenda are permitted.

52 Lumax Industries Limited
C. Recording Minutes of proceedings at Board Meetings
The Company Secretary records the Minutes of the proceedings of each Board and Committee meeting. Draft minutes are circulated to all the members of the Board / Committee for their comments. The final minutes are entered in the Minutes Book within 30 days from conclusion of the meeting.
D. Post Meeting Follow-up Mechanism
The Guidelines for Board meetings facilitate an effective post meeting follow-up, review and reporting process for the decisions taken by the Board. The important decisions taken at the Board meetings are communicated to the departments / divisions concerned promptly. Action taken report on the decisions/minutes of the previous meeting(s) is placed at the
immediately succeeding meeting of the Board for noting by the Board.
E. Role of the Company Secretary in Overall Governance Process
The Company Secretary plays a key role in ensuring that the Board procedures are followed and regularly reviewed. He ensures that all relevant information, details and documents are made available to the Board and Senior Management for effective decision making. The Company Secretary while preparing the agenda, Notes on agenda, Minutes etc. of the meeting(s), is responsible for and is required to ensure adherence to all the applicable laws and regulations including the Companies Act, 2013 read with the Rules framed there under and the Secretarial Standards recommended by the Institute of Company Secretaries of India.
Sl.No
Name of the Directors
Category of Directorship
No. of Board
Meetings Attended
No. of Director-ships in Other Public
Companies1
No. of Committee Positions Held in Other Public
Companies2
Last AGM Attended
Relationship Interse
Chairman Member
1 Mr. D.K. Jain Non Executive Chairman
5 8 - 1 Yes Related as Father to Mr. Deepak Jain and Mr. Anmol Jain
2 Mr. Deepak Jain
Managing Director
5 7 1 - Yes Related as Son to Mr. D.K Jain and as Brother to Mr. Anmol Jain
3 Mr. Anmol Jain
Joint Manag-ing Director
5 7 - 2 Yes Related as Son to Mr. D.K Jain and as Brother to Mr. Deepak Jain
4 Mr. Eiichi Hirooka
Sr. ExecutiveDirector (StanleyNominee)
5 - - - Yes Related as Nominee Directors of Stanley.
5 Mr. Koji Sawada*
Executive Director (StanleyNominee)
3 - - - No Related as Nominee Directors of Stanley.
6 Mr. Toru Tanabe
Non-Executive Director (Stanley Nominee)
1 - - - No Related as Nominee Directors of Stanley.
7 Mr. A.P. Gandhi
Non-Executive Independent Director
4 8 2 5 No Not related to any Director.
8 Mr. Gursaran Singh **
Non-Executive Independent Director
1 3 - - Yes Not related to any Director.
9 Mr. M.C. Gupta
Non-Executive Independent Director
5 2 2 1 Yes Not related to any Director.
F. Composition, Category and Attendance of Directors at Board Meetings, Last Annual General Meeting (AGM) and number of other Directorships and Chairmanships/Memberships of Committees of each Director in various Companies as on March 31, 2017.
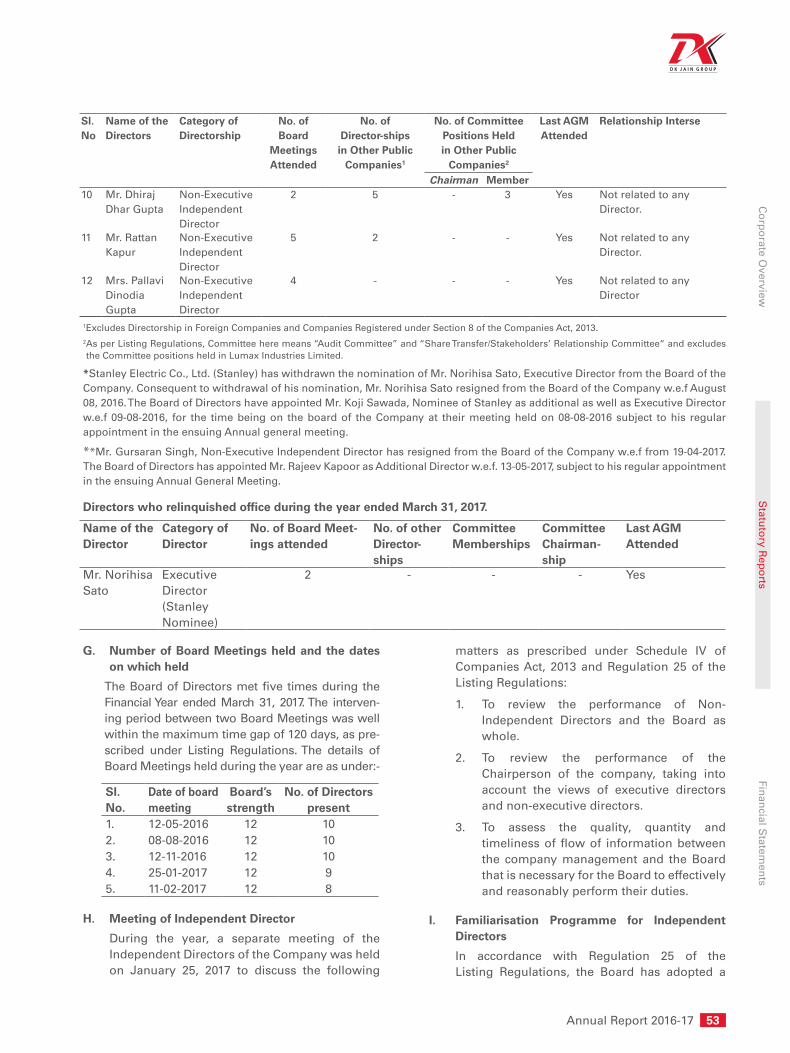
Annual Report 2016-17 53
Co
rpo
rate Overview
Statu
tory R
epo
rtsFin
ancial S
tatemen
ts
Sl.No
Name of the Directors
Category of Directorship
No. of Board
Meetings Attended
No. of Director-ships in Other Public
Companies1
No. of Committee Positions Held in Other Public
Companies2
Last AGM Attended
Relationship Interse
Chairman Member10 Mr. Dhiraj
Dhar GuptaNon-Executive Independent Director
2 5 - 3 Yes Not related to any Director.
11 Mr. Rattan Kapur
Non-Executive Independent Director
5 2 - - Yes Not related to any Director.
12 Mrs. Pallavi Dinodia Gupta
Non-Executive Independent Director
4 - - - Yes Not related to any Director
1Excludes Directorship in Foreign Companies and Companies Registered under Section 8 of the Companies Act, 2013.
2 As per Listing Regulations, Committee here means “Audit Committee” and “Share Transfer/Stakeholders’ Relationship Committee“ and excludes the Committee positions held in Lumax Industries Limited.
*Stanley Electric Co., Ltd. (Stanley) has withdrawn the nomination of Mr. Norihisa Sato, Executive Director from the Board of the Company. Consequent to withdrawal of his nomination, Mr. Norihisa Sato resigned from the Board of the Company w.e.f August 08, 2016. The Board of Directors have appointed Mr. Koji Sawada, Nominee of Stanley as additional as well as Executive Director w.e.f 09-08-2016, for the time being on the board of the Company at their meeting held on 08-08-2016 subject to his regular appointment in the ensuing Annual general meeting.
**Mr. Gursaran Singh, Non-Executive Independent Director has resigned from the Board of the Company w.e.f from 19-04-2017. The Board of Directors has appointed Mr. Rajeev Kapoor as Additional Director w.e.f. 13-05-2017, subject to his regular appointment in the ensuing Annual General Meeting.
Directors who relinquished office during the year ended March 31, 2017.
Name of the Director
Category of Director
No. of Board Meet-ings attended
No. of other Director-ships
Committee Memberships
Committee Chairman-ship
Last AGM Attended
Mr. Norihisa Sato
Executive Director(Stanley Nominee)
2 - - - Yes
G. Number of Board Meetings held and the dates on which held
The Board of Directors met five times during the Financial Year ended March 31, 2017. The interven-ing period between two Board Meetings was well within the maximum time gap of 120 days, as pre-scribed under Listing Regulations. The details of Board Meetings held during the year are as under:-
Sl. No.
Date of board meeting
Board’s strength
No. of Directors present
1. 12-05-2016 12 102. 08-08-2016 12 103. 12-11-2016 12 104. 25-01-2017 12 95. 11-02-2017 12 8
H. Meeting of Independent Director
During the year, a separate meeting of the Independent Directors of the Company was held on January 25, 2017 to discuss the following
matters as prescribed under Schedule IV of Companies Act, 2013 and Regulation 25 of the Listing Regulations:
1. To review the performance of Non-Independent Directors and the Board as whole.
2. To review the performance of the Chairperson of the company, taking into account the views of executive directors and non-executive directors.
3. To assess the quality, quantity and timeliness of flow of information between the company management and the Board that is necessary for the Board to effectively and reasonably perform their duties.
I. Familiarisation Programme for Independent Directors
In accordance with Regulation 25 of the Listing Regulations, the Board has adopted a
54 Lumax Industries Limited
Familiarisation Programme for Independent Directors to familiarize the Independent Directors of the company with the organisation.
The Company through its Managing Director/Chief Executive Officer/Senior Managerial Personnel conducts programmes/presentations periodically to familiarize the Independent Directors with the strategy, operations and functions of the Company and above all the Industry perspective & issues.
The Independent Directors are provided with all the documents/reports/policies sought by them for enabling a good understanding of the Company, its various operations and the industry of which it is a part. The Independent Directors are also provided with regular updates on relevant statutory changes to ensure that they remain upto date on the Compliance framework.
The details of such Familiarisation Programme for Independent Director are uploaded on the website of the company and the web link of the same is provided here under: http://www.lumaxindustries.com/pdf/familarisation-program.pdf.
3. COMMITTEES OF THE BOARD
Currently, the Board has Four Committees: the Audit Committee, the Nomination and Remuneration Committee, the Share Transfer/ Stakeholder Relationship Committee and Corporate Social Responsibility Committee. The Company’s process and procedure related to the Board Meetings are also applicable and followed in the Committee Meetings. The brief details of the various committees of the Board and their constitution and functions are as under:
A. Audit Committee
a) Composition and Attendance
The Audit Committee comprises of five non-executive Independent Directors, Managing Director and Executive Director. The Composition of the Audit Committee during the Financial Year April 2016 to March 2017 was as follows:
S. No. Name Status Category of
membership1. Mr. A.P.
Gandhi
Chairman Non-Executive
Independent Director
2. Mr. M.C.
Gupta
Member Non-Executive
Independent Director
S. No. Name Status Category of
membership3. Mr. D.D.
Gupta
Member Non-Executive
Independent Director4. Mr. Rattan
Kapur
Member Non-Executive
Independent Director5. Mrs. Pallavi
Dinodia Gupta
Member Non-Executive
Independent Director6. Mr. Deepak
Jain
Member Managing Director
7. Mr. Eiichi
Hirooka
Member Senior Executive
Director
The Audit Committee had met Six times during the Financial Year April 1, 2016 to March 31, 2017. The attendances of the meetings are as under:
S. No.
Directors No. of Meetings Attended
1. Mr. A.P. Gandhi 52. Mr. M. C. Gupta 63. Mr. D.D. Gupta 34. Mr. Rattan Kapur 65. Mrs. Pallavi Dinodia
Gupta5
6. Mr. Deepak Jain 47. Mr. Eiichi Hirooka 4
Statutory Auditors, Internal Auditors and Finance Head are permanent invitees to the Audit Committee Meetings. The Company Secretary acts as the Secretary to the Audit Committee.
The Audit Committee has been constituted as per Section 177 of the Companies Act, 2013 and the guidelines set out in the Listing Regulations. The Audit Committee of the Company, inter-alia, provides assurance to the Board on the existence and adequacy of an effective Internal Control systems that ensures:
• Efficiencyandeffectivenessofoperations.
• Safeguarding of Assets and adequacy ofprovisions for all liabilities.
• Reliability of all financial and othermanagement information and adequacy of disclosures.
• Compliancewithallrelevantstatutes.
The Committee has powers as envisaged under Regulation 18 of the Listing Regulations and as specified by the Board of Directors of the Company.
Annual Report 2016-17 55
Co
rpo
rate Overview
Statu
tory R
epo
rtsFin
ancial S
tatemen
ts
b) Powers of Audit Committee
Audit Committee shall have following Powers:
1) To investigate any activity within its terms of reference;
2) To seek any information from any employee.
3) To obtain outside legal or other professional advice.
4) To secure attendance of outsiders with relevant expertise, if considered necessary.
c) Role of Audit Committee
1) Oversight of the company’s financial reporting process and the disclosure of its financial information to ensure that the financial statement is correct, sufficient and credible;
2) Recommendation for appointment, remuneration and terms of appointment of auditors of the company;
3) Approval of payment to statutory auditors for any other services rendered by the statutory auditors;
4) Reviewing, with the management, the annual financial statements and auditor’s report thereon before submission to the board for approval, with particular reference to:
a. Matters required to be included in the Director’s Responsibility Statement to be included in the Board’s report in terms of clause (c) of sub-section 3 of section 134 of the Companies Act, 2013.
b. Changes, if any, in accounting policies and practices and reasons for the same.
c. Major accounting entries involving estimates based on the exercise of judgment by management.
d. Significant adjustments made in the financial statements arising out of audit findings
e. Compliance with listing and other legal requirements relating to financial statements
f. Disclosure of any related party transactions
g. modified opinion(s) in the draft audit report;
5) Reviewing, with the management, the quarterly financial statements before submission to the board for approval;
6) Reviewing, with the management, the statement of uses / application of funds raised through an issue (public issue, rights issue, preferential issue, etc.), the statement of funds utilized for purposes other than those stated in the offer document / prospectus / notice and the report submitted by the monitoring agency monitoring the utilisation of proceeds of a public or rights issue, and making appropriate recommendations to the Board to take up steps in this matter;
7) Review and monitor the auditor’s independence and performance, and effectiveness of audit process;
8) Approval or any subsequent modification of transactions of the company with related parties;
9) Scrutiny of inter-corporate loans and investments;
10) Valuation of undertakings or assets of the company, wherever it is necessary;
11) Evaluation of internal financial controls and risk management systems;
12) Reviewing with the management, performance of the Statutory and Internal Auditors, adequacy of Internal Control systems.
13) Reviewing the adequacy of Internal Audit function, if any, including the structure of the internal audit department, staffing and seniority of the official heading the department, reporting structure coverage and frequency of internal audit.
14) Discussion with Internal Auditors on any significant findings and follow-up thereon.
15) Reviewing the findings of any internal investigations by the Internal Auditors into matters where there is suspected

56 Lumax Industries Limited
fraud or irregularity or a failure of internal control systems of a material nature and reporting the matter to the Board.
16) Discussion with Statutory Auditors before the audit commences, about the nature and scope of audit as well as post-audit discussion to ascertain any area of concern.
17) To look into the reasons for substantial defaults in the payment to the depositors, debenture holders, shareholders (in case of non payment of declared dividends) and creditors.
18) To Review the functioning of Whistle Blower mechanism.
19) Approval of appointment of CFO (i.e., the whole-time Finance Director or any other person heading the finance function or discharging that function) after assessing the qualifications, experience & background, etc. of the candidate.
20) Carrying out any other function as is mentioned in the terms of reference of the Audit Committee.
d) Review of information by Audit Committee
The Audit Committee shall mandatorily review the following information:-
1) Management discussion and analysis of financial conditions and results of operations;
2) Statement of significant related party transactions (as defined by the audit committee), submitted by management;
3) Management letters/ letters of internal control weakness issued by the Statutory Auditors;
4) Internal Audit Reports relating to internal control weakness; and
5) The appointment, removal and terms of remuneration of the Chief Internal Auditors shall be subject to review by the Audit Committee.
6) Statement of deviations, if any.
B. Nomination and Remuneration Committee
The Nomination and Remuneration Committee consists of Independent and Non-Executive Directors to review and recommend payment of annual salaries, commission, service agreements and other employment conditions of the Executive Directors of the Company. The committee fixes the remuneration after taking into consideration remuneration practices followed by Companies of similar size and standing in the Industry.
The Committee’s Constitution and terms of reference are in compliance with the provisions of the Companies Act, 2013 and Regulation 19 of the Listing Regulations.
The Nomination and Remuneration Committee comprises of four Directors as its members. All the members of the Committee are Non-Executive Independent Director and have sound knowledge of management practices. The Chairman of the Committee is a Non-Executive Independent Director nominated by the Board. The power and role of the Nomination & Remuneration Committee is as per guidelines set out in Listing Regulations. The constitution of the Nomination and Remuneration Committee is as under:
S. No
Name of Directors
Status Category of Membership
1. Mr. Rattan Kapur
Chairman Non-Executive Independent Director
2. Mr. A.P. Gandhi Member Non-Executive Independent Director
3. Mr. D.D. Gupta Member Non-Executive Independent Director
4. Mr. Gursaran Singh*
Member Non-Executive Independent Director
*Pursuant to resignation of Mr. Gursaran Singh from
the Board of the Company, he ceased to be the member
of the Nomination and Remuneration Committee.
The Nomination & Remuneration Committee had met twice during the financial year April

Annual Report 2016-17 57
Co
rpo
rate Overview
Statu
tory R
epo
rtsFin
ancial S
tatemen
ts
1, 2016 to March 31, 2017 to consider and recommend to the Board:-
1. Re-appointment of Mr. Anmol Jain as Joint Managing Director of the Company for a period of 5(Five) years.
2. Appointment of Mr. Koji Sawada as Director as well as Executive Director of the Company, nominee of Stanley, Japan and fixation of remuneration.
The attendance of the Nomination & Remuneration Committee Meeting is as under:
S. No.
Name of Directors
No. of Meetings Attended
1. Mr. Rattan Kapur 2
2. Mr. A.P. Gandhi 1
3. Mr. D.D. Gupta 2
4. Mr. Gursaran Singh 1
Role of Nomination and Remuneration Committee
1. formulation of the criteria for determining qualifications, positive attributes and independence of a director and recommend to the board of directors a policy relating to, the remuneration of the directors, key managerial personnel and other employees;
2. formulation of criteria for evaluation of performance of independent directors and the board of directors;
3. devising a policy on diversity of board of directors;
4. identifying persons who are qualified to become directors and who may be appointed in senior management in accordance with the criteria laid down, and recommend to the board of directors their appointment and removal.
5. whether to extend or continue the term of appointment of the independent director, on the basis of the report of performance evaluation of independent directors.
a) Remuneration Policy:
The Nomination and Remuneration Committee fixes the remuneration of the Executive Directors after considering various factors such as qualification, experience, expertise, prevailing remuneration in the competitive industries, financial position of the Company, etc. The remuneration structure comprises Basic Salary, Commission, Perquisites and Allowances, contribution to Provident Fund etc. The remuneration policy for Executive Directors is directed towards rewarding performance, based on review of achievements of Executive Directors. The Extract of the Remuneration and Evaluation of the Performance of the Board of Directors Policy is given below:
1.1 Purpose
The Board of Directors believes that an equitable remuneration to the Executive Management helps ensure that the company can attract and retain key employees. Efforts are made to ensure that the remuneration of the Board of Directors, Key Managerial Personnel (KMP) and other employees matches the level in comparable companies, whilst also taking into consideration board members’ required competencies, effort and the scope of the board work, including the number of meetings.
The policy shall ensure that level and composition of remuneration is reasonable and sufficient to attract, retain and motivate directors of the quality required to run the company successfully.
Section 178 of the Companies Act, 2013 and Regulation 19 of the Listing Regulations provides that the Nomination and Remuneration Committee shall formulate the criteria for determining
58 Lumax Industries Limited
qualifications, positive attributes and independence of a director and recommend to the Board a policy, relating to the remuneration for the directors, key managerial personnel and other employees.
This policy on remuneration of Directors and Key Managerial Personnel has been formulated by the Nomination and Remuneration Committee and approved by the Board of Directors of the Company.
1.2 Objective
The objective of this policy is to lay down a framework in relation to remuneration of Directors, KMP and other employees.
1.3 Definition
“Board” means Board of Directors of the Company.
“Key Managerial Personnel” means
i. Managing Director, or Chief Executive Officer or Manager and in their absence, a Whole-time Director;
ii. Chief Financial Officer;
iii. Company Secretary
1.4 Applicability & Accountability
This Policy is applicable to :
a) Directors viz. Executive and Non-Executive and Independent
b) Key Managerial Personnel
c) Other Employees of the Company
1.5 Nomination and Remuneration Committee
The Committee shall have at least 3 non-executive directors, out of which one-half shall be independent directors. If the chairperson of the company appointed as a member of the Committee, he shall not chair such Committee.
The members of the Committee are :
S.No. Name Category1 Mr. Rattan Kapur Chairman2 Mr. A.P. Gandhi Member3 Mr. D.D. Gupta Member4 Mr. Gursaran
SinghMember
1.6 Committee’s Responsibility
The key responsibilities of the Committee would be as follows :
• To guide the Board in relationto appointment and removal of Directors and Key Managerial Personnel.
• To evaluate the performance ofthe members of the Board and provide necessary report to the Board in this regard.
• To determine the remunerationof Directors and Key Managerial Personnel in such a manner that involves a balance between fixed and incentive pay reflecting short and long-term performance objectives appropriate to the working of the company and its goals:
• To recommend to the Board onRemuneration payable to the Directors and Key Managerial Personnel.
• Delegating any of its powers toone or more of its members or the Secretary of the Committee
1.7 Frequency of Meetings
The meeting of the Committee shall be held at such regular intervals as may be required.
1.8 Matter relating to appointment of Director and Key Managerial Personnel
a) The Committee shall identify and ascertain the integrity, qualification, expertise and experience of the person for appointment as Director and Key Managerial Personnel and recommend to the Board his / her appointment. While recommending

Annual Report 2016-17 59
Co
rpo
rate Overview
Statu
tory R
epo
rtsFin
ancial S
tatemen
ts
any person for appointment as Director, Committee shall keep in view the issue with respect to Board diversity;
b) The Committee has discretion to decide whether qualification, expertise and experience possessed by a person are sufficient/ satisfactory for the concerned position.
c) The Committee shall ensure that any appointment of a person as an independent director of the Company shall be made in accordance with the provisions of Section 149, 150 and 152 read with Schedule IV and other applicable provisions of the Companies Act, 2013 and the Companies (Appointment and Qualification of Directors) Rules, 2014 and Regulation 17 of the Listing Regulations.
1.9 Matter relating to the Remuneration for the Directors and Key Managerial Personnel
a) The Committee shall determine remuneration structure for Directors and Key Managerial Personnel taking into account factors it deems relevant, including but not limited to market scenario, business performance and practices in comparable companies, having due regard to financial and commercial health of the Company as well as prevailing laws and Government/other guidelines.
b) The remuneration / commission etc. to the Managing Director, Whole-time Director and Key Managerial Personnel will be determined by the Committee and recommended to the Board for approval. The remuneration / commission etc. shall be subject to the prior/post approval of the shareholders of the Company and
Central Government, wherever required.
c) If, in any financial year, the Company has no profits or its profits are inadequate, the Company shall pay remuneration to its Managing Director/ Executive/ Whole-time Director(s) in accordance with the provisions of Schedule V of the Companies Act, 2013 and if the remuneration paid is not in compliance with such provisions, the same shall be subject to the previous approval of the Central Government.
d) Increments to the existing remuneration structure may be recommended by the Committee to the Board, which shall be within the overall limits of remuneration as prescribed under Companies Act, 2013.
e) Where any insurance is taken by the Company on behalf of its Managing Director/ Executive/Whole-time Director, Key Managerial Personnel and any other employees for indemnifying them against any liability, the premium paid on such insurance shall not be treated as part of the remuneration payable to any such personnel. However, if such person is proved to be guilty, the premium paid on such insurance shall be treated as part of the remuneration.
Remuneration to Independent Director:
The Independent Director shall be paid sitting fees for attending meetings of Board or Committees thereof as may be decided by the Board from time to time. Provided that the amount of such fees shall not exceed ` One Lac per meeting of the Board or Committee.
Remuneration to Other Employees of the Company
Employees are assigned grades according
60 Lumax Industries Limited
to their qualifications and work experience, competencies as well as their roles and responsibilities in the Company. Individual remuneration is determined within the appropriate grade and is based on an individual’s experience, skill, competencies and knowledge relevant to the job and an individual’s performance and potential contribution to the Company.
Term / Tenure
a) Managing Director/Whole-time Director:
The Company shall appoint or re-appoint any person as its Executive Chairman, Managing Director or Executive/ Whole Time Director for a term not exceeding five years at a time. No reappointment shall be made earlier than one year before the expiry of term.
b) Independent Director:
An Independent Director shall hold office for a term up to five consecutive years on the Board of the Company and will be eligible for re-appointment on passing of a special resolution by the shareholders of the Company.
No Independent Director shall hold office for more than two consecutive terms, but such Independent Director shall be eligible for appointment after expiry of three years of ceasing to become an Independent Director. Provided that an Independent Director shall not, during the said period of three years, be appointed in or be
associated with the Company in any other capacity, either directly or indirectly.
The Terms and conditions of appointment of Independent Directors uploaded on the website of the company and the web link of the same is provided here under: http://www.lumaxindustries.com/pdf/letter-of-appointment.pdf.
Performance evaluation criteria for In-dependent Directors.
The Board is responsible for undertaking a formal annual evaluation of its own performance, its committees and individual Directors as per the provisions of Companies Act, 2013 and Listing Regulations, with a view to ensure that individual Directors and the Board as a whole work efficiently and effectively in achieving Company’s objectives. During the year, the evaluation of the Board as a whole, committees and all the Directors conducted as per the internally designed evaluation process approved by the Board. The Evaluation of Independent Director was carried out taking into account various parameters such as – exercises independent objective of judgement during board discussion, upholds ethical standards of integrity and probity, well informed about the company and the external environment in which it operates, maintains high level of confidentiality, assists the company in implementing best corporate governance practices etc.
b) The details of Remuneration paid to Whole Time Directors during the financial year ended March 31, 2017 are as follows:
S. No.
Name of the Directors
Salary(`)
Perquisites and other benefits (`)
Commission(`)
Total(`)
1. Mr. Deepak Jain 7,200,000 4,583,506 14,931,347 26,714,853
2. Mr. Anmol Jain 3,120,000 1,560,000 11,938,743 16,618,743
3. Mr. Eiichi Hirooka 288,000 1,773,391 - 2,061,391
4. Mr. Norihisa Sato(upto 08.08.2016)
102,194 633,115 - 735,309
5. Mr. Koji Sawada(w.e.f. 09.08.2016)
185,806 616,247 - 802,053
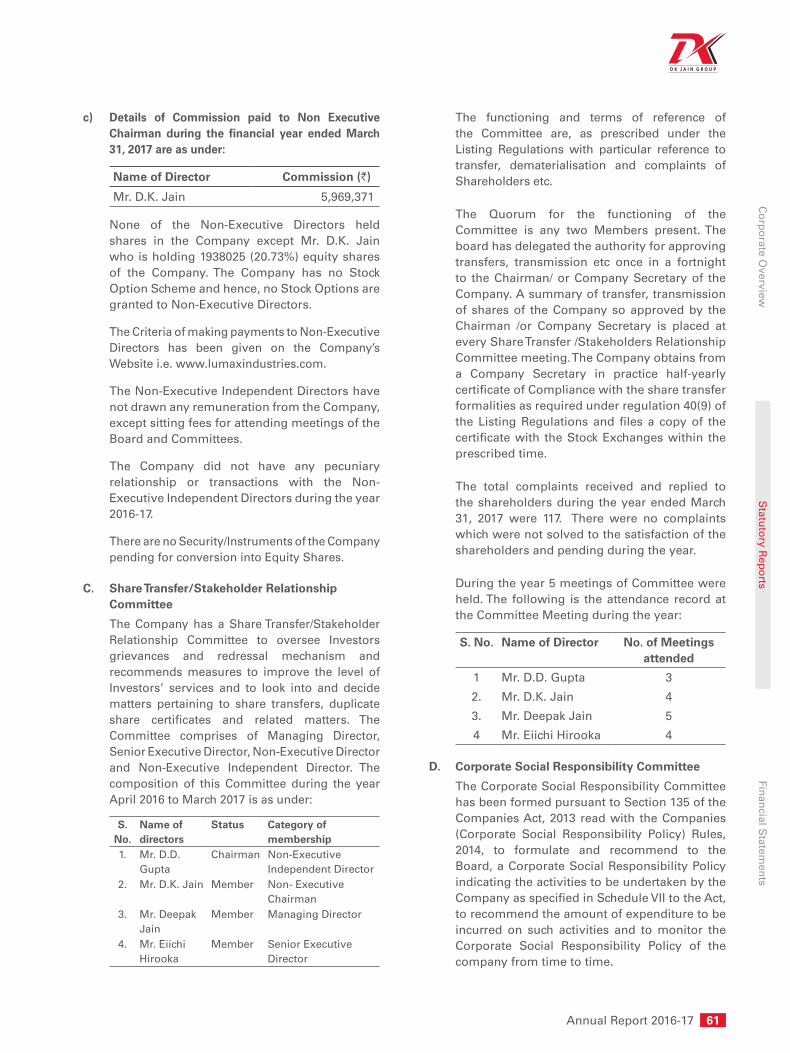
Annual Report 2016-17 61
Co
rpo
rate Overview
Statu
tory R
epo
rtsFin
ancial S
tatemen
ts
c) Details of Commission paid to Non Executive Chairman during the financial year ended March 31, 2017 are as under:
Name of Director Commission (`)
Mr. D.K. Jain 5,969,371
None of the Non-Executive Directors held shares in the Company except Mr. D.K. Jain who is holding 1938025 (20.73%) equity shares of the Company. The Company has no Stock Option Scheme and hence, no Stock Options are granted to Non-Executive Directors.
The Criteria of making payments to Non-Executive Directors has been given on the Company’s Website i.e. www.lumaxindustries.com.
The Non-Executive Independent Directors have not drawn any remuneration from the Company, except sitting fees for attending meetings of the Board and Committees.
The Company did not have any pecuniary relationship or transactions with the Non-Executive Independent Directors during the year 2016-17.
There are no Security/Instruments of the Company pending for conversion into Equity Shares.
C. Share Transfer/Stakeholder Relationship Committee
The Company has a Share Transfer/Stakeholder Relationship Committee to oversee Investors grievances and redressal mechanism and recommends measures to improve the level of Investors’ services and to look into and decide matters pertaining to share transfers, duplicate share certificates and related matters. The Committee comprises of Managing Director, Senior Executive Director, Non-Executive Director and Non-Executive Independent Director. The composition of this Committee during the year April 2016 to March 2017 is as under:
S. No.
Name of directors
Status Category of membership
1. Mr. D.D. Gupta
Chairman Non-Executive Independent Director
2. Mr. D.K. Jain Member Non- Executive Chairman
3. Mr. Deepak Jain
Member Managing Director
4. Mr. Eiichi Hirooka
Member Senior Executive Director
The functioning and terms of reference of the Committee are, as prescribed under the Listing Regulations with particular reference to transfer, dematerialisation and complaints of Shareholders etc.
The Quorum for the functioning of the Committee is any two Members present. The board has delegated the authority for approving transfers, transmission etc once in a fortnight to the Chairman/ or Company Secretary of the Company. A summary of transfer, transmission of shares of the Company so approved by the Chairman /or Company Secretary is placed at every Share Transfer /Stakeholders Relationship Committee meeting. The Company obtains from a Company Secretary in practice half-yearly certificate of Compliance with the share transfer formalities as required under regulation 40(9) of the Listing Regulations and files a copy of the certificate with the Stock Exchanges within the prescribed time.
The total complaints received and replied to the shareholders during the year ended March 31, 2017 were 117. There were no complaints which were not solved to the satisfaction of the shareholders and pending during the year.
During the year 5 meetings of Committee were held. The following is the attendance record at the Committee Meeting during the year:
S. No. Name of Director No. of Meetings attended
1 Mr. D.D. Gupta 3
2. Mr. D.K. Jain 4
3. Mr. Deepak Jain 5
4 Mr. Eiichi Hirooka 4
D. Corporate Social Responsibility Committee
The Corporate Social Responsibility Committee has been formed pursuant to Section 135 of the Companies Act, 2013 read with the Companies (Corporate Social Responsibility Policy) Rules, 2014, to formulate and recommend to the Board, a Corporate Social Responsibility Policy indicating the activities to be undertaken by the Company as specified in Schedule VII to the Act, to recommend the amount of expenditure to be incurred on such activities and to monitor the Corporate Social Responsibility Policy of the company from time to time.
62 Lumax Industries Limited
The Corporate Social Responsibility Committee comprises of Managing Director, Joint Managing Director, Non-Executive Chairman and Non-Executive Independent Directors. The Chairman of the Committee is Mr. M.C. Gupta, Non-Executive Independent Director. The Composition of Corporate Social Responsibility Committee during the year April 2016 to March 2017 is as under:
S. No. Name of Directors Status Category of Membership No. of meetings attended
1. Mr. M.C. Gupta Chairman Non-Executive Independent Director 3
2. Mr. A.P Gandhi Member Non-Executive Independent Director 3
3. Mr. D.K. Jain Member Non Executive Chairman 2
4. Mr. Deepak Jain Member Managing Director 2
5. Mr. Anmol Jain Member Joint Managing Director 2
E. Policy on Sexual Harassment
In accordance with the provisions of Sexual Harassment of Women at Workplace (Prevention, Prohibition and Redressal) Act, 2013, the Company has adopted the “Prevention of Sexual Harassment at Workplace Policy” and constituted an Internal Complaints Committee for Prohibition, Prevention and Redressal of Sexual Harassment of Women at Workplace and matters connected therewith or incidental thereto covering all the related aspects. During the year, no such complaints were received by the Company.
4. COMPLIANCE OFFICER OF THE COMPANY:
Mr. Shwetank Tiwari, Company Secretary is the Compliance Officer of the Company. He is primarily responsible to ensure compliance with applicable statutory requirements and is the interface between the management and regulatory authorities for governance matters.
5. GENERAL BODY MEETING
The details of Annual General Meeting (AGMs) held in the last three years are as follows:
Financial year
Date Time Location
2013-14 22-08-2014 10.30 A.M Air Force Auditorium, Subroto Park,New Delhi
2014-15 19-08-2015 10.30 A.M Air Force Auditorium, Subroto Park,New Delhi
2015-16 08-08-2016 10.30 A.M Air Force Auditorium, Subroto Park,New Delhi
Special Resolutions passed in previous three Annual General Meetings (AGM).
(i) AGM held on 22-08-2014:
a) Appointment of Mr. Norihisa Sato as Director as well as Executive Director of the Company.
b) Special Resolution under section 180(1)(c) and 180(1)(a) of the Companies Act, 2013 for the Borrowing powers of the Board of Directors and creation of security on assets of the Company.
(ii) AGM held on 19-08-2015:
a) Re-appointment of Mr. Eiichi Hirooka as Senior Executive Director for a period of 3 years
b) Increase in Remuneration of Mr. Deepak Jain, Managing Director of the Company.
c) Change in designation of Mr. Anmol Jain as Joint Managing Director of the Company
(iii) AGM held on 08-08-2016:
a) Re-appointment of Mr. Deepak Jain as Managing Director for a period of 5 years
b) Re-appointment of Mr. Anmol Jain as Joint Managing Director for a period of 5 years
There were no ordinary or special resolution that needed to be passed through Postal Ballot process during the year 2016-17.
6. CODE OF CONDUCT
The Company has adopted a Code of Conduct for all Board Members and Senior Employees of the Company. All Board Members and Senior Management Personnel have affirmed compliance with the Code of Conduct on annual basis. The Annual Report contains a declaration to this effect signed by the Managing Director of the Company. The Code of Conduct has already been posted on the website of Company for general viewing.
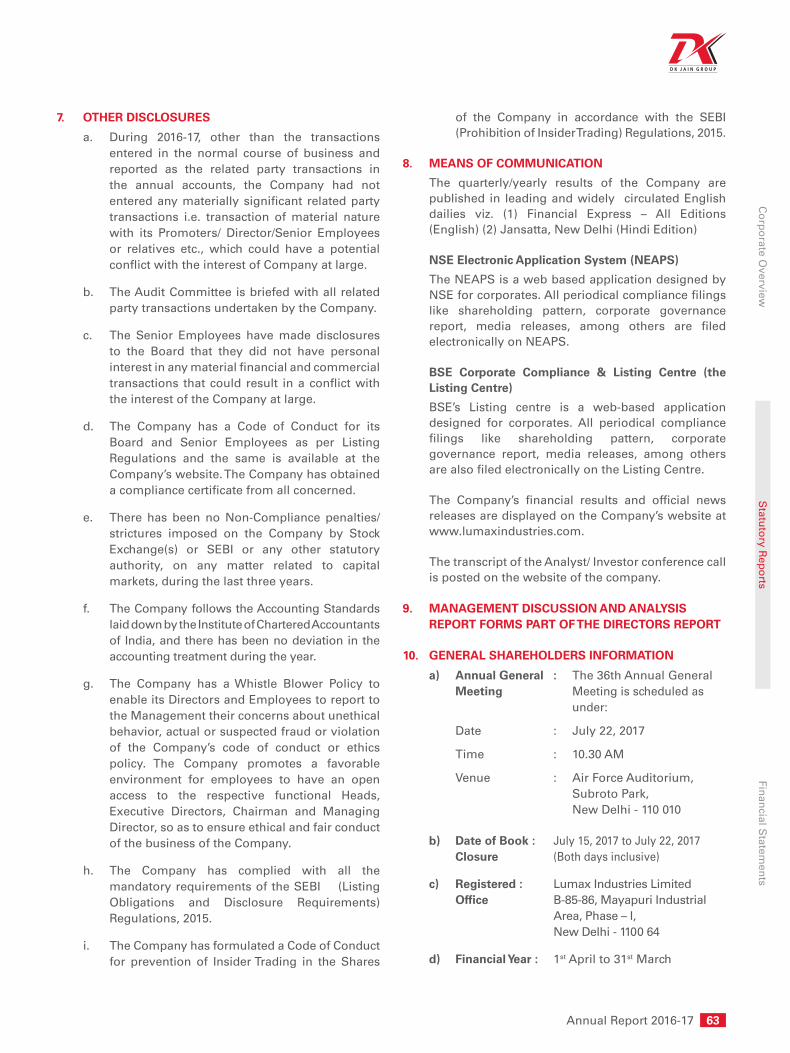
Annual Report 2016-17 63
Co
rpo
rate Overview
Statu
tory R
epo
rtsFin
ancial S
tatemen
ts
7. OTHER DISCLOSURES
a. During 2016-17, other than the transactions entered in the normal course of business and reported as the related party transactions in the annual accounts, the Company had not entered any materially significant related party transactions i.e. transaction of material nature with its Promoters/ Director/Senior Employees or relatives etc., which could have a potential conflict with the interest of Company at large.
b. The Audit Committee is briefed with all related party transactions undertaken by the Company.
c. The Senior Employees have made disclosures to the Board that they did not have personal interest in any material financial and commercial transactions that could result in a conflict with the interest of the Company at large.
d. The Company has a Code of Conduct for its Board and Senior Employees as per Listing Regulations and the same is available at the Company’s website. The Company has obtained a compliance certificate from all concerned.
e. There has been no Non-Compliance penalties/strictures imposed on the Company by Stock Exchange(s) or SEBI or any other statutory authority, on any matter related to capital markets, during the last three years.
f. The Company follows the Accounting Standards laid down by the Institute of Chartered Accountants of India, and there has been no deviation in the accounting treatment during the year.
g. The Company has a Whistle Blower Policy to enable its Directors and Employees to report to the Management their concerns about unethical behavior, actual or suspected fraud or violation of the Company’s code of conduct or ethics policy. The Company promotes a favorable environment for employees to have an open access to the respective functional Heads, Executive Directors, Chairman and Managing Director, so as to ensure ethical and fair conduct of the business of the Company.
h. The Company has complied with all the mandatory requirements of the SEBI (Listing Obligations and Disclosure Requirements) Regulations, 2015.
i. The Company has formulated a Code of Conduct for prevention of Insider Trading in the Shares
of the Company in accordance with the SEBI (Prohibition of Insider Trading) Regulations, 2015.
8. MEANS OF COMMUNICATION
The quarterly/yearly results of the Company are published in leading and widely circulated English dailies viz. (1) Financial Express – All Editions (English) (2) Jansatta, New Delhi (Hindi Edition)
NSE Electronic Application System (NEAPS)
The NEAPS is a web based application designed by NSE for corporates. All periodical compliance filings like shareholding pattern, corporate governance report, media releases, among others are filed electronically on NEAPS.
BSE Corporate Compliance & Listing Centre (the Listing Centre)
BSE’s Listing centre is a web-based application designed for corporates. All periodical compliance filings like shareholding pattern, corporate governance report, media releases, among others are also filed electronically on the Listing Centre.
The Company’s financial results and official news releases are displayed on the Company’s website at www.lumaxindustries.com.
The transcript of the Analyst/ Investor conference call is posted on the website of the company.
9. MANAGEMENT DISCUSSION AND ANALYSIS REPORT FORMS PART OF THE DIRECTORS REPORT
10. GENERAL SHAREHOLDERS INFORMATION
a) Annual General : The 36th Annual General Meeting Meeting is scheduled as
under:
Date : July 22, 2017
Time : 10.30 AM
Venue : Air Force Auditorium, Subroto Park, New Delhi - 110 010
b) Date of Book : July 15, 2017 to July 22, 2017 Closure (Both days inclusive)
c) Registered : Lumax Industries Limited Office B-85-86, Mayapuri Industrial
Area, Phase – I, New Delhi - 1100 64
d) Financial Year : 1st April to 31st March
64 Lumax Industries Limited
e) For the Financial Year 2016-17 results were announced on:
Adoption of Quarterly Results Ended
Dates
June 30, 2016 August 08, 2016September 30, 2016 November 12, 2016December 31, 2016 February 11, 2017March 31, 2017 (Audited Annual Accounts)
May 13, 2017
f) Financial Calendar for 2017-18 (Provisional).
Adoption of Quarterly Results Ended
Tentative Calendar #
June 30, 2017 2nd week of August 2017September 30, 2017 2nd week of
November 2017December 31, 2017 2nd week of
February 2018March 31, 2018 (Audited Annual Accounts)
4th week of May 2018
# Within 45/60 days of the end of the Quarter, as per
Listing Regulations.
g) Dividend & Dividend Payment Date:
A dividend of ` 14.50/- per share (145%) has been recommended by the Board of Directors for the Financial Year 2016-17 which is subject to the approval of the shareholders at the ensuing Annual General Meeting. For Demat shareholders and Physical shareholders who have opted for NECS/ ECS, Dividend Amount of ` 14.50/- per share will be credited directly to their respective bank accounts through NECS/ ECS, wherever such facilities are available, soon after the declaration of dividend in the AGM. For others, Dividend Warrants will be posted by August 16, 2017 (tentative)
h) Unclaimed Dividends:
Unclaimed Dividend for the Financial year 2009-2010 shall become transferable to the Investor Education & Protection Fund by last week of September, 2017. The Company has been writing periodical reminders to all the shareholders as a part of sending Notice of the Annual General Meeting, whose Dividends are lying unpaid in the Unpaid Dividend Account. Members who have not encashed their Dividend for the Financial year 2009-10 and onwards are therefore, requested to make their claims to the Company immediately.
Transfer of underlying share in to Investor Education and Protection Fund (IEPF) in cases where unclaimed dividends have been transferred to IEPF.
In terms of section 124 of the Companies Act, 2013 read with Investor Education & Protection Fund (IEPF) Authority (Accounting, Auditing transfer and refund) Rules 2016,the company is required to transfer the shares in respect of which dividends have remained unclaimed for a period of seven consecutive years to the IEPF account established by the central Government.
The Shareholders may note that both the unclaimed dividend and corresponding shares transferred to IEPF including all benefits accruing on such shares, if any can be claimed back from IEPF following the procedures prescribed in the Rules. No claim shall lie in respect of thereof with the Company.
i) Share Transfer System:
All work related to Share Registry, both in physical form and electronic form, is handled by the Company’s Registrar and Share Transfer Agent. The Company has appointed M/s Karvy Computershare Pvt. Ltd. as the Registrar & Share Transfer Agent. The Share transfers in physical form are approved by the Chairman and Company Secretary on fortnightly basis and the same were approved and ratified by the Share Transfer/ Stakeholder Relationship Committee.
The total number of shares transferred/transmitted during the Financial Year 2016-17 was 3910, which were registered and returned to the respective transferees within a period ranging from one to two weeks, provided the documents lodged with the Registrars/Company are clear in all respects.
j) Registrar and Share Transfer Agent (For Physical as well as for Demat Segment)
Address : M/s Karvy Computershare Pvt. Ltd. Unit: Lumax Industries Limited Karvy Selenium Tower-B,
Plot No.31-32, Gachibowli, Financial District, Nanakramguda, Hyderabad-500008
Tel : 040 -67162222
Fax : 040 -23001153
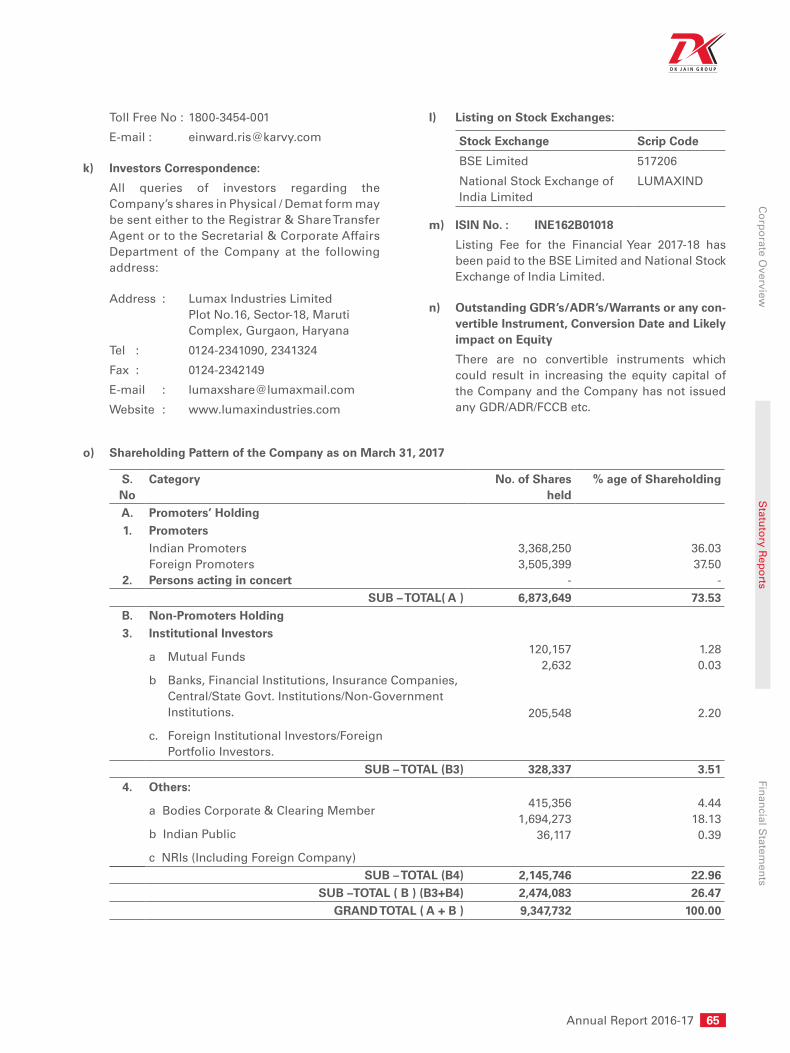
Annual Report 2016-17 65
Co
rpo
rate Overview
Statu
tory R
epo
rtsFin
ancial S
tatemen
ts
Toll Free No : 1800-3454-001
E-mail : [email protected]
k) Investors Correspondence:
All queries of investors regarding the Company’s shares in Physical / Demat form may be sent either to the Registrar & Share Transfer Agent or to the Secretarial & Corporate Affairs Department of the Company at the following address:
Address : Lumax Industries Limited Plot No.16, Sector-18, Maruti Complex, Gurgaon, Haryana
Tel : 0124-2341090, 2341324
Fax : 0124-2342149
E-mail : [email protected]
Website : www.lumaxindustries.com
l) Listing on Stock Exchanges:
Stock Exchange Scrip Code
BSE Limited 517206
National Stock Exchange of India Limited
LUMAXIND
m) ISIN No. : INE162B01018
Listing Fee for the Financial Year 2017-18 has been paid to the BSE Limited and National Stock Exchange of India Limited.
n) Outstanding GDR’s/ADR’s/Warrants or any con-vertible Instrument, Conversion Date and Likely impact on Equity
There are no convertible instruments which could result in increasing the equity capital of the Company and the Company has not issued any GDR/ADR/FCCB etc.
o) Shareholding Pattern of the Company as on March 31, 2017
S. No
Category No. of Shares held
% age of Shareholding
A. Promoters’ Holding1. Promoters
2.
Indian PromotersForeign PromotersPersons acting in concert
3,368,2503,505,399
-
36.0337.50
-SUB – TOTAL( A ) 6,873,649 73.53
B. Non-Promoters Holding3. Institutional Investors
a Mutual Funds
b Banks, Financial Institutions, Insurance Companies, Central/State Govt. Institutions/Non-Government Institutions.
c. Foreign Institutional Investors/Foreign Portfolio Investors.
120,1572,632
205,548
1.280.03
2.20
SUB – TOTAL (B3) 328,337 3.514. Others:
a Bodies Corporate & Clearing Member
b Indian Public
c NRIs (Including Foreign Company)
415,3561,694,273
36,117
4.4418.130.39
SUB – TOTAL (B4) 2,145,746 22.96SUB –TOTAL ( B ) (B3+B4) 2,474,083 26.47
GRAND TOTAL ( A + B ) 9,347,732 100.00

66 Lumax Industries Limited
p) Distribution of Shareholding as on March 31, 2017
Range of Shares No. of Share-holders
% of Shareholders
Amount (`) % of Equity Capital
15,001 10,001 20,00130,00140,00150,001 100,001
5,00010,00020,00030,00040,00050,000100,000& above
180802309739179
2432
97.581.240.520.210.090.050.130.18
857719017546501441410960740613920415390
175697077957050
9.171.881.541.030.660.441.88
83.40Total 18528 100.00 93477320 100.00
q) Dematerialisation of Shares: As per notifications issued by the Securities and Exchange Board of India (SEBI), the trading in Company’s
shares is permitted only in dematerialised form. In order to enable the shareholders to hold their shares in electronic form and to facilitate scripless trading, the Company has enlisted its shares with National Securities Depository Limited (NSDL) and Central Depository Services (India) Limited (CDSL).
r) Status of Dematerialisation & Liquidity as on March 31, 2017:
Dematerialisation:
No. of Shares Dematerialised 9,086,066 (97.20% of the total share capital)No. of Shareholders in Demat form 10,929 (58.99% of the total No. of Shareholders)
Liquidity:
The Numbers of Shares of the Company traded in the Stock Exchange for the financial year 2016-2017 is given below:
Particulars BSE NSE TotalNo of shares Traded 1,712,054 5,579,592 7,291,646% of total Equity 18.31% 59.69% 78.00%
s) Stock Market Data during the Financial Year 2016-17
The monthly High and Low Prices of the Shares of the Company Listed on BSE Limited (BSE) and National Stock Exchange of India Limited (NSE) along with the BSE “Sensex” and NSE “Nifty” are as follows:
MONTH
BSE NSE
Share Price Sensex Share Price S&P CNX Nifty
High (`) Low (`) High Low High (`) Low (`) High Low
April 2016 466.70 412.00 26100.54 24523.20 466.15 410.75 7992.00 7516.85
May 2016 571.90 430.50 26837.20 25057.93 572.00 422.10 8213.60 7678.35
June 2016 744.00 492.00 27105.41 25911.33 744.00 494.05 8308.15 7927.05
July 2016 805.60 685.00 28240.20 27034.14 805.00 687.65 8674.70 8287.55
August 2016 814.25 649.00 28532.25 27627.97 812.80 650.50 8819.20 8518.15
September 2016 859.00 650.00 29077.28 27716.78 859.90 652.00 8968.70 8555.20
October 2016 981.20 821.50 28477.65 27488.30 980.00 820.00 8806.95 8506.15
November 2016 989.00 685.05 28029.80 25717.93 996.00 689.10 8669.60 7916.40
December 2016 822.00 704.40 26803.76 25753.74 826.95 708.80 8274.95 7893.80
January 2017 1180.00 755.00 27980.39 26447.06 1179.95 749.55 8672.70 8133.80
February 2017 1424.00 1040.60 29065.31 27590.10 1423.00 1041.25 8982.15 8537.50
March 2017 1410.00 1274.05 29824.62 28716.21 1404.00 1276.00 9218.40 8860.10
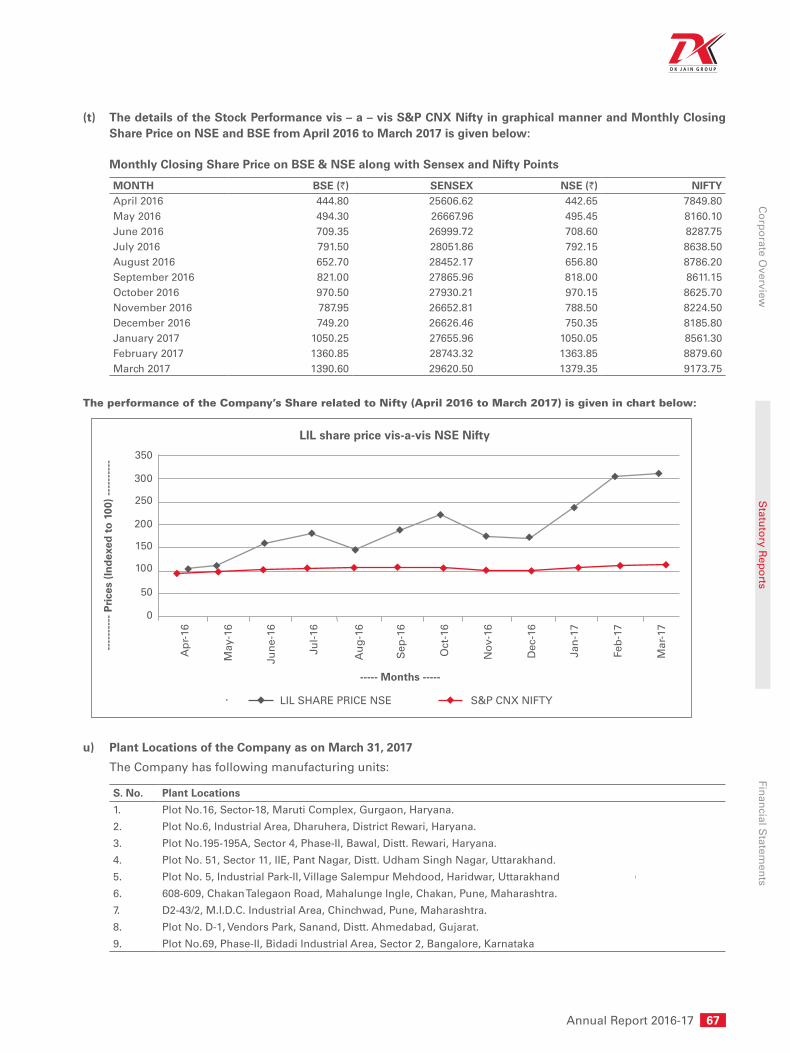
Annual Report 2016-17 67
Co
rpo
rate Overview
Statu
tory R
epo
rtsFin
ancial S
tatemen
ts
(t) The details of the Stock Performance vis – a – vis S&P CNX Nifty in graphical manner and Monthly Closing Share Price on NSE and BSE from April 2016 to March 2017 is given below:
Monthly Closing Share Price on BSE & NSE along with Sensex and Nifty Points
MONTH BSE (`) SENSEX NSE (`) NIFTYApril 2016 444.80 25606.62 442.65 7849.80May 2016 494.30 26667.96 495.45 8160.10June 2016 709.35 26999.72 708.60 8287.75July 2016 791.50 28051.86 792.15 8638.50August 2016 652.70 28452.17 656.80 8786.20September 2016 821.00 27865.96 818.00 8611.15October 2016 970.50 27930.21 970.15 8625.70November 2016 787.95 26652.81 788.50 8224.50December 2016 749.20 26626.46 750.35 8185.80January 2017 1050.25 27655.96 1050.05 8561.30February 2017 1360.85 28743.32 1363.85 8879.60March 2017 1390.60 29620.50 1379.35 9173.75
u) Plant Locations of the Company as on March 31, 2017
The Company has following manufacturing units:
S. No. Plant Locations
1. Plot No.16, Sector-18, Maruti Complex, Gurgaon, Haryana.
2. Plot No.6, Industrial Area, Dharuhera, District Rewari, Haryana.
3. Plot No.195-195A, Sector 4, Phase-II, Bawal, Distt. Rewari, Haryana.
4. Plot No. 51, Sector 11, IIE, Pant Nagar, Distt. Udham Singh Nagar, Uttarakhand.
5. Plot No. 5, Industrial Park-II, Village Salempur Mehdood, Haridwar, Uttarakhand
6. 608-609, Chakan Talegaon Road, Mahalunge Ingle, Chakan, Pune, Maharashtra.
7. D2-43/2, M.I.D.C. Industrial Area, Chinchwad, Pune, Maharashtra.
8. Plot No. D-1, Vendors Park, Sanand, Distt. Ahmedabad, Gujarat.
9. Plot No.69, Phase-II, Bidadi Industrial Area, Sector 2, Bangalore, Karnataka
The performance of the Company’s Share related to Nifty (April 2016 to March 2017) is given in chart below:
Ap
r-16
0
50
100
150
200
250
300
350
LIL share price vis-a-vis NSE Nifty
May
-16
Jun
e-16
Jul-
16
Au
g-1
6
Sep
-16
Oct
-16
Nov
-16
Dec
-16
Jan
-17
Feb
-17
Mar
-17
----
----
-- P
rice
s (I
nd
exed
to
100
) --
----
----
----- Months -----
LIL SHARE PRICE NSE S&PCNXNIFTY

68 Lumax Industries Limited
11. UNCLAIMED SUSPENSE ACCOUNT
Pursuant to Regulation 34(3) read with Schedule V of the Listing Regulations, the Company reports the following details in respect of the equity shares lying in the suspense account:
Particulars No. of
Shareholders
No. of Shares
Aggregate number
of shareholders and
outstanding shares at the
beginning of the year i.e. as
on April 1, 2016
661 20537
Number of shareholders
who approached for issue/
transfer of Shares during
the year 2016-17
3 60
Number of shareholders to
whom shares were issued/
transferred
3 60
Aggregate number of
shareholders and the
Outstanding shares lying
at the end of the year i.e.
March 31, 2017
658 20477
The members who have not claimed the shares from the above returned undelivered cases are requested
to contact the Registrar-M/s Karvy Computershare Pvt Ltd at the address given above. The voting rights on the 20,477 shares shall remain frozen till the rightful owner of such shares claims the shares.
12. Non-Mandatory requirements
The Company is complying with mandatory requirements and partly complying with the non-mandatory requirements such as:
• TheChairmanoftheCompanyisNon-Executiveand is entitled to maintain a separate office space at the Company’s expenses.
13. CEO/CFO CERTIFICATE
The Managing Director, Mr. Deepak Jain and the Chief Financial Officer, Mr. Shruti Kant Rustagi have furnished the requisite certificate to the Board of Directors pursuant to Regulation 17(8) of the Listing Regulations.
Nomination Facility
Shareholders holding shares in physical form and desirous of making a nomination in respect of their shareholding in the Company, as permitted under Section 72 of the Companies Act, 2013, read with the Companies (Share Capital and Debentures) Rules, 2015 are requested to submit to the Company nomination in the prescribed Form SH-13 for this purpose.

Annual Report 2016-17 69
Co
rpo
rate Overview
Statu
tory R
epo
rtsFin
ancial S
tatemen
ts
ANNEXURE - G
A. Information pursuant to Section 197 of the Companies Act, 2013 read with Rule 5(1) of Companies (Appointment and Remuneration of Managerial Personnel) Rules, 2014
Name of Directors & Key Managerial Personnel
Designation Ratio of Remuneration to Median remuneration of employees
Mr. Deepak Jain Managing Director 70.61
Mr. Anmol Jain Joint Managing Director 29.48
Mr. Eiichi Hirooka Senior Executive Director 6.77
Mr. Koji Sawada Executive Director 4.19
Mr. Shruti Kant Rustagi Chief Financial Officer 16.66
Mr. Shwetank Tiwari Company Secretary 4.73
Notes:
1. The number of permanent employees as on 31st March, 2017 was 2292.
2. The percentage increase in the median remuneration of employees for the financial year was 32.85%.
3. The average percentage increase made in the salaries of employees excluding Key Managerial Personnel for the financial year was 22.25%. The percentage increase in Remuneration of Key Managerial Personnel was 11.12%.
4. The Percentage increase in remuneration of each director, chief financial officer, company secretary ranges between 0% to 27%. The remuneration components in case of directors includes commission which is linked with the profitability of the Company.
5. The remuneration of the Directors, Key Managerial Personnel and other employees is in accordance with the Remuneration Policy of the Company provided under the section ‘Report on Corporate Governance’, which forms part of the Report and Accounts.

70 Lumax Industries Limited
a. We certify to the Board that we have reviewed Financial Statements and Cash Flow Statement for the year ended March 31, 2017 and that to the best of our knowledge and belief;
(i) these statements do not contain any materially untrue statement or omit any material fact or contain statements that might be misleading;
(ii) these statements together present a true and fair view of the Company’s affairs and are in compliance with existing accounting standards, applicable laws and regulations.
b. There are, to the best of our knowledge and belief, no transactions entered into by the Company during the year which are fraudulent, illegal or violative of the Company’s Code of Conduct.
c. We accept responsibility for establishing and maintaining internal controls for financial reporting and that we have evaluated the effectiveness of the
Certificate of Compliance of Code of Conduct by Board of Directors and Senior Management Personnel
I, Deepak Jain, Managing Director of the Company hereby certify that the Board of Directors and the Senior Management Personnel have affirmed compliance of the Code of Conduct of the Company for the Financial Year 2016 - 2017.
Place: Gurugram (Deepak Jain) Date: May 13, 2017 Managing Director
Place: Gurugram (Shruti Kant Rustagi) (Deepak Jain) Date: May 13, 2017 Chief Financial Officer Managing Director
CEO AND CFO CERTIFICATEunder Regulation 17(8) of the SEBI (Listing Obligations and Disclosure Requirements) Regulations, 2015
internal control systems of the Company pertaining to financial reporting and we have disclosed to the Auditors and the Audit Committee deficiencies in the design or operation of such internal controls, if any, of which we are aware and the steps we have taken or propose to take to rectify these deficiencies, if any.
d. We have indicated to the Auditors and the Audit Committee
(i) significant changes in internal control over financial reporting during the year, if any;
(ii) significant changes in accounting policies during the year and that the same have been disclosed in the notes to the financial statements, if any; and
(iii) There were no instances of fraud of which we have become aware and the involvement therein, if any, of the management or an employee having a significant role in the Company’s internal control system over financial reporting.

Annual Report 2016-17 71
Co
rpo
rate Overview
Statu
tory R
epo
rtsFin
ancial S
tatemen
ts
To
The Members of Lumax Industries Limited
We have examined the compliance of conditions of corporate governance by Lumax Industries Limited for the year ended on March 31, 2017 as stipulated in Chapter IV of Securities and Exchange Board of India (Listing Obligations and Disclosure Requirements) Regulations, 2015 pursuant to the Listing Agreement of the said Company with Stock Exchange(s).
The compliance of conditions of corporate governance is the responsibility of the management. Our examination was limited to procedures and implementation thereof, adopted by the Company for ensuring the compliance of the conditions of the Corporate Governance. It is neither an audit nor an expression of opinion on the financial statements of the Company.
In our opinion and to the best of our information and according to the explanations given to us, We certify that the Company has complied with the conditions of
AUDITORS’ CERTIFICATE
Corporate Governance as stipulated in the provisions as specified in Chapter IV of Securities and Exchange Board of India (Listing Obligations and Disclosure Requirements) Regulations, 2015 pursuant to the Listing Agreement of the said Company with stock exchange(s).
We further state that such compliance is neither an assurance as to the future viability of the Company nor the efficiency or effectiveness with which the management has conducted the affairs of the Company.
For S.R. Batliboi & CO. LLP Chartered AccountantsICAI Firm Registration Number: 301003E/E300005
per Vikas MehraPartnerMembership Number: 94421
Place : New DelhiDate: May 13, 2017

72 Lumax Industries Limited
To the Members of Lumax Industries Limited
Report on the Financial Statements
We have audited the accompanying standalone financial statements of Lumax Industries Limited (“the Company”), which comprises the Balance Sheet as at March 31, 2017, the Statement of Profit and Loss and Cash Flow Statement for the year then ended, and a summary of significant accounting policies and other explanatory information.
Management’s Responsibility for the Financial Statements
The Company’s Board of Directors is responsible for the matters stated in Section 134(5) of the Companies Act, 2013 (“the Act”) with respect to the preparation of these standalone financial statements that give a true and fair view of the financial position, financial performance and cash flows of the Company in accordance with accounting principles generally accepted in India, including the Accounting Standards specified under section 133 of the Act, read with Rule 7 of the Companies (Accounts) Rules, 2014 and the Companies (Accounting Standards) Amendment Rules, 2016. This responsibility also includes maintenance of adequate accounting records in accordance with the provisions of the Act for safeguarding of the assets of the Company and for preventing and detecting frauds and other irregularities; selection and application of appropriate accounting policies; making judgments and estimates that are reasonable and prudent; and the design, implementation and maintenance of adequate internal financial control that were operating effectively for ensuring the accuracy and completeness of the accounting records, relevant to the preparation and presentation of the financial statements that give a true and fair view and are free from material misstatement, whether due to fraud or error.
Auditor’s Responsibility
Our responsibility is to express an opinion on these standalone financial statements based on our audit. We have taken into account the provisions of the Act, the accounting and auditing standards and matters which are required to be included in the audit report under the provisions of the Act and the Rules made thereunder. We conducted our audit in accordance with the Standards on Auditing, issued by the Institute of Chartered Accountants of India, as specified under Section 143(10) of the Act. Those Standards require that we comply with ethical
requirements and plan and perform the audit to obtain reasonable assurance about whether the financial statements are free from material misstatement.
An audit involves performing procedures to obtain audit evidence about the amounts and disclosures in the financial statements. The procedures selected depend on the auditor’s judgment, including the assessment of the risks of material misstatement of the financial statements, whether due to fraud or error. In making those risk assessments, the auditor considers internal financial control relevant to the Company’s preparation of the financial statements that give a true and fair view in order to design audit procedures that are appropriate in the circumstances. An audit also includes evaluating the appropriateness of accounting policies used and the reasonableness of the accounting estimates made by the Company’s Directors, as well as evaluating the overall presentation of the financial statements. We believe that the audit evidence we have obtained is sufficient and appropriate to provide a basis for our audit opinion on the standalone financial statements.
Opinion
In our opinion and to the best of our information and according to the explanations given to us, the standalone financial statements give the information required by the Act in the manner so required and give a true and fair view in conformity with the accounting principles generally accepted in India of the state of affairs of the Company as at March 31, 2017, its profit, and its cash flows for the year ended on that date.
Report on Other Legal and Regulatory Requirements
1. As required by the Companies (Auditor’s report) Order, 2016 (“the Order”) issued by the Central Government of India in terms of sub-section (11) of section 143 of the Act, we give in the Annexure 1 a statement on the matters specified in paragraphs 3 and 4 of the Order.
2. As required by section 143 (3) of the Act, we report that:
(a) We have sought and obtained all the information and explanations which to the best of our knowledge and belief were necessary for the purpose of our audit;
Independent AudItor’s report

Annual Report 2016-17 73
Co
rpo
rate Overview
Statu
tory R
epo
rtsFin
ancial S
tatemen
ts
(b) In our opinion proper books of account as required by law have been kept by the Company so far as it appears from our examination of those books;
(c) The Balance Sheet, Statement of Profit and Loss, and Cash Flow Statement dealt with by this Report are in agreement with the books of account;
(d) In our opinion, the aforesaid standalone financial statements comply with the Accounting Standards specified under section 133 of the Act, read with Rule 7 of the Companies (Accounts) Rules, 2014 and the Companies (Accounting Standards) Amendment Rules, 2016;
(e) On the basis of written representations received from the directors as on March 31, 2017, and taken on record by the Board of Directors, none of the directors is disqualified as on March 31, 2017, from being appointed as a director in terms of section 164 (2) of the Act;
(f) With respect to the adequacy of the internal financial controls over financial reporting of the Company and the operating effectiveness of such controls, refer to our separate Report in “Annexure 2” to this report;
(g) With respect to the other matters to be included in the Auditor’s Report in accordance with Rule 11 of the Companies (Audit and Auditors) Rules, 2014, in our opinion and to the best of our information and according to the explanations given to us:
i. The Company has disclosed the impact of pending litigations on its financial position in its financial statements – Refer Note 34 to the financial statements;
ii. The Company has made provision, as required under the applicable law or accounting standards, for material foreseeable losses, if any, on long-term contracts including derivative contract;
iii. There has been no delay in transferring amounts, required to be transferred, to the Investor Education and Protection Fund by the Company.
iv. The Company has provided requisite disclosures in Note 35 to these standalone financial statements as to the holding of Specified Bank Notes on November 8, 2016 and December 30, 2016 as well as dealings in Specified Bank Notes during the period from November 8, 2016 to December 30, 2016. Based on our audit procedures and relying on the management representation regarding the holding and nature of cash transactions, including Specified Bank Notes, we report that these disclosures are in accordance with the books of accounts maintained by the Company and as produced to us by the Management.
For S.R. Batliboi & CO. LLP Chartered AccountantsICAI Firm Registration Number: 301003E/E300005
per Vikas MehraPartnerMembership Number: 94421
Place of Signature: New DelhiDate: May 13, 2017

74 Lumax Industries Limited
(i) (a) The company has maintained proper records showing full particulars, including quantitative details and situation of fixed assets.
(b) Fixed assets have been physically verified by the management during the year and no material discrepancies were identified on such verification.
(c) According to the information and explanations given by the management, the title deeds of immovable properties included in property, plant and equipment/ fixed assets are held in the name of the company.
(ii) The inventory has been physically verified by the management during the year. In our opinion, the frequency of verification is reasonable. No material discrepancies were noticed on such physical verification. Inventories lying with third parties have been confirmed by them as at year end and no material discrepancies were noticed in respect of such confirmations.
(iii) According to the information and explanations given to us, the Company has not granted any loans, secured or unsecured to companies, firms, Limited Liability Partnerships or other parties covered in the register maintained under section 189 of the Companies Act, 2013. Accordingly, the provisions of clause 3(iii)(a), (b) and (c) of the Order are not applicable to the Company and hence not commented upon.
(iv) In our opinion and according to the information and explanations given to us, there are no loans, investments, guarantees, and securities granted in respect of which provisions of section 185 and 186 of
Annexure referred to In pArAgrAph 1 under the heAdIng “report on other legAl And regulAtory requIrements” of our report. (Annexure 1)Re: Lumax Industries Limited (‘the Company’)
the Companies Act 2013 are applicable and hence not commented upon.
(v) The Company has not accepted any deposits within the meaning of Sections 73 to 76 of the Act and the Companies (Acceptance of Deposits) Rules, 2014 (as amended). Accordingly, the provisions of clause 3(v) of the Order are not applicable.
(vi) We have broadly reviewed the books of account maintained by the Company pursuant to the rules made by the Central Government for the maintenance of cost records under section 148(1) of the Companies Act, 2013, related to the manufacture of auto components (electricals or electronic machinery), and are of the opinion that prima facie, the specified accounts and records have been made and maintained. We have not, however, made a detailed examination of the same.
(vii) (a) The Undisputed statutory dues including provident fund, employees’ state insurance, income-tax, sales-tax, service tax, duty of custom, duty of excise, value added tax, cess and other statutory dues have generally been regularly deposited with the appropriate authorities though there has been a slight delay in a few cases.
(b) According to the information and explanations given to us, no undisputed amounts payable in respect of provident fund, employees’ state insurance, income-tax, service tax, sales-tax, duty of custom, duty of excise, value added tax, cess and other material statutory dues were outstanding, at the year end, for a period of more than six months from the date they became payable.
(c) According to the records of the Company, the dues outstanding of income-tax, sales-tax, service tax, duty of custom, duty of excise, value added tax and cess on account of any dispute, are as follows:
Name of the statute Nature of dues Amount (`) Period to which the amount relates
Forum where dispute is pending
Service Tax, FinanceAct, 1994
Demand for disallowance of Cenvat credit in respect of service tax paid on certain services i.e. catering and CHA (export).
927,306 2010-11 and 2012-13 Deputy Commissioner Central excise
Service Tax, FinanceAct, 1994
Demand for disallowance of Cenvat credit against outward transportation.
15,48,280 2011- 2015 Commissioner (Appeals) and Deputy Commissioner (Appeals) of Central Excise Pune
The Central Sales TaxAct, 1956
Demand against non- submission of C Forms and H Forms
92,49,222 From 1997-98 to 2011-12
Joint Sales Tax Commissioner and Sales Tax Appellate Tribunal

Annual Report 2016-17 75
Co
rpo
rate Overview
Statu
tory R
epo
rtsFin
ancial S
tatemen
ts
(viii) In our opinion and according to the information and explanations given by the management, the Company has not defaulted in repayment of dues to a financial institution or bank or debentures or any other government dues during the year.
(ix) According to the information and explanations given by the management, the Company has not raised any money way of initial public offer / further public offer / debt instruments and term loans hence, reporting under clause (ix) is not applicable to the Company and hence not commented upon.
(x) Based upon the audit procedures performed for the purpose of reporting the true and fair view of the financial statements and according to the information and explanations given by the management, we report that no fraud by the company or no fraud / material fraud on the company by the officers and employees of the Company has been noticed or reported during the year.
(xi) According to the information and explanations given by the management, the managerial remuneration has been paid / provided in accordance with the requisite approvals mandated by the provisions of section 197 read with Schedule V to the Companies Act, 2013.
(xii) In our opinion, the Company is not a Nidhi company. Therefore, the provisions of clause 3(xii) of the order are not applicable to the Company and hence not commented upon.
(xiii) According to the information and explanations given by the management, transactions with the related parties are in compliance with section 177 and
188 of Companies Act, 2013 where applicable and the details have been disclosed in the notes to the financial statements, as required by the applicable accounting standards.
(xiv) According to the information and explanations given to us and on an overall examination of the balance sheet, the company has not made any preferential allotment or private placement of shares or fully or partly convertible debentures during the year under review and hence, reporting requirements under clause 3(xiv) are not applicable to the company and, not commented upon.
(xv) According to the information and explanations given by the management, the Company has not entered into any non-cash transactions with directors or persons connected with him as referred to in section 192 of Companies Act, 2013.
(xvi) According to the information and explanations given to us, the provisions of section 45-IA of the Reserve Bank of India Act, 1934 are not applicable to the Company.
For S.R. Batliboi & CO. LLP Chartered AccountantsICAI Firm Registration Number: 301003E/E300005
per Vikas MehraPartnerMembership Number: 94421
Place of Signature: New DelhiDate: May 13, 2017

76 Lumax Industries Limited
To the Members of Lumax Industries Limited
We have audited the internal financial controls over financial reporting of Lumax Industries Limited (“the Company”) as of March 31, 2017 in conjunction with our audit of the standalone financial statements of the Company for the year ended on that date.
Management’s Responsibility for Internal Financial Controls
The Company’s Management is responsible for establishing and maintaining internal financial controls based on the internal control over financial reporting criteria established by the Company considering the essential components of internal control stated in the Guidance Note on Audit of Internal Financial Controls over Financial Reporting issued by the Institute of Chartered Accountants of India. These responsibilities include the design, implementation and maintenance of adequate internal financial controls that were operating effectively for ensuring the orderly and efficient conduct of its business, including adherence to the Company’s policies, the safeguarding of its assets, the prevention and detection of frauds and errors, the accuracy and completeness of the accounting records, and the timely preparation of reliable financial information, as required under the Companies Act, 2013.
Auditor’s Responsibility
Our responsibility is to express an opinion on the Company’s internal financial controls over financial reporting based on our audit. We conducted our audit in accordance with the Guidance Note on Audit of Internal Financial Controls Over Financial Reporting (the “Guidance Note”) and the Standards on Auditing as specified under section 143(10) of the Companies Act, 2013, to the extent applicable to an audit of internal financial controls, both applicable to an audit of Internal Financial Controls and, both issued by the Institute of Chartered Accountants of India. Those Standards and the Guidance Note require that we comply with ethical requirements and plan and perform the audit to obtain reasonable assurance about whether adequate internal financial controls over financial reporting was established and maintained and if such controls operated effectively in all material respects.
Our audit involves performing procedures to obtain audit evidence about the adequacy of the internal financial controls system over financial reporting and their operating effectiveness. Our audit of internal financial controls over financial reporting included obtaining an understanding of internal financial controls over financial reporting, assessing the risk that a material weakness exists, and testing and evaluating the design and operating effectiveness of internal control based on the assessed risk. The procedures selected depend on the auditor’s judgement, including the assessment of the risks of material misstatement of the financial statements, whether due to fraud or error.
We believe that the audit evidence we have obtained is sufficient and appropriate to provide a basis for our audit opinion on the internal financial controls system over financial reporting.
Meaning of Internal Financial Controls over Financial Reporting
A company’s internal financial control over financial reporting is a process designed to provide reasonable assurance regarding the reliability of financial reporting and the preparation of financial statements for external purposes in accordance with generally accepted accounting principles. A company’s internal financial control over financial reporting includes those policies and procedures that (1) pertain to the maintenance of records that, in reasonable detail, accurately and fairly reflect the transactions and dispositions of the assets of the company; (2) provide reasonable assurance that transactions are recorded as necessary to permit preparation of financial statements in accordance with generally accepted accounting principles, and that receipts and expenditures of the company are being made only in accordance with authorisations of management and directors of the company; and (3) provide reasonable assurance regarding prevention or timely detection of unauthorised acquisition, use, or disposition of the company’s assets that could have a material effect on the financial statements.
Inherent Limitations of Internal Financial Controls over Financial Reporting
Because of the inherent limitations of internal financial controls over financial reporting, including the possibility
Annexure -2 to the Independent AudItor’s report of even dAte on the stAndAlone fInAncIAl stAtements of lumAx IndustrIes lImItedReport on the Internal Financial Controls under Clause (i) of Sub-section 3 of Section 143 of the Companies Act, 2013 (“the Act”)

Annual Report 2016-17 77
Co
rpo
rate Overview
Statu
tory R
epo
rtsFin
ancial S
tatemen
ts
of collusion or improper management override of controls, material misstatements due to error or fraud may occur and not be detected. Also, projections of any evaluation of the internal financial controls over financial reporting to future periods are subject to the risk that the internal financial control over financial reporting may become inadequate because of changes in conditions, or that the degree of compliance with the policies or procedures may deteriorate.
Opinion
In our opinion, the Company has, in all material respects, an adequate internal financial controls system over financial reporting and such internal financial controls over financial reporting were operating effectively as at March 31, 2017, based on the internal control over financial
reporting criteria established by the Company considering the essential components of internal control stated in the Guidance Note on Audit of Internal Financial Controls Over Financial Reporting issued by the Institute of Chartered Accountants of India.
For S.R. Batliboi & CO. LLP Chartered AccountantsICAI Firm Registration Number: 301003E/E300005
per Vikas MehraPartnerMembership Number: 94421
Place of Signature: New DelhiDate: May 13, 2017

78 Lumax Industries Limited
BAlAnce sheet as at March 31, 2017
Amount in `Particulars Notes As at
March 31, 2017As at
March 31, 2016I EQUItY & LIABILItIES Shareholders’ funds (a) Share capital 3 93,477,320 93,477,320 (b) Reserves and surplus 4 2,323,071,847 1,948,304,949
2,416,549,167 2,041,782,269 Non-Current Liabilities (a) Long term borrowings 5 36,376,956 105,728,944 (b) Deferred tax liabilities (net) 6 279,439,857 194,418,367 (c) Other long term liabilities 7 217,424,739 223,712,544 (d) Long term provisions 8 114,598,344 92,716,007
647,839,896 616,575,862 Current Liabilities (a) Short term borrowings 9 790,221,122 848,253,641 (b) Trade payables 10 - Total outstanding due of micro enterprises and small enterprises 1,480,603 722,444 - Total outstanding due of creditors other than micro enterprises
and small enterprises 3,441,231,922 3,096,045,229
(c) Other current liabilities 11 1,045,901,865 1,284,420,745 (d) Short term provisions 8 69,277,569 55,912,545
5,348,113,081 5,285,354,604 tOtAL 8,412,502,144 7,943,712,735 II ASSEtS Non-Current Assets (a) Fixed assets Property, Plant & Equipment 12 3,840,814,451 4,054,223,293 Intangible assets 13 33,302,237 25,673,979 Capital work in progress 524,819,185 170,377,539 (b) Non-Current Investments 14 45,074,204 45,074,204 (c) Loans and advances 15 478,305,796 313,950,910 (d) Other Non-Current assets 16.2 18,077,240 12,148,876
4,940,393,113 4,621,448,801 Current Assets (a) Current investments 17 987,000 987,000 (b) Inventories 18 1,160,454,455 1,045,501,751 (c) Trade receivables 16.1 1,909,421,724 1,811,903,475 (d) Cash and bank balances 19 13,695,090 34,552,286 (e) Loans and advances 15 372,602,325 358,338,177 (f) Other current assets 16.2 14,948,437 70,981,245
3,472,109,031 3,322,263,934
tOtAL 8,412,502,144 7,943,712,735 Summary of significant accounting policies 2.1The accompanying notes are an integral part of the financial statements.
As per our report of even date
For S. R. BAtLIBOI & CO. LLP For and on behalf of the Board of Directors of Lumax Industries LimitedChartered AccountantsICAI firm registration number: 301003E/E300005
per Vikas Mehra D. K. Jain Deepak JainPartner Chairman Managing DirectorMembership No. 94421 DIN: 00085848 DIN: 00004972
Place : Gurugram Shruti Kant Rustagi Shwetank tiwariDate : May 13, 2017 Chief Financial Officer Company Secretary
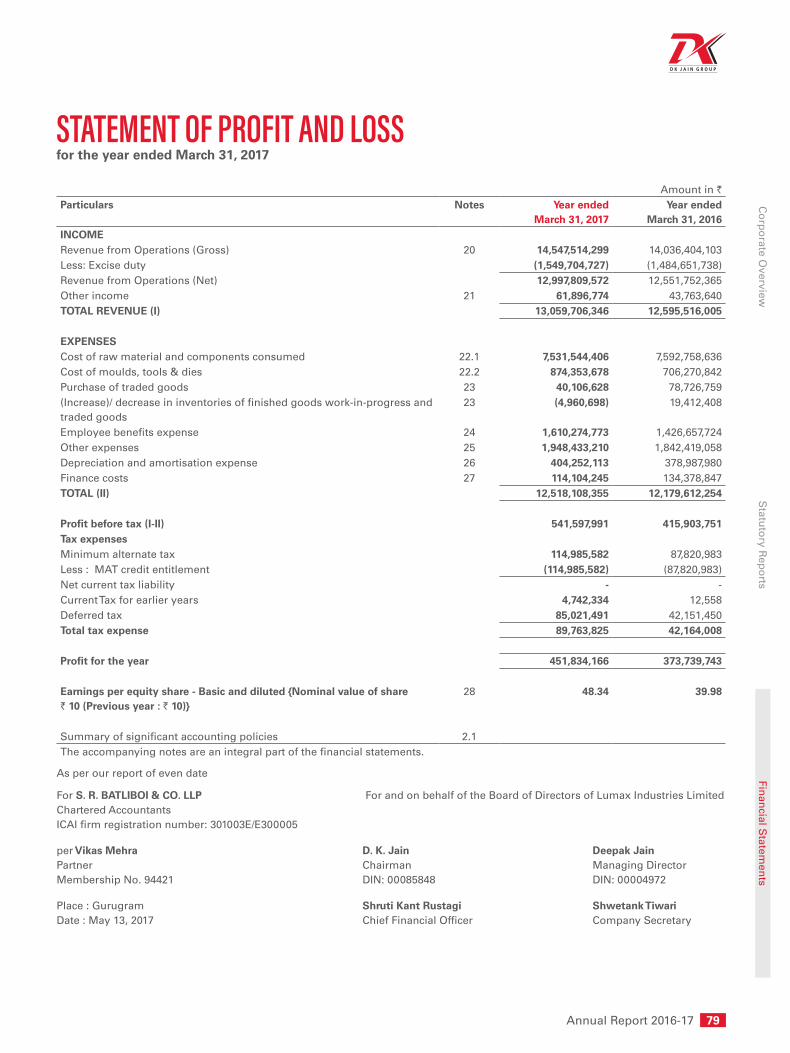
Annual Report 2016-17 79
Co
rpo
rate Overview
Statu
tory R
epo
rtsFin
ancial S
tatemen
ts
stAtement of profIt And lossfor the year ended March 31, 2017
As per our report of even date
For S. R. BAtLIBOI & CO. LLP For and on behalf of the Board of Directors of Lumax Industries LimitedChartered AccountantsICAI firm registration number: 301003E/E300005
per Vikas Mehra D. K. Jain Deepak JainPartner Chairman Managing DirectorMembership No. 94421 DIN: 00085848 DIN: 00004972
Place : Gurugram Shruti Kant Rustagi Shwetank tiwariDate : May 13, 2017 Chief Financial Officer Company Secretary
Amount in `Particulars Notes Year ended
March 31, 2017Year ended
March 31, 2016INCOMERevenue from Operations (Gross) 20 14,547,514,299 14,036,404,103 Less: Excise duty (1,549,704,727) (1,484,651,738)Revenue from Operations (Net) 12,997,809,572 12,551,752,365 Other income 21 61,896,774 43,763,640 tOtAL REVENUE (I) 13,059,706,346 12,595,516,005
EXPENSESCost of raw material and components consumed 22.1 7,531,544,406 7,592,758,636 Cost of moulds, tools & dies 22.2 874,353,678 706,270,842 Purchase of traded goods 23 40,106,628 78,726,759 (Increase)/ decrease in inventories of finished goods work-in-progress and traded goods
23 (4,960,698) 19,412,408
Employee benefits expense 24 1,610,274,773 1,426,657,724 Other expenses 25 1,948,433,210 1,842,419,058 Depreciation and amortisation expense 26 404,252,113 378,987,980 Finance costs 27 114,104,245 134,378,847 tOtAL (II) 12,518,108,355 12,179,612,254
Profit before tax (I-II) 541,597,991 415,903,751 tax expensesMinimum alternate tax 114,985,582 87,820,983 Less : MAT credit entitlement (114,985,582) (87,820,983)Net current tax liability - - Current Tax for earlier years 4,742,334 12,558 Deferred tax 85,021,491 42,151,450 total tax expense 89,763,825 42,164,008
Profit for the year 451,834,166 373,739,743
Earnings per equity share - Basic and diluted {Nominal value of share ` 10 (Previous year : ` 10)}
28 48.34 39.98
Summary of significant accounting policies 2.1The accompanying notes are an integral part of the financial statements.
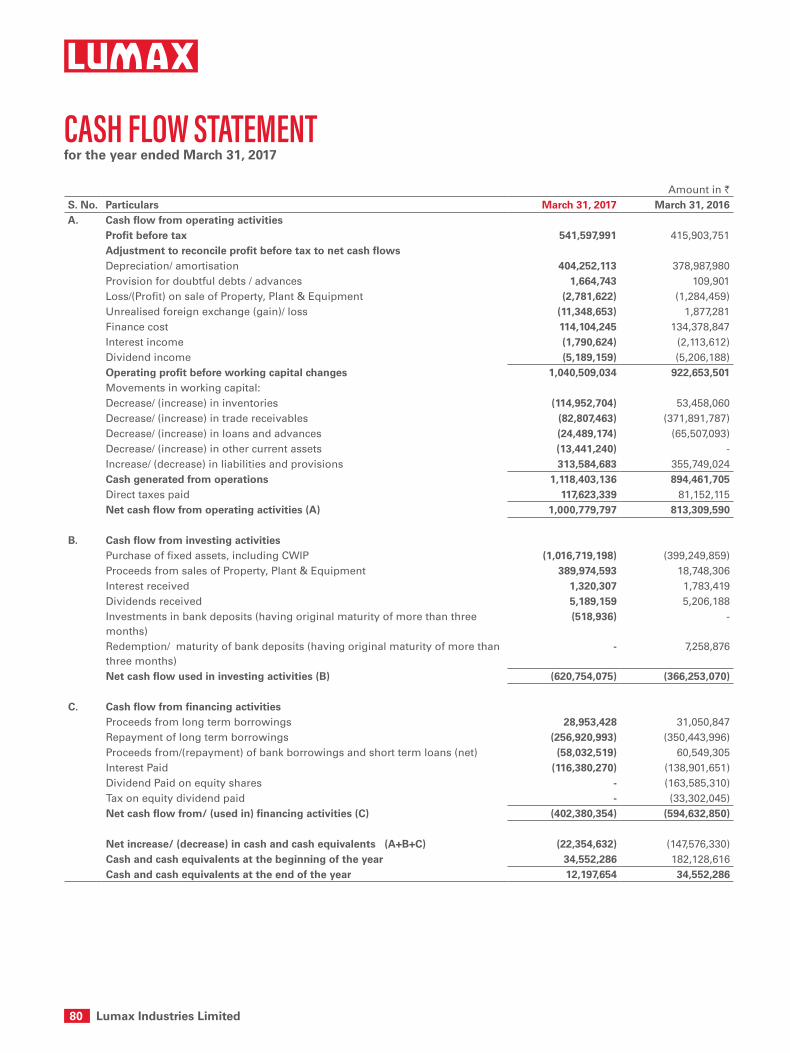
80 Lumax Industries Limited
Amount in `S. No. Particulars March 31, 2017 March 31, 2016A. Cash flow from operating activities
Profit before tax 541,597,991 415,903,751 Adjustment to reconcile profit before tax to net cash flowsDepreciation/ amortisation 404,252,113 378,987,980 Provision for doubtful debts / advances 1,664,743 109,901 Loss/(Profit) on sale of Property, Plant & Equipment (2,781,622) (1,284,459)Unrealised foreign exchange (gain)/ loss (11,348,653) 1,877,281 Finance cost 114,104,245 134,378,847 Interest income (1,790,624) (2,113,612)Dividend income (5,189,159) (5,206,188)Operating profit before working capital changes 1,040,509,034 922,653,501 Movements in working capital:Decrease/ (increase) in inventories (114,952,704) 53,458,060 Decrease/ (increase) in trade receivables (82,807,463) (371,891,787)Decrease/ (increase) in loans and advances (24,489,174) (65,507,093)Decrease/ (increase) in other current assets (13,441,240) - Increase/ (decrease) in liabilities and provisions 313,584,683 355,749,024 Cash generated from operations 1,118,403,136 894,461,705 Direct taxes paid 117,623,339 81,152,115 Net cash flow from operating activities (A) 1,000,779,797 813,309,590
B. Cash flow from investing activitiesPurchase of fixed assets, including CWIP (1,016,719,198) (399,249,859)Proceeds from sales of Property, Plant & Equipment 389,974,593 18,748,306 Interest received 1,320,307 1,783,419 Dividends received 5,189,159 5,206,188 Investments in bank deposits (having original maturity of more than three months)
(518,936) -
Redemption/ maturity of bank deposits (having original maturity of more than three months)
- 7,258,876
Net cash flow used in investing activities (B) (620,754,075) (366,253,070)
C. Cash flow from financing activitiesProceeds from long term borrowings 28,953,428 31,050,847 Repayment of long term borrowings (256,920,993) (350,443,996) Proceeds from/(repayment) of bank borrowings and short term loans (net) (58,032,519) 60,549,305 Interest Paid (116,380,270) (138,901,651)Dividend Paid on equity shares - (163,585,310)Tax on equity dividend paid - (33,302,045)Net cash flow from/ (used in) financing activities (C) (402,380,354) (594,632,850)
Net increase/ (decrease) in cash and cash equivalents (A+B+C) (22,354,632) (147,576,330)Cash and cash equivalents at the beginning of the year 34,552,286 182,128,616 Cash and cash equivalents at the end of the year 12,197,654 34,552,286
cAsh flow stAtementfor the year ended March 31, 2017

Annual Report 2016-17 81
Co
rpo
rate Overview
Statu
tory R
epo
rtsFin
ancial S
tatemen
ts
As per our report of even date
For S. R. BAtLIBOI & CO. LLP For and on behalf of the Board of Directors of Lumax Industries LimitedChartered AccountantsICAI firm registration number: 301003E/E300005
per Vikas Mehra D. K. Jain Deepak JainPartner Chairman Managing DirectorMembership No. 94421 DIN: 00085848 DIN: 00004972
Place : Gurugram Shruti Kant Rustagi Shwetank tiwariDate : May 13, 2017 Chief Financial Officer Company Secretary
Amount in `S. No. Particulars March 31, 2017 March 31, 2016
Components of cash and cash equivalentsCash on hand 1,727,866 2,764,506 Cheques on Hand 342,358 5,026,725 Balances with banks: On current accounts 4,636,144 19,014,978 On unpaid dividend accounts* 5,491,286 7,746,077 total cash and cash equivalents (note 19) 12,197,654 34,552,286
* The Company can utilize these balances only toward settlement of the respective unpaid dividend.

82 Lumax Industries Limited
1. CORPORAtE INFORMAtION
Lumax Industries Limited (‘the Company’) is a leading manufacturer and supplier of auto components, mainly automotive lighting systems for four wheeler and two wheeler applications. The Company has technical as well as financial collaboration with Stanley Electric Co. Ltd., Japan. Its shares are listed on two exchanges in India.
2. BASIS OF PREPARAtION
The financial statements of the Company have been prepared and presented in accordance with generally accepted accounting principles in India (Indian GAAP). The Company has prepared these financial statements to comply with all material respects with the accounting standards specified under section 133 of the Companies Act, 2013, read together with paragraph 7 of the Companies (Accounts) Rules, 2014 and Companies (Accounting Standards) Amendment Rules, 2016. The financial statements have been prepared on an accrual basis and under the historical cost convention.
The accounting policies adopted in the preparation of financial statements are consistent with those of previous year, except for the change in accounting policy explained below.
2.1 Summary of significant accounting policies
Change in Accounting Policies
1. Classification of items of stores and spares
Pre-revised AS 10 required that stand-by and servicing equipment should normally be capitalized as property, plant and equipment. It required that machinery spares are usually treated as inventory and charged to profit or loss on consumption. However, spares parts that can be only used in connection with a particular item of property, plant and equipment, and whose use is expected to be irregular, are capitalized. Such spare parts are depreciated over a period, not exceeding the remaining useful life of the principal asset.
According to revised AS 10, all spare parts, stand-by and servicing equipment qualify as property, plant and equipment (PPE) if they meet the definition of PPE i.e. if the company intends to use these during more than a period
of 12 months, the spare parts capitalized in this manner are depreciated as per revised AS 10.
The company has changed its accounting policy of property, plant and equipment to comply with changes in AS 10. The company has applied transitional provisions that requires previously recognized stores and spares as inventory be capitalized as PPE at its carrying amount and be depreciated prospectively over its remaining useful life.
Spare Parts having useful life for more than one year are capitalised w.e.f. 01.04.2016.
Had the company continued to use the earlier policy of classifying stores and spares as inventories, its financial statements for the period would have been impacted as below:
Inventories would have been higher by ` 9,521,290, property, plant and equipment would have been lower by ` 9,521,290 (gross), depreciation would have been lower by ` 1,329,029. Profit before tax for the current period would have been higher by ` 1,329,029.
2. Accounting of Proposed Dividend
As per the requirements of pre-revised AS 4, the Company used to create a liability for dividend proposed/ declared after the balance sheet date for dividend related to periods covered by the financial statements. Going forward, as per revised AS 4, the company cannot create provision for dividend proposed / declared after the balance sheet date unless a statute requires otherwise. However, the company need to disclose the same in notes to the financial statements.
Accordingly, the company has disclosed dividend proposed by board of directors after the balance sheet date in the notes.
Had the company continued with creation of provision for proposed dividend, its surplus in the statement of profit and loss account would have been lower by ` 163,135,299 and current provision would have been higher by ` 163,135,299 (including dividend distribution tax of ` 27,593,185).
notes to fInAncIAl stAtements for the year ended March 31, 2017
Annual Report 2016-17 83
Co
rpo
rate Overview
Statu
tory R
epo
rtsFin
ancial S
tatemen
ts
notes to fInAncIAl stAtements for the year ended March 31, 2017
3. Accounting for assets earlier carried at revalued amount
The Company had revalued Land, Building and Plant & Machinery and was carried at revalued amount under the pre-revised AS 10. Under the revised AS 10, the Company has applied cost model on all the items of property, plant and equipment. As per the transitional provision under revised AS 10, where a Company does not adopt the revaluation model as its accounting policy but the carrying amount of item(s) of PPE reflects any previous revaluation, the Company should adjust the amount outstanding in the revaluation reserve against the carrying amount of that item. However, the carrying amount of that item should not be less than residual value. Any excess of the amount outstanding as revaluation reserve over the carrying amount of that item should be adjusted in revenue reserves. Accordingly, the Company has adjusted the balance of revaluation reserve against land and building, resulting in reduction in land and building and revaluation reserve by ` 77,067,268.
a. Use of estimates
The preparation of financial statements are in conformity with Indian GAAP which requires the management to make judgments, estimates and assumptions that affect the reported amounts of assets, liabilities, revenue and expenses and the disclosure of contingent liabilities, at the end of the reporting period. Although these estimates are based on the management’s best knowledge of current events and actions, uncertainty about these assumptions and estimates could result in the outcomes requiring a material adjustment to the carrying amounts of assets, liabilities, revenue and expenses in future periods. Changes in estimates are reflected in the financial statements in the period in which changes are made and if material, their effects are disclosed in notes to accounts.
b. Property, Plant and Equipment
Property, plant and equipment are stated at cost, net of accumulated depreciation and accumulated impairment losses, if any. The
cost comprises purchase price, borrowing costs if capitalization criteria are met and directly attributable cost of bringing the asset to its working condition for the intended use. Any trade discounts and rebates are deducted in arriving at the purchase price. Such cost includes the cost of replacing part of the plant and equipment. When significant parts of plant and equipment are required to be replaced at intervals, the Company depreciates them separately based on their specific useful lives. Likewise, when a major inspection is performed, its cost is recognised in the carrying amount of the plant and equipment as a replacement if the recognition criteria are satisfied. All other repair and maintenance costs are recognised in profit or loss as incurred.
Items of stores and spares that meet the definition of property, plant and equipment are capitalized at cost and depreciated over their useful life. Otherwise, such items are classified as inventories.
Gains or losses arising from derecognition of property, plant and equipment are measured as the difference between the net disposal proceeds and the carrying amount of the asset and are recognized in the statement of profit and loss when the asset is derecognized.
If a component / part of an asset has a cost which is significant to the total cost of asset and has a useful life that is materially different from that of the remaining component/part of the asset, the Company identifies and determines cost of such component/part of the asset separately.
Property, plant and equipment held for sale is valued at lower of their carrying amount and net realizable value. Any write-down is recognized in the statement of profit and loss.
c. Depreciation on Property, plant and Equipment
Leasehold land is amortized over the period of lease ranging from 90 years to 99 years.
84 Lumax Industries Limited
Depreciation on other property, plant and equipment is calculated on a straight line basis using rates arrived at based on the useful lives estimated by the management. The identified components are depreciated separately over their useful lives; the remaining components are depreciated over the life of the principal asset.. The Company has used following estimated useful life to provide depreciation on its property, plant and equipment:
Particulars Useful lives estimated by the
management (years)
Factory building 30
Other building 60
Plant and Machinery (i, ii)
3-21
Spare Parts 3-15
Furniture and fixtures 10
Vehicles (ii) 5
Office equipment 5
i) The management has estimated supported by independent assessment, the useful life of certain plant and machinery as 21 years, which is higher than those indicated in schedule II of the Companies Act 2013.
ii) The management has estimated, based on past experience, the useful life of these blocks of assets as lower than the life indicated for respective block of assets in schedule II of the Companies Act 2013.
The residual values, useful lives and methods of depreciation of property, plant and equipment are reviewed at each financial year end and adjusted prospectively, if appropriate.
d. Intangible Assets
Intangible assets acquired separately are measured on initial recognition at cost.
Following initial recognition, intangible assets are carried at cost less accumulated amortization and accumulated impairment losses, if any. Internally generated intangible assets, excluding capitalized development costs, are not capitalized and expenditure is reflected in the statement of profit and loss in the year in which the expenditure is incurred.
Intangibles assets are amortized using straight-line method over their estimated useful lives as follows:
Intangible Assets
Estimated Useful Life (Years)
Computer Software
Over the estimated economic useful lives ranging from 3.5 to 4 years
Technical Know-how
Over the period of Technical Assistance Agreement i.e. 8 years
The amortization period and the amortization method are reviewed at least at each financial year end. If the expected useful life of the asset is significantly different from previous estimates, the amortization period is changed accordingly. If there has been a significant change in the expected pattern of economic benefits from the asset, the amortization method is changed to reflect the changed pattern. Such changes are accounted for in accordance with AS 5 Net Profit or Loss for the Period, Prior Period Items and Changes in Accounting Policies.
Gains or losses arising from de-recognition of an intangible asset are measured as the difference between the net disposal proceeds and the carrying amount of the asset and are recognized in the statement of profit and loss when the asset is derecognized.
e. Research costs
Research costs are expensed as incurred.
notes to fInAncIAl stAtements for the year ended March 31, 2017

Annual Report 2016-17 85
Co
rpo
rate Overview
Statu
tory R
epo
rtsFin
ancial S
tatemen
ts
f. Leases
Where the Company is the lessee
Finance leases, which effectively transfer to the Company substantially all the risks and benefits incidental to ownership of the leased item, are capitalized at the lower of the fair value of leased property and present value of the minimum lease payments at the inception of the lease term and disclosed as leased assets.
Lease payments are apportioned between the finance charges and reduction of the lease liability so as to achieve a constant rate of interest on the remaining balance of the liability. Finance charges are recognized as finance costs in the statement of profit and loss. Lease management fees, legal charges and other initial direct costs are capitalised.
A leased asset is depreciated on a straight-line basis over the useful life of the asset. However, if there is no reasonable certainty that the Company will obtain the ownership by the end of the lease term, the capitalized asset is depreciated on a straight-line basis over the shorter of the estimated useful life of the asset or the lease term.
Leases, where the lessor effectively retains substantially all the risks and benefits of ownership of the leased item are classified as operating leases. Operating lease payments are recognized as an expense in the statement of profit and loss on a straight-line basis over the lease term.
Where the Company is the lessor
Leases in which the Company transfers substantially all the risks and benefits of ownership of the asset are classified as finance leases. Assets given under finance lease are recognized as a receivable at an amount equal to the net investment in the lease. After initial recognition, the Company apportions lease rentals between the principal repayment and interest income
so as to achieve a constant periodic rate of return on the net investment outstanding in respect of the finance lease. The interest income is recognized in the statement of profit and loss. Initial direct costs such as legal costs, brokerage costs, etc. are recognized immediately in the statement of profit and loss.
Leases in which the Company does not transfer substantially all the risks and benefits of ownership of the asset are classified as operating leases. Assets subject to operating leases are included in property, plant and equipment. Lease income on an operating lease is recognized in the statement of profit and loss on a straight-line basis over the lease term. Costs, including depreciation, are recognized as an expense in the statement of profit and loss. Initial direct costs such as legal costs, brokerage costs, etc. are recognized immediately in the statement of profit and loss.
g. Borrowing costs
Borrowing cost includes interest, amortization of ancillary costs incurred in connection with the arrangement of borrowings.
Borrowing costs directly attributable to the acquisition, construction or production of an asset that necessarily takes a substantial period of time to get ready for its intended use or sale are capitalized as part of the cost of the respective asset. All other borrowing costs are expensed in the period they occur.
h. Government Grant and subsidies
Grants and subsidies from the government are recognized when there is reasonable assurance that (i) the Company will comply with the conditions attached to them, and (ii) the grant/subsidy will be received.
When the grant or subsidy relates to revenue, it is recognized as income on a systematic basis in the statement of profit and loss over the periods necessary to
notes to fInAncIAl stAtements for the year ended March 31, 2017

86 Lumax Industries Limited
match them with the related costs, which they are intended to compensate. Where the grant relates to an asset, the grant is shown as a deduction from the gross value of the asset concerned in arriving at its book value. The grant is thus recognised in the statement of profit and loss over the useful life of a depreciable asset by way of a reduced depreciation charge.
i. Impairment of property, plant and equipment
The Company assesses at each reporting date whether there is an indication that an asset may be impaired. If any indication exists, or when annual impairment testing for an asset is required, the Company estimates the asset’s recoverable amount. An asset’s recoverable amount is the higher of an asset’s or cash-generating unit’s (CGU) net selling price and its value in use. The recoverable amount is determined for an individual asset, unless the asset does not generate cash inflows that are largely independent of those from other assets or groups of assets. Where the carrying amount of an asset or CGU exceeds its recoverable amount, the asset is considered impaired and is written down to its recoverable amount.
Impairment losses of continuing operations, including impairment on inventories, are recognized in the statement of profit and loss, except for previously revalued property, plant and equipment, where the revaluation was taken to revaluation reserve. In this case, the impairment is also recognized in the revaluation reserve up to the amount of any previous revaluation.
After impairment, depreciation is provided on the revised carrying amount of the asset over its remaining useful life.
An assessment is made at each reporting date as to whether there is any indication that previously recognized impairment losses may no longer exist or may have decreased. If such indication exists, the
company estimates the asset’s or cash-generating unit’s recoverable amount. A previously recognized impairment loss is reversed only if there has been a change in the assumptions used to determine the asset’s recoverable amount since the last impairment loss was recognized. The reversal is limited so that the carrying amount of the asset does not exceed its recoverable amount, nor exceed the carrying amount that would have been determined, net of depreciation, had no impairment loss been recognized for the asset in prior years. Such reversal is recognized in the statement of profit and loss unless the asset is carried at a revalued amount, in which case the reversal is treated as a revaluation increase.
j. Investments
Investments, which are readily realizable and intended to be held for not more than one year from the date on which such investments are made, are classified as current investments. All other investments are classified as long-term investments.
On initial recognition, all investments are measured at cost. The cost comprises purchase price and directly attributable acquisition charges such as brokerage, fees and duties. If an investment is acquired, or partly acquired, by the issue of shares or other securities, the acquisition cost is the fair value of the securities issued.
Current investments are carried in the financial statements at lower of cost and fair value determined on an individual investment basis. Long-term investments are carried at cost. However, provision for diminution in value is made to recognize a decline other than temporary in the value of the investments.
On disposal of an investment, the difference between its carrying amount and net disposal proceeds is charged or credited to the statement of profit and loss.
notes to fInAncIAl stAtements for the year ended March 31, 2017

Annual Report 2016-17 87
Co
rpo
rate Overview
Statu
tory R
epo
rtsFin
ancial S
tatemen
ts
k. Inventories
Inventories are valued as follows:
Raw materials and components, Stores and spares (including packing materials)
At Cost and Net Realizable Value, whichever is lower. However, materials and other items held for use in the production of inventories are not written down below cost if the finished products in which they will be incorporated are expected to be sold at or above cost.
Cost is determined on moving weighted average basis. Cost of raw materials and components lying in bonded warehouse includes custom duty accounted for on accrual basis.
Stores and spares which do not meet the definition of property, plant and equipment are accounted as inventories.
Finished goods & Traded goods, Work-in-progress and Moulds, tools and dies in process
At Cost and Net Realizable Value, whichever is lower. Cost of Finished goods and Work-in-progress (including moulds, tools and dies in process) includes direct materials, labour and a proportion of manufacturing overheads based on normal operating capacity. Cost of traded goods includes cost of purchase and other costs incurred in bringing the inventories to their present location and condition. Cost is determined on moving weighted average basis. Cost of finished goods includes excise duty.
Scrap At net realizable value.
Net realizable value is the estimated selling price in the ordinary course of business, less estimated costs of completion and to make the sale.
notes to fInAncIAl stAtements for the year ended March 31, 2017
l. Revenue Recognition
Revenue is recognized to the extent that it is probable that the economic benefits will flow to the Company and the revenue can be reliably measured. The following specific recognition criteria must be met before revenue is recognised.
Sale of goods
Revenue from sale of Goods is recognised when the significant risks and rewards of ownership of the goods have passed to the buyer usually on delivery of goods to the customer. The Company collects sales taxes and value added taxes (VAT) on behalf of the government and, therefore, these are not economic benefits flowing to the Company. Hence, they are excluded from revenue. Excise duty deducted from revenue (gross) is the amount that is included in the revenue (gross) and not the entire amount of liability arising during the year.
Sale of services
Revenues from service contracts are recognized as and when services are rendered. The Company collects service tax on behalf of the government and, therefore, it is not an economic benefit flowing to the Company. Hence, it is excluded from revenue.
Interest
Interest income is recognized on a time proportion basis taking into account the amount outstanding and the applicable interest rate. Interest income is included under the head “other income” in the statement of profit and loss.
Dividends
Dividend income is recognized when the Company’s right to receive dividend is established by the reporting date.
88 Lumax Industries Limited
Export Incentives
Export benefits are accounted for in the year of exports based on eligibility and when there is no uncertainty in receiving the same.
m. Foreign Currency translation
Foreign currency transactions
i. Initial Recognition
Foreign currency transactions are recorded in the reporting currency, by applying to the foreign currency amount the exchange rate between the reporting currency and the foreign currency at the date of the transaction.
ii. Conversion
Foreign currency monetary items are reported using the closing rate. Non-monetary items which are carried in terms of historical cost denominated in a foreign currency are reported using the exchange rate at the date of the transaction.
iii. Exchange Differences
Exchange differences arising on the settlement of monetary items or on reinstatement of monetary items at rates different from those at which they were initially recorded during the year, or reported in previous financial statements, are recognised as income or as expenses.
iv. Forward exchange contracts entered into to hedge foreign currency risk of an existing asset/ liability
The premium or discount arising at the inception of forward exchange contracts is amortised as expense or income over the life of the contract. Exchange differences on such contracts are recognized in the statement of profit and loss in the year in which the exchange rates change. Any profit or loss arising on cancellation or renewal of forward exchange contract
is recognized as income or as expense for the period.
n. Retirement and other Employee Benefits
i. Retirement benefit in the form of provident fund is a defined contribution scheme. The company has no obligation, other than the contribution payable to the provident fund. The company recognizes contribution payable to the provident fund scheme as expenditure, when an employee renders the related service.
ii. Gratuity Liability is a defined benefit plan and is provided for on the basis of an actuarial valuation on projected unit credit method made at the end of each financial year.
Actuarial gain and loss for defined benefit plan is recognized in full in the period in which it occur in the statement of profit and loss.
iii. Accumulated leave, which is expected to be utilized within the next 12 months, is treated as short-term employee benefit. The Company measures the expected cost of such absences as the additional amount that it expects to pay as a result of the unused entitlement that has accumulated at the reporting date.
iv. The Company treats accumulated leave expected to be carried forward beyond twelve months, as long-term employee benefit for measurement purposes. Such long-term compensated absences are provided for based on the actuarial valuation using the projected unit credit method at the year-end. Actuarial gains/losses are immediately taken to the statement of profit and loss and are not deferred. The company presents the leave as a current liability in the balance sheet, to the extent it does not have an unconditional right to defer its settlement for 12 months after the reporting date.
notes to fInAncIAl stAtements for the year ended March 31, 2017

Annual Report 2016-17 89
Co
rpo
rate Overview
Statu
tory R
epo
rtsFin
ancial S
tatemen
ts
Where company has the unconditional legal and contractual right to defer the settlement for a period beyond 12 months, the same is presented as non-current liability.
o. Income taxes
Tax expense comprises current and deferred tax. Current income-tax is measured at the amount expected to be paid to the tax authorities in accordance with the Income-tax Act, 1961 enacted in India and tax laws prevailing in the respective tax jurisdictions where the Company operates. The tax rates and tax laws used to compute the amount are those that are enacted or substantively enacted, at the reporting date. Current income tax relating to items recognized directly in equity is recognized in equity and not in the statement of profit and loss.
Deferred income taxes reflect the impact of timing differences between taxable income and accounting income originating during the current year and reversal of timing differences for the earlier years. Deferred tax is measured using the tax rates and the tax laws enacted or substantively enacted at the reporting date. Deferred income tax relating to items recognized directly in equity is recognized in equity and not in the statement of profit and loss.
Deferred tax liabilities are recognized for all taxable timing differences. Deferred tax assets are recognized for deductible timing differences only to the extent that there is reasonable certainty that sufficient future taxable income will be available against which such deferred tax assets can be realized. In situations where the Company has unabsorbed depreciation or carry forward tax losses, all deferred tax assets are recognized only if there is virtual certainty supported by convincing evidence that they can be realized against future taxable profits.
In the situations where the Company is entitled to a tax holiday under the Income-tax Act, 1961 enacted in India
or tax laws prevailing in the respective tax jurisdictions where it operates, no deferred tax (asset or liability) is recognized in respect of timing differences which reverse during the tax holiday period, to the extent the Company’s gross total income is subject to the deduction during the tax holiday period. Deferred tax in respect of timing differences which reverse after the tax holiday period is recognized in the year in which the timing differences originate. However, the Company restricts recognition of deferred tax assets to the extent that it has become reasonably certain or virtually certain, as the case may be, that sufficient future taxable income will be available against which such deferred tax assets can be realized. For recognition of deferred taxes, the timing differences which originate first are considered to reverse first.
At each reporting date, the Company re-assesses unrecognized deferred tax assets. It recognizes unrecognized deferred tax asset to the extent that it has become reasonably certain or virtually certain, as the case may be, that sufficient future taxable income will be available against which such deferred tax assets can be realized.
The carrying amount of deferred tax assets are reviewed at each reporting date. The Company writes-down the carrying amount of deferred tax asset to the extent that it is no longer reasonably certain or virtually certain, as the case may be, that sufficient future taxable income will be available against which deferred tax assets can be realized. Any such write-down is reversed to the extent that it becomes reasonably certain or virtually certain, as the case may be, that sufficient future taxable income will be available.
Deferred tax assets and deferred tax liabilities are offset, if a legally enforceable right exists to set-off current tax assets against current tax liabilities and the deferred tax assets and deferred taxes
notes to fInAncIAl stAtements for the year ended March 31, 2017
90 Lumax Industries Limited
relate to the same taxable entity and the same taxation authority.
Minimum alternate tax (MAT) paid in a year is charged to the statement of profit and loss as current tax. The Company recognizes MAT credit available as an asset only to the extent that there is convincing evidence that the Company will pay normal income tax during the specified period, i.e., the period for which MAT credit is allowed to be carried forward. In the year in which the Company recognizes MAT credit as an asset in accordance with the Guidance Note on Accounting for Credit Available in respect of Minimum Alternative Tax under the Income-tax Act, 1961, the said asset is created by way of credit to the statement of profit and loss and shown as “MAT Credit Entitlement.” The Company reviews the “MAT credit entitlement” asset at each reporting date and writes down the asset to the extent the Company does not have convincing evidence that it will pay normal tax during the specified period.
p. Segment Reporting Policies
Business Segment
The Company is engaged in the business of manufacture of various types of Automotive Lighting Equipment. The entire operations are governed by the same set of risks and return hence the entire operations represent a single primary segment.
Geographical Segment
The analysis of geographical segments is based on the geographical location of the customers i.e. customers located within India and customers located outside India.
q. Earnings per share
Basic earnings per share are calculated by dividing the net profit or loss for the period attributable to equity shareholders by the weighted average number of equity shares outstanding during the period.
For the purpose of calculating diluted earnings per equity share, the net profit
or loss for the period attributable to equity shareholders and the weighted average number of shares outstanding during the period are adjusted for the effects of all dilutive potential equity shares.
r. Provisions
A provision is recognised when an enterprise has a present obligation as a result of past event and it is probable that an outflow of resources will be required to settle the obligation, in respect of which a reliable estimate can be made. Provisions are not discounted to its present value and are determined based on best management estimate required to settle the obligation at the balance sheet date. These are reviewed at each balance sheet date and adjusted to reflect the current best management estimates.
Warranty provisions
Provisions for warranty-related costs are recognized when the product is sold or service provided. Provision is based on historical experience. The estimate of such warranty-related costs is revised annually.
s. Contingent liabilities
A contingent liability is a possible obligation that arises from past events whose existence will be confirmed by the occurrence or non-occurrence of one or more uncertain future events beyond the control of the Company or a present obligation that is not recognized because it is not probable that an outflow of resources will be required to settle the obligation. A contingent liability also arises in extremely rare cases where there is a liability that cannot be recognized because it cannot be measured reliably. The Company does not recognize a contingent liability but discloses its existence in the financial statements.
t. Cash and Cash equivalents
Cash and cash equivalents in the cash flow statement comprise cash at bank and in hand and short- term investments with an original maturity of three months or less.
notes to fInAncIAl stAtements for the year ended March 31, 2017

Annual Report 2016-17 91
Co
rpo
rate Overview
Statu
tory R
epo
rtsFin
ancial S
tatemen
ts
notes to fInAncIAl stAtements for the year ended March 31, 2017
3. ShARE CAPItALAmount in `
As at March 31, 2017
As at March 31, 2016
Authorized shares 12,000,000 (Previous year 12,000,000) equity shares of ` 10/- each 120,000,000 120,000,000Issued, subscribed and fully paid up shares 9,347,732 (Previous year 9,347,732) equity shares of ` 10/- each 93,477,320 93,477,320
a. Reconciliation of shares outstanding at the beginning and at the end of the reporting year
As at March 31, 2017 As at March 31, 2016Nos. Amount in ` Nos. Amount in `
At the beginning of the year 9,347,732 93,477,320 9,347,732 93,477,320 Issued during the year - - - - Outstanding at the end of the year 9,347,732 93,477,320 9,347,732 93,477,320
b. terms/rights attached to equity shares
The Company has only one class of equity shares having a par value of ` 10 per share. Each holder of equity shares is entitled to one vote per share. The Company declares and pays dividends in Indian rupees. The dividend proposed by the Board of Directors is subject to the approval of shareholders in the ensuing Annual General Meeting
In the event of liquidation of the Company, the holders of equity shares will be entitled to receive remaining assets of the Company, after distribution of all preferential amounts. The distribution will be in proportion to the number of equity shares held by the shareholders.
c. Details of shareholders holding more than 5% shares in the Company
As at March 31, 2017 As at March 31, 2016Nos. % holding in
the class Nos. % holding in
the class Equity shares of ` 10 each fully paidStanley Electric Co. Limited 3,343,381 35.77% 3,343,381 35.77%Dhanesh Kumar Jain 1,938,025 20.73% 1,938,025 20.73%Lumax Auto Technologies Limited 525,000 5.62% 525,000 5.62%
As per records of the company, including its register of shareholders/ members and other declarations received from shareholders regarding beneficial interest, the above shareholding represents both legal and beneficial ownership of shares.
d. Proposed dividend on Equity shares:Amount in `
As at March 31, 2017
As at March 31, 2016
The Board proposed dividend on equity shares after the balance sheet dateProposed dividend on equity shares for the year ended ` 14.50 per share (Previous year: Nil)
135,542,114 -
Dividend Distribution Tax on proposed dividend 27,593,185 - 163,135,299 -

92 Lumax Industries Limited
notes to fInAncIAl stAtements for the year ended March 31, 2017
4. RESERVES AND SURPLUSAmount in `
As at March 31, 2017
As at March 31, 2016
Capital reserve 65,138 65,138 Securities premium account 679,665,909 679,665,909 Revaluation reserveBalance as per the last financial statements 77,067,268 77,346,536 Less: amount transferred to General Reserve (279,268)Less: amount adjusted against Land & Building pursuant to applicability of revised AS 10
(77,067,268) -
Closing Balance - 77,067,268 General reserveBalance as per the last financial statements 637,079,268 599,300,000 Add: amount transferred from surplus balance in the statement of profit and loss
54,200,000 37,500,000
Add: amount transferred from Revaluation Reserve - 279,268 Closing Balance 691,279,268 637,079,268 Surplus as per the statement of profit and lossBalance as per the last financial statements 554,427,366 353,196,071 Add: Profit for the year 451,834,166 373,739,743 Less:- AppropriationsFinal equity dividend (Previous year: ` 12.00 per share) - (112,172,784)Tax on equity dividend - (22,835,664)Transfer to general reserve (54,200,000) (37,500,000)total appropriations (54,200,000) (172,508,448)Net surplus in the statement of profit and loss 952,061,532 554,427,366 total reserves and surplus 2,323,071,847 1,948,304,949
5. LONG tERM BORROwINGSAmount in `
Non-current portion Current MaturitiesAs at
March 31, 2017As at
March 31, 2016As at
March 31, 2017As at
March 31, 2016term loansIndian rupee loan from banks (secured) 36,376,956 64,319,574 56,896,040 49,919,430 Foreign currency loan from banks (secured) - 41,409,370 40,531,250 269,160,938
36,376,956 105,728,944 97,427,290 319,080,368 the above amount includesSecured borrowings 36,376,956 105,728,944 97,427,290 319,080,368 Amount disclosed under the head "other current liabilities" (Note 11)
(97,427,290) (319,080,368)
Net amount 36,376,956 105,728,944 - -
Notes:
1 Indian Rupee Loan from Bank includes:
(a) ̀ 27,937,500/- (Previous year ` 50,287,500/-) taken in the Financial Year 2013-14 carries interest @ 10% p.a. at present. The loan is repayable in 16 equal quarterly installments of ` 5,587,500/- (excluding interest) after one year moratorium period from the disbursement date i.e. from 04.04.2013. The Loan is secured by way of first pari passu charge on the land and building situated at Sohna, Gurgaon (Haryana) unit.
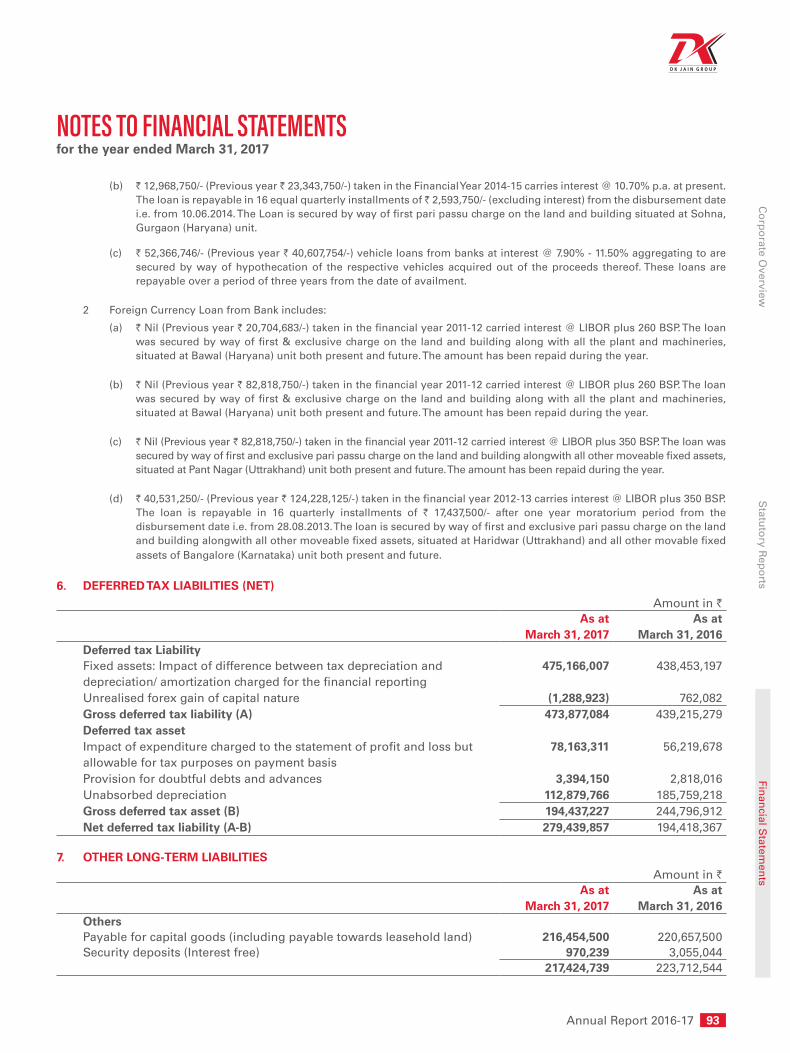
Annual Report 2016-17 93
Co
rpo
rate Overview
Statu
tory R
epo
rtsFin
ancial S
tatemen
ts
notes to fInAncIAl stAtements for the year ended March 31, 2017
(b) ̀ 12,968,750/- (Previous year ` 23,343,750/-) taken in the Financial Year 2014-15 carries interest @ 10.70% p.a. at present. The loan is repayable in 16 equal quarterly installments of ̀ 2,593,750/- (excluding interest) from the disbursement date i.e. from 10.06.2014. The Loan is secured by way of first pari passu charge on the land and building situated at Sohna, Gurgaon (Haryana) unit.
(c) ̀ 52,366,746/- (Previous year ` 40,607,754/-) vehicle loans from banks at interest @ 7.90% - 11.50% aggregating to are secured by way of hypothecation of the respective vehicles acquired out of the proceeds thereof. These loans are repayable over a period of three years from the date of availment.
2 Foreign Currency Loan from Bank includes:
(a) ̀ Nil (Previous year ` 20,704,683/-) taken in the financial year 2011-12 carried interest @ LIBOR plus 260 BSP. The loan was secured by way of first & exclusive charge on the land and building along with all the plant and machineries, situated at Bawal (Haryana) unit both present and future. The amount has been repaid during the year.
(b) ̀ Nil (Previous year ` 82,818,750/-) taken in the financial year 2011-12 carried interest @ LIBOR plus 260 BSP. The loan was secured by way of first & exclusive charge on the land and building along with all the plant and machineries, situated at Bawal (Haryana) unit both present and future. The amount has been repaid during the year.
(c) ̀ Nil (Previous year ` 82,818,750/-) taken in the financial year 2011-12 carried interest @ LIBOR plus 350 BSP. The loan was secured by way of first and exclusive pari passu charge on the land and building alongwith all other moveable fixed assets, situated at Pant Nagar (Uttrakhand) unit both present and future. The amount has been repaid during the year.
(d) ̀ 40,531,250/- (Previous year ` 124,228,125/-) taken in the financial year 2012-13 carries interest @ LIBOR plus 350 BSP. The loan is repayable in 16 quarterly installments of ` 17,437,500/- after one year moratorium period from the disbursement date i.e. from 28.08.2013. The loan is secured by way of first and exclusive pari passu charge on the land and building alongwith all other moveable fixed assets, situated at Haridwar (Uttrakhand) and all other movable fixed assets of Bangalore (Karnataka) unit both present and future.
6. DEFERRED tAX LIABILItIES (NEt)Amount in `
As at March 31, 2017
As at March 31, 2016
Deferred tax LiabilityFixed assets: Impact of difference between tax depreciation and depreciation/ amortization charged for the financial reporting
475,166,007 438,453,197
Unrealised forex gain of capital nature (1,288,923) 762,082 Gross deferred tax liability (A) 473,877,084 439,215,279 Deferred tax assetImpact of expenditure charged to the statement of profit and loss but allowable for tax purposes on payment basis
78,163,311 56,219,678
Provision for doubtful debts and advances 3,394,150 2,818,016 Unabsorbed depreciation 112,879,766 185,759,218 Gross deferred tax asset (B) 194,437,227 244,796,912 Net deferred tax liability (A-B) 279,439,857 194,418,367
7. OthER LONG-tERM LIABILItIESAmount in `
As at March 31, 2017
As at March 31, 2016
OthersPayable for capital goods (including payable towards leasehold land) 216,454,500 220,657,500 Security deposits (Interest free) 970,239 3,055,044
217,424,739 223,712,544

94 Lumax Industries Limited
notes to fInAncIAl stAtements for the year ended March 31, 2017
8. PROVISIONSAmount in `
Long-term Short-termAs at
March 31, 2017As at
March 31, 2016As at
March 31, 2017As at
March 31, 2016Provision for employee benefitsProvision for leave benefits 114,598,344 92,716,007 11,907,942 9,180,439 Provision for gratuity (Note 29) - - 54,095,627 39,715,106
114,598,344 92,716,007 66,003,569 48,895,545 Other provisionsProvision for warranties {Refer point (a) below}
- - 3,274,000 7,017,000
- - 3,274,000 7,017,000 114,598,344 92,716,007 69,277,569 55,912,545
(a) Provision for warranties
A provision is recognized for expected warranty claims on products sold during the last one year, based on past experience of the level of repairs and returns. It is expected that all of these costs will be incurred in the next financial year after the reporting date. Assumptions used to calculate the provision for warranties were based on current sales levels and current information available about warranty based on the one-year period for all products sold.
The table below gives information about movement in warranty provisions.Amount in `
As at March 31, 2017
As at March 31, 2016
At the beginning of the year 7,017,000 7,134,000 Arising during the year 2,211,191 11,791,544 Utilized during the year (5,954,191) (11,908,544)At the end of the year (current portion) 3,274,000 7,017,000
9. ShORt-tERM BORROwINGSAmount in `
As at March 31, 2017
As at March 31, 2016
Commercial Papers (unsecured) 400,000,000 - Cash credit/Working Capital facility from banks (secured) 96,791,970 450,891,414 Vendor finance facility from banks (unsecured) 293,429,152 397,362,227
790,221,122 848,253,641
Notes:
(a) Cash credit facility of ` Nil (Previous year ` 8,670,747/-) was secured by way of first pari passu charge on all current assets of the Company. This facility was further secured by extension of charge by way of hypothecation on the Plant and Machinery along with the UREM on Land and Building situated at Chakan Unit of the Company & carried interest @ 10.20%. The amount has been repaid during the year.
(b) WCDL Facility of ` Nil (Previous year ` 150,000,000/-) & Cash Credit facility of ` Nil (Previous year ` Nil) is secured by way of first pari passu charge on all current assets of the Company. This facility was further secured by way of equitable mortgage on Land and Buildings and first pari passu charges against movable Fixed Assets at Chinchwad Unit of the Company & carried interest @ 9.35%. and 8.95%
(c) Cash Credit facility of ` 76,998,098/- (Previous year ` 92,220,667/-) & WCDL Facility of ` Nil (Previous year ` Nil) is secured by way of first pari passu charge on all current assets of the Company. This facility is further secured by way of equitable mortgage on Land and Buildings and first pari passu charges against movable Fixed Assets at Chinchwad Unit of the Company repayable on demand & carries interest @ 9.25% for the current year & 9.65% respectively for the previous year.

Annual Report 2016-17 95
Co
rpo
rate Overview
Statu
tory R
epo
rtsFin
ancial S
tatemen
ts
notes to fInAncIAl stAtements for the year ended March 31, 2017
(d) WCDL Facility of ` Nil (Previous year ` 200,000,000/-) was secured by way of first pari passu charge on all current assets of the Company. This facility was further secured by way of equitable mortgage on Land and Buildings and first pari passu charges against movable Fixed Assets at Chinchwad Unit of the Company repayable on demand & carried interest @ 9.50%.
(e) Vendor Finance Facility from MSIL of ` 193,429,152/- (Previous year ` 397,362,227/-) is repayable on 60 days from respective drawdown & carries interest @ 8.45%.
(f) Vendor Finance Facility from MSIL of Rs 100,000,000/- (Previous year ` Nil) is repayable on 60 days from respective drawdown & carries interest @ 8.10 %.
(g) Commercial paper issued to Bank amounting to ` 400,000,000/- (previous year Nil) carrying interest rate ranging from 6.95 % p.a. to 7.25 % p.a. Commercial paper is payable by 31 May 2017. This facility is unsecured short term borrowing. Unexpired discount on commercial papers is ` 46,83,467/- (Previous year Nil), towards interest accrued but not due.
(h) Cash credit facility of ` 19,793,872/- (Previous year Nil ) is secured by way of first pari passu charge on all current assets of the Company. This facility is further secured by extension of charge by way of hypothecation on the Plant and Machinery along with the UREM on Land and Building situated at Chakan Unit of the Company, repayable on demand & carries interest @ 8.52 %.
10. tRADE PAYABLESAmount in `
As at March 31, 2017
As at March 31, 2016
Trade payables*- Total outstanding due of micro enterprises and small enterprises (refer
note 37 for details of dues to micro and small enterprises) 1,480,603 722,444
- Total outstanding due of creditors other than micro enterprises and small enterprises#
3,441,231,922 3,096,045,229
3,442,712,525 3,096,767,673
* Refer note 32 for related party transactions
# Trade payables include acceptances of ` 254,228,254/- (Previous year ` 188,015,774/-)
11. OthER CURRENt LIABILItIESAmount in `
As at March 31, 2017
As at March 31, 2016
Current maturities of long term borrowings (Note 5) 97,427,290 319,080,368 Interest accrued but not due on borrowings 3,327,581 5,603,606 Investor Education and Protection Fund will be credited by following amounts (as and when due) {Refer point (a)} Unpaid dividend 5,491,286 7,746,077 Other Payables Payable for capital goods 139,749,454 93,843,383 Interest free deposits from customers # 333,390 233,390 Advances from customers * 472,054,051 582,535,250 Statutory dues payable 98,599,879 77,289,962 Other liabilities {Refer point (b)} 228,918,934 198,088,709
1,045,901,865 1,284,420,745
* Refer note 32 for related party transactions # Customer deposits are repayable on demand.
(a) Investor Education and Protection Fund is being credited by the amount of unclaimed dividend after seven years from the due date. Accordingly, the Company has transferred ` 141,107/- during the current year (Previous year ` 426,572/-) to the Investor Education and Protection Fund.
(b) Other liabilities (net) represents amount towards rate provision payable to the customers net off amounts receivable from customers in respect of price increase not yet debited.
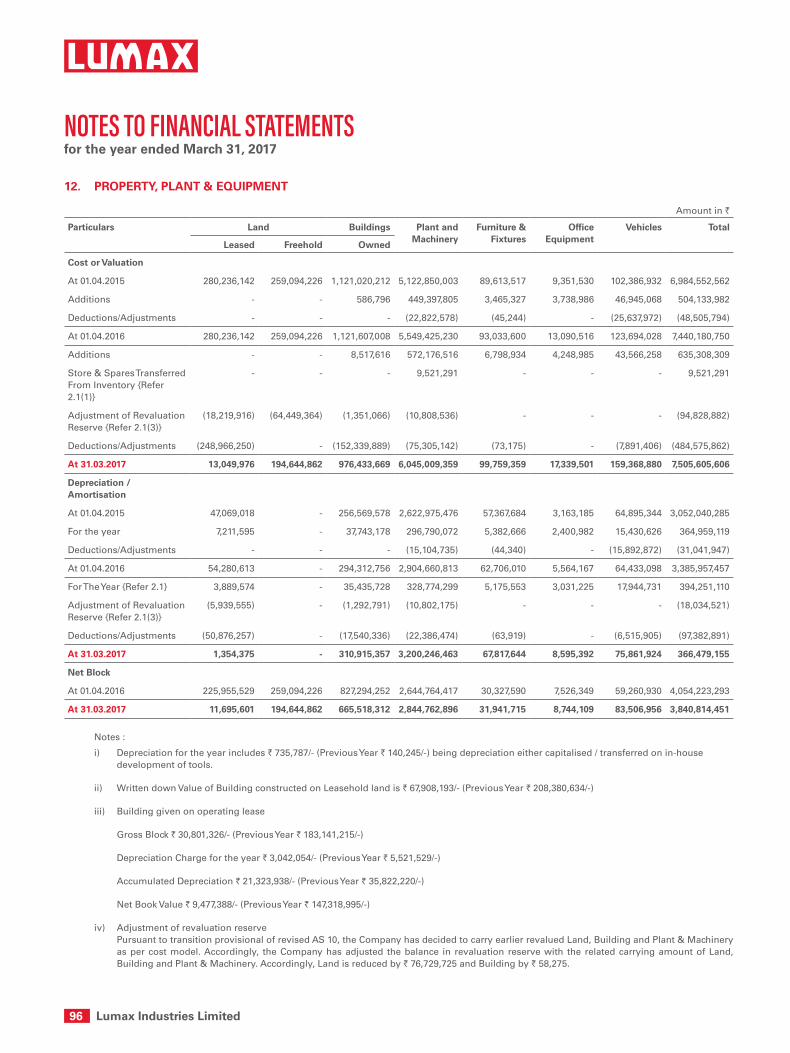
96 Lumax Industries Limited
notes to fInAncIAl stAtements for the year ended March 31, 2017
12. PROPERtY, PLANt & EQUIPMENt
Amount in `
Particulars Land Buildings Plant and Machinery
Furniture & Fixtures
Office Equipment
Vehicles total
Leased Freehold Owned
Cost or Valuation
At 01.04.2015 280,236,142 259,094,226 1,121,020,212 5,122,850,003 89,613,517 9,351,530 102,386,932 6,984,552,562
Additions - - 586,796 449,397,805 3,465,327 3,738,986 46,945,068 504,133,982
Deductions/Adjustments - - - (22,822,578) (45,244) - (25,637,972) (48,505,794)
At 01.04.2016 280,236,142 259,094,226 1,121,607,008 5,549,425,230 93,033,600 13,090,516 123,694,028 7,440,180,750
Additions - - 8,517,616 572,176,516 6,798,934 4,248,985 43,566,258 635,308,309
Store & Spares Transferred From Inventory {Refer 2.1(1)}
- - - 9,521,291 - - - 9,521,291
Adjustment of Revaluation Reserve {Refer 2.1(3)}
(18,219,916) (64,449,364) (1,351,066) (10,808,536) - - - (94,828,882)
Deductions/Adjustments (248,966,250) - (152,339,889) (75,305,142) (73,175) - (7,891,406) (484,575,862)
At 31.03.2017 13,049,976 194,644,862 976,433,669 6,045,009,359 99,759,359 17,339,501 159,368,880 7,505,605,606
Depreciation / Amortisation
At 01.04.2015 47,069,018 - 256,569,578 2,622,975,476 57,367,684 3,163,185 64,895,344 3,052,040,285
For the year 7,211,595 - 37,743,178 296,790,072 5,382,666 2,400,982 15,430,626 364,959,119
Deductions/Adjustments - - - (15,104,735) (44,340) - (15,892,872) (31,041,947)
At 01.04.2016 54,280,613 - 294,312,756 2,904,660,813 62,706,010 5,564,167 64,433,098 3,385,957,457
For The Year {Refer 2.1} 3,889,574 - 35,435,728 328,774,299 5,175,553 3,031,225 17,944,731 394,251,110
Adjustment of Revaluation Reserve {Refer 2.1(3)}
(5,939,555) - (1,292,791) (10,802,175) - - - (18,034,521)
Deductions/Adjustments (50,876,257) - (17,540,336) (22,386,474) (63,919) - (6,515,905) (97,382,891)
At 31.03.2017 1,354,375 - 310,915,357 3,200,246,463 67,817,644 8,595,392 75,861,924 366,479,155
Net Block
At 01.04.2016 225,955,529 259,094,226 827,294,252 2,644,764,417 30,327,590 7,526,349 59,260,930 4,054,223,293
At 31.03.2017 11,695,601 194,644,862 665,518,312 2,844,762,896 31,941,715 8,744,109 83,506,956 3,840,814,451
Notes :
i) Depreciation for the year includes ` 735,787/- (Previous Year ` 140,245/-) being depreciation either capitalised / transferred on in-house development of tools.
ii) Written down Value of Building constructed on Leasehold land is ` 67,908,193/- (Previous Year ` 208,380,634/-)
iii) Building given on operating lease
Gross Block ` 30,801,326/- (Previous Year ` 183,141,215/-)
Depreciation Charge for the year ` 3,042,054/- (Previous Year ` 5,521,529/-)
Accumulated Depreciation ` 21,323,938/- (Previous Year ` 35,822,220/-)
Net Book Value ` 9,477,388/- (Previous Year ` 147,318,995/-)
iv) Adjustment of revaluation reserve Pursuant to transition provisional of revised AS 10, the Company has decided to carry earlier revalued Land, Building and Plant & Machinery
as per cost model. Accordingly, the Company has adjusted the balance in revaluation reserve with the related carrying amount of Land, Building and Plant & Machinery. Accordingly, Land is reduced by ` 76,729,725 and Building by ` 58,275.
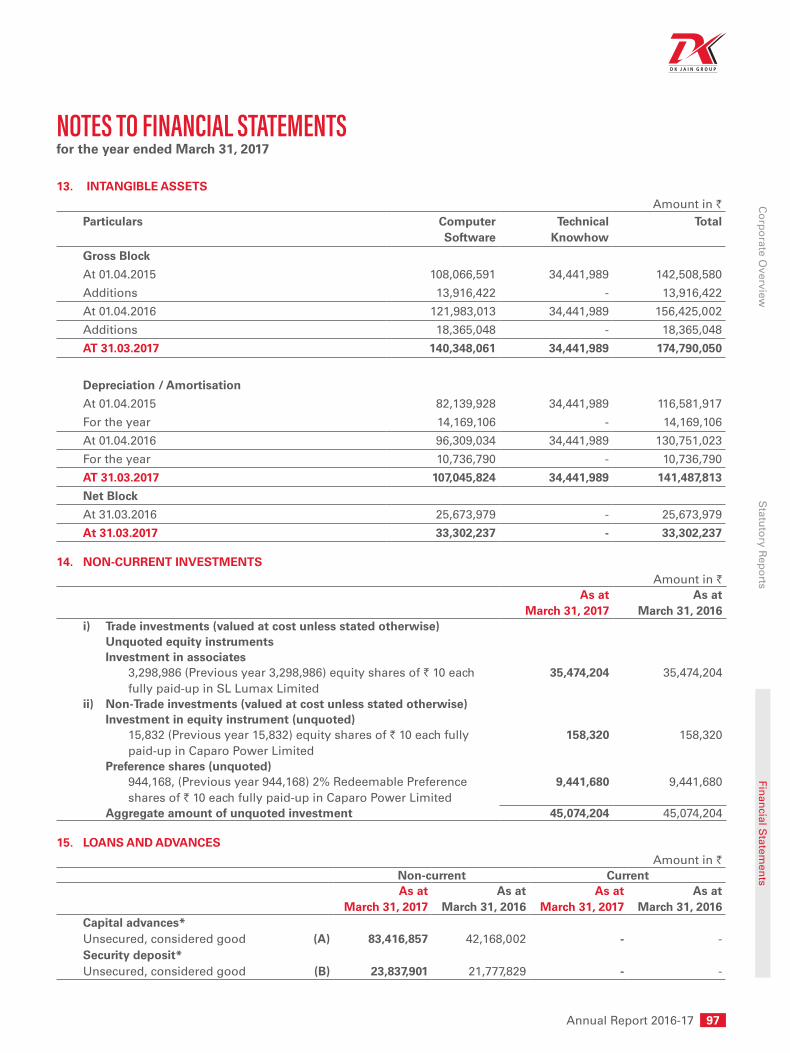
Annual Report 2016-17 97
Co
rpo
rate Overview
Statu
tory R
epo
rtsFin
ancial S
tatemen
ts
notes to fInAncIAl stAtements for the year ended March 31, 2017
13. INtANGIBLE ASSEtSAmount in `
Particulars Computer Software
technical Knowhow
total
Gross Block
At 01.04.2015 108,066,591 34,441,989 142,508,580
Additions 13,916,422 - 13,916,422
At 01.04.2016 121,983,013 34,441,989 156,425,002
Additions 18,365,048 - 18,365,048
At 31.03.2017 140,348,061 34,441,989 174,790,050
Depreciation / Amortisation
At 01.04.2015 82,139,928 34,441,989 116,581,917
For the year 14,169,106 - 14,169,106
At 01.04.2016 96,309,034 34,441,989 130,751,023
For the year 10,736,790 - 10,736,790
At 31.03.2017 107,045,824 34,441,989 141,487,813
Net Block
At 31.03.2016 25,673,979 - 25,673,979
At 31.03.2017 33,302,237 - 33,302,237
14. NON-CURRENt INVEStMENtSAmount in `
As at March 31, 2017
As at March 31, 2016
i) trade investments (valued at cost unless stated otherwise) Unquoted equity instruments Investment in associates 3,298,986 (Previous year 3,298,986) equity shares of ` 10 each
fully paid-up in SL Lumax Limited 35,474,204 35,474,204
ii) Non-trade investments (valued at cost unless stated otherwise) Investment in equity instrument (unquoted) 15,832 (Previous year 15,832) equity shares of ` 10 each fully
paid-up in Caparo Power Limited 158,320 158,320
Preference shares (unquoted) 944,168, (Previous year 944,168) 2% Redeemable Preference
shares of ` 10 each fully paid-up in Caparo Power Limited 9,441,680 9,441,680
Aggregate amount of unquoted investment 45,074,204 45,074,204
15. LOANS AND ADVANCESAmount in `
Non-current CurrentAs at
March 31, 2017As at
March 31, 2016As at
March 31, 2017As at
March 31, 2016Capital advances*Unsecured, considered good (A) 83,416,857 42,168,002 - - Security deposit*Unsecured, considered good (B) 23,837,901 21,777,829 - -
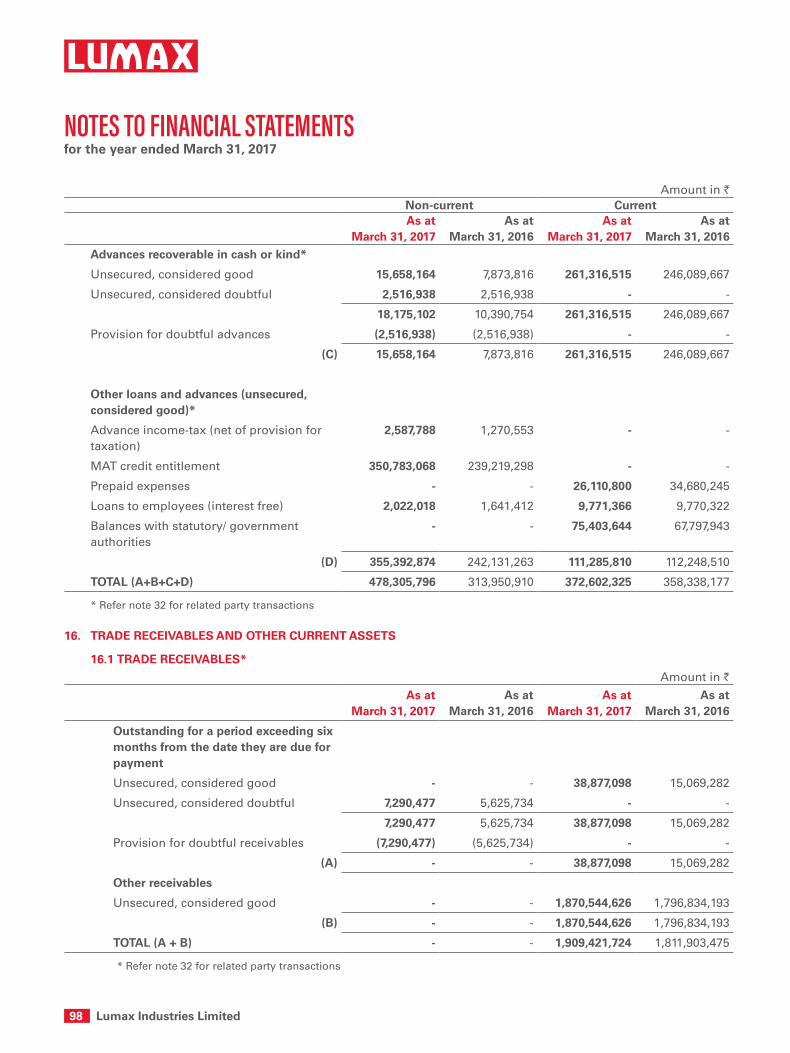
98 Lumax Industries Limited
notes to fInAncIAl stAtements for the year ended March 31, 2017
Amount in `Non-current CurrentAs at
March 31, 2017As at
March 31, 2016As at
March 31, 2017As at
March 31, 2016Advances recoverable in cash or kind*
Unsecured, considered good 15,658,164 7,873,816 261,316,515 246,089,667
Unsecured, considered doubtful 2,516,938 2,516,938 - -
18,175,102 10,390,754 261,316,515 246,089,667
Provision for doubtful advances (2,516,938) (2,516,938) - -
(C) 15,658,164 7,873,816 261,316,515 246,089,667
Other loans and advances (unsecured, considered good)*
Advance income-tax (net of provision for taxation)
2,587,788 1,270,553 - -
MAT credit entitlement 350,783,068 239,219,298 - -
Prepaid expenses - - 26,110,800 34,680,245
Loans to employees (interest free) 2,022,018 1,641,412 9,771,366 9,770,322
Balances with statutory/ government authorities
- - 75,403,644 67,797,943
(D) 355,392,874 242,131,263 111,285,810 112,248,510
tOtAL (A+B+C+D) 478,305,796 313,950,910 372,602,325 358,338,177
* Refer note 32 for related party transactions
16. tRADE RECEIVABLES AND OthER CURRENt ASSEtS
16.1 tRADE RECEIVABLES*Amount in `
As at March 31, 2017
As at March 31, 2016
As at March 31, 2017
As at March 31, 2016
Outstanding for a period exceeding six months from the date they are due for payment
Unsecured, considered good - - 38,877,098 15,069,282
Unsecured, considered doubtful 7,290,477 5,625,734 - -
7,290,477 5,625,734 38,877,098 15,069,282
Provision for doubtful receivables (7,290,477) (5,625,734) - -
(A) - - 38,877,098 15,069,282
Other receivables
Unsecured, considered good - - 1,870,544,626 1,796,834,193
(B) - - 1,870,544,626 1,796,834,193
tOtAL (A + B) - - 1,909,421,724 1,811,903,475
* Refer note 32 for related party transactions
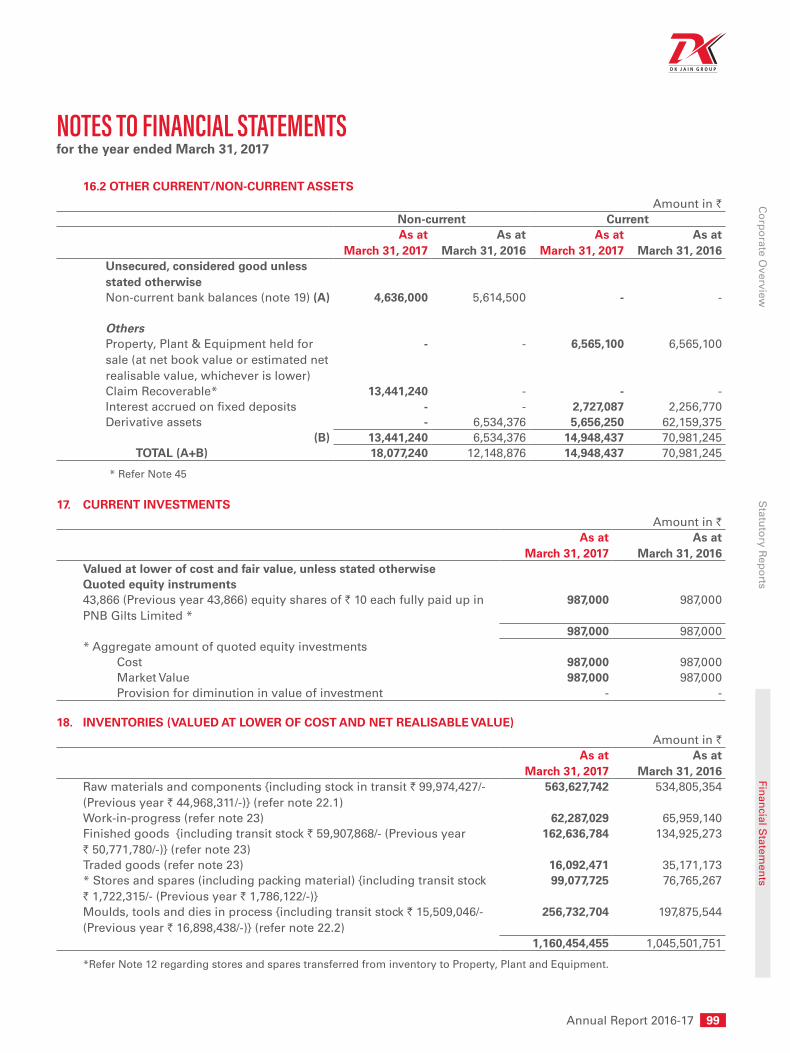
Annual Report 2016-17 99
Co
rpo
rate Overview
Statu
tory R
epo
rtsFin
ancial S
tatemen
ts
notes to fInAncIAl stAtements for the year ended March 31, 2017
16.2 OthER CURRENt/NON-CURRENt ASSEtSAmount in `
Non-current CurrentAs at
March 31, 2017As at
March 31, 2016As at
March 31, 2017As at
March 31, 2016Unsecured, considered good unless stated otherwiseNon-current bank balances (note 19) (A) 4,636,000 5,614,500 - -
OthersProperty, Plant & Equipment held for sale (at net book value or estimated net realisable value, whichever is lower)
- - 6,565,100 6,565,100
Claim Recoverable* 13,441,240 - - - Interest accrued on fixed deposits - - 2,727,087 2,256,770 Derivative assets - 6,534,376 5,656,250 62,159,375
(B) 13,441,240 6,534,376 14,948,437 70,981,245 tOtAL (A+B) 18,077,240 12,148,876 14,948,437 70,981,245
* Refer Note 45
17. CURRENt INVEStMENtSAmount in `
As at March 31, 2017
As at March 31, 2016
Valued at lower of cost and fair value, unless stated otherwiseQuoted equity instruments43,866 (Previous year 43,866) equity shares of ` 10 each fully paid up in PNB Gilts Limited *
987,000 987,000
987,000 987,000 * Aggregate amount of quoted equity investments Cost 987,000 987,000 Market Value 987,000 987,000 Provision for diminution in value of investment - -
18. INVENtORIES (VALUED At LOwER OF COSt AND NEt REALISABLE VALUE)Amount in `
As at March 31, 2017
As at March 31, 2016
Raw materials and components {including stock in transit ` 99,974,427/- (Previous year ` 44,968,311/-)} (refer note 22.1)
563,627,742 534,805,354
Work-in-progress (refer note 23) 62,287,029 65,959,140 Finished goods {including transit stock ` 59,907,868/- (Previous year ` 50,771,780/-)} (refer note 23)
162,636,784 134,925,273
Traded goods (refer note 23) 16,092,471 35,171,173 * Stores and spares (including packing material) {including transit stock ` 1,722,315/- (Previous year ` 1,786,122/-)}
99,077,725 76,765,267
Moulds, tools and dies in process {including transit stock ` 15,509,046/- (Previous year ` 16,898,438/-)} (refer note 22.2)
256,732,704 197,875,544
1,160,454,455 1,045,501,751
*Refer Note 12 regarding stores and spares transferred from inventory to Property, Plant and Equipment.

100 Lumax Industries Limited
notes to fInAncIAl stAtements for the year ended March 31, 2017
19. CASh AND BANK BALANCESAmount in `
Non-current CurrentAs at
March 31, 2017As at
March 31, 2016As at
March 31, 2017As at
March 31, 2016Cash and cash equivalentsBalances with banks: On current accounts - - 4,636,144 19,014,978 On unpaid dividend account* - - 5,491,286 7,746,077 Cash on hand - - 1,727,866 2,764,506 Cheques on Hand - - 342,358 5,026,725
- - 12,197,654 34,552,286 Other bank balancesDeposits having remaining maturity of more than 12 months#
4,636,000 5,614,500 - -
Deposits having remaining maturity of less than 12 months#
- - 1,497,436 -
4,636,000 5,614,500 1,497,436 - Amount disclosed under non-current assets (note 16.2)
(4,636,000) (5,614,500) - -
- - 13,695,090 34,552,286
* The Company can utilize the balance only towards settlement of unclaimed dividend.
# Deposits include ` 6,133,436/- (Previous year ` 5,614,500/-) pledged with banks for guarantees given.
20. REVENUE FROM OPERAtIONSAmount in `
For the year ended March 31, 2017
For the year endedMarch 31, 2016
Sale of products Finished goods # 13,203,906,447 12,894,075,425 Traded goods 67,503,447 89,687,246 Moulds, tools and dies 1,182,456,923 953,695,721 Sale of services 64,936,884 70,345,756 Other operating revenue Scrap sales 22,220,534 21,130,286 Other 6,490,064 7,469,669 Revenue from operations (gross) 14,547,514,299 14,036,404,103 Excise duty* 1,549,704,727 1,484,651,738 Revenue from operations (net) 12,997,809,572 12,551,752,365
* Excise duty on sales amounting to ` 1,549,704,727/- (Previous year: ` 1,484,651,738/-) has been reduced from sales in statement of profit & loss and excise duty on (increase)/decrease in inventory amounting to ` 6,776,891/- (Previous year: ` (2,045,717/-)) {note 25} has been considered as expense/(income).
Details of products soldAmount in `
For the year ended March 31, 2017
For the year endedMarch 31, 2016
Finished goods sold#
Automotive Lamps 13,203,906,447 12,889,052,831 Gear shifter - 5,022,594 total 13,203,906,447 12,894,075,425
# Includes Raw material & components amounting to ` 268,878,975/- (Previous year ` 420,092,749/-)

Annual Report 2016-17 101
Co
rpo
rate Overview
Statu
tory R
epo
rtsFin
ancial S
tatemen
ts
notes to fInAncIAl stAtements for the year ended March 31, 2017
Amount in `For the year ended
March 31, 2017For the year ended
March 31, 2016traded goods soldAutomotive Lamps 67,503,447 89,687,246 total 67,503,447 89,687,246
tools, moulds & dies soldTools & moulds 1,182,456,923 953,695,721 total 1,182,456,923 953,695,721
Details of services renderedSale of designs 64,936,884 70,345,756 total 64,936,884 70,345,756
21. OthER INCOMEAmount in `
For the year ended March 31, 2017
For the year endedMarch 31, 2016
Interest income on Bank deposits 958,748 1,158,907 Others 831,876 954,705 Dividend income on long-term investments 5,189,159 5,206,188 Profit on sale / discard of property, plant & equipment (net) 2,781,622 1,284,459 Rent 15,464,570 23,918,588 Provisions/creditors no longer required written back 1,106,454 5,570,487 Exchange difference (net) 22,117,296 - Other non-operating income 13,447,049 5,670,306 total 61,896,774 43,763,640
22.1 COSt OF RAw MAtERIAL AND COMPONENtS CONSUMEDAmount in `
For the year ended March 31, 2017
For the year endedMarch 31, 2016
Inventory at the beginning of the year 534,805,354 470,228,897 Add: Purchases 7,560,366,794 7,657,335,093
8,095,172,148 8,127,563,990 Less: Inventory at the end of the year (Note 18) 563,627,742 534,805,354
7,531,544,406 7,592,758,636 Details of raw material and components consumedPlastic Powder 1,522,775,115 1,486,789,728 Bulbs 1,180,198,284 1,068,934,727 Adjustor Motors 717,469,058 705,782,386 Others 4,111,101,949 4,331,251,795 total 7,531,544,406 7,592,758,636
Details of InventoryRaw material and componentsPlastic Powder 110,584,705 122,528,343 Bulbs 59,519,563 85,367,099 Adjustor Motors 18,798,185 28,132,854 Others 374,725,289 298,777,058 total 563,627,742 534,805,354
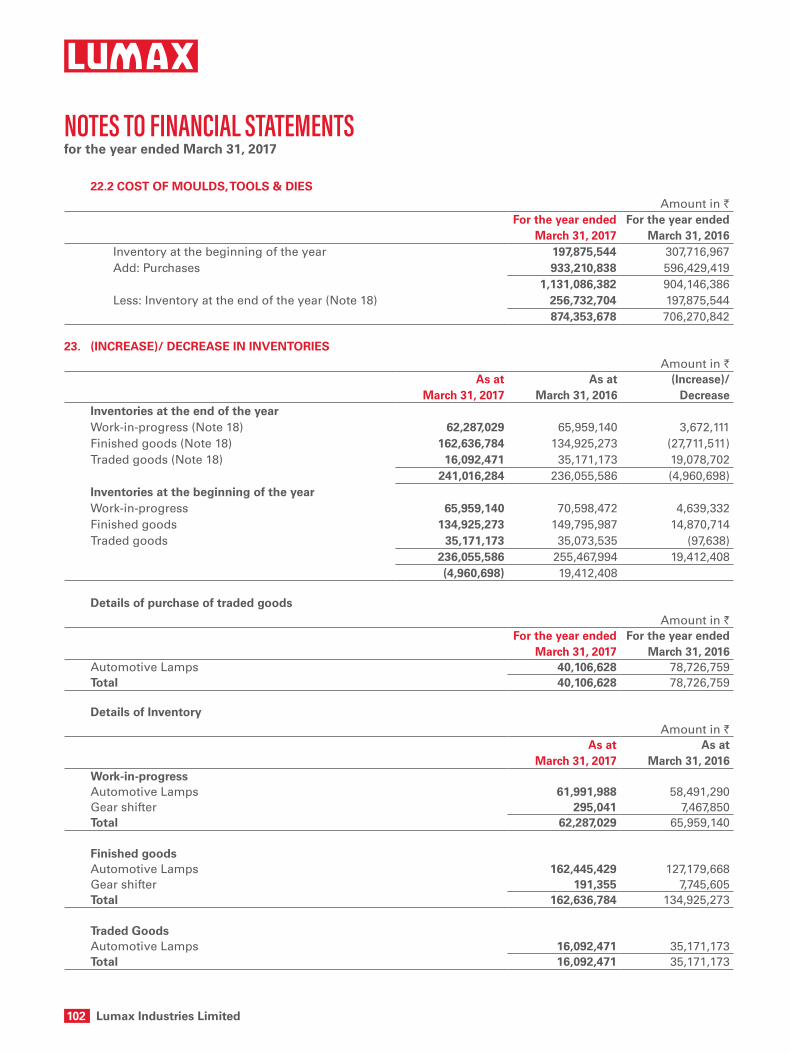
102 Lumax Industries Limited
notes to fInAncIAl stAtements for the year ended March 31, 2017
22.2 COSt OF MOULDS, tOOLS & DIESAmount in `
For the year ended March 31, 2017
For the year endedMarch 31, 2016
Inventory at the beginning of the year 197,875,544 307,716,967 Add: Purchases 933,210,838 596,429,419
1,131,086,382 904,146,386 Less: Inventory at the end of the year (Note 18) 256,732,704 197,875,544
874,353,678 706,270,842
23. (INCREASE)/ DECREASE IN INVENtORIESAmount in `
As at March 31, 2017
As atMarch 31, 2016
(Increase)/ Decrease
Inventories at the end of the year Work-in-progress (Note 18) 62,287,029 65,959,140 3,672,111 Finished goods (Note 18) 162,636,784 134,925,273 (27,711,511)Traded goods (Note 18) 16,092,471 35,171,173 19,078,702
241,016,284 236,055,586 (4,960,698)Inventories at the beginning of the year Work-in-progress 65,959,140 70,598,472 4,639,332 Finished goods 134,925,273 149,795,987 14,870,714 Traded goods 35,171,173 35,073,535 (97,638)
236,055,586 255,467,994 19,412,408 (4,960,698) 19,412,408
Details of purchase of traded goodsAmount in `
For the year ended March 31, 2017
For the year endedMarch 31, 2016
Automotive Lamps 40,106,628 78,726,759 total 40,106,628 78,726,759
Details of InventoryAmount in `
As atMarch 31, 2017
As atMarch 31, 2016
work-in-progressAutomotive Lamps 61,991,988 58,491,290 Gear shifter 295,041 7,467,850 total 62,287,029 65,959,140
Finished goodsAutomotive Lamps 162,445,429 127,179,668 Gear shifter 191,355 7,745,605 total 162,636,784 134,925,273
traded GoodsAutomotive Lamps 16,092,471 35,171,173 total 16,092,471 35,171,173
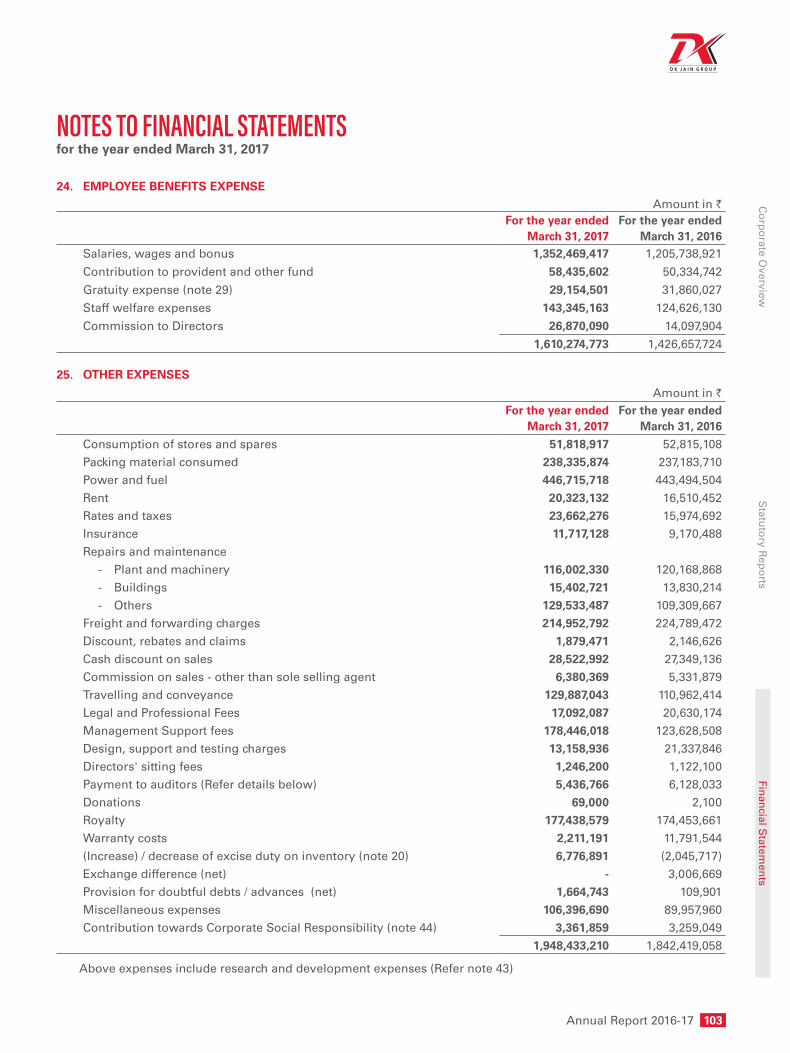
Annual Report 2016-17 103
Co
rpo
rate Overview
Statu
tory R
epo
rtsFin
ancial S
tatemen
ts
notes to fInAncIAl stAtements for the year ended March 31, 2017
24. EMPLOYEE BENEFItS EXPENSEAmount in `
For the year ended March 31, 2017
For the year endedMarch 31, 2016
Salaries, wages and bonus 1,352,469,417 1,205,738,921
Contribution to provident and other fund 58,435,602 50,334,742
Gratuity expense (note 29) 29,154,501 31,860,027
Staff welfare expenses 143,345,163 124,626,130
Commission to Directors 26,870,090 14,097,904
1,610,274,773 1,426,657,724
25. OthER EXPENSES
Amount in `For the year ended
March 31, 2017For the year ended
March 31, 2016
Consumption of stores and spares 51,818,917 52,815,108 Packing material consumed 238,335,874 237,183,710 Power and fuel 446,715,718 443,494,504 Rent 20,323,132 16,510,452 Rates and taxes 23,662,276 15,974,692 Insurance 11,717,128 9,170,488 Repairs and maintenance - Plant and machinery 116,002,330 120,168,868 - Buildings 15,402,721 13,830,214 - Others 129,533,487 109,309,667 Freight and forwarding charges 214,952,792 224,789,472 Discount, rebates and claims 1,879,471 2,146,626 Cash discount on sales 28,522,992 27,349,136 Commission on sales - other than sole selling agent 6,380,369 5,331,879 Travelling and conveyance 129,887,043 110,962,414 Legal and Professional Fees 17,092,087 20,630,174 Management Support fees 178,446,018 123,628,508 Design, support and testing charges 13,158,936 21,337,846 Directors' sitting fees 1,246,200 1,122,100 Payment to auditors (Refer details below) 5,436,766 6,128,033 Donations 69,000 2,100 Royalty 177,438,579 174,453,661 Warranty costs 2,211,191 11,791,544 (Increase) / decrease of excise duty on inventory (note 20) 6,776,891 (2,045,717)Exchange difference (net) - 3,006,669 Provision for doubtful debts / advances (net) 1,664,743 109,901 Miscellaneous expenses 106,396,690 89,957,960 Contribution towards Corporate Social Responsibility (note 44) 3,361,859 3,259,049
1,948,433,210 1,842,419,058
Above expenses include research and development expenses (Refer note 43)
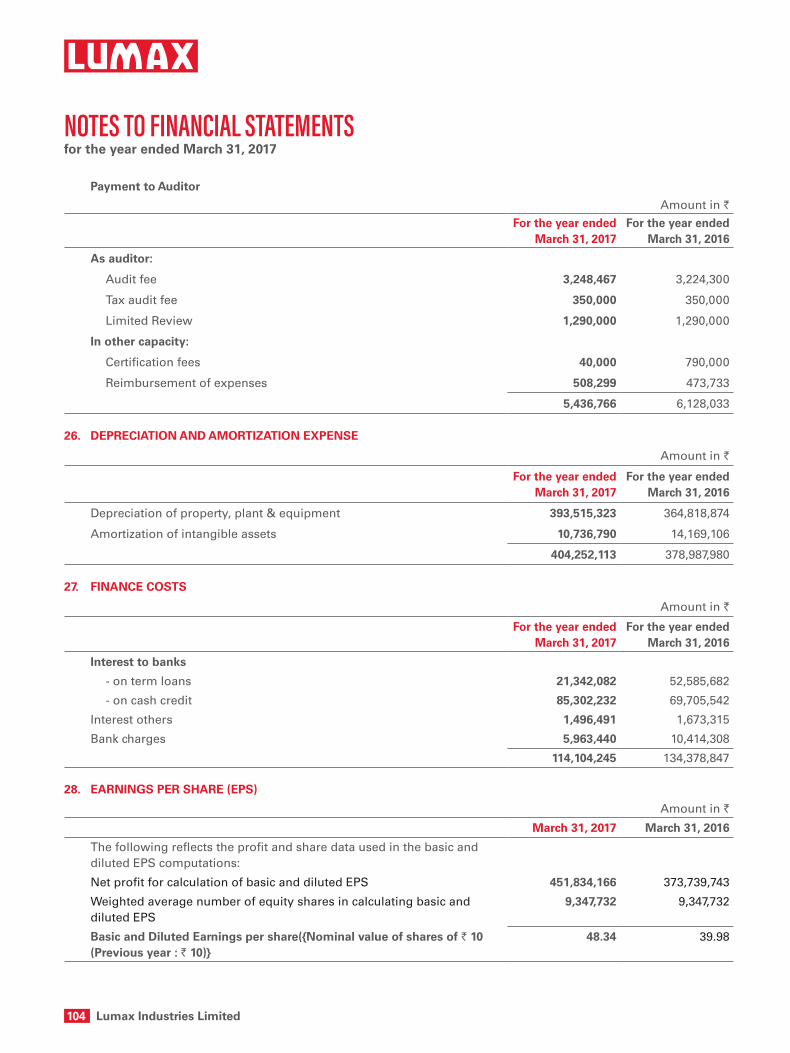
104 Lumax Industries Limited
notes to fInAncIAl stAtements for the year ended March 31, 2017
Payment to Auditor
Amount in `
For the year ended March 31, 2017
For the year endedMarch 31, 2016
As auditor:
Audit fee 3,248,467 3,224,300
Tax audit fee 350,000 350,000
Limited Review 1,290,000 1,290,000
In other capacity:
Certification fees 40,000 790,000
Reimbursement of expenses 508,299 473,733
5,436,766 6,128,033
26. DEPRECIAtION AND AMORtIzAtION EXPENSE
Amount in `
For the year ended March 31, 2017
For the year endedMarch 31, 2016
Depreciation of property, plant & equipment 393,515,323 364,818,874
Amortization of intangible assets 10,736,790 14,169,106
404,252,113 378,987,980
27. FINANCE COStS
Amount in `
For the year ended March 31, 2017
For the year endedMarch 31, 2016
Interest to banks
- on term loans 21,342,082 52,585,682
- on cash credit 85,302,232 69,705,542
Interest others 1,496,491 1,673,315
Bank charges 5,963,440 10,414,308
114,104,245 134,378,847
28. EARNINGS PER ShARE (EPS)
Amount in `
March 31, 2017 March 31, 2016
The following reflects the profit and share data used in the basic and diluted EPS computations:
Net profit for calculation of basic and diluted EPS 451,834,166 373,739,743
Weighted average number of equity shares in calculating basic and diluted EPS
9,347,732 9,347,732
Basic and Diluted Earnings per share({Nominal value of shares of ` 10 (Previous year : ` 10)}
48.34 39.98
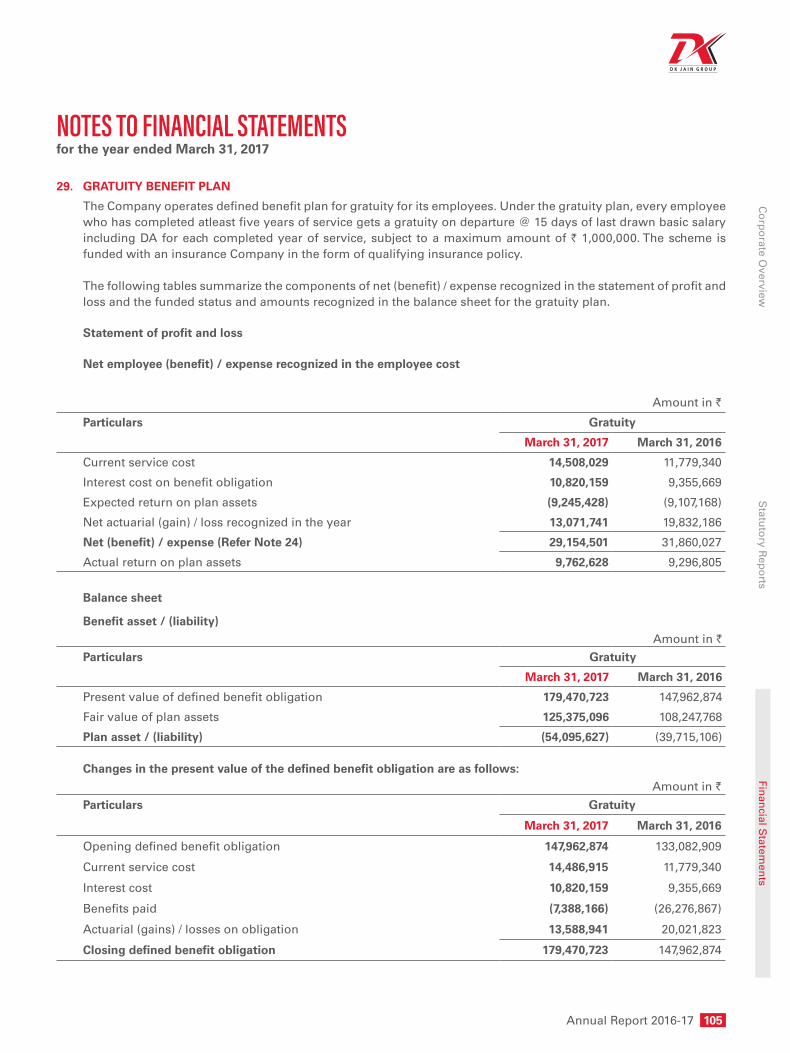
Annual Report 2016-17 105
Co
rpo
rate Overview
Statu
tory R
epo
rtsFin
ancial S
tatemen
ts
notes to fInAncIAl stAtements for the year ended March 31, 2017
29. GRAtUItY BENEFIt PLAN
The Company operates defined benefit plan for gratuity for its employees. Under the gratuity plan, every employee who has completed atleast five years of service gets a gratuity on departure @ 15 days of last drawn basic salary including DA for each completed year of service, subject to a maximum amount of ` 1,000,000. The scheme is funded with an insurance Company in the form of qualifying insurance policy.
The following tables summarize the components of net (benefit) / expense recognized in the statement of profit and loss and the funded status and amounts recognized in the balance sheet for the gratuity plan.
Statement of profit and loss
Net employee (benefit) / expense recognized in the employee cost
Amount in `
Particulars Gratuity
March 31, 2017 March 31, 2016
Current service cost 14,508,029 11,779,340
Interest cost on benefit obligation 10,820,159 9,355,669
Expected return on plan assets (9,245,428) (9,107,168)
Net actuarial (gain) / loss recognized in the year 13,071,741 19,832,186
Net (benefit) / expense (Refer Note 24) 29,154,501 31,860,027
Actual return on plan assets 9,762,628 9,296,805
Balance sheet
Benefit asset / (liability)Amount in `
Particulars Gratuity
March 31, 2017 March 31, 2016
Present value of defined benefit obligation 179,470,723 147,962,874
Fair value of plan assets 125,375,096 108,247,768
Plan asset / (liability) (54,095,627) (39,715,106)
Changes in the present value of the defined benefit obligation are as follows:Amount in `
Particulars Gratuity
March 31, 2017 March 31, 2016
Opening defined benefit obligation 147,962,874 133,082,909
Current service cost 14,486,915 11,779,340
Interest cost 10,820,159 9,355,669
Benefits paid (7,388,166) (26,276,867)
Actuarial (gains) / losses on obligation 13,588,941 20,021,823
Closing defined benefit obligation 179,470,723 147,962,874

106 Lumax Industries Limited
notes to fInAncIAl stAtements for the year ended March 31, 2017
Changes in the fair value of plan assets are as follows:
Amount in `
Particulars Gratuity
March 31, 2017 March 31, 2016
Opening fair value of plan assets 108,247,768 118,663,555
Expected return 9,245,428 9,107,168
Contributions by employer 14,774,092 6,179,474
Benefits paid (7,409,392) (25,892,066)
Actuarial gains / (losses) 517,200 189,637
Closing fair value of plan assets 125,375,096 108,247,768
The Company expects to contribute ` 39,206,270 to gratuity in the next year (Previous year: ` 14,789,453).
the major categories of plan assets as a percentage of the fair value of total plan assets are as follows:
Particulars Gratuity
March 31, 2017 March 31, 2016
Investments with insurer 100% 100%
the principal assumptions used in determining gratuity obligation for the Company’s plans are shown below:
Particulars Gratuity
March 31, 2017 March 31, 2016
Discount rate 7.50% 7.80%
Expected rate of return on assets 8.26% 8.37%
Attrition rate / Employee turnover 5.00% 5.00%
The estimates of future salary increases, considered in actuarial valuation, take account of inflation, seniority, promotion and other relevant factors, such as supply and demand in the employment market.
The overall expected rate of return on assets is determined based on the market prices prevailing on that date, applicable to the period over which the obligation is to be settled.
Amounts for the current and previous four periods are as follows:
Amount in `
Particulars March 31, 2017 March 31, 2016 March 31, 2015 March 31, 2014 March 31, 2013
Gratuity
Defined benefit obligation 179,470,723 147,962,874 133,082,909 112,940,497 103,391,956
Plan assets 125,375,096 108,247,768 118,663,555 102,954,582 87,213,530
Surplus / (deficit) (54,095,627) (39,715,106) (14,419,354) (9,985,915) (16,178,426)
Experience adjustments on plan liabilities
13,588,941 20,021,823 6,927,756 2,769,944 2,796,180
Experience adjustments on plan assets
517,200 189,637 412,378 490,903 449,071
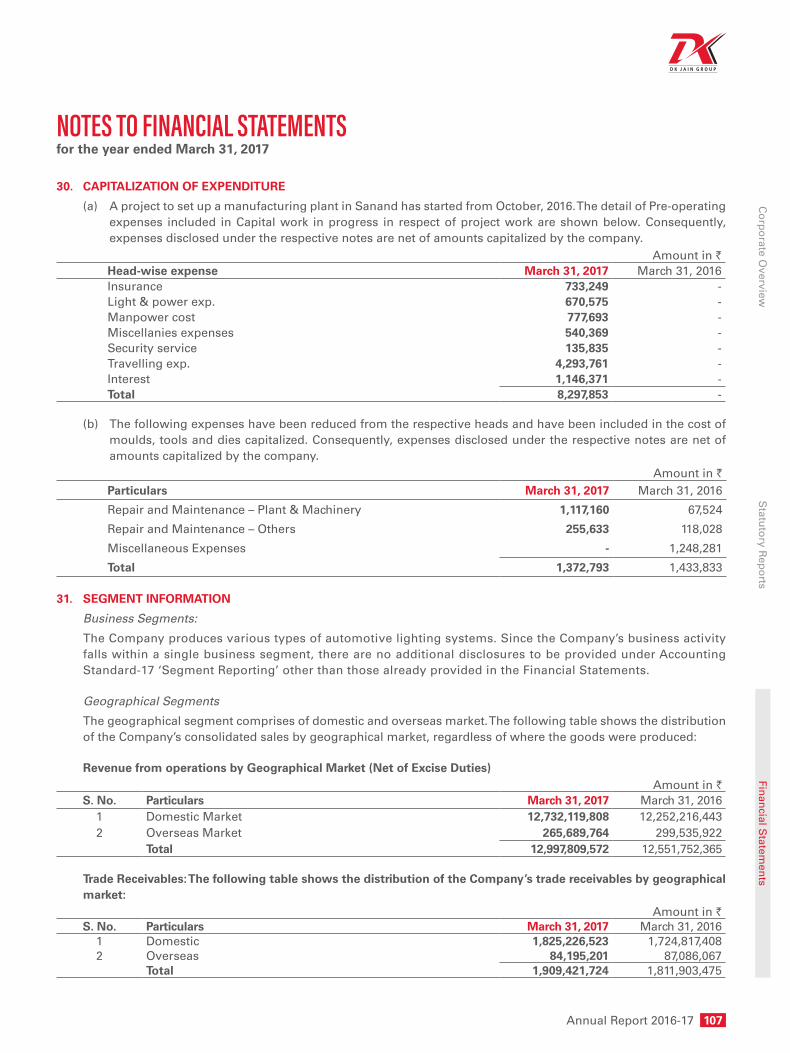
Annual Report 2016-17 107
Co
rpo
rate Overview
Statu
tory R
epo
rtsFin
ancial S
tatemen
ts
notes to fInAncIAl stAtements for the year ended March 31, 2017
30. CAPItALIzAtION OF EXPENDItURE
(a) A project to set up a manufacturing plant in Sanand has started from October, 2016. The detail of Pre-operating expenses included in Capital work in progress in respect of project work are shown below. Consequently, expenses disclosed under the respective notes are net of amounts capitalized by the company.
Amount in `head-wise expense March 31, 2017 March 31, 2016Insurance 733,249 -Light & power exp. 670,575 -Manpower cost 777,693 -Miscellanies expenses 540,369 -Security service 135,835 -Travelling exp. 4,293,761 -Interest 1,146,371 -total 8,297,853 -
(b) The following expenses have been reduced from the respective heads and have been included in the cost of moulds, tools and dies capitalized. Consequently, expenses disclosed under the respective notes are net of amounts capitalized by the company.
Amount in `Particulars March 31, 2017 March 31, 2016
Repair and Maintenance – Plant & Machinery 1,117,160 67,524
Repair and Maintenance – Others 255,633 118,028
Miscellaneous Expenses - 1,248,281
total 1,372,793 1,433,833
31. SEGMENt INFORMAtION
Business Segments:
The Company produces various types of automotive lighting systems. Since the Company’s business activity falls within a single business segment, there are no additional disclosures to be provided under Accounting Standard-17 ‘Segment Reporting’ other than those already provided in the Financial Statements.
Geographical Segments
The geographical segment comprises of domestic and overseas market. The following table shows the distribution of the Company’s consolidated sales by geographical market, regardless of where the goods were produced:
Revenue from operations by Geographical Market (Net of Excise Duties)Amount in `
S. No. Particulars March 31, 2017 March 31, 20161 Domestic Market 12,732,119,808 12,252,216,4432 Overseas Market 265,689,764 299,535,922
total 12,997,809,572 12,551,752,365
trade Receivables: the following table shows the distribution of the Company’s trade receivables by geographical market:
Amount in `S. No. Particulars March 31, 2017 March 31, 2016
1 Domestic 1,825,226,523 1,724,817,4082 Overseas 84,195,201 87,086,067
total 1,909,421,724 1,811,903,475

108 Lumax Industries Limited
notes to fInAncIAl stAtements for the year ended March 31, 2017
32. RELAtED PARtY DISCLOSURES
Names of related parties and related party relationship
A. Related parties under AS-18 with whom transactions have taken place during the year.
S. No. Particulars Name of Related Parties
1. Enterprise having significant influence Stanley Electric Co. Ltd., Japan
2. Associate SL Lumax Limited
3. Key Management Personnel Mr. D. K. Jain (Chairman)
Mr. Deepak Jain (Managing Director)
Mr. Anmol Jain (Joint Managing Director)
Mr. E. Hirooka (Sr. Executive Director)
Mr. N. Sato (Executive Director)
Mr. K Sawada (Executive Director)
4. Enterprise owned or significantly influenced by Key Management Personnel or their Relatives
Lumax Auto Technologies Limited
Lumax DK Auto Industries Limited
Lumax Tours & Travels Limited
Lumax Ancillary Limited
Mahavir Udyog
Bharat Enterprises
Lumax Cornaglia Auto Technologies Private Limited
Lumax Mannoh Allied Technologies Limited
Lumax Management Services Private Limited
Lumax Energy Solutions Private Limited
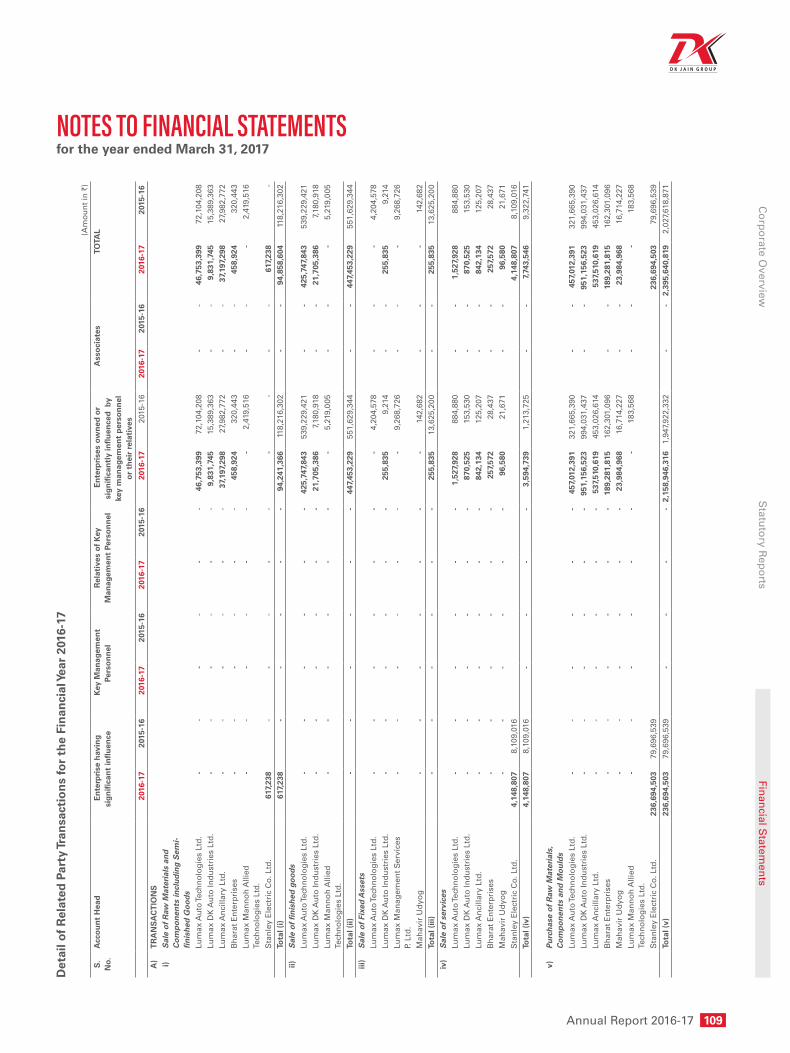
Annual Report 2016-17 109
Co
rpo
rate Overview
Statu
tory R
epo
rtsFin
ancial S
tatemen
ts
notes to fInAncIAl stAtements for the year ended March 31, 2017
Det
ail o
f R
elat
ed P
arty
tran
sact
ion
s fo
r th
e Fi
nan
cial
Yea
r 20
16-1
7
(Am
ou
nt
in `
)
S.
No.
Acc
ou
nt
hea
d E
nte
rpri
se h
avin
g
sig
nifi
can
t in
flu
ence
K
ey M
anag
emen
t Pe
rso
nn
el
Rel
ativ
es o
f K
ey
Man
agem
ent
Pers
on
nel
En
terp
rise
s ow
ned
or
sig
nifi
can
tly
infl
uen
ced
by
key
man
agem
ent
per
son
nel
o
r th
eir
rela
tive
s
Ass
oci
ates
tO
tAL
201
6-17
2
015-
16
201
6-17
2
015-
16
201
6-17
2
015-
16
201
6-17
2
015-
16
201
6-17
2
015-
16
201
6-17
2
015-
16
A)
tR
AN
SA
Ct
ION
Si)
Sal
e o
f R
aw M
ater
ials
an
d
Co
mp
on
ents
incl
ud
ing
Sem
i-fi
nis
hed
Go
od
s
Lum
ax A
uto
Tech
no
log
ies
Ltd
.-
--
--
-46
,753
,399
72,1
04,2
08-
-46
,753
,399
72,1
04,2
08
Lum
ax D
K A
uto
Ind
ust
ries
Ltd
. -
--
--
-9,
831,
745
15,3
89,3
63-
-9,
831,
745
15,3
89,3
63
Lum
ax A
nci
llary
Ltd
.-
--
--
-37
,197
,298
27,9
82,7
72-
-37
,197
,298
27,9
82,7
72
Bh
arat
En
terp
rise
s-
--
--
-45
8,92
432
0,44
3-
-45
8,92
432
0,44
3
Lum
ax M
ann
oh
Alli
ed
Tech
no
log
ies
Ltd
.-
--
--
--
2,41
9,51
6-
--
2,41
9,51
6
S
tan
ley
Ele
ctri
c C
o. L
td.
617,
238
--
--
--
--
-61
7,23
8-
to
tal (
i)61
7,23
8-
--
--
94,2
41,3
6611
8,21
6,30
2-
-94
,858
,604
118,
216,
302
ii)S
ale
of
fin
ish
ed g
oo
ds
Lu
max
Au
to Te
chn
olo
gie
s Lt
d.
--
--
--
425,
747,
843
539,
229,
421
--
425,
747,
843
539,
229,
421
Lu
max
DK
Au
to In
du
stri
es L
td.
--
--
--
21,7
05,3
867,
180,
918
--
21,7
05,3
867,
180,
918
Lu
max
Man
no
h A
llied
Te
chn
olo
gie
s Lt
d.
--
--
--
-5,
219,
005
--
-5,
219,
005
to
tal (
ii)-
--
--
-44
7,45
3,22
955
1,62
9,34
4-
-44
7,45
3,22
955
1,62
9,34
4iii
)S
ale
of
Fixe
d A
sset
s
Lum
ax A
uto
Tech
no
log
ies
Ltd
.-
--
--
--
4,20
4,57
8-
--
4,20
4,57
8
Lum
ax D
K A
uto
Ind
ust
ries
Ltd
. -
--
--
-25
5,83
59,
214
--
255,
835
9,21
4
Lum
ax M
anag
emen
t S
ervi
ces
P. L
td.
--
--
--
-9,
268,
726
--
-9,
268,
726
M
ahav
ir U
dyo
g-
--
--
--
142,
682
--
-14
2,68
2
tota
l (iii
)-
--
--
-25
5,83
513
,625
,200
--
255,
835
13,6
25,2
00iv
)S
ale
of
serv
ices
Lu
max
Au
to Te
chn
olo
gie
s Lt
d.
--
--
--
1,52
7,92
888
4,88
0-
-1,
527,
928
884,
880
Lu
max
DK
Au
to In
du
stri
es L
td.
--
--
--
870,
525
153,
530
--
870,
525
153,
530
Lu
max
An
cilla
ry L
td.
--
--
--
842,
134
125,
207
--
842,
134
125,
207
B
har
at E
nte
rpri
ses
--
--
--
257,
572
28,4
37-
-25
7,57
228
,437
M
ahav
ir U
dyo
g-
--
--
-96
,580
21,6
71-
-96
,580
21,6
71
Sta
nle
y E
lect
ric
Co
. Ltd
.4,
148,
807
8,10
9,01
64,
148,
807
8,10
9,01
6
tota
l (iv
)4,
148,
807
8,10
9,01
6-
--
-3,
594,
739
1,21
3,72
5-
-7,
743,
546
9,32
2,74
1
v)
Pu
rch
ase
of
Raw
Mat
eria
ls,
Co
mp
on
ents
an
d M
ou
lds
Lu
max
Au
to Te
chn
olo
gie
s Lt
d.
--
--
--
457,
012,
391
321,
665,
390
--
457,
012,
391
321,
665,
390
Lu
max
DK
Au
to In
du
stri
es L
td.
--
--
--
951,
156,
523
994,
031,
437
--
951,
156,
523
994,
031,
437
Lu
max
An
cilla
ry L
td.
--
--
--
537,
510,
619
453,
026,
614
537,
510,
619
453,
026,
614
B
har
at E
nte
rpri
ses
--
--
--
189,
281,
815
162,
301,
096
--
189,
281,
815
162,
301,
096
M
ahav
ir U
dyo
g-
--
--
-23
,984
,968
16,7
14,2
27-
-23
,984
,968
16,7
14,2
27
Lum
ax M
ann
oh
Alli
ed
Tech
no
log
ies
Ltd
.-
--
--
--
183,
568
--
-18
3,56
8
S
tan
ley
Ele
ctri
c C
o. L
td.
236,
694,
503
79,6
96,5
3923
6,69
4,50
379
,696
,539
to
tal (
v)23
6,69
4,50
379
,696
,539
--
--
2,15
8,94
6,31
61,
947,
922,
332
--
2,39
5,64
0,81
92,
027,
618,
871

110 Lumax Industries Limited
notes to fInAncIAl stAtements for the year ended March 31, 2017
(Am
ou
nt
in `
)
S.
No.
Acc
ou
nt
hea
d E
nte
rpri
se h
avin
g
sig
nifi
can
t in
flu
ence
K
ey M
anag
emen
t Pe
rso
nn
el
Rel
ativ
es o
f K
ey
Man
agem
ent
Pers
on
nel
En
terp
rise
s ow
ned
or
sig
nifi
can
tly
infl
uen
ced
by
key
man
agem
ent
per
son
nel
o
r th
eir
rela
tive
s
Ass
oci
ates
tO
tAL
201
6-17
2
015-
16
201
6-17
2
015-
16
201
6-17
2
015-
16
201
6-17
2
015-
16
201
6-17
2
015-
16
201
6-17
2
015-
16
vi)
Pu
rch
ase
of
Pack
ing
Mat
eria
l (n
et)
M
ahav
ir U
dyo
g-
--
--
-15
2,53
9,22
413
4,94
2,33
4-
-15
2,53
9,22
413
4,94
2,33
4
to
tal (
vi)
--
--
--
152,
539,
224
134,
942,
334
--
152,
539,
224
134,
942,
334
vii)
Pu
rch
ase
of
Sp
ares
& S
amp
les
Lu
max
En
erg
y S
olu
tio
ns
P. L
td.
--
--
--
1,63
3,47
5-
--
1,63
3,47
5-
Lu
max
DK
Au
to In
du
stri
es L
td.
--
--
--
-1,
323,
688
--
-1,
323,
688
S
tan
ley
Ele
ctri
c C
o. L
td.
103,
950
756,
282
103,
950
756,
282
to
tal (
vii)
103,
950
756,
282
--
--
1,63
3,47
51,
323,
688
--
1,73
7,42
52,
079,
970
viii)
Pu
rch
ase
of
Fixe
d A
sset
s
Lu
max
Au
to Te
chn
olo
gie
s Lt
d.
--
--
--
66,2
20-
--
66,2
20-
Lu
max
Man
agem
ent
Ser
vice
s P.
Ltd
.-
--
--
-86
1,27
8-
--
861,
278
-
S
tan
ley
Ele
ctri
c C
o. L
td.
14,0
89,5
35-
--
--
--
--
14,0
89,5
35-
to
tal (
viii)
14,0
89,5
35-
--
--
927,
498
--
-15
,017
,033
-
ix)
Pu
rch
ase
of
Fin
ish
ed G
oo
ds
S
tan
ley
Ele
ctri
c C
o. L
td.
-46
,570
--
--
--
--
-46
,570
to
tal (
ix)
-46
,570
--
--
--
--
-46
,570
x)P
urc
has
e O
f S
ervi
ces
Lu
max
Tou
rs &
Tra
vels
Ltd
.-
--
--
-45
,127
,109
39,3
19,3
16-
-45
,127
,109
39,3
19,3
16
to
tal (
x)-
--
--
-45
,127
,109
39,3
19,3
16-
-45
,127
,109
39,3
19,3
16
xi)
tech
nic
al C
har
ges
D
esig
n, D
raw
ing
& te
stin
g C
hg
.
S
tan
ley
Ele
ctri
c C
o. L
td.
202,
427,
752
130,
061,
632
--
--
--
--
202,
427,
752
130,
061,
632
Lu
max
Man
no
h A
llied
Te
chn
olo
gie
s Lt
d.
--
--
--
-37
,791
--
-37
,791
M
anag
emen
t S
up
po
rt F
ee
S
tan
ley
Ele
ctri
c C
o. L
td.
80,1
14,1
8861
,104
,275
--
--
--
--
80,1
14,1
8861
,104
,275
Lu
max
Man
agem
ent
Ser
vice
s P.
Ltd
.-
--
--
-11
2,06
2,14
471
,283
,579
--
112,
062,
144
71,2
83,5
79
to
tal (
xi)
282,
541,
940
191,
165,
907
--
--
112,
062,
144
71,3
21,3
70-
-39
4,60
4,08
426
2,48
7,27
7
xii)
Ren
t R
ecei
ved
Lu
max
Au
to Te
chn
olo
gie
s Lt
d.
--
--
--
6,55
8,65
49,
206,
993
--
6,55
8,65
49,
206,
993
Lu
max
Tou
rs &
Tra
vels
Ltd
.-
--
--
-24
9,48
822
5,06
3-
-24
9,48
822
5,06
3
Lu
max
DK
Au
to In
du
stri
es L
td.
--
--
--
332,
644
300,
079
--
332,
644
300,
079
Lu
max
En
erg
y S
olu
tio
ns
P. L
td.
--
--
--
34,3
7314
,313
--
34,3
7314
,313
Lu
max
Co
rnag
lia A
uto
Te
chn
olo
gie
s P.
Ltd
.-
--
--
-4,
716,
180
4,44
1,84
0-
-4,
716,
180
4,44
1,84
0
to
tal (
xii)
--
--
--
11,8
91,3
3914
,188
,288
--
11,8
91,3
3914
,188
,288
xiii)
Div
iden
d R
ecei
ved
S
L Lu
max
Ltd
.-
--
--
--
-4,
948,
389
4,94
8,38
94,
948,
389
4,94
8,38
9
to
tal (
xiii)
--
--
--
--
4,94
8,38
94,
948,
389
4,94
8,38
94,
948,
389
xiv)
Ren
t Pa
id
M
r. D
. K. J
ain
--
1,63
8,75
11,
640,
896
--
--
--
1,63
8,75
11,
640,
896
Lu
max
DK
Au
to In
du
stri
es L
td.
--
--
--
15,6
13,9
3813
,734
,595
--
15,6
13,9
3813
,734
,595
to
tal (
xiv)
--
1,63
8,75
11,
640,
896
--
15,6
13,9
3813
,734
,595
--
17,2
52,6
8915
,375
,491

Annual Report 2016-17 111
Co
rpo
rate Overview
Statu
tory R
epo
rtsFin
ancial S
tatemen
ts
notes to fInAncIAl stAtements for the year ended March 31, 2017
(Am
ou
nt
in `
)
S.
No.
Acc
ou
nt
hea
d E
nte
rpri
se h
avin
g
sig
nifi
can
t in
flu
ence
K
ey M
anag
emen
t Pe
rso
nn
el
Rel
ativ
es o
f K
ey
Man
agem
ent
Pers
on
nel
En
terp
rise
s ow
ned
or
sig
nifi
can
tly
infl
uen
ced
by
key
man
agem
ent
per
son
nel
o
r th
eir
rela
tive
s
Ass
oci
ates
tO
tAL
201
6-17
2
015-
16
201
6-17
2
015-
16
201
6-17
2
015-
16
201
6-17
2
015-
16
201
6-17
2
015-
16
201
6-17
2
015-
16
xv)
Man
ager
ial R
emu
ner
atio
n
M
r. D
eep
ak J
ain
--
13,3
67,5
1011
,495
,966
--
--
--
13,3
67,5
1011
,495
,966
M
r. A
nm
ol J
ain
--
5,36
6,40
55,
366,
405
--
--
--
5,36
6,40
55,
366,
405
M
r. E
. Hir
oo
ka-
-2,
080,
246
2,22
0,41
2-
--
--
-2,
080,
246
2,22
0,41
2
M
r. N
. Sat
o (
up
to 0
8.08
.16)
--
757,
979
2,45
8,62
3-
--
--
-75
7,97
92,
458,
623
M
r. K
Saw
ada
( w
ef. 0
9.08
.16)
--
798,
239
--
--
--
-79
8,23
9-
to
tal (
xv)
--
22,3
70,3
7921
,541
,406
--
--
--
22,3
70,3
7921
,541
,406
xvi)
Co
mm
issi
on
to
Dir
ecto
r
M
r. D
. K. J
ain
--
5,96
9,37
14,
560,
511
--
--
--
5,96
9,37
14,
560,
511
M
r. D
eep
ak J
ain
--
14,9
31,3
479,
750,
189
--
--
--
14,9
31,3
479,
750,
189
M
r. A
nm
ol J
ain
--
11,9
38,7
434,
347,
715
--
--
--
11,9
38,7
434,
347,
715
to
tal (
xvi)
--
32,8
39,4
6118
,658
,415
--
--
--
32,8
39,4
6118
,658
,415
xvii)
Roy
alty
S
tan
ley
Ele
ctri
c C
o. L
td.
177,
438,
579
174,
453,
661
--
--
--
--
177,
438,
579
174,
453,
661
to
tal (
xvii)
177,
438,
579
174,
453,
661
--
--
--
--
177,
438,
579
174,
453,
661
xviii
)D
ivid
end
Pai
d
M
r. D
. K. J
ain
--
-33
,915
,438
--
--
--
-33
,915
,438
M
r. D
eep
ak J
ain
--
-2,
392,
443
--
--
--
-2,
392,
443
M
r. A
nm
ol J
ain
--
-94
1,11
5-
--
--
--
941,
115
M
r. M
. K. J
ain
--
--
-10
,500
--
--
-10
,500
M
r. U
. K. J
ain
--
--
-27
,265
--
--
-27
,265
M
rs. U
sha
Jain
--
--
-2,
528,
453
--
--
-2,
528,
453
D
K J
ain
an
d S
on
s (H
UF)
--
--
--
-2,
186,
975
--
-2,
186,
975
Lu
max
Au
to Te
chn
olo
gie
s Lt
d.
--
--
--
-9,
187,
500
--
-9,
187,
500
Lu
max
Fin
ance
Pvt
. Ltd
.-
--
--
--
7,30
1,92
8-
--
7,30
1,92
8
Lu
max
Au
tom
oti
ve S
yste
ms
Ltd
.-
--
--
--
18,9
00-
--
18,9
00
S
tan
ley
Ele
ctri
c C
o. L
td.
-58
,509
,168
--
--
--
--
-58
,509
,168
Oth
ers
--
--
-49
0,52
5-
--
--
490,
525
to
tal (
xviii
)-
58,5
09,1
68-
37,2
48,9
96-
3,05
6,74
3-
18,6
95,3
03-
--
117,
510,
210
xix)
Oth
ers
(Net
)
Lu
max
Au
to Te
chn
olo
gie
s Lt
d.
--
--
--
(496
,269
)(7
77,2
16)
--
(496
,269
)(7
77,2
16)
Lu
max
DK
Au
to In
du
stri
es L
td.
--
--
--
(281
,894
)(5
08,3
03)
--
(281
,894
)(5
08,3
03)
Lu
max
An
cilla
ry L
td.
--
--
--
(123
,179
)(2
92,8
02)
--
(123
,179
)(2
92,8
02)
Lu
max
Au
tom
oti
ve S
yste
m L
td.
--
--
--
-87
5,08
8-
--
875,
088
Lu
max
Man
agem
ent
Ser
vice
s P.
Ltd
.-
--
--
-(4
,564
,984
)(2
68,9
04)
--
(4,5
64,9
84)
(268
,904
)
Lu
max
Man
no
h A
llied
Te
chn
olo
gie
s Lt
d.
--
--
--
(30,
659)
(61,
612)
--
(30,
659)
(61,
612)
Lu
max
En
erg
y S
olu
tio
ns
P. L
td.
--
--
--
-(7
69,5
86)
--
-(7
69,5
86)
M
ahav
ir U
dyo
g-
-(4
71)
--
-(4
71)
-
S
tan
ley
Ele
ctri
c C
o. L
td.
3,85
8,94
11,
605,
617
--
--
--
--
3,85
8,94
11,
605,
617
to
tal (
xix)
3,85
8,94
11,
605,
617
--
--
(5,4
97,4
56)
(1,8
03,3
35)
--
(1,6
38,5
15)
(197
,718
)

112 Lumax Industries Limited
notes to fInAncIAl stAtements for the year ended March 31, 2017
(Am
ou
nt
in `
)
S.
No.
Acc
ou
nt
hea
d E
nte
rpri
se h
avin
g
sig
nifi
can
t in
flu
ence
K
ey M
anag
emen
t Pe
rso
nn
el
Rel
ativ
es o
f K
ey
Man
agem
ent
Pers
on
nel
En
terp
rise
s ow
ned
or
sig
nifi
can
tly
infl
uen
ced
by
key
man
agem
ent
per
son
nel
o
r th
eir
rela
tive
s
Ass
oci
ates
tO
tAL
201
6-17
2
015-
16
201
6-17
2
015-
16
201
6-17
2
015-
16
201
6-17
2
015-
16
201
6-17
2
015-
16
201
6-17
2
015-
16
xx)
Leav
e Li
abili
ty &
Gra
tuty
Tr
ansf
er
Lu
max
Man
agem
ent
Ser
vice
s P.
Ltd
.-
--
--
--
(20,
502,
525)
--
-(2
0,50
2,52
5)
to
tal (
xx)
--
--
--
-(2
0,50
2,52
5)-
--
(20,
502,
525)
B)
BA
LAN
CE
S A
T T
HE
YE
AR
EN
D
i) R
ecei
vab
les
Lu
max
Au
to Te
chn
olo
gie
s Lt
d.
--
--
--
155,
995,
198
178,
079,
135
--
155,
995,
198
178,
079,
135
Lu
max
DK
Au
to In
du
stri
es L
td.
--
--
--
5,77
9,72
612
,070
,974
--
5,77
9,72
612
,070
,974
Lu
max
Co
rnag
lia A
uto
Te
chn
olo
gie
s P.
Ltd
.-
--
--
-78
6,60
067
9,25
0-
-78
6,60
067
9,25
0
Lu
max
Tou
rs &
Tra
vels
Ltd
.-
--
--
-1,
815
34,2
56-
-1,
815
34,2
56
Lu
max
An
cilla
ry L
td.
--
--
--
8,17
0,72
94,
302,
198
--
8,17
0,72
94,
302,
198
B
har
at E
nte
rpri
ses
--
--
--
79,2
7167
,683
--
79,2
7167
,683
Lu
max
Man
no
h A
llied
Te
chn
olo
gie
s Lt
d.
--
--
--
-99
4,54
6-
--
994,
546
Lu
max
En
erg
y S
olu
tio
ns
P. L
td.
--
--
--
2,87
6-
--
2,87
6-
to
tal (
i)
--
--
--
170,
816,
215
196,
228,
042
--
170,
816,
215
196,
228,
042
ii) P
ayab
les
Lu
max
Au
to Te
chn
olo
gie
s Lt
d.
--
--
--
195,
615,
016
138,
657,
020
--
195,
615,
016
138,
657,
020
Lu
max
DK
Au
to In
du
stri
es L
td.
--
--
--
376,
548,
602
349,
492,
019
--
376,
548,
602
349,
492,
019
Lu
max
Man
no
h A
llied
Te
chn
olo
gie
s Lt
d.
--
--
--
-9,
848
--
-9,
848
Lu
max
Tou
rs &
Tra
vels
Ltd
.-
--
--
-2,
248,
837
3,79
2,53
5-
-2,
248,
837
3,79
2,53
5
Lu
max
An
cilla
ry L
td.
--
--
--
135,
722,
094
120,
045,
127
--
135,
722,
094
120,
045,
127
B
har
at E
nte
rpri
ses
--
--
--
47,2
33,8
6245
,088
,996
--
47,2
33,8
6245
,088
,996
M
ahav
ir U
dyo
g-
--
--
-47
,652
,861
46,2
39,3
26-
-47
,652
,861
46,2
39,3
26
Lu
max
Man
agem
ent
Ser
vice
s P.
Ltd
.-
--
--
-8,
319,
759
15,4
00,8
57-
-8,
319,
759
15,4
00,8
57
Lu
max
En
erg
y S
olu
tio
ns
P. L
td.
--
--
--
266,
233
769,
586
--
266,
233
769,
586
S
tan
ley
Ele
ctri
c C
o. L
td.
392,
528,
252
153,
620,
892
--
--
--
--
392,
528,
252
153,
620,
892
to
tal (
ii)
392,
528,
252
153,
620,
892
- -
- -
813,
607,
264
719,
495,
314
--
,206
,135
,516
87
3,11
6,20
6
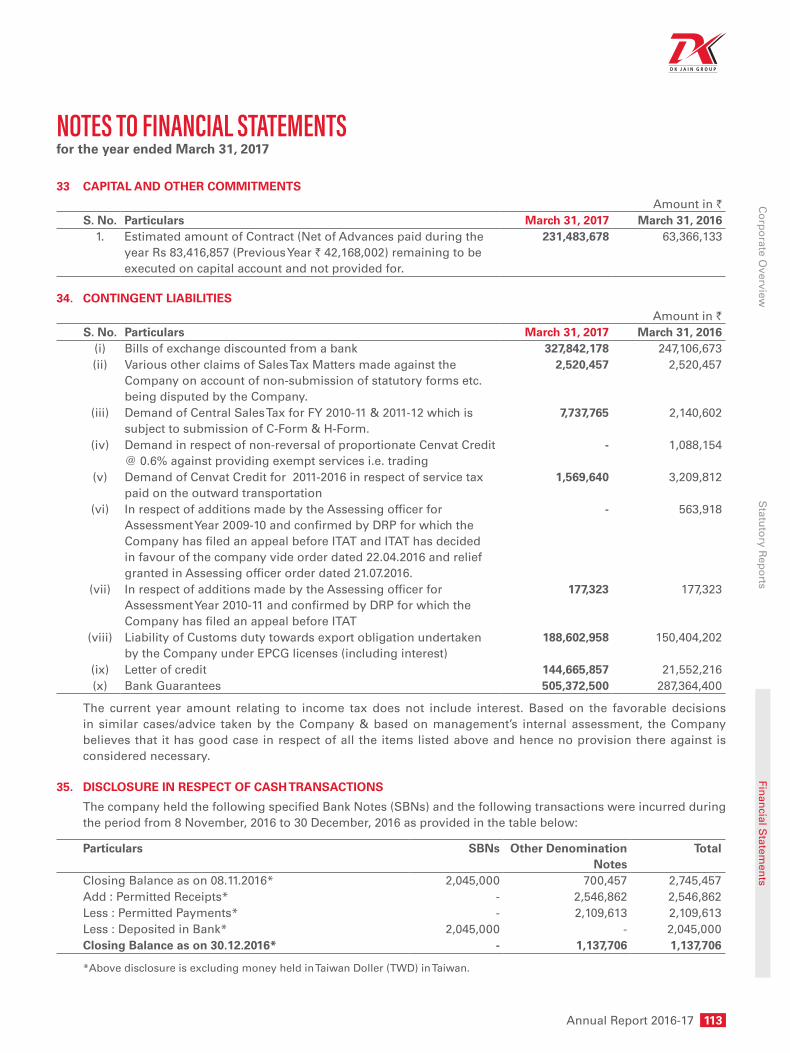
Annual Report 2016-17 113
Co
rpo
rate Overview
Statu
tory R
epo
rtsFin
ancial S
tatemen
ts
notes to fInAncIAl stAtements for the year ended March 31, 2017
33 CAPItAL AND OthER COMMItMENtSAmount in `
S. No. Particulars March 31, 2017 March 31, 20161. Estimated amount of Contract (Net of Advances paid during the
year Rs 83,416,857 (Previous Year ` 42,168,002) remaining to be executed on capital account and not provided for.
231,483,678 63,366,133
34. CONtINGENt LIABILItIESAmount in `
S. No. Particulars March 31, 2017 March 31, 2016(i) Bills of exchange discounted from a bank 327,842,178 247,106,673(ii) Various other claims of Sales Tax Matters made against the
Company on account of non-submission of statutory forms etc. being disputed by the Company.
2,520,457 2,520,457
(iii) Demand of Central Sales Tax for FY 2010-11 & 2011-12 which is subject to submission of C-Form & H-Form.
7,737,765 2,140,602
(iv) Demand in respect of non-reversal of proportionate Cenvat Credit @ 0.6% against providing exempt services i.e. trading
- 1,088,154
(v) Demand of Cenvat Credit for 2011-2016 in respect of service tax paid on the outward transportation
1,569,640 3,209,812
(vi) In respect of additions made by the Assessing officer for Assessment Year 2009-10 and confirmed by DRP for which the Company has filed an appeal before ITAT and ITAT has decided in favour of the company vide order dated 22.04.2016 and relief granted in Assessing officer order dated 21.07.2016.
- 563,918
(vii) In respect of additions made by the Assessing officer for Assessment Year 2010-11 and confirmed by DRP for which the Company has filed an appeal before ITAT
177,323 177,323
(viii) Liability of Customs duty towards export obligation undertaken by the Company under EPCG licenses (including interest)
188,602,958 150,404,202
(ix) Letter of credit 144,665,857 21,552,216(x) Bank Guarantees 505,372,500 287,364,400
The current year amount relating to income tax does not include interest. Based on the favorable decisions in similar cases/advice taken by the Company & based on management’s internal assessment, the Company believes that it has good case in respect of all the items listed above and hence no provision there against is considered necessary.
35. DISCLOSURE IN RESPECt OF CASh tRANSACtIONS
The company held the following specified Bank Notes (SBNs) and the following transactions were incurred during the period from 8 November, 2016 to 30 December, 2016 as provided in the table below:
Particulars SBNs Other Denomination Notes
total
Closing Balance as on 08.11.2016* 2,045,000 700,457 2,745,457Add : Permitted Receipts* - 2,546,862 2,546,862Less : Permitted Payments* - 2,109,613 2,109,613Less : Deposited in Bank* 2,045,000 - 2,045,000Closing Balance as on 30.12.2016* - 1,137,706 1,137,706
*Above disclosure is excluding money held in Taiwan Doller (TWD) in Taiwan.
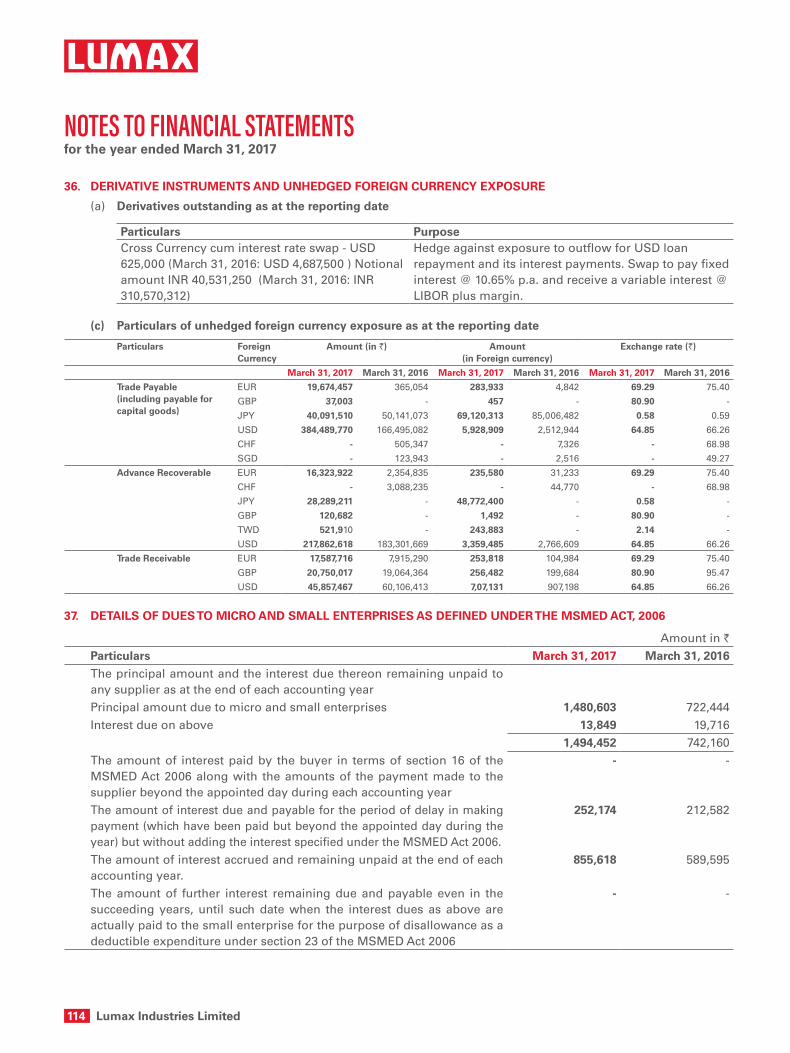
114 Lumax Industries Limited
36. DERIVAtIVE INStRUMENtS AND UNhEDGED FOREIGN CURRENCY EXPOSURE
(a) Derivatives outstanding as at the reporting date
Particulars PurposeCross Currency cum interest rate swap - USD 625,000 (March 31, 2016: USD 4,687,500 ) Notional amount INR 40,531,250 (March 31, 2016: INR 310,570,312)
Hedge against exposure to outflow for USD loan repayment and its interest payments. Swap to pay fixed interest @ 10.65% p.a. and receive a variable interest @ LIBOR plus margin.
(c) Particulars of unhedged foreign currency exposure as at the reporting date
Particulars Foreign Currency
Amount (in `) Amount (in Foreign currency)
Exchange rate (`)
March 31, 2017 March 31, 2016 March 31, 2017 March 31, 2016 March 31, 2017 March 31, 2016
trade Payable (including payable for capital goods)
EUR 19,674,457 365,054 283,933 4,842 69.29 75.40
GBP 37,003 - 457 - 80.90 -
JPY 40,091,510 50,141,073 69,120,313 85,006,482 0.58 0.59
USD 384,489,770 166,495,082 5,928,909 2,512,944 64.85 66.26
CHF - 505,347 - 7,326 - 68.98
SGD - 123,943 - 2,516 - 49.27
Advance Recoverable EUR 16,323,922 2,354,835 235,580 31,233 69.29 75.40
CHF - 3,088,235 - 44,770 - 68.98
JPY 28,289,211 - 48,772,400 - 0.58 -
GBP 120,682 - 1,492 - 80.90 -
TWD 521,910 - 243,883 - 2.14 -
USD 217,862,618 183,301,669 3,359,485 2,766,609 64.85 66.26
trade Receivable EUR 17,587,716 7,915,290 253,818 104,984 69.29 75.40
GBP 20,750,017 19,064,364 256,482 199,684 80.90 95.47
USD 45,857,467 60,106,413 7,07,131 907,198 64.85 66.26
37. DEtAILS OF DUES tO MICRO AND SMALL ENtERPRISES AS DEFINED UNDER thE MSMED ACt, 2006
Amount in `Particulars March 31, 2017 March 31, 2016The principal amount and the interest due thereon remaining unpaid to any supplier as at the end of each accounting yearPrincipal amount due to micro and small enterprises 1,480,603 722,444Interest due on above 13,849 19,716
1,494,452 742,160The amount of interest paid by the buyer in terms of section 16 of the MSMED Act 2006 along with the amounts of the payment made to the supplier beyond the appointed day during each accounting year
- -
The amount of interest due and payable for the period of delay in making payment (which have been paid but beyond the appointed day during the year) but without adding the interest specified under the MSMED Act 2006.
252,174 212,582
The amount of interest accrued and remaining unpaid at the end of each accounting year.
855,618 589,595
The amount of further interest remaining due and payable even in the succeeding years, until such date when the interest dues as above are actually paid to the small enterprise for the purpose of disallowance as a deductible expenditure under section 23 of the MSMED Act 2006
- -
notes to fInAncIAl stAtements for the year ended March 31, 2017
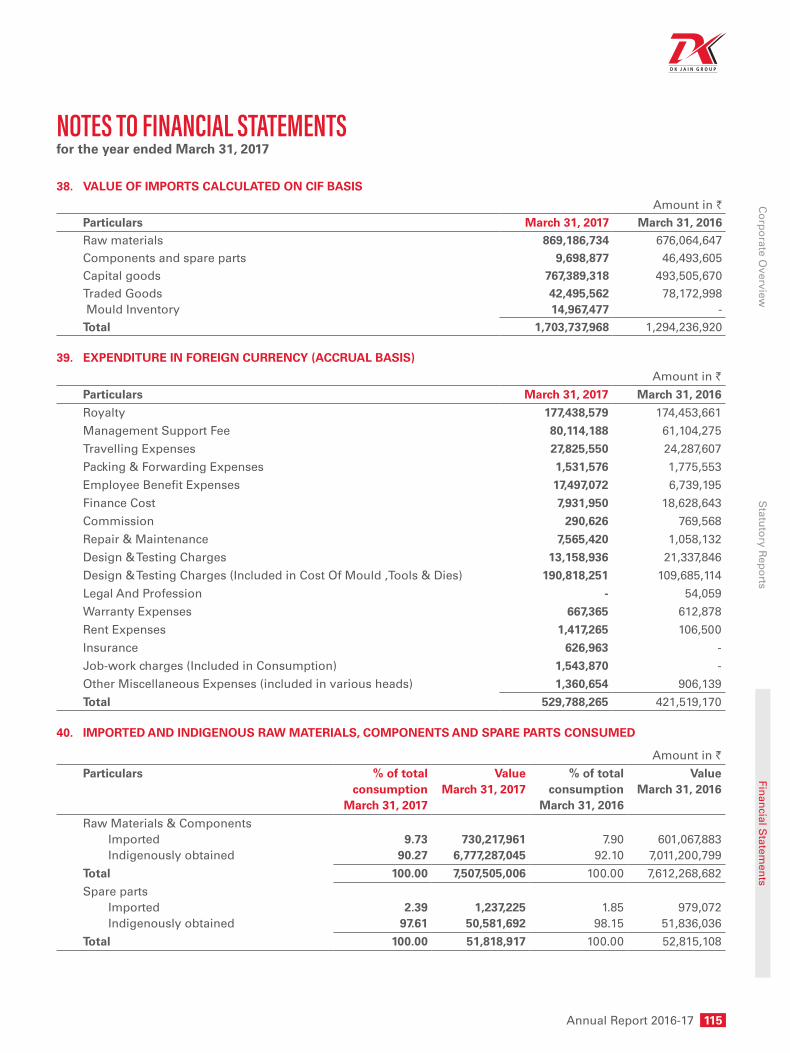
Annual Report 2016-17 115
Co
rpo
rate Overview
Statu
tory R
epo
rtsFin
ancial S
tatemen
ts
38. VALUE OF IMPORtS CALCULAtED ON CIF BASIS
Amount in `Particulars March 31, 2017 March 31, 2016Raw materials 869,186,734 676,064,647 Components and spare parts 9,698,877 46,493,605 Capital goods 767,389,318 493,505,670 Traded Goods Mould Inventory
42,495,56214,967,477
78,172,998-
total 1,703,737,968 1,294,236,920
39. EXPENDItURE IN FOREIGN CURRENCY (ACCRUAL BASIS)
Amount in `
Particulars March 31, 2017 March 31, 2016
Royalty 177,438,579 174,453,661
Management Support Fee 80,114,188 61,104,275
Travelling Expenses 27,825,550 24,287,607
Packing & Forwarding Expenses 1,531,576 1,775,553
Employee Benefit Expenses 17,497,072 6,739,195
Finance Cost 7,931,950 18,628,643
Commission 290,626 769,568
Repair & Maintenance 7,565,420 1,058,132
Design & Testing Charges 13,158,936 21,337,846
Design & Testing Charges (Included in Cost Of Mould ,Tools & Dies) 190,818,251 109,685,114
Legal And Profession - 54,059
Warranty Expenses 667,365 612,878
Rent Expenses 1,417,265 106,500
Insurance 626,963 -
Job-work charges (Included in Consumption) 1,543,870 -
Other Miscellaneous Expenses (included in various heads) 1,360,654 906,139
total 529,788,265 421,519,170
40. IMPORtED AND INDIGENOUS RAw MAtERIALS, COMPONENtS AND SPARE PARtS CONSUMED
Amount in `
Particulars % of total consumption
March 31, 2017
Value March 31, 2017
% of total consumption
March 31, 2016
ValueMarch 31, 2016
Raw Materials & Components Imported Indigenously obtained
9.7390.27
730,217,9616,777,287,045
7.9092.10
601,067,8837,011,200,799
total 100.00 7,507,505,006 100.00 7,612,268,682
Spare parts Imported Indigenously obtained
2.3997.61
1,237,22550,581,692
1.8598.15
979,07251,836,036
total 100.00 51,818,917 100.00 52,815,108
notes to fInAncIAl stAtements for the year ended March 31, 2017

116 Lumax Industries Limited
41. NEt DIVIDEND REMIttED IN FOREIGN EXChANGE
Amount in `Year of remittance (ending on) March 31, 2017 March 31, 2016Period to which it relates 1 April 2015 to
31 March 20161 April 2014 to31 March 2015
Number of non-resident shareholders
- - 2 2
Number of equity shares held on which dividend was due
- - 3,505,399 3,505,399
Amount remitted (in USD) - - 616,695 284,193
42. EARNINGS IN FOREIGN CURRENCY (ACCRUAL BASIS)
Amount in `Particulars March 31, 2017 March 31, 2016Exports at F.O.B. Value 237,404,931 268,627,226Recovery of testing charges/Service Income 7,184,705 15,121,522total 244,589,636 283,748,748
43. DEtAILS OF RESEARCh AND DEVELOPMENt EXPENSES ARE AS FOLLOwS:
A. The Company has incurred expenses on its in-house research and development center at Gurgaon approved and recognised by the Ministry of Science & Technology, Government of India.
a. Capital Expenditure
Amount in `Particulars March 31, 2017 March 31, 2016Capital expenditure 21,297,790 17,154,739
b. Revenue Expenditure
Amount in `Particulars March 31, 2017 March 31, 2016Salaries, Wages and Bonus 90,008,894 73,028,979Contribution to Provident Fund 4,391,761 3,586,926Contribution to Other Funds 226,676 206,830Staff Welfare 17,142,094 12,120,633Provision for Retirement Benefit 3,253,842 2,110,993Insurance 542,844 346,346Repair & Maintenance 13,368,676 12,277,078Travelling & Conveyance 35,097,633 29,025,564Research & Development 34,892 1,120Power & Fuel 926,800 808,238Miscellaneous 5,257,390 4,676,826Design, Support & Testing Charges 974,388 1,522,488Material/Consumable/Spares 346,494 95,830Depreciation 12,962,645 15,153,808Finance Cost 634,542 745,982total 185,169,571 155,707,641
notes to fInAncIAl stAtements for the year ended March 31, 2017

Annual Report 2016-17 117
Co
rpo
rate Overview
Statu
tory R
epo
rtsFin
ancial S
tatemen
ts
B. The Company has incurred expenses on its in-house research and development center at Pune approved and recognised by the Ministry of Science & Technology, Government of India.
a. Capital Expenditure
Particulars March 31, 2017 March 31, 2016Capital expenditure 20,196,177 7,463,762
b. Revenue Expenditure
Particulars March 31, 2017 March 31, 2016Salaries, Wages and Bonus 68,314,460 44,708,512Contribution to Provident Fund 2,786,748 2,147,793Contribution to Other Funds 202,829 189,125Staff Welfare 5,985,786 5,474,640Provision for Retirement Benefit 1,669,314 1,333,692Insurance 320,488 170,070Repair & Maintenance 5,279,785 5,091,501Travelling & Conveyance 15,612,732 11,521,068Research & Development - 61,383Legal & Professional Expenses 2,209,754 3,596,647Power & Fuel 2,979,941 2,337,783Miscellaneous 2,682,080 1,821,636Design, Support & Testing Charges 896,007 387,948Material / Consumables / Spares 97,851 40,538Depreciation 7,539,255 8,137,997Finance Cost 171,685 218,462total 116,748,715 87,238,795
44. CORPORAtE SOCIAL RESPONSIBILItY (CSR)
As per the provisions of section 135 of the Companies Act, 2013, the Company has to spend atleast 2% of the average net profits of the company made during three immediately preceding financial years towards CSR. Accordingly, a CSR committee has been formed for carrying out the CSR activities as specified in Schedule VII of the Companies Act, 2013.The specified percentage of aforesaid net profit amounts to ` 3,742,223 (Previous year ` 2,016,882). However, the Company has spent an amount of ` 3, 361,859 (Previous year ` 3, 259,049) and has accordingly charged the same to the statement of Profit & Loss.
45. Claim recoverable represents receivables from West Bengal Industrial Development Corporation in relation to Singur Land. The Company has relied on legal opinion for ascertaining the recoverability of the claim.
46. The assets of ` 350,783,068 (Previous year ` 239,219,298) recognized by the Company as ‘MAT Credit Entitlement’ under ‘ Loans and Advances’ represents that portion of MAT, which can be recovered and set off in subsequent years based on provisions of Section 115JAA of the Income Tax Act, 1961. The management, based on present trend of profitability and also the future profitability projections, is of the view that there would be sufficient taxable income in foreseeable future, which will enable the Company to utilize MAT credit assets.
47. Previous year’s figures have been regrouped / reclassified, where necessary, to conform to this year’s classification.
notes to fInAncIAl stAtements for the year ended March 31, 2017
As per our report of even date
For S. R. BAtLIBOI & CO. LLP For and on behalf of the Board of Directors of Lumax Industries LimitedChartered AccountantsICAI firm registration number: 301003E/E300005
per Vikas Mehra D. K. Jain Deepak JainPartner Chairman Managing DirectorMembership No. 94421 DIN: 00085848 DIN: 00004972
Place : Gurugram Shruti Kant Rustagi Shwetank tiwariDate : May 13, 2017 Chief Financial Officer Company Secretary

118 Lumax Industries Limited
To the Members of Lumax Industries Limited
Report on the Consolidated Financial Statements
We have audited the accompanying consolidated financial statements of Lumax Industries Limited, (“hereinafter referred to as the “Holding Company”) and its associate Company, comprising of the consolidated Balance Sheet as at March 31, 2017, the consolidated Statement of Profit and Loss and consolidated Cash Flow Statement for the year then ended, and a summary of significant accounting policies and other explanatory information.
Management’s Responsibility for the Consolidated Financial Statements
The Holding Company’s Board of Directors is responsible for the preparation of these consolidated financial statements in terms with the requirement of the Companies Act, 2013 (“the Act”) that give a true and fair view of the consolidated financial position, consolidated financial performance and consolidated cash flows of the Holding Company and its associate in accordance with accounting principles generally accepted in India, including the Accounting Standards specified under Section 133 of the Act, read with Rule 7 of the Companies (Accounts) Rules, 2014 and Companies (Accounting Standards) Amendment Rules, 2016.The respective Board of Directors of the Companies included in the Holding Company and its associate are responsible for maintenance of adequate accounting records in accordance with the provisions of the Act for safeguarding of the assets of the Holding Company and its associate and for preventing and detecting frauds and other irregularities; the selection and application of appropriate accounting policies; making judgments and estimates that are reasonable and prudent; and the design, implementation and maintenance of adequate internal financial control that were operating effectively for ensuring the accuracy and completeness of the accounting records, relevant to the preparation and presentation of the financial statements that give a true and fair view and are free from material misstatement, whether due to fraud or error, which have been used for the purpose of preparation of the consolidated financial statements by the Directors of the Holding Company, as aforesaid.
Auditor’s Responsibility
Our responsibility is to express an opinion on these consolidated financial statements based on our audit. While conducting the audit, we have taken into account the provisions of the Act, the accounting and auditing standards and matters which are required to be included in the audit report under the provisions of the Act and the Rules made thereunder. We conducted our audit in accordance with the
Standards on Auditing, issued by the Institute of Chartered Accountants of India, as specified under Section 143(10) of the Act. Those Standards require that we comply with ethical requirements and plan and perform the audit to obtain reasonable assurance about whether the financial statements are free from material misstatement.
An audit involves performing procedures to obtain audit evidence about the amounts and disclosures in the consolidated financial statements. The procedures selected depend on the auditor’s judgment, including the assessment of the risks of material misstatement of the consolidated financial statements, whether due to fraud or error. In making those risk assessments, the auditor considers internal financial control relevant to the Holding Company’s preparation of the consolidated financial statements that give a true and fair view in order to design audit procedures that are appropriate in the circumstances. An audit also includes evaluating the appropriateness of accounting policies used and the reasonableness of the accounting estimates made by the Holding Company’s Board of Directors, as well as evaluating the overall presentation of the consolidated financial statements. We believe that the audit evidence obtained by us and the audit evidence obtained by the other auditors in terms of their reports referred to in paragraph (a) of the Other Matters below, is sufficient and appropriate to provide a basis for our audit opinion on the consolidated financial statements.
Opinion
In our opinion and to the best of our information and according to the explanations given to us, the consolidated financial statements give the information required by the Act in the manner so required and give a true and fair view in conformity with the accounting principles generally accepted in India of the consolidated state of affairs of the Holding Company and its associate as at March 31, 2017, their consolidated profit, and their consolidated cash flows for the year ended on that date.
Report on Other Legal and Regulatory Requirements
As required by section 143 (3) of the Act, we report, to the extent applicable, that:
(a) We / the other auditors whose reports we have relied upon have sought and obtained all the information and explanations which to the best of our knowledge and belief were necessary for the purpose of our audit of the aforesaid consolidated financial statements;
(b) In our opinion proper books of account as required by law relating to preparation of
Independent AudItor’s report

Annual Report 2016-17 119
Co
rpo
rate Overview
Statu
tory R
epo
rtsFin
ancial S
tatemen
ts
the aforesaid consolidation of the financial statements have been kept so far as it appears from our examination of those books and reports of the other auditors;
(c) The consolidated Balance Sheet, consolidated Statement of Profit and Loss, and consolidated Cash Flow Statement dealt with by this Report are in agreement with the books of account maintained for the purpose of preparation of the consolidated financial statements;
(d) In our opinion, the aforesaid consolidated financial statements comply with the Accounting Standards specified under section 133 of the Act, read with Rule 7 of the Companies (Accounts) Rules, 2014 and Companies (Accounting Standards) Amendment Rules, 2016;
(e) On the basis of the written representations received from the directors of the Holding Company as on March 31, 2017 taken on record by the Board of Directors of the Holding Company and the reports of the auditors of the associate Company incorporated in India, none of the directors of the Holding Company and its associate, incorporated in India is disqualified as on 31st March, 2017 from being appointed as a director in terms of Section 164 (2) of the Act.
(f) With respect to the adequacy and the operating effectiveness of the internal financial controls over financial reporting of the Holding Company and its associate, refer to our separate report in “Annexure 1” to this report;
(g) With respect to the other matters to be included in the Auditor’s Report in accordance with Rule 11 of the Companies (Audit and Auditors) Rules, 2014, in our opinion and to the best of our information and according to the explanations given to us:
i. The consolidated financial statements disclose the impact of pending litigations on its consolidated financial position of the Holding Company and its associate – Refer Note 34 to the consolidated financial statements;
ii. The Company has made provision, as required under the applicable law or accounting standards, for material foreseeable losses, if any, on long-term contracts including derivative contract;
iii. There has been no delay in transferring amounts, required to be transferred, to the Investor Education and Protection Fund by the Holding Company and its associate incorporated in India during the year ended March 31, 2017.
iv. The Holding Company and its associate have provided requisite disclosures in Note 35 to these consolidated financial statements as to the holding of Specified Bank Notes on November 8, 2016 and December 30, 2016 as well as dealings in Specified Bank Notes during the period from November 8, 2016 to December 30, 2016. Based on our audit procedures and relying on the management representation of the Holding Company regarding the holding and nature of cash transactions, including Specified Bank Notes, we report that these disclosures are in accordance with the books of accounts maintained by the Holding Company and its associate and as produced to us by the Management of the Holding Company.
Other Matter
We did not audit the financial statements of an associate. The consolidated financial statements include the Company’s share of net profit of ` 10,53,02,432 for the year ended March 31, 2017, as considered in the consolidated financial statements, in respect of one associate, whose financial statements, other financial information have been audited by other auditors and whose reports have been furnished to us by the Management. Our opinion on the consolidated financial statements, in so far as it relates to the amounts and disclosures included in respect of its associate, and our report in terms of sub-sections (3) of Section 143 of the Act, in so far as it relates to the aforesaid associate, is based solely on the report of such other auditor.
Our opinion above on the consolidated financial statements, and our report on Other Legal and Regulatory Requirements above, is not modified in respect of the above matters with respect to our reliance on the work done and the reports of the other auditors and the financial statements and other financial information certified by the Management.
For S.R. Batliboi & CO. LLP Chartered Accountants
ICAI Firm Registration Number: 301003E/E300005
per Vikas MehraPlace of Signature: New Delhi PartnerDate: May 13, 2017 Membership Number: 94421
120 Lumax Industries Limited
In conjunction with our audit of the consolidated financial statements of Lumax Industries Limited as of and for the year ended March 31, 2017, we have audited the internal financial controls over financial reporting of Lumax Industries Limited (hereinafter referred to as the “Holding Company”) and its associate Company which are the Companies incorporated in India, as of that date.
Management’s Responsibility for Internal Financial Controls
The respective Board of Directors of the Holding Company, its associate company which are Companies incorporated in India, are responsible for establishing and maintaining internal financial controls based on the internal control over financial reporting criteria established by the Holding Company considering the essential components of internal control stated in the Guidance Note on Audit of Internal Financial Controls Over Financial Reporting issued by the Institute of Chartered Accountants of India. These responsibilities include the design, implementation and maintenance of adequate internal financial controls that were operating effectively for ensuring the orderly and efficient conduct of its business, including adherence to the respective company’s policies, the safeguarding of its assets, the prevention and detection of frauds and errors, the accuracy and completeness of the accounting records, and the timely preparation of reliable financial information, as required under the Act.
Auditor’s Responsibility
Our responsibility is to express an opinion on the company’s internal financial controls over financial reporting based on our audit. We conducted our audit in accordance with the Guidance Note on Audit of Internal Financial Controls Over Financial Reporting (the “Guidance Note”) and the Standards on Auditing, both, issued by Institute of Chartered Accountants of India, and deemed to be prescribed under section 143(10) of the Act, to the extent applicable to an audit of internal financial controls. Those Standards and the Guidance Note require that we comply with ethical requirements and plan and perform the audit to obtain reasonable assurance about whether adequate internal financial controls over financial reporting was established and maintained and if such controls operated effectively in all material respects.
Our audit involves performing procedures to obtain audit evidence about the adequacy of the internal financial controls system over financial reporting and their operating effectiveness. Our audit of internal financial controls over financial reporting included obtaining an understanding of internal financial controls over financial reporting, assessing the risk that a material weakness exists, and testing and evaluating the design and operating effectiveness of internal control based on the assessed risk. The procedures selected depend on the auditor’s judgement, including the assessment of the risks of material misstatement of the financial statements, whether due to fraud or error.
We believe that the audit evidence we have obtained and the audit evidence obtained by the other auditors in terms of their reports referred to in the Other Matters paragraph below, is sufficient and appropriate to provide a basis for our audit opinion on the internal financial controls system over financial reporting.
Meaning of Internal Financial Controls Over Financial Reporting
A company’s internal financial control over financial reporting is a process designed to provide reasonable assurance regarding the reliability of financial reporting and the preparation of financial statements for external purposes in accordance with generally accepted accounting principles. A company’s internal financial control over financial reporting includes those policies and procedures that (1) pertain to the maintenance of records that, in reasonable detail, accurately and fairly reflect the transactions and dispositions of the assets of the company; (2) provide reasonable assurance that transactions are recorded as necessary to permit preparation of financial statements in accordance with generally accepted accounting principles, and that receipts and expenditures of the company are being made only in accordance with authorisations of management and directors of the company; and (3) provide reasonable assurance regarding prevention or timely detection of unauthorised acquisition, use, or disposition of the company’s assets that could have a material effect on the financial statements.
Annexure-1 to the Independent AudItor’s report of even dAte on the consolIdAted fInAncIAl stAtements of lumAx IndustrIes lImItedReport on the Internal Financial Controls under Clause (i) of Sub-section 3 of Section 143 of the Companies Act, 2013 (“the Act”)

Annual Report 2016-17 121
Co
rpo
rate Overview
Statu
tory R
epo
rtsFin
ancial S
tatemen
ts
Inherent Limitations of Internal Financial Controls Over Financial Reporting
Because of the inherent limitations of internal financial controls over financial reporting, including the possibility of collusion or improper management override of controls, material misstatements due to error or fraud may occur and not be detected. Also, projections of any evaluation of the internal financial controls over financial reporting to future periods are subject to the risk that the internal financial control over financial reporting may become inadequate because of changes in conditions, or that the degree of compliance with the policies or procedures may deteriorate.
Opinion
In our opinion, the Holding Company and its associate which are Companies incorporated in India, have, maintained in all material respects, an adequate internal financial controls system over financial reporting and such internal financial controls over financial reporting were operating effectively as at March 31, 2017, based on the internal control over financial reporting criteria established by the Holding Company considering the essential components of internal control stated in the
Guidance Note on Audit of Internal Financial Controls Over Financial Reporting issued by the Institute of Chartered Accountants of India.
Other Matters
Our report under Section 143(3)(i) of the Act on the adequacy and operating effectiveness of the internal financial controls over financial reporting of the Holding Company, insofar as it relates to the one associate Company, which is the Company incorporated in India, is based on the corresponding report of the auditors of such associate Company incorporated in India.
For S.R. Batliboi & CO. LLP Chartered AccountantsICAI Firm Registration Number: 301003E/E300005
per Vikas MehraPartnerMembership Number: 94421
Place of Signature: New DelhiDate: May 13, 2017

122 Lumax Industries Limited
Amount in `Notes As at
March 31, 2017As at
March 31, 2016I. EQUITY & LIABILITIES Shareholders’ funds (a) Share capital 3 93,477,320 93,477,320 (b) Reserves and surplus 4 3,065,312,747 2,590,191,806
3,158,790,067 2,683,669,126 Non-Current Liabilities (a) Long term borrowings 5 36,376,956 105,728,944 (b) Deferred tax liabilities (net) 6 279,439,857 194,418,367 (c) Other long term liabilities 7 217,424,739 223,712,544 (d) Long term provisions 8 114,598,344 92,716,007
647,839,896 616,575,862 Current Liabilities (a) Short term borrowings 9 790,221,122 848,253,641 (b) Trade payables 10 - Total outstanding due of micro enterprises and small
enterprises 1,480,603 722,444
- Total outstanding due of creditors other than micro enterprises and small enterprises
3,441,231,922 3,096,045,229
(c) Other current liabilities 11 1,045,901,865 1,284,420,745 (d) Short term provisions 8 69,277,569 55,912,545
5,348,113,081 5,285,354,604 TOTAL 9,154,743,044 8,585,599,592 II ASSETS Non-Current Assets (a) Fixed assets Property, Plant & Equipment 12 3,840,814,451 4,054,223,293 Intangible assets 13 33,302,237 25,673,979 Capital work in progress 524,819,185 170,377,539 (b) Non-Current Investments 14 787,315,104 686,961,061 (c) Loans and advances 15 478,305,796 313,950,910 (d) Other Non-Current assets 16.2 18,077,240 12,148,876
5,682,634,013 5,263,335,658 Current Assets (a) Current investments 17 987,000 987,000 (b) Inventories 18 1,160,454,455 1,045,501,751 (c) Trade receivables 16.1 1,909,421,724 1,811,903,475 (d) Cash and bank balances 19 13,695,090 34,552,286 (e) Loans and advances 15 372,602,325 358,338,177 (f) Other current assets 16.2 14,948,437 70,981,245
3,472,109,031 3,322,263,934 TOTAL 9,154,743,044 8,585,599,592 Summary of significant accounting policies 2.1The accompanying notes are an integral part of the financial statements.
As per our report of even date
For S. R. BATLIBOI & CO. LLP For and on behalf of the Board of Directors of Lumax Industries LimitedChartered AccountantsICAI firm registration number: 301003E/E300005
per Vikas Mehra D. K. Jain Deepak JainPartner Chairman Managing DirectorMembership No. 94421 DIN: 00085848 DIN: 00004972
Place : Gurugram Shruti Kant Rustagi Shwetank TiwariDate : May 13, 2017 Chief Financial Officer Company Secretary
consolIdAted BAlAnce sheet as at March 31, 2017
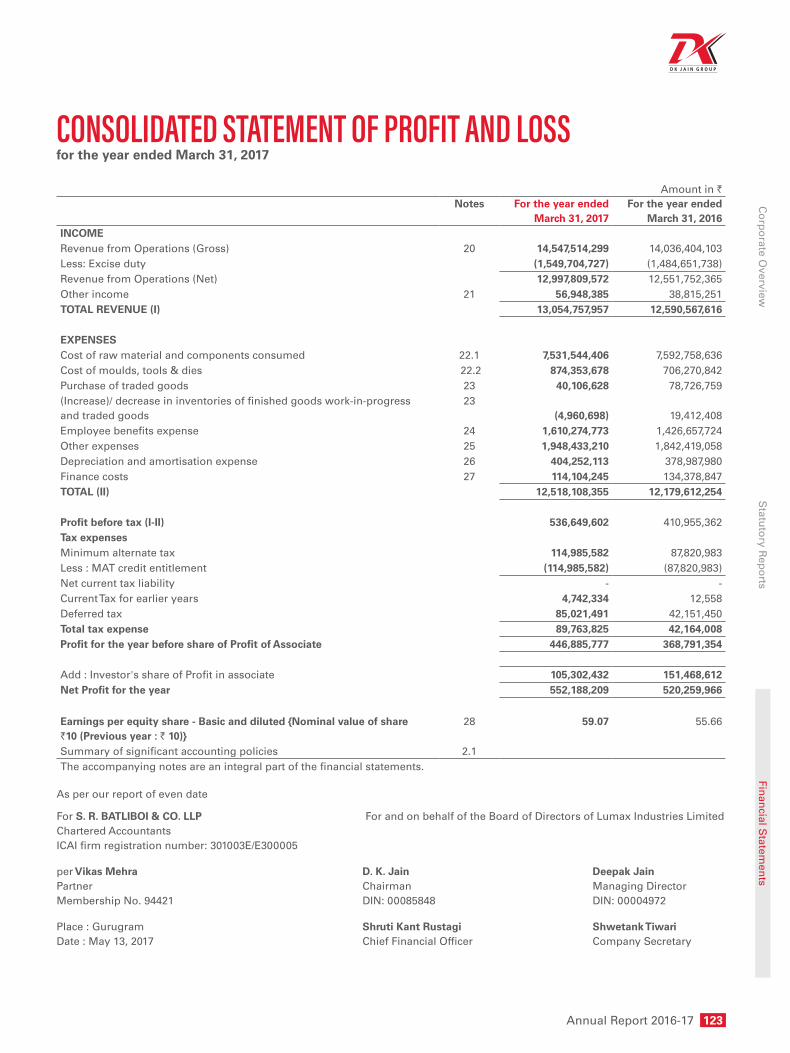
Annual Report 2016-17 123
Co
rpo
rate Overview
Statu
tory R
epo
rtsFin
ancial S
tatemen
ts
As per our report of even date
For S. R. BATLIBOI & CO. LLP For and on behalf of the Board of Directors of Lumax Industries LimitedChartered AccountantsICAI firm registration number: 301003E/E300005
per Vikas Mehra D. K. Jain Deepak JainPartner Chairman Managing DirectorMembership No. 94421 DIN: 00085848 DIN: 00004972
Place : Gurugram Shruti Kant Rustagi Shwetank TiwariDate : May 13, 2017 Chief Financial Officer Company Secretary
Amount in `Notes For the year ended
March 31, 2017For the year ended
March 31, 2016INCOMERevenue from Operations (Gross) 20 14,547,514,299 14,036,404,103 Less: Excise duty (1,549,704,727) (1,484,651,738)Revenue from Operations (Net) 12,997,809,572 12,551,752,365 Other income 21 56,948,385 38,815,251 TOTAL REVENUE (I) 13,054,757,957 12,590,567,616
EXPENSESCost of raw material and components consumed 22.1 7,531,544,406 7,592,758,636 Cost of moulds, tools & dies 22.2 874,353,678 706,270,842 Purchase of traded goods 23 40,106,628 78,726,759 (Increase)/ decrease in inventories of finished goods work-in-progress and traded goods
23 (4,960,698)
19,412,408
Employee benefits expense 24 1,610,274,773 1,426,657,724 Other expenses 25 1,948,433,210 1,842,419,058 Depreciation and amortisation expense 26 404,252,113 378,987,980 Finance costs 27 114,104,245 134,378,847 TOTAL (II) 12,518,108,355 12,179,612,254
Profit before tax (I-II) 536,649,602 410,955,362 Tax expensesMinimum alternate tax 114,985,582 87,820,983 Less : MAT credit entitlement (114,985,582) (87,820,983)Net current tax liability - -Current Tax for earlier years 4,742,334 12,558 Deferred tax 85,021,491 42,151,450 Total tax expense 89,763,825 42,164,008 Profit for the year before share of Profit of Associate 446,885,777 368,791,354
Add : Investor's share of Profit in associate 105,302,432 151,468,612 Net Profit for the year 552,188,209 520,259,966
Earnings per equity share - Basic and diluted {Nominal value of share `10 (Previous year : ` 10)}
28 59.07 55.66
Summary of significant accounting policies 2.1The accompanying notes are an integral part of the financial statements.
consolIdAted stAtement of profIt And lossfor the year ended March 31, 2017

124 Lumax Industries Limited
Amount in `
S. No. Particulars March 31, 2017 March 31, 2016
A. Cash flow from operating activities
Profit before tax 536,649,602 410,955,362
Adjustment to reconcile profit before tax to net cash flows
Depreciation/ amortisation 404,252,113 378,987,980
Provision for doubtful debts / advances 1,664,743 109,901
Loss/(Profit) on sale of Property, Plant & Equipment (2,781,622) (1,284,459)
Unrealised foreign exchange (gain)/ loss (11,348,653) 1,877,281
Finance cost 114,104,245 134,378,847
Interest income (1,790,624) (2,113,612)
Dividend income (240,770) (257,799)
Operating profit before working capital changes 1,040,509,034 922,653,501
Movements in working capital:
Decrease/ (increase) in inventories (114,952,704) 53,458,060
Decrease/ (increase) in trade receivables (82,807,463) (371,891,787)
Decrease/ (increase) in loans and advances (24,489,174) (65,507,093)
Decrease/ (increase) in other current assets (13,441,240) -
Increase/ (decrease) in liabilities and provisions 313,584,683 355,749,024
Cash generated from operations 1,118,403,136 894,461,705
Direct taxes paid 117,623,339 81,152,115
Net cash flow from operating activities (A) 1,000,779,797 813,309,590
B. Cash flow from investing activities
Purchase of fixed assets, including CWIP (1,016,719,198) (399,249,859)
Proceeds from sales of Property, Plant & Equipment 389,974,593 18,748,306
Interest received 1,320,307 1,783,419
Dividends received 5,189,159 5,206,188
Investments in bank deposits (having original maturity of more than three months)
(518,936) -
Redemption/ maturity of bank deposits (having original maturity of more than three months)
- 7,258,876
Net cash flow used in investing activities (B) (620,754,075) (366,253,070)
C. Cash flow from financing activities
Proceeds from long term borrowings 28,953,428 31,050,847
Repayment of long term borrowings (256,920,993) (350,443,996)
Proceeds from/(repayment) of bank borrowings and short term loans (net)
(58,032,519) 60,549,305
Interest Paid (116,380,270) (138,901,651)
Dividend Paid on equity shares - (163,585,310)
Tax on equity dividend paid - (33,302,045)
Net cash flow from/ (used in) financing activities (C) (402,380,354) (594,632,850)
Net increase/ (decrease) in cash and cash equivalents (A+B+C) (22,354,632) (147,576,330)
Cash and cash equivalents at the beginning of the year 34,552,286 182,128,616
Cash and cash equivalents at the end of the year 12,197,654 34,552,286
consolIdAted cAsh flow stAtement for the year ended March 31, 2017

Annual Report 2016-17 125
Co
rpo
rate Overview
Statu
tory R
epo
rtsFin
ancial S
tatemen
ts
As per our report of even date
For S. R. BATLIBOI & CO. LLP For and on behalf of the Board of Directors of Lumax Industries LimitedChartered AccountantsICAI firm registration number: 301003E/E300005
per Vikas Mehra D. K. Jain Deepak JainPartner Chairman Managing DirectorMembership No. 94421 DIN: 00085848 DIN: 00004972
Place : Gurugram Shruti Kant Rustagi Shwetank TiwariDate : May 13, 2017 Chief Financial Officer Company Secretary
Amount in `
S. No. Particulars March 31, 2017 March 31, 2016
Components of cash and cash equivalents
Cash on hand 1,727,866 2,764,506
Cheques on Hand 342,358 5,026,725
Balances with banks:
On current accounts 4,636,144 19,014,978
On unpaid dividend accounts* 5,491,286 7,746,077
Total cash and cash equivalents (note 19) 12,197,654 34,552,286
* The Company can utilize these balances only toward settlement of the respective unpaid dividend.

126 Lumax Industries Limited
1. CORPORATE INFORMATION AND PRINCIPLES OF CONSOLIDATION
The consolidated financial statements relate to Lumax Industries Limited (‘Parent Company’) and its associate company. The company is a leading manufacturer and supplier of auto components, mainly automotive lighting systems for four-wheeler and two-wheeler applications. The Company has technical as well as financial collaboration with Stanley Electric Co. Ltd., Japan. Its shares are listed on two exchanges in India. The consolidated financial statements have been prepared on the following basis:
a. The financial statements of the parent company and its associate have been combined as per equity method from the date on which it falls within the definition of an associate as per Accounting Standard – 21, on Consolidated Financial Statements, notified under the Companies (Accounting Standards) Rules, 2014. On acquisition of the investment, any difference between the cost of acquisition and the Company’s share of the equity of the associate has been described as goodwill or capital reserve, as the case may be.
b. The parent Company has prepared the accompanying consolidated financial statements by including the parent Company’s proportionate share in the associate’s net profit (after taxes) as per equity method. Unrealised profits and losses resulting from transactions between the parent Company and the associate have been eliminated to the extent of parent Company’s proportionate share.
c. Details of the associate Company is as follows:
NameCountry of
IncorporationPercentage Holding as
at March 31, 2017SL Lumax
LimitedIndia 21.28%
d. The Parent Company and its associate follow a uniform accounting period and as far as possible, the Consolidated Financial Statements have been prepared using accounting policies for like transactions and other events in similar circumstances and are presented to the extent possible, in the same manner as the Parent Company’s separate financial statements.
2. BASIS OF PREPARATION
The financial statements of the Company have been prepared and presented in accordance with generally accepted accounting principles in India (Indian GAAP). The Company has prepared these financial statements to comply with all material respects with the accounting standards specified under section 133 of the Companies Act, 2013, read together with paragraph 7 of the Companies (Accounts) Rules, 2014 and Companies (Accounting Standards) Amendment Rules, 2016. The financial statements have been prepared on an accrual basis and under the historical cost convention.
The accounting policies adopted in the preparation of financial statements are consistent with those of previous year, except for the change in accounting policy explained below.
2.1 Summary of significant accounting policies
Change in Accounting Policies
1. Classification of items of stores and spares
Pre-revised AS 10 required that stand-by and servicing equipment should normally be capitalized as property, plant and equipment. It required that machinery spares are usually treated as inventory and charged to profit or loss on consumption. However, spares parts that can be only used in connection with a particular item of property, plant and equipment, and whose use is expected to be irregular, are capitalized. Such spare parts are depreciated over a period, not exceeding the remaining useful life of the principal asset.
According to revised AS 10, all spare parts, stand-by and servicing equipment qualify as property, plant and equipment (PPE) if they meet the definition of PPE i.e. if the company intends to use these during more than a period of 12 months, the spare parts capitalized in this manner are depreciated as per revised AS 10.
The company has changed its accounting policy of property, plant and equipment to
notes to consolIdAted fInAncIAl stAtements for the year ended March 31, 2017

Annual Report 2016-17 127
Co
rpo
rate Overview
Statu
tory R
epo
rtsFin
ancial S
tatemen
ts
comply with changes in AS 10. The company has applied transitional provisions that requires previously recognized stores and spares as inventory be capitalized as PPE at its carrying amount and be depreciated prospectively over its remaining useful life.
Spare Parts having useful life for more than one year are capitalised w.e.f. 01.04.2016.
Had the company continued to use the earlier policy of classifying stores and spares as inventories, its financial statements for the period would have been impacted as below:
Inventories would have been higher by ` 9,521,290, property, plant and equipment would have been lower by ` 9,521,290 (gross), depreciation would have been lower by ` 1,329,029. Profit before tax for the current period would have been higher by ` 1,329,029.
2. ACCOUNTINg OF PROPOSED DIVIDEND
As per the requirements of pre-revised AS 4, the Company used to create a liability for dividend proposed/ declared after the balance sheet date for dividend related to periods covered by the financial statements. Going forward, as per revised AS 4, the company cannot create provision for dividend proposed / declared after the balance sheet date unless a statute requires otherwise. However, the company need to disclose the same in notes to the financial statements.
Accordingly, the company has disclosed dividend proposed by board of directors after the balance sheet date in the notes.
Had the company continued with creation of provision for proposed dividend, its surplus in the statement of profit and loss account would have been lower by ` 163,135,299 and current provision would have been higher by ` 163,135,299 (including dividend distribution tax of ` 27,593,185).
3. ACCOUNTINg FOR ASSETS EARLIER CARRIED AT REVALUED AMOUNT
The Company had revalued Land, Building and Plant & Machinery and was carried at revalued
amount under the pre-revised AS 10. Under the revised AS 10, the Company has applied cost model on all the items of property, plant and equipment. As per the transitional provision under revised AS 10, where a Company does not adopt the revaluation model as its accounting policy but the carrying amount of item(s) of PPE reflects any previous revaluation, the Company should adjust the amount outstanding in the revaluation reserve against the carrying amount of that item. However, the carrying amount of that item should not be less than residual value. Any excess of the amount outstanding as revaluation reserve over the carrying amount of that item should be adjusted in revenue reserves. Accordingly, the Company has adjusted the balance of revaluation reserve against land and building, resulting in reduction in land and building and revaluation reserve by ` 77,067,268.
a. Use of estimates
The preparation of financial statements are in conformity with Indian GAAP which requires the management to make judgments, estimates and assumptions that affect the reported amounts of assets, liabilities, revenue and expenses and the disclosure of contingent liabilities, at the end of the reporting period. Although these estimates are based on the management’s best knowledge of current events and actions, uncertainty about these assumptions and estimates could result in the outcomes requiring a material adjustment to the carrying amounts of assets, liabilities, revenue and expenses in future periods. Changes in estimates are reflected in the financial statements in the period in which changes are made and if material, their effects are disclosed in notes to accounts.
b. goodwill/ capital reserve
Goodwill/ capital reserve represents the difference between the parent’s Company share in the net worth of the associate company and the cost of acquisition at the time of making the investment in the associate company. For this purpose, the Parent Company’s share of net worth of the associate company is determined on the basis of the latest financial statements of the associate company prior to acquisition,
notes to consolIdAted fInAncIAl stAtements for the year ended March 31, 2017

128 Lumax Industries Limited
after making necessary adjustments for material events between the date of such financial statements and the date of respective acquisition.
c. Property, Plant and Eqiupment
Property, plant and equipment are stated at cost, net of accumulated depreciation and accumulated impairment losses, if any. The cost comprises purchase price, borrowing costs if capitalization criteria are met and directly attributable cost of bringing the asset to its working condition for the intended use. Any trade discounts and rebates are deducted in arriving at the purchase price. Such cost includes the cost of replacing part of the plant and equipment. When significant parts of plant and equipment are required to be replaced at intervals, the Company depreciates them separately based on their specific useful lives. Likewise, when a major inspection is performed, its cost is recognised in the carrying amount of the plant and equipment as a replacement if the recognition criteria are satisfied. All other repair and maintenance costs are recognised in profit or loss as incurred.
Items of stores and spares that meet the definition of property, plant and equipment are capitalized at cost and depreciated over their useful life. Otherwise, such items are classified as inventories.
Gains or losses arising from derecognition of property, plant and equipment are measured as the difference between the net disposal proceeds and the carrying amount of the asset and are recognized in the statement of profit and loss when the asset is derecognized.
If a component/ part of an asset has a cost which is significant to the total cost of asset and has a useful life that is materially different from that of the remaining component/part of the asset, the Company identifies and determines cost of such component/part of the asset separately.
Property, plant and equipment held for sale is valued at lower of their carrying amount and net realizable value. Any write-down is recognized in the statement of profit and loss.
Depreciation on Property, plant and Equipment
Leasehold land is amortized over the period of lease ranging from 90 years to 99 years.
Depreciation on other property, plant and equipment is calculated on a straight line basis using rates arrived at based on the useful lives estimated by the management. The identified components are depreciated separately over their useful lives; the remaining components are depreciated over the life of the principal asset.. The Company has used following estimated useful life to provide depreciation on its property, plant and equipment:
Particulars Useful lives estimated by the
management (years)
Factory building 30Other building 60Plant and Machinery (i, ii) 3-21Spare Parts 3-15Furniture and fixtures 10Vehicles (ii) 5-8Office equipment 5
i) The management has estimated supported by independent assessment, the useful life of certain plant and machinery as 21 years, which is higher than those indicated in schedule II of the Companies Act 2013.
ii) The management has estimated, based on past experience, the useful life of these blocks of assets as lower than the life indicated for respective block of assets in schedule II of the Companies Act 2013.
The residual values, useful lives and methods of depreciation of property, plant and equipment are reviewed at each financial year end and adjusted prospectively, if appropriate.
d. Intangible Assets
Intangible assets acquired separately are measured on initial recognition at cost. Following initial recognition, intangible assets are carried at cost less accumulated amortization and accumulated impairment losses, if
notes to consolIdAted fInAncIAl stAtements for the year ended March 31, 2017
Annual Report 2016-17 129
Co
rpo
rate Overview
Statu
tory R
epo
rtsFin
ancial S
tatemen
ts
any. Internally generated intangible assets, excluding capitalized development costs, are not capitalized and expenditure is reflected in the statement of profit and loss in the year in which the expenditure is incurred.
Intangibles assets are amortized using straight-line method over their estimated useful lives as follows:
Intangible Assets
Estimated Useful Life (Years)
Computer Software
Over the estimated economic useful lives ranging from 3.5 to 5 years
Technical Know-how
Over the period of Technical Assistance Agreement i.e. 8 years
The amortization period and the amortization method are reviewed at least at each financial year end. If the expected useful life of the asset is significantly different from previous estimates, the amortization period is changed accordingly. If there has been a significant change in the expected pattern of economic benefits from the asset, the amortization method is changed to reflect the changed pattern. Such changes are accounted for in accordance with AS 5 Net Profit or Loss for the Period, Prior Period Items and Changes in Accounting Policies.
Gains or losses arising from de-recognition of an intangible asset are measured as the difference between the net disposal proceeds and the carrying amount of the asset and are recognized in the statement of profit and loss when the asset is derecognized.
e. Research costs Research costs are expensed as incurred.
f. Leases
Where the Company is the lessee
Finance leases, which effectively transfer to the Company substantially all the risks and benefits incidental to ownership of the leased item, are capitalized at the lower of the fair value of leased property and present value of the minimum lease payments at the inception of the lease term and disclosed as leased assets.
Lease payments are apportioned between the finance charges and reduction of the lease liability so as to achieve a constant rate of interest on the remaining balance of the liability. Finance charges are recognized as finance costs in the statement of profit and loss. Lease management fees, legal charges and other initial direct costs are capitalised.
A leased asset is depreciated on a straight-line basis over the useful life of the asset. However, if there is no reasonable certainty that the Company will obtain the ownership by the end of the lease term, the capitalized asset is depreciated on a straight-line basis over the shorter of the estimated useful life of the asset or the lease term.
Leases, where the lessor effectively retains substantially all the risks and benefits of ownership of the leased item are classified as operating leases. Operating lease payments are recognized as an expense in the statement of profit and loss on a straight-line basis over the lease term.
Where the Company is the lessor
Leases in which the Company transfers substantially all the risks and benefits of ownership of the asset are classified as finance leases. Assets given under finance lease are recognized as a receivable at an amount equal to the net investment in the lease. After initial recognition, the Company apportions lease rentals between the principal repayment and interest income so as to achieve a constant periodic rate of return on the net investment outstanding in respect of the finance lease. The interest income is recognized in the statement of profit and loss. Initial direct costs such as legal costs, brokerage costs, etc. are recognized immediately in the statement of profit and loss.
Leases in which the Company does not transfer substantially all the risks and benefits of ownership of the asset are classified as operating leases. Assets subject to operating leases are included in property, plant and equipment. Lease income on an operating lease
notes to consolIdAted fInAncIAl stAtements for the year ended March 31, 2017
130 Lumax Industries Limited
is recognized in the statement of profit and loss on a straight-line basis over the lease term. Costs, including depreciation, are recognized as an expense in the statement of profit and loss. Initial direct costs such as legal costs, brokerage costs, etc. are recognized immediately in the statement of profit and loss.
g. Borrowing costs
Borrowing cost includes interest, amortization of ancillary costs incurred in connection with the arrangement of borrowings.
Borrowing costs directly attributable to the acquisition, construction or production of an asset that necessarily takes a substantial period of time to get ready for its intended use or sale are capitalized as part of the cost of the respective asset. All other borrowing costs are expensed in the period they occur.
h. government grant and subsidies
Grants and subsidies from the government are recognized when there is reasonable assurance that (i) the Company will comply with the conditions attached to them, and (ii) the grant/subsidy will be received.
When the grant or subsidy relates to revenue, it is recognized as income on a systematic basis in the statement of profit and loss over the periods necessary to match them with the related costs, which they are intended to compensate. Where the grant relates to an asset, the grant is shown as a deduction from the gross value of the asset concerned in arriving at its book value. The grant is thus recognised in the statement of profit and loss over the useful life of a depreciable asset by way of a reduced depreciation charge.
i. Impairment of property, plant and equipment
The Company assesses at each reporting date whether there is an indication that an asset may be impaired. If any indication exists, or when annual impairment testing for an asset is required, the Company estimates the asset’s recoverable amount. An asset’s recoverable amount is the higher of an asset’s or cash-generating unit’s (CGU) net selling price and
its value in use. The recoverable amount is determined for an individual asset, unless the asset does not generate cash inflows that are largely independent of those from other assets or groups of assets. Where the carrying amount of an asset or CGU exceeds its recoverable amount, the asset is considered impaired and is written down to its recoverable amount.
Impairment losses of continuing operations, including impairment on inventories, are recognized in the statement of profit and loss, except for previously revalued property, plant and equipment, where the revaluation was taken to revaluation reserve. In this case, the impairment is also recognized in the revaluation reserve up to the amount of any previous revaluation.
After impairment, depreciation is provided on the revised carrying amount of the asset over its remaining useful life.
An assessment is made at each reporting date as to whether there is any indication that previously recognized impairment losses may no longer exist or may have decreased. If such indication exists, the company estimates the asset’s or cash-generating unit’s recoverable amount. A previously recognized impairment loss is reversed only if there has been a change in the assumptions used to determine the asset’s recoverable amount since the last impairment loss was recognized. The reversal is limited so that the carrying amount of the asset does not exceed its recoverable amount, nor exceed the carrying amount that would have been determined, net of depreciation, had no impairment loss been recognized for the asset in prior years. Such reversal is recognized in the statement of profit and loss unless the asset is carried at a revalued amount, in which case the reversal is treated as a revaluation increase.
Associate
SL Lumax limited proposed project of setting up a plant in 5 acre SIPCOT Leasehold factory land situated opposite to the existing factory so as to supply KIA Motors ‘Indian arm originally planned to be located within 100 km from HMI being abandoned [on account of KIA Motors
notes to consolIdAted fInAncIAl stAtements for the year ended March 31, 2017

Annual Report 2016-17 131
Co
rpo
rate Overview
Statu
tory R
epo
rtsFin
ancial S
tatemen
ts
change in location from Tada to Anantpur District in Andhra Pradesh], the additional cost of 13.97 crores paid to the outgoing lease holder for securing their no objection to enable SIPCOT for allotment of the said land on lease in addition to the amounts being paid to SIPCOT by the company , is considered as totally impaired in view of the anticipated advantage of acquiring the nearby land is lost and such additional cost is considered by the management as not recoverable, considering the given economic conditions and prevailing market situation .
j. Investments
Investments, which are readily realizable and intended to be held for not more than one year from the date on which such investments are made, are classified as current investments. All other investments are classified as long-term investments.
On initial recognition, all investments are measured at cost. The cost comprises purchase price and directly attributable acquisition charges such as brokerage, fees and duties. If an investment is acquired, or partly acquired, by the issue of shares or other securities, the acquisition cost is the fair value of the securities issued.
Current investments are carried in the financial statements at lower of cost and fair value determined on an individual investment basis. Long-term investments are carried at cost. However, provision for diminution in value is made to recognize a decline other than temporary in the value of the investments. On disposal of an investment, the difference between its carrying amount and net disposal proceeds is charged or credited to the statement of profit and loss.
notes to consolIdAted fInAncIAl stAtements for the year ended March 31, 2017
k. Inventories
Inventories are valued as follows:
Raw materials and components, Stores and spares (including packing materials)
At Cost and Net Realizable Value, whichever is lower. However, materials and other items held for use in the production of inventories are not written down below cost if the finished products in which they will be incorporated are expected to be sold at or above cost.
Cost is determined on moving weighted average basis. Cost of raw materials and components lying in bonded warehouse includes custom duty accounted for on accrual basis.
Stores and spares which do not meet the definition of property, plant and equipment are accounted as inventories.
Finished goods & Traded goods, Work-in-progress and Moulds, tools and dies in process
At Cost and Net Realizable Value, whichever is lower. Cost of Finished goods and Work-in-progress (including moulds, tools and dies in process) includes direct materials, labour and a proportion of manufacturing overheads based on normal operating capacity. Cost of traded goods includes cost of purchase and other costs incurred in bringing the inventories to their present location and condition. Cost is determined on moving weighted average basis. Cost of finished goods includes excise duty.
Scrap At net realizable value.
Net realizable value is the estimated selling price in the ordinary course of business, less estimated costs of completion and to make the sale.

132 Lumax Industries Limited
l. Revenue Recognition
Revenue is recognized to the extent that it is probable that the economic benefits will flow to the Company and the revenue can be reliably measured. The following specific recognition criteria must be met before revenue is recognised.
Sale of goods
Revenue from sale of Goods is recognised when the significant risks and rewards of ownership of the goods have passed to the buyer usually on delivery of goods to the customer. The Company collects sales taxes and value added taxes (VAT) on behalf of the government and, therefore, these are not economic benefits flowing to the Company. Hence, they are excluded from revenue. Excise duty deducted from revenue (gross) is the amount that is included in the revenue (gross) and not the entire amount of liability arising during the year.
Sale of services
Revenues from service contracts are recognized as and when services are rendered. The Company collects service tax on behalf of the government and, therefore, it is not an economic benefit flowing to the Company. Hence, it is excluded from revenue.
Interest
Interest income is recognized on a time proportion basis taking into account the amount outstanding and the applicable interest rate. Interest income is included under the head “other income” in the statement of profit and loss.
Dividends
Dividend income is recognized when the Company’s right to receive dividend is established by the reporting date.
Export Incentives
Export benefits are accounted for in the year of exports based on eligibility and when there is no uncertainty in receiving the same.
m. Foreign Currency Translation
Foreign currency transactions
i. Initial Recognition
Foreign currency transactions are recorded in the reporting currency, by applying to the foreign currency amount the exchange rate between the reporting currency and the foreign currency at the date of the transaction.
ii. Conversion
Foreign currency monetary items are reported using the closing rate. Non-monetary items which are carried in terms of historical cost denominated in a foreign currency are reported using the exchange rate at the date of the transaction.
iii. Exchange Differences
Exchange differences arising on the settlement of monetary items or on reinstatement of monetary items at rates different from those at which they were initially recorded during the year, or reported in previous financial statements, are recognised as income or as expenses.
iv. Forward exchange contracts entered into to hedge foreign currency risk of an existing asset/ liability
The premium or discount arising at the inception of forward exchange contracts is amortised as expense or income over the life of the contract. Exchange differences on such contracts are recognized in the statement of profit and loss in the year in which the exchange rates change. Any profit or loss arising on cancellation or renewal of forward exchange contract is recognized as income or as expense for the period.
n. Retirement and other Employee Benefits
i. Retirement benefit in the form of provident fund is a defined contribution scheme. The company has no obligation, other than the contribution payable to the provident fund. The company recognizes contribution
notes to consolIdAted fInAncIAl stAtements for the year ended March 31, 2017
Annual Report 2016-17 133
Co
rpo
rate Overview
Statu
tory R
epo
rtsFin
ancial S
tatemen
ts
payable to the provident fund scheme as expenditure, when an employee renders the related service.
ii. Gratuity Liability is a defined benefit plan and is provided for on the basis of an actuarial valuation on projected unit credit method made at the end of each financial year.
Actuarial gain and loss for defined benefit plan is recognized in full in the period in which it occur in the statement of profit and loss.
iii. Accumulated leave, which is expected to be utilized within the next 12 months, is treated as short-term employee benefit. The Company measures the expected cost of such absences as the additional amount that it expects to pay as a result of the unused entitlement that has accumulated at the reporting date.
iv. The Company treats accumulated leave expected to be carried forward beyond twelve months, as long-term employee benefit for measurement purposes. Such long-term compensated absences are provided for based on the actuarial valuation using the projected unit credit method at the year-end. Actuarial gains/losses are immediately taken to the statement of profit and loss and are not deferred. The company presents the leave as a current liability in the balance sheet, to the extent it does not have an unconditional right to defer its settlement for 12 months after the reporting date. Where company has the unconditional legal and contractual right to defer the settlement for a period beyond 12 months, the same is presented as non-current liability.
o. Income Taxes
Tax expense comprises current and deferred tax. Current income-tax is measured at the amount expected to be paid to the tax authorities in accordance with the Income-tax Act, 1961 enacted in India and tax laws prevailing in the respective tax jurisdictions where the Company operates. The tax rates and tax laws used to compute the amount are those that are enacted
or substantively enacted, at the reporting date. Current income tax relating to items recognized directly in equity is recognized in equity and not in the statement of profit and loss.
Deferred income taxes reflect the impact of timing differences between taxable income and accounting income originating during the current year and reversal of timing differences for the earlier years. Deferred tax is measured using the tax rates and the tax laws enacted or substantively enacted at the reporting date. Deferred income tax relating to items recognized directly in equity is recognized in equity and not in the statement of profit and loss.
Deferred tax liabilities are recognized for all taxable timing differences. Deferred tax assets are recognized for deductible timing differences only to the extent that there is reasonable certainty that sufficient future taxable income will be available against which such deferred tax assets can be realized. In situations where the Company has unabsorbed depreciation or carry forward tax losses, all deferred tax assets are recognized only if there is virtual certainty supported by convincing evidence that they can be realized against future taxable profits.
In the situations where the Company is entitled to a tax holiday under the Income-tax Act, 1961 enacted in India or tax laws prevailing in the respective tax jurisdictions where it operates, no deferred tax (asset or liability) is recognized in respect of timing differences which reverse during the tax holiday period, to the extent the Company’s gross total income is subject to the deduction during the tax holiday period. Deferred tax in respect of timing differences which reverse after the tax holiday period is recognized in the year in which the timing differences originate. However, the Company restricts recognition of deferred tax assets to the extent that it has become reasonably certain or virtually certain, as the case may be, that sufficient future taxable income will be available against which such deferred tax assets can be realized. For recognition of deferred taxes, the timing differences which originate first are considered to reverse first.
notes to consolIdAted fInAncIAl stAtements for the year ended March 31, 2017
134 Lumax Industries Limited
At each reporting date, the Company re-assesses unrecognized deferred tax assets. It recognizes unrecognized deferred tax asset to the extent that it has become reasonably certain or virtually certain, as the case may be, that sufficient future taxable income will be available against which such deferred tax assets can be realized.
The carrying amount of deferred tax assets are reviewed at each reporting date. The Company writes-down the carrying amount of deferred tax asset to the extent that it is no longer reasonably certain or virtually certain, as the case may be, that sufficient future taxable income will be available against which deferred tax assets can be realized. Any such write-down is reversed to the extent that it becomes reasonably certain or virtually certain, as the case may be, that sufficient future taxable income will be available
Deferred tax assets and deferred tax liabilities are offset, if a legally enforceable right exists to set-off current tax assets against current tax liabilities and the deferred tax assets and deferred taxes relate to the same taxable entity and the same taxation authority.
Minimum alternate tax (MAT) paid in a year is charged to the statement of profit and loss as current tax. The Company recognizes MAT credit available as an asset only to the extent that there is convincing evidence that the Company will pay normal income tax during the specified period, i.e., the period for which MAT credit is allowed to be carried forward. In the year in which the Company recognizes MAT credit as an asset in accordance with the Guidance Note on Accounting for Credit Available in respect of Minimum Alternative Tax under the Income-tax Act, 1961, the said asset is created by way of credit to the statement of profit and loss and shown as “MAT Credit Entitlement.” The Company reviews the “MAT credit entitlement” asset at each reporting date and writes down the asset to the extent the Company does not have convincing evidence that it will pay normal tax during the specified period.
p. Segment Reporting Policies
Business Segment
The Company is engaged in the business of manufacture of various types of Automotive
Lighting Equipment. The entire operations are governed by the same set of risks and return hence the entire operations represent a single primary segment.
geographical Segment
The analysis of geographical segments is based on the geographical location of the customers i.e. customers located within India and customers located outside India.
q. Earnings per share
Basic earnings per share are calculated by dividing the net profit or loss for the period attributable to equity shareholders by the weighted average number of equity shares outstanding during the period.
For the purpose of calculating diluted earnings per equity share, the net profit or loss for the period attributable to equity shareholders and the weighted average number of shares outstanding during the period are adjusted for the effects of all dilutive potential equity shares.
r. Provisions
A provision is recognised when an enterprise has a present obligation as a result of past event and it is probable that an outflow of resources will be required to settle the obligation, in respect of which a reliable estimate can be made. Provisions are not discounted to its present value and are determined based on best management estimate required to settle the obligation at the balance sheet date. These are reviewed at each balance sheet date and adjusted to reflect the current best management estimates.
Warranty provisions
Provisions for warranty-related costs are recognized when the product is sold or service provided. Provision is based on historical experience. The estimate of such warranty-related costs is revised annually.
From current year Associate is estimating warranty for 5 years.
s. Long –term Contract
The Associate has a process whereby periodically all long-term contacts (including
notes to consolIdAted fInAncIAl stAtements for the year ended March 31, 2017

Annual Report 2016-17 135
Co
rpo
rate Overview
Statu
tory R
epo
rtsFin
ancial S
tatemen
ts
derivative contracts) are assessed for material foreseeable losses. At the year end, the company has reviewed and ensured that adequate provision as required under any law/accounting standards for material foreseeable losses on such long-term contracts (including derivative contracts) has been made in the books of accounts.
t. Contingent liabilities
A contingent liability is a possible obligation that arises from past events whose existence will be confirmed by the occurrence or non-occurrence of one or more uncertain future events beyond the control of the Company
or a present obligation that is not recognized because it is not probable that an outflow of resources will be required to settle the obligation. A contingent liability also arises in extremely rare cases where there is a liability that cannot be recognized because it cannot be measured reliably. The Company does not recognize a contingent liability but discloses its existence in the financial statements.
u. Cash and Cash equivalents
Cash and cash equivalents in the cash flow statement comprise cash at bank and in hand and short- term investments with an original maturity of three months or less.
notes to consolIdAted fInAncIAl stAtements for the year ended March 31, 2017

136 Lumax Industries Limited
notes to consolIdAted fInAncIAl stAtements for the year ended March 31, 2017
3. SHARE CAPITALAmount in `
As at March 31, 2017
As at March 31, 2016
Authorized shares
12,000,000 (Previous year 12,000,000) equity shares of ` 10/- each 120,000,000 120,000,000
Issued, subscribed and fully paid up shares
9,347,732 (Previous year 9,347,732) equity shares of ` 10/- each 93,477,320 93,477,320
a. Reconciliation of shares outstanding at the beginning and at the end of the reporting year
As at March 31, 2017 As at March 31, 2016
Nos. Amount in ` Nos. Amount in `
At the beginning of the year 9,347,732 93,477,320 9,347,732 93,477,320
Issued during the year - - - -
Outstanding at the end of the year 9,347,732 93,477,320 9,347,732 93,477,320
b. Terms/rights attached to equity shares
The Company has only one class of equity shares having a par value of ` 10 per share. Each holder of equity shares is entitled to one vote per share. The Company declares and pays dividends in Indian rupees. The dividend proposed by the Board of Directors is subject to the approval of shareholders in the ensuing Annual General Meeting
In the event of liquidation of the Company, the holders of equity shares will be entitled to receive remaining assets of the Company, after distribution of all preferential amounts. The distribution will be in proportion to the number of equity shares held by the shareholders.
c. Details of shareholders holding more than 5% shares in the Company
As at March 31, 2017 As at March 31, 2016Nos. % holding in
the class Nos. % holding in
the class Equity shares of ` 10 each fully paidStanley Electric Co. Limited 3,343,381 35.77% 3,343,381 35.77%Dhanesh Kumar Jain 1,938,025 20.73% 1,938,025 20.73%Lumax Auto Technologies Limited 525,000 5.62% 525,000 5.62%
As per records of the company, including its register of shareholders/ members and other declarations received from shareholders regarding beneficial interest, the above shareholding represents both legal and beneficial ownership of shares.

Annual Report 2016-17 137
Co
rpo
rate Overview
Statu
tory R
epo
rtsFin
ancial S
tatemen
ts
notes to consolIdAted fInAncIAl stAtements for the year ended March 31, 2017
d. Proposed dividend on Equity shares:Amount in `
As at March 31, 2017
As atMarch 31, 2016
The Board proposed dividend on equity shares after the balance sheet dateProposed dividend on equity shares for the year ended ` 14.50 per share (Previous year: Nil)
135,542,114 -
Dividend Distribution Tax on proposed dividend 27,593,185 - 163,135,299 -
4. RESERVES AND SURPLUSAmount in `
As at March 31, 2017
As at March 31, 2016
Capital reserve 65,138 65,138 Captial Reserve in Associates 105,965,591 105,965,591 Securities premium account 679,665,909 679,665,909 Revaluation reserve Balance as per the last financial statements 77,067,268 77,346,536 Less: amount transferred to General Reserve - (279,268)Less: amount adjusted against Land & Building pursuant to applicability of reised AS 10
(77,067,268) -
Closing Balance - 77,067,268 general reserve Balance as per the last financial statements 637,079,268 599,300,000 Add: amount transferred from surplus balance in the statement of profit and loss
54,200,000 37,500,000
Add: amount transferred from Revaluation Reserve - 279,268 Closing Balance 691,279,268 637,079,268
Surplus as per the statement of profit and lossOpening share of Profit of Associate - 389,401,043 Balance as per the last financial statements 1,090,348,632 353,196,071 Add: Profit for the year 552,188,209 520,259,966 Less:- AppropriationsFinal equity dividend (Previous year: ` 12.00 per share) - (112,172,784)Tax on equity dividend - (22,835,664)Transfer to general reserve (54,200,000) (37,500,000)Total appropriations (54,200,000) (172,508,448)Net surplus in the statement of profit and loss 1,588,336,841 1,090,348,632 Total reserves and surplus 3,065,312,747 2,590,191,806

138 Lumax Industries Limited
5. LONg TERM BORROWINgSAmount in `
Non-current portion Current maturitiesAs at
March 31, 2017As at
March 31, 2016As at
March 31, 2017As at
March 31, 2016Term loansIndian rupee loan from banks (secured) 36,376,956 64,319,574 56,896,040 49,919,430 Foreign currency loan from banks (secured) - 41,409,370 40,531,250 269,160,938
36,376,956 105,728,944 97,427,290 319,080,368 The above amount includesSecured borrowings 36,376,956 105,728,944 97,427,290 319,080,368 Amount disclosed under the head "other current liabilities" (Note 11)
(97,427,290) (319,080,368)
Net amount 36,376,956 105,728,944 - -
Notes:
1 Indian Rupee Loan from Bank includes:
(a) ̀ 27,937,500/- (Previous year ` 50,287,500/-) taken in the Financial Year 2013-14 carries interest @ 10% p.a. at present. The loan is repayable in 16 equal quarterly installments of ` 5,587,500/- (excluding interest) after one year moratorium period from the disbursement date i.e. from 04.04.2013. The Loan is secured by way of first pari passu charge on the land and building situated at Sohna, Gurgaon (Haryana) unit.
(b) ̀ 12,968,750/- (Previous year ` 23,343,750/-) taken in the Financial Year 2014-15 carries interest @ 10.70% p.a. at present. The loan is repayable in 16 equal quarterly installments of ̀ 2,593,750/- (excluding interest) from the disbursement date i.e. from 10.06.2014. The Loan is secured by way of first pari passu charge on the land and building situated at Sohna, Gurgaon (Haryana) unit.
(c) ̀ 52,366,746/- (Previous year ` 40,607,754/-) vehicle loans from banks at interest @ 7.90% - 11.50% aggregating to are secured by way of hypothecation of the respective vehicles acquired out of the proceeds thereof. These loans are repayable over a period of three years from the date of availment.
2 Foreign Currency Loan from Bank includes:
(a) ̀ Nil (Previous year ` 20,704,683/-) taken in the financial year 2011-12 carried interest @ LIBOR plus 260 BSP. The loan was secured by way of first & exclusive charge on the land and building along with all the plant and machineries, situated at Bawal (Haryana) unit both present and future. The amount has been repaid during the year.
(b) ̀ Nil (Previous year ` 82,818,750/-) taken in the financial year 2011-12 carried interest @ LIBOR plus 260 BSP. The loan was secured by way of first & exclusive charge on the land and building along with all the plant and machineries, situated at Bawal (Haryana) unit both present and future. The amount has been repaid during the year.
(c) ̀ Nil (Previous year ` 82,818,750/-) taken in the financial year 2011-12 carried interest @ LIBOR plus 350 BSP. The loan was secured by way of first and exclusive pari passu charge on the land and building alongwith all other moveable fixed assets, situated at Pant Nagar (Uttrakhand) unit both present and future. The amount has been repaid during the year.
(d) ̀ 40,531,250/- (Previous year ` 124,228,125/-) taken in the financial year 2012-13 carries interest @ LIBOR plus 350 BSP. The loan is repayable in 16 quarterly installments of ` 17,437,500/- after one year moratorium period from the disbursement date i.e. from 28.08.2013. The loan is secured by way of first and exclusive pari passu charge on the land and building alongwith all other moveable fixed assets, situated at Haridwar (Uttrakhand) and all other movable fixed assets of Bangalore (Karnataka) unit both present and future.
notes to consolIdAted fInAncIAl stAtements for the year ended March 31, 2017

Annual Report 2016-17 139
Co
rpo
rate Overview
Statu
tory R
epo
rtsFin
ancial S
tatemen
ts
6. DEFERRED TAX LIABILITIES (NET)Amount in `
As at March 31, 2017
As at March 31, 2016
Deferred tax LiabilityFixed assets: Impact of difference between tax depreciation and depreciation/ amortization charged for the financial reporting
475,166,007 438,453,197
Unrealised forex gain of capital nature (1,288,923) 762,082 gross deferred tax liability (A) 473,877,084 439,215,279 Deferred tax assetImpact of expenditure charged to the statement of profit and loss but allowable for tax purposes on payment basis
78,163,311 56,219,678
Provision for doubtful debts and advances 3,394,150 2,818,016 Unabsorbed depreciation 112,879,766 185,759,218 gross deferred tax asset (B) 194,437,227 244,796,912 Net deferred tax liability (A-B) 279,439,857 194,418,367
7. OTHER LONg-TERM LIABILITIESAmount in `
As at March 31, 2017
As at March 31, 2016
OthersPayable for capital goods (including payable towards leasehold land) 216,454,500 220,657,500 Security deposits (Interest free) 970,239 3,055,044
217,424,739 223,712,544
8. PROVISIONS
Amount in `Long-term Short-term
As at March 31, 2017
As at March 31, 2016
As at March 31, 2017
As at March 31, 2016
Provision for employee benefitsProvision for leave benefits 114,598,344 92,716,007 11,907,942 9,180,439 Provision for gratuity (Note 29) - - 54,095,627 39,715,106
114,598,344 92,716,007 66,003,569 48,895,545 Other provisionsProvision for warranties {Refer point (a) below}
- - 3,274,000 7,017,000
- - 3,274,000 7,017,000 114,598,344 92,716,007 69,277,569 55,912,545
notes to consolIdAted fInAncIAl stAtements for the year ended March 31, 2017

140 Lumax Industries Limited
notes to consolIdAted fInAncIAl stAtements for the year ended March 31, 2017
(a) Provision for warranties
A provision is recognized for expected warranty claims on products sold during the last one year, based on past experience of the level of repairs and returns. It is expected that all of these costs will be incurred in the next financial year after the reporting date. Assumptions used to calculate the provision for warranties were based on current sales levels and current information available about warranty based on the one-year period for all products sold.
The table below gives information about movement in warranty provisions.Amount in `
As at March 31, 2017
As at March 31, 2016
At the beginning of the year 7,017,000 7,134,000 Arising during the year 2,211,191 11,791,544 Utilized during the year (5,954,191) (11,908,544)At the end of the year (current portion) 3,274,000 7,017,000
9. SHORT-TERM BORROWINgSAmount in `
As at March 31, 2017
As at March 31, 2016
Commercial Papers (unsecured) 400,000,000 -Cash credit/Working Capital facility from banks (secured) 96,791,970 450,891,414 Vendor finance facility from banks (unsecured) 293,429,152 397,362,227
790,221,122 848,253,641
Notes:
(a) Cash credit facility of ` Nil (Previous year ` 8,670,747/-) was secured by way of first pari passu charge on all current assets of the Company. This facility was further secured by extension of charge by way of hypothecation on the Plant and Machinery along with the UREM on Land and Building situated at Chakan Unit of the Company, & carried interest @ 10.20%. The amount has been repaid during the year.
(b) WCDL Facility of ̀ Nil (Previous year ̀ 150,000,000/-) & Cash Credit facility of ̀ Nil (Previous year ̀ Nil) was secured by way of first pari passu charge on all current assets of the Company. This facility was further secured by way of equitable mortgage on Land and Buildings and first pari passu charges against movable Fixed Assets at Chinchwad Unit of the Company & carried interest @ 9.35%. and 8.95%.
(c) Cash Credit facility of ` 76,998,098/- (Previous year ` 92,220,667/-) & WCDL Facility of ` Nil (Previous year ` Nil) is secured by way of first pari passu charge on all current assets of the Company. This facility is further secured by way of equitable mortgage on Land and Buildings and first pari passu charges against movable Fixed Assets at Chinchwad Unit of the Company, repayable on demand and carries interest @ 9.25% for the current year & 9.65% respectively for the previous year.
(d) WCDL Facility of ` Nil (Previous year ` 200,000,000/-) was secured by way of first pari passu charge on all current assets of the Company. This facility was further secured by way of equitable mortgage on Land and Buildings and first pari passu charges against movable Fixed Assets at Chinchwad Unit of the Company, repayable on demand and carried interest @ 9.50%.
(e) Vendor Finance Facility from MSIL of ` 193,429,152/- (Previous year ` 397,362,227/-) is repayable on 60 days from respective drawdown & carries interest @ 8.45%.
(f) Vendor Finance Facility from MSIL of ` 100,000,000/- (Previous year ` Nil) is repayable on 60 days from respective drawdown & carries interest @ 8.10 %.
(g) Commercial paper issued to Bank amounting to ` 400,000,000/- (previous year Nil) carrying interest rate ranging from 6.95 % p.a. to 7.25% p.a. Commercial paper is payable by 31 May 2017. This facility is unsecured short term borrowing. Unexpired discount on commercial papers is ` 4,683,467/- (Previous year Nil), towards interest accrued but not due.
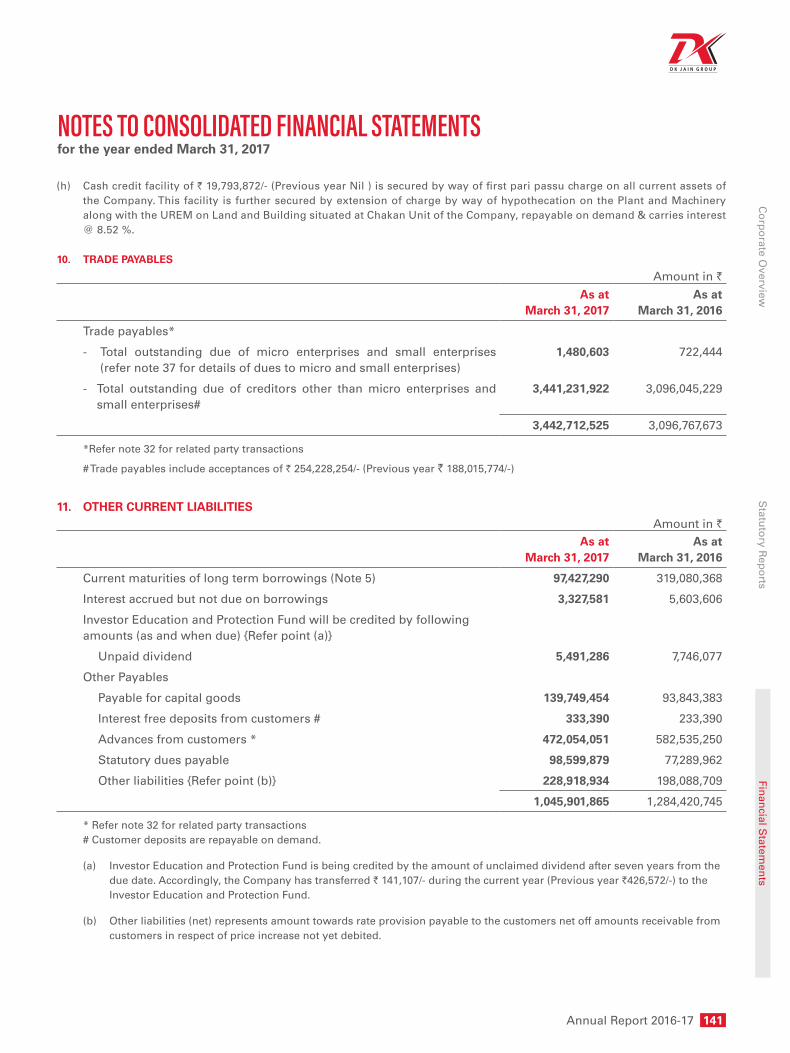
Annual Report 2016-17 141
Co
rpo
rate Overview
Statu
tory R
epo
rtsFin
ancial S
tatemen
ts
notes to consolIdAted fInAncIAl stAtements for the year ended March 31, 2017
(h) Cash credit facility of ` 19,793,872/- (Previous year Nil ) is secured by way of first pari passu charge on all current assets of the Company. This facility is further secured by extension of charge by way of hypothecation on the Plant and Machinery along with the UREM on Land and Building situated at Chakan Unit of the Company, repayable on demand & carries interest @ 8.52 %.
10. TRADE PAYABLES
Amount in `
As at March 31, 2017
As at March 31, 2016
Trade payables*
- Total outstanding due of micro enterprises and small enterprises (refer note 37 for details of dues to micro and small enterprises)
1,480,603 722,444
- Total outstanding due of creditors other than micro enterprises and small enterprises#
3,441,231,922 3,096,045,229
3,442,712,525 3,096,767,673
*Refer note 32 for related party transactions
# Trade payables include acceptances of ` 254,228,254/- (Previous year ` 188,015,774/-)
11. OTHER CURRENT LIABILITIESAmount in `
As at March 31, 2017
As at March 31, 2016
Current maturities of long term borrowings (Note 5) 97,427,290 319,080,368
Interest accrued but not due on borrowings 3,327,581 5,603,606
Investor Education and Protection Fund will be credited by following amounts (as and when due) {Refer point (a)}
Unpaid dividend 5,491,286 7,746,077
Other Payables
Payable for capital goods 139,749,454 93,843,383
Interest free deposits from customers # 333,390 233,390
Advances from customers * 472,054,051 582,535,250
Statutory dues payable 98,599,879 77,289,962
Other liabilities {Refer point (b)} 228,918,934 198,088,709
1,045,901,865 1,284,420,745
* Refer note 32 for related party transactions # Customer deposits are repayable on demand.
(a) Investor Education and Protection Fund is being credited by the amount of unclaimed dividend after seven years from the due date. Accordingly, the Company has transferred ` 141,107/- during the current year (Previous year `426,572/-) to the Investor Education and Protection Fund.
(b) Other liabilities (net) represents amount towards rate provision payable to the customers net off amounts receivable from customers in respect of price increase not yet debited.

142 Lumax Industries Limited
notes to consolIdAted fInAncIAl stAtements for the year ended March 31, 2017
12. PROPERTY, PLANT & EQUIPMENT
Particulars Land Buildings Plant and Machinery
Furniture & Fixtures
Office Equipment
Vehicles Total
Leased Freehold Owned
Cost or Valuation
At 01.04.2015 280,236,142 259,094,226 1,121,020,212 5,122,850,003 89,613,517 9,351,530 102,386,932 6,984,552,562
Additions - - 586,796 449,397,805 3,465,327 3,738,986 46,945,068 504,133,982
Deductions/Adjustments - - - (22,822,578) (45,244) - (25,637,972) (48,505,794)
At 01.04.2016 280,236,142 259,094,226 1,121,607,008 5,549,425,230 93,033,600 13,090,516 123,694,028 7,440,180,750
Additions - - 8,517,616 572,176,516 6,798,934 4,248,985 43,566,258 635,308,309
Store & Spares Transferred From Inventory {Refer 2.1(1)}
- - - 9,521,291 - - - 9,521,291
Adjustment of Revaluation Reserve {Refer 2.1(3)}
(18,219,916) (64,449,364) (1,351,066) (10,808,536) - - - (94,828,882)
Deductions/Adjustments (248,966,250) - (152,339,889) (75,305,142) (73,175) - (7,891,406) (484,575,862)
At 31.03.2017 13,049,976 194,644,862 976,433,669 6,045,009,359 99,759,359 17,339,501 159,368,880 7,505,605,606
Depreciation / Amortisation
At 01.04.2015 47,069,018 - 256,569,578 2,622,975,476 57,367,684 3,163,185 64,895,344 3,052,040,285
For The Year 7,211,595 - 37,743,178 296,790,072 5,382,666 2,400,982 15,430,626 364,959,119
Deductions/Adjustments - - - (15,104,735) (44,340) - (15,892,872) (31,041,947)
At 01.04.2016 54,280,613 - 294,312,756 2,904,660,813 62,706,010 5,564,167 64,433,098 3,385,957,457
For The Year {Refer 2.1(1)} 3,889,574 - 35,435,728 328,774,299 5,175,553 3,031,225 17,944,731 394,251,110
Adjustment of Revaluation Reserve {Refer 2.1(3)}
(5,939,555) - (1,292,791) (10,802,175) - - - (18,034,521)
Deductions/Adjustments (50,876,257) - (17,540,336) (22,386,474) (63,919) - (6,515,905) (97,382,891)
At 31.03.2017 1,354,375 - 310,915,357 3,200,246,463 67,817,644 8,595,392 75,861,924 366,479,155
Net Block
At 01.04.2016 225,955,529 259,094,226 827,294,252 2,644,764,417 30,327,590 7,526,349 59,260,930 4,054,223,293
At 31.03.2017 11,695,601 194,644,862 665,518,312 2,844,762,896 31,941,715 8,744,109 83,506,956 3,840,814,451
Notes :
i) Depreciation for the year includes ̀ 735,787/- (Previous Year ̀ 140,245/-) being depreciation either capitalised / transferred on in-house development of tools.
ii) Written down Value of Building constructed on Leasehold land is ` 67,908,193/- (Previous Year ` 208,380,634/-)
iii) Building given on operating lease
Gross Block ` 30,801,326/- (Previous Year ` 183,141,215/-)
Depreciation Charge for the year ` 3,042,054/- (Previous Year ` 5,521,529/-)
Accumulated Depreciation ` 21,323,938/- (Previous Year ` 35,822,220/-)
Net Book Value ` 9,477,388/- (Previous Year ` 147,318,995/-)
iv) Adjustment of revaluation reserve
Pursuant to transition provisional of revised AS 10, the Company has decided to carry earlier revalued Land, Building and Plant & Machinery as per cost model. Accordingly, the Company has adjusted the balance in revaluation reserve with the related carrying amount of Land, Building and Plant & Machinery. Accordingly, Land is reduced by ` 76,729,725 and Building by ` 58,275.
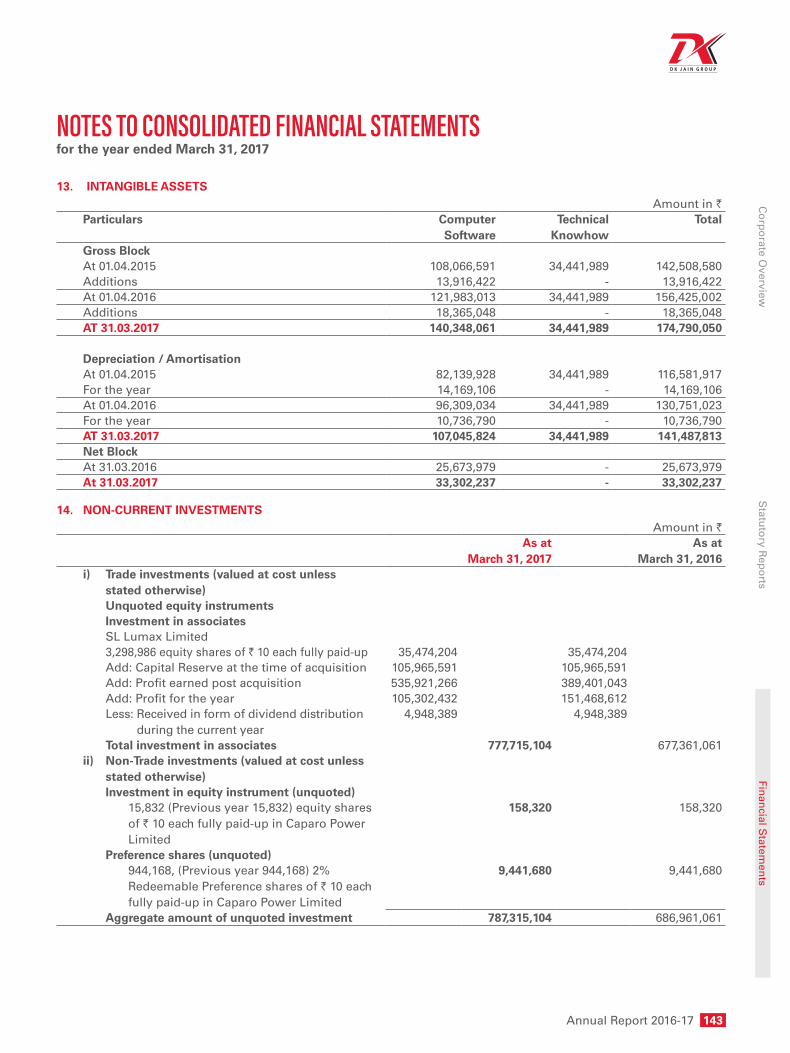
Annual Report 2016-17 143
Co
rpo
rate Overview
Statu
tory R
epo
rtsFin
ancial S
tatemen
ts
notes to consolIdAted fInAncIAl stAtements for the year ended March 31, 2017
13. INTANgIBLE ASSETSAmount in `
Particulars Computer Software
Technical Knowhow
Total
gross BlockAt 01.04.2015 108,066,591 34,441,989 142,508,580 Additions 13,916,422 - 13,916,422 At 01.04.2016 121,983,013 34,441,989 156,425,002 Additions 18,365,048 - 18,365,048 AT 31.03.2017 140,348,061 34,441,989 174,790,050
Depreciation / AmortisationAt 01.04.2015 82,139,928 34,441,989 116,581,917 For the year 14,169,106 - 14,169,106 At 01.04.2016 96,309,034 34,441,989 130,751,023 For the year 10,736,790 - 10,736,790 AT 31.03.2017 107,045,824 34,441,989 141,487,813 Net BlockAt 31.03.2016 25,673,979 - 25,673,979 At 31.03.2017 33,302,237 - 33,302,237
14. NON-CURRENT INVESTMENTSAmount in `
As at March 31, 2017
As atMarch 31, 2016
i) Trade investments (valued at cost unless stated otherwise)
Unquoted equity instruments Investment in associates SL Lumax Limited 3,298,986 equity shares of ` 10 each fully paid-up 35,474,204 35,474,204 Add: Capital Reserve at the time of acquisition 105,965,591 105,965,591 Add: Profit earned post acquisition 535,921,266 389,401,043 Add: Profit for the year 105,302,432 151,468,612 Less: Received in form of dividend distribution
during the current year4,948,389 4,948,389
Total investment in associates 777,715,104 677,361,061 ii) Non-Trade investments (valued at cost unless
stated otherwise) Investment in equity instrument (unquoted) 15,832 (Previous year 15,832) equity shares
of ` 10 each fully paid-up in Caparo Power Limited
158,320 158,320
Preference shares (unquoted) 944,168, (Previous year 944,168) 2%
Redeemable Preference shares of ` 10 each fully paid-up in Caparo Power Limited
9,441,680 9,441,680
Aggregate amount of unquoted investment 787,315,104 686,961,061

144 Lumax Industries Limited
notes to consolIdAted fInAncIAl stAtements for the year ended March 31, 2017
15. LOANS AND ADVANCES
Amount in `Non-current CurrentAs at
March 31, 2017As at
March 31, 2016As at
March 31, 2017As at
March 31, 2016Capital advances*Unsecured, considered good (A) 83,416,857 42,168,002 - - Security deposit*Unsecured, considered good (B) 23,837,901 21,777,829 - - Advances recoverable in cash or kind*Unsecured, considered good 15,658,164 7,873,816 261,316,515 246,089,667 Unsecured, considered doubtful 2,516,938 2,516,938 - -
18,175,102 10,390,754 261,316,515 246,089,667 Provision for doubtful advances (2,516,938) (2,516,938) - -
(C) 15,658,164 7,873,816 261,316,515 246,089,667
Other loans and advances (unsecured, considered good)*Advance income-tax (net of provision for taxation)
2,587,788 1,270,553 - -
MAT credit entitlement 350,783,068 239,219,298 - - Prepaid expenses - - 26,110,800 34,680,245 Loans to employees (interest free) 2,022,018 1,641,412 9,771,366 9,770,322 Balances with statutory/ government authorities
- - 75,403,644 67,797,943
(D) 355,392,874 242,131,263 111,285,810 112,248,510 TOTAL (A+B+C+D) 478,305,796 313,950,910 372,602,325 358,338,177
* Refer note 32 for related party transactions
16. TRADE RECEIVABLES AND OTHER CURRENT ASSETS
16.1 TRADE RECEIVABLES*Amount in `
As at March 31, 2017
As at March 31, 2016
As at March 31, 2017
As at March 31, 2016
Outstanding for a period exceeding six months from the date they are due for paymentUnsecured, considered good - - 38,877,098 15,069,282 Unsecured, considered doubtful 7,290,477 5,625,734 - -
7,290,477 5,625,734 38,877,098 15,069,282 Provision for doubtful receivables (7,290,477) (5,625,734) - -
(A) - - 38,877,098 15,069,282 Other receivablesUnsecured, considered good - - 1,870,544,626 1,796,834,193
(B) - - 1,870,544,626 1,796,834,193 TOTAL (A + B) - - 1,909,421,724 1,811,903,475
* Refer note 32 for related party transactions
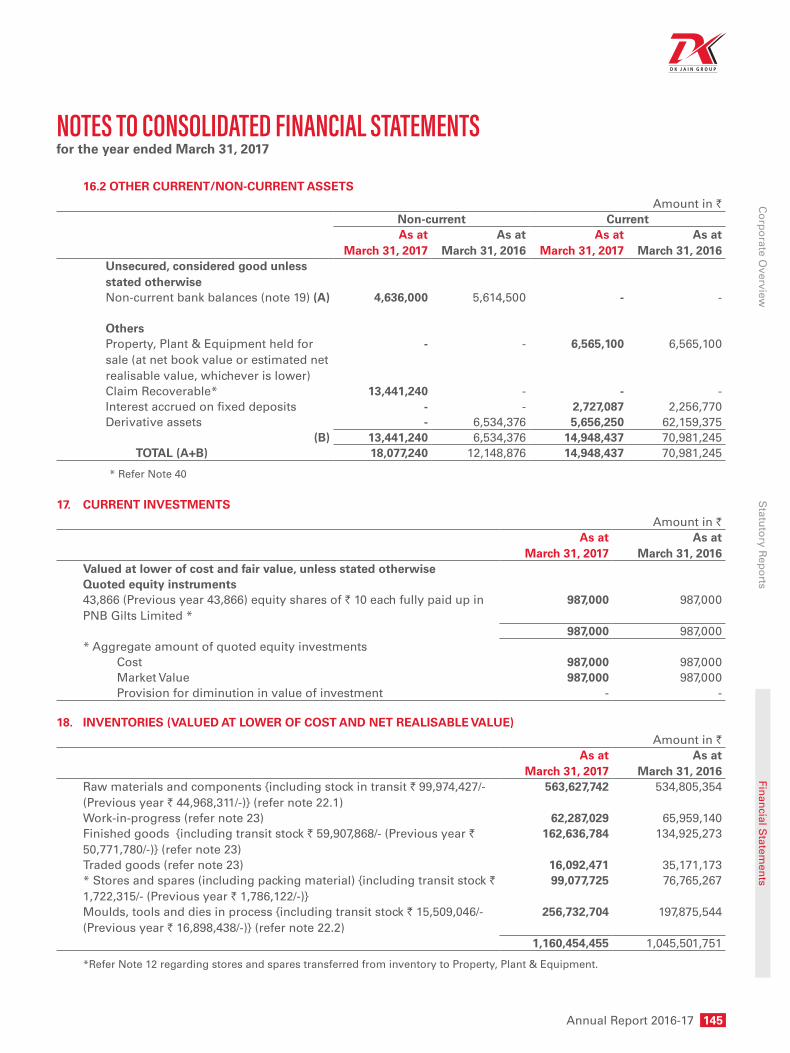
Annual Report 2016-17 145
Co
rpo
rate Overview
Statu
tory R
epo
rtsFin
ancial S
tatemen
ts
notes to consolIdAted fInAncIAl stAtements for the year ended March 31, 2017
16.2 OTHER CURRENT/NON-CURRENT ASSETSAmount in `
Non-current CurrentAs at
March 31, 2017As at
March 31, 2016As at
March 31, 2017As at
March 31, 2016Unsecured, considered good unless stated otherwiseNon-current bank balances (note 19) (A) 4,636,000 5,614,500 - -
OthersProperty, Plant & Equipment held for sale (at net book value or estimated net realisable value, whichever is lower)
- - 6,565,100 6,565,100
Claim Recoverable* 13,441,240 - - - Interest accrued on fixed deposits - - 2,727,087 2,256,770 Derivative assets - 6,534,376 5,656,250 62,159,375
(B) 13,441,240 6,534,376 14,948,437 70,981,245 TOTAL (A+B) 18,077,240 12,148,876 14,948,437 70,981,245
* Refer Note 40
17. CURRENT INVESTMENTSAmount in `
As at March 31, 2017
As at March 31, 2016
Valued at lower of cost and fair value, unless stated otherwiseQuoted equity instruments43,866 (Previous year 43,866) equity shares of ` 10 each fully paid up in PNB Gilts Limited *
987,000 987,000
987,000 987,000 * Aggregate amount of quoted equity investments Cost 987,000 987,000 Market Value 987,000 987,000 Provision for diminution in value of investment - -
18. INVENTORIES (VALUED AT LOWER OF COST AND NET REALISABLE VALUE)Amount in `
As at March 31, 2017
As atMarch 31, 2016
Raw materials and components {including stock in transit ` 99,974,427/- (Previous year ` 44,968,311/-)} (refer note 22.1)
563,627,742 534,805,354
Work-in-progress (refer note 23) 62,287,029 65,959,140 Finished goods {including transit stock ` 59,907,868/- (Previous year ` 50,771,780/-)} (refer note 23)
162,636,784 134,925,273
Traded goods (refer note 23) 16,092,471 35,171,173 * Stores and spares (including packing material) {including transit stock ` 1,722,315/- (Previous year ` 1,786,122/-)}
99,077,725 76,765,267
Moulds, tools and dies in process {including transit stock ` 15,509,046/- (Previous year ` 16,898,438/-)} (refer note 22.2)
256,732,704 197,875,544
1,160,454,455 1,045,501,751
*Refer Note 12 regarding stores and spares transferred from inventory to Property, Plant & Equipment.
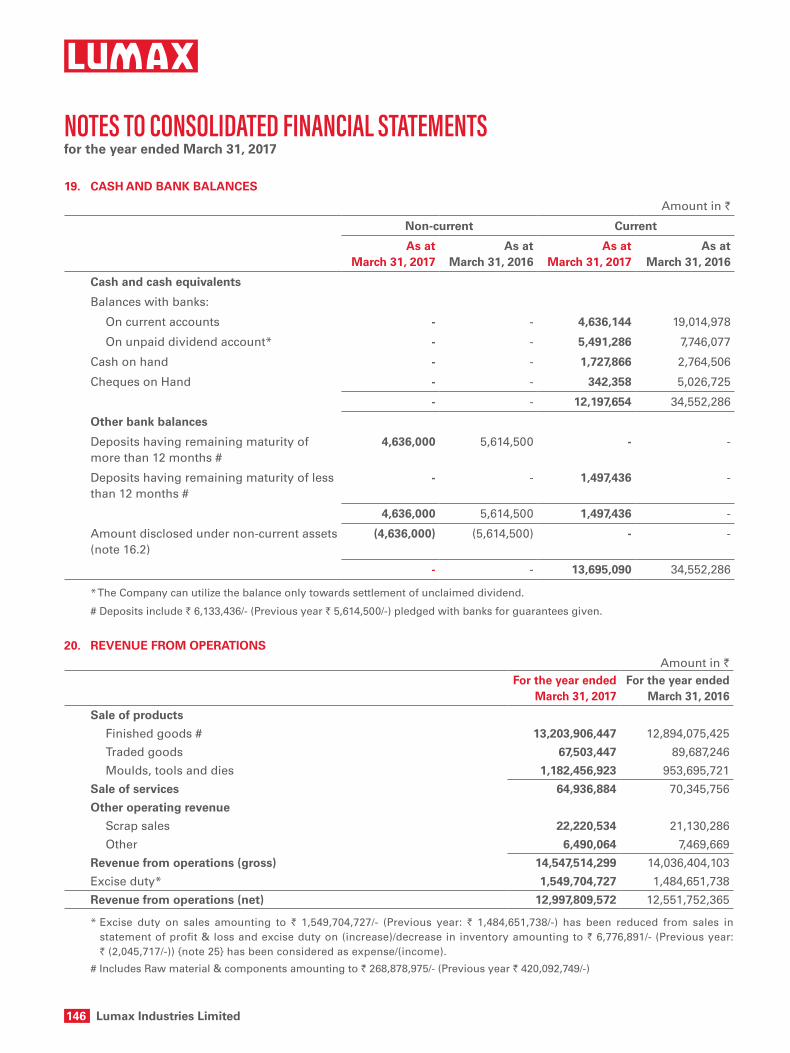
146 Lumax Industries Limited
notes to consolIdAted fInAncIAl stAtements for the year ended March 31, 2017
19. CASH AND BANK BALANCES
Amount in `
Non-current Current
As at March 31, 2017
As at March 31, 2016
As at March 31, 2017
As at March 31, 2016
Cash and cash equivalents
Balances with banks:
On current accounts - - 4,636,144 19,014,978
On unpaid dividend account* - - 5,491,286 7,746,077
Cash on hand - - 1,727,866 2,764,506
Cheques on Hand - - 342,358 5,026,725
- - 12,197,654 34,552,286
Other bank balances
Deposits having remaining maturity of more than 12 months #
4,636,000 5,614,500 - -
Deposits having remaining maturity of less than 12 months #
- - 1,497,436 -
4,636,000 5,614,500 1,497,436 -
Amount disclosed under non-current assets (note 16.2)
(4,636,000) (5,614,500) - -
- - 13,695,090 34,552,286
* The Company can utilize the balance only towards settlement of unclaimed dividend.
# Deposits include ` 6,133,436/- (Previous year ` 5,614,500/-) pledged with banks for guarantees given.
20. REVENUE FROM OPERATIONSAmount in `
For the year ended March 31, 2017
For the year endedMarch 31, 2016
Sale of products
Finished goods # 13,203,906,447 12,894,075,425
Traded goods 67,503,447 89,687,246
Moulds, tools and dies 1,182,456,923 953,695,721
Sale of services 64,936,884 70,345,756
Other operating revenue
Scrap sales 22,220,534 21,130,286
Other 6,490,064 7,469,669
Revenue from operations (gross) 14,547,514,299 14,036,404,103
Excise duty* 1,549,704,727 1,484,651,738
Revenue from operations (net) 12,997,809,572 12,551,752,365
* Excise duty on sales amounting to ` 1,549,704,727/- (Previous year: ` 1,484,651,738/-) has been reduced from sales in statement of profit & loss and excise duty on (increase)/decrease in inventory amounting to ` 6,776,891/- (Previous year: ` (2,045,717/-)) {note 25} has been considered as expense/(income).
# Includes Raw material & components amounting to ` 268,878,975/- (Previous year ` 420,092,749/-)

Annual Report 2016-17 147
Co
rpo
rate Overview
Statu
tory R
epo
rtsFin
ancial S
tatemen
ts
notes to consolIdAted fInAncIAl stAtements for the year ended March 31, 2017
Details of products soldAmount in `
For the year ended March 31, 2017
For the year endedMarch 31, 2016
Finished goods sold#
Automotive Lamps 13,203,906,447 12,889,052,831 Gear shifter - 5,022,594 Total 13,203,906,447 12,894,075,425
# Includes Raw material & components amounting to ` 268,878,975/- (Previous year ` 420,092,749/-)
Amount in `For the year ended
March 31, 2017For the year ended
March 31, 2016Traded goods soldAutomotive Lamps 67,503,447 89,687,246 Total 67,503,447 89,687,246
Tools, moulds & dies soldTools & moulds 1,182,456,923 953,695,721 Total 1,182,456,923 953,695,721
Details of services renderedSale of designs 64,936,884 70,345,756 Total 64,936,884 70,345,756
21. OTHER INCOMEAmount in `
For the year ended March 31, 2017
For the year endedMarch 31, 2016
Interest income on Bank deposits 958,748 1,158,907 Others 831,876 954,705 Dividend income on long-term investments 240,770 257,799 Profit on sale / discard of property, plant & equipment (net) 2,781,622 1,284,459 Rent 15,464,570 23,918,588 Provisions/creditors no longer required written back 1,106,454 5,570,487 Exchange difference (net) 22,117,296 - Other non-operating income 13,447,049 5,670,306 Total 56,948,385 38,815,251
22.1 COST OF RAW MATERIAL AND COMPONENTS CONSUMEDAmount in `
For the year ended March 31, 2017
For the year endedMarch 31, 2016
Inventory at the beginning of the year 534,805,354 470,228,897 Add: Purchases 7,560,366,794 7,657,335,093
8,095,172,148 8,127,563,990 Less: Inventory at the end of the year (Note 18) 563,627,742 534,805,354
7,531,544,406 7,592,758,636
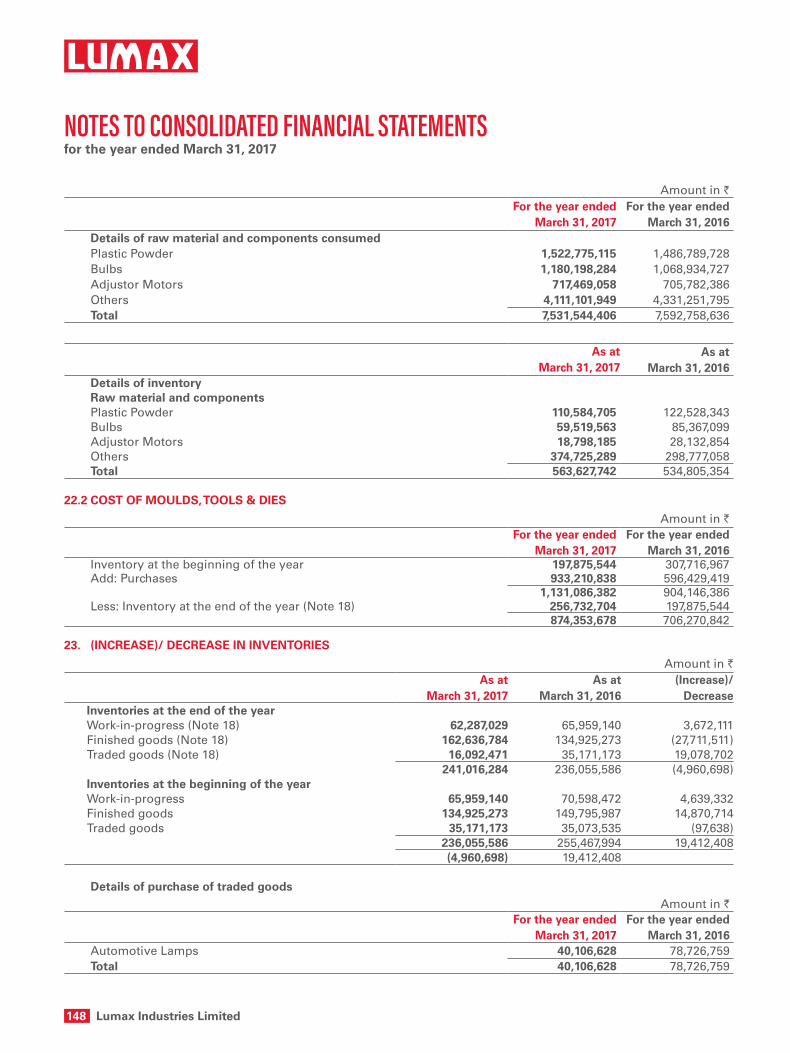
148 Lumax Industries Limited
notes to consolIdAted fInAncIAl stAtements for the year ended March 31, 2017
Amount in `For the year ended
March 31, 2017For the year ended
March 31, 2016Details of raw material and components consumedPlastic Powder 1,522,775,115 1,486,789,728 Bulbs 1,180,198,284 1,068,934,727 Adjustor Motors 717,469,058 705,782,386 Others 4,111,101,949 4,331,251,795 Total 7,531,544,406 7,592,758,636
As at March 31, 2017
As atMarch 31, 2016
Details of inventoryRaw material and componentsPlastic Powder 110,584,705 122,528,343 Bulbs 59,519,563 85,367,099 Adjustor Motors 18,798,185 28,132,854 Others 374,725,289 298,777,058 Total 563,627,742 534,805,354
22.2 COST OF MOULDS, TOOLS & DIES
Amount in `For the year ended
March 31, 2017For the year ended
March 31, 2016Inventory at the beginning of the year 197,875,544 307,716,967 Add: Purchases 933,210,838 596,429,419
1,131,086,382 904,146,386 Less: Inventory at the end of the year (Note 18) 256,732,704 197,875,544
874,353,678 706,270,842
23. (INCREASE)/ DECREASE IN INVENTORIES
Amount in `As at
March 31, 2017As at
March 31, 2016 (Increase)/
DecreaseInventories at the end of the yearWork-in-progress (Note 18) 62,287,029 65,959,140 3,672,111 Finished goods (Note 18) 162,636,784 134,925,273 (27,711,511)Traded goods (Note 18) 16,092,471 35,171,173 19,078,702
241,016,284 236,055,586 (4,960,698)Inventories at the beginning of the yearWork-in-progress 65,959,140 70,598,472 4,639,332 Finished goods 134,925,273 149,795,987 14,870,714 Traded goods 35,171,173 35,073,535 (97,638)
236,055,586 255,467,994 19,412,408 (4,960,698) 19,412,408
Details of purchase of traded goodsAmount in `
For the year ended March 31, 2017
For the year endedMarch 31, 2016
Automotive Lamps 40,106,628 78,726,759 Total 40,106,628 78,726,759

Annual Report 2016-17 149
Co
rpo
rate Overview
Statu
tory R
epo
rtsFin
ancial S
tatemen
ts
notes to consolIdAted fInAncIAl stAtements for the year ended March 31, 2017
Details of InventoryAmount in `
As atMarch 31, 2017
As atMarch 31, 2016
Work-in-progressAutomotive Lamps 61,991,988 58,491,290 Gear shifter 295,041 7,467,850 Total 62,287,029 65,959,140
Finished goodsAutomotive Lamps 162,445,429 127,179,668 Gear shifter 191,355 7,745,605 Total 162,636,784 134,925,273
Traded goodsAutomotive Lamps 16,092,471 35,171,173 Total 16,092,471 35,171,173
24 EMPLOYEE BENEFITS EXPENSEAmount in `
For the year ended March 31, 2017
For the year endedMarch 31, 2016
Salaries, wages and bonus 1,352,469,417 1,205,738,921 Contribution to provident and other fund 58,435,602 50,334,742 Gratuity expense (note 29) 29,154,501 31,860,027 Staff welfare expenses 143,345,163 124,626,130 Commission to Directors 26,870,090 14,097,904
1,610,274,773 1,426,657,724
25 OTHER EXPENSESAmount in `
For the year ended March 31, 2017
For the year endedMarch 31, 2016
Consumption of stores and spares 51,818,917 52,815,108 Packing material consumed 238,335,874 237,183,710 Power and fuel 446,715,718 443,494,504 Rent 20,323,132 16,510,452 Rates and taxes 23,662,276 15,974,692 Insurance 11,717,128 9,170,488 Repairs and maintenance - Plant and machinery 116,002,330 120,168,868 - Buildings 15,402,721 13,830,214 - Others 129,533,487 109,309,667 Freight and forwarding charges 214,952,792 224,789,472 Discount, rebates and claims 1,879,471 2,146,626 Cash discount on sales 28,522,992 27,349,136 Commission on sales - other than sole selling agent 6,380,369 5,331,879 Travelling and conveyance 129,887,043 110,962,414 Legal and Professional Fees 17,092,087 20,630,174 Management Support fees 178,446,018 123,628,508

150 Lumax Industries Limited
notes to consolIdAted fInAncIAl stAtements for the year ended March 31, 2017
Amount in `For the year ended
March 31, 2017For the year ended
March 31, 2016Design, support and testing charges 13,158,936 21,337,846 Directors' sitting fees 1,246,200 1,122,100 Payment to auditors (Refer details below) 5,436,766 6,128,033 Donations 69,000 2,100 Royalty 177,438,579 174,453,661 Warranty costs 2,211,191 11,791,544 (Increase)/ decrease of excise duty on inventory (note 20) 6,776,891 (2,045,717)Exchange difference (net) - 3,006,669 Provision for doubtful debts / advances (net) 1,664,743 109,901 Miscellaneous expenses 106,396,690 89,957,960 Contribution towards Corporate Social Responsibility (note 39) 3,361,859 3,259,049
1,948,433,210 1,842,419,058
Above expenses include research and development expenses (Refer note 38)
Payment to AuditorAmount in `
For the year ended March 31, 2017
For the year endedMarch 31, 2016
As auditor: Audit fee 3,248,467 3,224,300 Tax audit fee 350,000 350,000 Limited Review 1,290,000 1,290,000 In other capacity: Certification fees 40,000 790,000 Reimbursement of expenses 508,299 473,733
5,436,766 6,128,033
26. DEPRECIATION AND AMORTIzATION EXPENSEAmount in `
For the year ended March 31, 2017
For the year endedMarch 31, 2016
Depreciation of property, plant & equipment 393,515,323 364,818,874 Amortization of intangible assets 10,736,790 14,169,106
404,252,113 378,987,980
27. FINANCE COSTSAmount in `
For the year ended March 31, 2017
For the year endedMarch 31, 2016
Interest to banks - on term loans 21,342,082 52,585,682 - on cash credit 85,302,232 69,705,542 Interest others 1,496,491 1,673,315 Bank charges 5,963,440 10,414,308
114,104,245 134,378,847

Annual Report 2016-17 151
Co
rpo
rate Overview
Statu
tory R
epo
rtsFin
ancial S
tatemen
ts
notes to consolIdAted fInAncIAl stAtements for the year ended March 31, 2017
28. EARNINgS PER SHARE (EPS)
Amount in `
March 31, 2017 March 31, 2016
The following reflects the profit and share data used in the basic and diluted EPS computations:
Net profit for calculation of basic and diluted EPS 552,188,209 520,259,966
Weighted average number of equity shares in calculating basic and diluted EPS
9,347,732 9,347,732
Basic and Diluted Earnings per share ({Nominal value of shares of ` 10 (Previous year : ` 10)}
59.07 55.66
29. gRATUITY BENEFIT PLAN The Company operates defined benefit plan for gratuity for its employees. Under the gratuity plan, every employee
who has completed atleast five years of service gets a gratuity on departure @ 15 days of last drawn basic salary including DA for each completed year of service, subject to a maximum amount of ` 1,000,000. The scheme is funded with an insurance Company in the form of qualifying insurance policy.
The following tables summarize the components of net (benefit) / expense recognized in the statement of profit and loss and the funded status and amounts recognized in the balance sheet for the gratuity plan.
Statement of profit and loss
Net employee (benefit) / expense recognized in the employee cost
Amount in `
Particularsgratuity
March 31, 2017 March 31, 2016
Current service cost 14,508,029 11,779,340
Interest cost on benefit obligation 10,820,159 9,355,669
Expected return on plan assets (9,245,428) (9,107,168)
Net actuarial (gain) / loss recognized in the year 13,071,741 19,832,186
Net (benefit) / expense (Refer Note 24) 29,154,501 31,860,027
Actual return on plan assets 9,762,628 9,296,805
Balance sheet
Benefit asset/ (liability)
Particularsgratuity
March 31, 2017 March 31, 2016
Present value of defined benefit obligation 179,470,723 147,962,874
Fair value of plan assets 125,375,096 108,247,768
Plan asset / (liability) (54,095,627) (39,715,106)
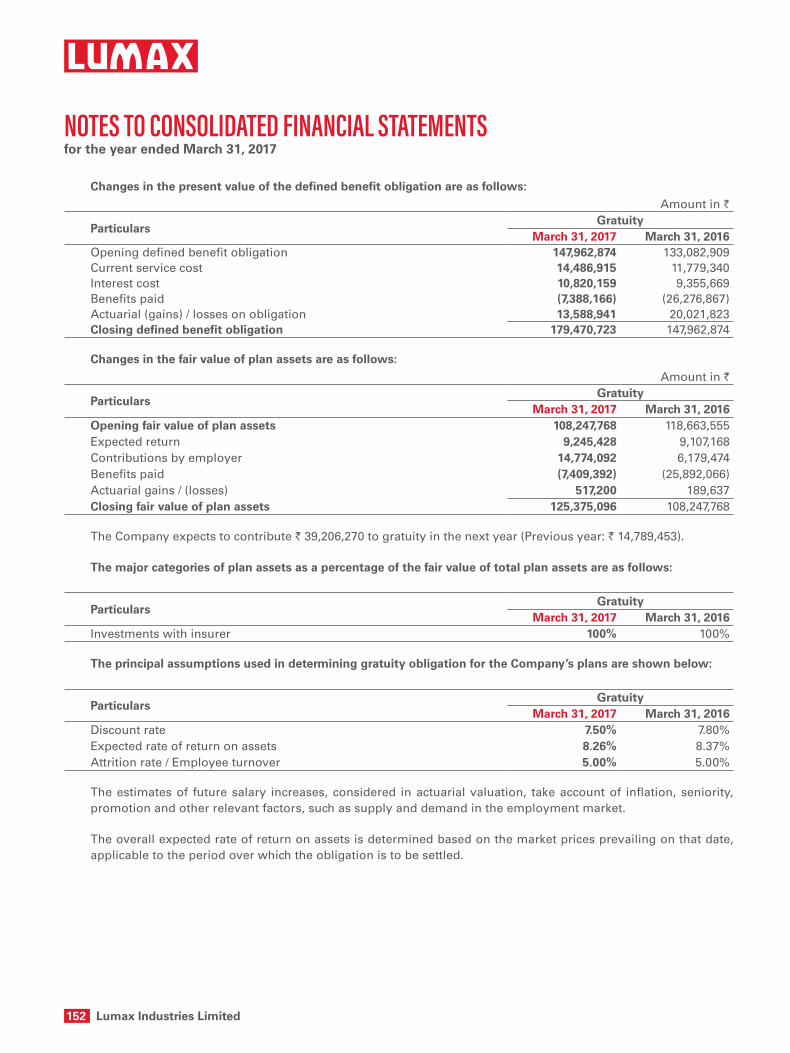
152 Lumax Industries Limited
notes to consolIdAted fInAncIAl stAtements for the year ended March 31, 2017
Changes in the present value of the defined benefit obligation are as follows:Amount in `
Particularsgratuity
March 31, 2017 March 31, 2016Opening defined benefit obligation 147,962,874 133,082,909Current service cost 14,486,915 11,779,340Interest cost 10,820,159 9,355,669Benefits paid (7,388,166) (26,276,867)Actuarial (gains) / losses on obligation 13,588,941 20,021,823Closing defined benefit obligation 179,470,723 147,962,874
Changes in the fair value of plan assets are as follows:Amount in `
Particularsgratuity
March 31, 2017 March 31, 2016Opening fair value of plan assets 108,247,768 118,663,555Expected return 9,245,428 9,107,168Contributions by employer 14,774,092 6,179,474Benefits paid (7,409,392) (25,892,066)Actuarial gains / (losses) 517,200 189,637Closing fair value of plan assets 125,375,096 108,247,768
The Company expects to contribute ` 39,206,270 to gratuity in the next year (Previous year: ` 14,789,453).
The major categories of plan assets as a percentage of the fair value of total plan assets are as follows:
Particularsgratuity
March 31, 2017 March 31, 2016Investments with insurer 100% 100%
The principal assumptions used in determining gratuity obligation for the Company’s plans are shown below:
Particularsgratuity
March 31, 2017 March 31, 2016Discount rate 7.50% 7.80%Expected rate of return on assets 8.26% 8.37%Attrition rate / Employee turnover 5.00% 5.00%
The estimates of future salary increases, considered in actuarial valuation, take account of inflation, seniority, promotion and other relevant factors, such as supply and demand in the employment market.
The overall expected rate of return on assets is determined based on the market prices prevailing on that date, applicable to the period over which the obligation is to be settled.

Annual Report 2016-17 153
Co
rpo
rate Overview
Statu
tory R
epo
rtsFin
ancial S
tatemen
ts
notes to consolIdAted fInAncIAl stAtements for the year ended March 31, 2017
Amounts for the current and previous four periods are as follows:Amount in `
Particulars March 31, 2017 March 31, 2016gratuity Defined benefit obligation 179,470,723 147,962,874Plan assets 125,375,096 108,247,768Surplus / (deficit) (54,095,627) (39,715,106)Experience adjustments on plan liabilities
13,588,941 20,021,823
Experience adjustments on plan assets 517,200 189,637
30. CAPITALIzATION OF EXPENDITURE
(a) A project to set up a manufacturing plant in Sanand has started from October, 2016. The detail of Pre-operating expenses included in Capital work-in-progress in respect of project work are shown below. Consequently, expenses disclosed under the respective notes are net of amounts capitalized by the company.
Amount in `Head-wise expense March 31, 2017 March 31, 2016Insurance 733,249 -Light & power exp. 670,575 -Manpower cost 777,693 -Miscellanies expenses 540,369 -Security service 135,835 -Travelling exp. 4,293,761 -Interest 1,146,371 -Total 8,297,853 -
(b) The following expenses have been reduced from the respective heads and have been included in the cost of moulds, tools and dies capitalized. Consequently, expenses disclosed under the respective notes are net of amounts capitalized by the company.
Amount in `Particulars March 31, 2017 March 31, 2016
Repair and Maintenance – Plant & Machinery 1,117,160 67,524Repair and Maintenance – Others 255,633 118,028Miscellaneous Expenses - 1,248,281Total 1,372,793 1,433,834
31. SEgMENT INFORMATION
Business Segments:
The Company produces various types of automotive lighting systems. Since the Company’s business activity falls within a single business segment, there are no additional disclosures to be provided under Accounting Standard-17 ‘Segment Reporting’ other than those already provided in the Financial Statements.
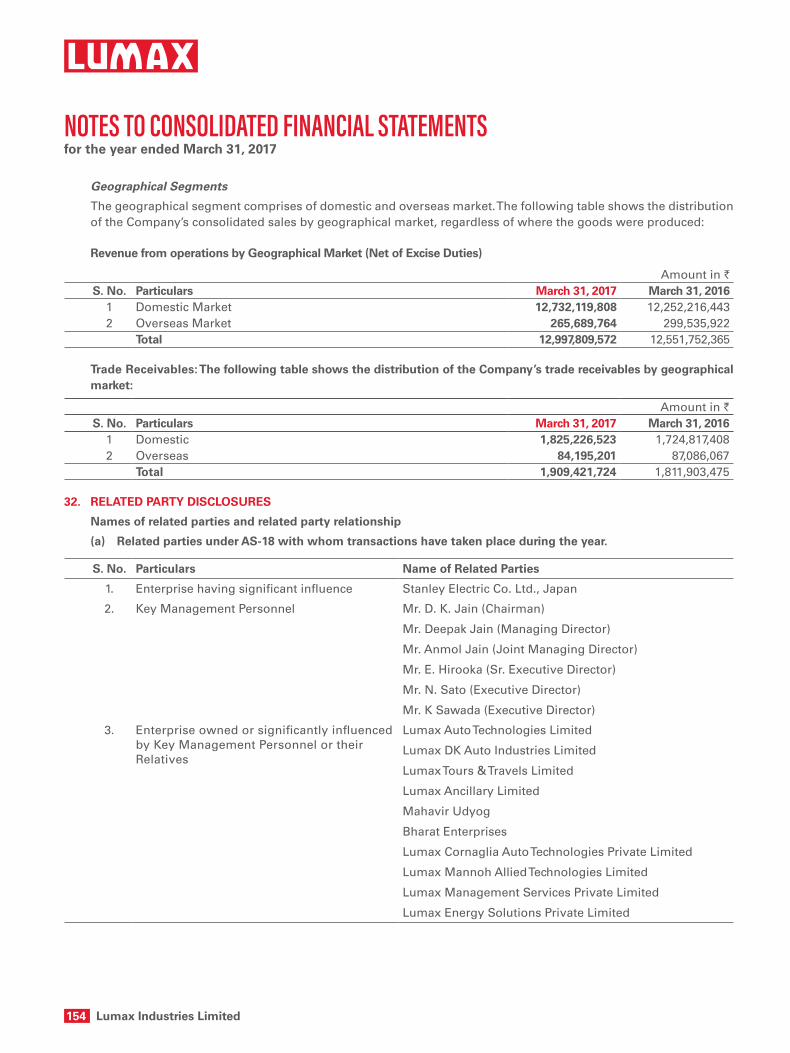
154 Lumax Industries Limited
notes to consolIdAted fInAncIAl stAtements for the year ended March 31, 2017
Geographical Segments
The geographical segment comprises of domestic and overseas market. The following table shows the distribution of the Company’s consolidated sales by geographical market, regardless of where the goods were produced:
Revenue from operations by geographical Market (Net of Excise Duties)
Amount in `S. No. Particulars March 31, 2017 March 31, 2016
1 Domestic Market 12,732,119,808 12,252,216,4432 Overseas Market 265,689,764 299,535,922
Total 12,997,809,572 12,551,752,365
Trade Receivables: The following table shows the distribution of the Company’s trade receivables by geographical market:
Amount in `S. No. Particulars March 31, 2017 March 31, 2016
1 Domestic 1,825,226,523 1,724,817,4082 Overseas 84,195,201 87,086,067
Total 1,909,421,724 1,811,903,475
32. RELATED PARTY DISCLOSURES
Names of related parties and related party relationship
(a) Related parties under AS-18 with whom transactions have taken place during the year.
S. No. Particulars Name of Related Parties
1. Enterprise having significant influence Stanley Electric Co. Ltd., Japan
2. Key Management Personnel Mr. D. K. Jain (Chairman)
Mr. Deepak Jain (Managing Director)
Mr. Anmol Jain (Joint Managing Director)
Mr. E. Hirooka (Sr. Executive Director)
Mr. N. Sato (Executive Director)
Mr. K Sawada (Executive Director)
3. Enterprise owned or significantly influenced by Key Management Personnel or their Relatives
Lumax Auto Technologies Limited
Lumax DK Auto Industries Limited
Lumax Tours & Travels Limited
Lumax Ancillary Limited
Mahavir Udyog
Bharat Enterprises
Lumax Cornaglia Auto Technologies Private Limited
Lumax Mannoh Allied Technologies Limited
Lumax Management Services Private Limited
Lumax Energy Solutions Private Limited
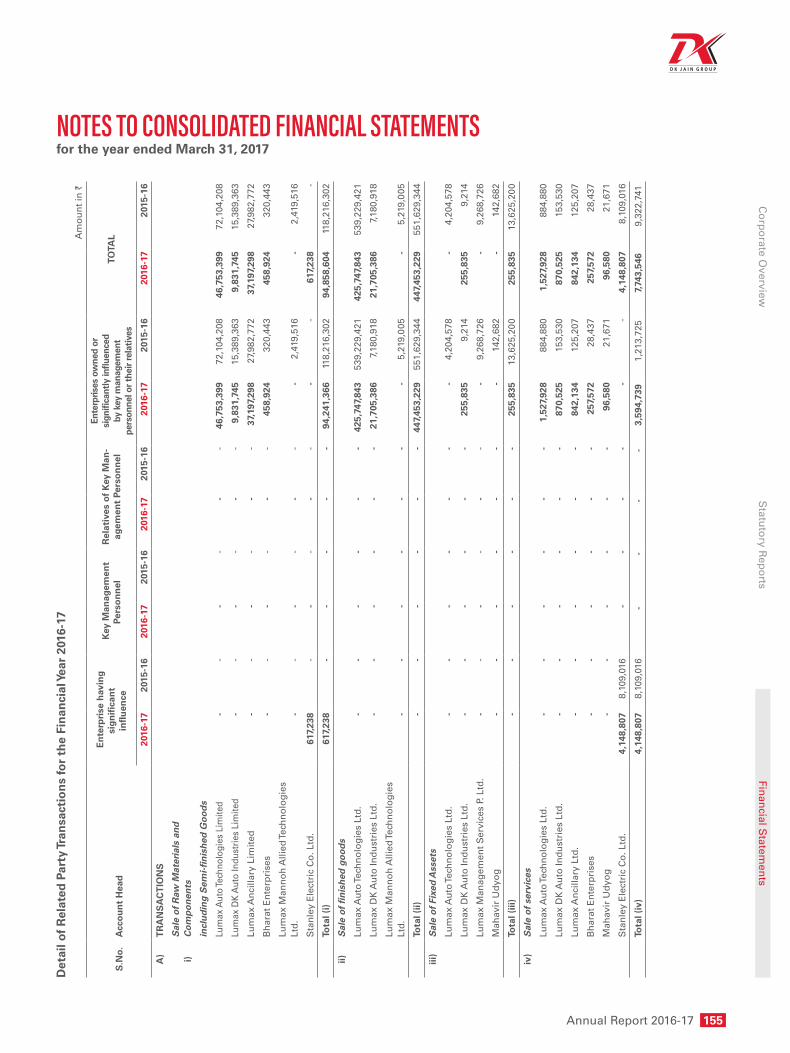
Annual Report 2016-17 155
Co
rpo
rate Overview
Statu
tory R
epo
rtsFin
ancial S
tatemen
ts
notes to consolIdAted fInAncIAl stAtements for the year ended March 31, 2017
Det
ail o
f R
elat
ed P
arty
Tran
sact
ion
s fo
r th
e Fi
nan
cial
Yea
r 20
16-1
7A
mo
un
t in
`
S.N
o.A
cco
un
t H
ead
En
terp
rise
hav
ing
si
gn
ifica
nt
in
flu
ence
Key
Man
agem
ent
Pers
on
nel
R
elat
ives
of
Key
Man
-ag
emen
t Pe
rso
nn
el
Ente
rpris
es o
wne
d or
si
gnifi
cant
ly in
fluen
ced
by
key
man
agem
ent
pe
rson
nel o
r th
eir
rela
tive
s
TOTA
L
2016
-17
2015
-16
201
6-17
2
015-
16
201
6-17
2
015-
16
2016
-17
201
5-16
2
016-
17
201
5-16
A)
TR
AN
SA
CT
ION
S
i)S
ale
of
Raw
Mat
eria
ls a
nd
C
om
po
nen
ts
in
clu
din
g S
emi-
fin
ish
ed G
oo
ds
Lu
max
Aut
o Te
chno
logi
es L
imite
d-
--
--
-46
,753
,399
72,1
04,2
0846
,753
,399
72,1
04,2
08
Lu
max
DK
Aut
o In
dust
ries
Lim
ited
--
--
--
9,83
1,74
515
,389
,363
9,83
1,74
515
,389
,363
Lu
max
An
cilla
ry L
imit
ed-
--
--
-37
,197
,298
27,9
82,7
7237
,197
,298
27,9
82,7
72
B
har
at E
nte
rpri
ses
--
--
--
458,
924
320,
443
458,
924
320,
443
Lu
max
Man
no
h A
llied
Tech
no
log
ies
Ltd
.-
--
--
--
2,41
9,51
6-
2,41
9,51
6
S
tan
ley
Ele
ctri
c C
o. L
td.
617,
238
--
--
--
-61
7,23
8-
To
tal (
i)61
7,23
8-
--
--
94,2
41,3
6611
8,21
6,30
294
,858
,604
118,
216,
302
ii)S
ale
of
fin
ish
ed g
oo
ds
Lu
max
Au
to Te
chn
olo
gie
s Lt
d.
--
--
--
425,
747,
843
539,
229,
421
425,
747,
843
539,
229,
421
Lu
max
DK
Au
to In
du
stri
es L
td.
--
--
--
21,7
05,3
867,
180,
918
21,7
05,3
867,
180,
918
Lu
max
Man
no
h A
llied
Tech
no
log
ies
Ltd
.-
--
--
--
5,21
9,00
5-
5,21
9,00
5
To
tal (
ii)-
--
--
-44
7,45
3,22
955
1,62
9,34
444
7,45
3,22
955
1,62
9,34
4
iii)
Sal
e o
f Fi
xed
Ass
ets
Lu
max
Au
to Te
chn
olo
gie
s Lt
d.
--
--
--
-4,
204,
578
-4,
204,
578
Lu
max
DK
Au
to In
du
stri
es L
td.
--
--
--
255,
835
9,21
425
5,83
59,
214
Lu
max
Man
agem
ent
Ser
vice
s P.
Ltd
.-
--
--
--
9,26
8,72
6-
9,26
8,72
6
M
ahav
ir U
dyo
g-
--
--
--
142,
682
-14
2,68
2
To
tal (
iii)
--
--
--
255,
835
13,6
25,2
0025
5,83
513
,625
,200
iv)
Sal
e o
f se
rvic
es
Lu
max
Au
to Te
chn
olo
gie
s Lt
d.
--
--
--
1,52
7,92
888
4,88
01,
527,
928
884,
880
Lu
max
DK
Au
to In
du
stri
es L
td.
--
--
--
870,
525
153,
530
870,
525
153,
530
Lu
max
An
cilla
ry L
td.
--
--
--
842,
134
125,
207
842,
134
125,
207
B
har
at E
nte
rpri
ses
--
--
--
257,
572
28,4
3725
7,57
228
,437
M
ahav
ir U
dyo
g-
--
--
-96
,580
21,6
7196
,580
21,6
71
S
tan
ley
Ele
ctri
c C
o. L
td.
4,14
8,80
78,
109,
016
--
--
--
4,14
8,80
78,
109,
016
To
tal (
iv)
4,14
8,80
78,
109,
016
--
--
3,59
4,73
91,
213,
725
7,74
3,54
69,
322,
741

156 Lumax Industries Limited
notes to consolIdAted fInAncIAl stAtements for the year ended March 31, 2017
Am
ou
nt
in `
S. N
o.A
cco
un
t H
ead
En
terp
rise
hav
ing
si
gn
ifica
nt
infl
uen
ce
Key
Man
agem
ent
Pers
on
nel
Rel
ativ
es o
f K
ey
Man
agem
ent
Pers
on
-n
el
Ent
erpr
ises
ow
ned
or
sign
ifica
ntly
influ
ence
d b
y ke
y m
anag
emen
t pe
rson
nel o
r th
eir
rela
tive
s
TOTA
L
2016
-17
2015
-16
201
6-17
2
015-
16
201
6-17
2
015-
16
201
6-17
2
015-
16
201
6-17
2
015-
16
v)P
urc
has
e o
f R
aw M
ater
ials
, C
om
po
nen
ts a
nd
Mo
uld
s
Lu
max
Au
to Te
chn
olo
gie
s Lt
d.
--
--
--
457,
012,
391
321,
665,
390
457,
012,
391
321,
665,
390
Lu
max
DK
Au
to In
du
stri
es L
td.
--
--
--
951,
156,
523
994,
031,
437
951,
156,
523
994,
031,
437
Lu
max
An
cilla
ry L
td.
--
--
--
537,
510,
619
453,
026,
614
537,
510,
619
453,
026,
614
B
har
at E
nte
rpri
ses
--
--
--
189,
281,
815
162,
301,
096
189,
281,
815
162,
301,
096
M
ahav
ir U
dyo
g-
--
--
-23
,984
,968
16,7
14,2
2723
,984
,968
16,7
14,2
27
Lu
max
Man
no
h A
llied
Tech
no
lo-
gie
s Lt
d.
--
--
--
-18
3,56
8-
183,
568
S
tan
ley
Ele
ctri
c C
o. L
td.
236,
694,
503
79,6
96,5
39-
--
--
-23
6,69
4,50
379
,696
,539
To
tal (
v)23
6,69
4,50
379
,696
,539
--
--
2,15
8,94
6,31
61,
947,
922,
332
2,39
5,64
0,81
92,
027,
618,
871
vi)
Pu
rch
ase
of
Pack
ing
Mat
eria
l (n
et)
M
ahav
ir U
dyo
g-
--
--
-15
2,53
9,22
413
4,94
2,33
415
2,53
9,22
413
4,94
2,33
4
To
tal (
vi)
--
--
--
152,
539,
224
134,
942,
334
152,
539,
224
134,
942,
334
vii)
Pu
rch
ase
of
Sp
ares
& S
amp
les
Lu
max
En
erg
y S
olu
tio
ns
P. L
td.
--
--
--
1,63
3,47
5-
1,63
3,47
5-
Lu
max
DK
Au
to In
du
stri
es L
td.
--
--
--
-1,
323,
688
-1,
323,
688
S
tan
ley
Ele
ctri
c C
o. L
td.
103,
950
756,
282
--
--
--
103,
950
756,
282
To
tal (
vii)
103,
950
756,
282
--
--
1,63
3,47
51,
323,
688
1,73
7,42
52,
079,
970
viii)
Pu
rch
ase
of
Fixe
d A
sset
s
Lu
max
Au
to Te
chn
olo
gie
s Lt
d.
--
--
--
66,2
20-
66,2
20-
Lu
max
Man
agem
ent
Ser
vice
s P.
Lt
d.
--
--
--
861,
278
-86
1,27
8-
S
tan
ley
Ele
ctri
c C
o. L
td.
14,0
89,5
35-
--
--
--
14,0
89,5
35-
To
tal (
viii)
14,0
89,5
35-
--
--
927,
498
-15
,017
,033
-
ix)
Pu
rch
ase
of
Fin
ish
ed G
oo
ds
S
tan
ley
Ele
ctri
c C
o. L
td.
-46
,570
--
--
--
-46
,570
To
tal (
ix)
-46
,570
--
--
--
-46
,570
x)P
urc
has
e O
f S
ervi
ces
Lu
max
Tou
rs &
Tra
vels
Ltd
.-
--
--
-45
,127
,109
39,3
19,3
1645
,127
,109
39,3
19,3
16
To
tal (
x)-
--
--
-45
,127
,109
39,3
19,3
1645
,127
,109
39,3
19,3
16

Annual Report 2016-17 157
Co
rpo
rate Overview
Statu
tory R
epo
rtsFin
ancial S
tatemen
ts
Am
ou
nt
in `
S.N
o.A
cco
un
t H
ead
En
terp
rise
hav
ing
si
gn
ifica
nt
infl
uen
ce
Key
Man
agem
ent
Per-
son
nel
Rel
ativ
es o
f K
ey M
an-
agem
ent
Pe
rso
nn
el
Ent
erpr
ises
ow
ned
or
sign
ifica
ntly
influ
ence
d b
y ke
y m
anag
emen
t pe
rson
nel
or t
heir
rel
ativ
es
TOTA
L
2016
-17
201
5-16
20
16-1
7 2
015-
16
2016
-17
2015
-16
2016
-17
2015
-16
2016
-17
2015
-16
xi)
Tech
nic
al C
har
ges
D
esig
n, D
raw
ing
& Te
stin
g C
hg
.
S
tan
ley
Ele
ctri
c C
o. L
td.
202,
427,
752
130,
061,
632
--
--
--
202,
427,
752
130,
061,
632
Lu
max
Man
no
h A
llied
Tech
no
lo-
gie
s Lt
d.
--
--
--
-37
,791
-37
,791
M
anag
emen
t S
up
po
rt F
ee
S
tan
ley
Ele
ctri
c C
o. L
td.
80,1
14,1
8861
,104
,275
--
--
--
80,1
14,1
8861
,104
,275
Lu
max
Man
agem
ent
Ser
vice
s P.
Lt
d.
--
--
--
112,
062,
144
71,2
83,5
7911
2,06
2,14
471
,283
,579
To
tal (
xi)
282,
541,
940
191,
165,
907
--
--
112,
062,
144
71,3
21,3
7039
4,60
4,08
426
2,48
7,27
7
xii)
Ren
t R
ecei
ved
Lu
max
Au
to Te
chn
olo
gie
s Lt
d.
--
--
--
6,55
8,65
49,
206,
993
6,55
8,65
49,
206,
993
Lu
max
Tou
rs &
Tra
vels
Ltd
.-
--
--
-24
9,48
822
5,06
324
9,48
822
5,06
3
Lu
max
DK
Au
to In
du
stri
es L
td.
--
--
--
332,
644
300,
079
332,
644
300,
079
Lu
max
En
erg
y S
olu
tio
ns
P. L
td.
--
--
--
34,3
7314
,313
34,3
7314
,313
Lu
max
Co
rnag
lia A
uto
Tech
no
log
ies
P. L
td.
--
--
--
4,71
6,18
04,
441,
840
4,71
6,18
04,
441,
840
To
tal (
xii)
--
--
--
11,8
91,3
3914
,188
,288
11,8
91,3
3914
,188
,288
xiii)
Ren
t Pa
id
M
r. D
. K. J
ain
--
1,63
8,75
11,
640,
896
--
--
1,63
8,75
11,
640,
896
Lu
max
DK
Au
to In
du
stri
es L
td.
--
--
--
15,6
13,9
3813
,734
,595
15,6
13,9
3813
,734
,595
To
tal (
xii)
--
1,63
8,75
11,
640,
896
--
15,6
13,9
3813
,734
,595
17,2
52,6
8915
,375
,491
xiv)
Man
ager
ial R
emu
ner
atio
n
M
r. D
eep
ak J
ain
--
13,3
67,5
1011
,495
,966
--
--
13,3
67,5
1011
,495
,966
M
r. A
nm
ol J
ain
--
5,36
6,40
55,
366,
405
--
--
5,36
6,40
55,
366,
405
M
r. E
. Hir
oo
ka-
-2,
080,
246
2,22
0,41
2-
--
-2,
080,
246
2,22
0,41
2
M
r. N
. Sat
o (
up
to 0
8.08
.16)
--
757,
979
2,45
8,62
3-
--
-75
7,97
92,
458,
623
M
r. K
Saw
ada
( w
.e.f.
09.
08.1
6)-
-79
8,23
9-
--
--
798,
239
-
To
tal (
xiv)
--
22,3
70,3
7921
,541
,406
--
--
22,3
70,3
7921
,541
,406
xv)
Co
mm
issi
on
to
Dir
ecto
r
M
r. D
. K. J
ain
--
5,96
9,37
14,
560,
511
--
--
5,96
9,37
14,
560,
511
M
r. D
eep
ak J
ain
--
14,9
31,3
479,
750,
189
--
--
14,9
31,3
479,
750,
189
M
r. A
nm
ol J
ain
--
11,9
38,7
434,
347,
715
--
--
11,9
38,7
434,
347,
715
To
tal (
xv)
--
32,8
39,4
6118
,658
,415
--
--
32,8
39,4
6118
,658
,415
notes to consolIdAted fInAncIAl stAtements for the year ended March 31, 2017
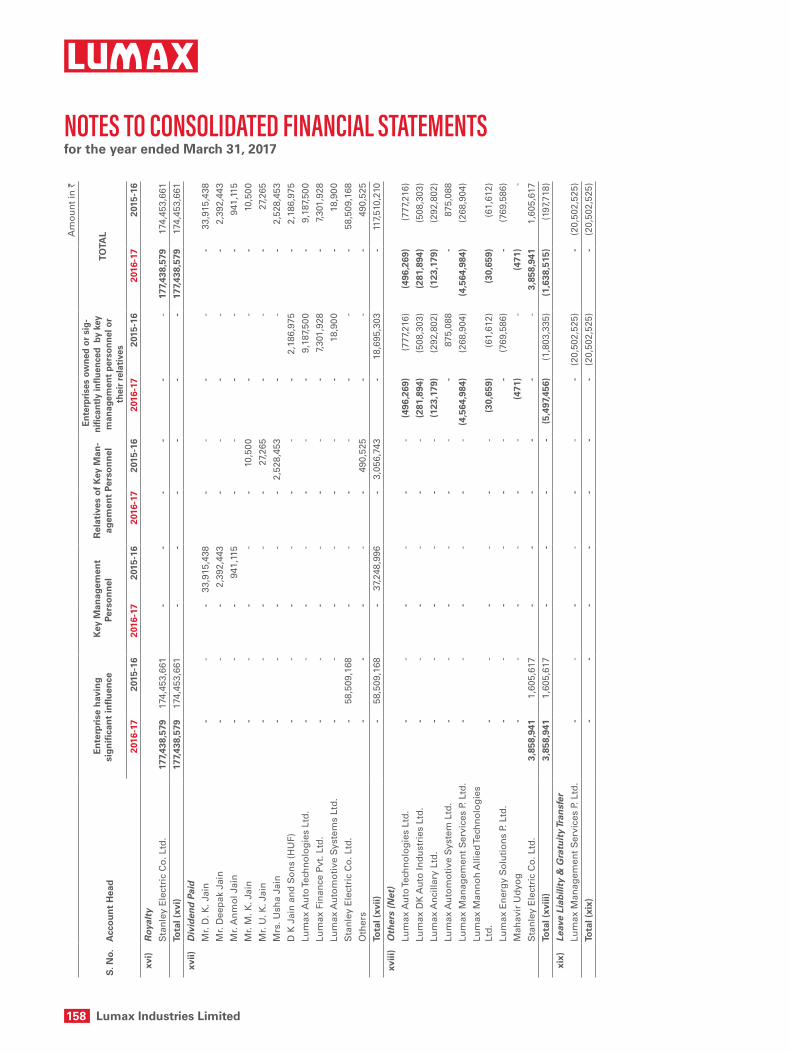
158 Lumax Industries Limited
notes to consolIdAted fInAncIAl stAtements for the year ended March 31, 2017
Am
ou
nt
in `
S. N
o.A
cco
un
t H
ead
En
terp
rise
hav
ing
si
gn
ifica
nt
infl
uen
ce
Key
Man
agem
ent
Pers
on
nel
R
elat
ives
of
Key
Man
-ag
emen
t Pe
rso
nn
el
Ent
erpr
ises
ow
ned
or s
ig-
nific
antl
y in
fluen
ced
by
key
man
agem
ent
pers
onne
l or
thei
r re
lati
ves
TOTA
L
2016
-17
201
5-16
2
016-
17
201
5-16
2
016-
17
201
5-16
2
016-
17
201
5-16
2
016-
17
201
5-16
xvi)
Roy
alty
S
tan
ley
Ele
ctri
c C
o. L
td.
177,
438,
579
174,
453,
661
--
--
--
177,
438,
579
174,
453,
661
To
tal (
xvi)
177,
438,
579
174,
453,
661
--
--
--
177,
438,
579
174,
453,
661
xvii)
Div
iden
d P
aid
M
r. D
. K. J
ain
--
-33
,915
,438
--
--
-33
,915
,438
M
r. D
eep
ak J
ain
--
-2,
392,
443
--
--
-2,
392,
443
M
r. A
nm
ol J
ain
--
-94
1,11
5-
--
--
941,
115
M
r. M
. K. J
ain
--
--
-10
,500
--
-10
,500
M
r. U
. K. J
ain
--
--
-27
,265
--
-27
,265
M
rs. U
sha
Jain
--
--
-2,
528,
453
--
-2,
528,
453
D
K J
ain
an
d S
on
s (H
UF)
--
--
--
-2,
186,
975
-2,
186,
975
Lu
max
Au
to Te
chn
olo
gie
s Lt
d.
--
--
--
-9,
187,
500
-9,
187,
500
Lu
max
Fin
ance
Pvt
. Ltd
.-
--
--
--
7,30
1,92
8-
7,30
1,92
8
Lu
max
Au
tom
oti
ve S
yste
ms
Ltd
.-
--
--
--
18,9
00-
18,9
00
Sta
nle
y E
lect
ric
Co
. Ltd
.-
58,5
09,1
68-
--
--
--
58,5
09,1
68
O
ther
s-
--
--
490,
525
--
-49
0,52
5
To
tal (
xvii)
-58
,509
,168
-37
,248
,996
-3,
056,
743
-18
,695
,303
-11
7,51
0,21
0
xviii
)O
ther
s (N
et)
Lu
max
Au
to Te
chn
olo
gie
s Lt
d.
--
--
--
(496
,269
)(7
77,2
16)
(496
,269
)(7
77,2
16)
Lu
max
DK
Au
to In
du
stri
es L
td.
--
--
--
(281
,894
)(5
08,3
03)
(281
,894
)(5
08,3
03)
Lu
max
An
cilla
ry L
td.
--
--
--
(123
,179
)(2
92,8
02)
(123
,179
)(2
92,8
02)
Lu
max
Au
tom
oti
ve S
yste
m L
td.
--
--
--
-87
5,08
8-
875,
088
Lu
max
Man
agem
ent
Ser
vice
s P.
Ltd
.-
--
--
-(4
,564
,984
)(2
68,9
04)
(4,5
64,9
84)
(268
,904
)
Lu
max
Man
no
h A
llied
Tech
no
log
ies
Ltd
.-
--
--
-(3
0,65
9)(6
1,61
2)(3
0,65
9)(6
1,61
2)
Lu
max
En
erg
y S
olu
tio
ns
P. L
td.
--
--
--
-(7
69,5
86)
-(7
69,5
86)
M
ahav
ir U
dyo
g-
--
--
-(4
71)
-(4
71)
-
S
tan
ley
Ele
ctri
c C
o. L
td.
3,85
8,94
11,
605,
617
--
--
--
3,85
8,94
11,
605,
617
To
tal (
xviii
)3,
858,
941
1,60
5,61
7-
--
-(5
,497
,456
)(1
,803
,335
)(1
,638
,515
)(1
97,7
18)
xix)
Leav
e Li
abili
ty &
Gra
tuit
y Tr
ansf
er
Lu
max
Man
agem
ent
Ser
vice
s P.
Ltd
.-
--
--
--
(20,
502,
525)
-(2
0,50
2,52
5)
To
tal (
xix)
--
--
--
-(2
0,50
2,52
5)-
(20,
502,
525)
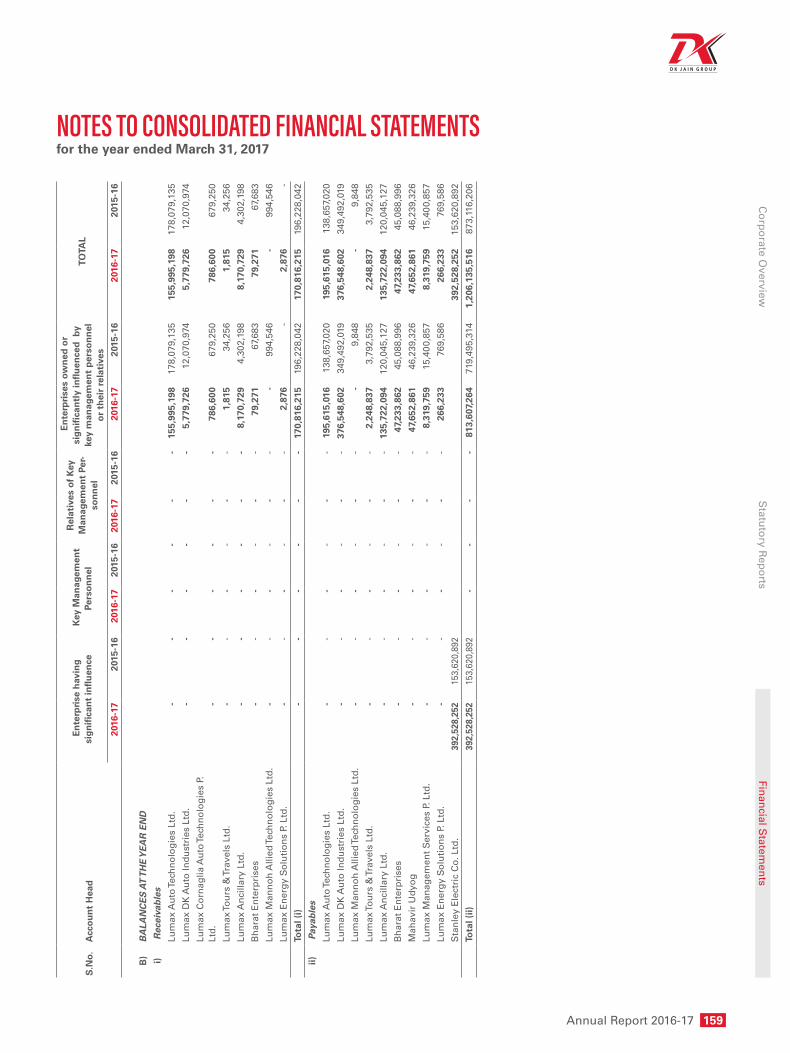
Annual Report 2016-17 159
Co
rpo
rate Overview
Statu
tory R
epo
rtsFin
ancial S
tatemen
ts
notes to consolIdAted fInAncIAl stAtements for the year ended March 31, 2017
S.N
o.A
cco
un
t H
ead
En
terp
rise
hav
ing
si
gn
ifica
nt
infl
uen
ce
Key
Man
agem
ent
Pers
on
nel
Rel
ativ
es o
f K
ey
Man
agem
ent
Per-
son
nel
En
terp
rise
s ow
ned
or
sig
nifi
can
tly
infl
uen
ced
by
key
man
agem
ent
per
son
nel
o
r th
eir
rela
tive
s
TOTA
L
201
6-17
2
015-
16
201
6-17
2
015-
16
201
6-17
2
015-
16
201
6-17
2
015-
16
201
6-17
2
015-
16
B)
BA
LAN
CE
S A
T T
HE
YE
AR
EN
D
i) R
ecei
vab
les
Lu
max
Au
to Te
chn
olo
gie
s Lt
d.
--
--
--
155,
995,
198
178,
079,
135
155,
995,
198
178,
079,
135
Lu
max
DK
Au
to In
du
stri
es L
td.
--
--
--
5,77
9,72
612
,070
,974
5,77
9,72
612
,070
,974
Lu
max
Co
rnag
lia A
uto
Tech
no
log
ies
P.
Ltd
.-
--
--
-78
6,60
067
9,25
078
6,60
067
9,25
0
Lu
max
Tou
rs &
Tra
vels
Ltd
.-
--
--
-1,
815
34,2
561,
815
34,2
56
Lu
max
An
cilla
ry L
td.
--
--
--
8,17
0,72
94,
302,
198
8,17
0,72
94,
302,
198
B
har
at E
nte
rpri
ses
--
--
--
79,2
7167
,683
79,2
7167
,683
Lu
max
Man
no
h A
llied
Tech
no
log
ies
Ltd
.-
--
--
--
994,
546
-99
4,54
6
Lu
max
En
erg
y S
olu
tio
ns
P. L
td.
--
--
--
2,87
6-
2,87
6-
To
tal (
i)
--
--
--
170,
816,
215
196,
228,
042
170,
816,
215
196,
228,
042
ii) P
ayab
les
Lu
max
Au
to Te
chn
olo
gie
s Lt
d.
--
--
--
195,
615,
016
138,
657,
020
195,
615,
016
138,
657,
020
Lu
max
DK
Au
to In
du
stri
es L
td.
--
--
--
376,
548,
602
349,
492,
019
376,
548,
602
349,
492,
019
Lu
max
Man
no
h A
llied
Tech
no
log
ies
Ltd
.-
--
--
--
9,84
8-
9,84
8
Lu
max
Tou
rs &
Tra
vels
Ltd
.-
--
--
-2,
248,
837
3,79
2,53
52,
248,
837
3,79
2,53
5
Lu
max
An
cilla
ry L
td.
--
--
--
135,
722,
094
120,
045,
127
135,
722,
094
120,
045,
127
B
har
at E
nte
rpri
ses
--
--
--
47,2
33,8
6245
,088
,996
47,2
33,8
6245
,088
,996
M
ahav
ir U
dyo
g-
--
--
-47
,652
,861
46,2
39,3
2647
,652
,861
46,2
39,3
26
Lu
max
Man
agem
ent
Ser
vice
s P.
Ltd
.-
--
--
-8,
319,
759
15,4
00,8
578,
319,
759
15,4
00,8
57
Lu
max
En
erg
y S
olu
tio
ns
P. L
td.
--
--
--
266,
233
769,
586
266,
233
769,
586
S
tan
ley
Ele
ctri
c C
o. L
td.
392,
528,
252
153,
620,
892
392,
528,
252
153,
620,
892
To
tal (
ii)
392,
528,
252
153,
620,
892
- -
- -
813,
607,
264
719,
495,
314
1,20
6,13
5,51
6 87
3,11
6,20
6

160 Lumax Industries Limited
notes to consolIdAted fInAncIAl stAtements for the year ended March 31, 2017
33. CAPITAL AND OTHER COMMITMENTS
Amount in `
S. No. Particulars March 31, 2017 March 31, 2016
1. Estimated amount of Contract (Net of Advances paid during the year Rs 83,416,857 (Previous Year ` 42,168,002) remaining to be executed on capital account and not provided for.
231,483,678 63,366,133
The Company’s share in capital commitments of its associate, SL Lumax Limited is ` 43,321,701 (previous year ` 15,662,014)
34. CONTINgENT LIABILITIES
Amount in `
S. No. Particulars March 31, 2017 March 31, 2016
(i) Bills of exchange discounted from a bank 327,842,178 247,106,673
(ii) Various other claims of Sales Tax Matters made against the Company on account of non-submission of statutory forms etc. being disputed by the Company.
2,520,457 2,520,457
(iii) Demand of Central Sales Tax for Financial Year 2010-11 & 2011-12 which is subject to submission of C-Form & H-Form.
7,737,765 2,140,602
(iv) Demand in respect of non-reversal of proportionate Cenvat Credit @ 0.6% against providing exempt services i.e. trading
- 1,088,154
(v) Demand of Cenvat Credit for 2011-2016 in respect of service tax paid on the outward transportation
1,569,640 3,209,812
(vi) In respect of additions made by the Assessing officer for Assessment Year 2009-10 and confirmed by DRP for which the Company has filed an appeal before ITAT and ITAT has decided in favour of the company vide order dated 22.04.2016 and relief granted in Assessing officer order dated 21.07.2016.
- 563,918
(vii) In respect of additions made by the Assessing officer for Assessment Year 2010-11 and confirmed by DRP for which the Company has filed an appeal before ITAT
177,323 177,323
(viii) Liability of Customs duty towards export obligation undertaken by the Company under EPCG licenses (including interest)
188,602,958 150,404,202
(ix) Letter of credit 144,665,857 21,552,216
(x) Bank Guarantees 505,372,500 287,364,400
The Company’s share in contingencies of its associate, SL Lumax Limited is ` 1,310,111 (previous year `1, 310,111).
The current year amount relating to income tax does not include interest. Based on the favorable decisions in similar cases/advice taken by the Company & based on management’s internal assessment, the Company believes that it has good case in respect of all the items listed above and hence no provision there against is considered necessary.

Annual Report 2016-17 161
Co
rpo
rate Overview
Statu
tory R
epo
rtsFin
ancial S
tatemen
ts
notes to consolIdAted fInAncIAl stAtements for the year ended March 31, 2017
35. DISCLOSURE IN RESPECT OF CASH TRANSACTIONS.
The company held the following specified Bank Notes (SBNs) and the following transactions were incurred during the period from 8 November, 2016 to 30 December, 2016 as provided in the table below:
Particulars SBNs Other Denomination Notes TotalClosing Balance as on 08.11.2016* 2,045,000 700,457 2,745,457Add : Permitted Receipts* - 2,546,862 2,546,862Less : Permitted Payments* - 2,109,613 2,109,613Less : Deposited in Bank 2,045,000 - 2,045,000Closing Balance as on 30.12.2016* - 1,137,706 1,137,706
* Above disclosure is excluding money held in Taiwan Doller (TWD) in Taiwan.
The associate company’ SL Lumax Limited held the following specified Bank Notes (SBNs) and the following transactions were incurred during the period from 8 November, 2016 to 30 December, 2016 as provided in the table below.
Particulars SBNs Other Denomination Notes TotalClosing Balance as on 08.11.2016 167,000 885 167,885Add : Permitted Receipts* 84,000 1,196,870 1,280,870Less : Permitted Payments - 449,830 449,830Less : Deposited in Bank 251,000 - 251,000Closing Balance as on 30.12.2016 - 747,925 747,925
*Permitted receipts on SBNs comprise earlier payment in old denominations to employees retuned by them and replaced by the company with new currency
36. DERIVATIVE INSTRUMENTS AND UNHEDgED FOREIgN CURRENCY EXPOSURE
(a) Derivatives outstanding as at the reporting date
Particulars PurposeCross Currency cum interest rate swap - USD 625,000 (March 31, 2016: USD 4,687,500 ) Notional amount INR 40,531,250 (March 31, 2016: INR 310,570,312)
Hedge against exposure to outflow for USD loan repayment and its interest payments. Swap to pay fixed interest @ 10.65% p.a. and receive a variable interest @ LIBOR plus margin.
(b) Particulars of unhedged foreign currency exposure as at the reporting date
Amount in `Particulars Foreign
CurrencyAmount Amount (in Foreign
currency)Exchange rate
March 31, 2017
March 31, 2016
March 31, 2017
March 31, 2016
March 31, 2017
March 31, 2016
Trade Payable (including payable for capital goods)
EUR 19,674,457 365,054 283,933 4,842 69.29 75.40
GBP 37,003 - 457 - 80.90 -JPY 40,091,510 50,141,073 69,120,313 85,006,482 0.58 0.59USD 384,489,770 166,495,082 5,928,909 2,512,944 64.85 66.26CHF - 505,347 - 7,326 - 68.98SGD - 123,943 - 2,516 - 49.27
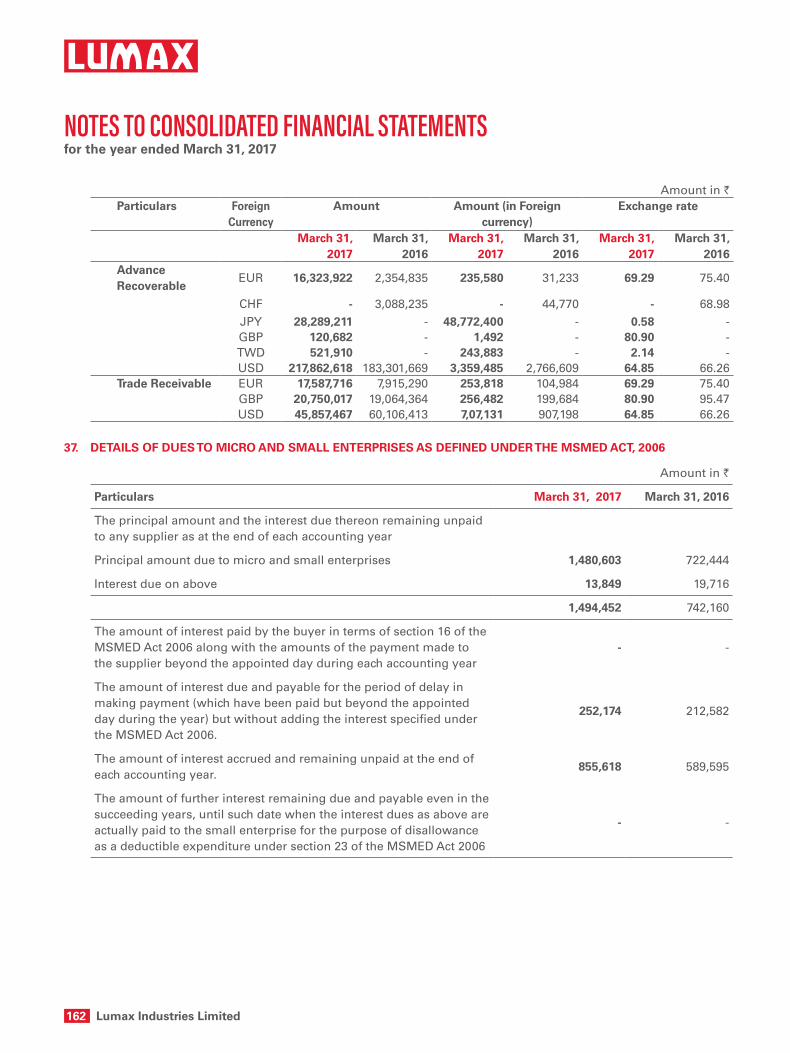
162 Lumax Industries Limited
notes to consolIdAted fInAncIAl stAtements for the year ended March 31, 2017
Amount in `Particulars Foreign
CurrencyAmount Amount (in Foreign
currency)Exchange rate
March 31, 2017
March 31, 2016
March 31, 2017
March 31, 2016
March 31, 2017
March 31, 2016
Advance Recoverable
EUR 16,323,922 2,354,835 235,580 31,233 69.29 75.40
CHF - 3,088,235 - 44,770 - 68.98JPY 28,289,211 - 48,772,400 - 0.58 -GBP 120,682 - 1,492 - 80.90 -TWD 521,910 - 243,883 - 2.14 -USD 217,862,618 183,301,669 3,359,485 2,766,609 64.85 66.26
Trade Receivable EUR 17,587,716 7,915,290 253,818 104,984 69.29 75.40GBP 20,750,017 19,064,364 256,482 199,684 80.90 95.47USD 45,857,467 60,106,413 7,07,131 907,198 64.85 66.26
37. DETAILS OF DUES TO MICRO AND SMALL ENTERPRISES AS DEFINED UNDER THE MSMED ACT, 2006
Amount in `
Particulars March 31, 2017 March 31, 2016
The principal amount and the interest due thereon remaining unpaid to any supplier as at the end of each accounting year
Principal amount due to micro and small enterprises 1,480,603 722,444
Interest due on above 13,849 19,716
1,494,452 742,160
The amount of interest paid by the buyer in terms of section 16 of the MSMED Act 2006 along with the amounts of the payment made to the supplier beyond the appointed day during each accounting year
- -
The amount of interest due and payable for the period of delay in making payment (which have been paid but beyond the appointed day during the year) but without adding the interest specified under the MSMED Act 2006.
252,174 212,582
The amount of interest accrued and remaining unpaid at the end of each accounting year.
855,618 589,595
The amount of further interest remaining due and payable even in the succeeding years, until such date when the interest dues as above are actually paid to the small enterprise for the purpose of disallowance as a deductible expenditure under section 23 of the MSMED Act 2006
- -

Annual Report 2016-17 163
Co
rpo
rate Overview
Statu
tory R
epo
rtsFin
ancial S
tatemen
ts
notes to consolIdAted fInAncIAl stAtements for the year ended March 31, 2017
38. DETAILS OF RESEARCH AND DEVELOPMENT EXPENSES ARE AS FOLLOWS:
A. The Company has incurred expenses on its in-house research and development center at Gurgaon approved and recognised by the Ministry of Science & Technology, Government of India.
a. Capital ExpenditureAmount in `
Particulars March 31, 2017 March 31, 2016Capital expenditure 21,297,790 17,154,739
b. Revenue Expenditure
Amount in `Particulars March 31, 2017 March 31, 2016Salaries, Wages and Bonus 90,008,894 73,028,979Contribution to Provident Fund 4,391,761 3,586,926Contribution to Other Funds 226,676 206,830Staff Welfare 17,142,094 12,120,633Provision for Retirement Benefit 3,253,842 2,110,993Insurance 542,844 346,346Repair & Maintenance 13,368,676 12,277,078Travelling & Conveyance 35,097,633 29,025,564Research & Development 34,892 1,120Power & Fuel 926,800 808,238Miscellaneous 5,257,390 4,676,826Design, Support & Testing Charges 974,388 1,522,488Material/Consumable/Spares 346,494 95,830Depreciation 12,962,645 15,153,808Finance Cost 634,542 745,982Total 185,169,571 155,707,641
B. The Company has incurred expenses on its in-house research and development center at Pune approved and recognised by the Ministry of Science & Technology, Government of India.
a. Capital ExpenditureAmount in `
Particulars March 31, 2017 March 31, 2016Capital expenditure 20,196,177 7,463,762
a. Revenue Expenditure
Amount in `Particulars March 31, 2017 March 31, 2016Salaries, Wages and Bonus 68,314,460 44,708,512Contribution to Provident Fund 2,786,748 2,147,793Contribution to Other Funds 202,829 189,125

164 Lumax Industries Limited
notes to consolIdAted fInAncIAl stAtements for the year ended March 31, 2017
Amount in `Particulars March 31, 2017 March 31, 2016Staff Welfare 5,985,786 5,474,640Provision for Retirement Benefit 1,669,314 1,333,692Insurance 320,488 170,070Repair & Maintenance 5,279,785 5,091,501Travelling & Conveyance 15,612,732 11,521,068Research & Development - 61,383Legal & Professional Expenses 2,209,754 3,596,647Power & Fuel 2,979,941 2,337,783Miscellaneous 2,682,080 1,821,636Design, Support & Testing Charges 896,007 387,948Material / Consumables / Spares 97,851 40,538Depreciation 7,539,255 8,137,997Finance Cost 171,685 218,462Total 116,748,715 87,238,795
39. CORPORATE SOCIAL RESPONSIBILITY (CSR)
As per the provisions of section 135 of the Companies Act, 2013, the Company has to spend atleast 2% of the average net profits of the company made during three immediately preceding financial years towards CSR. Accordingly, a CSR committee has been formed for carrying out the CSR activities as specified in Schedule VII of the Companies Act, 2013.The specified percentage of aforesaid net profit amounts to `3,742,223 (Previous year `2,016,882). However, the Company has spent an amount of ̀ 3, 361,859 (Previous year ̀ 3, 259,049) and has accordingly charged the same to the statement of Profit & Loss.
40. Claim recoverable represents receivables from West Bengal Industrial Development Corporation in relation to Singur Land. The Company has relied on legal opinion for ascertaining the recoverability of the claim.
41. The assets of ` 350,783,068 (Previous year ` 239,219,298) recognized by the Company as ‘MAT Credit Entitlement’ under ‘ Loans and Advances’ represents that portion of MAT, which can be recovered and set off in subsequent years based on provisions of Section 115JAA of the Income Tax Act, 1961. The management, based on present trend of profitability and also the future profitability projections, is of the view that there would be sufficient taxable income in foreseeable future, which will enable the Company to utilize MAT credit assets.
42. Previous year’s figures have been regrouped / reclassified, where necessary, to conform to this year’s classification.
As per our report of even date
For S. R. BATLIBOI & CO. LLP For and on behalf of the Board of Directors of Lumax Industries LimitedChartered AccountantsICAI firm registration number: 301003E/E300005
per Vikas Mehra D. K. Jain Deepak JainPartner Chairman Managing DirectorMembership No. 94421 DIN: 00085848 DIN: 00004972
Place : Gurugram Shruti Kant Rustagi Shwetank TiwariDate : May 13, 2017 Chief Financial Officer Company Secretary

CorPorate information
Works
Plot No. 16, Sector-18, Maruti Complex, Gurugram, Haryana.Plot No. 6, Industrial Area, Dharuhera, District Rewari, Haryana.Plot No. 195-195A, Sector 4, Phase-II, Bawal, District Rewari, Haryana.Plot No. 51, Sector 11, IIE, Pant Nagar, District Udham Singh Nagar, Uttarakhand.Plot No. 5, Industrial Park – II, Village Salempur, Mehdood, Haridwar, Uttarakhand.608-609, ChakanTalegaon Road, Mahalunge Ingle, Chakan, Pune, Maharashtra.D2-43/2, M.I.D.C. Industrial Area, Chinchwad, Pune, Maharashtra.Plot No. D-1, Vendors Park, Sanand, District Ahmedabad, Gujarat.Plot No. 69, Phase-II, Bidadi Industrial Area, Sector 2, Bangalore, Karnataka.
Board of Directors
Mr. D.K. Jain (Non-Executive Chairman)
Mr. Deepak Jain (Managing Director)
Mr. Anmol Jain (Joint Managing Director)
Mr. Toru Tanabe (Non-Executive Director) Stanley Nominee
Mr. Eiichi Hirooka (Senior Executive Director) Stanley Nominee
Mr. Koji Sawada (Executive Director) Stanley Nominee
Mr. A.P. Gandhi (Independent Director)
Mr. Rattan Kapur (Independent Director)
Mr. Rajeev Kapoor (Independent Director)
Mr. M.C. Gupta (Independent Director)
Mr. Dhiraj Dhar Gupta (Independent Director)
Mrs. Pallavi Dinodia Gupta (Independent Director)
Board Committees
Audit Committee
Mr. A.P. Gandhi – Chairman
Mr. M.C. Gupta – Member
Mr. Dhiraj Dhar Gupta – Member
Mr. Rattan Kapur – Member
Mrs. Pallavi Dinodia Gupta – Member
Mr. Deepak Jain – Member
Mr. Eiichi Hirooka – Member
Nomination and Remuneration Committee
Mr. Rattan Kapur – Chairman
Mr. A.P. Gandhi – Member
Mr. Dhiraj Dhar Gupta – Member
Share Transfer / Stakeholder Relationship Committee
Mr. Dhiraj Dhar Gupta – Chairman
Mr. D.K. Jain – Member
Mr. Deepak Jain – Member
Mr. Eiichi Hirooka – Member
Corporate Social Responsibility Committee
Mr. M.C. Gupta – Chairman
Mr. A.P. Gandhi – Member
Mr. D.K. Jain – Member
Mr. Deepak Jain – Member
Mr. Anmol Jain – Member
Registrar & Share Transfer Agent
M/s Karvy Computershare Private LimitedKarvy Selenium Tower BPlot 31-32, GachibowliFinancial District, NanakramgudaHyderabad – 500 032E-mail : [email protected]
Registered Office
B-85-86, Mayapuri Industrial Area, Phase – I, New Delhi – 110 064 E-mail : [email protected]
Corporate Identity Number
L74899DL1981PLC012804
Bankers
HDFC Bank Ltd.HSBC BankICICI Bank Ltd.IDBI Bank Ltd.Societe GeneraleStandard Chartered BankState Bank of IndiaSyndicate BankYes Bank LimitedCiti BankAxis Bank Ltd.CTBC Bank Co. Ltd.Kotak Mahindra Bank Ltd.
Chief Financial Officer
Mr. Shruti Kant Rustagi
Company Secretary
Mr. Shwetank Tiwari
Auditors
M/s S.R. Batliboi & Co. LLP, Chartered Accountants, Gurugram

Lumax Industries Limitedwww.lumaxindustries.com | www.lumaxworld.in