Pangalos european economy - 04.2013
37
Theodoros Pangalos Former Deputy Primeminister, Greece April 2013
-
Upload
theodoros-pangalos -
Category
Documents
-
view
185.154 -
download
0
Transcript of Pangalos european economy - 04.2013

Theodoros Panga los Former Deputy Primeminister, Greece
April 2013

Contents
¡ GDP and Growth
¡ Public Debt
¡ Trade
¡ Unemployment

GDP and Growth

World GDP per capita

:: overview
¡ 1980 – 1990: United States and Japan lead expansion
¡ 1990 – 2000: United States dominates expansion
¡ 2000 – 2010: Rise of Developing and Emerging Economies
¡ 2010 – 2017: The BRICs lead economic growth.

:: GDP Figures (IMF)
IMF nominal GDP Data (September 2011)

European Countries GDP
IMF April 2012 (b USD)

GDP per capita 2008-2009

IMF April 2012 (b USD)

1980 - 1990
¡ United States and Japan lead expansion ¡ At exchange rates, the economic output of 112 markets expanded by
$10.7 trillion from 1980 to 1990. The economic output of 34 markets contracted by $276.9 billion from 1980 to 1990.
¡ The five largest contributors to global output contraction are Argentina at 24%, Saudi Arabia at 17%, Nigeria at 11%, Venezuela at 8%, and Vietnam at 8%.
¡ At purchasing power parity, the economic output of 145 markets expanded by $12.1 trillion from 1980 to 1990. The economic output of 2 markets contracted by $3.5 billion from 1980 to 1990.
¡ The two contributors to global output contraction are Lebanon at 70% and Libya at 30%.

1990 - 2000
¡ United States dominates expansion ¡ At exchange rates, the economic output of 122 markets expanded by
$10.7 trillion from 1990 to 2000. The economic output of 29 markets contracted by $94.2 billion from 1990 to 2000.
¡ The five largest contributors to global output contraction are Italy at 37%, Finland at 18%, Bulgaria at 9%, Algeria at 8%, and the Democratic Republic of Congo at 5%.
¡ At purchasing power parity, the economic output of 148 markets expanded by $16.9 trillion from 1990 to 2000. The economic output of 3 markets contracted by $17.8 billion from 1990 to 2000.
¡ The three contributors to global output contraction are Bulgaria at 64%, the Democratic Republic of Congo at 29% and Sierra Leone at 7%.

2000 – 2008 ¡ 2000 – 2006: United States still leads, but China is catching up
¡ The five largest contributors to global output expansion are the United States at 20%, China at 9%, Germany at 6%, the United Kingdom at 6%, and France at 5%.
¡ 2007 – China leads expansion ¡ The economic output by nominal GDP of 183 markets expanded by $6.4
trillion during 2007. China accounted for 12% while the United States accounted for 10%, Germany accounted for 6%, and the United Kingdom accounted for 6% of the global output expansion.
¡ 2008 – credit crisis begins ¡ The economic output of 171 markets expanded by $5.8 trillion during 2008.
China accounted for one-sixth of the global output expansion. The economic output of 11 markets contracted by $267 billion during 2008. The United Kingdom accounted for one-half while South Korea accounted for two-fifth of the global output contraction. Though the crisis first affected most countries in 2008, it was not yet deep enough to reverse growth.

2008 - 2010 ¡ 2009 – credit crisis spreads ¡ At exchange rates, the economic output of 127 markets contracted by
$4.1 trillion during 2009. The United Kingdom was the largest victim accounting for 12% while Russia accounted for 11% and Germany accounted for 8% of the global output contraction. The economic output of 56 markets expanded by $767.1 billion during 2009. China accounted for 61% while Japan accounted for 20% and Indonesia accounted for 4% of the global output expansion.
¡ At purchasing power parity, the economic output of 79 markets contracted by $1.4 trillion during 2009. The United States was the largest victim accounting for 18% while Japan accounted for 17% and Russia accounted for 10% of the global output contraction. The economic output of 104 markets expanded by $1.5 trillion during 2009. China accounted for 56% while India accounted for 17% and Indonesia accounted for 3% of the global output expansion.
¡ 2010 – recovery

2010 - recovery ¡ At exchange rates, the economic output of 148 markets expanded by
$5.3 trillion during 2010. The five largest contributors to global output expansion are China at 17%, the United States at 10%, Brazil at 9%, Japan at 8%, and India at 5%. The economic output of 35 markets contracted by $338.5 billion during 2010. The five largest contributors to global output contraction are France at 22%, Italy at 18%, Spain at 17%, Venezuela at 10%, and Germany at 7%.
¡ At purchasing power parity, the economic output of 169 markets expanded by $4.2 trillion during 2010. The five largest contributors to global output expansion are China at 25%, the United States at 13%, India at 10%, Japan at 5%, and Brazil at 4%. The economic output of 14 markets contracted by $17.8 billion during 2010. The five largest contributors to global output contraction are Greece at 67%, Venezuela at 19%, Romania at 5%, Haiti at 3%, and Croatia at 2%.
¡ IMF's economic outlook for 2010 noted that banks faced a "wall" of maturing debt, which presents important risks for the normalization of credit conditions. There has been little progress in lengthening the maturity of their funding and, as a result, over $4 trillion in debt is due to be refinanced in the next 2 years.

EU Growth Rate

Industrial Production

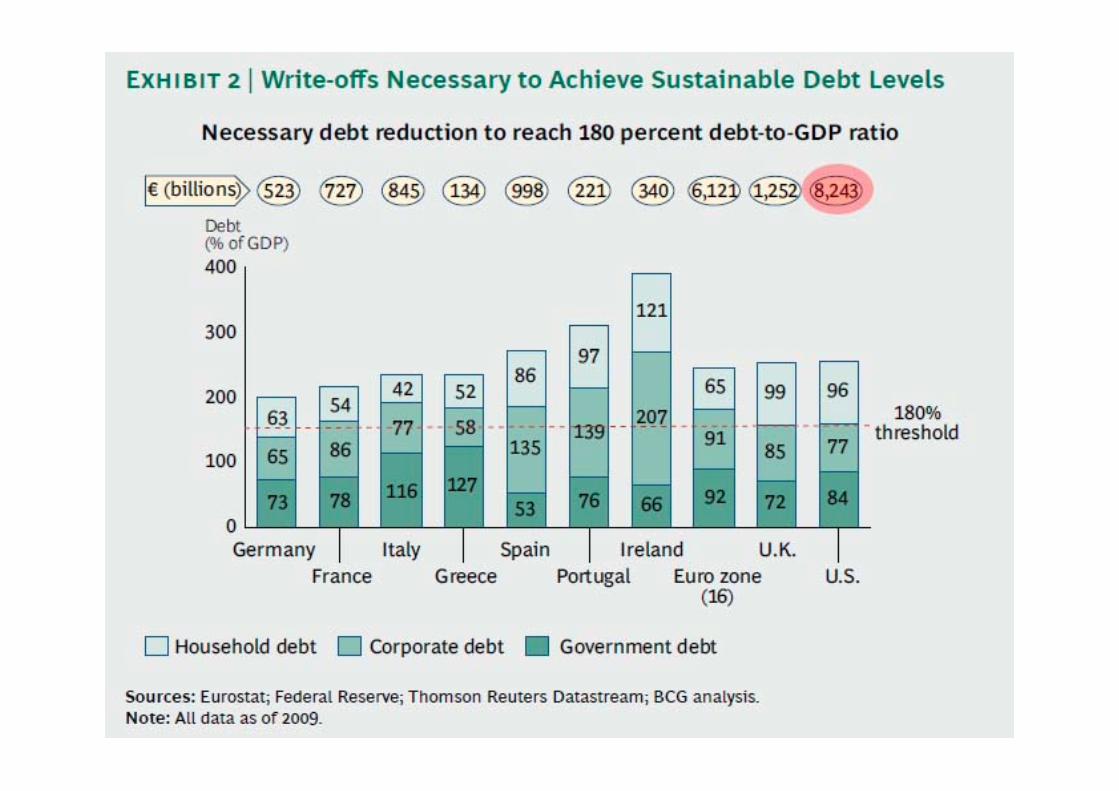
Government debt

Public Debt
www.economist.com

World Government Debt

Europe Government Debt


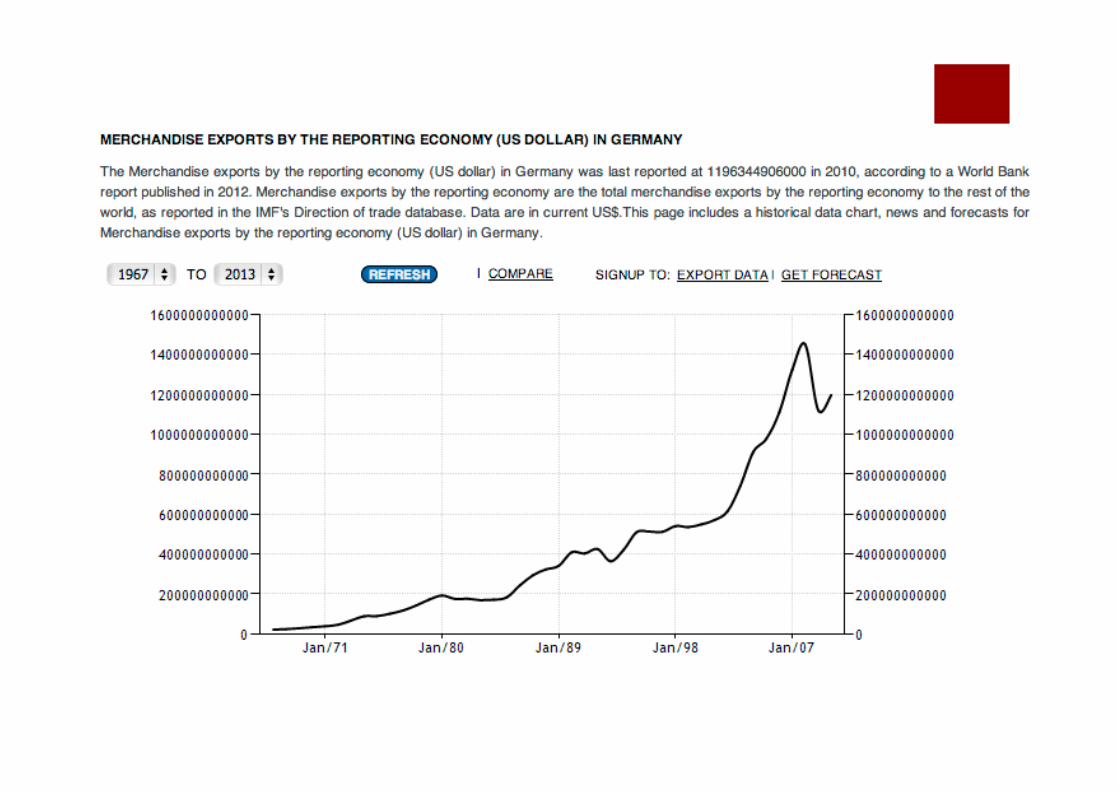
Trade

Largest EU trading partners

millions euro (2011)

Balance EU trade in goods


WTO 28.11.2012


Unemployment

Unemployment rate

EU unemployment rate


![DB [04.2013] Hiromi](https://static.fdocuments.net/doc/165x107/552c29084a7959f07c8b466f/db-042013-hiromi.jpg)