Organizational Performance Index (OPI) Handbook€¦ · the outcomes of our capacity development...
44
Organizational Performance Index (OPI) Handbook January 2013 A PRACTICAL GUIDE TO THE OPI TOOL FOR PRACTITIONERS AND DEVELOPMENT PROFESSIONALS. pact organizational performance index
Transcript of Organizational Performance Index (OPI) Handbook€¦ · the outcomes of our capacity development...

Organizational Performance Index (OPI) Handbook
January 2013
A PRACTICAL GUIDE TO THE OPI TOOL FOR PRACTITIONERS AND DEVELOPMENT PROFESSIONALS.
pact organizational performance index

2
Table of Contents Table of Contents ............................................................................................................................. 2
Purpose of this handbook ................................................................................................................ 4
The Pact OPI – Description and Overview ....................................................................................... 5 Why measure organizational performance? ......................................................................................................... 5 The Pact OPI - What is it? .............................................................................................................................................. 6 Where does it come from?............................................................................................................................................ 6 Why is it needed? ............................................................................................................................................................. 7 OPI and other Pact capacity development measurement tools ...................................................................... 8 Who does it engage? ....................................................................................................................................................... 9 What does OPI not measure? .................................................................................................................................... 10
How does it work?........................................................................................................................... 11 Construction of the Index ........................................................................................................................................... 11
OPI Domains and Sub-Areas.................................................................................................................................................... 11 Step-by-step process .................................................................................................................................................... 12
Step 1: Partner Preparation..................................................................................................................................................... 12 Step 2: Planning for Data Collection..................................................................................................................................... 12 Step 3: Data Collection ............................................................................................................................................................... 13 Step 4: Entering Data into Database .................................................................................................................................... 14 Step 5: Data Analysis .................................................................................................................................................................. 14
Using the OPI data ......................................................................................................................................................... 15 Timeline & major milestones .................................................................................................................................... 15 Resources required ...................................................................................................................................................... 15
Staffing ............................................................................................................................................................................................. 15 Budget............................................................................................................................................................................................... 16
Lessons learned from experience .................................................................................................. 17 Results & efficacy data ................................................................................................................................................. 17 Case story #1: China ..................................................................................................................................................... 18 Case story #2: South Sudan ........................................................................................................................................ 19 OPI Reliability Testing ................................................................................................................................................. 20 Success factors ................................................................................................................................................................ 21 Mistakes to avoid ........................................................................................................................................................... 21 Adaptations and impact area applications .......................................................................................................... 22
Appendices and Resources ............................................................................................................ 23 Appendix 1: Glossary ................................................................................................................................................... 24 Appendix 2: Sample proposal language ................................................................................................................ 26
Strengthening MNCH Frontline Organizations, Nigeria (Bill & Melinda Gates Foundation)........................ 26 Climate Change Adaptation, Vietnam (USAID) ................................................................................................................ 26 SACE, Nigeria (USAID) ............................................................................................................................................................... 26 Activity 5: Implementation of Transition Plans to Direct USAID Funding .......................................................... 26
Appendix 3: Sample budgets ..................................................................................................................................... 28

3
Appendix 4: The OPI Index ........................................................................................................................................ 29 Appendix 5: OPI data collection tool ...................................................................................................................... 35 Appendix 6: Sample data analysis ........................................................................................................................... 39
Pact Thailand ............................................................................................................................................................................... 39 Appendix 7: Contacts within Pact ............................................................................................................................ 41 Appendix 8: Links to other materials..................................................................................................................... 42 Appendix 9: Two-page marketing materials ....................................................................................................... 43

4
Purpose of this handbook This handbook is intended to help development practitioners understand how to use and what can be achieved by Pact’s Organizational Performance Index (OPI) tool. This document will provide the Pact practitioner and manager with information on how the Pact OPI works and how best to incorporate it in their country strategy or program. While this document is designed primarily for internal Pact purposes, it may be shared with donors and partners when they require more information to make funding or partnership decisions. Note: Thanks to the country directors and OPI practitioners from Ethiopia, Nigeria, South Sudan, Swaziland, Vietnam, and Zimbabwe who took part in the Rockefeller Foundation-funded Index Reliability Testing Project which provided invaluable input into this handbook. A special thanks to Shirley Lin of Pact China and Rachel Beck of Pact South Sudan for developing and sharing the case stories, Pact Vietnam and Pact South Sudan for sharing resources, Jana Kala and Hannah Poole for the handbook review. Developed by the Productization Project Team: Rachel DuBois, Matt Reeves & Olga Yakimakho. Guidance provided by the Productization Oversight Group: Eddie Byrd, Katie Schwarm, John Whalen, and Graham Wood. Please send any questions or comments you have to [email protected]

5
The Pact OPI – Description and Overview
Why measure organizational performance? Today, the concepts of capacity development and organizational strengthening are more critical than ever to the international development community, informing the activities of donors, international NGOs and local organizations alike. Capacity development was identified as one of seven key themes for the 4th High Level Forum on Aid Effectiveness held in Busan, Korea, in November 2011. Likewise, a key objective of USAID’s Implementation and Procurement Reform is seeking to mainstream local capacity development across programming to develop “true partnerships to create the conditions where aid is no longer necessary in the countries where [USAID] work(s).” Other donors are following suit, and we expect the role of capacity development to continue to expand as the development community seeks mechanisms for best implementing the principle of country ownership.
As donor interest in capacity development grows, so too does the pressure to be accountable for the results of capacity development initiatives. We have learned that at its best, capacity development unleashes local knowledge, experience, skills and agency, and acts as a driving force for generating meaningful and sustainable development results that empower communities to shape their own destinies. At the same time, practitioners have found the measurement of capacity development results to be elusive. Today, many measurements of capacity development still rely on anecdotal evidence of change or assess the effectiveness of projects by analyzing the numbers of practitioners trained or strategic plans developed. But the “so what?” question of how capacity development efforts influence the lives of beneficiary communities, often remains unanswered.
In order to answer this question, we must first articulate our theory of change that describes the pathway by which our capacity development efforts enable the change that we seek. In Pact’s case, our theory of change can be described as follows: (a) Stronger local organizations and networks with better internal policies, skills, procedures and practices; (b) perform externally at a higher level; and (c) as a result, have greater impact (on health, the environment and livelihoods) in their target communities (see Figure 1).
Figure 1: Pact’s Theory of Change for Capacity Development
Outputs
Change in the internal systems, skills and policies of organizations, networks and systems
Outcomes
Improved external performance of organizations, networks and systems
Impact
Improved health, environment and/or livelihoods in the communities served by organizations, networks and systems

6
Once we have articulated our theory of change, the next stage is to measure it. Pact has many tools for measuring change in internal organizational policies, skills, procedures and practices (OCA, OD Roadmap, etc.). Likewise our project evaluations tell us a lot about change at the community and beneficiary level. However, the capacity development community has traditionally been weak in measuring the changes in external organizational performance that are the outcome of strengthened policies, procedures and skills. To address this challenge, Pact has pioneered the revolutionary Organizational Performance Index (OPI), which helps measure the extent to which capacity development investments improve the performance of our local partners.
The Pact OPI - What is it? The Pact OPI is an approach that helps set up baselines and measure change in organizational performance over time. It consists of a tool – the OPI – and a process that shapes data collection, analysis and usage. The Pact OPI goes beyond measuring the short-term gains from capacity development such as “new systems in place”, “dedicated human resources personnel hired”, or “governing board set up.” Rather, the process assists Pact and our partners to understand the extent to which these outputs of capacity development support positive changes in the way organizations deliver services, relate to their stakeholders and react to changes in the external environment.
The Index is built upon IDRC/Universalia’s research-based and field-tested Capacity Development Outcomes Framework which identifies four domains of organizational performance – Effectiveness, Efficiency, Relevance and Sustainability (see box 1). A detailed description of the OPI and its usage follows in the “How does it work?” section of this handbook.
OPI data aggregated at the project or country level allows us to see and analyze the trends in organizational performance across all local partner organizations and to make comparisons between organizations. When aggregated to the global level, OPI data shows the broad picture of Pact’s capacity development “footprint”.
Where does it come from? The OPI is a product of a number of complementary processes that occurred both within and outside of Pact. For several years, Pact’s Capacity Development and Monitoring and Evaluation Communities of Practice had been working together to refine our theory of change for capacity development. Together these groups chose to adopt the IDRC Capacity Development Outcomes Framework and developed a shared understanding of improved performance as the critical outcome of increased internal capacity. These conversations were boosted by the broader conversation around measurement that was taking place in the global capacity development community, spearheaded by the European Centre for Development Policy Management’s (ECPDM) research initiative around Capacity, Change and Performance.
Box 1: IDRC/Universalia Capacity Development Outcomes Framework: Effectiveness: achieving results and meeting standards Efficiency: delivering services and increasing reach Relevance: engaging target populations and promoting learning Sustainability: mobilizing resources and increasing social capital

7
At the same time, outside of Pact, the number of capacity assessment tools used by other organizations that focused on internal systems, skills, policies and procedures was multiplying rapidly. As a result of this increased competition, Pact’s OCA (discussed in more detail on page 9) was no longer viewed as the leading measurement tool for capacity development that it had been a decade previously.
The development of Pact’s global indicators1 provided an excellent opportunity to crystallize our thinking around measuring organizational performance. The Organizational Performance Index was initially developed as Pact’s global indicator for capacity development – strengthening our accountability to partners and donors alike. We have since adopted the OPI more generally as a key tool and complement to the OCA, which is used for measuring the result of our capacity development efforts in numerous projects around the world. In 2013 Pact incorporated the application of the OPI and other tools into its Capacity Development Gold Standards Handbook.
Why is it needed? The majority of organizational assessment tools (Pact’s OCA, MSH’s MOST, McKinsey’s Capacity Assessment Grid, etc.) focus solely on output level changes in internal organizational systems, structures, policies and procedures. The Pact OPI is distinctive in that it measures organizational change at the outcome level with a focus on external performance. Although large scale performance studies have been conducted in the past (such as ECDPM’s study on Capacity, Change and Performance and the annual NGO Capacity survey in Ukraine), the OPI is the only tool that is designed to be used in a consistent way with limited resources.
As described in the “Why measure organizational performance” part of this handbook, assessing outcomes of capacity development is becoming best practice in the field of capacity development, and the OPI positions Pact as a field-leader in the institutionalization of performance measurement. During the 2012 Interaction Forum and USAID Local Capacity Development Summit, Pact confirmed that other development actors are only beginning to tackle the issue of global outcome measurement.
Secondly, a standardized performance assessment tool allows us to see cross-organizational trends and to disaggregate by impact area, location and organizational type. By promoting better understanding of the outcomes of our capacity development efforts worldwide, Pact is empowered to make evidence-based decisions about funding, new business opportunities, staff excellence and areas for improvement. We can also use OPI data to support our understanding of our theory of change and of the impact we are making in the world. For example, Pact projects conducting external evaluations of capacity development initiatives will benefit in particular by having outcome level data on hand before external evaluators collect their own data. This will allow evaluators to make better judgments about the results of the intervention and demonstrate the high level of internal learning.
1 Pact Global Indicators Initiative started in 2011 with the goal of measuring the global impact of Pact programs and approaches across all programs and projects. The Capacity Development Global Indicator measures the number of local partners with improved organizational capacity.
Box 2: Who benefits from OPI Results & Analysis?
• Pact Partners • Country Teams • Pact Globally • Donors

8
Last but not least, the bigger picture of partner progress at the country level will be not only helpful to celebrate successes, learn from evidence, set targets and adjust work plans, but also to promote Pact externally and generate more support from local and international partners. As our colleagues in Ethiopia have suggested, the OPI “is a good means for ensuring accountability on the work we do to justify our contributions and results gained to donors, government and community.”
OPI and other Pact capacity development measurement tools Pact has several tools for measuring capacity development, such as OCA, the OD Roadmap, TOCA and PCAT. The OPI is a unique and an ideal complement to these existing measurement tools because it measures change in performance, the outcome of capacity development. Although the OPI may be used independently, it is most powerful when used alongside existing tools.
OCA and OPI OCA OPI OCA focuses on the outputs of capacity development, the shorter-term internal changes in organizational policies, skills, procedures and practices. OCA answers the question “How have the organization’s internal systems, policies and procedures changed in the result of capacity development activities?” OCA will attest if an organization has developed financial standards that are in line with national and international practices.
OPI focuses on capacity development outcomes, the change in organizational performance that results from improved internal capacity. OPI answers the questions “So what if this organization has an improved governance system?”, “So what if they are better at managing finances?” OPI will demonstrate that an organization’s financial system is enabling efficient spending of project funds.
The two tools are absolutely connected and can feed into each other. Over time, for example, we can analyze changes in OCA scores to identify how improved capacity influences improved performance. Ideally, the results of both assessments can be combined to support the development of Institutional Strengthening Plans.
In order to save time and emphasize the differences between OCA and OPI, it is recommended that Pact work with partners to complete both tools as part of a single process. Reserve half a day during the OCA assessment to introduce the OPI and fill out the OPI scoring sheets with the organization. This approach has been applied successfully in South Sudan, Mozambique and Nigeria. Our South Sudan team commented that “it helped to do OPI at the same time as OCA – the difference was clear to the participants and there was no resistance to doing two assessment types together.”
The above also applies when comparing the OPI with other organizational or capacity assessment tools such as the OD Roadmap or Network Capacity Assessment (NECA). More information on the Pact OCA can be found in the OCA Handbook.

9
OPI and MCAT The Management Control Assessment Tool (MCAT) is used to judge the risk associated with issuing a grant to the selected partner. This is a compulsory checklist, completed by Pact staff, that ensures compliance and alerts us to any shortcomings that need to be addressed in the course of the grant. The output of the MCAT consists of recommendations for grant conditions and for areas of improvement to be included in Institutional Strengthening Plans. The MCAT is useful for making critical decisions around grants to local partners, but it is not designed for measuring capacity development.
The OPI, on the other hand, is primarily a tool for measuring and learning about capacity development. OPI results may be used to inform decisions about the level of extending financial and technical support to a partner: results from capacity development activities depend on many factors and may take a long time to manifest themselves as the outcome-levels change in organizational performance. If using the OPI tool to support funding or support decisions, it is mandatory to use it in combination with other assessments and records of partner performance.
OPI and PCAT Some projects decide to use a non-mandatory Program Capacity Assessment Tool (PCAT) in addition to MCAT. PCAT measures a partner’s technical capacity in the impact area in which they operate. It is specific to a technical impact area, be it Orphans and Vulnerable Children, Biodiversity, Microfinance, etc., and explores standards and process related to that impact area in much greater depth than the OPI. In several new projects, we have explored the combination of technical/programmatic and organizational capacity assessments (TOCAs) that remove the necessity of conducting a separate PCAT. These integrated assessments have the advantage of reducing the assessment burden on partners, and enabling a faster transition into capacity development and technical support activities.
Who does it engage? Pact’s OPI is the tool that can measure progress of a formal organization, association or network (see Box 3 for examples). For the purposes of this handbook, any of the above will be referred to as “organization” or “partner”. The current version of the tool is not applicable to national or sub-national governments, communities and systems. It also should not be used with issue-based coalitions, communities of practice, or other types of informal networks.
Because it tracks outcome level change, the OPI is best used in combination with traditional assessment tools as part of a multi-year intervention.
Pact’s OPI measures change at the “organizational” level rather than the “project” level. This is due to Pact’s commitment to engage local partners holistically. It is not sufficient for an organization to engage
Box 3: Examples of partner organizations for OPI application:
Organizations: • Civil Society Organization (CSO) • Community Based Organization (CBO) • Faith Based Organization (FBO) • International Non-Governmental
Organization (INGO) • Foundation, Community Based
Foundation Networks and associations:
• Labor or Trade Union • Chamber of Commerce • Network of People Living with HIV&AIDS • Capacity Development Association

10
beneficiaries as part of a Pact-funded project – this practice must be embedded in all projects and activities of this organization. As a result, OPI implementation should engage partner organizations holistically, rather than just those staff involved in a Pact-funded project or initiative.
Some organizations have multiple “chapters” operating in multiple locations and/or on multiple levels. In cases where engaging the whole organization is not possible, it is reasonable to apply the OPI to a single chapter of the organization, rather than the entire national or international entity.
The data collection process usually engages the partner organization’s management and other key program personnel. From the Pact side, Program Officers, Capacity Development Officers and MERL Officers work together, combine their multiple perspectives to generate reliable data and lead in data analysis. For results debriefings with the partner, other appropriate members of the partner organization and Pact may be brought in.
What does OPI not measure? OPI does not measure attribution because many factors influence capacity development outcomes of a single organization, including, but not limited to, government actions, other donors, local activities, staff changes, etc. Rather, the OPI focuses on Pact’s contribution to change in organizational performance.
OPI data should not be used by Pact to make country-to-country comparisons. Discussions of individual country progress are possible only through deep qualitative understanding of operating environments, impact areas and program circumstances.
Unlike the Pact OCA, OPI does not examine organizational systems, policies, practices and procedures, and is therefore not a good basis for the development of an Institutional Strengthening Plan.
Likewise, although the OPI does consider technical performance, it is not ideal for deep analysis of a specific technical area. Where such analysis is needed, a PCAT or TOCA may be a better assessment tool.
OPI also does not assess risks involved in potential engagements with local partners, nor do the results of OPI help in determining the type of sub-grant Pact should issue to the partner. The MCAT and PCAT tools and audits are best suited for these purposes.
11
How does it work?
Construction of the Index The unit of measurement is an individual entity, examples of which are given in Box 3 on page 8.
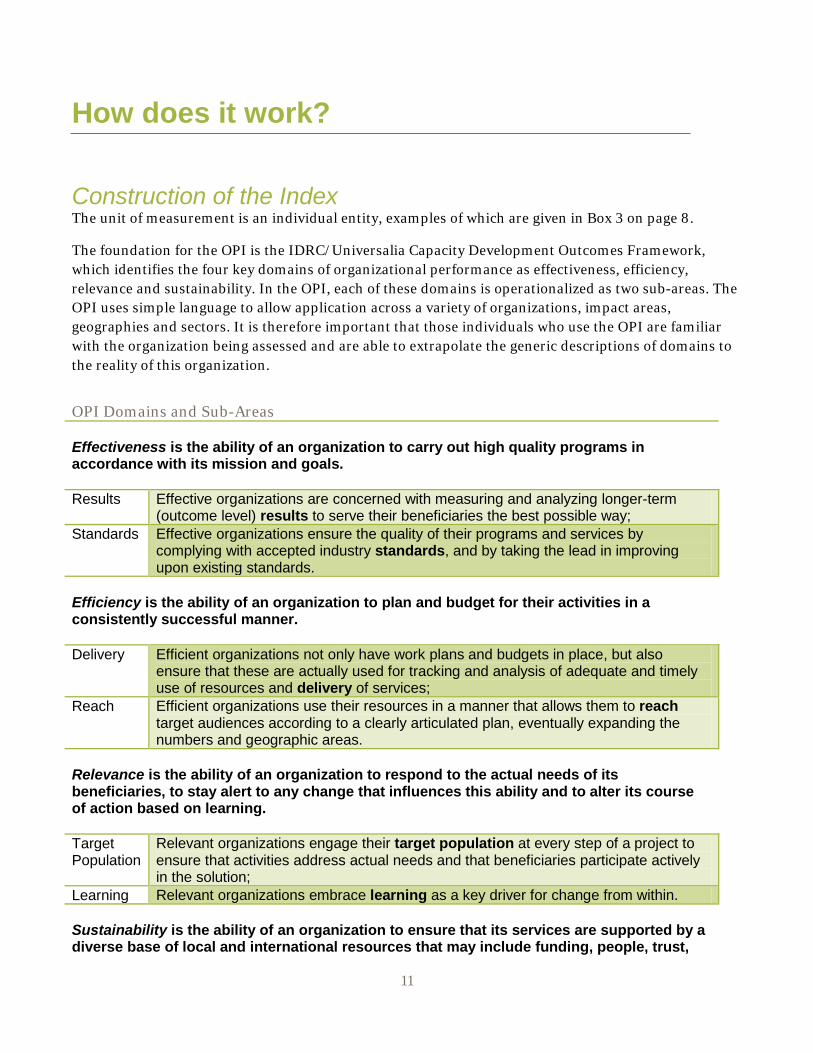
The foundation for the OPI is the IDRC/Universalia Capacity Development Outcomes Framework, which identifies the four key domains of organizational performance as effectiveness, efficiency, relevance and sustainability. In the OPI, each of these domains is operationalized as two sub-areas. The OPI uses simple language to allow application across a variety of organizations, impact areas, geographies and sectors. It is therefore important that those individuals who use the OPI are familiar with the organization being assessed and are able to extrapolate the generic descriptions of domains to the reality of this organization.
OPI Domains and Sub-Areas Effectiveness is the ability of an organization to carry out high quality programs in accordance with its mission and goals. Results Effective organizations are concerned with measuring and analyzing longer-term
(outcome level) results to serve their beneficiaries the best possible way; Standards Effective organizations ensure the quality of their programs and services by
complying with accepted industry standards, and by taking the lead in improving upon existing standards.
Efficiency is the ability of an organization to plan and budget for their activities in a consistently successful manner. Delivery Efficient organizations not only have work plans and budgets in place, but also
ensure that these are actually used for tracking and analysis of adequate and timely use of resources and delivery of services;
Reach Efficient organizations use their resources in a manner that allows them to reach target audiences according to a clearly articulated plan, eventually expanding the numbers and geographic areas.
Relevance is the ability of an organization to respond to the actual needs of its beneficiaries, to stay alert to any change that influences this ability and to alter its course of action based on learning. Target Population
Relevant organizations engage their target population at every step of a project to ensure that activities address actual needs and that beneficiaries participate actively in the solution;
Learning Relevant organizations embrace learning as a key driver for change from within. Sustainability is the ability of an organization to ensure that its services are supported by a diverse base of local and international resources that may include funding, people, trust,

12
and other types of support. Resources Sustainable organizations generate resources from multiple sources in a strategic
manner; Social Capital
Sustainable organizations understand and use the power of social capital, or those relationships and connections in their communities that allow for running successful programs and that produce long-standing results.
Each sub-area is articulated in four levels of benchmarks that describe increasing levels of performance. Level 1 maps to the lowest level of performance and Level 4 to the highest. Each sub-area should be assigned a number score 1 – 4 corresponding to the level agreed upon by the organization and Pact. In case of differences in perception between the organization and Pact, both parties negotiate and agree on one score (see Data Collection below). Each two sub-areas are averaged together to get the domain score, and the four domain scores are averaged to an overall organizational score.
Step-by-step process Step 1: Partner Preparation Preparing the partner for an upcoming OPI scoring is a critical step in the implementation process. It is important to get organizations on board with the process before applying OPI and to encourage using this approach for organizational learning and strategy development. This is because the stronger a partner’s buy-in, the better data and results that are going to come out of the process. The most important part of the preparation is ensuring the partner understands the reason for this assessment and its role in the partnership with Pact.
Pact has prepared a PowerPoint presentation to use for training partners on the OPI. Pact staff should use this presentation as a template, which they are free to tailor according to their audience, needs and time constraints.
We have learned that applying the OPI alongside an OCA can be a powerful way of highlighting the difference between the two.
See the section “Who does it engage?” for the types of partners we can use the Index with.
Step 2: Planning for Data Collection Program Staff, Capacity Development Officers and MERL Officers are responsible for conducting the OPI data collection and analysis at the country level. The process is overseen by senior officers or managers in the country. This process ensures that partner scores reflect the range of technical expertise on the Pact team and that country office teams are on the same page concerning partner scores. Program Advancement support is available to the country offices for OPI-related training and troubleshooting.
Tip:
A fun way of learning the Index and ensuring good understanding of it is to engage Pact staff/partners in a game of puzzle. Cut the Index into small squares where sub-domains and benchmarks become puzzle pieces. Ask the group to put the Index together.

13
Key members of the partner organization must participate in the data collection and any staff member can participate in the results debrief. It is not necessary to arrange separate meetings/site visits for OPI purposes solely. It is best to attach the OPI data collection to another process such as an OCA/TOCA/ONA Results Debrief, a stakeholder meeting or a workshop, or a mentoring visit dedicating 2-3 hours with the key staff to do this scoring. If this is the first time a partner has been introduced to the OPI, additional time may be necessary for training, or Pact staff may need to be available for remote support to answer questions that arise.
Ensure that Pact staff engages in data collection and verification, and partners understand that in order to move to the next level, they must meet all of the proceeding and next level’s qualities.
Data sources Primary data should come from the partner organization in the form of OCA reports, programmatic reports, management data (HR, financial, governance), databases, M&E plans, meeting minutes, etc. Secondary data can be obtained from other CSOs, media, and other sources outside of the organization. Make sure that the organization is aware if you are using secondary data in your scoring.
What counts as evidence? Each individual completing the scoring should use the best judgment possible, because it is important to ensure that the resulting data represents the objective reality (data validity). If two people conduct the scoring independently from each other, they should come out of the assessment with the same scores. In order to achieve this, each Pact staff member and partner participant must understand what counts as evidence before beginning the scoring process. With partners, it may be necessary to review and discuss relevant evidence on several occasions.
The examples of evidence given in the OPI tool are not exhaustive. Because every country context is different and every organization should be able to set up its operations in the most convenient way, the reviewers should be open to new evidence types – as long as it upholds the standard articulated in the OPI and confirms the statement describing each level. What matters most in evidence review is the quality of the information that is contained in the evidence piece.
Step 3: Data Collection There are two standard practices for OPI data collection.
Bronze Standard of Data Collection Gold Standard of Data Collection In special circumstances such as imperfect timing, unavailability of the partner, environmental
The preferred data collection with the most credibility is achieved when the partner scores
Tip for Facilitating Evidence Checks: Pact country office may start building up the list of its country-specific evidence so that each new staff member is better equipped to complete the exercise and produce valid data.
Important! It is vital to assess the partner correctly during the baseline data collection so that consequent assessments show growth. While we are striving to move all partners towards Level 4, this is the stage where they stop requiring intensive external capacity development support.

14
restrictions, etc. Pact officers shall make the judgment and conduct scoring independently of the partner based on the information available to them (from previous OCAs, reports, events, etc).
itself first, with Pact reviewing the evidence provided and negotiating the scores if necessary.
The Gold Standard is the preferred method of collecting data because it generates organizational buy-in and empowers partners to score themselves. The Gold Standard is more in line with Pact’s participatory, customer-driven approach, and it builds capacities in self-reflection and identification/presentation of evidence.
It can take up to four hours for partners to compete an initial self-assessment using the OPI. Reassessments and assessments completed by Pact staff tend to be much quicker – lasting less than one hour.
Data Disaggregation Data collected using the OPI for Pact’s Global Indicator process enables us to analyze country-level and global trends in capacity development support. Data is disaggregated by country; type of organization/partner; length of partnership with Pact; Bronze or Gold Standard data collection method; name of partner; sector(s)/impact areas; types of capacity development provided by Pact; project(s) through which support is provided; and the performance domains of the OPI. This information is helpful to understand trends and pose additional follow-up questions: Which impact areas demonstrate most change? What support is necessary to projects in other impact areas? What is the correlation between the types of support partners receive and the change in their performance? Does progress depend on the length of partnership with Pact? At what point does our support reach the limits of benefit to the partner?
Frequency of data collection In the beginning of the relationship with every partner, Pact will set up a baseline and targets for future results of organizational development efforts (minimum 1 year, maximum 5 years). In certain cases, with projects already active, it may be possible to set the baseline retroactively for the previous year. Each organization is then reassessed on an annual basis. The reporting deadline for Global Indicator data for all Pact country offices is October 31, but each office should set an internal deadline, which can be any time of the year depending on the office’s work plans and priorities. Regardless of when OPI data is collected, it should be done so in a consistent manner, at around the same time each year.
Step 4: Entering Data into Database The data collection tool in Appendix 5 is used to quickly record the eight scores, list the evidence that confirms the scores, and, where applicable, highlight comments from discussions with the organization. OPI data is then transferred into the Pact global online database via computer.
Step 5: Data Analysis For the Pact Global Indicator, the Program Advancement CD Team averages the scores for each sub-area, and those organizations with a higher average score than the previous year are counted as having “improved their performance.” The number of organizations that improve their performance is currently reported as Pact’s Global Indicator for capacity development.

15
In addition to the Global Indicator, analysis of OPI data can provide deep insights into the progress of projects and individual partner organizations. Once disaggregated by country and project, OPI data can be graphed and analyzed to answer questions such as:
• In which OPI domains and sub-areas are partners improving their performance? • In which OPI domains and sub-areas is partner performance unchanged? • Are there patterns in how partner performance has improved? • Are there external factors that have influenced change in partner performance (either positively
or negatively)? • How have project activities contributed towards improved partner performance? • How might project activities over the coming year be tailored to support improved
performance?
Using the OPI data It is important to use – and look for creative ways of using – the data collected in the OPI process. In addition to learning about outcomes at the partner level and aggregating data across the Pact world, the OPI data can provide useful information for:
- Proposals: OPI data can be used to support statements around past performance and emphasize Pact’s commitment to measuring the results of our capacity development efforts.
- Partner Events: OPI data can be shared back to partners and other stakeholders at project events. Data can be used to support reviews of work completed and to influence planning for future activities.
- Success Stories and Project Reports: OPI data can be used to enrich qualitative success stories of Pact’s work, helping us to link capacity development support to community-level change.
Timeline & major milestones Data collection: OPI data can be collected over the course of the year, whenever it makes most sense for a project and its partners. For consistency, it is recommended that OPI data be collected at a similar time each year.
For the Pact Global Indicator process, the following dates hold:
• Data due to the global collection MERL point of contact: end of October • Global data analysis: November - December • Global report issued: January
Resources required Staffing Each country office needs to have at least two OPI-trained Capacity Development/Program staff members managing the annual data collection. Training materials are available here. It is preferred that

16
MERL personnel be engaged in data collection and analysis. This allows for better linkage between capacity development and other programmatic work.
Budget If combined with other capacity development activities, the data collection should bear no additional cost except for staff’s LOE. We estimate that on-site OPI data verification per organization should not exceed four hours. Data analysis is performed at the global level, and any additional data analysis at the country office or project level will result in additional LOE costs.

17
Lessons learned from experience
Results & efficacy data As a result of rolling out Pact’s Organizational Performance Index for global data collection, Pact is the first organization to consistently measure outcome level change and clarify the link between capacity development inputs and community-level impact. Six of 23 country programs pioneered use of the OPI to establish changes in performance or to collect baseline data among Pact’s FY2011 partners. In the six countries that used the OPI, 47 partners were assessed.2
The two graphs to the right provide insight into the change of performance across all partners using the OPI. Figure 2 shows global change in performance across the four domains of Pact’s OPI: Effectiveness, Efficiency, Relevance, and Sustainability. We can see that the greatest level of change occurred under the Efficiency domain, and least progress under the Relevance. This same type of graph can be used to visualize data at the country or project level.
Figure 3 helps to explain the results for partners of Pact Thailand by breaking them down into eight sub-areas, two per performance domain. For example, the picture tells us that Learning has been one of the greatest areas of performance growth. This may be due to the development and implementation of the “M&E for Me” initiative.
2 China 4; Myanmar 2; South Sudan 4; Swaziland 13; Thailand 8 and Vietnam 20
11.5
22.5
33.5
4
Baseline 2011
Figure 2: Change in Partner Performance Across Country Offices Piloting the Organizational Performance Index
Effectiveness
Efficiency
Relevance
Sustainability
1.00
2.00
3.00
4.00Results
Standards
Delivery
Reach
TargetPopulation
Learning
Resources
SocialCapital
Figure 3: Average Performance Compared with Baseline - Thailand
Average Baseline
Average Current

18
Case story #1: China Since 2008, Pact has been working with four local partners to implement a USAID-funded HIV/AIDS and Livelihoods Development project in rural, urban and semi-urban localities of Yunnan and Guangxi in China. The support provided to partners included various types of organizational and technical capacity development.
In 2012, Pact invited staff, beneficiaries of partners and government representatives to a forum to review capacity development achievements and engage key stakeholders in a discussion of the results. Presentations by Pact’s partners demonstrated that in the course of the project they had become increasingly capable of meeting the complex needs of beneficiaries, had gained greater understanding of linkages between HIV/AIDS and livelihoods programming, and had developed stronger relationships with various stakeholders.
OPI data, used to enrich the discussions, demonstrated that project partners became much more efficient in providing timely services and ensuring good project management. The level of partner effectiveness increased greatly as well; organizations had developed mechanisms for measuring progress toward goals, and analyzed how successful they were in reaching them. Partners also increased their relevance by actively engaging beneficiaries in project planning, delivery and assessment. Sustainability showed the least advancement, indicating an important area for future capacity development efforts.
Based on the discussions, participants in the forum drafted a sustainability plan and committed to continue their work beyond the life of Pact’s project. Having good data on capacity development results during an important conversation with project stakeholders helped to ensure everyone’s agreement on future needs and commitments going forward.
In applying the OPI, the Pact China team appreciated that the tool is not a top-down approach and that the self-assessment and evidence identification by partners is participatory. As a result of this, partners were more likely to own the OPI tool and their results, which in turn made them more comfortable sharing and discussing results with external stakeholders. Local partners felt that they could benefit from being able to use this index to demonstrate organizational resilience when applying for external funding resources in the future.
At the same time, the Pact China team recognized that because the OPI is a globally applied measurement tool, it does not meet the specific needs of all partners, as each varies in type, size, scope, mission, working environment and multiple other aspects. In line with one of Pact’s core values – local solutions - in future iterations the team will look for opportunities to complement the OPI with other measurement approaches that are targeted toward the specific needs of partners. It was necessary to support partners to understand some of the more complex terms and identify appropriate evidence for each benchmark.

19
“The Capacity Development Index was the most difficult to report on for the FY 2011; our new projects in FY 2012 will have baseline indicators which will assist with monitoring actual progress on Capacity Development.“
Census K Lo-liyong MERL Coordinator, South Sudan Country
Program
Case story #2: South Sudan In 2011, when Pact first introduced the OPI, the South Sudan office attempted to roll out the Index to more than 100 partners. With little time and resources, the process was incredibly challenging and the data received was questionable. The next year, with guidance from the PA Capacity Development team, the South Sudan office tried a new approach, selecting nine advanced partners that are part of the CBO Excellence Initiative to implement the OPI with and use the gold standard in this process. The idea behind this strategy was to start small and do as well as possible, then next year roll the OPI out to more partners, and repeat each year until all partners participate.
Preparing to conduct OCAs for all nine CBO partners, the South Sudan office decided to incorporate the OPI into the OCA process. To do so, the staff facilitating the OCAs needed to be trained. Given the sensitivities around partners and testing, the training on the OPI included a section on understanding the differences between the OCA and OPI and why both processes were needed and valuable to both Pact and its partners. In addition, this section was included in the rollout to partners, which helped in gaining buy-in.
While coordinating logistics and the flow of information to and from remote locations is a challenge in South Sudan, so was making sure that staff and partners had a concrete understanding of the Index itself. There were a number of challenges in this area including staff and partners not asking questions or wanting to admit they didn’t understand everything perfectly the first time. This resulted in some staff not being able to complete the staff scoring and partners that needed extra meetings and more of a structured, facilitated process to complete score sheets.
In addition, partners seemed to understand that the evidence is what would be used to justify a score in a particular category but not necessarily that they needed to provide such evidence to Pact for validation. Some of the basic concepts of evidence and validation scoring by Pact staff were not easily comprehended by the partners.
Furthermore, the facilitators found that the first page of the Index was particularly difficult for everyone to understand. The first page often took an hour or more to go through. Participants seemed to get discouraged and frustrated by the first page. The facilitator decided to start with the second page, which is service delivery focused – something all partners are more familiar with and comfortable. This resulted in partners’ increased confidence.
Finding the entire training process for the Index rather lengthy and challenging to understand, the facilitators also made efforts to include participants throughout the process, asking them to read sections or provide their own examples. The South Sudan team found this to be helpful in keeping participants engaged throughout the process but recommended more effort to incorporate participatory facilitation techniques to both maintain engagement and promote deeper comprehension of the tool.

20
OPI Reliability Testing In 2012 Pact received funding from the Rockefeller Foundation to carry out research on the reliability of the Organizational Performance Index (OPI). Pact’s Ethiopia, Nigeria, South Sudan, Swaziland, Vietnam, and Zimbabwe country programs participated in the research based on their availability to support this initiative including their access to cost share resources, staff availability, and partner accessibility. For the purposes of the reliability testing, Pact targeted small community based organizations (CBOs), faith-based organizations (FBOs), national level NGOs, and formal networks. In total, the initiative involved 40 partners, with each partner assessed independently by two trained Pact staff as well as by the organization’s own staff.
We compared the Pact staff scores with the partner scores to assess the reliability of the overall index. Pact hypothesized that if reliable both sets of Pact staff should assign the same organizational performance level and that there should be little variation between Pact scores and partner scores. Reliability of .70 or higher on Cronbach’s Alpha scale was sought in the research.
The research revealed that the reliability of the OPI on the Cronbach’s Alpha scale is 0.894 when analyzing the collective of all scorers (two Pact staff and the partner across all 40 organizations and all domains). The table with Cronbach’s Alpha by country presented above highlights the alphas across all participating country programs.
The project participants also shared qualitative information that helped to further analyze and explain results. For example, scorers found that the Effective domain was more difficult to understand and assign a score than other domains. This domain showed the lowest reliability, as shown in the table to the right. Consequently, Pact added additional descriptive information to this domain to provide clarity (see the updated OPI Index in Appendix 4).
Through the research, Pact found that the OPI tool exceeds the reliability alpha sought as well as that reliability increases as both Pact and partners assess and verify evidence (Gold Standard).
Country Cronbach’s Alpha Ethiopia 0.867 Nigeria 0.850 South Sudan 0.907 Swaziland 0.875 Vietnam 0.897 Zimbabwe 0.907 All 0.894
OPI Domain Cronbach’s Alpha
Effective 0.856
Efficient 0.877
Relevant 0.885
Sustainable 0.917

21
Success factors The following have been identified as critical success factors by those involved in piloting the OPI:
1. Allocate enough time: Pact must allocate enough time for (i) internal staff to learn the tool; (ii) explaining the tool and implementing scoring with the partners; and (iii) analyzing OPI results. It is recommended that each country office identify a time during the fiscal year that works well in terms of project schedules. The OPI produces better data when there is not deadline pressure.
2. Understand all language before taking it to the partner: It may be necessary to translate the index into local languages and/or clarify the meaning of specific terms using the glossary in Appendix 1 of this document.
3. Integrate the OPI data collection into existing processes: Conducting OPI at the same time as OCA or other preplanned partner visits will save time. Likewise, integrating OPI into an OCA exercise will demonstrate how these two processes differ and complement each other.
4. Explain the tool to partners: Taking the time to explain the purpose of OPI to partners makes a great difference to implementers. Country offices that have done this have found it much easier to build enthusiasm and understanding of the tool. Participatory approaches that involve discussion and opportunities for question-and-answer have proven particularly fruitful.
5. Identify an OPI Champion: An OPI Champion within the country office can train staff and partners, provide refresher training and ensure that the data collection takes place in a timely manner.
6. Score later domains first: Some partners find the concepts in the Effectiveness domain to be somewhat complicated. By starting with later domains such as Reach or Target Population, you can put the partner at ease with the process, before moving to more complicated concepts such as Results or Standards.
Mistakes to avoid The following have been identified as mistakes to avoid by those involved in piloting the OPI:
1. Changing the OPI to apply to the context: It is tempting to change the OPI tool in order to accommodate local circumstances and/or make partner scores appear higher. This not only skews the global picture but limits the possibility of comparison and learning across programs. The key to the OPI exercise is not to score high but analyze the change over time against a standardized and globally recognized framework.
2. Waiting until the Global Indicator reporting period to implement: It is not necessary to wait until September and October to implement the OPI with partner organizations. Waiting this late will result in a rushed and stressful implementation. Rather you should implement at a time that makes sense for you and your partners.
3. Focusing only on the part of the organization funded by Pact: It is tempting, and often easier, to apply the OPI only to the project or unit of the partner that is funded by Pact. However, we know that capacity development needs to be holistic and that if a partner acts in a certain manner only because of its funder it has not truly changed its performance. OPI implementation should therefore engage the whole partner organization. Some organizations have multiple “chapters” operating in multiple locations and/or on multiple levels. It is reasonable to apply the OPI to a single chapter of an organization, rather than the entire national or international entity.

22
4. Taking too much time: The OPI is designed to be relatively simple to implement. Partners should not need to spend more than four hours completing their initial scoring, or two hours reviewing previous scores. If partners are scoring themselves, it is recommended to keep the momentum and excitement by giving a maximum of one week for turnaround.
Adaptations and impact area applications Because we are using the OPI to measure the Capacity Development Global Indicator, it is important to use the OPI in its standardized form where possible. This enables comparison and cross-learning between projects and country offices. Flexibility does exist in judging the types of evidence that are considered sufficient to identify an organization at each level, as long as this is applied in a consistent manner across all partners in this country context. Where new types of evidence are identified, please share these with us, as they could be valuable for future iterations of the OPI.
Projects are encouraged to add their own sub-areas/domains to the OPI if they feel these would be more appropriate for their partners’ learning. In this case, the standard core of the OPI would need to be disaggregated out for the purpose of reporting on Global Indicators.
Several country offices have found value in translating the OPI into local languages. This is recommended, particularly where it aids partner understanding.
The current version of the OPI is likely to evolve. As with all Pact approaches, we are open to learning and improving the quality of the tool through the testing process. In particular, we are looking at ways to adapt the OPI to meet the needs of alternative types of partners, such as informal community groups and government agencies. In each case, the core domains of Effectiveness, Efficiency, Relevance and Sustainability will remain the same, but benchmarks and examples of evidence will be altered to be more applicable. We are also considering the addition of a Level 5, to meet the needs of organizations in particularly favorable operating environments.

23
Appendices and Resources
These appendices are intended to provide additional information which the Pact manager or marketer may find useful in understanding more about the Pact OPI.

24
Appendix 1: Glossary Civil Society Organization: An organization that operates in multiple communities or at the national level. It can be an NGO, non-profit organization, trade union, association, etc.
Community Based Organization: A CSO that operates within a single community (regardless of whether that organization is faith-based or secular).
Data quality audit: A regular external assessment performed to ensure that the reported data from the institution that receives funding or other support is reliable, valid, timely, and collected/stored with integrity and precision. Data quality: Data quality refers to the worth/accuracy of the information collected and focuses on ensuring that the process of data capturing, verification and analysis is of a high standard (such that it would meet the requirements of an internal or external Data Quality Assessment/Audit). Faith Based Organization: A CSO operating in multiple communities or at the national level whose governance structures are explicitly linked to a religious institution. Impact: The long-term effect of a program or project on its end beneficiaries (for example, decreased poverty in a community in livelihoods interventions, improved health among the targeted OVC population in a health program, or established sustainable funding flows from local business to an organization in a capacity development project). Indicators: Statements that describe a state of affairs in each of the areas that require improvement, which an organization is striving to achieve. Institutional Strengthening Plan (ISP): An ISP is a program management document that describes what Pact will do to build the capacity of a partner. An ISP can be referred to as a CD plan, action plan, partner support plan, etc. Institutionalization: Adoption of practices and procedures as an all-organization standard that applies consistently to relevant departments and functions within the organization. International Non-Governmental Organization: A CSO operating in multiple countries (regardless of whether that organization is faith-based or secular). Leveraging: Using one set of resources (for example, a grant from Pact) to bring in another set of resources (a private foundation that had agreed to match the amount other donors bring). Management Control Assessment Tool (MCAT): A checklist of management and financial indicators used to judge the grant-worthiness of the partner. Management Control Assessment Tool (MCAT): A checklist of management and financial indicators used to judge the grant-worthiness of the partner. Monitoring, Evaluation, Reporting and Learning (MERL) Plan: A document that outlines data needs, data collection and analysis process, and evaluation and reporting procedures to be undertaken by the organization. The MERL plan builds from the organization’s strategic plan or similar document that outlines the mission, strategies, objectives and key activities of the organization. Network: An inter-dependent system of relationships between individuals and groups connected by a common purpose (see ONA handbook for more information about networks).
25
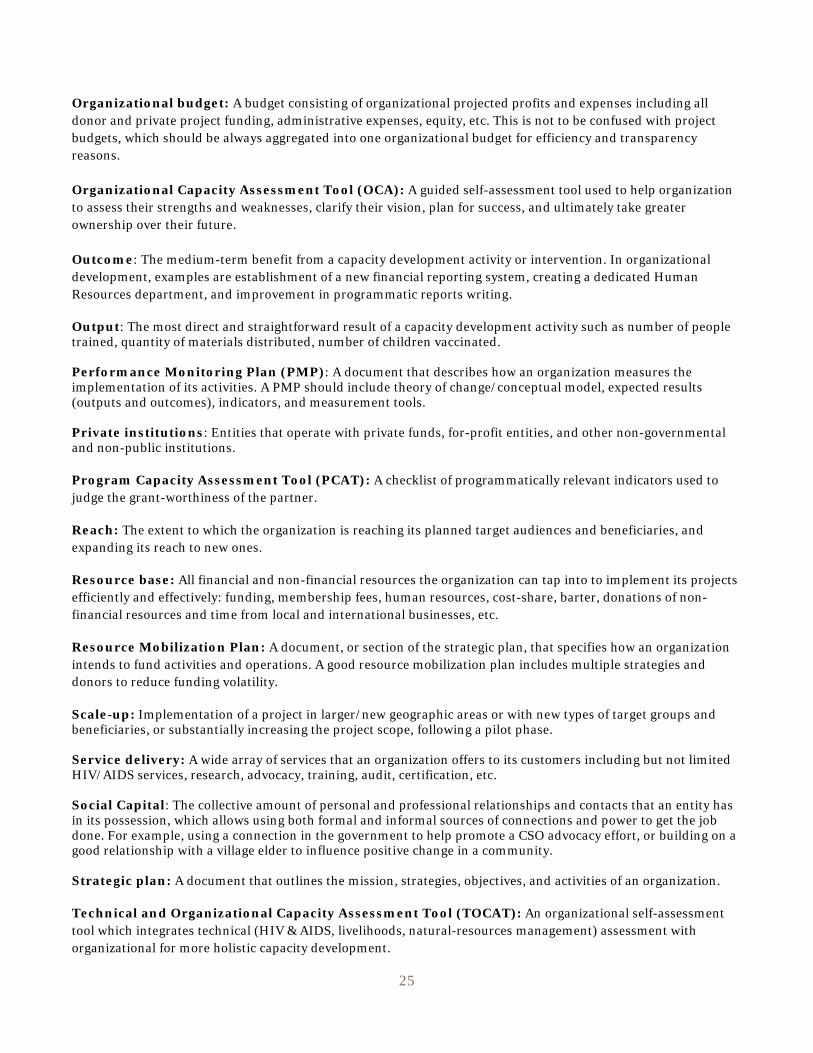
Organizational budget: A budget consisting of organizational projected profits and expenses including all donor and private project funding, administrative expenses, equity, etc. This is not to be confused with project budgets, which should be always aggregated into one organizational budget for efficiency and transparency reasons. Organizational Capacity Assessment Tool (OCA): A guided self-assessment tool used to help organization to assess their strengths and weaknesses, clarify their vision, plan for success, and ultimately take greater ownership over their future. Outcome: The medium-term benefit from a capacity development activity or intervention. In organizational development, examples are establishment of a new financial reporting system, creating a dedicated Human Resources department, and improvement in programmatic reports writing. Output: The most direct and straightforward result of a capacity development activity such as number of people trained, quantity of materials distributed, number of children vaccinated. Performance Monitoring Plan (PMP): A document that describes how an organization measures the implementation of its activities. A PMP should include theory of change/conceptual model, expected results (outputs and outcomes), indicators, and measurement tools. Private institutions: Entities that operate with private funds, for-profit entities, and other non-governmental and non-public institutions. Program Capacity Assessment Tool (PCAT): A checklist of programmatically relevant indicators used to judge the grant-worthiness of the partner. Reach: The extent to which the organization is reaching its planned target audiences and beneficiaries, and expanding its reach to new ones. Resource base: All financial and non-financial resources the organization can tap into to implement its projects efficiently and effectively: funding, membership fees, human resources, cost-share, barter, donations of non-financial resources and time from local and international businesses, etc. Resource Mobilization Plan: A document, or section of the strategic plan, that specifies how an organization intends to fund activities and operations. A good resource mobilization plan includes multiple strategies and donors to reduce funding volatility. Scale-up: Implementation of a project in larger/new geographic areas or with new types of target groups and beneficiaries, or substantially increasing the project scope, following a pilot phase. Service delivery: A wide array of services that an organization offers to its customers including but not limited HIV/AIDS services, research, advocacy, training, audit, certification, etc. Social Capital: The collective amount of personal and professional relationships and contacts that an entity has in its possession, which allows using both formal and informal sources of connections and power to get the job done. For example, using a connection in the government to help promote a CSO advocacy effort, or building on a good relationship with a village elder to influence positive change in a community. Strategic plan: A document that outlines the mission, strategies, objectives, and activities of an organization. Technical and Organizational Capacity Assessment Tool (TOCAT): An organizational self-assessment tool which integrates technical (HIV & AIDS, livelihoods, natural-resources management) assessment with organizational for more holistic capacity development.

26
Appendix 2: Sample proposal language Strengthening MNCH Frontline Organizations, Nigeria (Bill & Melinda Gates Foundation) Organizational assessments and monitoring progress against capacity development plans measure partners’ outputs while Pact’s Organizational Performance Index (OPI) measures the change in partner performance, an outcome-level result. The Index is based on the IDRC/Universalia Capacity Development Outcomes Framework: Effectiveness—Achieving Results & Meeting Standards; Efficiency—Delivering Services & Increasing Reach; Relevance—Engaging Target Populations & Promoting Learning; and Sustainability—Mobilizing Resources & Increasing Social Capital. Impact- level data will be sourced through SFH. Measuring at all three levels —output, outcome and impact—will allow Pact, SFH and the Gates Foundation to better capture and understand linkages between supporting organizational, adaptive and influencing capacity development, grant-making and the reduction of mortality among newborns and mothers. The OPI mechanism will provide the Foundation with data showing which organizations are growing stronger as well as how this is impacting service-delivery performance.
Climate Change Adaptation, Vietnam (USAID) Measuring Performance: Investments in capacity building must lead to tangible improvements in performance. Pact’s Organizational Performance Index (OPI) measures in organizational performance over time and clarifies the link between capacity development inputs and community-level impact. It is a revolutionary yet user-friendly approach that looks beyond the development of organizational systems or skills, and analyzes the actual value added through capacity building efforts. The OPI will enable Pact to track progress across the four domains of effectiveness, efficiency, relevance and sustainability, highlighting capacity building results and supporting discussions around continuous improvement.
SACE, Nigeria (USAID) Using a combination of OCA/PECAN and Pact’s Organizational Performance Index, benchmarks are set to measure progress in capacity over time at the output (internal systems, structures, policies, procedures and skills) and outcome level (performance). OCA/PECANs are undertaken at baseline, mid-and end-line. Together with ongoing monitoring against the CD Plans and the annual OPI exercise, SACE will be able to track the impact of capacity assistance and allow CSOs to amend their plans based on changes in capacity and the context each year. The SACE Capacity Development Team and the Business Advocacy Advisor (Objective 4) will facilitate the drafting of each plan through workshops followed up by intensive coaching and one-on-one mentoring. If partners already have a Capacity Development Plan, the Capacity Development Team will support them to improve and implement the plan.
Activity 5: Implementation of Transition Plans to Direct USAID Funding By mid-Year 2 it is anticipated that partners who are positioned to receive direct USAID funding, as well as the partner best suited to take over direct SACE grants management, will be identified and placed in Tracks 1 and 2. The DCOP and the Capacity Development Team will work closely with partners to design and implement a transition plan that prepares them to manage direct funding from USAID. Organizational capacity development will be closely integrated with grants management under Objective 2, particularly for the future manager of the SACE program.

27
Using the calibrated OCA/PECAN and the OD Roadmap, partners under Track 1 and 2 together with Pact will be able to regularly monitor their progress towards graduation using clear benchmarks. Partners found to be interested and have a higher opportunity for graduation will continue to use the OD Roadmap throughout SACE, whereas lower capacity CSOs will continue through Track 3, focusing more heavily on foundational organizational management skills and systems. A 2012 evaluation of Pact Namibia’s capacity development work with CSOs found partners using the OD Roadmap were 67% more likely to score a level 3 and above on the OPI indicating higher performance (effective, efficient, relevant and sustain) and that partners using the Roadmap were 20 percent more likely to retain systems established through the delivery of Pact capacity development.

28
Appendix 3: Sample budgets
Bronze and Gold Standard Year 1 Year 2 Year 3 TOTAL The responsible staff member (CDO, PO) LOE 2% 2% 2% 6%
Budget Unit Cost Year 1 Year 2 Year 3 Venue Rental (per event) 0 0 0 0 0 Facilitator Transportation (per trip) 100 200 200 200 600 Facilitator M&IE (per day) 40 80 80 80 240 Facilitator Accommodation (per day) 85 170 170 170 510 Lunch and Refreshments per Participant (per day) 15 300 300 300 900
Training Materials and Supplies per Participant (per event) 3 60 60 60 180
TOTAL $810 $810 $810 $2430

29
Appendix 4: The OPI Index Level 1 Level 2 Level 3 Level 4
Effective
Resu
lts The organization is in the process of
developing outcome level targets for its programs & services.
The organization has set clearly defined outcome level targets for its programs & services.
The organization has met over 50% of outcome level targets for its programs & services.
The organization has met over 75% of outcome level targets for its programs & services.
Evidence: • Organization self-identifies as
Level 1.
Evidence: • Completed PMP and or MERL
Plan that includes clearly defined outcomes, targets, indicators and measurement tools.
Evidence: • Completed monitoring spreadsheet
and/or database showing that 50% of outcome level targets have been met.
• Written procedures for ensuring data quality that meet expectations of Pact’s MERL staff.
Evidence: • Completed monitoring spreadsheet
and/or database showing that 75% of outcome level targets have been met.
• Completed Data Quality Audit verifying the quality of the outcome data.
Stan
dard
s3
The organization is building awareness of national and international standards and/or is in the process of developing internal standards that govern their programs & services
The organization is taking clear steps towards achievement of national and international standards that govern their programs & services
The organization has achieved national and international standards that govern their programs & services
The organization consistently meets existing standards and is involved in setting new national and/or international standards that govern their programs & services
3 Examples of Standards include among other national and international guidelines the following: Pact’s Capacity Development Gold Standards, Pact’s Standards for Programs Serving Vulnerable Children, PEPFAR’s Guidance for Orphans and Vulnerable Children Programming, WHO’s Child Growth Standards, WHO’s Guidelines for Drinking Water Quality, CDC’s Guidelines for Infection Control, DAC’s Quality Standards for Development Evaluation, The Sphere Project’s Humanitarian Charter and Minimum Standards in Humanitarian Response, USAID’s Youth in Development/Youth Policy, USAID’s Gender Equality and Female Empowerment Policy, USAID’s Building Resilience to Recurrent Crisis Policy and Program Guidance, and The World Bank’s Safeguard Policies.

30
Evidence: • Organization self-identifies as
Level 1.
Evidence: • Relevant technical standards that
the organization is working toward, which are consistent with national and international standards.
• Evidence of staff training, monitoring and/or procedures that indicate that organization is taking steps to implement standards.
Evidence: • External evidence (evaluation,
certification from a recognized body, etc.) that concludes the organization has met relevant standards.
Evidence: • Multiple instances of external
evidence (evaluation, certification from a recognized body, etc.) over a period of at least two years that conclude the organization has met and continues to meet relevant standards.

Efficient De
liver
y
The organization is developing a written operational or work plan that describes how programs & services will be delivered including: activities, budget, timeline and responsibilities.
The organization has a written operational or work plan that describes how programs & services will be delivered including: activities, budget, timeline and responsibilities.
The organization has successfully completed over 50% of the programs & services in its operational or work plan on time and on budget.
The organization has successfully completed over 75% of the programs & services in its operational or work plan on time and on budget.
Evidence: • Organization self-identifies as
Level 1.
Evidence: • Copy of organization’s written
operational or work plan. • Activities described in work plan
are clear and include a budget, timeline and are assigned to a responsible person or unit.
• Activities in work plan are both relevant and sufficient to deliver programs and services.
Evidence: • Copy of organization’s quarterly
report (or similar) including a review of the work plan that indicates that at least 50% of programs and services are on time and on budget.
• Evidence (minutes or similar) of an internal verification process in support of this data.
Evidence: • Copy of organization’s quarterly
report (or similar) including a review of the work plan that indicates that at least 75% of programs and services are on time and on budget.
• Evidence (minutes or similar) of an internal verification process in support of this data.
Reac
h
The organization is in the process of identifying and delineating a target population for its programs & services.
The organization has clearly identified and delineated a target population for its programs & services and is collecting output data to track service delivery to target populations.
The organization has achieved at least 80% of its output level targets and is reaching its target population with its programs and services.
The organization has achieved at least 80% of its output level targets and has scaled-up the reach of its service delivery to new geographical areas and populations.
Evidence: • Organization self-identifies as
Level 1.
Evidence: • Completed PMP or MERL plan
that clearly identifies target populations, output targets, and methods for data disaggregation across target populations.
Evidence: • Completed monitoring spreadsheet
and/or database showing that output level targets have been met.
• Written procedures for ensuring data quality that meet expectations of Pact’s MERL staff.
Evidence: • Operational or work plans that detail
how the organization is scaling up services to new geographical areas or target populations.
• Completed monitoring spreadsheet and/or database showing that output level targets have been met.
• Written procedures for ensuring data quality that meet expectations of Pact’s MERL staff.

32
Relevant Ta
rget
Po
pula
tion
The organization is considering engaging in participatory planning and decision-making processes that involve their target population.
The organization engages in participatory planning and decision-making processes that involve their target population.
The results of participatory planning and decision-making processes have been used to inform programs & services.
The results of participatory planning and decision-making processes are consistently used to inform programs & services. Members of the target population are engaged in the delivery of programs & services.
Evidence: • Organization self-identifies as
Level 1.
Evidence: • Minutes or reports from
participatory planning meetings. • Attendance list showing involvement
of representatives from all major target populations.
• Budgets include funds for community participatory meetings
Evidence: • An example of a work plan that
incorporates the conclusions from participatory planning meetings.
Evidence: • Examples of at least three work
plans from the last two years that incorporate the conclusions from participatory planning meetings.
• Organizational reports that detail the engagement of members of the target population in delivering programs and services.
Lear
ning
The organization is developing processes for analyzing the successes and challenges arising from their programs & services.
The organization has a process for analyzing the successes and challenges arising from their programs & services.
The organization has institutionalized a process for analyzing the successes and challenges arising from their programs & services, and consistently makes changes as a result of these analyses.
The organization uses its analyses to influence change in the programs & services of others at the national and/or international level through presentations, training and/or publications.
Evidence: • Organization self-identifies as
Level 1.
Evidence: • Written documentation of a
procedure for analyzing the successes and challenges arising from programs and services.
• Minutes from meetings or similar proof that the procedure has been followed on at least one occasion.
Evidence: • Minutes from meetings or similar
proof that the organizational procedure for analyzing successes and challenges has been followed on at least three occasions within the last two years.
• Plans, strategic or operational, that include new ways of performing products or services that were identified in the minutes of analysis meetings.
Evidence: • Evidence of at least three separate
efforts within the last two years to influence others through sharing the results of programmatic analyses.
• Examples could include workshops, publications, presentations, etc.
• Content of materials must map to findings from programs.

33
Sustainable Re
sour
ces
The organization is developing a resource mobilization plan that clearly identifies both the resources needed for programs and services and potential providers/sources for these resources.
The organization has a resource mobilization plan that clearly identifies both the resources needed for programs and services and potential providers/sources for these resources.
The organization has succeeded in leveraging at least 10% of resources needed for the current operating year from a source other than Pact (where applicable).
The organization has succeeded in leveraging resources to support programs & services from at least two donors in addition to Pact (where applicable). No single source of funding represents more than 40% of the organization’s total resource base for the current operating year.
Evidence: • Organization self-identifies as
Level 1.
Evidence: • Resource mobilization plan that
identifies resources needed. • Resource mobilization plan maps to
needs identified in organizational budget and strategic plan.
Evidence: • Proof of receipt of resources from
non-Pact source (resources may be financial, human, inkind)
• Resource received from non-Pact source must represent at least 10% of total organizational budget.
Evidence: • Proof of receipt of resources from at
least two non-Pact sources. • Resource received from each non-
Pact source must represent at least 10% of total organizational budget.
• Budget shows that no single source provides more than 40% of the organization’s resources.
Soci
al C
apita
l
The organization is learning about the value of networking, and considering potential partnerships.
The organization participates in recognized local networks that are relevant to its programs & services. The organization leverages its participation in networks and is able to demonstrate partnership and engagement with at least one other civil society organization.
The organization participates in recognized national networks that are relevant to its programs & services. The organization leverages its participation in networks and is able to demonstrate partnership and engagement with other civil society organizations and relevant government entities.
The organization is identified as a leader in recognized national networks that are relevant to its programs & services. The organization leverages its participation in networks and is able to demonstrate partnership and engagement with other civil society organizations, relevant government entities and private institutions.

34
Evidence: • Organization self-identifies as
Level 1.
Evidence: • Membership list from local network
whose theme is relevant to the mission of the organization.
• Minutes or other documents from the local network that clearly identify the organization as an active participant within the network.
• Guiding documents (MoU, Letter of Commitment, Joint project documents, etc.) that demonstrate the existance of a partnership with at least one other CSO
• Positive reference from CSO partner.
Evidence: • Membership list from national
network whose theme is relevant to the mission of the organization.
• Minutes or other documents from the national network that clearly identify the organization as an active participant within the network.
• Guiding documents (MoU, Letter of Commitment, Joint project documents) that demonstrate the existance of a partnership with at least one CSO and government agency
• Positive references from CSO and government partners
Evidence: • Minutes or other documents from
the national network that clearly identify the organization as playing a leading role within the network.
• Guiding documents (MoU, Letter of Commitment, Joint project documents) that demonstrate the existance of a partnership with at least one CSO, one government agency and one private sector entity.
• Positive references from CSO, government and private sector partners
.

Appendix 5: OPI data collection tool Country: _______________________________ Name of the organization: _______________________________________________________________________ Type of the organization/partner: [CBO ] [NGO ] [FBO ] [INGO/UN ] [Sub-National Government ] [National Government ] [For-Profit ] [Network of Organizations ] [Network of Individuals ] [Community System ] Partner’s Prevailing Impact area: [Health ] [Livelihoods ] [Natural Resources Management ] Other ____________________________ Length of partnership with Pact: [Less than one year ] [1-3 years ] [Over 3 years ] Data collection method: [Bronze ] [Gold ] Types of CD support provided by Pact: [Grant ] [Expert Consultancy Services ] [Training/Workshops ] [Mentoring/Coaching ] [Information/Resource Referral ] [Peer Learning/Facilitation ] [None ] Project Name and Code through which support is provided: ____________________________________________________________________
1. EFFECTIVENESS
1a. Results Choose the level
Briefly describe the evidence that supports the level choice
Level 1: The organization is in the process of developing outcome level targets for its programs & services. Level 2: The organization has set clearly defined outcome level targets for its programs & services. Level 3: The organization has met over 50% of outcome level targets for its programs & services. Level 4: The organization has met over 75% of outcome level targets for its programs & services.

36
1b. Standards4 Choose the level
Briefly describe the evidence that supports the level choice
Level 1: The organization is building awareness of national and international standards and/or is in the process of developing internal standards that govern their programs & services Level 2: The organization is taking clear steps towards achievement of national and international standards that govern their programs & services Level 3: The organization has achieved national and international standards that govern their programs & services Level 4: The organization consistently meets existing standards and is involved in setting new national and/or international standards that govern their programs & services
2. EFFICIENCY
2a. Delivery Choose the level
Briefly describe the evidence that supports the level choice
Level 1: The organization is developing a written operational or work plan that describes how programs & services will be delivered including: activities, budget, timeline and responsibilities. Level 2: The organization has a written operational or work plan that describes how programs & services will be delivered including: activities, budget, timeline and responsibilities. Level 3: The organization has successfully completed over 50% of the programs & services in its operational or work plan on time and on budget. Level 4: The organization has successfully completed over 90% of the programs & services in its operational or work plan on time and on budget.
2b. Reach Choose the level
Briefly describe the evidence that supports the level choice
Level 1: The organization is in the process of identifying and delineating a target population for its programs & services.
4 Examples of Standards include among other national and international guidelines the following: Pact’s Capacity Development Gold Standards, Pact’s Standards for Programs Serving Vulnerable Children, PEPFAR’s Guidance for Orphans and Vulnerable Children Programming, WHO’s Child Growth Standards, WHO’s Guidelines for Drinking Water Quality, CDC’s Guidelines for Infection Control, DAC’s Quality Standards for Development Evaluation, The Sphere Project’s Humanitarian Charter and Minimum Standards in Humanitarian Response, USAID’s Youth in Development/Youth Policy, USAID’s Gender Equality and Female Empowerment Policy, USAID’s Building Resilience to Recurrent Crisis Policy and Program Guidance, and The World Bank’s Safeguard Policies.

37
Level 2: The organization has clearly identified and delineated a target population for its programs & services and is collecting output data to track service delivery to target populations. Level 3: The organization has achieved at least 80% of its output level targets and is reaching its target population with its programs and services. Level 4: The organization has achieved at least 80% of its output level targets and has scaled-up the reach of its service delivery to new geographical areas and populations.
3. RELEVANCE
3a. Target Population Choose the level
Briefly describe the evidence that supports the level choice
Level 1: The organization is considering engaging in participatory planning and decision-making processes that involve their target population. Level 2: The organization engages in participatory planning and decision-making processes that involve their target population. Level 3: The results of participatory planning and decision-making processes have been used to inform programs & services. Level 4: The results of participatory planning and decision-making processes are consistently used to inform programs & services. Members of the target population are engaged in the delivery of programs & services.
3b. Learning Choose the level
Describe the evidence that supports the level choice
Level 1: The organization is developing processes for analyzing the successes and challenges arising from their programs & services. Level 2: The organization has a process for analyzing the successes and challenges arising from their programs & services. Level 3: The organization has institutionalized a process for analyzing the successes and challenges arising from their programs & services, and consistently makes changes as a result of these analyses. Level 4: The organization uses its analyses to influence change in the programs & services of others at the national and/or international level through presentations, training and/or publications.

38
4. SUSTAINABILITY
4a. Resources Choose the level
Describe the evidence that supports the level choice
Level 1: The organization is developing a resource mobilization plan that clearly identifies both the resources needed for programs and services and potential providers/sources for these resources. Level 2: The organization has a resource mobilization plan that clearly identifies both the resources needed for programs and services and potential providers/sources for these resources. Level 3: The organization has succeeded in leveraging at least 10% of resources needed from a source other than Pact (where applicable). Level 4: The organization has succeeded in leveraging resources to support programs & services from at least two donors in addition to Pact (where applicable). No single source of funding represents more than 40% of the organization’s total resource base for the current operating year.
4b. Social Capital Choose the level
Describe the evidence that supports the level choice
Level 1: The organization is learning about the value of networking, and considering potential partnerships. Level 2: The organization participates in recognized local networks that are relevant to its programs & services. The organization leverages its participation in networks and is able to demonstrate partnership and engagement with at least one other CSO. Level 3: The organization participates in recognized national networks that are relevant to its programs & services. The organization leverages its participation in networks and is able to demonstrate partnership and engagement with other CSOs and relevant government entities. Level 4: The organization is identified as a leader in recognized national networks that are relevant to its programs & services. The organization leverages its participation in networks and is able to demonstrate partnership and engagement with other CSOs, relevant government entities and private institutions.

Appendix 6: Sample data analysis Pact Thailand The Thailand country program successfully applied the OPI with eight partners. Each partner worked with Pact to reconstruct their baseline and then measure their performance at the end of FY2011 (Figure 15). The data shows great variation across the eight organizations both in terms of baseline performance and change in performance during FY2011. At one extreme, we see that Organization B changed by 1.50 over the course of the year. Organizations A, D and E also had significant change, registering 1.00, 1.13 and 1.25 respectively. Interestingly, Organization C recorded no change.
Figure 16 details change across the four domains of performance. The greatest change took place under the Sustainability domain, where partner scores associated with Resources and Social Capital averaged a Level 3. A Level 3 under Resources indicates that “the organization has succeeded in leveraging at least 10% of resources needed from a source other than Pact (where applicable)” and under Social Capital a Level 3 states that “the organization participates in recognized national networks that are relevant to its programs & services. The organization leverages its participation in networks and is able to demonstrate partnership and engagement with other civil society organizations and relevant government entities”.
The overall highest performance was found under the Efficiency domain with partner scores for Delivery
Baseline
20111.00
2.00
3.00
4.00
1.56
2.44
1.94 1.75
2.31
3.13 2.81 3.00
Figure 16: Change by Performance Domain - Thailand
2.00
1.00
3.13
1.75 1.50
2.50 2.25
1.25
3.00
2.50
3.13 2.88 2.75
3.38
3.00
1.88
Org A Org B Org C Org D Org E Org F Org G Org H
Figure 15: Performance by Organization Compared with Baseline - Thailand
Performance Baseline Performance Current

40
averaging 3.50 and Reach 2.75. It is worth noting that Efficiency scores started from a higher baseline than did scores in the other domains. The lowest scoring domain was Effectiveness, with Results averaging 2.13 and Standards 2.50.
Under the area Learning, partners averaged a 3.00 score. Level 3 indicates that “the organization has institutionalized a process for analyzing the successes and challenges arising from their programs & services, and consistently makes changes as a result of these analyses”. This strong score may be due to the efforts of the Pact Thailand team to support monitoring and evaluation capacity development in partners.
1.00
2.00
3.00
4.00Results
Standards
Delivery
Reach
TargetPopulation
Learning
Resources
SocialCapital
Figure 17: Average Performance Compared with Baseline - Thailand
Average Baseline
Average Current

41
Appendix 7: Contacts within Pact Matt Reeves, Capacity Development Director Nairobi, Kenya [email protected] skype: matthew_reeves Olga Yakimakho, Senior Program Manager for Capacity Development Washington D.C., USA [email protected] skype: impact.2008 Rachel DuBois, Senior Technical Officer for Capacity Development Washington D.C., USA [email protected] skype: rachdubois

42
Appendix 8: Links to other materials
Some helpful Pact documents are included on our Intranet:
Manuals and Handbooks Introduction to Organizational Development: http://tinyurl.com/Intro-OD-Module
OCA Handbook
Documents
Pact Capacity Development White Paper
Additional Pact documents can be accessed here
Other useful resources on organizational capacity assessments:
http://reflectlearn.org/ ECDPM study on Capacity, Change & Performance AIDSTAR 2 website section on assessment

43
Appendix 9: Two-page marketing materials
The OPI 2-pager can be downloaded from Pact’s Intranet Storefront page here.

This work is licensed under the Creative Commons Attribution-ShareAlike 3.0 Unported License. To view a copy of this license, visit http://creativecommons.org/licenses/by-sa/3.0/
or send a letter to Creative Commons, 444 Castro Street, Suite 900, Mountain View, California, 94041, USA.