Older Adults and Technology Use - pewinternet.org€¦ · broadband access at home, and 23% do not...
27
APRIL 3, 2014 FOR FURTHER INFORMATION ON THIS REPORT: Aaron Smith, Senior Researcher 202.419.4500 www.pewresearch.org RECOMMENDED CITATION: Pew Research Center, April 2014, “Older Adults and Technology Use” Available at: http://www.pewinternet.org/2014/04/03/older-adults-and-technology-use/ NUMBERS, FACTS AND TRENDS SHAPING THE WORLD
Transcript of Older Adults and Technology Use - pewinternet.org€¦ · broadband access at home, and 23% do not...

APRIL 3, 2014
FOR FURTHER INFORMATION
ON THIS REPORT:
Aaron Smith, Senior Researcher
202.419.4500
www.pewresearch.org
RECOMMENDED CITATION: Pew Research Center, April 2014, “Older Adults and Technology Use”
Available at: http://www.pewinternet.org/2014/04/03/older-adults-and-technology-use/
http://pewinternet.org/Reports/2014/African-American-Tech-Use.aspx
NUMBERS, FACTS AND TRENDS SHAPING THE WORLD

1
Older Adults and Technology
www.pewresearch.org
91
86
70
77
59
47
Cell phone
Internet
Broadband
All adults 65+
Main Findings
America’s seniors have historically been late adopters to the world of technology compared to their
younger compatriots, but their movement into digital life continues to deepen, according to newly
released data from the Pew Research Center. In this report, we take advantage of a particularly
large survey to conduct a unique exploration not only of technology use between Americans ages
65 or older and the rest of the population, but within the senior population as well.
Two different groups of older Americans emerge. The first group (which leans toward younger,
more highly educated, or more affluent seniors) has relatively substantial technology assets, and
also has a positive view toward the benefits of online platforms. The other (which tends to be older
and less affluent, often with significant challenges with health or disability) is largely disconnected
from the world of digital tools and services, both physically and psychologically.
As the internet plays an increasingly central role in connecting Americans of all ages to news and
information, government services, health resources, and opportunities for social support, these
divisions are noteworthy—particularly for the many organizations and individual caregivers who
serve the older adult population. Among the key findings of this research:
Six in ten seniors now go online, and just
under half are broadband adopters
In April 2012 the Pew Research Center found
for the first time that more than half of older
adults (defined as those ages 65 or older) were
internet users. Today, 59% of seniors report
they go online—a six-percentage point increase
in the course of a year—and 47% say they have a
high-speed broadband connection at home. In
addition, 77% of older adults have a cell phone,
up from 69% in April 2012.
But despite these gains, seniors continue to lag
behind younger Americans when it comes to
tech adoption. And many seniors remain largely
unattached from online and mobile life—41%
do not use the internet at all, 53% do not have
broadband access at home, and 23% do not use
cell phones.
Seniors continue to lag in tech adoption
Seniors vs. all American adults 18+
Pew Research Center’s Internet Project July 18-September 30,
2013 tracking survey.
PEW RESEARCH CENTER

2
PEW RESEARCH CENTER
www.pewresearch.org
74 68
47
37
65
55
34
21
0
20
40
60
80
100
65-69 70-74 75-79 80+
Go online Broadband at home
%
Younger, higher-income, and more highly educated seniors use the internet and broadband
at rates approaching—or even exceeding—the general population; internet use and
broadband adoption each drop off dramatically around age 75
Seniors, like any other demographic group, are not monolithic, and there are important
distinctions in their tech adoption patterns, beginning with age itself. Internet use and broadband
adoption among seniors each fall off notably starting at approximately age 75. Some 68% of
Americans in their early 70s go online, and
55% have broadband at home. By contrast,
internet adoption falls to 47% and broadband
adoption falls to 34% among 75-79 year olds.
In addition, affluent and well-educated seniors
adopt the internet and broadband at
substantially higher rates than those with
lower levels of income and educational
attainment:
Among seniors with an annual household
income of $75,000 or more, 90% go online
and 82% have broadband at home. For
seniors earning less than $30,000
annually, 39% go online and 25% have
broadband at home.
Fully 87% of seniors with a college degree
go online, and 76% are broadband
adopters. Among seniors who have not
attended college, 40% go online and just
27% have broadband at home.
Older adults face a number of hurdles to adopting new technologies
Older adults face several unique barriers and challenges when it comes to adopting new
technologies. These include:
Physical challenges to using technology: Many seniors have physical conditions or health
issues that make it difficult to use new technologies. Around two in five seniors indicate that they
have a “physical or health condition that makes reading difficult or challenging” or a “disability,
handicap, or chronic disease that prevents them from fully participating in many common daily
Among seniors, internet and broadband
use drop off around age 75
% within each age group who …
Pew Research Center’s Internet Project July 18-September 30,
2013 tracking survey.
PEW RESEARCH CENTER

3
Older Adults and Technology
www.pewresearch.org
88 84 79
71
6 8
8
11
18-29 30-49 50-64 65+
3-5 times
per week
Every day
or almost
every day
Net 94 92 87 82
activities”. This group is significantly less likely than seniors who do not face these physical
challenges to go online (49% vs. 66%), to have broadband at home (38% vs. 53%), and to own
most major digital devices.
Skeptical attitudes about the benefits of technology: Older adults who do not currently use
the internet are divided on the question of whether that lack of access hurts them or not. Half of
these non-users (49%) agree with the statement that “people lacking internet access are at a real
disadvantage because of all the information they might be missing,” with 25% agreeing strongly.
But 35% of these older non-internet users disagree that they are missing out on important
information—and 18% of them strongly disagree.
Difficulties learning to use new technologies: A significant majority of older adults say they
need assistance when it comes to using new digital devices. Just 18% would feel comfortable
learning to use a new technology device such as a smartphone or tablet on their own, while 77%
indicate they would need someone to help walk them through the process. And among seniors who
go online but do not currently use social networking sites such as Facebook or Twitter, 56% would
need assistance if they wanted to use these sites to connect with friends or family members.
Once seniors join the online world, digital
technology often becomes an integral part
of their daily lives
Despite some of these unique challenges facing
the older adult population when it comes to
technology, most seniors who become internet
users make visiting the digital world a regular
occurrence. Among older adults who use the
internet, 71% go online every day or almost
every day, and an additional 11% go online
three to five times per week.
These older internet users also have strongly
positive attitudes about the benefits of online
information in their personal lives. Fully 79% of
older adults who use the internet agree with the
statement that “people without internet access
are at a real disadvantage because of all the
information they might be missing,” while 94%
A majority of older internet users go
online on a daily basis
% of internet users in each age group who go online …
Pew Research Center’s Internet Project July 18-September 30,
2013 tracking survey.
PEW RESEARCH CENTER

4
PEW RESEARCH CENTER
www.pewresearch.org
55
18
43
27
All adults 65+
Smartphone Tablet or e-reader
agree with the statement that “the internet makes it much easier to find information today than in
the past.”
Seniors differ from the general population in their device ownership habits
Device ownership among older adults differs notably from the
population as a whole in several specific ways:
Few older adults are smartphone owners: More than half
of all Americans now have a smartphone, but among older
adults, adoption levels sit at just 18%. Additionally, smartphone
ownership among older adults has risen only modestly in recent
years, from 11% in April 2011. A significant majority of older
adults (77%) do have a cell phone of some kind, but by and large
these tend to be more basic devices.
Among older adults, tablets and e-book readers are as
popular as smartphones: Among the general public,
smartphones are much more common than either tablet
computers or e-book readers, such as Kindles or Nooks. But
tablets, e-book readers, and smartphones are each owned by an
identical 18% of older adults. In fact, the proportion of older
adults who own either a tablet or an e-book reader is actually
larger than the proportion owning a smartphone. Some 27% of
seniors own a tablet, an e-book reader, or both, while 18% own a
smartphone.
Seniors are more likely to
own a tablet or e-book
reader than smartphone
% who own a …
Pew Research Center’s Internet Project July
18-September 30, 2013 tracking survey.
PEW RESEARCH CENTER

5
Older Adults and Technology
www.pewresearch.org
41%
32%
27%
Use SNS
Do not go
online
Go online,
no SNS
27% of older adults use social networking sites such as
Facebook, but these users socialize more frequently with
others compared with non-SNS users
Today 46% of online seniors (representing 27% of the total older
adult population) use social networking sites such as Facebook,
and these social network adopters have more persistent social
connections with the people they care about.
Some 81% of older adults who use social networking sites say
that they socialize with others (either in person, online, or over
the telephone) on a daily or near-daily basis. Among older adults
who go online but do not use social networking sites, that figure
is 71%; and for those who are not online at all, it is 63%.
About this survey
The findings in this report are based on data from telephone
interviews conducted by Princeton Survey Research Associates
International from July 18 to September 30, 2013, among a
sample of 6,010 adults ages 18 and older. Telephone interviews
were conducted in English and Spanish by landline and cell phone. The margin of error for those
ages 65 or older (n=1,526) is plus or minus 2.9 percentage points. Base sizes and margins of error
for the subgroups of the senior population discussed throughout this report can be found in the
Methods section.
About Pew Research Center
Pew Research Center is a nonpartisan fact tank that informs the public about the issues, attitudes
and trends shaping America and the world. It does not take policy positions. It conducts public
opinion polling, demographic research, media content analysis and other empirical social science
research. The center studies U.S. politics and policy views; media and journalism; internet and
technology; religion and public life; Hispanic trends; global attitudes and U.S. social and demo-
graphic trends. All of the center’s reports are available at www.pewresearch.org. Pew Research
Center is a subsidiary of The Pew Charitable Trusts.
© Pew Research Center 2014
One-quarter of seniors
use online social
networks
% of seniors who …
Pew Research Center’s Internet Project July
18-September 30, 2013 tracking survey.
PEW RESEARCH CENTER
6
PEW RESEARCH CENTER
www.pewresearch.org
50
86
14
59
0
20
40
60
80
100
2000 2002 2004 2006 2008 2010 2012
All Adults 18+
65+
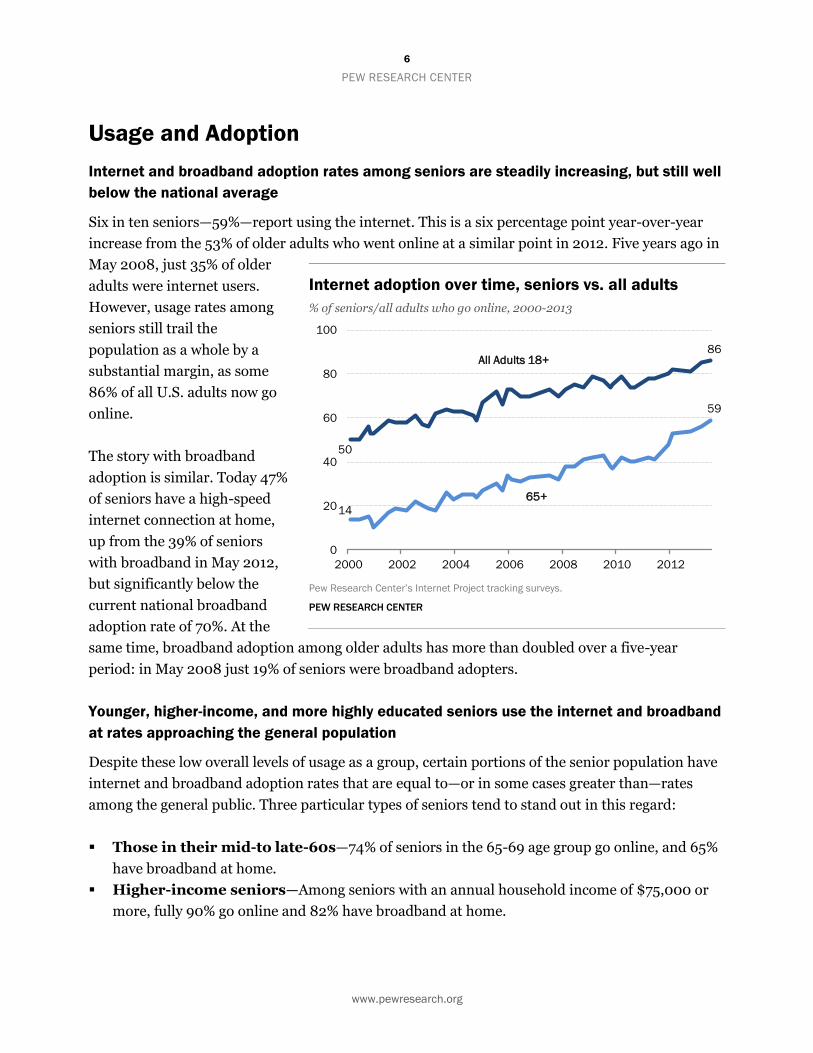
Usage and Adoption
Internet and broadband adoption rates among seniors are steadily increasing, but still well
below the national average
Six in ten seniors—59%—report using the internet. This is a six percentage point year-over-year
increase from the 53% of older adults who went online at a similar point in 2012. Five years ago in
May 2008, just 35% of older
adults were internet users.
However, usage rates among
seniors still trail the
population as a whole by a
substantial margin, as some
86% of all U.S. adults now go
online.
The story with broadband
adoption is similar. Today 47%
of seniors have a high-speed
internet connection at home,
up from the 39% of seniors
with broadband in May 2012,
but significantly below the
current national broadband
adoption rate of 70%. At the
same time, broadband adoption among older adults has more than doubled over a five-year
period: in May 2008 just 19% of seniors were broadband adopters.
Younger, higher-income, and more highly educated seniors use the internet and broadband
at rates approaching the general population
Despite these low overall levels of usage as a group, certain portions of the senior population have
internet and broadband adoption rates that are equal to—or in some cases greater than—rates
among the general public. Three particular types of seniors tend to stand out in this regard:
Those in their mid-to late-60s—74% of seniors in the 65-69 age group go online, and 65%
have broadband at home.
Higher-income seniors—Among seniors with an annual household income of $75,000 or
more, fully 90% go online and 82% have broadband at home.
Internet adoption over time, seniors vs. all adults
% of seniors/all adults who go online, 2000-2013
Pew Research Center’s Internet Project tracking surveys.
PEW RESEARCH CENTER

7
Older Adults and Technology
www.pewresearch.org
College graduates—87% of seniors with a college degree go online, and 76% are broadband
adopters.
On the other hand, other
subgroups of older adults—in
particular, those 80 years of age
or older, those with low
household incomes, and those
who have not attended college—
tend to be much more removed
from online life. For example,
slightly more than one third of
those 80 years of age or older
(37%) use the internet, and just
one in five members of this age
group—21%—have a broadband
connection at home. Overall
adoption levels are similar
among seniors who have not
attended college, as well as
among those with an annual
household income of less than
$30,000 per year.
Mobile adoption: A substantial majority of seniors now own cell phones, but smartphones
remain rare within the 65-and-older population
Fully 77% of seniors are now cell phone owners. This trails the national average—91% of all
Americans own a cell phone—but represents a significant year-to-year increase over the 69% of
seniors who owned a cell phone in April 2012. More notably, cell phones are now owned by a
majority of seniors in every major demographic subcategory. Even among the oldest seniors (those
80 years of age or older, just 37% of whom use the internet), cell phone adoption sits at 61%.
But even as cell phones are becoming more common among seniors, smartphones have yet to
catch on with all but small pockets of the older adult population. Just 18% of seniors are
smartphone adopters (this is well below the national adoption rate of 55%) and their rate of
smartphone adoption has been growing at a relatively modest pace. Since the Pew Research Center
first began tracking data on smartphone ownership in May 2011, smartphone adoption nationally
Internet and broadband adoption among seniors
% of seniors (ages 65 and older) who …
Go online Broadband at home
Total for all 65+ 59% 47%
Age
65-69 74 65
70-74 68 55
75-79 47 34
80+ 37 21
Education
High school grad or less 40 27
Some college 69 57
College graduate 87 76
Household Income
<$30,000 39 25
$30,000-$49,999 63 51
$50,000-$74,999 86 73
$75,000+ 90 82
Pew Research Center’s Internet Project July 18-September 30, 2013 tracking survey.
PEW RESEARCH CENTER

8
PEW RESEARCH CENTER
www.pewresearch.org
has increased by 20 percentage points—from 35% to 55% of American adults—but adoption levels
among seniors have increased by just seven percentage points, from 11% to 18%.
Smartphone ownership is fairly
low along the entire age
spectrum of the older adult
population, but decreases
substantially for seniors in their
mid-70s (10% of 75-79 year
olds own a smartphone), and
becomes nearly non-existent
among seniors in their 80s and
beyond (just 5% of those 80
and older are smartphone
owners).
Even the most affluent seniors
(that is, those who live in a
household with an annual
income of $75,000 or more)
have high levels of smartphone
ownership by the standards of
the older adult population but
trail members of the general population at a similar income level. Some 42% of older adults at this
income level are smartphone owners. This is more than double the rate among seniors as a whole,
but roughly half the smartphone ownership rate among high-income adults within the general
population, 76% of whom are smartphone adopters.
As is the case in the population as a whole, tablets and e-book readers are primarily “elite”
devices among older adults
Some 18% of seniors own an e-book reader, and an identical 18% own a tablet computer. Taken
together, 27% of older adults own a tablet, an e-book reader, or both.
E-book reader ownership levels among seniors are slightly lower than the national average (24% of
all U.S. adults are e-book reader owners), while tablet ownership levels among seniors are around
half the national average (34% of all U.S. adults are tablet owners).
Cell phone and smartphone adoption among seniors
% of seniors (ages 65 and older) who own a …
Cell phone Smartphone
Total for all 65+ 77% 18%
Age
65-69 84 29
70-74 84 21
75-79 72 10
80+ 61 5
Education
High school grad or less 70 10
Some college 80 19
College graduate 87 35
Household Income
<$30,000 67 8
$30,000-$49,999 83 15
$50,000-$74,999 88 28
$75,000+ 92 42
Pew Research Center’s Internet Project July 18-September 30, 2013 tracking survey.
PEW RESEARCH CENTER

9
Older Adults and Technology
www.pewresearch.org
Nationally, tablets and e-book
readers are most popular
among college graduates and
higher-income Americans, and
this is also true among seniors.
Seniors who have graduated
from college are around three
times as likely to own both an e-
book reader and a tablet as are
seniors who have not attended
college, and those with an
annual household income of
$75,000 or more per year are
around four times as likely to
own each device as are those
with a household income of less
than $30,000 per year.
46% of online seniors use social networking sites, but just 6% use Twitter
Usage of social networking sites by older Americans has been steadily increasing in recent years,
but has not yet reached majority status—among older adults who use the internet, 46% use social
networking sites such as Facebook, well below the national average of 73% of adult internet users.
On a “total population” basis (that is, accounting for individuals who do not use the internet at all),
63% of all American adults, and 27% of all Americans ages 65 and older, are social networking site
users.
Tablet and e-book reader adoption among seniors
% of seniors (ages 65 and older) who own a …
e-book reader Tablet computer
Total for all 65+ 18% 18%
Age
65-69 23 23
70-74 19 18
75-79 18 20
80+ 10 9
Education
High school grad or less 12 11
Some college 19 19
College graduate 30 31
Household Income
<$30,000 8 8
$30,000-$49,999 17 16
$50,000-$74,999 33 28
$75,000+ 33 39
Pew Research Center’s Internet Project July 18-September 30, 2013 tracking survey.
PEW RESEARCH CENTER

10
PEW RESEARCH CENTER
www.pewresearch.org
90
78
65
46
0
20
40
60
80
100
2006 2007 2008 2009 2010 2011 2012 2013
%
18-29
%
50-64
65+
30-49
As is the case for the online
population as a whole, older
women are more likely than
older men to use social
networking sites. Half (52%)
of female internet users ages
65+ are social networking site
adopters, compared with 39%
of older men. Social
networking site usage is also
more common among the
younger cohort of seniors, and
adoption drops off
dramatically after age 80.
Some 54% of internet users
ages 65-69 use social
networking sites, compared
with just 27% of internet users
ages 80 and older.
Few older adults use Twitter—
just 6% of online seniors
report doing so, compared
with 19% of all adult internet
users. In total, that means that
just 3% of all American
seniors are Twitter users.
Social networking site use over time, by age group
% of internet users in each age group who use social networking sites
Pew Research Center’s Internet Project surveys.
PEW RESEARCH CENTER

11
Older Adults and Technology
www.pewresearch.org
16
18
23
29
All adults 65+
Physical or health
condition makes
reading difficult or
challenging
Disability, handicap, or
chronic disease that prevents
full participation in work,
school, or other activities
Attitudes, Impacts, and Barriers to Adoption
Many seniors face physical challenges to using new digital devices
Not only do seniors use many
common technologies at
relatively low rates, they also
face unique barriers and
challenges to increasing those
adoption levels.1 For example,
many seniors have physical
conditions or health issues
that make using these tools a
challenge: 23% of older adults
indicate that they have a
“physical or health condition
that makes reading difficult or
challenging,” while 29% have a
“disability, handicap, or
chronic disease that prevents
them from fully participating
in many common daily
activities.”2
In total, some 39% of older adults fall into one of these two categories, and they are significantly
less likely than seniors who do not face these physical challenges to go online (49% vs. 66%), to
have broadband at home (38% vs. 53%), to own a cell phone (69% vs. 82%), and to have a
smartphone (13% vs. 22%).
Interestingly, differences in technology adoption between these “physically challenged” seniors
and the rest of the older adult population are somewhat more modest when it comes to tablets and
e-book readers. Some 22% of seniors with a life-impacting disability or chronic disease, or a
physical condition that makes reading difficult, own either a tablet computer or an e-book reader,
1 In previous Pew Research surveys on this subject, we have found that many seniors take a skeptical view towards the potential
benefits of new technologies and their relevance to their lives. For example, a recent Pew Research study of smartphone adoption
found that older adults were especially likely to cite a lack of need or relevance—as opposed to price—as the main reason why they
have not upgraded from a basic cell phone to a smartphone. 2 We have previously reported that 75% of seniors live with a chronic health condition and have documented the role of technology in
their lives (see http://www.pewinternet.org/2013/11/26/part-one-who-lives-with-chronic-conditions/). That study was based on a
more expansive series of questions about specific health conditions (diabetes, high blood pressure, cancer, etc.), while this study
defines “physically challenged” seniors using the simpler, two-part set of questions noted above.
Older adults more likely to have physical or health
conditions that make tech use challenging
% of adults in each age group who have …
Pew Research Center’s Internet Project July 18-September 30, 2013 tracking survey.
PEW RESEARCH CENTER

12
PEW RESEARCH CENTER
www.pewresearch.org
just eight percentage points lower than the 30% ownership rate among seniors who do not have
any of these conditions.
Most older adults say they would need assistance learning how to use new devices and
digital services
In addition to the issues of health or disability discussed above, a substantial majority of seniors
express trepidation about using new digital tools or devices without assistance. When asked how
they would learn how to use a new technology device such as a tablet computer or smartphone if
they wished to do so, only a small proportion of seniors—18%—express comfort with learning how
to do so without assistance, while 77% indicate that they would need someone else to help them.
Not surprisingly, this concern about “going it alone” with new technologies is especially acute
among seniors with limited exposure to these devices. Among seniors who do not currently own a
smartphone, a tablet computer, or an e-book reader, just 13% would feel comfortable attempting
to use a new technology device without assistance. At the same time, even those with some level of
exposure to technology express a fair amount of trepidation about branching out to new devices
without assistance. Among older adults who do own one or more of the devices listed above, 29%
would feel comfortable using new devices on their own—but 70% think they would need to ask for
assistance.
This general discomfort with new technologies also extends to online communications platforms
such as Facebook. Among seniors who do use the internet but do not currently use social
networking sites such as Facebook or Twitter, 56% say they would require assistance if they
wished to use these sites to connect with friends or family members. Just 24% of these seniors feel
comfortable jumping into the social media environment without someone there to guide them (the
other 20% of these non-SNS-users were unsure how they would react or were unable to answer the
question). Older adults who currently use a social networking site of some kind have more
confidence in their abilities: some 68% of these seniors would feel comfortable using social media
on their own to connect with family or friends.
Once online, most seniors make the internet a daily part of their lives and view it in a
positive light. Non-users are divided on the relative merits of going online.
Although seniors are less likely than the rest of the population to go online in the first place, once
there they tend to make the internet a part of their daily routine. Among seniors who use the
internet, 71% go online every day or almost every day and 11% go online three to five times per
week. The subset of seniors who have a smartphone or a home broadband connection go online

13
Older Adults and Technology
www.pewresearch.org
47
25
31
24
Internet users Non-Users
Somewhat
agree
Strongly
agree
Net 79 48
with even greater frequency: 78% of older broadband users go online every day or almost every
day, as do 84% of older smartphone owners.
In addition to using digital tools with some
frequency, seniors who have integrated the
internet and other digital technologies into
their lives tend to view them as essential
resources that positively impact their daily life.
Fully 79% of older adults who use the internet
agree (47% strongly) with the statement that
“people without internet access are at a real
disadvantage because of all the information
they might be missing.” And 94% agree (77%
strongly) with the statement that “the internet
makes it much easier to find information today
than in the past.”
Seniors who do not currently go online, on the
other hand, are much more divided when it
comes to the benefits of technology. Half of
these non-users (48%) agree that people lacking
internet access are at a disadvantage and
missing out on important information, with
25% agreeing strongly. But 35% of older non-internet users disagree with the assessment that they
are missing out on important information—with 18% of them disagreeing strongly.
Older social networking site users socialize more frequently with friends and family
members than do non-users.
For a variety of reasons (such as physical distance from family members and/or lack of mobility)
some older adults often have difficulty connecting with friends and family members in person. For
these seniors, social networking sites can offer an additional venue for connection and socializing
with others—and indeed, older adults who use social networking sites such as Facebook are more
likely to regularly socialize with friends, whether online, in person, or over the telephone,
compared with seniors who are not social networking site users. Some 81% of older adults who use
social networking sites say they socialize with others on a daily or near-daily basis. Among older
adults who go online but do not use social networking sites, that figure is 71%; and for those who
are not online at all, it is 63%. And this correlation between social networking site use and
Many older non-internet users don’t
think they are missing out on much
% of those 65 and older who agree with the statement:
“People without internet access are at a real
disadvantage because of all the information they might
be missing”
Pew Research Center’s Internet Project July 18-September 30,
2013 tracking survey
PEW RESEARCH CENTER

14
PEW RESEARCH CENTER
www.pewresearch.org
increased socialization with others persists even when we control for common demographic
factors such as age, income, or geographic area of residence.3
3 In previous studies of the general population, we have found that Facebook users are more trusting, get more support from their
friends, and have a larger number of close relationships compared with non-Facebook users. See
http://www.pewinternet.org/2011/06/16/social-networking-sites-and-our-lives/ for more details.

15
Older Adults and Technology
www.pewresearch.org
Appendix—Detailed Demographic Tables
Internet usage for older adults
% of those 65 and older who use the internet or email
Total for all 65+ (n=1,526) 59%
Gender
a Male (n=612) 65b
b Female (n=914) 55
Age
a 65-69 (n=531) 74cd
b 70-74 (n=401) 68cd
c 75-79 (n=244) 47d
d 80+ (n=350) 37
Education
a High school grad or less (n=598) 40
b Some college (n=381) 69a
c College graduate (n=537) 87ab
Household Income
a <$30,000 (n=467) 39
b $30,000-$49,999 (n=282) 63a
c $50,000-$74,999 (n=192) 86ab
d $75,000+ (n=274) 90ab
Community Type
a Urban (n=413) 60c
b Suburban (n=758) 63c
c Rural (n=355) 50
Pew Research Center’s Internet Project July 18-September 30, 2013 tracking survey.
Note: Columns marked with a superscript letter (a) or another letter indicate a statistically
significant difference between that row and the row designated by that superscript letter.
Statistical significance is determined inside the specific section covering each demographic
trait.
PEW RESEARCH CENTER

16
PEW RESEARCH CENTER
www.pewresearch.org
Broadband adoption for older adults
% of those 65 and older with broadband at home
Total for all 65+ (n=1,526) 47%
Gender
a Male (n=612) 53b
b Female (n=914) 43
Age
a 65-69 (n=531) 65bcd
b 70-74 (n=401) 55cd
c 75-79 (n=244) 34d
d 80+ (n=350) 21
Education
a High school grad or less (n=598) 27
b Some college (n=381) 57a
c College graduate (n=537) 76ab
Household Income
a <$30,000 (n=467) 25
b $30,000-$49,999 (n=282) 51a
c $50,000-$74,999 (n=192) 73ab
d $75,000+ (n=274) 82abc
Community Type
a Urban (n=413) 48
b Suburban (n=758) 50c
c Rural (n=355) 40
Pew Research Center’s Internet Project July 18-September 30, 2013 tracking survey.
Note: Columns marked with a superscript letter (a) or another letter indicate a statistically
significant difference between that row and the row designated by that superscript letter.
Statistical significance is determined inside the specific section covering each demographic
trait.
PEW RESEARCH CENTER

17
Older Adults and Technology
www.pewresearch.org
Cell phone ownership for older adults
% of those 65 and older who have a cell phone of some kind
Total for all 65+ (n=1,526) 77%
Gender
a Male (n=612) 82b
b Female (n=914) 73
Age
a 65-69 (n=531) 84cd
b 70-74 (n=401) 84cd
c 75-79 (n=244) 72d
d 80+ (n=350) 61
Education
a High school grad or less (n=598) 70
b Some college (n=381) 80a
c College graduate (n=537) 87ab
Household Income
a <$30,000 (n=467) 67
b $30,000-$49,999 (n=282) 83a
c $50,000-$74,999 (n=192) 88a
d $75,000+ (n=274) 92ab
Community Type
a Urban (n=413) 77c
b Suburban (n=758) 80c
c Rural (n=355) 69
Pew Research Center’s Internet Project July 18-September 30, 2013 tracking survey.
Note: Columns marked with a superscript letter (a) or another letter indicate a statistically
significant difference between that row and the row designated by that superscript letter.
Statistical significance is determined inside the specific section covering each demographic
trait.
PEW RESEARCH CENTER

18
PEW RESEARCH CENTER
www.pewresearch.org
Smartphone ownership for older adults
% of those 65 and older who own a smartphone
Total for all 65+ (n=1,526) 18%
Gender
a Male (n=612) 22b
b Female (n=914) 15
Age
a 65-69 (n=531) 29bcd
b 70-74 (n=401) 21cd
c 75-79 (n=244) 10d
d 80+ (n=350) 5
Education
a High school grad or less (n=598) 10
b Some college (n=381) 19a
c College graduate (n=537) 35ab
Household Income
a <$30,000 (n=467) 8
b $30,000-$49,999 (n=282) 15a
c $50,000-$74,999 (n=192) 28ab
d $75,000+ (n=274) 42abc
Community Type
a Urban (n=413) 20c
b Suburban (n=758) 20c
c Rural (n=355) 12
Pew Research Center’s Internet Project July 18-September 30, 2013 tracking survey.
Note: Columns marked with a superscript letter (a) or another letter indicate a statistically
significant difference between that row and the row designated by that superscript letter.
Statistical significance is determined inside the specific section covering each demographic
trait.
PEW RESEARCH CENTER

19
Older Adults and Technology
www.pewresearch.org
Tablet computer ownership for older adults
% of those 65 and older who own a tablet computer
Total for all 65+ (n=1,526) 18%
Gender
a Male (n=612) 20
b Female (n=914) 17
Age
a 65-69 (n=531) 23d
b 70-74 (n=401) 18d
c 75-79 (n=244) 20d
d 80+ (n=350) 9
Education
a High school grad or less (n=598) 11
b Some college (n=381) 19a
c College graduate (n=537) 31ab
Household Income
a <$30,000 (n=467) 8
b $30,000-$49,999 (n=282) 16a
c $50,000-$74,999 (n=192) 28ab
d $75,000+ (n=274) 39abc
Community Type
a Urban (n=413) 20c
b Suburban (n=758) 19
c Rural (n=355) 14
Pew Research Center’s Internet Project July 18-September 30, 2013 tracking survey.
Note: Columns marked with a superscript letter (a) or another letter indicate a statistically
significant difference between that row and the row designated by that superscript letter.
Statistical significance is determined inside the specific section covering each demographic
trait.
PEW RESEARCH CENTER

20
PEW RESEARCH CENTER
www.pewresearch.org
E-book reader ownership for older adults
% of those 65 and older who own an e-book reader
Total for all 65+ (n=1,526) 18%
Gender
a Male (n=612) 17
b Female (n=914) 19
Age
a 65-69 (n=531) 23d
b 70-74 (n=401) 19d
c 75-79 (n=244) 18d
d 80+ (n=350) 10
Education
a High school grad or less (n=598) 12
b Some college (n=381) 19a
c College graduate (n=537) 30ab
Household Income
a <$30,000 (n=467) 8
b $30,000-$49,999 (n=282) 17a
c $50,000-$74,999 (n=192) 33ab
d $75,000+ (n=274) 33ab
Community Type
a Urban (n=413) 19
b Suburban (n=758) 19
c Rural (n=355) 15
Pew Research Center’s Internet Project July 18-September 30, 2013 tracking survey.
Note: Columns marked with a superscript letter (a) or another letter indicate a statistically
significant difference between that row and the row designated by that superscript letter.
Statistical significance is determined inside the specific section covering each demographic
trait.
PEW RESEARCH CENTER

21
Older Adults and Technology
www.pewresearch.org
Social networking site usage for older adults
% of those 65 and older who use social networking sites
Based on internet
users 65+ Based on all adults 65+
All 65+ 46% 27%
Gender
a Male 39 25
b Female 52a 29
Age
a 65-69 54bd 40bcd
b 70-74 42d 29d
c 75-79 46d 21d
d 80+ 27 10
Education
a High school grad or less 44 18
b Some college 44 31a
c College graduate 48 42ab
Household Income
a <$30,000 41 16
b $30,000-$49,999 47 30a
c $50,000-$74,999 49 42ab
d $75,000+ 51 46ab
Community Type
a Urban 47 28
b Suburban 45 28
c Rural 47 23
Pew Research Center’s Internet Project July 18-September 30, 2013 tracking survey.
Note: Columns marked with a superscript letter (a) or another letter indicate a statistically
significant difference between that row and the row designated by that superscript letter.
Statistical significance is determined inside the specific section covering each demographic
trait.
PEW RESEARCH CENTER

22
PEW RESEARCH CENTER
www.pewresearch.org
Twitter usage for older adults
% of those 65 and older who use Twitter
Based on internet
users 65+ Based on all adults 65+
All 65+ 6% 3%
Gender
a Male 6 4
b Female 5 3
Age
a 65-69 8bd 6bcd
b 70-74 4 3
c 75-79 4 2
d 80+ 4 1
Education
a High school grad or less 4 2
b Some college 6 4
c College graduate 7 6a
Household Income
a <$30,000 9c 3
b $30,000-$49,999 4 3
c $50,000-$74,999 3 2
d $75,000+ 8c 7bc
Community Type
a Urban 6 4
b Suburban 6 4c
c Rural 3 1
Pew Research Center’s Internet Project July 18-September 30, 2013 tracking survey.
Note: Columns marked with a superscript letter (a) or another letter indicate a statistically
significant difference between that row and the row designated by that superscript letter.
Statistical significance is determined inside the specific section covering each demographic
trait.
PEW RESEARCH CENTER

23
Older Adults and Technology
www.pewresearch.org
Methods
The Pew Research Center Library Survey, sponsored by the Pew Research Center’s Internet &
American Life Project and the Gates Foundation, obtained telephone interviews with a nationally
representative sample of 6,224 people ages 16 and older living in the United States. Interviews
were conducted via landline (nLL=3,122) and cell phone (nC=3,102, including 1,588 without a
landline phone). The survey was conducted by Princeton Survey Research Associates
International. The interviews were administered in English and Spanish by Princeton Data Source
from July 18 to September 30, 2013. Statistical results are weighted to correct known demographic
discrepancies. The margin of sampling error for results based on the complete set of weighted data
is ±1.4 percentage points. Results based on the 5,320 internet users have a margin of sampling
error of ±1.5 percentage points.
A combination of landline and
cellular random digit dial
(RDD) samples was used to
represent all adults in the
United States who have access
to either a landline or cellular
telephone. Both samples were
provided by Survey Sampling
International, LLC (SSI)
according to PSRAI
specifications. Numbers for the
landline sample were drawn
with probabilities in proportion
to their share of listed
telephone households from
active blocks (area code +
exchange + two-digit block
number) that contained three
or more residential directory
listings. The cellular sample
was not list-assisted, but was
drawn through a systematic
sampling from dedicated wireless 100-blocks and shared service 100-blocks with no directory-
listed landline numbers.
Sample sizes and margins of error for older adults
Based on adults ages 65 and older
Unweighted sample
size Plus or minus…
All 65+ 1,526 2.9 percentage point
Men 612 4.6 ppt
Women 914 3.8 ppt
65-69 531 5.0 ppt
70-74 401 5.7 ppt
75-79 244 7.3 ppt
80+ 350 6.1 ppt
HS Grad or less 598 4.7 ppt
Some college 381 5.8 ppt
College grad 537 4.9 ppt
<$30,000 HH income 467 5.3 ppt
$30,000-<$50,000 282 6.8 ppt
$50,000-<$74,999 192 8.2 ppt
$75,000 or more 274 6.9 ppt
Urban 413 5.6 ppt
Suburban 758 4.1 ppt
Rural 355 6.1 ppt
Pew Research Center’s Internet Project July 18-September 30, 2013 tracking survey.
PEW RESEARCH CENTER

24
PEW RESEARCH CENTER
www.pewresearch.org
Interviews were conducted from July 18 to September 30, 2013. As many as 10 attempts were
made to contact every sampled telephone number. Sample was released for interviewing in
replicates, which are representative subsamples of the larger sample. Using replicates to control
the release of sample ensures that complete call procedures are followed for the entire sample.
Calls were staggered over times of day and days of the week to maximize the chance of making
contact with potential respondents. Interviewing was spread as evenly as possible across the days
in field. Each telephone number was called at least one time during the day in an attempt to
complete an interview.
For the landline sample, interviewers asked to speak with the youngest male or female ages 16 or
older currently at home based on a random rotation. If no male/female was available, interviewers
asked to speak with the youngest person age 16 or older of the other gender. This systematic
respondent selection technique has been shown to produce samples that closely mirror the
population in terms of age and gender when combined with cell interviewing.
For the cellular sample, interviews were conducted with the person who answered the phone.
Interviewers verified that the person was age 16 or older and in a safe place before administering
the survey. Cellular respondents were offered a post-paid cash reimbursement for their
participation. Weighting is generally used in survey analysis to compensate for sample designs and
patterns of non-response that might bias results. The sample was weighted to match national adult
general population parameters. A two-stage weighting procedure was used to weight this dual-
frame sample.
The first stage of weighting corrected for different probabilities of selection associated with the
number of adults in each household and each respondent’s telephone usage patterns. This
weighting also adjusts for the overlapping landline and cell sample frames and the relative sizes of
each frame and each sample.
The second stage of weighting balances sample demographics to population parameters. The
sample is balanced to match national population parameters for sex, age, education, race,
Hispanic origin, region (U.S. Census definitions), population density, and telephone usage. The
Hispanic origin was split out based on nativity; U.S born and non-U.S. born. The White, non-
Hispanic subgroup was also balanced on age, education and region. The basic weighting
parameters came from the US Census Bureau’s 2011 American Community Survey data. The
population density parameter was derived from Census 2010 data. The telephone usage parameter
came from an analysis of the July-December 2012 National Health Interview Survey.

25
Older Adults and Technology
www.pewresearch.org
Weighting was accomplished using Sample Balancing, a special iterative sample weighting
program that simultaneously balances the distributions of all variables using a statistical
technique called the Deming Algorithm. Weights were trimmed to prevent individual interviews
from having too much influence on the final results. The use of these weights in statistical analysis
ensures that the demographic characteristics of the sample closely approximate the demographic
characteristics of the national population.
Table 2 reports the disposition of all sampled telephone numbers ever dialed from the original
telephone number samples. The response rate estimates the fraction of all eligible respondents in
the sample that were ultimately interviewed. At PSRAI it is calculated by taking the product of
three component rates:
Contact rate – the proportion of working numbers where a request for interview was made
Cooperation rate – the proportion of contacted numbers where a consent for interview was
at least initially obtained, versus those refused
Completion rate – the proportion of initially cooperating and eligible interviews that were
completed
Table 2: Sample Disposition
Landline Cell
116,709 61,496 Total Numbers Dialed
5,165 1,052 Non-residential
4,316 225 Computer/Fax
30 0 Cell phone
70,002 25,290 Other not working
5,084 497 Additional projected not working
32,113 34,432 Working numbers
27.5% 56.0% Working Rate
1,695 166 No Answer / Busy
8,341 6,795 Voice Mail
116 50 Other Non-Contact
21,961 27,421 Contacted numbers
68.4% 79.6% Contact Rate
843 3,543 Callback
17,666 19,219 Refusal
3,452 4659 Cooperating numbers

26
PEW RESEARCH CENTER
www.pewresearch.org
15.7% 17.0% Cooperation Rate
204 228 Language Barrier
0 1,250 Child's cell phone
3,248 3,181 Eligible numbers
94.1% 68.3% Eligibility Rate
126 78 Break-off
3,122 3,103 Completes
96.1% 97.5% Completion Rate
10.3% 13.2% Response Rate
Thus the response rate for the landline sample was 10 percent. The response rate for the cellular
sample was 13 percent.