Newell Brands Inc (NWL) April 18, 2018 - biz.uiowa.edu · Important disclosures appear on the last...
30
Important disclosures appear on the last page of this report. The Henry Fund Henry B. Tippie School of Management Hannah Geyer [[email protected]] Newell Brands Inc (NWL) April 18, 2018 Consumer Discretionary – Household & Personal Products Stock Rating Buy Investment Thesis Target Price $31-35 We recommend a BUY rating for Newell Brands Inc, (NWL) as the company is poised for a turnaround effort through an ambitious transformation plan; divests 25% of the company by the end of 2019, resulting in projected revenues of $11 billion. Experienced leadership and iconic core brands will contribute to the company’s success. Our model suggests an upside of 23% for Newell Brands Inc, with a target price range of $31-35. Drivers of Thesis • Focused Operations: Company divestitures and focus on fewer brands will improve operations and decrease SG&A expenses by 4% within the year • Experienced Management: NWL’s CEO, Michael B. Polk, provides 28 years of experience in the industry and a track record of success, having served for seven years as President and COO at Unilever • Strong Camping Growth: We anticipate 4% growth for NWL’s camping brands as more than 1 million new households have begun camping each year since 2014, driven largely by millennials • Iconic Brand Names: Defensive and popular brand names reinforce customer familiarity and loyalty Risks to Thesis • Guidance Cuts: Management has cut guidance three times this past year after acquisitions stretched company operations in a challenging retail environment, negatively impacting investor sentiment • Board Member Uncertainty: Activist hedge fund Starboard Value LP is pursuing a proxy fight after rival activist Carl Icahn won five board seats in March of 2017, indicating some uncertainty on the board • Concentrated Buyers: NWL’s sales are dependent on purchases from large customers and any significant decline in these purchases or pressure from these customers to reduce prices could have a negative effect on the company’s future financial performance Henry Fund DCF $33.50 Henry Fund DDM $22.62 Relative Multiple $42.94 Price Data Current Price $27.23 52wk Range $23.85 – 55.08 Consensus 1yr Target $33.67 Key Statistics Market Cap (B) $12.08 Shares Outstanding (M) $488 Institutional Ownership 92.7% Five Year Beta 0.62 Dividend Yield 3.6% Est. 5yr Growth 6.93% Price/Earnings (TTM) 9.38 Price/Earnings (FY1) 8.92 Price/Sales (TTM) 0.85 Price/Book (mrq) 0.88 Profitability Operating Margin 9.63% Profit Margin 18.65% Return on Assets (TTM) 2.65% Return on Equity (TTM) 21.50% Earnings Estimates Year 2015 2016 2017 2018E 2019E 2020E EPS $1.30 $1.25 $5.65 $2.19 $2.36 $2.47 growth -4.21% -3.85% 352% -61.27% 7.99% 4.66% 12 Month Performance Company Description Newell Brands Inc is a worldwide marketer of consumer and commercial products with a portfolio of brands including Rubbermaid food storage, home organization, and reusable container products. The company, formerly known as Newell Rubbermaid Inc., was founded in 1903 and is headquartered in Hoboken, New Jersey. Beginning in January 2017, the company reports its financial results in five segments: Live, Learn, Work, Play, and Other. 9.4 8.3 9.2 9.4 22.0 12.9 18.9 27.5 12.5 0 10 20 30 P/E ROE EV/EBITDA NWL Industry PG -70% -50% -30% -10% 10% 30% A M J J A S O N D J F M NWL S&P 500 Source: Yahoo Finance Source: Factset
Transcript of Newell Brands Inc (NWL) April 18, 2018 - biz.uiowa.edu · Important disclosures appear on the last...

Important disclosures appear on the last page of this report.
The Henry Fund
Henry B. Tippie School of Management
Hannah Geyer [[email protected]]
Newell Brands Inc (NWL) April 18, 2018
Consumer Discretionary – Household & Personal Products Stock Rating Buy
Investment Thesis Target Price $31-35 We recommend a BUY rating for Newell Brands Inc, (NWL) as the company is poised for a turnaround effort through an ambitious transformation plan; divests 25% of the company by the end of 2019, resulting in projected revenues of $11 billion. Experienced leadership and iconic core brands will contribute to the company’s success. Our model suggests an upside of 23% for Newell Brands Inc, with a target price range of $31-35. Drivers of Thesis
• Focused Operations: Company divestitures and focus on fewer brands will improve operations and decrease SG&A expenses by 4% within the year
• Experienced Management: NWL’s CEO, Michael B. Polk, provides 28 years of experience in the industry and a track record of success, having served for seven years as President and COO at Unilever
• Strong Camping Growth: We anticipate 4% growth for NWL’s camping brands as more than 1 million new households have begun camping each year since 2014, driven largely by millennials
• Iconic Brand Names: Defensive and popular brand names reinforce customer familiarity and loyalty
Risks to Thesis
• Guidance Cuts: Management has cut guidance three times this past year after acquisitions stretched company operations in a challenging retail environment, negatively impacting investor sentiment
• Board Member Uncertainty: Activist hedge fund Starboard Value LP is pursuing a proxy fight after rival activist Carl Icahn won five board seats in March of 2017, indicating some uncertainty on the board
• Concentrated Buyers: NWL’s sales are dependent on purchases from large customers and any significant decline in these purchases or pressure from these customers to reduce prices could have a negative effect on the company’s future financial performance
Henry Fund DCF $33.50 Henry Fund DDM $22.62 Relative Multiple $42.94 Price Data Current Price $27.23 52wk Range $23.85 – 55.08 Consensus 1yr Target $33.67 Key Statistics Market Cap (B) $12.08 Shares Outstanding (M) $488 Institutional Ownership 92.7% Five Year Beta 0.62 Dividend Yield 3.6% Est. 5yr Growth 6.93% Price/Earnings (TTM) 9.38 Price/Earnings (FY1) 8.92 Price/Sales (TTM) 0.85 Price/Book (mrq) 0.88 Profitability Operating Margin 9.63% Profit Margin 18.65% Return on Assets (TTM) 2.65% Return on Equity (TTM) 21.50%
Earnings Estimates Year 2015 2016 2017 2018E 2019E 2020E
EPS $1.30 $1.25 $5.65 $2.19 $2.36 $2.47
growth -4.21% -3.85% 352% -61.27% 7.99% 4.66%
12 Month Performance Company Description
Newell Brands Inc is a worldwide marketer of consumer and commercial products with a portfolio of brands including Rubbermaid food storage, home organization, and reusable container products. The company, formerly known as Newell Rubbermaid Inc., was founded in 1903 and is headquartered in Hoboken, New Jersey. Beginning in January 2017, the company reports its financial results in five segments: Live, Learn, Work, Play, and Other.
9.4 8.3 9.29.4
22.0
12.9
18.9
27.5
12.5
0
10
20
30
P/E ROE EV/EBITDA
NWL Industry PG
-70%
-50%
-30%
-10%
10%
30%
A M J J A S O N D J F M
NWL S&P 500
Source: Yahoo Finance
Source: Factset

Page 2
EXECUTIVE SUMMARY
We recommend a BUY position for Newell Brands Inc. (NWL) as the company is positioned for a strategic turnaround effort with an ambitious transformation strategy to take effect before the end of 2019. Within the past year, NWL saw its stock drop from $55.08 to its current price of $25.75, due in part to a series of three guidance cuts from management and the resignation of three board members. In January of 2018, management articulated a transformation plan to better position the company for long-term growth, focusing on fewer core brand names by divesting 25% of the company. This simplification will accelerate the company’s ability to pay down debt, freeing up approximately $4B for debt repayment by 2019. Brands under review for sale include Rubbermaid Commercial Products®, Process Solutions®, and Waddington®, as well as smaller, non-core businesses such as Goody®, Rawlings®, and U.S. Playing Cards®.
We see this as a valuable focus for the company going forward as recent acquisitions have stretched NWL beyond its areas of expertise. In addition, NWL maintains a strong dividend yield of 3.6%, and a competitive PE ratio of 9.4.2
In our valuations, we did not factor the divestitures outlined in the transformation plan as they have yet to materialize; however, as the company moves in this direction, we will adjust accordingly. As per our calculations, the intrinsic value of the company is $33.50, 23% above the current market price of $27.23, putting the company’s rating as a buy.
COMPANY DESCRIPTION Newell Brands Inc., formerly Newell Rubbermaid Inc., is a global marketer of consumer and commercial products. This New Jersey-based company sells its products in nearly 200 countries, with operations in nearly 100 countries and over 49,000 employees worldwide.1
Founded in 1903, NWL features products under a portfolio of brands including Paper Mate®, Sharpie®, Dymo®, EXPO®, Elmer’s®, Coleman®, Jostens®, Marmot®, Rawlings®, Oster®, Sunbeam®, FoodSaver®, Mr. Coffee®, Rubbermaid Commercial Products®, Graco®, Baby Jogger®, NUK®, Calphalon®, Contigo®, First Alert®, Waddington and Yankee Candle.®
Effective January 1, 2017, Newell Brands Inc. began reporting its financial results in five segments: Live, Learn, Work, Play and Other. The purpose for this change was to align with the company’s Growth Game Plan strategy. All prior periods were reclassified to reflect this reporting structure.1 Net sales and core sales growth in each category are outlined below, with the Learn and Play segments leading core sales growth at 1.8% and 1.4% respectively. Growth in the Learn segment was due in part to increased Jostens marketing in the academic channel. Growth in the Play segment reflects an increase in US camping rates.
The graph below indicates 2017 net sales by segment. In 2017, the Live segment composed nearly 38% of NWL’s net sales, followed by Work (18.96%), Learn (1.82%), Play (17.53%), and Other (7.03%)
Source: Company Filings, 2017
The following chart indicates net sales growth in each of the five segments between 2015 and 2017, along with our projected net sales forecasts for 2018-2019.1
37.67%
18.82%
18.96%
17.53%
7.03%
2017 Net Sales
Live
Learn
Work
Play
Other
Source: Company Earnings Presentation, 2017

Page 3
Over the past three years, the largest growth has come from within the Live segment, increasing to represent 23.94%, 34.49%, and 37.67% of sales in 2015, 2016, and 2017 respectively.1 About 23% of this growth, can be explained through the 2016 Jarden acquisition.1 The Other segment has grown the least, representing 20.73%, 14.39%, and 7.03% of net sales in 2015, 2016, and 2017 respectively. About 55% of this change is due to NWL’s 2016 divestiture its Tools business to Stanley Black & Decker.
Additional factors driving changes in revenue streams, including the mix of organic growth and growth from acquisitions, are further explained in the following sections. Our revenue forecast for each segment considers company relationships with buyers, changing customer preferences, and trending brands, among other factors. However, we do not forecast divestitures as these have not yet been officially announced.
Live Segment
NWL’s Live segment features household products including kitchen appliances, cookware, bakeware,
cutlery, food storage, home fragrance products, baby gear, infant care, and health products.1
These products exist primarily under Aprica, Baby Jogger, Ball, Calphalon, Chesapeake Bay Candle, Crock-Pot, FoodSaver, Graco, Mr. Coffee, NUK, Oster, Rubbermaid, Sistema, Sunbeam, Tigex, WoodWick, and Yankee Candle brands.1
The 2017 increase in net sales for this segment was due in part to acquisitions (approximately 23%) as well as strong growth in the baby gear category.1 However, we expect Baby brands to experience negative core sales growth in the first half of 2018, resulting from the bankruptcy of Toys R Us and Babies R Us, a buyer of NWL.
Despite the challenge with Babies R Us, NWL’s baby gear segment has been steadily gaining US market share over the past four years, growing from 31% to 36%. We believe this growth will continue slightly in 2018 as NWL emphasizes this category heavily in its e-commerce segment.10
Source: 2018 CAGNY Conference Presentation, NPD
Another category in the Live segment, food storage, has also gained US market share. From 2014 to 2017, this category grew from 36% to nearly 40% of US market share, competing primarily with Tupperware Corp (TUP). However, we do not anticipate this growing, as room for growth gets tighter and NWL looks to divest Rubbermaid Commercial Products.10
Based on the above factors, we anticipate that revenue in the Live segment will grow by -1% in 2018, 2% in 2019, 2.25% in 2020, 2.5% in 2021, and 2.75% in 2022.
0%
10%
20%
30%
40%
2015 2016 2017 2018E 2019E
2015-2019E Net Sales
Live Learn Work Play Other
Source: Company Filings, 2017
31.1% 31.8% 33.9% 35.9%
36.2% 37.4% 38.1% 39.7%
0%
10%
20%
30%
40%
50%
2014 2015 2016 2017
NWL's US Market Share Gains
Baby Gear Food Storage
Live Segment Key Brands
Source: Company Filings, 2017

Page 4
Learn Segment
NWL’s Learn segment offers writing instruments, including markers and highlighters, pens and pencils, art products, adhesives, cutting products, and writing instruments under brands including Dymo, Elmer's, Expo, Jostens, Mr. Sketch, Paper Mate, Parker, Prismacolor, Sharpie, Waterman, and X-Acto brands.1 Additionally, the Learn segment also includes the company’s Jostens business, which provides class and championship rings, caps and gowns, diplomas, varsity jackets, yearbooks and other accessories. 1
The Learn segment markets its products directly to mass merchants, grocery/drug stores, office supply stores, contract stationers, on-line and other retailers.
The increase in net sales for 2017 was primarily due to the Jarden Acquisition (approximately 9%) and an increase in Elmer’s glue sales due to the popularity of homemade Slime.3 Although this trend provided a boost in sales, we expect Elmer’s glue sales to remain strong, as the brand remains the leading adhesive brand in the United States.18
Newell’s Writing products, independent from glue sales, have experienced market share growth over the past four years, as the chart below indicates.
Source: 2018 CAGNY Conference Presentation, NPD
However, company guidance expects Writing brands to have negative core sales growth in the first half of 2018, as writing invoice sales at NWL’s third largest customer were down over 55% related to a trade dispute with Office Depot. This dispute, further discussed in the Markets and Competition section, has since been resolved.10
Management describes Jostens as a “hidden gem,” in this segment, growing 2% in 2017 due to increased marketing in the academic and achievement channel and a network of independent sales representatives to sell its scholastic products in K-12 schools, colleges, and universities.1
Based on the factors above, we anticipate that revenue in the Learn segment will grow by -10% in 2018, 5% in 2019, 5.25% in 2020, 5.5% in 2021, and 5.75% in 2022.
Work Segment
Newell’s Work segment includes cleaning and commercial brands, like Rubbermaid®, Rubbermaid Commercial Products®, Quickie®, Spontex® and MAPA®. The Waddington business is a global packaging manufacturer and marketer serving the foodservice, bakery, deli, produce and confectionary markets whose products include containers, serving ware, drinkware and cutlery, and disposable plastic products.1
This segment primarily markets its products through distributors and directly to mass merchants, home centers, commercial products distributors, select contract customers and other professional customers. The increase in net sales for 2017 was primarily due to the Jarden Acquisition (approximately 18%) and growth in the Safety and Security and Waddington categories.1
Newell anticipates significant changes for this segment, with plans to divest Rubbermaid Commercial Products, MAPA, Quickie, Spontex, as well as Waddington brands,
38.60%
40.20%40.60%
41.10%
37%
38%
39%
40%
41%
42%
2014 2015 2016 2017
NWL's US Market Share Gains Writing (excluding Glue)
Learn Segment Key Brands
Work Segment Key Brands
Source: Company Filings, 2017
Source: Company Filings, 2017

Page 5
including WNA, ECO, and Polar Pak. Because these divestiture have not yet been solidified, we did not build them into our valuation.
Looking ahead, we anticipate that revenue in the Work segment will grow by -1% in 2018, 2.5% in 2019, 2.25% in 2020, 2.25% in 2020, 2.25% in 2021, and 2.25% in 2022.
Play Segment
NWL’s Play segment includes products for outdoor and outdoor-related activities primarily under brands including Berkley®, Coleman®, Contigo®, Ex Officio®, Marmot®, Rawlings®, and Shakespeare® trademarks. The Play segment primarily markets its products directly to club, department store, drug/grocery, mass merchant, sporting goods and specialty retailers and distributors. This segment’s 38.1% increase in net sales for 2017 was primarily due to the Jarden Acquisition (approximately 35%) with the balance of growth generated primarily by the Beverage, Coleman, Team Sports and Technical Apparel categories, primarily due to increased demand.1
We anticipate this to continue as camping rates in the US are up. According to a January 2017 survey conducted by Cairn Consulting Group, an estimated 13 million US households plan to camp more in 2017 than they did in
2016.14 In addition, more than 1 million new households have begun camping each year since 2014, driven largely by millennials. Millennials now account for 38% of the 75 million active camper households in the US, up from 24% in 2015.14 Based on projected growth in the camping category, we anticipate that revenue in the Play segment will grow by 3% in 2018, 3.25% in 2019, 3.5% in 2020, 3.75% in 2021, and 4% in 2022.
Other Segment
NWL’s Other segment features plastic products, including closures, contact lens packaging, medical disposables, plastic cutlery, beauty products, vacuum cleaning systems, and gaming products primarily under Jarden Plastic Solutions, Jarden Applied Materials, Jarden Zinc Products, Goody, Bicycle, and Rainbow brands.1
The Jarden Applied Materials business produces specialty nylon polymers, conductive fibers and monofilament used in various products. Jarden Zinc Products is the sole source supplier of copper-plated zinc penny blanks to the United States Mint and a major supplier to the Royal Canadian Mint, as well as a supplier of brass, bronze and nickel-plated finishes on steel and zinc for coinage to other international markets.1
The decrease in this segment’s net sales for 2017 was primarily due to impact of the company’s divestiture of its Tools business (approximately 55%), partially offset by the Jarden Acquisition (approximately 15%). NWL’s Tools business, which included brands like Irwin, Lenox, and Hilmor brands, was sold to Stanley Black & Decker (SWK) for $1.95B in cash in 2016. Newell used the proceeds to reduce its debt, reporting that the total net sales of the remaining businesses held for sale was about $700M.13
Looking ahead, we anticipate that revenue in the Other segment will grow by 0% from 2018-2022 as NWL plans to sell the brands in this category, including Process Solutions, LifoAM, Rainbow, Goody, ACE, Solano, Bicycle, Bee, and Aviator.10
Play Segment Key Brands
Other Segment Key Brands
Source: Company Filings, 2017
Source: Company Filings, 2017

Page 6
Company Analysis
Newell started 2017 with two strong quarterly results. Operating income rose double-digits during both quarters and revenue more than doubled in the first, due largely to the company’s Jarden acquisition.1 Along with these encouraging numbers, Newell's management raised its dividend for the first time since 2015. The first two months into Q3 appeared promising as well. However, on September 6, 2017, NWL lowered EPS guidance from $3.00-$3.20 to $2.95-$3.05, resulting in investor concern. Along with this announcement, NWL’s stock dropped 15%.10 The graph below indicates Newell Brands Price change compared with the S&P 500 change between 2013 and 2018.
Source: SeekingAlpha
Progressing into Q3, Newell continued to underperform. Despite lowered estimates for revenue and profit, the company missed both marks and reported an adjusted EPS of $0.86 on revenue of 3.68 billion. In addition, revenue revealed a $276 million (7%) decline year over year and a nearly $400 million decline in revenue from Q2. 5
Management cited several reasons for this underperformance including Hurricane Harvey, commodity cost inflation (resin), the Toys R Us bankruptcy, growing consumer expectations for promotions, and a difficult pricing environment.3 While some of these variables caused a temporary disruption in the company’s supply chain, others reflect a more persistent trend for companies in the retail industry that find it increasingly difficult to maintain brick and mortar revenue in a digital environment.
In addition to these factors, the Jarden acquisition presented management complications as the former Jarden CEO, Martin Franklin, and two other former Jarden
executives joined Newell’s board with strong opinions about company leadership.
Along with this underperforming quarter, management further lowered EPS guidance down from $2.95-$3.05 to $2.80-$2.85 per share. In comparison, our EPS estimate for 2018 is $2.19. After Q3 earnings were released on November 2, 2017, NWL stock dropped to a 52-week low of $30.1
Transformation Plan
On January 25, 2018, NWL released a transformation plan to address the company’s recent poor performance. This plan includes the goal of reducing company size by 25% by selling several of its industrial and consumer brands before the end of 2019.1 The brands NWL intends to sell include Rubbermaid Commercial Products, Process Solutions, and Waddington. The company also plans to divest smaller, non-core businesses such as Goody, Rawlings, and U.S. Playing Cards. Ideally, this transformation plan will simplify logistics and allow for more focused operations.10 These brands, labeled Under Review, are listed below.
Source: 2018 CAGNY Conference Presentation, NPD
Within this announcement came a third EPS guidance cut within the year, down to $2.72-$2.76 per share. Consequently, NWL stock plunged another 21%. By adapting these new strategies, Newell may raise profit margins and grow the bottom line, even if overall revenue does not.3
As a result of these sales, Newell Brands will focus its brands on fewer categories, listed in the following chart. Along with this review, the company also anticipates decreasing its factories by 53%, distribution centers by 47%, retailers and distributors by 50%, and employees by 25%.10

Page 7
Source: 2018 CAGNY Conference Presentation
As they divest, NWL’s plans for the funds include the following: investing in the core business, holding the dividend, deleveraging the balance sheet, repurchasing shares, and funding strategic, accretive, bolt-on M&A (2020+).10
According to management, the new company make-up would have projected EBITDA of $2 billion on $11 billion in revenue, compared to $14.8 billion expected before the transformation plan.
Source: 2017 Conference Presentation
The transformation plan recognizes that acquiring Jarden for $15 billion in 2016 was too ambitious and spread the company’s efforts in many directions. Managing over 200 diverse brands is challenging when operations are vastly different. As a result, logistics and administration quickly become both expensive and complicated.
This move from management is timely and responsible, as steps to become a smaller company will ultimately allow
NWL to focus on 9 core consumer divisions. This reduction in operational complexity cuts down significantly on overhead, resulting in lower SG&A expenses and a greater bottom line.
As a result, we project SG&A expenses to decrease from 26.6% of revenue in 2016 to 22% of revenue after 2017.
Geographic Segmentation
The company’s 2017 sales were primarily in North America, with 71% in the United States and 6% in Canada. Behind North America, 12.44% of sales took place in Europe, the Middle East, and Africa, 5.23% in Latin America, and 5.71% in Asia Pacific.
NWL’s 2017 regional core sales growth report reveals that geographically, Latin America and Asia Pacific were responsible for the most growth within the year at 10.3% and 3.9% respectively. Management indicates that NWL seeks to expand even further in these regions within the next five years.3
76.62%
12.44%
5.23%
5.71%2017 Sales
North America
Europe, Middle East,and Africa
Latin America
Asia Pacific
Source: Company Filings, 2017
Source: Company Earnings Presentation, 2017

Page 8
Global E-Commerce Division
Companies in the retail industry are facing challenges as brick and mortar stores lose ground to e-commerce sites like Amazon and eBay. In 2017, NWL initiated a new company-wide e-commerce division, opening e-commerce offices in the New York Metro area. This new team doubled the budgeted growth rate and established a $1.6 billion global e-commerce business that grew over 25% in 2017, now representing 11% of net sales.3
The company plans to continue investing in its e-commerce business through 2018, but the majority of Newell's revenue still come from traditional brick and mortar retailers. Although their e-commerce business has grown, this may not be competitive enough against more established players in the e-commerce space.
The graph below indicates the 2017 FY US sales, segmented as a percentage of total e-commerce sales.
The largest segment of e-commerce sales in 2017 came from baby products (49%), followed by Jostens (24%), Appliances and Cookware (21%), Outdoor and Recreation (20%), Writing (14%), Home Fragrance (13%), Storage (10%), Fishing (10%), and Food (7%). Products in the Under Review category (2%), include the brands that Newell anticipates divesting by the end of 2019. Newell has targeted e-commerce appliances to grow by 30% in 2018, partially through the rollout of a new brand direct-to-consumer online store called @heartoflife. This online store is set to launch in 2018, leveraging common infrastructure and integrated learning from the e-commerce DTC team.10 This growth may provide opportunity to move toward more expensive premium products as the average price in appliance product families are typically 1.6 times higher than baby products, currently the largest segment of e-commerce sales.10
Debt
NWL has grown significantly through acquisitions. After acquiring Jarden Corporation in 2016, the company incurred debt totaling $6.5 billion.
Today, NWL has a total debt load of $10.6 billion with a debt rating of BBB- from Standard & Poor's and Baa3 from Moody’s.
The company’s short-term debt, however, only represents $662 million and it has $485 million in cash and cash equivalents. As NWL anticipates upcoming divestitures, we do not anticipate issues with repaying debt in the near future.7
The company has been consistent in paying off debt and reaching the targeted leverage ratio of 3x. Since April 2016, it has reduced gross debt by $3.4 billion.7 NWL has no major maturities looming until 2021. The company’s debt maturities for the five years following December 31, 2017 and thereafter are as follows, displayed in millions:
Debt Maturities (in millions)
2018 $671.9
2019 $919.2
2020 $306.8
2021 $1362.0
2022 $251.2
Thereafter $7,103.7
Total $10,614
89%
11%
2017 Net Sales
Brick and Mortar
e-commerce
49%
24%21% 20%
14% 13%10% 10%
7%2%
2017 NWL US Total Sales from e-Commerce
Source: 2018 Conference Presentation
Source: Company Filings, 2017
Page 9
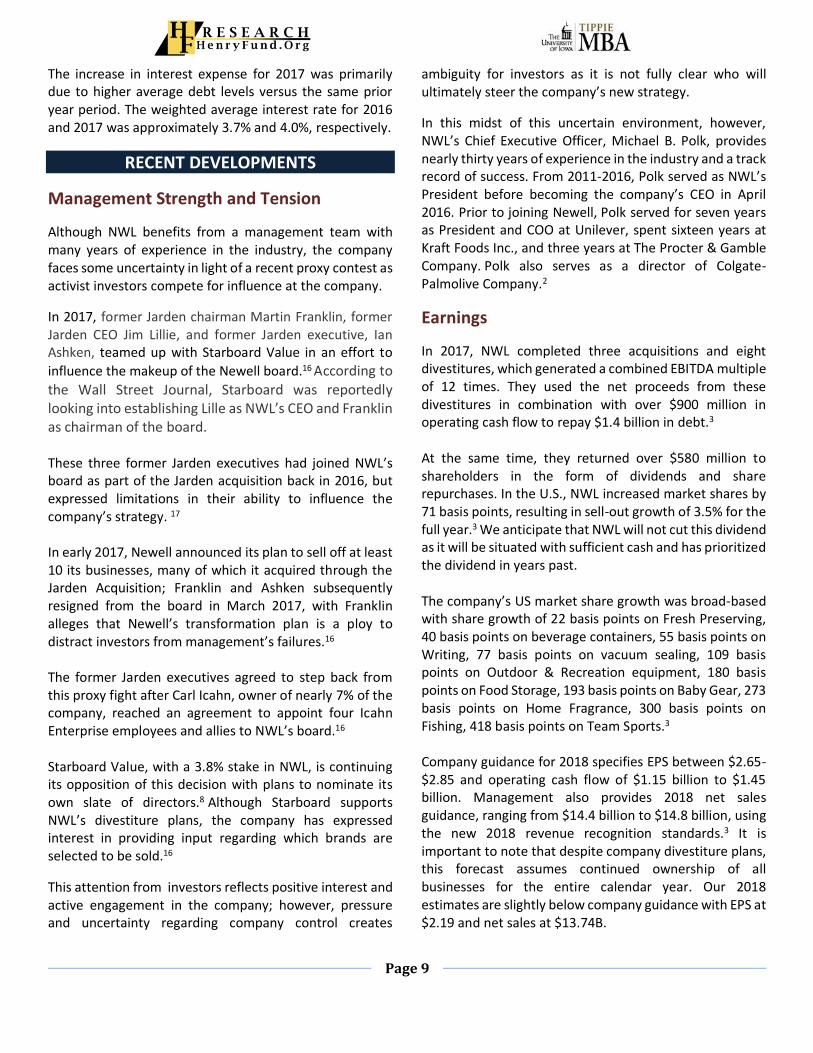
The increase in interest expense for 2017 was primarily due to higher average debt levels versus the same prior year period. The weighted average interest rate for 2016 and 2017 was approximately 3.7% and 4.0%, respectively.
RECENT DEVELOPMENTS
Management Strength and Tension
Although NWL benefits from a management team with many years of experience in the industry, the company faces some uncertainty in light of a recent proxy contest as activist investors compete for influence at the company.
In 2017, former Jarden chairman Martin Franklin, former Jarden CEO Jim Lillie, and former Jarden executive, Ian Ashken, teamed up with Starboard Value in an effort to
influence the makeup of the Newell board.16 According to the Wall Street Journal, Starboard was reportedly looking into establishing Lille as NWL’s CEO and Franklin as chairman of the board.
These three former Jarden executives had joined NWL’s board as part of the Jarden acquisition back in 2016, but expressed limitations in their ability to influence the company’s strategy. 17 In early 2017, Newell announced its plan to sell off at least 10 its businesses, many of which it acquired through the Jarden Acquisition; Franklin and Ashken subsequently resigned from the board in March 2017, with Franklin alleges that Newell’s transformation plan is a ploy to distract investors from management’s failures.16 The former Jarden executives agreed to step back from this proxy fight after Carl Icahn, owner of nearly 7% of the company, reached an agreement to appoint four Icahn Enterprise employees and allies to NWL’s board.16
Starboard Value, with a 3.8% stake in NWL, is continuing its opposition of this decision with plans to nominate its own slate of directors.8 Although Starboard supports NWL’s divestiture plans, the company has expressed interest in providing input regarding which brands are selected to be sold.16
This attention from investors reflects positive interest and active engagement in the company; however, pressure and uncertainty regarding company control creates
ambiguity for investors as it is not fully clear who will ultimately steer the company’s new strategy.
In this midst of this uncertain environment, however, NWL’s Chief Executive Officer, Michael B. Polk, provides nearly thirty years of experience in the industry and a track record of success. From 2011-2016, Polk served as NWL’s President before becoming the company’s CEO in April 2016. Prior to joining Newell, Polk served for seven years as President and COO at Unilever, spent sixteen years at Kraft Foods Inc., and three years at The Procter & Gamble Company. Polk also serves as a director of Colgate-Palmolive Company.2
Earnings
In 2017, NWL completed three acquisitions and eight divestitures, which generated a combined EBITDA multiple of 12 times. They used the net proceeds from these divestitures in combination with over $900 million in operating cash flow to repay $1.4 billion in debt.3 At the same time, they returned over $580 million to shareholders in the form of dividends and share repurchases. In the U.S., NWL increased market shares by 71 basis points, resulting in sell-out growth of 3.5% for the full year.3 We anticipate that NWL will not cut this dividend as it will be situated with sufficient cash and has prioritized the dividend in years past. The company’s US market share growth was broad-based with share growth of 22 basis points on Fresh Preserving, 40 basis points on beverage containers, 55 basis points on Writing, 77 basis points on vacuum sealing, 109 basis points on Outdoor & Recreation equipment, 180 basis points on Food Storage, 193 basis points on Baby Gear, 273 basis points on Home Fragrance, 300 basis points on Fishing, 418 basis points on Team Sports.3 Company guidance for 2018 specifies EPS between $2.65-$2.85 and operating cash flow of $1.15 billion to $1.45 billion. Management also provides 2018 net sales guidance, ranging from $14.4 billion to $14.8 billion, using the new 2018 revenue recognition standards.3 It is important to note that despite company divestiture plans, this forecast assumes continued ownership of all businesses for the entire calendar year. Our 2018 estimates are slightly below company guidance with EPS at $2.19 and net sales at $13.74B.

Page 10
Project Renewal
Project Renewal was initially launched in October 2011 to reduce the complexity of the organization and increase investment in growth platforms within the business. In April 2015, NWL committed to further expansion of Project Renewal. Under Project Renewal, the Company simplified and aligned its businesses around two key activities — Brand & Category Development and Market Execution & Delivery. Project Renewal was completed by the end of 2017, and as a result, additional cash payments and savings will be realized thereafter.1
Acquisitions
2017 - In January 2017, NWL acquired Smith Mountain Industries, a provider of home fragrance products, sold primarily under the WoodWick® Candle brand, for a cash purchase price of approximately $100 million. In April, NWL acquired Sistema Plastics, a New Zealand based manufacturer and marketer of food storage containers with market shares and presence in Australia, New Zealand, U.K. and parts of continental Europe for a cash purchase price of approximately $472 million. Then in September of that year, NWL acquired Chesapeake Bay Candle for a cash purchase price of approximately $75 million.1
2016 – In April 2016, NWL acquired Jarden Corporation; the total merger consideration, including debt assumed, was approximately $18.7 billion. Along with this deal, former Jarden CEO Martin Franklin and two other former Jarden executives joined Newell’s board.
Jarden’s results of operations are included in Newell’s results of operations since the acquisition date. Jarden was a leading, global consumer products company with leading brands such as Crock-Pot®, FoodSaver®, Mr. Coffee®, Oster®, Coleman®, First Alert®, Rawlings®, Jostens®, Marmot®, Yankee Candle® and many others. This acquisition allowed NWL to expand at a more competitive scale, now interacting with leading brands in a global market that exceeds $100 billion. However, the company is now stepping back from some of these brands.
Divestitures
2018 – As described in the Transformation Strategy section, NWL plans to accelerate its transformation plan, improving operational performance and reducing debt by
divesting brands including Waddington, Process Solutions, Rubbermaid Commercial Products and Mapa. The company plans to begin the evaluation process “immediately” and finish by the end of 2019. This strategy will focus the company’s portfolio on core consumer divisions, including Elmer’s, Marmot, and Sharpie.
The accelerated transformation plan would significantly reduce operational and systems complexity, exposure to economic cycles and focus the company’s remaining portfolio on leading brands in global consumer-facing categories that can leverage Newell’s capabilities in brands, innovation, design and E-commerce.
2017 - In 2017, NWL sold its Tools business, its Rubbermaid® consumer storage totes business, its stroller business under the Teutonia® brand, its Lehigh business, its firebuilding business, its triathlon apparel business under the Zoot® and Squadra® brands and its Winter Sports business.
As a result of these activities, NWL expects to incur up to $1.0 billion of restructuring and other costs through 2021.1
Stock Repurchase Plan
In September 2017, NWL announced that it is reinstating the company’s Stock Repurchase Program, which it had suspended in 2015 at the same time as its acquisition of Jarden Corp. This announcement indicated that NWL received board approval to repurchase up to $1.26 billion of its outstanding shares through the end of 2020.1
MARKETS AND COMPETITION
Suppliers
Typically, NWL has not struggled to find sufficient quantities of raw materials from its foreign and domestic suppliers. The company also relies on third-party manufacturers as a source for finished goods. At times, a single or small number of manufacturers may supply most of the finished goods for a product line.1
For example, the Baby division (in the Live segment) has a single source of supply for products that comprise a majority of its sales, as well as intellectual property ownership rights for those products.3 Should this single suppliers fail to produce a sufficient supply, go out of

Page 11
business, or discontinue an essential component, NWL’s operations would be disrupted and sales may suffer.
Another challenge for NWL is inconsistent pricing. The company does not often enter into long-term contracts with its primary vendors and suppliers. Instead, they choose to buy on a “purchase order” basis. As a result, NWL may be subject to unexpected changes in pricing or supply of products.3
For these reasons, NWL’s ability to select and retain reliable vendors and suppliers will impact the company’s success in meeting customer demand for timely delivery of quality products. We do not anticipate difficulties with this supplier in the near future, but note that NWL is positioned somewhat precariously with several of its suppliers and vendors.
Buyers
NWL’s principal customers are large mass merchandisers such as discount stores, warehouse clubs, office superstores, craft stores, direct-to-consumer channels, specialty retailers and wholesalers, commercial distributors, e-commerce companies.
The company’s largest customer, Walmart (including Sam’s Club), accounted for approximately 10.9%, 13.5%, and 13.7% of net sales in 2015, 2016, and 2017, respectively, across substantially all segments. Although further sales segmentation data is not provided, the company’s top ten customers in 2017 included Amazon, Bed, Bath & Beyond, Costco, Lowe’s, Office Depot, Staples, Target, The Home Depot, Toys ‘R’ Us and Walmart.1
We view NWL’s strong relationships with large, high-volume purchasers as advantageous. However, the company’s sales are very dependent on bulk purchases from these large customers and any significant decline or pressure to reduce prices from these customers would have a large impact on NWL’s income.
For example, in 2017, NWL’s Writing business (in the Work segment), was down 55% globally due to a conflict with Office Depot. This conflict stemmed from Newell’s belief that Office Depot was not sufficiently promoting its writing products and, as a result, NWL held back shipments. In an interview with the Wall Street Journal, Newell CEO Michael Polk stated that the dispute stemmed from Office Depot's declining business and its subsequent failure to promote Newell brands like Sharpie, Paper Mate pens, and
Elmer's glue, as they had agreed.15 This trend led to a $54M year-over-year sales drop in the fourth quarter of 2017.1
NWL and Office Depot have since repaired this relationship. However, as an indication of buyers’ power, the combination of this conflict with Office Depot, along with the Babies R Us bankruptcy, explained a 200 bps decline when compared with the prior year.3
In addition, NWL’s buyers may further consolidate, which could negatively impact its sales and margins. Looking forward, we do not see consolidation within these top ten customers on the immediate horizon.
Foreign Currency Exchange Rates
NWL has moderate exposure to risks including foreign currency exchange rates and commodity pricing. While the company transacts predominantly in US dollars, a significant portion of the Company’s operating costs are expressed in other currencies, including the Brazilian Real, British Pound, Canadian dollar, Chinese Renminbi, European Euro, Japanese Yen and Mexican Peso.1 Changes in relation to the US dollar will affect the company’s sales and profitability and could result in exchange losses.
In 2017, approximately 29% of NWL’s sales were denominated in foreign currencies. Of these sales, the largest amount, 8.0%, was from the Euro, while 5.8% were from the Canadian dollar.1
The following table presents the fair value of derivative financial instruments as of December 31, 2017 (in millions):
According to management, the primary purpose of NWL’s foreign currency hedging activities is to mitigate the foreign currency exchange rate exposure on the cash flows related to forecasted inventory purchases and sales. However, this activity does not meaningfully impact earnings. A hypothetical 10% change in foreign currency exchange rates would not have a material effect on foreign currency gains and losses related to the foreign currency

Page 12
derivatives or the net fair value of the company’s foreign currency derivatives.3 Nonetheless, we anticipate these conversion rates to remain stable in the years ahead.
Peer Comparison
Newell’s major competitors include ACCO Brands Corp (ACCO), Tupperware Brands Corp (TUP), Procter & Gamble (PG), and Colgate-Palmolive (CL), all American multi-national consumer goods corporations. Trailing twelve month stock prices of all competitors are charted below, with Newell currently trading at the lowest rate, followed by Tupperware.2
Source: YahooFinance
Acco Brands Corp (ACCO) manufactures and markets office, school, calendar products and select computer and electronic accessories, aligning most closely with the products in NWL’s Word segment.
Tupperware Corp. (TUP) provides brands and categories that include, storage and serving for the kitchen and home through the Tupperware brand, as well as beauty and personal care products through the Avroy Shlain, BeautiControl, Fuller, NaturCare, Nutrimetics and Nuvo brands. This company aligns most closely with NWL’s Live segment.
Procter & Gamble (PG) engages in the provision of branded consumer packaged goods. It operates through the following segments: Beauty, Grooming, Health Care, Fabric and Home Care, and Baby, Feminine and Family Care, aligning most closely with NWL’s Live segment.
Colgate-Palmolive Co. (CL) engages in the manufacturing and distribution of consumer products. It operates through Oral, Personal and Home Care; and Pet Nutrition segments.
We compared these competitors across the following metrics.
Market Cap
Rev (M) Fwd 1yr
P/E (ttm)
ROA EV/ EBITDA
Newell Brands (NWL)
13.24B 14,477 4.84 2.65% 11.09
ACCO Brands Corp (ACCO)
1.43B 1,989 11.16 17.76% 7.55
Tupperware Corp (TUP)
2.24B 2,267 20.23 14.81% 6.69
Procter & Gamble (PG)
196.94B 66,978 20.84 7.74% 12.14
Colgate-Palmolive (CL)
63.04B 16,206 31.66 19.71% 15.48
Data Source: Factset
Profit Margins – When comparing margins, we see that NWL has the highest profit margin at over 18%, followed by PG and CL with 15.3% and 13.1% respectively.
Profit Margin Operating Margin (ttm)
Newell Brands (NWL) 18.65% 9.63% ACCO Brands Corp (ACCO) 6.76% 11.86%
Tupperware Corp (TUP) -11.77% 15.63%
Procter & Gamble (PG) 15.34% 22.95%
Colgate-Palmolive (CL) 13.10% 25.31%
Source: YahooFinance
However, taking into consideration historical changes, we see the following trends.
Source: Factset
-70%
-50%
-30%
-10%
10%
30%
A M J J A S O N D J F M
12 Month Stock Price
NWL ACCO TUPPG CL S&P 500
-30
-20
-10
0
10
20
30
2008 2009 2010 2011 2012 2013 2014 2015 2016 2017
Net Margin History
NWL ACCO TUP PG CL

Page 13
Operating Margins for all five companies have remained fairly consistent over the past nine years.
Source: Factset
Source: Factset
Source: Factset
Source: FactSet Dividend - Newell Brands pays an annual dividend of $0.92 per share and has a dividend yield of 3.6%. Newell Brands pays out 33.5% of its earnings in the form of a dividend. As a group, “Plastics products, not elsewhere classified” companies pay a dividend yield of 2.5% and pay out 43.1% of their earnings in the form of a dividend. Newell Brands is clearly a better dividend stock than its peers, given its higher yield and lower payout ratio. However, with its current low stock price, Newell differentiates itself from these rivals with a dividend yield of 3.6%. In comparison, CL’s dividend yield is just 2.3%. Although PG yields 3.45%, the company has experienced stagnant revenues over the past several years.2
In addition, NWL trades at a PE of 10, compared to PG’s PE of 21 and CL’s PE ratio of 30. Although Newell stock has been more volatile, we believe it will become more stable in the years ahead when the company’s transformation plan has been fully implemented.
ECONOMIC OUTLOOK
Unemployment Data
According to Bureau of Labor Statistics, the unemployment rate in US has declined steadily over the last 5 years and currently remains at 4.1%, as of March 2018, compared to 4.5% by end of March 2017. Looking forward, we estimate the unemployment rate to remain close to 4.2% in 2018, indicating a steady rise in labor costs. Historically low unemployment levels will lead to more disposable income. However, we believe this will increase gradually to 4.7% by the end of 2020.
0
5
10
15
20
25
30
2008 2009 2010 2011 2012 2013 2014 2015 2016 2017
Operating Margin
NWL ACCO TUP PG CL
-30
-20
-10
0
10
20
30
2008 2009 2010 2011 2012 2013 2014 2015 2016 2017
ROA
NWL ACCO TUP PG CL
0
5
10
15
20
2008 2009 2010 2011 2012 2013 2014 2015 2016 2017
EV/EBITDA FY2
NWL ACCO TUP PG CL
0
5
10
15
20
25
30
P/E FY2
NWL ACCO TUP PG CL

Page 14
US Unemployment Rate
Disposable Income
Retail companies are influenced heavily by consumer spending. We expect consumer confidence and discretionary spending to continue in the coming year, positively impacting the industry. In January 2018, US customer confidence rose higher than expected, as a result of low unemployment, modest inflation, and economic growth. The Conference Board cites consumer confidence at 125.4 points, up from 123.1 in December.4
Source: US Bureau of Economic Analysis
Interest Rates
Ten-year treasury yields remain low relative to historical levels, despite a series of increases beginning in mid-2016. Ten-year treasury yields currently stand at 2.88%. Interest rates are important for companies with significant levels of debt like NWL. We project that the ten-year treasury rate will rise to about 3.5% by the end of 2020.
Rising interest rates will limit financing options for acquisition activity. This may be a good thing as management is focused on divestitures. While the majority of NWL’s debt is fixed, fluctuations in interest
rates can increase borrowing costs on the portion that is variable and interest rate increases on this portion of the company’s debt could adversely impact net income.
INVESTMENT POSITIVES
• With increasing focus on e-commerce, we believe revenue from this segment to grow 5% this year
• With management steering the company toward more specialized product lines, NWL will reduce its operational complexity and cut down significantly on overhead, reducing SG&A expenses by 4%
• With debt to assets ratio of .55, NWL has the ability to comfortably pay down its debts over time
• As camping rates continue to rise steadily in the US, NWL’s outdoor recreation and camping brands will experience growth in the coming years
INVESTMENT NEGATIVES
• Challenges remain with brick-and-mortar retailing as Amazon continues to dominate the e-commerce space
• With continued tension surrounding board member seats, NWL could experience leadership changes that disrupt or cloud its transformation plan.
VALUATION
Our calculations are based on three valuation methods: Discounted Cash Flow, Dividend Discount, and Relative Multiple (P/E). Capital expenditure forecast is based on the company’s long-term guidance to spend more on managing debt over the next five years.
Liquidity and Capital Resources - At the end of 2017, NWL had cash and cash equivalents of $486 million, of which approximately $401 million was held by their non-U.S. subsidiaries. Overall, we believe that available cash and cash equivalents, cash flows generated from future operations, access to capital markets, and availability under its revolving credit facility and receivables purchase agreement will be adequate to support the company’s cash needs. NWL intends to use available cash, borrowing capacity, cash flows from future operations and alternative financing arrangements to invest in capital expenditures in support of the Company’s growth platforms, to maintain its dividend per share and to repay debt maturities as they
Source: Bureau of Labor Statistics

Page 15
come due and to complete its ongoing restructuring initiatives. Capital Expenditures - For 2016, capital expenditures were $441 million versus $211 million for 2015. The change in cash provided by (used in) investing activities for 2016 was primarily due to an increase in cash used for the acquisition of businesses, net of cash acquired (approximately $8.1 billion), primarily due to the Jarden Acquisition, partially offset by the cash impact of the 2015 deconsolidation of the Venezuelan operations (approximately $98 million). We estimate the capital expenditure to fluctuate between 2.5% to 2.7% of the total revenues over the next five years.
WACC Calculations
Risk-free Rate - To determine the risk-free rate, we used the 30-year Treasure Bond yield, which stood at 3.14%, as of April 2018.
Cost of Debt - To find the cost of debt, we added the company’s default premium to the risk-free rate of 3.14%, which gave us the pre-tax cost of debt at 5.0%.
Beta - A raw Bloomberg Beta of 1.21 was used for our calculations.
Cost of Equity - To determine cost of equity, we used a CAPM model. Our model incorporates a market risk premium of 4.80%, which reflects our expectations of forward-looking market conditions. This resulted in 8.95% cost of equity.
WACC - Our weighted average cost of capital, through a CAPM model, was 6.66%, similar to analysts’ consensus.
DCF/EP Models
Our model assumes a 2% terminal growth rate for NOPLAT. Our DCF price of $33.50 implies an upside of 23% from the current stock price. This does not account for the anticipated gains from selling brands, as outlined in the company’s transformation plan.
Relative Multiple (P/E)
Our Relative Multiple model revealed an implied value of $22.62. However, this does not factor an adjusted EPS.
Sensitivity Analysis
Sensitivity analysis of our DCF model suggests that the price estimate is highly sensitive to three key metrics: pre-tax cost of debt, CV growth, and market risk premium. We used a pre-tax cost of debt of 5% for our model. If using 4.5% or 5.5% instead, our estimate of the company’s stock price would reach $36.7 or $30.48 respectively.
We used a CV growth rate of 2%. However, with a rate of 2.5% or 3% instead, our estimate of NWL’s stock price would reach $35.64 or $38.38 respectively. In addition, we used a market risk premium of 4.8%. However, with a market risk premium of 5.2%, our estimate would drop to $30.19
KEYS TO MONITOR
We recommend a BUY position for Newell Brands Inc. (NWL) as the company is poised with a strong dividend yield of 3.6%, competitive PE ratio, divestment strategy to focus its operations, strong leadership, and iconic brands. However, we recommend closely monitoring implementation of the company’s transformation plan as well as results of the pending proxy fight as these are major factors in determining the company’s positioning moving forward.
REFERENCES 1. Newell Brands, Inc. SEC filing 10-K, December 31, 2017 2. Factset 3. Newell Brands, Inc. (NWL) Q4 2017 Earnings Call 4. Financial Times – Starboard Value Launches Proxy Fight
at Newell Brands, April 4, 2018 - https://www.ft.com/content/9824dc92-3848-11e8-8eee-e06bde01c544
5. NewellBrands.com - NWL Quarter 3 Results – 11/02/17 http://ir.newellbrands.com/investor-relations/press-releases/press-release-details/2017/Newell-Brands-Announces-Third-Quarter-2017-Results/default.aspx
6. NewellBrands.com - NWL Announces Acceleration of Transformation Plan, Preliminary 2017 Results and Initial 2018 Guidance, January 25, 2018 - http://ir.newellbrands.com/investor-relations/press-releases/press-release-details/2018/Newell-Brands-Announces-Acceleration-of-Transformation-Plan-Preliminary-2017-Results-and-Initial-2018-Guidance/default.aspx

Page 16
7. NewellBrands.com – NWL Confirms Receipt of Starboard Value’s Director Nominations –02/02/2018 - http://ir.newellbrands.com/investor-relations/press-releases/press-release-details/2018/Newell-Brands-Confirms-Receipt-of-Starboard-Values-Director-Nominations/default.aspx
8. Wall Street Journal – Newell Strikes Deal with Icahn to Fend Off Other Activists – March 19, 2018 - https://www.wsj.com/articles/newell-brands-strikes-deal-with-icahn-1521458721
9. Bloomberg – Starboard Proceeds with Proxy Fight at Newell Despite Icahn Deal – April 4, 2018 - https://www.bloomberg.com/news/articles/2018-04-04/starboard-proceeds-with-proxy-fight-at-newell-despite-icahn-deal
10. Consumer Analyst Presentation February 22, 2018 - http://s1.q4cdn.com/122517005/files/doc_presentations/2018/CAGNY_2_22_18_FINAL-FINAL_WEBDECK_v2.pdf
11. Financial Times - Newell Brands Shares Come Unglued as it Looks to Shrink its Footprint – 01/25/18 https://www.ft.com/content/7726ae5e-01ec-11e8-9650-9c0ad2d7c5b5
12. Businesswire – Newell Announces Fourth Quarter https://www.businesswire.com/news/home/20180216005166/en/Newell-Brands-Announces-Fourth-Quarter-Full-Year
13. WSJ – Stanley Black & Decker to Buy Newell’s Tool Unit - https://www.wsj.com/articles/stanley-black-decker-buys-newells-tools-unit-1476270544
14. Camping is Up in the US, Trend Expected to Continue as Millennials Seek the Positive Health Impacts of Time Spent Outdoors - https://www.businesswire.com/ news/home/20170315005391/en/Camping-U.S.-Trend-Expected-Continue-Millennials-Seek
15. WSJ - Maker of Sharpies Drew the Line on Trade Promotions—and Paid in Lost Sales - https://www.wsj.com/articles/maker-of-sharpies-
drew-the-line-on-trade-promotionsand-paid-in-lost-sales-1522065600
16. WSJ – Three Former Newell Directors to Drop Their Proxy Fight - https://www.wsj.com/articles/three-former-newell-directors-to-drop-their-proxy-fight-1521546853
17. WSJ - Starboard Pursuing Proxy Fight at Newell Brands Despite Deal with Icahn - https://www.wsj.com/articles/starboard-pursuing-proxy-fight-at-newell-brands-despite-deal-with-icahn-1522866118
18. Statista – Sale of Leading Adhesive Brands in the US - https://www.statista.com/statistics/258818/sales-of-the-leading-adhesive-brands-in-the-united-states/
IMPORTANT DISCLAIMER Henry Fund reports are created by students enrolled in the Applied Securities Management program at the University of Iowa’s Tippie College of Business. These reports provide potential employers and other interested parties an example of the analytical skills, investment knowledge, and communication abilities of our students. Henry Fund analysts are not registered investment advisors, brokers or officially licensed financial professionals. The investment opinion contained in this report does not represent an offer or solicitation to buy or sell any of the aforementioned securities. Unless otherwise noted, facts and figures included in this report are from publicly available sources. This report is not a complete compilation of data, and its accuracy is not guaranteed. From time to time, the University of Iowa, its faculty, staff, students, or the Henry Fund may hold an investment position in the companies mentioned in this report.

Newell Brands IncRevenue Decomposition
Fiscal Years Ending Dec. 31 2015 2016 2017 2018E 2019E 2020E 2021E 2022ENet Sales by Major Product Grouping (millions)Live 1,416.50 4,575.10 5,553.50 5497.97 5607.92 5734.10 5877.46 6039.09Learn 1,792.90 2,539.40 2,773.90 2773.90 2822.44 2878.89 2943.67 3009.90Work 1,186.40 2,369.20 2,794.80 2766.85 2836.02 2906.92 2979.60 3054.09Play 293.5 1871.1 2,583.90 2661.42 2747.91 2844.09 2950.74 3068.77Other 1,226.40 1,909.20 1,036.10 1036.10 1036.10 1036.10 1036.10 1036.10Total 5,915.70 13,264.00 14,742.20 14,736.23 15,050.40 15,400.11 15,787.56 16,207.94
Net Sales Growth %Live 222.99% 21.39% -1.00% 2.00% 2.25% 2.50% 2.75%Learn 41.64% 9.23% -10.00% 15.00% 5.25% 5.50% 5.75%Work 99.70% 17.96% -1.00% 2.50% 2.50% 2.50% 2.50%Play 537.51% 38.10% 3.00% 3.25% 3.50% 3.75% 4.00%Other 55.68% -45.73% 0.00% 0.00% 0.00% 0.00% 0.00%Total 124.22% 11.14% -0.04% 2.13% 2.32% 2.52% 2.66%
Net sales, % of TotalLive 23.94% 34.49% 37.67% 37.31% 37.26% 37.23% 37.23% 37.26%Learn 30.31% 19.15% 18.82% 18.82% 18.75% 18.69% 18.65% 18.57%Work 20.06% 17.86% 18.96% 18.78% 18.84% 18.88% 18.87% 18.84%Play 4.96% 14.11% 17.53% 18.06% 18.26% 18.47% 18.69% 18.93%Other 20.73% 14.39% 7.03% 7.03% 6.88% 6.73% 6.56% 6.39%Total 100.00% 100.00% 100.00% 100.00% 100.00% 100.00% 100.00% 100.00%
Net Sales, GeographicalUnited States 4,291.80 9,518.40 10,444.80 10462.73 10685.79 10934.08 11209.17 11507.64Canada 249.8 720.1 850.8 884.17 903.02 847.01 789.38 1053.52
North America 4,541.60 10,238.50 11,295.60 11,346.90 11,588.81 11,781.08 11,998.55 12,561.16Europe, Middle East, and Africa 591.1 1,659.00 1,833.80 1842.03 1918.93 2002.01 2091.85 2147.55Latin America 408.5 643.6 771.4 773.65 790.15 847.01 907.78 850.92Asia Pacific 374.5 722.9 841.4 773.65 752.52 770.01 789.38 648.32
Total International 1,374.10 3,025.50 3,446.60 3389.33 3461.59 3619.03 3789.02 3646.79Total Net Sales 5,915.70 13,264.00 14,742.20 14736.23 15050.40 15400.11 15787.56 16207.94
Net Sales, % of TotalNorth America 76.77% 77.19% 76.62% 77.00% 77.00% 76.50% 76.00% 77.50%Europe, Middle East, and Africa 9.99% 12.51% 12.44% 12.50% 12.75% 13.00% 13.25% 13.25%Latin America 6.91% 4.85% 5.23% 5.25% 5.25% 5.50% 5.75% 5.25%Asia Pacific 6.33% 5.45% 5.71% 5.25% 5.00% 5.00% 5.00% 4.00%Total Net Sales 100.00% 100.00% 100.00% 100.00% 100.00% 100.00% 100.00% 100.00%

Newell Brands IncIncome Statement(millions)Fiscal Years Ending Dec. 31 2015 2016 2017 2018E 2019E 2020E 2021E 2022ENet sales 5915.7 13264.0 14742.2 14736.23 15050.40 15400.11 15787.56 16207.94
Cost of Goods Sold 3439.5 8428.0 9652.9 9431.19 9481.75 9702.07 9946.16 10211.01Depreciation and Amortization (incl. in COGS) 171.6 437.2 635.6 647.36 653.60 668.82 680.89 716.09
Gross Profit 2476.2 4836.0 5089.3 5305.0 5568.6 5698.0 5841.4 5996.9SG&A Expense 1573.9 3221.1 3669.1 3241.97 3311.09 3388.02 3473.26 3565.75Pension Settlement Charge (gain) 52.1 2.7 (2.4) - - - - -Restructuring costs, Net 77.2 74.9 111.9 200.0 200.0 200.0 200.0 200.0Impairment of Goodwill, Intangibles and other Assets - - 85.0 - - - - -
Operating Income 825.1 1540.0 1225.7 1863.1 2057.6 2110.0 2168.1 2231.2Non-operating Expenses:
Interest Expense, Net 79.9 404.5 468.9 527.62 611.22 591.80 587.33 569.04Loss on Extinguishment of Debt - 47.6 32.3 - - - - -Other expense (income), net 184.0 (166.5) (704.5) - - - - -Income before taxes 561.2 1254.4 1429.0 1335.5 1446.3 1518.2 1580.8 1662.2Income tax expense (benefit) 78.2 286.0 (1319.8) 267.09 289.27 303.64 316.16 332.43Income from continuing operations 483.0 968.4 2748.8 1068.4 1157.1 1214.6 1264.6 1329.7Income (loss) from discontinued operations, net of tax 90.7 (0.7) - - - - - -
Net Income 573.7 967.7 2748.8 1068.4 1157.1 1214.6 1264.6 1329.79.70% 7.30% 18.65% 7.25% 7.69% 7.89% 8.01% 8.20%
Weighted Average Shares Outstanding (Basic) 269.3 421.3 486.7 488 490 491 492 494Basic Earnings Per Share 1.30 1.25 5.65 2.19 2.36 2.47 2.57 2.69Dividends Per Share 0.76 0.76 0.88 0.88 0.88 0.88 0.88 0.92Basic EPS Growth -2.46% 56.44% 15.52% 0.31% 0.29% 0.29% 0.29% 0.28%

Newell Brands IncBalance Sheet
Fiscal Years Ending Dec. 31 2015 2016 2017 2018E 2019E 2020E 2021E 2022EAssets
Cash & Cash Equivalents 274.8 587.5 485.7 205.60 172.70 437.43 430.76 455.14Accounts Receivable, Net 1250.7 2746.9 2674.0 2947.25 3010.08 3080.02 3157.51 3241.59Inventories, Net 721.8 2116.0 2498.8 2431.48 2483.32 2541.02 2604.95 2674.31Prepaid Expenses and Other 147.8 288.4 415.5 367.97 376.26 385.00 394.69 405.20Assets Held for Sale 98.4 1745.7 4.0 0.00 0.00 0.00 0.00 0.00
Total Current Assets 2493.5 7484.5 6078.0 5952.3 6042.4 6443.5 6587.9 6776.2PPE, Gross 2114.7 3216 3643.2 4048.2 4448.2 4848.2 5248.2 5648.2Depreciation 1515.5 1672.6 1935.7 2227.2 2530.8 2842.1 3157.3 3498.4
Property, Plant, & Equipment, Net 599.2 1543.4 1707.5 1821.0 1917.4 2006.1 2090.9 2149.8Goodwill 2791.2 10218.9 10560.1 10560.1 10560.1 10560.1 10560.1 10560.1Intangible assets, net 1063.7 14111.8 14236.0 13999.4 14297.9 14630.1 14998.2 15397.5Deferred Tax Assets 38.5 95.3 151.2 117.6 120.4 123.2 126.3 129.7Other Assets 273.4 383.6 402.7 368.4 376.3 385.0 394.7 405.2
Total Assets 7259.5 33837.5 33135.5 32818.9 33314.4 34147.9 34758.1 35418.5
LiabilitiesST Debt & Curr Portion LT Debt 388.8 601.9 662.8 671.7 654.5 664.9 676.1 687.4Accounts Payable 642.4 1518.9 1761.6 1621.0 1655.5 1694.0 1736.6 1782.9Income Tax Payable 67.4 64.9 217.6 133.5 144.6 151.8 158.1 166.2Other Current Liabilities 890.0 2106.3 1674.8 1768.3 1806.0 1848.0 1894.5 1945.0
Total Current Liabilities 1988.6 4292.0 4316.8 4194.5 4260.8 4358.8 4465.3 4581.5Long-term debt 2669.1 11290.9 9889.6 11552.6 11181.6 11081.8 10704.7 10311.2Deferred income taxes 226.6 5082.8 3307.0 801.3 867.8 910.9 948.5 997.3Other Liabilities 548.8 1787.4 1440.8 1473.6 1505.0 1540.0 1578.8 1620.8
Total Liabilities 5433.1 22453.1 18954.2 18022.1 17815.2 17891.5 17697.2 17510.8Stockholders' Equity
Common stock 1088.90 10649.00 10870.10 10876.5 10882.9 10889.3 10895.7 10902.1Treasury stock, at cost (523.10) (545.30) (573.50) (603.1) (633.3) (665.0) (698.2) (733.1)Retained earnings 2090.90 2289.90 4611.20 5249.96 5976.16 6758.61 7589.89 8465.27AOCI (loss) (833.80) (1044.80) (763.10) (763.10) (763.10) (763.10) (763.10) (763.10)
Equity attributable to parent 1822.9 11348.8 14144.7 14760.2 15462.7 16219.9 17024.3 17871.2Equity attributable to noncontrolling interests 3.5 35.6 36.6 36.60 36.60 36.60 36.60 36.60Total Stockholders' Equity 1826.4 11384.4 14181.3 14796.8 15499.3 16256.5 17060.9 17907.8Total Liabilities & Equity 7259.5 33837.5 33135.5 32818.9 33314.4 34147.9 34758.1 35418.5

Newell Brands IncCash Flow Statement(millions)Fiscal Years Ending Dec. 31 2018E 2019E 2020E 2021E 2022E
Operating ActivitiesNet Income 1068.36 1157.08 1214.57 1264.64 1329.72 Depreciation and Amortization 647.36 653.60 668.82 680.89 716.09 Accounts Receivable, Net (A) (273.25) (62.83) (69.94) (77.49) (84.08)Inventories, Net (A) 67.32 (51.84) (57.70) (63.93) (69.36)Prepaid Expenses and Other (A) 47.53 (8.29) (8.74) (9.69) (10.51)Assets Held for Sale (A) 4.00 0.00 0.00 0.00 0.00 Deferred Tax Assets (A) 33.56 (2.76) (2.80) (3.10) (3.36)Other Assets (A) 34.29 (7.85) (8.74) (9.69) (10.51)Accounts Payable (L) (140.61) 34.56 38.47 42.62 46.24Income Tax Payable (L) (84.05) 11.09 7.19 6.26 8.14Other Current Liabilities (L) 93.55 37.70 41.96 46.49 50.45Deferred income taxes (L) (2505.73) 66.54 43.12 37.55 48.81Other Liabilities (L) 32.82 31.42 34.97 38.75 42.04Net Cash Flow from Operating Cash Flow (974.85) 1858.40 1901.18 1953.30 2063.66
Investing ActivitiesGoodwill (A) 0.00 0.00 0.00 0.00 0.00Intangible assets, net (A) 236.58 (298.46) (332.22) (368.08) (399.36)Change in Gross PPE (A) (760.90) (749.99) (757.45) (765.75) (774.95)Net Cash Flow from Investing Activities (524.32) (1048.45) (1089.67) (1133.83) (1174.32)
Financing ActivitiesDividends Paid (429.61) (430.87) (432.12) (433.36) (454.34)ST Debt & Curr Portion LT Debt (L) 8.87 (17.14) 10.38 11.18 11.33Long-term debt (L) 1663.04 (371.09) (99.77) (377.11) (393.45)Common stock (E) 6.40 6.40 6.40 6.40 6.40Treasury stock, at cost (E) (29.63) (30.16) (31.66) (33.25) (34.91)AOCI (loss) 0.00 0.00 0.00 0.00 0.00Net Cash Flow from Financing Activities 1219.07 (842.86) (546.78) (826.14) (864.96)
Exchange Rate Effect
Net Change in Cash Flow -280.1 -32.9 264.7 -6.7 24.4Beginning of Year Cash 485.7 205.6 172.7 437.4 430.8End of Year Cash 205.6 172.7 437.4 430.8 455.1

Newell Brands IncCommon Size Income Statement
Fiscal Years Ending Dec. 31 2015 2016 2017 2018E 2019E 2020E 2021E 2022ENet sales 100.00% 100.00% 100.00% 100.00% 100.00% 100.00% 100.00% 100.00%
Cost of Goods Sold 58.14% 63.54% 65.48% 64.00% 63.00% 63.00% 63.00% 63.00%Depreciation and Amortization 2.90% 3.30% 4.31% 4.39% 4.34% 4.34% 4.31% 4.42%
Gross Profit 41.86% 36.46% 34.52% 36.00% 37.00% 37.00% 37.00% 37.00%SG&A Expense 26.61% 24.28% 24.89% 22.00% 22.00% 22.00% 22.00% 22.00%Pension Settlement Charge (gain) 0.88% 0.02% -0.02% - - - - -Restructuring costs, Net 1.31% 0.56% 0.76% 1.36% 1.33% 1.30% 1.27% 1.23%Impairment of Goodwill, Intangibles and other Assets - - 0.58% - - - - -
Operating Income 13.95% 11.61% 8.31% 12.64% 13.67% 13.70% 13.73% 13.77%Non-operating Expenses: 0.00% 0.00% 0.00% 0.00% 0.00% 0.00% 0.00% 0.00%
Interest Expense, Net 1.35% 3.05% 3.18% 3.58% 4.06% 3.84% 3.72% 3.51%Loss on Extinguishment of Debt - 0.36% 0.22% - - - - -Other expense (income), net 3.11% -1.26% -4.78% - - - - -Income before taxes 9.49% 9.46% 9.69% 9.06% 9.61% 9.86% 10.01% 10.26%Income tax expense (benefit) 1.32% 2.16% -8.95% 1.81% 1.92% 1.97% 2.00% 2.05%Income from continuing operations 8.16% 7.30% 18.65% 7.25% 7.69% 7.89% 8.01% 8.20%Income (loss) from discontinued operations, net of tax 1.53% -0.01% - - - - - -
Net Income 9.70% 7.30% 18.65% 7.25% 7.69% 7.89% 8.01% 8.20%

Newell Brands IncCommon Size Balance Sheet
Fiscal Years Ending Dec. 31 2015 2016 2017 2018E 2019E 2020E 2021E 2022E
AssetsCash & Cash Equivalents 4.65% 4.43% 3.29% 1.40% 1.15% 2.84% 2.73% 2.81%
Accounts Receivable, Net 21.14% 20.71% 18.14% 20.00% 20.00% 20.00% 20.00% 20.00%
Inventories, Net 12.20% 15.95% 16.95% 16.50% 16.50% 16.50% 16.50% 16.50%
Prepaid Expenses and Other 2.50% 2.17% 2.82% 2.50% 2.50% 2.50% 2.50% 2.50%
Assets Held for Sale 1.66% 13.16% 0.03% 0.00% 0.00% 0.00% 0.00% 0.00%
Total Current Assets 42.15% 56.43% 41.23% 40.39% 40.15% 41.84% 41.73% 41.81%
Property, Plant, & Equipment, Net 10.13% 11.64% 11.58% 12.36% 12.74% 13.03% 13.24% 13.26%
Goodwill 47.18% 77.04% 71.63% 71.66% 70.16% 68.57% 66.89% 65.15%
Intangible assets, net 17.98% 106.39% 96.57% 95.00% 95.00% 95.00% 95.00% 95.00%
Deferred Tax Assets 0.65% 0.72% 1.03% 0.80% 0.80% 0.80% 0.80% 0.80%
Other Assets 4.62% 2.89% 2.73% 2.50% 2.50% 2.50% 2.50% 2.50%
Total Assets 122.72% 255.11% 224.77% 222.71% 221.35% 221.74% 220.16% 218.53%
LiabilitiesST Debt & Curr Portion LT Debt 6.57% 4.54% 4.50% 4.56% 4.35% 4.32% 4.28% 4.24%
Accounts Payable 10.86% 11.45% 11.95% 11.00% 11.00% 11.00% 11.00% 11.00%
Income Tax Payable 1.14% 0.49% 1.48% 0.91% 0.96% 0.99% 1.00% 1.03%
Other Current Liabilities 15.04% 15.88% 11.36% 12.00% 12.00% 12.00% 12.00% 12.00%
Total Current Liabilities 33.62% 32.36% 29.28% 28.46% 28.31% 28.30% 28.28% 28.27%
Long-term debt 45.12% 85.12% 67.08% 78.40% 74.29% 71.96% 67.80% 63.62%
Deferred income taxes 3.83% 38.32% 22.43% 5.44% 5.77% 5.92% 6.01% 6.15%
Other Liabilities 9.28% 13.48% 9.77% 10.00% 10.00% 10.00% 10.00% 10.00%
Total Liabilities 91.84% 169.28% 128.57% 122.30% 118.37% 116.18% 112.10% 108.04%
Stockholders' EquityCommon stock 18.41% 80.28% 73.73% 73.81% 72.31% 70.71% 69.01% 67.26%
Treasury stock, at cost -8.84% -4.11% -3.89% -4.09% -4.21% -4.32% -4.42% -4.52%
Retained earnings 35.34% 17.26% 31.28% 35.63% 39.71% 43.89% 48.08% 52.23%
Accumulated other comprehensive income (loss) -14.09% -7.88% -5.18% -5.18% -5.07% -4.96% -4.83% -4.71%
Stockholders' equity attributable to parent 30.81% 85.56% 95.95% 100.16% 102.74% 105.32% 107.83% 110.26%
Stockholders' equity attributable to noncontrolling interests0.06% 0.27% 0.25% 0.25% 0.24% 0.24% 0.23% 0.23%
Total Stockholders' Equity 30.87% 85.83% 96.20% 100.41% 102.98% 105.56% 108.07% 110.49%
Total Liabilities & Equity 122.72% 255.11% 224.77% 222.71% 221.35% 221.74% 220.16% 218.53%

Newell Brands IncValue Driver Estimation
Fiscal Years Ending Dec. 31 2015 2016 2017 2018E 2019E 2020E 2021E 2022ENOPLAT CalculationOperating Revenues 5915.7 13264.0 14742.2 14736.2 15050.4 15400.1 15787.6 16207.9
Less COGS 3439.5 8428.0 9652.9 9431.2 9481.8 9702.1 9946.2 10211.0Less Depreciation and Amortization 171.6 437.2 635.6 647.4 653.6 668.8 680.9 716.1Less SG&A 1573.9 3221.1 3669.1 3242.0 3311.1 3388.0 3473.3 3565.7Plus Implied Interest (6%) on Operating Leases 14.8 43.1 44.3 45.0 45.0 45.0 45.0 45.0
EBITA 917.1 1658.0 1464.5 2108.1 2302.6 2355.0 2413.1 2476.2Adjusted for TaxesTotal Income Tax Provision/Expense 78.2 286.0 1319.8 267.1 289.3 303.6 316.2 332.4
Plus Tax Shield on Interest Expense 30.0 151.7 175.8 197.9 229.2 221.9 220.3 213.4Plus Tax Shield on Lease Interest 5.6 16.2 16.6 16.9 16.9 16.9 16.9 16.9Plus Tax Shield on Loss on Extinguishment of Debt 0.0 17.9 12.1 0.0 0.0 0.0 0.0 0.0Plus Tax Shield on Pension Settlement 19.5 1.0 -0.9 0.0 0.0 0.0 0.0 0.0Plus Tax Shield on Goodwill Impairment 0.0 0.0 31.9 0.0 0.0 0.0 0.0 0.0Plus Tax Shield on Other Operating Loss 69.0 -62.4 -264.2 0.0 0.0 0.0 0.0 0.0
Less Total Adjusted Taxes 202.3 410.3 1291.1 481.8 535.3 542.4 553.3 562.7Plus Change in Deferred Taxes Liability 6.2 4856.2 -1775.8 -2472.2 63.8 40.3 34.5 45.4NOPLAT 721.1 6103.9 -1602.5 -845.9 1831.0 1852.9 1894.3 1958.9Invested Capital Calculation
Normal Cash (Sales * 2%) 118.3 265.3 294.8 294.7 301.0 308.0 315.8 324.2Plus Accounts Receivable 1250.7 2746.9 2674.0 2947.2 3010.1 3080.0 3157.5 3241.6Plus Inventory (Programming Rights) 721.8 2116.0 2498.8 2431.5 2483.3 2541.0 2604.9 2674.3Plus Prepaid Expenses and Other 147.8 288.4 415.5 368.0 376.3 385.0 394.7 405.2
Non-Interest Bearing Operating Current Assets 2238.6 5416.6 5883.1 6041.4 6170.7 6314.0 6472.9 6645.3Less Accounts payable 642.4 1518.9 1761.6 1621.0 1655.5 1694.0 1736.6 1782.9Less Income Tax Payable 67.4 64.9 217.6 133.5 144.6 151.8 158.1 166.2Less Other Current Liabilities 890.0 2106.3 1674.8 1768.3 1806.0 1848.0 1894.5 1945.0
Non Interest-Bearing Operating Current Liabilities 1599.8 3690.1 3654.0 3522.9 3606.2 3693.8 3789.2 3894.0Net Operating Working Capital (NIBOCA-NIBOCL) 638.8 1726.5 2229.1 2518.5 2564.4 2620.2 2683.7 2751.2Plus Net PPE (Gross PPE - Accumulated Depreciation) 599.2 1543.4 1707.5 1821.0 1917.4 2006.1 2090.9 2149.8
Plus PV of Operating Leases 296.7 862.1 885.5 944.4 994.4 1040.4 1084.4 1114.9Intangible assets, net 1063.7 14111.8 14236.0 13999.4 14297.9 14630.1 14998.2 15397.5Other Operating Assets 273.4 383.6 402.7 368.4 376.3 385.0 394.7 405.2
Plus Net Other Operating Assets 2233.0 16900.9 17231.7 17133.3 17586.0 18061.5 18568.2 19067.4Less Other Operating Liabilities 548.8 1787.4 1440.8 1473.6 1505.0 1540.0 1578.8 1620.8Invested Capital 2922.2 18383.4 19727.6 19999.2 20562.8 21147.8 21764.0 22347.6WACC 9.00% 9.00% 9.00% 6.66% 6.66% 6.66% 6.66% 6.66%NOPLAT 721.1 6103.9 -1602.5 -845.9 1831.0 1852.9 1894.3 1958.9Beg Invested Capital 2779.4 2922.2 18383.4 19727.6 19999.2 20562.8 21147.8 21764.0Change in IC 142.8 15461.1 1344.2 271.7 563.5 585.0 616.3 583.6Ending Invested Capital 2922.2 18383.4 19727.6 19999.2 20562.8 21147.8 21764.0 22347.6ROIC (NOPLAT/Beg IC) 25.94% 208.88% -8.72% -4.29% 9.16% 9.01% 8.96% 9.00%FCF (NOPLAT - Change in IC) 578.3 -9357.2 -2946.6 -1117.6 1267.4 1267.9 1278.1 1375.3EP (Beg IC * (ROIC-WACC)) 470.9 5840.9 -3257.0 -2159.0 499.9 484.3 486.7 510.4

Newell Brands IncKey Management Ratios
Fiscal Years Ending 2015 2016 2017 2018E 2019E 2020E 2021E 2022E
Liquidity RatiosCurrent Ratio (CA/CL) 1.25 1.74 1.41 1.42 1.42 1.48 1.48 1.48Quick Ratio (Cash+AR)/CL 0.77 0.78 0.73 0.75 0.75 0.81 0.80 0.81Cash Ratio (Cash+Cash Equiv)/CL 0.14 0.14 0.11 0.05 0.04 0.10 0.10 0.10
Activity or Asset-Management RatiosAsset Turnover (Rev/Avg Total Assets) 0.81 0.39 0.44 0.45 0.45 0.45 0.45 0.46Receivables Turnover (Rev/Avg Accts Recvable) 4.73 4.83 5.51 5.00 5.00 5.00 5.00 5.00
Financial Leverage RatiosDebt to Assets (Debt/Assets) 0.75 0.66 0.57 0.55 0.53 0.52 0.51 0.49Debt to Equity (Debt/Equity) 2.97 1.97 1.34 1.22 1.15 1.10 1.04 0.98Equity Ratio (Total Equity/Total Assets) 0.25 0.34 0.43 0.45 0.47 0.48 0.49 0.51Interest Coverage (EBITDA/Interest Expense) 28.82 5.82 5.15 4.69 0.00 0.00 0.00 0.00
Profitability RatiosGross Margin (Rev-COGS -SG&A)/Rev 0.15 0.12 0.10 0.14 0.15 0.15 0.15 0.15Net Profit Margin (NI/Rev) 0.10 0.07 0.19 0.07 0.08 0.08 0.08 0.08PreTax Margin (EBIT/Rev) 0.13 0.09 0.06 0.10 0.11 0.11 0.11 0.11Return on Assets (NI/Total Assets) 0.08 0.03 0.08 0.03 0.03 0.04 0.04 0.04Return on Equity (NI/Shareholders Equity) 0.31 0.09 0.19 0.07 0.07 0.07 0.07 0.07
Payout Policy RatiosDividend Payout Ratio (Dividends/NI) 0.58 0.61 0.16 0.60 0.60 0.60 0.60 0.60

Newell Brands IncWeighted Average Cost of Capital (WACC) Estimation
Risk Free Rate (30-yr T-Note) 3.14%Market Risk Premium 4.80%Beta 1.21Cost of Equity Re = (Risk Free + (Beta*Risk Premium)) 8.95%Pre-tax Cost of Debt Rd 5.00%Marginal Tax Rate 20%After Tax Cost of Debt (Cost of Debt*(1-Marg Tax Rate)) 4.00%
WACC Calculation (2018)Total Shares Outstanding 486.70Price 27.23Market Value of Equity (E) 13252.84
PV of Operating Leases 885.52Short Term Debt 662.80Long Term Debt 9,889.60Total Value of Debt (D) 11437.92
Total Value of the Firm (D + E = V) 24690.76
Cost of Equity 8.95%* (E/V) 53.68%+After Tax Cost of Debt 4.00%*(D/V) 46.32% = WACC 6.66%
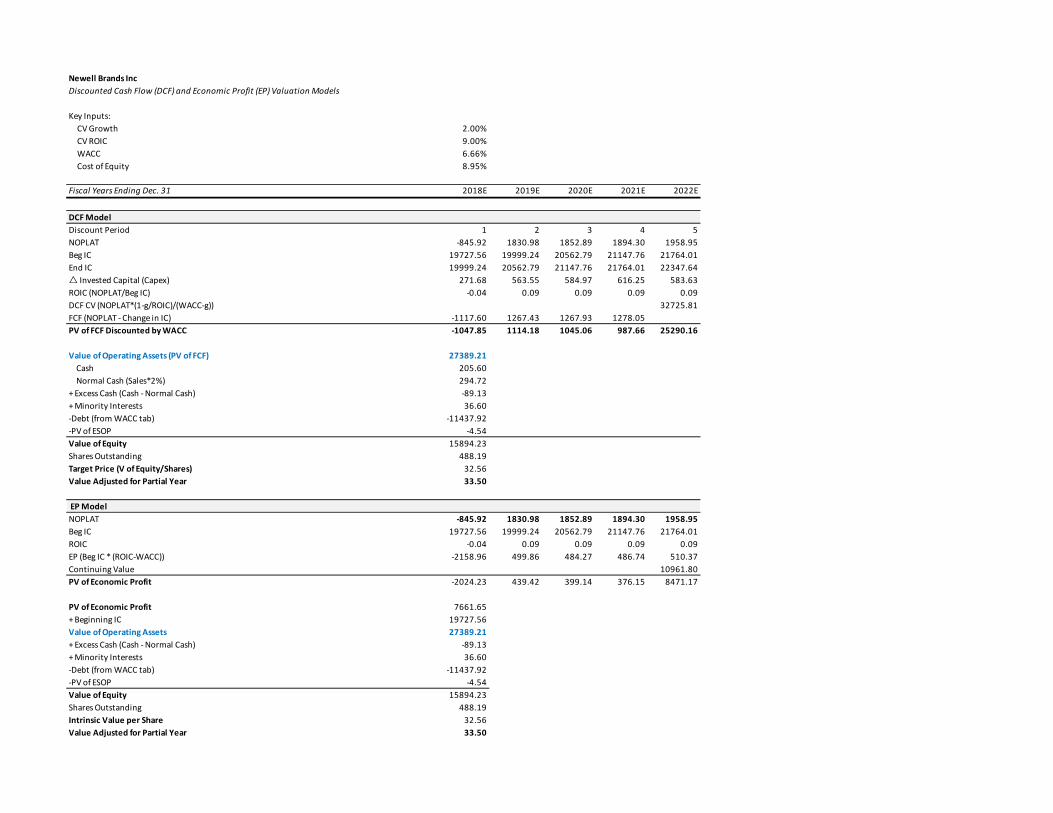
Newell Brands IncDiscounted Cash Flow (DCF) and Economic Profit (EP) Valuation Models
Key Inputs: CV Growth 2.00% CV ROIC 9.00% WACC 6.66% Cost of Equity 8.95%
Fiscal Years Ending Dec. 31 2018E 2019E 2020E 2021E 2022E
DCF ModelDiscount Period 1 2 3 4 5NOPLAT -845.92 1830.98 1852.89 1894.30 1958.95Beg IC 19727.56 19999.24 20562.79 21147.76 21764.01End IC 19999.24 20562.79 21147.76 21764.01 22347.64�� Invested Capital (Capex) 271.68 563.55 584.97 616.25 583.63ROIC (NOPLAT/Beg IC) -0.04 0.09 0.09 0.09 0.09DCF CV (NOPLAT*(1-g/ROIC)/(WACC-g)) 32725.81FCF (NOPLAT - Change in IC) -1117.60 1267.43 1267.93 1278.05PV of FCF Discounted by WACC -1047.85 1114.18 1045.06 987.66 25290.16
Value of Operating Assets (PV of FCF) 27389.21Cash 205.60Normal Cash (Sales*2%) 294.72
+ Excess Cash (Cash - Normal Cash) -89.13+ Minority Interests 36.60-Debt (from WACC tab) -11437.92-PV of ESOP -4.54Value of Equity 15894.23Shares Outstanding 488.19Target Price (V of Equity/Shares) 32.56Value Adjusted for Partial Year 33.50
EP Model NOPLAT -845.92 1830.98 1852.89 1894.30 1958.95Beg IC 19727.56 19999.24 20562.79 21147.76 21764.01ROIC -0.04 0.09 0.09 0.09 0.09EP (Beg IC * (ROIC-WACC)) -2158.96 499.86 484.27 486.74 510.37Continuing Value 10961.80PV of Economic Profit -2024.23 439.42 399.14 376.15 8471.17
PV of Economic Profit 7661.65+ Beginning IC 19727.56Value of Operating Assets 27389.21+ Excess Cash (Cash - Normal Cash) -89.13+ Minority Interests 36.60-Debt (from WACC tab) -11437.92-PV of ESOP -4.54Value of Equity 15894.23Shares Outstanding 488.19Intrinsic Value per Share 32.56Value Adjusted for Partial Year 33.50

Newell Brand CoDividend Discount Model (DDM) or Fundamental P/E Valuation Model
#NAME? 2018E 2019E 2020E 2021E 2022E
1 2 3 4 5
EPS 2.19 2.36 2.47 2.57 2.69
Key Assumptions CV growth 2%
CV ROE 7.43%
Cost of Equity 8.95%
Future Cash Flows P/E Multiple (CV Year)
EPS (CV Year) 2.69$
Future Stock Price 28.32
Dividends Per Share 0.88 0.88 0.88 0.88
Discounted Cash Flows 0.81 0.74 0.68 0.62 20.10
Intrinsic Value 22.14$
Intrinsic Share (Today) 22.62$

Newell Brands IncRelative Valuation Models
EPS EPS Est. 5yrTicker Company Price 2018E 2019E P/E 18 P/E 19 EPS gr. PEG 16 PEG 17
ACCO ACCO Brands Corp $12.85 $1.35 $1.45 9.5 8.9 10.0 0.95 0.89 TUP Tupperware Brands Corp $47.34 $5.15 $5.50 9.2 8.6 11.0 0.84 0.78 ACU Acme United Corp $22.10 $1.00 $1.20 22.1 18.4 10.0 2.21 1.84 CHD Church & Dwight Co $49.50 $2.26 $2.45 21.9 20.2 9.14 2.40 2.21 CL Colgate-Palmolive $72.14 $3.18 $3.44 22.7 21.0 8.36 2.71 2.51 PG Procter & Gamble Co $78.43 $4.18 $4.22 18.8 18.6 7.6 2.46 2.44
Average 17.4 15.9 1.9 1.8
NWL Newell Brand and Co $27.23 $2.47 $2.69 11.0 10.1 6.9 1.6 1.5
Implied Value: Relative P/E (EPS18) $ 42.94 Relative P/E (EPS19) 42.92$ PEG Ratio (EPS18) 33.04$ PEG Ratio (EPS19) 33.17$

Present Value of Operating Lease Obligations (2017) Present Value of Operating Lease Obligations (2016) Present Value of Operating Lease Obligations (2015)(in millions)
Operating Operating OperatingFiscal Years Ending Dec. 31 Leases Fiscal Years Ending Dec. 31 Leases Fiscal Years Ending Leases2018 215.4 2017 219.1 2016 97.22019 178.8 2018 189.4 2017 75.92020 140.1 2019 150.8 2018 57.62021 114 2020 113.8 2019 40.12022 95.3 2021 91.4 2020 27.5Thereafter 324.7 Thereafter 260.8 Thereafter 42.1Total Minimum Payments 1068.3 Total Minimum Payments 1025.3 Total Minimum Payments 340.4Less: Interest 183 Less: Interest 163 Less: Interest 44PV of Minimum Payments 886 PV of Minimum Payments 862 PV of Minimum Payments 297
Capitalization of Operating Leases Capitalization of Operating Leases Capitalization of Operating Leases
Pre-Tax Cost of Debt 5.00% Pre-Tax Cost of Debt 5.00% Pre-Tax Cost of Debt 5.00%Number Years Implied by Year 6 Payment 3.4 Number Years Implied by Year 6 Payment 2.9 Number Years Implied by Year 6 Payment 1.5
Lease PV Lease Lease PV Lease Lease PV LeaseYear Commitment Payment Year Commitment Payment Year Commitment Payment1 215.4 205.1 1 219.1 208.7 1 97.2 92.62 178.8 162.2 2 189.4 171.8 2 75.9 68.83 140.1 121.0 3 150.8 130.3 3 57.6 49.84 114 93.8 4 113.8 93.6 4 40.1 33.05 95.3 74.7 5 91.4 71.6 5 27.5 21.56 & beyond 95.3 228.7 6 & beyond 91.4 186.1 6 & beyond 27.5 31.0PV of Minimum Payments 885.5 PV of Minimum Payments 862.1 PV of Minimum Payments 296.7
Present Value of Operating Lease Obligations (2014) Present Value of Operating Lease Obligations (2013) Present Value of Operating Lease Obligations (2012) Present Value of Operating Lease Obligations (2011)
Operating Operating Operating OperatingFiscal Years Ending Leases Fiscal Years Ending Leases Fiscal Years Ending Leases Fiscal Years Ending Leases2015 105.8 2014 98.2 2013 105.5 2012 110.72016 80.4 2015 86.5 2014 81 2013 77.82017 62.7 2016 71.2 2015 68.9 2014 622018 44.8 2017 50.3 2016 53.3 2015 43.12019 35.5 2018 37.9 2017 44.7 2016 28.2Thereafter 55.1 Thereafter 88.5 Thereafter 103.9 Thereafter 86.4Total Minimum Payments 384.3 Total Minimum Payments 432.6 Total Minimum Payments 457.3 Total Minimum Payments 408.2Less: Interest 51 Less: Interest 64 Less: Interest 70 Less: Interest 60PV of Minimum Payments 333 PV of Minimum Payments 369 PV of Minimum Payments 387 PV of Minimum Payments 348
Capitalization of Operating Leases Capitalization of Operating Leases Capitalization of Operating Leases Capitalization of Operating Leases
Pre-Tax Cost of Debt 5.00% Pre-Tax Cost of Debt 5.00% Pre-Tax Cost of Debt 5.00% Pre-Tax Cost of Debt 5.00%Number Years Implied by Year 6 Payment 1.6 Number Years Implied by Year 6 Payment 2.3 Number Years Implied by Year 6 Payment 2.3 Number Years Implied by Year 6 Payment 3.1
Lease PV Lease Lease PV Lease Lease PV Lease Lease PV LeaseYear Commitment Payment Year Commitment Payment Year Commitment Payment Year Commitment Payment1 105.8 100.8 1 98.2 93.5 1 105.5 100.5 1 110.7 105.42 80.4 72.9 2 86.5 78.5 2 81 73.5 2 77.8 70.63 62.7 54.2 3 71.2 61.5 3 68.9 59.5 3 62 53.64 44.8 36.9 4 50.3 41.4 4 53.3 43.9 4 43.1 35.55 35.5 27.8 5 37.9 29.7 5 44.7 35.0 5 28.2 22.16 & beyond 35.5 40.6 6 & beyond 37.9 64.0 6 & beyond 44.7 75.1 6 & beyond 28.2 61.4PV of Minimum Payments 333.1 PV of Minimum Payments 368.5 PV of Minimum Payments 387.4 PV of Minimum Payments 348.5

Newell Brands IncSensitivity AnalysisTarget Price 33.50
33.50 1.17 1.18 1.19 1.20 1.21 1.22 1.23 1.24 1.253.10% 35.218 34.855 34.496 34.141 33.791 33.444 33.100 32.761 32.4253.11% 35.142 34.780 34.422 34.068 33.718 33.372 33.029 32.690 32.3553.12% 35.066 34.705 34.348 33.995 33.645 33.300 32.958 32.620 32.2863.13% 34.991 34.630 34.274 33.922 33.573 33.229 32.888 32.550 32.2173.14% 34.915 34.556 34.200 33.849 33.501 33.157 32.817 32.481 32.1483.15% 34.840 34.481 34.127 33.776 33.429 33.086 32.747 32.411 32.0793.16% 34.765 34.407 34.053 33.703 33.357 33.015 32.676 32.341 32.0103.17% 34.690 34.333 33.980 33.631 33.286 32.944 32.606 32.272 31.9413.18% 34.615 34.259 33.907 33.559 33.214 32.873 32.536 32.203 31.873
33.50 16.00% 17.00% 18.00% 19.00% 20.00% 21.00% 22.00% 23.00% 24.00%3.20% 51.647 51.595 51.540 51.483 51.423 51.360 51.294 51.225 51.1533.60% 46.342 46.272 46.200 46.125 46.047 45.966 45.883 45.796 45.7064.00% 41.685 41.604 41.520 41.433 41.343 41.251 41.155 41.057 40.9564.40% 37.564 37.475 37.383 37.289 37.192 37.092 36.990 36.884 36.7764.80% 33.891 33.798 33.701 33.603 33.501 33.397 33.290 33.181 33.0695.20% 30.597 30.501 30.402 30.301 30.197 30.091 29.983 29.872 29.7585.60% 27.624 27.527 27.428 27.327 27.223 27.116 27.008 26.896 26.7836.00% 24.929 24.832 24.734 24.633 24.530 24.424 24.317 24.207 24.0946.40% 22.473 22.378 22.281 22.181 22.080 21.976 21.871 21.763 21.653
33.50 3.00% 3.50% 4.00% 4.50% 5.00% 5.50% 6.00% 6.50% 7.00%1.00% 48.750 44.560 40.724 37.197 33.940 30.922 28.115 25.496 23.0441.25% 48.634 44.445 40.611 37.086 33.830 30.814 28.008 25.389 22.9391.50% 48.518 44.331 40.498 36.974 33.721 30.705 27.900 25.283 22.8341.75% 48.402 44.217 40.386 36.863 33.611 30.597 27.793 25.177 22.7292.00% 48.286 44.102 40.273 36.752 33.501 30.488 27.686 25.071 22.6232.25% 48.170 43.988 40.160 36.641 33.391 30.380 27.578 24.964 22.5182.50% 48.054 43.874 40.048 36.530 33.281 30.271 27.471 24.858 22.4132.75% 47.937 43.759 39.935 36.419 33.172 30.162 27.364 24.752 22.3083.00% 47.821 43.645 39.822 36.307 33.062 30.054 27.256 24.646 22.202
33.50 7.90% 8.10% 8.30% 8.50% 8.70% 8.90% 9.10% 9.30% 9.50%1.00% 30.344 30.344 30.344 30.344 30.344 30.344 30.344 30.344 30.3441.25% 31.024 31.024 31.024 31.024 31.024 31.024 31.024 31.024 31.0241.50% 31.770 31.770 31.770 31.770 31.770 31.770 31.770 31.770 31.7701.75% 32.591 32.591 32.591 32.591 32.591 32.591 32.591 32.591 32.5912.00% 33.501 33.501 33.501 33.501 33.501 33.501 33.501 33.501 33.5012.25% 34.514 34.514 34.514 34.514 34.514 34.514 34.514 34.514 34.5142.50% 35.649 35.649 35.649 35.649 35.649 35.649 35.649 35.649 35.6492.75% 36.930 36.930 36.930 36.930 36.930 36.930 36.930 36.930 36.9303.00% 38.385 38.385 38.385 38.385 38.385 38.385 38.385 38.385 38.385
Pre-Tax Cost of Debt
Normal Cash %
Cost of Equity
CV Growth of NOPLAT
Beta
Risk Free Rate
Tax Rate
Market Risk Premium