Network Effects in Internal Migration
31
MŰHELYTANULMÁNYOK DISCUSSION PAPERS INSTITUTE OF ECONOMICS, CENTRE FOR ECONOMIC AND REGIONAL STUDIES, HUNGARIAN ACADEMY OF SCIENCES - BUDAPEST, 2019 MT-DP – 2019/13 Network Effects in Internal Migration LÁSZLÓ LŐRINCZ – BRIGITTA NÉMETH
Transcript of Network Effects in Internal Migration

MŰHELYTANULMÁNYOK DISCUSSION PAPERS
INSTITUTE OF ECONOMICS, CENTRE FOR ECONOMIC AND REGIONAL STUDIES,
HUNGARIAN ACADEMY OF SCIENCES - BUDAPEST, 2019
MT-DP – 2019/13
Network Effects in Internal Migration
LÁSZLÓ LŐRINCZ – BRIGITTA NÉMETH

Discussion papers MT-DP – 2019/13
Institute of Economics, Centre for Economic and Regional Studies,
Hungarian Academy of Sciences
KTI/IE Discussion Papers are circulated to promote discussion and provoque comments.
Any references to discussion papers should clearly state that the paper is preliminary. Materials published in this series may subject to further publication.
Network Effects in Internal Migration
Authors:
László Lőrincz senior research fellow
Institute of Economics, Centre of Economics and Regional Studies, Hungarian Academy of Sciences,
and Corvinus University of Budapest [email protected]
Brigitta Németh junior research fellow
Institute of Economics, Centre of Economics and Regional Studies, Hungarian Academy of Sciences
May 2019

1
Network Effects in Internal Migration
László Lőrincz and Brigitta Németh
Abstract
Previous studies have shown the impact of family, community, and ethnic networks on
migration. Our research focuses on the role of social networks in Hungarian internal
migration. We examine the factors determining out-migration rate from municipalities, and
the factors influencing location choice by analysing migration volumes on the municipality-
municipality level. We measure social network effects by the migration rate of previous years,
and by the intensity of user-user connections on the iWiW online social network
(representing 3.7 million users) between two municipalities. The migration volumes and the
characteristics of the municipalities are included in the analysis based on administrative
data, and the distance between municipalities are indicated by the travel time. We analyse
longitudinal data for the 2000-2014 period, and cross-sectional models for the year 2014.
Based on multilevel and fixed-effect regression models we show that both leaving and
choosing municipalities is associated with network effects: the migration of previous years,
and also the connections on iWiW social network influence the current migration rate, even
after controlling for each other.
JEL: R23
Keywords: chain migration, internal migration, network effects, online social networks,
social networks.
Acknowledgement
The publication was prepared within the Széchenyi 2020 program framework (EFOP-3.6.1-
16-2016-00013) under the European Union project titled: “Institutional developments for
intelligent specialization at the Székesfehérvár Campus of Corvinus University of Budapest”
The research was supported by the Hungarian Research Fund (OTKA K-129124). The authors
thank Balázs Lengyel, Balázs Muraközy and Károly Takács for their comments.

2
Hálózati hatások a hazai migrációban
Lőrincz László és Németh Brigitta
Összefoglaló
A korábbi vizsgálatok elsősorban a nemzetközi vándorlásban mutatták ki a családi, közösségi
és etnikai kapcsolathálók hatását a migrációra. Tanulmányunkban ezt a belföldi migráció
kapcsán elemezzük. Modellünkben a származási települések és a célhely alternatíváinak
infrastrukturális és gazdasági jellemzői mellett a hálózati hatások további push és pull
faktorokként jelennek meg. Az elemzésbe bevontuk a települések jellemzőit a T–STAR-
adatbázis alapján, a települések közti távolságot pedig az útidővel jelöltük. A
kapcsolathálózatok hatását a korábbi évek migrációs rátája, valamint az iWiW-felhasználók
(online közösségi oldal, 3,7 millió felhasználóval) két település közötti kapcsolatainak az
intenzitása alapján mérjük. A longitudinális adataink a 2000–2014 közötti időszakra, a
keresztmetszeti modellek pedig 2014-re vonatkoznak. A statisztikai elemzésekhez többszintű
(multilevel) és fixhatás-modelleket használtunk. Eredményeink azt mutatják, hogy mind az
elvándorlással, mind a letelepedéssel szignifikáns és pozitív összefüggésben vannak a
kapcsolathálózati jellemzők: a korábbi évek vándorlása, és a közösségi hálón fenntartott
kapcsolatok is hatással vannak az aktuális évi vándorlás mértékére, egymás hatására
kontrollálva is.
JEL: R23
Tárgyszavak: láncmigráció, belföldi vándorlás, hálózati hatások, online
kapcsolathálózatok, kapcsolathálózatok.

3
1. INTRODUCTION
Migration and its social and economic antecedents have long been the subject of scientific
thinking. On the individual level the intention to migrate evolves along the individual goals,
preferences, perceived opportunities and constraints. In addition to individual resources and
cost-benefit calculations, family considerations, social contacts, economic, social, political
circumstances and labour market opportunities also influence the realization of the
migration intentions (Blaskó, Gödri 2014).
According to DaVanzo (1981), location-specific capital and information costs also
influence the willingness of an individual to migrate. One of the most apparent functions of
social networks is decreasing these information costs and risks. Additionally, the presence of
family and friendship networks, or even same ethnicity peers increase the attractiveness of
specific destinations for several further reasons. They may help the migrants on the labour
market; provide services, emotional aid and companionship. Accordingly, previous migration
experience in the community influences current out-migration and the location choice of the
migrants (Deléchat 2001).
As migrants maintain some of their relationships after moving, they create new
relationships between their place of origin and their new place of residence. Therefore, a self-
enhancing chain migration can occur between the source and destination areas. However, a
large inflow of migrants over a short period may have a negative impact, as saturation in the
labour market may undermine their position, and lower their wage levels (Beaman 2012;
Boeri et al. 2012). Nevertheless, studies show that previous movements have a positive
impact on subsequent migration (Deléchat 2001; Bauer, Epstein, Gang 2002).
About the migration decision, two elements is often distinguished; the decision to move
or stay, and the decision on the destination (Brown, Moore 1970; Sell, DeJong 1978). While
previous studies usually analyse only one of these, our data provide the opportunity to
examine the effects of networks on both of these decisions. Thus, we first examine, whether
more people will leave municipalities with more outward connections, or with less inward
connections, and that how previous migration contribute to subsequent out-migration.
Second, we analyse the effect of the composition of outward connections, and test, if more
connections between municipalities and higher volume of previous migration predict location
choice.
A difficulty in analysing the role of social networks in migration is to collect the
appropriate data. Previous studies most often use individual surveys about migration
behaviour (Kobrin, Speare Jr 1983; Deléchat 2001; Bauer, Epstein, Gang 2002). In our study
we use detailed administrative data on migration between municipalities, and combine these
with the iWiW Hungarian social network site’s archived database.

4
Although most of current literature’s interest is in international migration, domestic
migration also has its importance. Inadequate internal mobility is often blamed for regional
inequalities on the labour market. During the last three years, employers at the more
developed western regions of Hungary report shortage of skilled and unskilled labour and
consequent excess production capacities (Hajdu, Köllő, Tóth 2018), which was also
supported by our interviews, we carried out in the Central Transdanubia Region in 2017. The
problem of “labour shortage” also often emerged in public discourse (Tóth, Nyírő 2018).
Two main migration patterns emerged in the post-soviet era in Hungary: one is the
suburbanization movement from cities pointing towards agglomeration; the other is the
movement of dismissed urban workers towards the countryside (Brown, Schafft 2002). On
the other hand, after the transition, economic inequalities between regions increased, which
resulted in high unemployment in the north-eastern part of the country, and in small
peripheral municipalities (Fazekas 2002). Empirical studies have shown that labor market
characteristics did not affect migration patterns directly after the transition (Kertesi 1997).
However, in the later years, unemployment and wage differences moderately influenced
migration (Cseres-Gergely 2005). Nevertheless, the equalizing role of migration on regional
differences remained limited in Hungary, similarly to other countries (Hárs 2012).
2. THEORIES AND HYPOTHESES
2.1 PUSH AND PULL FACTORS AND THE TWO PHASE DECISION MODEL
An early and influential approach to understand migration was the push and pull theory of
Ravenstein (1889). His primary statement was that potential migrants are motivated by
available possibilities in the destination area to move there, whilst adverse circumstances at
their current residence urge them to leave. In addition to these two factors, distance also
determines the volume of migration: the majority of migrants move only a short distance.
Dorigo and Tobler (1983) describe push factors as situations, which are resulting in
dissatisfaction with the individual’s actual residence, and pull factors are those that make the
destination area preferable. The distance between the two locations can be given in travel
time, travel cost, social distance, etc. Brown and Moore (1970) describe the process of
migration with two firm phases: (1) a decision to leave the current residence and (2) the
“relocation decision” made between alternatives by their "place utility". This theory
emphasizes the possible differences between the factors influencing the decision to leave and
the factors influencing the choice of the destination (Sell, DeJong 1978).

5
2.1.1 Factors of Moving
The decision on leaving one’s residence needs a trigger; a stress between the needs and
affordances of the household (Brown, Moore 1970). Such a trigger is often the birth of
children in families, which makes current housing space inadequate (Chevan 1971). Life
events associated with migration also include marriage, divorce, completing studies,
retirement or the children separating from parents. The costs of migration are also part of a
human investment. For young people multiple years are available to realize such investment.
Therefore, even lower difference in wages makes moving advantageous for them, so young
people expect higher returns when investing in migration then elders. This difference
explains selective migration without examining sociological differences between young and
elders (Schultz 1961). Other life-cycle specific characteristics could be important as well.
These include status of labour market, income, education, obtained skills and training, age,
sex, and health status (Greenwood 1997).
Another common motivation for migration is to find new employment (Hansen,
Niedomysl 2008). Residential satisfaction and home ownership also influences this decision
(Speare 1974). The consideration of staying at or leaving a given neighbourhood also depends
on the amenities and economic factors. Perceptions of crime and violence, for example
increase out-migration of the middle income families (Droettboom et al. 1971), but civic
community institutions decrease migration (Irwin et al. 2004).
2.1.2 Factors of Location Choice
Sjaastad (1962) developed an economic model of migration, and describes it as a mechanism
aiming equilibrium. He understands migration as an investment decision, and separated
monetary and non-monetary expenses; financial burden belongs to the former, psychological
“expenses” to the latter. The returns of migration are coming from the change of nominal
income, employment chances, consumer opportunities or the combination of these. Distance
is also one of the most important predictors of location choice; it increases monetary costs of
moving, but information costs and uncertainty is also higher for more distant locations.
Moreover, psychic costs also increase when leaving the family and friends at the previous
location (Greenwood 1997).
Clark and Hunter (1992) examined net migration data between counties of the United
States to study the relationship between human capital, public goods and the accessible
services in relation to age-specific migration. They found that work possibilities, tax policies
and services also affecting migration in a life cycle specific manner. Employment possibilities
are mostly important for men in active age, while services are rather important for middle-

6
age men. Fiscal environment is also related to age, for example in older ages they do not
prefer counties with high inheritance and property tax.
2.2 THE ROLE OF SOCIAL NETWORKS IN MIGRATION
2.2.1 Family Networks and Out-migration
From the 1960’s the role of social and family networks was analysed as sociological incentives
and disincentives of migration (Sell and DeJong 1978). For example, Johnston (1971) argues
that presence of local kinship ties prevent migration for two reasons. First, members of a
community network (such as Italian or Jewish communities) need spatial proximity, where
only those migrate, who repudiates the community. Second, family is an important economic
unit, where the tradition of sons succeeding their father in family business (such as crafting
or farming) prevails.
Litwak (1960) proposed an opposing mechanism; that extended family networks can pool
resources better and therefore aid their members with economic, social and psychological
support when leaving the original community. Empirically he finds that among potential
migrants, those with closer family identification were more likely to leave the city.
However, when analysing the number of migrants, the first effect appears to be stronger:
people with more extended family relations are less likely to leave the community,
considering English working class towns (Johnston 1971), or in Rhode Island ethnic
communities (Kobrin, Speare 1983). Dawkins (2006) also finds that presence of relatives and
friends of children impede the out-migration of families from the neighbourhoods.
2.2.2 Chain Migration and Cumulative Causation
In the same period researchers started to observe that immigrants do not randomly settle in
cities. Even within ethnicities, Italian immigrants of certain towns of origin tend to settle
together in American Little Italies. MacDonald and MacDonald (1964) describe three phases
of this chain migration. Their observation that first breadwinners move to the destination
area and their families follow after they found suitable jobs (and living in ethnic quarters)
was also found about the great migration of blacks from the south to the north in the U.S.
(Gottlieb 1987; Grossman 1991).
The significance of social networks about chain migration lies in the fact that during
migration people face many expenses, such as gathering information about how to get a job,
where to live, etc. These valuable pieces of information can be obtained through social
networks, so networks reduce the costs and risks of migration (Massey et al. 1993; Deléchat
2001). In fact, relatives are the natural and most often utilized sources of information about
orientation, housing or finding jobs (Blumberg, Bell 1958; Choldin 1973; Banerjee 1983).

7
Therefore, migration experience occurring in the family or community influences the
decision of an individual whether to stay or move. Accordingly, Deléchat (2001) finds that the
migration experience in the family and the prevalence of migration in the community both
influence the decisions of individuals about migrating from Mexico to the U.S. Similarly,
Bauer, Epstein and Gang (2002) finds significant effect of the stock migration experience of
the sender village on subsequent migration.
In addition to costs associated with risk and information, further factors contribute to the
self-sustaining nature of migration. The cumulative causation approach emphasizes that
every single migratory act modifies the social context, which influences upcoming migratory
decisions, therefore increasing the probability of following migration (Massey et al. 1993). On
the long-term, as migration becomes a means of economic success for families and
individuals, norms regarding the alternatives of staying or migrating can change (Reichert
1982; Massey et al. 1993; Greiner 2011).
In the concern of internal migration, we therefore hypothesize that past migration affects
the probability of subsequent migration:
In those municipalities where out-migration rate was high in previous years, it will be
high in the next year too (H.1).
2.2.3 The Utilities of Networks Influencing Location Choice
Investment in information also explains the effect of networks in destination choices.
According to the human capital approach, migration is an investment with costs and
expected benefits (Bowles 1970)., Gathering information about migration however is also
costly. Consequently, potential migrants would only gather information which they can
obtain easier, and that is about those places where their friends and relatives live (DaVanzo
1981).
The presence of friends and relatives is not only beneficial during the migration process,
but also on the long term. They provide smaller and bigger services, financial aid, emotional
support and companionship to the family members (Wellman, Wortley 1990). This
influences location choices accordingly: closeness of family members is an important factor
when choosing the place of residence. Furthermore, this effect is more pronounced for those
families, which rely more heavily on family members when they need services (Stokenberga
2019).
These two effects of networks can be incorporated in the push-pull model of migration as
non-monetary factors. The first can be phrased as “information hypothesis”, while the second
as “affinity hypothesis” (Haug 2008).

8
Another network factor which influences location choice, is the size of the ethnic group at
the destination area. Substantial ethnic minority can provide “ethnic goods” to the new
arrivals, such as food, clothing, social organizations, religious services, media and marriage
markets (Chiswick, Lee, Miller 2005). Immigrants therefore, tend to move in to location
where similar ethnic minorities are already present; which was shown for example in OECD
countries (Gross, Schmitt 2006), European regions (Nowotny, Pennerstorfer 2011), and for
municipality choice of refugees (Aslund 2000; Damm 2009).
Helping the migrant to find a suitable job at the destination area is a further role of social
networks. Personal networks are especially important for migrants, as they tend to rely on
network referrals more than native workers (Elliott 2001; Patacchini, Zenou 2012). Increased
network size was associated with higher wages and employment probabilities for Mexican
migrants (Munshi 2003). Sudden inflow of immigrants however may increase competition;
thus it may have an adverse impact. Beaman (2012) found that if the size of the ethnic
network increases on a short term job-market outcomes worsen. In contrast, the stock size of
employed immigrants increases the employment chances for the newcomers. Boeri et al.
(2012) found nonlinear effects in Italian cities: the size of the immigrant community was
found to be beneficial for employment prospects, however if migrants exceeded 15-20% of the
local population and lived in segregated neighbourhoods, the effect turned to negative.
As previous migrants create social network connections between the source and the
destination community, every new migrant lowers the cost associated with migration to a
new set of friends and relatives (Massey et al. 1993). These network effects can be integrated
to an economic model of migration: Carrington, Detragiache, and Vishwanath (1996) shows
that the great migration of blacks from the south to the north cannot be properly described
only by the wage differentials based on Sjastaad (1962); but a model with endogenous
moving costs fits better, where previous migration decreases the costs of moving for future
migrant. Bauer, Epstein and Gang (2002) also find a positive effect for the recent flow of
migrants between the two municipalities when analysing Mexican migrants’ US destinations.
They find this being additional to the effect of the stock of migrants at the destination, and to
the effect of the stock migration experience of the sender village. We similarly assume that:
High rate of migration between two municipalities in the previous year predicts high
migration rate in the subsequent year. (H.2)
2.3 ONLINE SOCIAL NETWORKS AND MIGRATION
In the recent decade much of the communication between people occurs on social media
platforms. It was therefore analysed, how these online social networks (OSNs) contribute to
the social capital of users. In addition to making the distinction between „bridging” and

9
„bonding” social capital, Ellison, Steinfield, and Lampe (2007) introduced the category of
maintained social capital. This describes the extent to which individuals keep valuable
connections throughout different phases of life with the aid of social media. Brooks et al.
(2014) reported that information-seeking and friendship-maintenance behaviour is positively
associated with perceived bridging and bonding social capital, while transitivity of the ego-
network affects bonding social capital adversely. Ellison et al. (2014) also found that
friendship-maintenance on Facebook is positively associated with Facebook-related and
general bridging social capital. They found that Facebook activity is positively related to each
of these measures. Valenzuela, Park, and Kee (2009) found that intensity of Facebook use is
in positive correlation with social trust, civic activity and political participation.
We assume that the geographic structure of this social capital influences migration in
similar manner, as offline social networks do:
We hypothesize that more people migrate from municipalities, which have more online
social network connections outside the community (H.3a), and
We assume that fewer people migrate from municipalities with more social network
connections within the community (H.3b).
Social capital provided by OSNs interacts with the migration process at several points.
Social media supports maintaining existing connections, the creation of new ones, and also to
reactivate latent (lost) ties (Hiller, Franz 2004; Dekker, Engbersen 2014). About maintaining
connections, social media offers cheap and easy synchronous communication platform,
therefore also contributes to the feeling of proximity to the community of origin (Dekker,
Engbersen 2014). For international migrants, online communication is a persistent source of
social support (Ye 2006; Chen, Choi 2011). Even in the case of domestic migration, migrants
with broadband internet provided were able to maintain the intensity of their social
connections, while those without internet connection experienced a decrease (Hampton,
Wellman 2001).
For international migrants new or reactivated ties at the destination provide assistance
and information about the migration process, about the settlement, or to find housing and
employment. They also facilitate integration into the new community after moving (Hiller,
Franz 2004; Dekker, Engbersen 2014).
We assume that these benefits also exist in domestic migration. Therefore, our hypothesis
is the following:
From a given municipality people rather tend to migrate to destinations where they
have more contacts on social media. (H.4)
10
3. DATA AND METHODOLOGY
3.1 DATA
Our analysis relies on four databases and refers to the 2000-2014 years. The primary source
of our analysis are the Central Statistical Office's (CSO) domestic migration data files, which
include the source and destination municipalities of every migration acts in Hungary, their
date; information on migrants’ age, gender, and marital status. This database does not
include person IDs, therefore individuals cannot be identified. We accessed the data in the
research room operated by the Centre of Regional and Economic Studies of Hungarian
Academy of Sciences (CERS-HAS) and the CSO.
The second data source is the user and network database of the iWiW OSN. Anonymized
user data (registration date, gender, age, place of residence) and the links between users were
archived by the service provider in 2013 and made available for research purposes in the
OTKA K-112713 research project. For the present study we created the aggregate version of
the individual network data to municipality - municipality level.
About amenities and characteristics of municipalities, we used the T-Star database of the
CSO. This is a municipality-level statistical database that collects the most important
quantified information from the municipal statistical information systems.
Fourth, the “Route” database provided by CERS HAS Databank is used to estimate the
distance between the municipalities (given in travel time, by car).
3.2 VARIABLES AND ANALYTICAL METHODS
We apply two levels of analysis. To examine hypotheses H.1 and H.3a-H.3b, we analyse
migration rates of municipalities, whereas about hypotheses H.2 and H.4 the units of analysis
are dyads of municipalities.
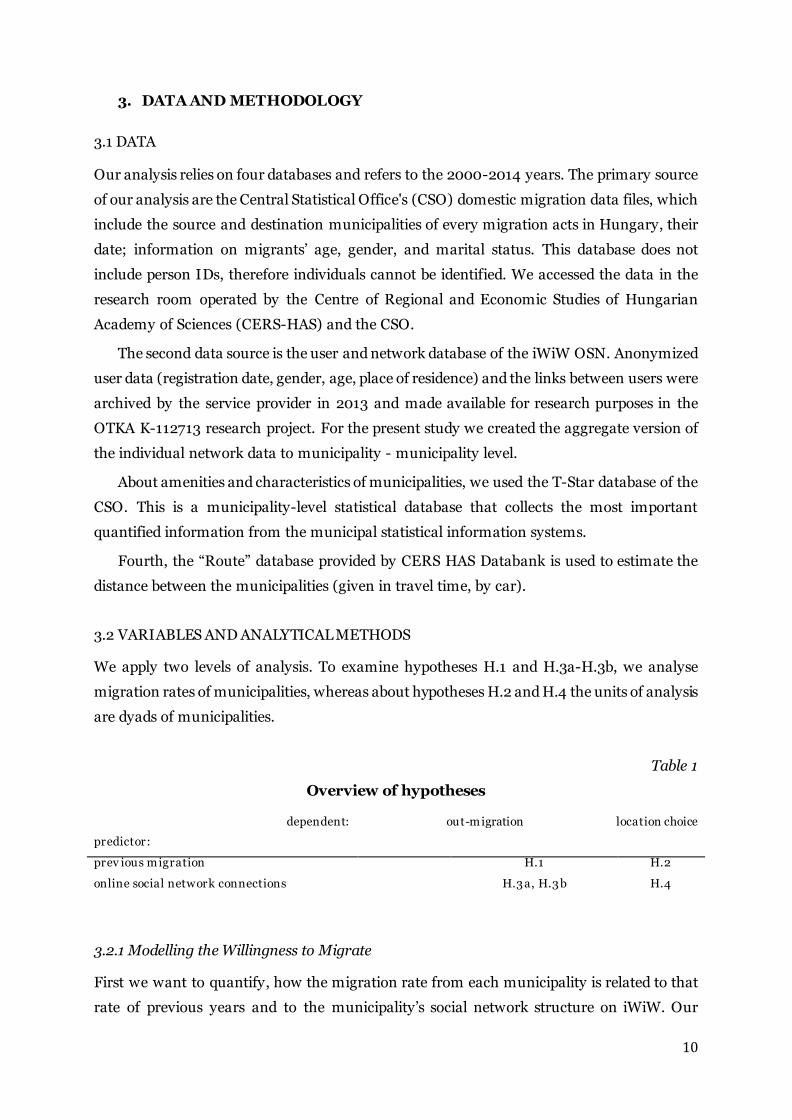
Table 1
Overview of hypotheses
dependent:
predictor:
out-migration location choice
prev ious migration H.1 H.2
online social network connections H.3a, H.3b H.4
3.2.1 Modelling the Willingness to Migrate
First we want to quantify, how the migration rate from each municipality is related to that
rate of previous years and to the municipality’s social network structure on iWiW. Our

11
dependent variable is the annual rate of the population moving away from the municipality,
relative to its total population.
Our key independent variable about chain migration is the out-migration rate in the
previous year. In addition to this baseline specification, we also examine a model with lagged
variables for the past five years as robustness check.
As migration is related to specific phases of life (Schultz 1961; Clark, Hunter 1992;
Greenwood 1997), we control for the demographic profile of the settlements. We divided the
population to 14 groups based on gender and age, and added the share of these groups as
control variables.
Infrastructural characteristics, public services, and amenities of the municipality may also
influence migration. We include the corresponding control variables obtained by principal
component analysis based on the T-Star database (detailed description is given in the
appendix).
We apply the following regression equation for examining H.1:
𝑀𝑖𝑡
𝑃𝑜𝑝𝑖𝑡= 𝛼 + 𝛽1
𝑀𝑖,𝑡−1
𝑃𝑜𝑝𝑖,𝑡−1+ 𝛽2𝑓𝑖,𝑡−1 + 𝛽3𝐷𝑖,𝑡−1 + 𝛽4𝑝𝑜𝑝𝑖,𝑡−1 + 𝛽5𝑡𝑦𝑝𝑒𝑖 + 𝜀𝑖𝑡 + ξ𝑖 , (1)
where “M” represents the out-migration from municipality “i” in year “t”; “pop” is its
population, and “f” contains the factors representing the characteristics of the municipality.
“D” includes the share of demographic groups, and “type” represents dummies describing the
urbanization of the municipality: whether it is a village, a town, a city, or the capital.
As our dependent variable is on municipality–year level, but our observations are
clustered by municipalities, we used multilevel modelling technique for obtaining the correct
standard errors1. Correspondingly, our equation includes error terms both on the
municipality–year level (𝜀𝑖𝑡) and on municipality level (ξ𝑖)
It must be noted that even though we analyse longitudinal data, we use pooled cross-
section identification, and not a fixed-effect panel (we did not include municipality
dummies). We chose this specification, because in case of fixed-effect panel identification the
interpretation of the 𝛽2 parameter would be: “if the migration in the previous year is high, we
expect the migration next year to be higher on the same municipality, compared to the years,
when it was low in the previous years”. In the pooled cross-section it is: “at those
municipalities, where the migration was high in the preceding year, we expect higher
migration in the next year compared to those municipalities, where it was low”. We argue
that it is definitely the second identification, which corresponds to our theoretical hypothesis.
1 We used the „meglm” module of the Stata software for the analysis.

12
According to our hypotheses H.3a and H.3b external OSN connections increase, while
internal connections prevent migration from a municipality. We use the data on the intensity
of internal and external contacts from our OSN database (iWiW).
In contrast to the previous model, this time we do not use longitudinal comparison, but
rely on a pure cross-section model. The reason is that the uptake of the iWiW network
exhibited specific geographic patterns - it was first popular in Budapest; than it spread to
bigger cities and finally to smaller villages (Lengyel et al. 2018) - and we assume that the
evolution of internal and external connections over the years within a municipality would be
heavily influenced by this pattern. However, we believe that social networks observed on
iWiW in its most diffused stage are good indicators for comparison across municipalities.
Therefore, our dependent variable is the migration outflow compared to the population
on each municipality (i), however, we analyse one year in a cross-sectional OLS regression:
𝑀𝑖,2014
𝑃𝑜𝑝𝑖,2014= 𝛼 + 𝛽1
𝑀𝑖,2013
𝑃𝑜𝑝𝑖,2013+𝛽2𝑒𝑥𝑡𝑖,2013 + 𝛽3𝑖𝑛𝑡𝑖,2013 + 𝛽4𝐶𝑖,2013
𝑠𝑡𝑑 + 𝛽5𝑁𝑖,2013𝑖𝑊𝑖𝑊 + 𝛽6𝑓𝑖,2013 +
𝛽7𝐷𝑖,2013 + 𝛽8𝑝𝑜𝑝𝑖,𝑡−1 + 𝛽9𝑡𝑦𝑝𝑒𝑖 𝜀𝑖. (2)
Our key independent variables here are ”ext”, which is the average number of external
connections per user on the iWiW, and “int” the average number of internal connections for a
user. As controls, we add the number of users (𝑁𝑖𝑊𝑖𝑊), and also the clustering measure of the
municipalities’ networks, which indicates how open or closed the local network structure is.2
We also include the migration rate of the previous year, the factors describing the
municipality characteristics, and the dummies for the demographic groups to the analysis. To
detect the interactions between these effects, we include these variables in a stepwise
manner.
3.2.2 Modelling Location Choice
When analysing location choices, our dependent variable is the migration volume between
the pair of municipalities compared to the number of migrants leaving the given source
municipality.
We measure the effect of previous migration (H.2) by the one year lagged version of the
independent variable.
2 We calculated the global clustering coefficient for this purpose, and standardized it by the average degree and
the size of the networks: 𝐶𝑖𝑠𝑡𝑑 =
𝐶𝑖𝑘𝑖
𝑁𝑖𝑖𝑊𝑖𝑊⁄
, following Neal (2017).

13
We use fixed effects for the source municipalities in this specification, thus we test,
whether more people choose a destination in a year, if it was chosen by more migrants from
the same municipality in the previous year. We estimate the following equation:
𝑀𝑖𝑗𝑡
𝑀𝑖𝑡
= 𝛼 + 𝛽1
𝑀𝑖𝑗,𝑡−1
𝑀𝑖,𝑡−1
+ 𝛽2𝑓𝑗,𝑡−1 + 𝛽3𝑡𝑦𝑝𝑒𝑗 + 𝛽4𝑃𝑜𝑝𝑗𝑡 + 𝛽5𝑠𝑖𝑧𝑒𝑗𝑡 + 𝛽6𝑑𝑖𝑗 + 𝛽7𝑑𝑖𝑗2 +𝛽8𝑆𝐶𝑖𝑗 +
𝛾𝐷𝑖 + 𝜀𝑖𝑗𝑡 + 𝜉𝑖
(3)
where “M” = number of migrants, leaving “i” municipality in “t” year and choosing “j”
municipality as destination. Once the fixed effects (𝐷𝑖 ) are included for the source
municipality, we only include parametric controls about the destination: the factor scores “f”
describing the available services and characteristics, and the “type” (urbanization) of the
destination. As our dependent variable is not standardized by the size of the destination,
adding the destination’s population is also necessary. We also include the distance (d)
measured by travel time in linear and quadratic forms as dyad-level control. As social
network connections tend to be structured by administrative regions (see Lengyel et al.
2015), we add a dummy representing whether the source and destination municipality is in
the same county (SC).
Beside the above baseline specification, we estimate different versions of the model to
check the robustness of the results. First we include more (five) lagged variables of the
previous migration. Next, we added destination municipality fixed effects in addition to the
source municipality fixed effects. Third, we add both the five lagged variables and the
destination municipality fixed effects. From the models with destination municipality fixed
effects we omit the parameters describing destination municipalities (factors, urbanization
types, population).
Note that even in the double fixed-effect models we do pooled cross-section
identification, as we did not include the 𝐷𝑖𝑗 fixed-effect dummies for the municipality pairs.
Thus our model can be interpreted as “whether from a selected municipality more migrants
choose a destination, which was popular among its migrants in the previous year, controlling
for the popularity of this destination across all migrants?”, and not “whether in case of a pair
of municipalities, more migration is expected, if migration was high in the previous year?”
About H.4 we assume that dense networks on the OSN makes a destination more popular
among migrants from the source municipality. Accordingly, our key independent variable is
the weight of the destination municipality in the outgoing OSN connections from the source
municipality.

14
As we described about equation (2), we cannot use the longitudinal variance of the iWiW
network as a proxy for the dynamics of the social network over time. Similarly to equation
(3), we compare destinations across the same source municipality; therefore we include
source municipality fixed effects (𝐷𝑖 ). Thus, we estimate the following model:
𝑀𝑖𝑗,2014
𝑀𝑖,2014
= 𝛼 + 𝛽1
𝑀𝑖𝑗,2013
𝑀𝑖,2013
+ 𝛽2𝑐𝑜𝑛𝑛𝑖𝑗,2013+𝛽3𝐶𝑖,2013𝑠𝑡𝑑 + 𝛽4𝑁𝑖,2013
𝑖𝑊𝑖𝑊 + 𝛽5𝑓𝑗,2013 + 𝛽6𝑇𝑦𝑝𝑒𝑗 +
𝛽7𝑃𝑜𝑝𝑗,2013 + 𝛽8𝑑𝑖𝑗 + 𝛽9𝑑𝑖𝑗2 + 𝛽10 𝑆𝐶𝑖𝑗 + 𝛾𝐷𝑖 + 𝜀𝑖𝑗 + 𝜉𝑖 , (4)
where “connij“ stands for the number of connections between municipality ”i” and ”j”
divided by the number of all external connections of municipality “i”. We add controls for the
size (𝑁𝑗𝑖𝑊𝑖𝑊) and clustering coefficient (𝐶𝑗
𝑠𝑡𝑑) of the OSN similarly to equation (2). We also
control for previous migration, size, type, and characteristics of the destination, and included
distance and same county dummy.
We also examine alternative models. First, we add five lagged variables of previous
migration. Second, we add fixed effects for the destination municipalities. Third, we examine
a model with adding both of these. When adding destination fixed effects, we omit the
observable parameters describing the destination municipalities (factors, type and
population).
3.2.3 Descriptive Statistics
The distribution of the population in Hungary shows that 17,7% lives in the capital, 17,4%
lives in county seats, 33,5% lives in towns and 31,4% in villages. Comparing this to the iWiW
users, we find a higher share of the urban population (capital and county seats), and a lower
share of population from villages. The yearly out-migration rate is around 4-5% in each
category (Table 2).
Table 2
Descriptive statistics by urbanization of municipalities
Capital (N=1 )
County seats (N=1 8)
Towns (N=287 )
Villages (N=2,844)
Population mean 1,744,665 95,528 1 1,520 1 ,091
standard deviation
48,715 9,696 1 ,161
Sum 1,744,665 1 ,719,496 3 ,306,268 3 ,103,232
% 1 7.7% 1 7.4% 33.5% 31 .4% N user on iWiW mean 7 72,388 39,679 3 ,717 292
standard deviation
21 ,164 3 ,618 37 0
sum 7 72,388 7 14,230 1 ,062,941 662,254
percent of population 44.3% 41 .5% 32.1% 21 .3%
15
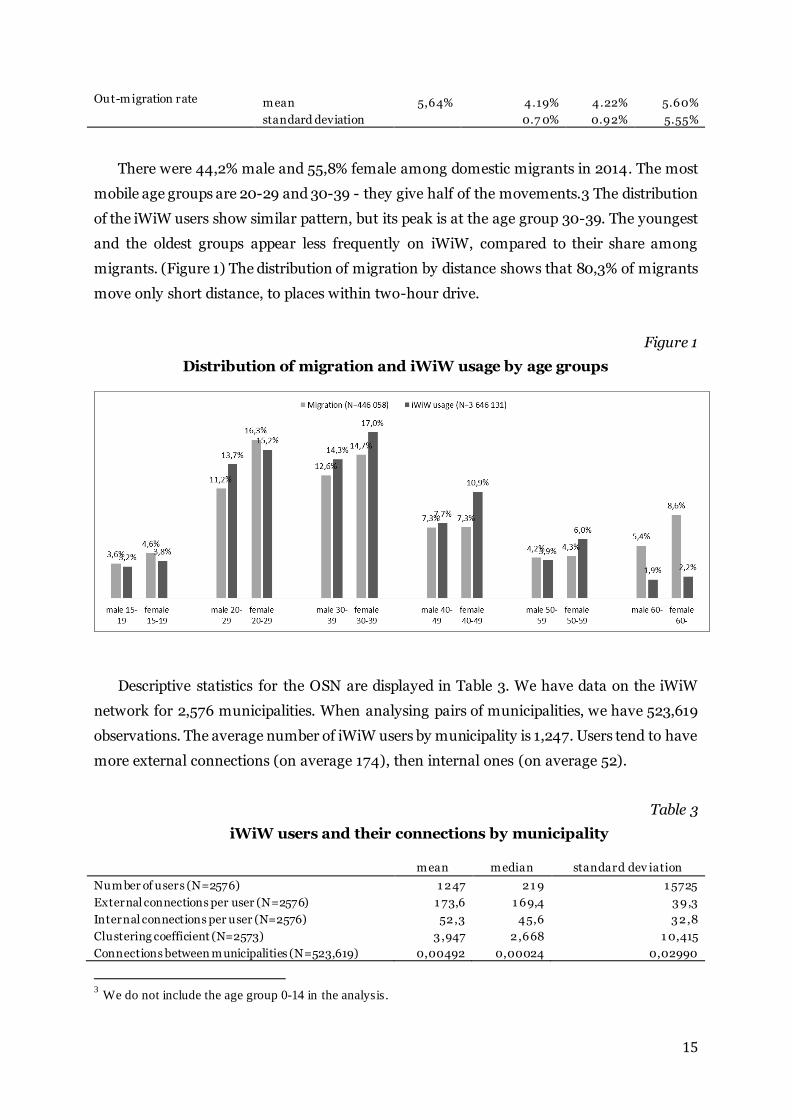
Out-migration rate mean 5,64% 4.19% 4.22% 5.60%
standard deviation
0.7 0% 0.92% 5.55%
There were 44,2% male and 55,8% female among domestic migrants in 2014. The most
mobile age groups are 20-29 and 30-39 - they give half of the movements.3 The distribution
of the iWiW users show similar pattern, but its peak is at the age group 30-39. The youngest
and the oldest groups appear less frequently on iWiW, compared to their share among
migrants. (Figure 1) The distribution of migration by distance shows that 80,3% of migrants
move only short distance, to places within two-hour drive.
Figure 1
Distribution of migration and iWiW usage by age groups
Descriptive statistics for the OSN are displayed in Table 3. We have data on the iWiW
network for 2,576 municipalities. When analysing pairs of municipalities, we have 523,619
observations. The average number of iWiW users by municipality is 1,247. Users tend to have
more external connections (on average 174), then internal ones (on average 52).
Table 3
iWiW users and their connections by municipality
mean median standard dev iation
Number of users (N=2576) 1 247 21 9 1 5725
External connections per user (N=2576) 1 73,6 1 69,4 39,3
Internal connections per user (N=2576) 52,3 45,6 32,8
Clustering coefficient (N=2573) 3 ,947 2,668 1 0,415
Connections between municipalities (N=523,619) 0,00492 0,00024 0,02990
3 We do not include the age group 0-14 in the analysis.

16
4. RESULTS
4.1 LEAVING MUNICIPALITIES
Our longitudinal regressions indicate that out-migration rate of the previous year is
significantly associated with the subsequent year’s out-migration. This is true when we
analyse the previous year’s effect on the out-migration rate, (Table 4, Column 1), and also,
when we add out-migration rates of the previous five years (Table 4, Column 2). These
support our H.1 hypothesis, and allow us to conclude, that cumulative causation has an
impact on migratory decisions. Interestingly, we observe that the coefficient of the previous
year’s migration rate is even augmented in Column 2, where we controlled for a longer
history of out-migration in the model.
Among the factor scores measuring municipality characteristics, the first four of them
represent positive amenities (services and public services, strength of the local economy).
Coefficients of these are generally negative (2-4) and significant (1-3) indicating that
amenities are associated with lower out-migration. The population of the municipality is
negatively associated with out-migration, so municipalities with high population face lower
out-migration rate, than low populated ones with similar attributes.

17
Table 4
Results of longitudinal regressions on out-migration
1 2
Out-migration rate (percentage points) Out-migration rate (percentage points, t -1) 0.1 44*** 0.253***
(0.0093) (0.0071)
Out-migration rate (percentage points, t -2) 0.0929***
(0.0074)
Out-migration rate (percentage points, t -3) 0.0993***
(0.0074)
Out-migration rate (percentage points, t -4) 0.171***
(0.0076)
Out-migration rate (percentage points, t -5) 0.133***
(0.0076)
Population (100 000) -2.43*** -0.927***
(0.387) (0.182)
Characteristics of the municipality (factor scores, previous year): Urban services 0.0960*** 0.0432***
(0.0171) (0.0093)
Local economy -0.1 66*** -0.1 24***
(0.0113) (0.0088)
Basic public services -0.0778*** -0.0145*
(0.0139) (0.0085)
Labor market -0.0564*** -0.0053
(0.0120) (0.0069)
Service orientation of local econ. -0.0161 0.0258***
(0.0132) (0.0086)
Industrial orientation of local econ. -0.0740*** -0.0404***
(0.0120) (0.0084)
Additional controls:
Shares of demographic groups, type (urbanization) y es y es
Municipality fixed-effects no no
Observ ations (municipality x years) 20,27 3 20,253
Number of groups (municipalities) 2 ,908 2,905 Notes: Standard errors in parentheses. *** p<0.01 , ** p< 0.05, * p<0.1
Models concerning the impact of online connections on out-migration are presented in
Table 5. The variables measuring the internal (within-municipality) and external connections
are included separately in all regressions, and their effects are significant in each
specification. Results indicate that as the intensity of connections within the municipality
increases (measured on the iWiW OSN), out-migration rate decreases. So results confirm
that the density of connections inside a community prevents migration (H.3a). Coefficients of
the external connections also support our hypothesis H.3b that external connections prone
leaving a municipality. In each model we included controls for the shares of the demographic
groups in the population, the population of the settlement, the type of the settlement
(urbanization), and the characteristics (factor scores).

18
In Table 5 Column 2 we added the out-migration rate of the previous years to the model,
thus we can examine the impact of H.1 and H.3a-b simultaneously. Comparing the coefficient
of the internal connections across the two columns, its magnitude decreases by about 50%;
and the coefficient of the external connections also decreases by 12%. This suggests that there
are overlaps between the network effects of the previous migration and the OSN connections,
but basically they measure different mechanisms. Including the migration of the previous
year decreases the effect of the internal connections more, than the effect of the external
connections, which suggests that if other people move from the community, people will be
likely to leave, even if they have a many local connections.
According to Column 3 these effects are still significant while including the 5 year lagged
values of out-migration. Our control for the clustering (local closeness) of the online network
connections within the municipality is significant before including previous migration, but
loses significance afterwards.
Table 5
Regression models considering the effect of social networks
1 2 3
Out-migration rate (percentage points, 2014)
External connections (100) on iWiW per user (previous year) 0.263*** 0.247*** 0.1 80**
(0.0987) (0.0878) (0.0818)
Internal connections (100) on iWiW per user (previous year) -1 .27*** -0.710*** -0.302***
(0.116) (0.108) (0.104)
Clustering coefficient on iWiW (standardized, previous year) 0.0272** 0.0152 0.0133
(0.0133) (0.0119) (0.0111)
Out-migration rate (percentage points, previous year)
0.457*** 0.246***
(0.0227) (0.0248)
Additional controls:
Shares of demographic groups, population, type (urbanization), characteristics (factor scores)
y es y es y es
Out-migration rate, t-2, t-3 , t-4, t-5 no no y es
R2 0.246 0.392 0.47 6
Number of groups (municipalities) 1 ,7 1 5 1 ,7 1 5 1 ,7 1 5
Notes: Standard errors in parentheses. *** p<0.01 , ** p<0.05, * p<0.1
4.2 CHOICE OF DESTINATION
In the longitudinal analysis of location choice, we analyse the impact of previous migration
between two municipalities in three specifications (Table 6). In columns 1-2 fixed effects of
the source municipality absorb the cross-sectional differences in push factors. In these

19
columns the control for the population of the destination municipality is necessary, as our
dependent variable is not standardized by the destination size. Additionally, we included the
type of the destination municipality and its characteristics as controls for the pull factors. In
column 2-3 we added controls for the previous five year’s migration volumes between the
municipalities. In Columns 3 adding the source and destination municipality fixed effects
absorb the average levels of both the source and destination municipalities; therefore, we did
not include parametric controls for them.
We can see that mobility between settlement pairs is positively associated with the
previous mobility between them, in each of the three specifications, corresponding to H.2.
The distance between the source and destination municipality is negatively associated
with the likelihood of migration. The negative squared term indicates a diminishing effect of
distance on location choice.
Table 6
Results of longitudinal regressions on location choice
1 2 3
Dependent variable Choice of the destination among migrants of the municipality (percentage points, 201 4) Independent variables
Migration rate (percentage points, previous year) 0.240*** 0.128*** 0.128***
(0.0023) (0.0026) (0.0004)
Distance (in hours) -0.497*** -0.290*** -0.299***
(0.0025) (0.0032) (0.0026)
Distance (in hours) squared 0.0688*** 0.0414*** 0.0421***
0.0004 0.0005 0.0004
Same county 0.0985*** 0.0357*** 0.0198***
(0.0023) (0.0026) (0.0023)
Additional controls: Population, type (urbanization), characteristics (factor scores) of destination municipality y es y es no
Migration rate, t-2, t-3 , t-4, t-5 no y es y es
Source municipality fixed-effects y es y es y es
Destination municipality fixed-effects no no y es
R2 0.292 0.359 0.342
Observ ations (municipality pairs x years) 6,546,306 4,47 2,336 5,057 ,240
Notes: Standard errors in parentheses. *** p<0.01 , ** p<0.05, * p<0.1
We examine four specifications on the effect of social networks on location choices. As we
use the connections on the OSN as cross-sectional data, these are all cross-sectional models
for the year 2014 (Table 7). First, we enter the intensity of OSN connections and the
clustering coefficient of the destination settlements to the model (Column 1). Next, we add
the intensity of migration in 2013 to examine hypotheses H.4 and H.2 simultaneously
(Column 2). Each of these models contains fixed effects for the source municipality , which

20
absorb the cross-sectional differences in push factors. In Column 3 we enter the additional
four year’s lagged variables. In each of these models (Columns 1-3) we include the
population, the settlement type (urbanization) and the characteristics (factor scores) of the
destination municipality as parametric controls for the pull factors. Furthermore, in Column
4 we add both source and destination municipality fixed effects and examine the model with
five lagged variables together with the double fixed effects. All four specifications (Column 1-
4) contain distance, squared distance and same county variables.
The coefficient of the social network variable (intensity of connections on iWiW) is
consistently significant and positive in each specification, suggesting that the more intensive
the network connection is, the likelihood of choosing that given municipality grows
comparing to other alternatives, corresponding to H.4. The clustering coefficient of the
destination settlement is not significant in any specifications.
The effect of the previous year’s migration shows similar tendencies to the longitudinal
analysis. Migration is more intensive, if its intensity was high in the previous year - as we
assumed based on the theory of chain migration. After adding the previous year’s migration
to the model, coefficients of the intensity of network connections decreases by about 14%,
after adding the five year lagged values it drops with 30%. It is not surprising; it indicates
that people sustain some of their previous social connections after moving, which creates a
positive correlation between the intensity of previous migration and the strength of network
connections between municipalities.
Table 7
Regression models considering the effect of social networks
1 2 3 4
Dependent variable Choice of the destination among migrants of the municipality (percentage points, 201 4) Independent variables
iWiW connections (percentage points, previous y ear)
0.120*** 0.1 07*** 0.0753*** 0.0730***
(0.0027) (0.0025) (0.0023) (0.0008)
Clustering coefficient of destination iWiW 7 .22e-06 7 .44e-06 4.37e-06
(standardized, previous year) (8.01e-06) (7 .97e-06) (7 .85e-06)
Migration rate (percentage points, previous y ear)
0.0954*** 0.0700*** 0.0882***
(0.0057) (0.0054) (0.0013)
Additional controls: Population, type (urbanization), characteristics (factor scores) of destination municipality y es y es y es no
Migration rate, t-2, t-3 , t-4, t-5 no no y es y es
Distance, distance2, same county y es y es y es y es
Source municipality fixed-effects y es y es y es y es
Destination municipality fixed-effects no no no y es
R2 0.201 0.209 0.229 0.431
Observ ations (municipality pairs) 295,061 295,061 295,009 523,432

21
Notes: Standard errors in parentheses. *** p<0.01 , ** p<0.05, * p<0.1
5. CONCLUSIONS
We examined the role of social networks in Hungarian internal migration. We analysed
separately the factors determining the decision to leave a municipality and the decision on
the place of resettling – so the out-migration and the choice of destination. The results show
that both leaving and settling have a significant and positive association with network effects.
Both previous migration and online social network connections influence the magnitude of
current migration in every specification we examined.
We found that the intensity of former migration in the community of origin has a
significant correlation with subsequent migration over the period 2000-2014, and those
destinations, which have been popular among the out-migrants of a municipality in the
previous year, will be popular in the subsequent year too. The former of these findings can be
linked to literature on cumulative causation (Massey et al. 1993; Deléchat 2001), while the
latter is consistent with previous findings on chain migration (Carrington, Detragiache,
Vishwanath 1996; Bauer, Epstein, Gang 2002).
Considering online social networks, we have found that less people migrate from
municipalities with dense internal linkages, and more people from ones with more external
linkages. Additionally, our models suggest that if there are more online social network
connections between residents of the source and the destination municipality compared to
other alternatives, it makes the given destination more popular among migrants. These
results are consistent with the information and affinity hypotheses (Haug 2008), about the
networks’ influence on migration. Although several previous studies illustrated the effect of
the networks on migration and location choice based on these arguments (Deléchat 2001;
Bauer, Epstein, Gang 2002; Nowotny, Pennerstorfer 2011), to our knowledge, our one is the
first, which utilized online social network connections to show this. For this hypothesis, we
assumed – based on previous studies – that online social networks are important sources of
social capital (affinity hypothesis), similarly to real networks, or they can be used as the
proxies of “real” networks. We also relied on previous studies by assuming that online social
networks are efficient tools for collecting information about migration. It must be added
however, that these mechanisms explaining network effects (information about getting
around and work, utility of nearby friends and relatives) are individual level explanations,
and our analysis is on the community level. In this sense, our analysis deviates from previous
literature, which analysed migration at the individual level (eg. Kobrin, Speare 1983;
Banerjee 1983; Deléchat 2001; Dawkins 2006), however, we find examples for similar
analysis, where observations are on the community level (Johnston 1971; Carrington,

22
Detragiache, Vishwanath 1996; Nowotny, Pennerstorfer 2011). Therefore, our analysis also
assumes that these individual mechanisms add up to the community level.
Municipality characteristics show mostly the expected effect on migration. Municipalities
with better infrastructure (local economy, basic public services, labor market) face less out-
migration. When choosing across destinations, municipalities with better conditions in the
dimensions of urban services, basic public services, and labour market are more attractive.
We did not find significant effects of the structure of the communities’ network by analysing
local clustering after controlling for previous migration. While an important source of
network effects in internal migration is ethnicity, in this study we also did not analyse ethnic
factors. A reason for this is that Hungary is ethnically highly homogenous, the most
numerous ethnic minority is the Roma population.
We analysed two indicators of network effects: the previous migration and the online
social network connections. By including both to the models we saw that the coefficients
decrease, but remain significant, which we interpreted as these effects partly overlap, but
each contribute additionally to explaining migration.
It is important to discuss the limitations of the results. First, one needs to be cautious
about the interpretation of the effect of previous migration. We argued that previous
migrants maintain the relationship with their place of origin; therefore, they can provide
information and benefits to the subsequent migrants. The effect of previous migration,
however, probably also includes additional unobserved effects, which we could not control
fully in our regressions. In case of the out-migration, such factor can be an ongoing economic
or social decline of the community, or the effect of agglomeration externalities. In case of the
location choice, transport linkages, administrative relationships, or cultural factors can
contribute to the fact that it is natural to select some destinations from some sources, beyond
the network effects, and the economic, administrative and distance factors, we were able to
control for.
The iWiW data also has its own limitations. It includes 3.77 million users, which is about
the two third of the internet user population at that time, but it has selective coverage by
urbanization and age. An additional issue is that how up-to-date user’s data are. If they did
not properly update their hometown, when they moved, and they gained new iWiW
connections at their new places of residence than we overestimate the connections between
the two municipalities and also overestimate the external links on the expense of internal
links. Moreover, there is a trade-off between these limitations: we chose to analyse the latest
available date of the iWiW database to decrease its selectivity; however, with this we possibly
sacrificed up-to-dateness of its information to some extent.

23
REFERENCES
Aslund, Olof. 2000. ‘Immigrant Settlement Policies and Subsequent Migration’. Working
Paper 2000:23, Uppsala University, Department of Economics.
Banerjee, Biswajit. 1983. ‘Social Networks in the Migration Process: Empirical Evidence on
Chain Migration in India’. The Journal of Developing Areas 17 (2): 185–196.
Bauer, Thomas K., Gil S. Epstein, and Ira N. Gang. 2002. ‘Herd Effects or Migration
Networks? The Location Choice of Mexican Immigrants in the US’. IZA Discussion
Paper No. 551
Beaman, Lori A. 2012. ‘Social Networks and the Dynamics of Labour Market Outcomes:
Evidence from Refugees Resettled in the US’. The Review of Economic Studies 79 (1):
128–161.
Blaskó, Zsuzsa, and Irén Gödri. 2014. ‘Kivándorlás Magyarországról: Szelekció És Célország-
Választás Az „új Migránsok” Körében’. Demográfia 57 (4): 271–307.
Blumberg, Leonard, and Robert R. Bell. 1958. ‘Urban Migration and Kinship Ties’. Soc.
Probs. 6: 328.
Boeri, Tito, Marta De Philippis, Eleonora Patacchini, and Michele Pellizzari. 2012. ‘Moving to
Segregation: Evidence from 8 Italian Cities’. IZA Discussion Paper No. 6834
Bowles, Samuel. 1970. ‘Migration as Investment: Empirical Tests of the Human Investment
Approach to Geographical Mobility’. The Review of Economics and Statistics, 356–
362.
Brooks, Brandon, Bernie Hogan, Nicole Ellison, Cliff Lampe, and Jessica Vitak. 2014.
‘Assessing Structural Correlates to Social Capital in Facebook Ego Networks’. Social
Networks 38: 1–15.
Brown, David L, and Kai A Schafft. 2002. ‘Population Deconcentration in Hungary during the
Post-Socialist Transformation’. Journal of Rural Studies 18 (3): 233–244.
Brown, Lawrence A., and Eric G. Moore. 1970. ‘The Intra-Urban Migration Process: A
Perspective’. Geografiska Annaler: Series B, Human Geography 52 (1): 1–13.
Carrington, William J., Enrica Detragiache, and Tara Vishwanath. 1996. ‘Migration with
Endogenous Moving Costs’. The American Economic Review 86 (4): 909–30.
Chen, Wenli, and Alfred Siu Kay Choi. 2011. ‘Internet and Social Support among Chinese
Migrants in Singapore’. New Media & Society 13 (7): 1067–1084.
Chevan, Albert. 1971. ‘Family Growth, Household Density, and Moving’. Demography 8 (4):
451–458.
Chiswick, Barry R, Yew Liang Lee, and Paul W Miller. 2005. ‘A Longitudinal Analysts of
Immigrant Occupational Mobility: A Test of the Immigrant Assimilation Hypothesis’.
International Migration Review 39 (2): 332–353.

24
Choldin, Harvey M. 1973. ‘Kinship Networks in the Migration Process’. International
Migration Review 7 (2): 163–176.
Clark, David E, and William J Hunter. 1992. ‘The Impact of Economic Opportunity,
Amenities and Fiscal Factors on Age-Specific Migration Rates’. Journal of Regional
Science 32 (3): 349–365.
Cseres-Gergely, Zsombor. 2005. ‘County to County Migration and Labour Market Conditions
in Hungary between 1994 and 2002’. Budapest Working Papers on the Labour
Market.
Damm, Anna Piil. 2009. ‘Ethnic Enclaves and Immigrant Labor Market Outcomes: Quasi-
Experimental Evidence’. Journal of Labor Economics 27 (2): 281–314.
DaVanzo, Julie. 1981. ‘Repeat Migration, Information Costs, and Location-Specific Capital’.
Population and Environment 4 (1): 45–73.
Dawkins, Casey J. 2006. ‘Are Social Networks the Ties That Bind Families to
Neighborhoods?’ Housing Studies 21 (6): 867–881.
Dekker, Rianne, and Godfried Engbersen. 2014. ‘How Social Media Transform Migrant
Networks and Facilitate Migration’. Global Networks 14 (4): 401–418.
Deléchat, Corinne. 2001. ‘International Migration Dynamics: The Role of Experience and
Social Networks’. Labour 15 (3): 457–486.
Dorigo, Guido, and Waldo Tobler. 1983. ‘Push-Pull Migration Laws’. Annals of the
Association of American Geographers 73 (1): 1–17.
Elliott, James R. 2001. ‘Referral Hiring and Ethnically Homogeneous Jobs: How Prevalent Is
the Connection and for Whom?’ Social Science Research 30 (3): 401–425.
Ellison, Nicole B, Charles Steinfield, and Cliff Lampe. 2007. ‘The Benefits of Facebook
friends: Social Capital and College Students Use of Online Social Network Sites’.
Journal of Computer-Mediated Communication 12 (4): 1143–1168.
Ellison, Nicole B., Jessica Vitak, Rebecca Gray, and Cliff Lampe. 2014. ‘Cultivating Social
Resources on Social Network Sites: Facebook Relationship Maintenance Behaviors
and Their Role in Social Capital Processes’. Journal of Computer-Mediated
Communication 19 (4): 855–870.
Fazekas, Károly. 2002. ‘Regional Disparities in Unemployment in Central and Eastern
Europe: The Case of Hungary’. In Labor, Employment, and Social Policies in the EU
Enlargement Process, 176–96. Washington, DC: World Bank.
Gottlieb, Peter. 1987. Making Their Own Way: Southern Blacks’ Migration to Pittsburgh,
1916-1930. Urbana: University of Illinois Press.
Greenwood, Michael J. 1997. ‘Internal Migration in Developed Countries’. Handbook of
Population and Family Economics 1: 647–720.

25
Greiner, Clemens. 2011. ‘Migration, Translocal Networks and Socio-Economic Stratification
in Namibia’. Africa 81 (4): 606–627.
Gross, Dominique M, and Nicolas Schmitt. 2006. ‘Why Do Low-and High-Skill Workers
Migrate? Flow Evidence from France’. CESifo Working Paper Series No. 1797
Grossman, James R. 1991. Land of Hope: Chicago, Black Southerners, and the Great
Migration. University of Chicago Press.
Hajdu, Miklós, János Köllő, and István János Tóth. 2018. ‘Manifest Shortage – Vacancies and
Idle Capacities.’ In The Hungarian Labour Market 2017. Budapest: MTA KRTK.
Hampton, Keith, and Barry Wellman. 2001. ‘Long Distance Community in the Network
Society: Contact and Support beyond Netville’. American Behavioral Scientist 45 (3):
476–495.
Hansen, Høgni Kalsø, and Thomas Niedomysl. 2008. ‘Migration of the Creative Class:
Evidence from Sweden’. Journal of Economic Geography 9 (2): 191–206.
Hárs, Ágnes. 2012. ‘Geographical Mobility’. In From Pensions to Public Works. Hungarian
Employment Policy from 1990 to 2010, 166–78. Budapest: Budapest Institute and IE-
HAS.
Haug, Sonja. 2008. ‘Migration Networks and Migration Decision-Making’. Journal of Ethnic
and Migration Studies 34 (4): 585–605.
Hiller, Harry H., and Tara M. Franz. 2004. ‘New Ties, Old Ties and Lost Ties: The Use of the
Internet in Diaspora’. New Media & Society 6 (6): 731–752.
Irwin, Michael, Troy Blanchard, Charles Tolbert, Alfred Nucci, and Thomas Lyson. 2004.
‘Why People Stay: The Impact of Community Context on Nonmigration in the USA’.
Population 59 (5): 567–592.
Johnston, Robert J. 1971. ‘Resistance to Migration and the Mover/Stayer Dichotomy: Aspects
of Kinship and Population Stability in an English Rural Area’. Geografiska Annaler:
Series B, Human Geography 53 (1): 16–27.
Kertesi, Gábor. 1997. ‘A Gazdasági Ösztönzők Hatása a Népesség Földrajzi Mobilitására 1990
És 1994 Között’. Esély 2: 3–32.
Kobrin, Francis E, and Alden Speare Jr. 1983. ‘Out-Migration and Ethnic Communities’.
International Migration Review 17 (3): 425–444.
Lengyel, Balázs, Riccardo Di Clemente, János Kertész, and Marta C González. 2018. ‘Spatial
Diffusion and Churn of Social Media’. ArXiv Preprint ArXiv:1804.01349.
Lengyel, Balázs, Attila Varga, Bence Ságvári, Ákos Jakobi, and János Kertész. 2015.
‘Geographies of an Online Social Network’. PloS One 10 (9): e0137248.
Litwak, Eugene. 1960. ‘Geographic Mobility and Extended Family Cohesion’. American
Sociological Review, 385–394.

26
MacDonald, John S, and Leatrice D MacDonald. 1964. ‘Chain Migration Ethnic
Neighborhood Formation and Social Networks’. The Milbank Memorial Fund
Quarterly 42 (1): 82–97.
Massey, Douglas S, Joaquin Arango, Graeme Hugo, Ali Kouaouci, Adela Pellegrino, and J
Edward Taylor. 1993. ‘Theories of International Migration: A Review and Appraisal’.
Population and Development Review 19 (3): 431–466.
Munshi, Kaivan. 2003. ‘Networks in the Modern Economy: Mexican Migrants in the US
Labor Market’. The Quarterly Journal of Economics 118 (2): 549–599.
Neal, Zachary P. 2017. ‘How Small Is It? Comparing Indices of Small Worldliness’. Network
Science 5 (1): 30–44.
Nowotny, Klaus, and Dieter Pennerstorfer. 2011. ‘Ethnic Networks and the Location Choice
of Migrants in Europe’. WIFO Working Papers.
Patacchini, Eleonora, and Yves Zenou. 2012. ‘Ethnic Networks and Employment Outcomes’.
Regional Science and Urban Economics 42 (6): 938–949.
Ravenstein, E. G. 1889. ‘The Laws of Migration.’, Journal of the Royal Statistical Society, 52
(2): 241–305.
Reichert, Joshua. 1982. ‘A Town Divided: Economic Stratification and Social Relations in a
Mexican Migrant Community’. Social Problems 29 (4): 411–423.
Schultz, Theodore W. 1961. ‘Investment in Human Capital’. The American Economic Review
51 (1): 1–17.
Sell, Ralph R, and Gordon F DeJong. 1978. ‘Toward a Motivational Theory of Migration
Decision Making’. Journal of Population 1 (4): 313–335.
Sjaastad, Larry A. 1962. ‘The Costs and Returns of Human Migration’. Journal of Political
Economy 70 (5, Part 2): 80–93.
Speare, Alden. 1974. ‘Residential Satisfaction as an Intervening Variable in Residential
Mobility’. Demography 11 (2): 173–188.
Stokenberga, Aiga. 2019. ‘How Family Networks Drive Residential Location Choices:
Evidence from a Stated Preference Field Experiment in Bogotá, Colombia’. Urban
Studies 56 (2): 368–384.
Tóth, István János, and Zsanna Nyírő. 2018. ‘“Labour Shortage” in the Hungarian Public
Discourse’. In The Hungarian Labour Market 2017. Budapest: MTA KRTK.
Valenzuela, Sebastián, Namsu Park, and Kerk F Kee. 2009. ‘Is There Social Capital in a Social
Network Site?: Facebook Use and College Students’ Life Satisfaction, Trust, and
Participation’. Journal of Computer-Mediated Communication 14 (4): 875–901.
Wellman, Barry, and Scot Wortley. 1990. ‘Different Strokes from Different Folks: Community
Ties and Social Support’. American Journal of Sociology 96 (3): 558–588.

27
Ye, Jiali. 2006. ‘Traditional and Online Support Networks in the Cross-Cultural Adaptation
of Chinese International Students in the United States’. Journal of Computer-
Mediated Communication 11 (3): 863–876.

28
APPENDIX
FACTORS DESCRIBING MUNICIPALITY CHARACTERISTICS
We have chosen a total of 22 variables from the T-Star database about education,
unemployment, housing, cultural facilities, public utilities, retail outlets, economy and
healthcare, to describe the infrastructure and characteristics of municipalities. When
selecting variables, a key condition was that they have observations annually for the analyzed
period (2000-2014). In order to reduce complexity of the selected variables, principle
component analysis was performed. This compiled the information into six factors, which we
named after their content. (Table 8.)
“Urban services” factor includes the logarithm of the number of retail stores in the
municipalities, the logarithm of the number of bars and restaurants, the logarithm of the
number of hospital beds, the number of nursery places per capita and the dummy variable for
the existence of museum in the municipality. Then a separate factor, “Basic public services”
embraces the number of primary school teachers per capita, kindergarten capacity per capita,
and the number of general practitioners.
“Local economy” factor includes the number of private and corporate businesses, the
proportion of taxpayers in population and the average amount of taxable income by one
taxpayer. “Labor Market” contains the ration of long-term unemployment (over 180 days)
with negative correlation, and the proportion of dwellings connected to the drinking water
network. This can be interpreted as a reverse deprivation index.
The local economy is characterized by the following two factors. “Service orientation of
local economy” contains the share of agricultural sector within local businesses, with
negative correlation, the share of service businesses with positive correlation and the share of
dwellings connected to the gas network. “Industrial orientation of local economy” includes
the proportion of enterprises in the industrial sector with positive correlation and the service
oriented ones with negative sign.

29
Table 8
Correlation matrix of principle component analysis
Infrastructure & serv ices Orientation of local
economy
1 2 3 4 5 6
Variables Urban serv ices
Local economy
Basic public serv ices
Labour market Service Industrial Unexplained
Number of corporations per capita 0.0641 0.2698 -0.0764 0.0484 0.1 455 -0.0480 .5981
The number of private businesses per capita -0.0314 0.6305 0.0223 -0.2502 -0.0643 -0.0417 .3303
Corporations in industry sector (within all corporate enterprises) -0.0063 -0.0205 -0.0141 -0.0086 0.0927 0.8144 .04683
Corporations in the agricultural sector (within all corporate enterprises) 0.0191 0.0448 0.0401 0.0162
-0.6483 -0.1 684 .1 834
Corporations in service sector (within all corporate enterprises) -0.0121 -0.0236 -0.0246 -0.0075 0.5105 -0.5192 .0546
Log number of retail stores 0.3688 -0.0701 0.1 494 -0.0280 0.1 967 0.0428 .1 906
Log number of bars & restaurants 0.3566 -0.0088 0.1144 -0.0034 0.1 986 0.0290 .1 97 Proportion of taxpayers in population -0.01 81 0.3751 0.0138 0.3923 -0.0792 -0.0011 .2204
Av erage taxable income by taxpayer 0.0198 0.4653 -0.0201 0.1 864 0.0359 0.0136 .228
Share of jobseekers ov er 180 days in the population 0.0098 0.1282 -0.0023 -0.6506 -0.0407 0.0131 .3119
The number of general practitioners per person -0.0333 0.0573 0.5362 0.0569 -0.0824 -0.0428 .4535
Log number of hospital beds 0.4177 -0.0273 -0.0730 0.0204 -0.1 250 -0.0491 .3461
Number of nursery places per capita 0.2628 0.1 538 -0.0218 -0.1 013 -0.0266 0.0292 .6569
Number of kindergarten places per capita -0.0198 0.0458 0.5333 -0.0498 -0.0223 -0.0162 .4617
The number of primary school teachers per capita 0.0287 -0.0586 0.6029 -0.0051 0.0235 0.0204 .2985
Log number of high school teachers 0.4430 -0.0021 -0.0483 -0.0315 -0.0251 0.0006 .2212
Log number of college students 0.3411 0.0064 -0.0813 0.0196 -0.1739 -0.0605 .5583
Av ailability of library 0.2394 -0.1 592 0.0286 0.1 651 -0.1103 -0.0474 .7 308
Av ailability of museum 0.3250 0.0333 -0.0119 -0.0445 -0.0304 0.0215 .5763
Share of drinking water network connected dwellings -0.0069 -0.0204 -0.01 07 0.4958 -0.0761 -0.0053 .5992
Share of sewer network connected dwellings 0.0842 0.2755 -0.0019 0.1 051 0.1177 0.0949 .5605
Share of gas network connected dwellings 0.0432 0.1 096 0.0634 0.1340 0.3317 0.1 028 .4989