Internal Migration in Israel
30
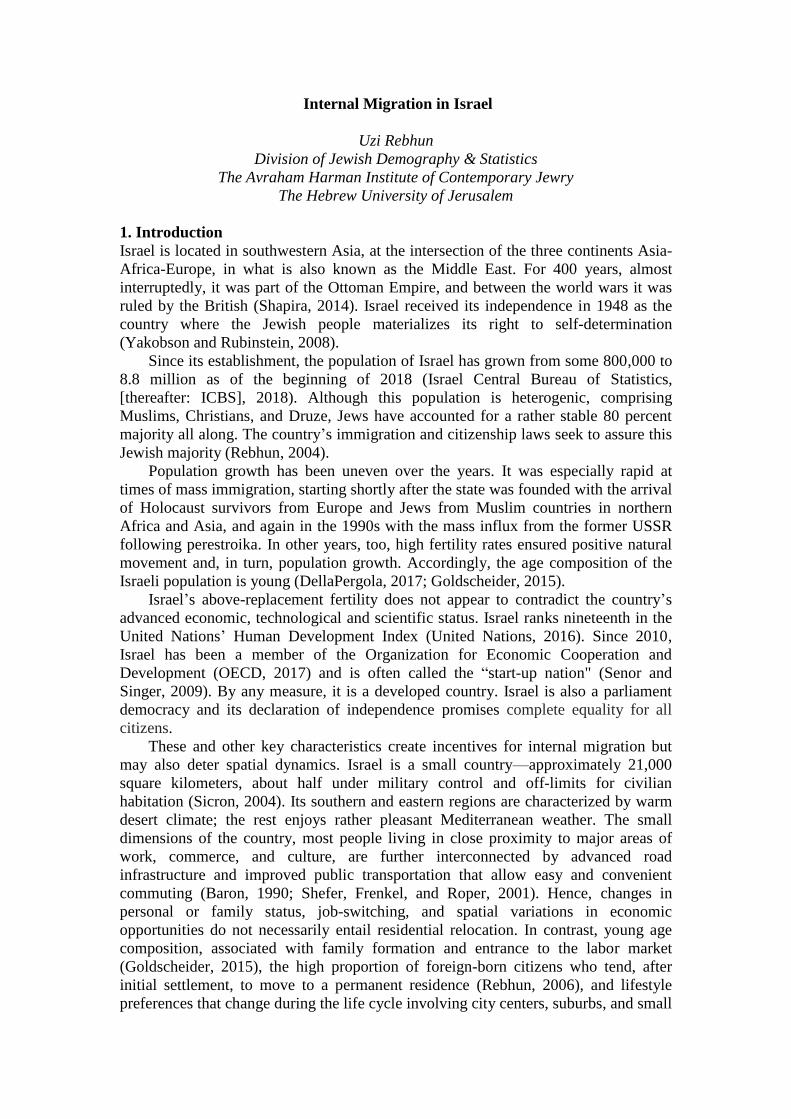
Internal Migration in Israel Uzi Rebhun Division of Jewish Demography & Statistics The Avraham Harman Institute of Contemporary Jewry The Hebrew University of Jerusalem 1. Introduction Israel is located in southwestern Asia, at the intersection of the three continents Asia- Africa-Europe, in what is also known as the Middle East. For 400 years, almost interruptedly, it was part of the Ottoman Empire, and between the world wars it was ruled by the British (Shapira, 2014). Israel received its independence in 1948 as the country where the Jewish people materializes its right to self-determination (Yakobson and Rubinstein, 2008). Since its establishment, the population of Israel has grown from some 800,000 to 8.8 million as of the beginning of 2018 (Israel Central Bureau of Statistics, [thereafter: ICBS], 2018). Although this population is heterogenic, comprising Muslims, Christians, and Druze, Jews have accounted for a rather stable 80 percent majority all along. The country’s immigration and citizenship laws seek to assure this Jewish majority (Rebhun, 2004). Population growth has been uneven over the years. It was especially rapid at times of mass immigration, starting shortly after the state was founded with the arrival of Holocaust survivors from Europe and Jews from Muslim countries in northern Africa and Asia, and again in the 1990s with the mass influx from the former USSR following perestroika. In other years, too, high fertility rates ensured positive natural movement and, in turn, population growth. Accordingly, the age composition of the Israeli population is young (DellaPergola, 2017; Goldscheider, 2015). Israel’s above-replacement fertility does not appear to contradict the country’s advanced economic, technological and scientific status. Israel ranks nineteenth in the United Nations’ Human Development Index (United Nations, 2016). Since 2010, Israel has been a member of the Organization for Economic Cooperation and Development (OECD, 2017) and is often called the “start-up nation" (Senor and Singer, 2009). By any measure, it is a developed country. Israel is also a parliament democracy and its declaration of independence promises complete equality for all citizens. These and other key characteristics create incentives for internal migration but may also deter spatial dynamics. Israel is a small country—approximately 21,000 square kilometers, about half under military control and off-limits for civilian habitation (Sicron, 2004). Its southern and eastern regions are characterized by warm desert climate; the rest enjoys rather pleasant Mediterranean weather. The small dimensions of the country, most people living in close proximity to major areas of work, commerce, and culture, are further interconnected by advanced road infrastructure and improved public transportation that allow easy and convenient commuting (Baron, 1990; Shefer, Frenkel, and Roper, 2001). Hence, changes in personal or family status, job-switching, and spatial variations in economic opportunities do not necessarily entail residential relocation. In contrast, young age composition, associated with family formation and entrance to the labor market (Goldscheider, 2015), the high proportion of foreign-born citizens who tend, after initial settlement, to move to a permanent residence (Rebhun, 2006), and lifestyle preferences that change during the life cycle involving city centers, suburbs, and small
Transcript of Internal Migration in Israel
Internal Migration in Israel
Uzi Rebhun
Division of Jewish Demography & Statistics
The Avraham Harman Institute of Contemporary Jewry
The Hebrew University of Jerusalem
1. Introduction
Israel is located in southwestern Asia, at the intersection of the three continents Asia-
Africa-Europe, in what is also known as the Middle East. For 400 years, almost
interruptedly, it was part of the Ottoman Empire, and between the world wars it was
ruled by the British (Shapira, 2014). Israel received its independence in 1948 as the
country where the Jewish people materializes its right to self-determination
(Yakobson and Rubinstein, 2008).
Since its establishment, the population of Israel has grown from some 800,000 to
8.8 million as of the beginning of 2018 (Israel Central Bureau of Statistics,
[thereafter: ICBS], 2018). Although this population is heterogenic, comprising
Muslims, Christians, and Druze, Jews have accounted for a rather stable 80 percent
majority all along. The country’s immigration and citizenship laws seek to assure this
Jewish majority (Rebhun, 2004).
Population growth has been uneven over the years. It was especially rapid at
times of mass immigration, starting shortly after the state was founded with the arrival
of Holocaust survivors from Europe and Jews from Muslim countries in northern
Africa and Asia, and again in the 1990s with the mass influx from the former USSR
following perestroika. In other years, too, high fertility rates ensured positive natural
movement and, in turn, population growth. Accordingly, the age composition of the
Israeli population is young (DellaPergola, 2017; Goldscheider, 2015).
Israel’s above-replacement fertility does not appear to contradict the country’s
advanced economic, technological and scientific status. Israel ranks nineteenth in the
United Nations’ Human Development Index (United Nations, 2016). Since 2010,
Israel has been a member of the Organization for Economic Cooperation and
Development (OECD, 2017) and is often called the “start-up nation" (Senor and
Singer, 2009). By any measure, it is a developed country. Israel is also a parliament
democracy and its declaration of independence promises complete equality for all
citizens.
These and other key characteristics create incentives for internal migration but
may also deter spatial dynamics. Israel is a small country—approximately 21,000
square kilometers, about half under military control and off-limits for civilian
habitation (Sicron, 2004). Its southern and eastern regions are characterized by warm
desert climate; the rest enjoys rather pleasant Mediterranean weather. The small
dimensions of the country, most people living in close proximity to major areas of
work, commerce, and culture, are further interconnected by advanced road
infrastructure and improved public transportation that allow easy and convenient
commuting (Baron, 1990; Shefer, Frenkel, and Roper, 2001). Hence, changes in
personal or family status, job-switching, and spatial variations in economic
opportunities do not necessarily entail residential relocation. In contrast, young age
composition, associated with family formation and entrance to the labor market
(Goldscheider, 2015), the high proportion of foreign-born citizens who tend, after
initial settlement, to move to a permanent residence (Rebhun, 2006), and lifestyle
preferences that change during the life cycle involving city centers, suburbs, and small

and distant localities, as well as differential housing prices (Lipshitz, 1998; Newman,
2000) may generate intensive population movement. Likewise, ever since Israel was
established, its governments have viewed the population as an instrument for spatial
planning, encouraging dispersion especially to the national periphery and border areas
(Eisenstadt, 1973).
2. Empirical Infrastructure
Statistics on internal migration in Israel are derived from three major sources, all of
which are governmental official data: population registers (Ministry of the Interior,
Population and Immigration Authority), population censuses (conducted
approximately once every ten years by the ICBS), and nationally representative
population surveys. Each instrument yields a different type of migration data in terms
of pattern of internal migration, time interval covered, and the ability to connect
migration status with other individual demographic and socio-economic
characteristics (Tables 1 & 1A).
Population registers. People who change addresses are required to report the
change to the Population and Immigration Authority. All those who do so by the last
day of a given year are included in a database of internal migration for the respective
year. Beginning in 1981, changes of address were also documented on the basis of
application forms for passport issuance or renewal, application for identity cards, and
birth notifications. The use of the last-mentioned was discontinued in mid-1990; when
it was used, the number of address changes registered was much larger (ICBS, 2017,
p. 6). The information on internal migration from the population register is published
annually in the Statistical Abstract of Israel.
The data provide insights on migration between localities. The data differentiate
between in-migrants (from one locality to another within a given geographic unit or
from a locality in a different unit) and out-migration (those who left one locality in
favor of another locality in the same geographic unit together with those who made a
more meaningful move to another geographic unit). These data are presented in
respect of both the entire population and the Jewish population alone, making it easy
to calculate migration between localities for non-Jews as well.
The Statistical Abstract also includes data on the number of in-migrants and out-
migrants for each major geographic unit, the migration balance, and the migration rate
per thousand of population. This information is also shown separately for urban
localities in general and size of locality in particular, including specific major cities,
and for rural localities, which are further disaggregated by type of internal
organization and status. On the basis of these vital statistics, ICBS occasionally
prepares special publications on internal migrants’ demographic characteristics such
as age, gender, and religion, and on the internal migration patterns of recent
immigrants. These special publications may also include data on intra-locality
migration.
Censuses. Israel has carried out six censuses to date—first in 1948, a few months
after the foundation of the state, and thereafter in 1961, 1972, 1983, 1995, and 2008.
At the present writing (2018), ICBS is preparing for a new census, scheduled to take
place in 2020.
The first census asked one question about internal migration, concerning the year
of moving to the current address. This question was repeated in the following two
censuses as well as that of 2008. More consistent is the question about year of arrival
in current locality, which has appeared in all censuses since 1961.

The censuses document the locality of residence at a fixed time in the past,
namely, five years ago. This makes it possible to classify the population according to
whether a person lives at the same address or at a different one. Further, among
migrants the census can determine whether the move was within the same locality or
between localities and, for the latter, by different spatial units (i.e., natural areas, sub-
districts, or districts). The most recent census (2008) introduced a new question on
previous locality of residence.
Unlike the common practice in American censuses (at the state level), the Israeli
census does not inquire into the place of birth in the country of the native-born. This
impediment prevents sorting the population into non-migrants, early migrants,
primary migrants, repeat migrants, and return migrants. This can be overcome by
linking census data with information from population registers on place/locality of
birth. The Israeli censuses also lack a question on place of residence one year ago, as
appears in the American Community Survey (ACS).
Surveys. Since 2002, on an annual basis, ICBS has been conducting what is
known as the Social Survey. Each year, the survey is based on a different
representative sample of the Israeli population. The survey has a permanent core
questionnaire and a changing section that explores a different topic at length. Two
items in the core questionnaire elicit information on internal migration: number of
years in locality and number of years respondent resides in h/her current dwelling.
These questions allow a distinction to be made between people who reside in their
locality of birth and those who do not. The statistics they yield can also identify
people who made an intra-locality move, i.e., between dwellings within the same
locality. Thus, overall, one can use the Social Survey to sort respondents into three
groups of lifetime migration: non-migrants, migrants between localities, and mixed
migrants, i.e., people who switched localities and later relocated within the same
locality. Given that the survey is conducted every year, it can be used to monitor
changes in the distribution of the population by these three groups over time.
Another project is a longitudinal survey sponsored by five governmental
authorities: ICBS, the Bank of Israel, the National Insurance Institute, the Ministry of
Finance, and the Ministry of Education. This survey began in 2012 and has gone
through six waves thus far, each including a core questionnaire on five variables
(household structure, state of health, schooling, employment, and income) and topics
investigated cyclically. Since this survey is based on repeated observations of the
same sample of people, it can be used to document changes in their places of
residence according to different spatial units and to assess the determinants of
different types of internal migration countrywide.

Table 1. Sources and Types of Data on Internal Migration
Population registers Censuses1 Surveys
Intra-locality migration Year moved to current
dwelling
Life-time migration
Inter-locality migration Year moved to current
locality
Annual movement
Five-year migration status
Previous locality of
residence
Table 1A. Internal Migration Data in Israeli Censuses, 1948–2008
Census Year moved to
current
dwelling
Year moved to
current locality
Residence five
years ago
Previous
locality of
residence
1948 √
1961 √ √ √
1972 √ √ √
1983 √ √
1995 √ √
2008 √ √ √ √
3. Geographic Administration
Israel is officially divided into six districts: Northern, Haifa, Central, Tel Aviv,
Jerusalem, and Southern (Map 1). Each district other than Tel Aviv is divided into
sub-districts (fifteen in all, countrywide). These sub-districts, in turn, are classified
into fifty natural areas that, to the extent possible, are continuous and uniform in
topographic and climatic structure and population characteristics. Apart from the six
districts, the West Bank has been considered a distinct area since 1967. (It included
the Gaza Strip until 2005, when Israel unilaterally withdrew its military
administration and its civilian population) (ICBS, 2008).
Another spatial distinction is between urban localities and rural localities.
Localities are classified irrespective of their economic nature (agricultural or not) and
other attributes; the sole criterion is the size of their population, with the cutoff point
at 2,000. At the beginning of 2015 Israel had 1,211 localities: 247 urban and 964 rural
(ICBS, 2015). Each of the country’s six districts is comprised of both urban and rural
localities. The respective types of localities, however, are not evenly spread among
the districts. Rural localities are disproportionately located in peripheral areas: the
Northern District (332 localities) and the Southern District (223 localities).
Nevertheless, a substantial number of rural localities, 188, are found in the Central
District. Tel Aviv is the only district that has more urban than rural localities.
Notably, the total number of localities also includes Jewish settlements in the disputed
territories of the West Bank (a total of 125, of which 33 are urban and 92 rural).
1 See Table 1A for details by specific censuses.

Urban localities are sorted into eight categories ranked by population size (half a
million or above, 200,000–499,000, 100,000–199,999, etc., down to 2,000–4,999).
The rural category is also quite diverse and distinguishes among different types of
internal organization and status such as moshav, collective moshav, and kibbutz (all
of which exhibit some kind of economic cooperation among inhabitants in production,
marketing, or consumption), institutional or communal localities (with no economic
cooperation), and others.
Israel also has four metropolitan areas, each named for its major city: Haifa, Tel
Aviv, Jerusalem, and Be’er Sheva (the southern part of the country). Metropolitan
areas are large geographic units that may include localities in several districts.
Localities not included in one of the metropolitan areas are aggregated into a single
non-metropolitan area. Notably, for a long time there were only two metropolitan
areas (Haifa and Tel Aviv). The Be’er Sheva metropolitan area was defined in 2001
and in 2013 the borders of the existing metropolitan areas were redrawn and a fourth
metropolitan area (Jerusalem) was added. This suggests that Israel, much like other
Western countries, is experiencing the movement of people from city centers to
surrounding localities, often involving lifestyle changes. In the midst of this process,
the population of the city declines while that of the metropolitan area increases.
The geographic administration described above generates three possible spatial
levels at which internal migration may be measured: locality, district, and
metropolitan. The locality level sort migrants by whether or not they have made an
intra- or inter-locality move and, among the latter, whether the localities of origin and
destination were both urban, both rural, or of different types (urban–rural/rural–
urban). The second level, that of the district, distinguishes among migration within
one natural area, between natural areas within one sub-district, between sub-districts
within a given district, and between districts. The third level, the metropolitan,
identifies people who moved within one metropolitan area, migrated between
metropolitan areas, moved from a metropolitan area to a non-metropolitan area, and
who moved in the reverse direction (from a non-metropolitan to a metropolitan area).
These typologies are not necessarily mutually exclusive. For example, an
individual may move from an urban locality to a rural one, each in a different district.
Similarly, one may migrate from an urban locality to another urban locality, each in a
different district and a different metropolitan area. In other cases, migration is
mutually exclusive, e.g., between localities across natural areas with both localities
being urban, located in the same district, and in the same metropolitan area, making it
only a migration between natural areas.
The spatial division of the country largely coincides with the nature of the official
data collected on internal migration. The inter-locality migration records that appear
annually in the Statistical Abstract refer to larger geographic units of districts and
sub-districts, type of locality (urban/rural), size of urban locality, and type of rural
locality. The census question on place of residence five years ago makes it possible to
sort the population by all three typologies: locality, district, and metropolitan area (the
later mainly in regard to the latest census). Since the Social Survey does not inquire
into previous place of residence, specific areas/types of locality of origin cannot be
linked to current residence. Given that the longitudinal survey provides detailed
information on place of residence at the time of the interview, i.e., every year, those
who relocated can be classified by all the foregoing types of migration.

4. Literature Review
Although research on internal migration in Israel is far from copious, it has attracted
the attention of a wide range of scholars: demographers, geographers, sociologists,
economists, and environmental planners. These investigators have tackled different
patterns of migration, parsing them by defined areas of the country, type of locality,
dispersion to the periphery or concentration in major urban areas, and among sub-
populations by religious identity, ethnicity, and nativity status. Hence, they adopt
different geographic units for the measurement of spatial movement.
Trends in internal migration in Israel suggest that the formative years of statehood
saw a strong inclination to switch localities of residence. The rate of migration slowed
in the 1960s, increased slightly in the following decade, and then stabilized at average
levels for the entire period. The fluctuations are attributed mainly to the large numbers
of immigrants who first settled in temporary dwellings and later moved to permanent
housing (Ben-Moshe, 1989). Similarly, high rates of internal migration were observed
during and immediately after the peak years of the influx of Soviet/FSU immigrants
in the early 1990s; As Hasson (1995) shows, more than half of the immigrants who
arrived between 1990 and 1994 made an inter-locality move during this period—12
percent each year as against 4 percent among the nonimmigrant population.
The directions of movement at the district level have also changed over time.
During the first decades, the Jewish population exhibited a clear preference for
resettlement in the Tel Aviv District, on the one hand, and in the Southern District, on
the other, all other districts experiencing negative migration balances. Slightly later, in
the 1970s and 1980s, the migration balance of these two districts turned negative,
joining the Northern, Haifa, and the Jerusalem districts (although Haifa and Jerusalem
occasionally had positive balances). Now the Central District proved to be the most
attractive area and, despite some ups and downs in levels of net migration, it
consistently displayed stronger pull—attraction of new residents—than push, ejection
of veteran inhabitants (Ben-Moshe, 1989; Rebhun, 1989/90; Sicron, 2004). In the
early 1990s, the two most peripheral districts, North and South, had positive
migration balances, reflecting both the internal migration of Soviet/FSU immigrants
to permanent housing and the suburbanization of nonimmigrant Israelis—especially
to the north. These tendencies slowed toward the end of that decade. Thus, at the
beginning of the twenty-first century, only the Central District reported positive and
significant net migration whereas the Southern District had a balance very close to nil.
Notably, the West Bank has been characterized by positive migrant balances since
1967 (Sicron, 2004).
Another important dimension of internal migration distinguishes between center
and periphery. In the first four decades of statehood, internal migration strengthened
the demography of the large metropolitan areas at the expense of the most outlying
districts (Northern and Southern). It also distributed the metropolitan population to
nearby localities in a way that did not involve changes in area of employment
(Lipshitz, 1991; Shachar, 1975). Later on, people—mainly among the
socioeconomically strong segments of the population—started leaving “development
towns” in the peripheries not only to the center of the country but also to new
community-type localities in their districts. Others left the major cities and
metropolitan areas in favor of new localities in the periphery, but not to development
towns despite the economic opportunities that those localities now offered (Alfendari
and Shefer, 1992; Schwartz, 1990).
Differences in patterns of internal migration in different parts of the country
persist. In the North, people who leave development towns often remain within the

district and resettle in community-type localities; in the South, however, out-
migration from development towns streams mainly to the center of the country
(Braude and Navon, 2006). Overall, whether one judges by districts or by the spatial
structure of core-periphery, internal migration in Israel weakens demographically the
periphery and strengthens the center, and with a clear tendency to de-concentration of
the population in the latter (Lipshitz, 1998).
Internal migration in Israel is positively selective and is overrepresented in all its
types by young people, the highly educated, and those with above-average income
(Alfendari and Shefer, 1992; Ben-Moshe, 1989; Braude and Navon, 2006; Rebhun,
2006). Thus, people of European-American background are more mobile than their
counterparts of Asian-African origin (Goldscheider, 2015). These characteristics of
the migrants deepen the social and economic inequality between core and periphery
and, especially, between core and development towns.
The literature on internal migration of the Arab population is somewhat rare. "The
overall political control over internal migration limited the voluntary movements of
Arab Israelis through the mid-1960s; and informal constrains (including the lack of
accessible housing, limited economic networks and discrimination) continue to limit
their internal migration" (Goldscheider, 2015: 69-70). The main characteristic of this
population is the combination of residential segregation and a high level of
commuting (Goldscheider, 2015).
5. Intensity of Migration
5.1 Annual Rates
Israel’s vital statistics (population registers) document migration within and between
localities. On the basis of this information, some of which appearing in the Statistical
Abstracts or special ICBS publications and the rest originating in data especially
prepared for this study,2 it is possible to calculate Aggregate Crude Migration
Intensity (ACMI) and Crude Migration Intensity (CMI) indices.3 This is done below
for the total population and for Jews and non-Jews separately. Our time series covers
a three-decade span, from 1985 to 2015.
For the total Israeli population the ACMI measurement has fluctuated over time
(Figure 1) from 6.33 in 2003 to 9.92 in 1993. Throughout most of the period,
however, migration intensity has been steady at around 7. The years of exceptionally
strong intensity were 1992–1997, with ACMI scores of around 9. This strong
tendency can be partly explained by the large influx from the former USSR and the
relocation of recently arrived immigrants from temporary to permanent places of
residence. Further, when immigrants move into specific localities, often large cities,
natives may be encouraged to leave for smaller cities or the metropolitan periphery
(creating a “scissor action”; Lipshitz, 1998). After this spike, migration intensity
weakened, although not in a linear pattern, and bottomed out in 2003—a time of
“second Intifada” unrest. Since then, it has recovered and stabilized at a yearly ACMI
rate of 7–8.
2 ICBS, Internal Migration. I wish to thank Dr. Ahmad Hlihel and Ms. Yifat Shani for their
kind help in preparing theses data. 3 ACMI=M/P*100, where M is the total number of migrants in a given time interval and P is
the national population at risk of moving. CMI=M/P*100 whereas M is the number of people
who changed region of residence and P is the population at risk of moving between these
defined regions (Charles-Edwards, Bell, Bernard, and Zhu, forthcoming).

These ups and downs largely unpack the migration patterns of Jews. Their
intensity, however, is slightly higher than that of the total population, as evidenced in
the broken line being above the continuous line throughout the period under
investigation. In many years in the last decade of the twentieth century, their ACMI
reached 10 or even 11.
The major shift among non-Jews is in the direction of more intensive migration.
This was especially salient during the 1990s; for one year, 1997, the non-Jewish
AMCI even converged with that of the Jews. Although it has declined since then, the
non-Jewish population remains more inclined to migrate today than it did in the
second half of the 1980s. The evidence that the 1990s were characterized by strong
migration intensity not only among Jews but also among non-Jews suggests that the
momentum of housing construction in that decade, although intended mainly for
immigrants, also affected the nonimmigrant population, Jewish and non-Jewish alike.
It is also possible that the positive political atmosphere in these years—driven by the
Oslo agreement between Israel and the Palestinians, the Israel–Jordan peace treaty,
and economic growth after a decade of very high inflation—motivated people to
improve their standard of living, resulting in high levels of internal migration.
Figure 1. Aggregate Crude Migration Intensity (ACMI) for
Total Population, Jews, and Non-Jews, 1985–2015
Obviously, CMI is lower than ACMI because it measures only migration between
geographic units (inter-locality migration in our case) (Figure 2). The difference
between the two measures attests to the division between intra- and inter-locality
migration. Still, the shape of the curves is very similar for both measures and in
regard to total population, Jews, and non-Jews. What is somewhat striking in the CMI
measure is the sharpness of the changes even as the intensity of overall migration
(ACMI) varied more smoothly. I interpret this by suggesting that ACMI includes
migration within localities, a rather regular process, whereas CMI is concerned only
with moves between localities—demarches that are more meaningful and,
accordingly, are more strongly affected by macro economic and social factors.

Figure 2. Crude Migration Intensity (CMI) for
Total Population, Jews, and Non-Jews, 1985–2015
5.2 Five-Year Migration Status
The Israeli censuses provide insights into another measure of internal migration: a
fixed interval of five years. Starting our examination with the 1983 census, 12.1
percent of the population is found to have moved between localities in the preceding
five years (1978–1983) (the two categories of migration within same district and
between different districts, Table 2). The rate accelerated slightly to 12.9 percent for
the five years preceding the next census (1990–1995) but receded to 11.7 percent in
2003–2008. These fluctuations are probably related to the mass immigration from the
former USSR after perestroika, which peaked in 1990; these immigrants tended first
to rent a dwelling and later to purchase and move into homes of their own (Borukhov,
1995), often involving changes in locality of residence (Hasson, 1995; Rebhun, 2006).
Next, I assess the tendency to stay within the same district or to move to a new
district. In all three periods, a larger proportion made an inter-district move than an
intra-district one. Over time, the gap between these two types of internal migration
widened in favor of the former: among all people who switched localities, the
proportion who crossed district boundaries increased from 52.9 percent in 1978–1983
to 58.1 percent in 1990–1995 and a record 62.1 percent in 2003–2008.
The above depicted fluctuations of inter-locality migration characterize the
Jewish population. Similarly is the increasing tendency to move from one district to
another vs. between localities within a given district. By contrast, non-Jews
experienced a diminution in their tendency to move to another locality. Over the first
two periods, among those who relocated to another locality, less than half made an
inter-district move (28.2 percent in 1978-1983 and 38.8 percent for 1990-1995); only
the migrants from 2003 and 2008 started moving between districts at a higher rate
with the proportion (54.5 percent of all inter-locality migrants) somewhat resembling
those of Jews.

Table 2. Five-Year Migration Status of Population at Risk
1978–19831 1990–19952 2003–20083
Total
Total 100.0 100.0 100.0
Same address 74.0 72.2 72.2
Same locality 13.9 14.9 16.1
Same district 5.7 5.4 4.4
Different district 6.4 7.5 7.3
Jews
Total 100.0 100.0 100.0
Same address 70.6 68.5 69.2
Same locality 15.8 16.8 17.4
Same district 6.2 6.0 5.0
Different district 7.4 8.7 8.4
Non-Jews
Total 100.0 100.0 100.0
Same address 92.2 90.3 86.9
Same locality 4.0 6.1 9.8
Same district 2.7 2.2 1.5
Different district 1.1 1.4 1.8
1) Adapted from: Israel Central Bureau of Statistics, 1983, Census of Population and Housing
Publications, Internal Migration—Part A (Population and Residence in 1983 and 1978), No.
16, pp. 74, 306 (1988).
2) Israel Central Bureau of Statistics, 1995 Census of Housing and Population, Census File
(data processing by ADRI of IPUMS).
3) Israel Central Bureau of Statistics, 2008 Census of Housing and Population, Census File
(analysis by the author).
The next variable examined is five-year migration status parsed by metropolitan
and non-metropolitan areas. Since the definitions of these areas have changed over
time, the analysis here focuses only on the last Israeli census, that of 2008 (Table 3).
Among inhabitants who were geographically stable over the 2003–2008 period,
nearly half (49.5 percent) lived in metropolitan areas and approximately one-fifth
(22.7 percent) resided in non-metropolitan areas. Of those who moved, 17.7 percent
changed locality within a given metropolitan area and another 1.3 percent moved
from one metropolitan area to another. In the non-metropolitan area of the country—a
single geographic unit—5.7 percent of the population moved between different non-
metropolitan localities. Migration that involved not only change of locality of
residence but also of the nature of area encompassed the 1.9 percent of the population
that moved from a non-metropolitan area to a metropolitan area and another 1.2
percent who moved from a metropolitan area to a non-metropolitan one.
The patterns described largely reflect the Jewish population of the country (Table
3). The non-Jewish population tends more to reside in non-metropolitan localities.
Insofar as non-Jews relocate, they express preference for the same type of area, be it
metropolitan or non-metropolitan. Only 1.2 percent of non-Jews moved between
different types of areas, and the majority of them, as with Jews, favored a
metropolitan area over a non-metropolitan area as against the reverse direction of
migration.

Table 3. Five-Year Metropolitan and Non-Metropolitan Migration Status,
2003-2008
Total Jews Non-Jews
Total 100.0 100.0 100.0
Same address in
metropolitan area
49.5 52.5 35.6
Different address,
same metropolitan
area
17.7 20.3 4.9
Other metropolitan
area
1.3 1.5 0.2
From non-
metropolitan to
metropolitan area
1.9 2.2 0.8
Same address, non-
metropolitan area
22.7 16.7 51.4
From non-
metropolitan to
non-metropolitan
area
5.7 5.6 6.7
From metropolitan
to non-metropolitan
area
1.2 1.3 0.4
1) My analysis of data from the 2008 Census of Population and Housing.
5.3 Urban/Rural Migration
Another dimension of internal migration is within or between different types of
locality. People may move from one urban locality to another, from one rural locality
to another, or between different types of localities—urban to rural or rural to urban.
Below I use population censuses to measure the extent of each type of urban/rural
migration and how the patterns have changed over time (Table 4).
Among those who changed locality of residence in 1978–1983, slightly more
than three-quarters (77.5 percent) moved between cities (urban–urban), and another
3.1 percent moved between two rural localities. The remaining migrants changed their
type of residence: 9.4 percent from rural to urban, contributing to the urbanization of
the country, and slightly more, 10 percent, from urban to rural, enhancing the
dispersion of the population. By 2003–2008, the proportion of urban-to-urban
migrants declined to two-thirds and the tendency to move from rural to urban
localities somewhat weakened, to 7.9 percent. Israelis strengthened their rural-to-rural
moves (7.6 percent of all migrants between localities) and, especially, from urban to
rural (17.1 percent).
This depiction reflects the migration patterns of the Jewish population. Non-Jews
tend more to move from rural localities to urban ones (12.5 percent) and less from
urban to rural (8 percent). These preferences have gained strength over time: by
2003–2008, one-fourth of non-Jewish migration was from rural localities to urban

localities (twice the rate in 1978–1983) and only 4.6 percent moved from urban
localities to rural one (a decline of about half relative to the earlier period).4
Table 4. Five-Year Migration Status by Origin Locality and Destination
Locality, 1978–1983 and 2003–2008
Total Urban–
urban
Rural–rural Urban–
rural
Rural–
urban
1978-19831
Total 100.0 77.5 3.1 10.0 9.4
Jews 100.0 77.5 3.1 10.1 9.2
Non-Jews 100.0 76.0 3.5 8.0 12.5
2003-20082
Total 100.0 67.4 7.6 17.1 7.9
Jews 100.0 67.4 7.7 17.6 7.3
Non-Jews 100.0 69.2 1.9 4.6 24.3
1) Adapted from: CBS, Internal Migration—Part A, 1983 Census of Population and Housing,
Publication No. 16, pp. 306–308, 1988.
2) My analysis of data from the 2008 Census of Population and Housing.
6. Migration Selectivities
Migration is not distributed evenly across the population. Rather, it is selective and
people with certain characteristics tend to relocate more than others do (Bogue, 1959;
Lee, 1966; White and Mueser, 1994). Stages in the life cycle including acquisition of
academic education, joining the labor force, and changes in marital status often
involve residential relocation. Since these events usually occur within a well-defined
age interval, they help to shape the curve of migration selectivity by age, in which
adolescents and young adults are overrepresented relative to the total population
(Long, 1988). Likewise, immigrants’ internal migration patterns differ from those of
the native-born population. Immigrants initially tend to settle in close geographic
proximity to others of the same nativity or ethnic extraction. As immigrants prolong
their stay in the destination country, acquire new skills, improve their information on
opportunities in alternative areas, and amass additional human capital, they evince a
higher rate of internal migration than that of the native-born (Bartal and Koch, 1991;
Rogers, Henning and Little, 1995). Still, other immigrants have lower propensity for
subsequent resettlement if they live in communities that they share with compatriots
(Kritz and Nogle, 1994; Gurak and Kritz, 2000; Newbold, 1996; Rebhun, 2006).
6.1 Who Moves?
Here I assess the relation between inter-locality migration and three key demographic
and social characteristics: age, marital status, and education. For Jews, I also show the
4 Israel is a highly urbanized country and has become more and more so, albeit not
consistently, over time. In 1955, shortly after the establishment of the state, 83 percent of the
population was concentrated in places that had populations of 2,000 or more. By 2015, the
proportion increased to 91.2 percent (ICBS, Statistical Abstract, various years). This trend is
observed for Jews and non-Jews alike, although it is more significant among the latter. Most
of the increase in the share of the urban population traces to natural increase. Among Jews, it
compensated for larger flows of people from urban to rural localities than in the opposite
direction, increasing the share of rural inhabitants; among non-Jews, the increase in the
proportion of urban residents coincides with the directions of this population’s internal
migration.

relations between internal migration and nativity status and, among the foreign-born,
according to duration in the country. I focus on five-year migration between 2003 and
2008. Notably, I found no substantial differences in migration intensity by gender.
Internal migration among Israeli Jews is strongly tied with age. The age curve is
shaped like a reverse J: the migration rate is already somewhat high among people
aged 18–24 (12.8 percent) and then climbs significantly to a peak of 32 percent
among those aged 25–34. In the next age group (35–49) it declines to 11.5 percent
and falls again, by about half, in the two oldest age cohorts (Table 5). The non-Jewish
population shows a similar pattern. Since non-Jews’ rates of migration are low
overall, the differentials by age groups are small as well. Still, the volume of
migration between localities among non-Jews declines by more than half among
people aged 35–49 as against their adjacent younger peers.
Marital status is loosely associated with migration. Indeed, Jewish singles,
divorced, and separated move more than married people do but the gaps are not
substantial. The group that had little tendency to relocate is the widowed, whose
migration rate is about half that of the other groups. Among non-Jews, the divorced
and separated have exceptional high rates of migration. We speculate that this is
associated with religious and cultural customs of women returning to their parents’
home after divorce, where under the Sharia (Islamic law) they remain in the custody
of their father (unless they are mothers who wish to remain near their children).
Although the trend is not completely linear, the tendency to migrate increases
with education. Among Jews, while only about six percent of those with fewer than
eight years of schooling switched localities in 2003–2008, the rate increased to
approximately ten percent among people with 11–12 years of schooling, 17.2 percent
for those with post-secondary education (13–15 years), and as high as two of every
ten people with sixteen years of education or more (equivalent to a baccalaureate
degree or advanced academic studies). The differences among non-Jews range from
one percent among those with no schooling at all to eight percent among those at the
highest educational category.
Given that Israel’s Law of Return limits immigration to Jews and their close kin,
our examination of the relationship between nativity status and internal migration is
limited to Jews alone. The findings in Table 5 suggest that the native-born are more
inclined to move than are the foreign-born. Among the latter, migration increases
commensurate with shorter duration in the country. This confirms our earlier
speculation that recently arrived immigrants first settle in rented accommodations and
after a short period of adjustment tend to relocate to permanent housing, causing high
levels of internal migration.
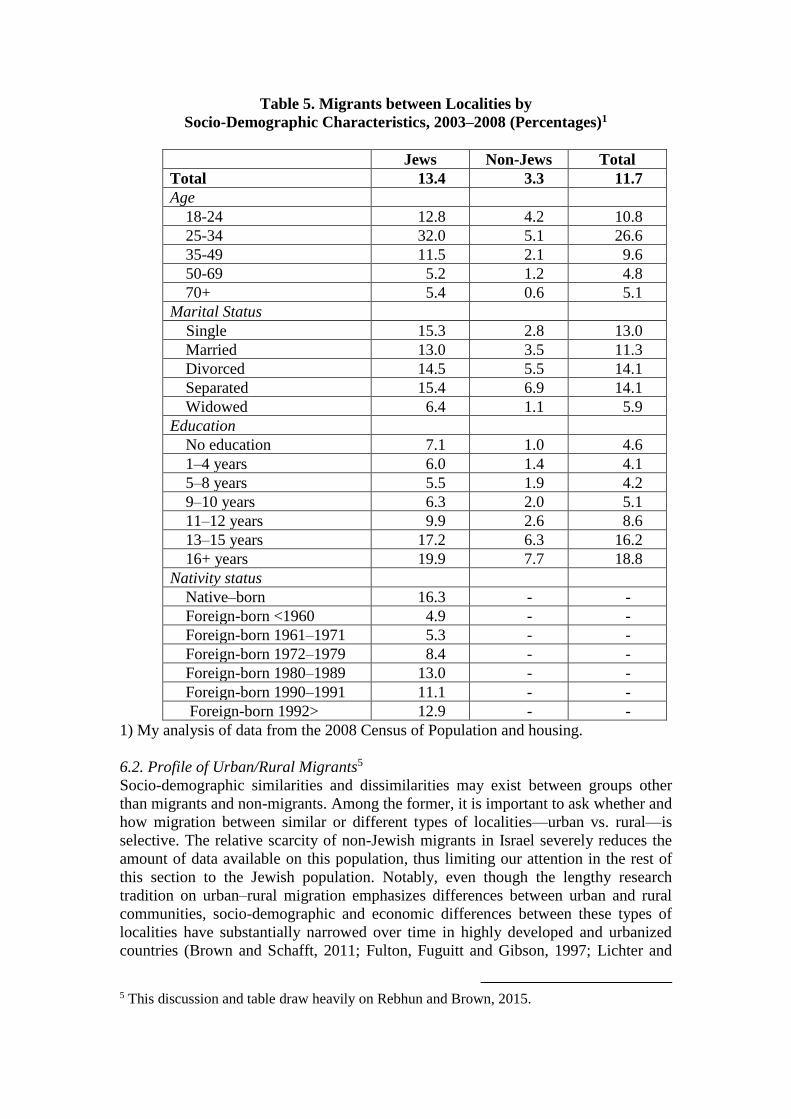
Table 5. Migrants between Localities by
Socio-Demographic Characteristics, 2003–2008 (Percentages)1
Jews Non-Jews Total
Total 13.4 3.3 11.7
Age
18-24 12.8 4.2 10.8
25-34 32.0 5.1 26.6
35-49 11.5 2.1 9.6
50-69 5.2 1.2 4.8
70+ 5.4 0.6 5.1
Marital Status
Single 15.3 2.8 13.0
Married 13.0 3.5 11.3
Divorced 14.5 5.5 14.1
Separated 15.4 6.9 14.1
Widowed 6.4 1.1 5.9
Education
No education 7.1 1.0 4.6
1–4 years 6.0 1.4 4.1
5–8 years 5.5 1.9 4.2
9–10 years 6.3 2.0 5.1
11–12 years 9.9 2.6 8.6
13–15 years 17.2 6.3 16.2
16+ years 19.9 7.7 18.8
Nativity status
Native–born 16.3 - -
Foreign-born <1960 4.9 - -
Foreign-born 1961–1971 5.3 - -
Foreign-born 1972–1979 8.4 - -
Foreign-born 1980–1989 13.0 - -
Foreign-born 1990–1991 11.1 - -
Foreign-born 1992> 12.9 - -
1) My analysis of data from the 2008 Census of Population and housing.
6.2. Profile of Urban/Rural Migrants5
Socio-demographic similarities and dissimilarities may exist between groups other
than migrants and non-migrants. Among the former, it is important to ask whether and
how migration between similar or different types of localities—urban vs. rural—is
selective. The relative scarcity of non-Jewish migrants in Israel severely reduces the
amount of data available on this population, thus limiting our attention in the rest of
this section to the Jewish population. Notably, even though the lengthy research
tradition on urban–rural migration emphasizes differences between urban and rural
communities, socio-demographic and economic differences between these types of
localities have substantially narrowed over time in highly developed and urbanized
countries (Brown and Schafft, 2011; Fulton, Fuguitt and Gibson, 1997; Lichter and
5 This discussion and table draw heavily on Rebhun and Brown, 2015.

Brown, 2011). This is likely to affect the characteristics of migrants by types of origin
and destination localities.
Comparing rural to urban migrants with counterparts who made the opposite
move, I find that the former are somewhat younger, much less likely to be married,
more likely to be single or divorced, and less likely to have a college education (Table
6). People who moved between rural localities vs. rural–urban migrants are more
likely to be middle aged and married and less likely to be either young adults or
elderly. Data on education attainment show few systematic differences between the
groups. Turning to urban–urban migrants in comparison with rural-to-urban ones, I
find them less likely to be young adults or of early middle age and more likely to be
elderly, married, foreign-born, and educated beyond the baccalaureate level. In
contrast, they are less likely to be young adults and more likely to have the lowest
levels of educational attainment.
Overall, rural–urban migrants seem to be at an earlier stage in life and somewhat
lower in educational attainment than urbanites who move to rural areas. Compared
with urban–rural migrants, people who move from one rural place to another are
middle-aged and unmarried. As against urban–rural migrants, people who move from
one urban place to another are more likely to be elders, unmarried, foreign-born, and
at either the lowest or the highest levels of educational attainment.

Table 6. Comparative Profile of Jewish Migrants by Type of Origin and
Destination Localities, 2003–2008
1) Source: Rebhun and Brown, 2015
7. Population Redistribution
What are the directions of internal migration? How does internal migration reshape
the spatial distribution of the population? Are these effects uniform or do they vary
over time and across major subgroups? In this section I first investigate the annual
gain or loss from internal migration of the six districts of the country and the West
Bank and assess the role of migration in changing the size of the population in each of
these areas. Then, utilizing data from the latest census, I present a matrix of five-year
migration flows between districts and a measure for the efficiency of migration in
redistributing the population. A separate discussion deals with migration balances
between urban and rural localities and the effectiveness of this migration for urban
and rural settlement countrywide.
7.1. Annual Migration between Districts
The left-hand panel of Table 7 shows the migration balances between districts for
2000–2016. These statistics were calculated from the Statistical Abstracts, which
Total Urban–
urban
Rural–
rural
Urban–
rural
Rural–
urban
Age 100.0 100.0 100.0 100.0 100.0
Age 25–34 53.2 54.2 44.6 51.2 58.7
Age 35–44 23.2 20.6 30.4 30.1 22.6
Age 45–64 16.3 16.1 22.7 14.7 14.7
Age 65+ 7.3 9.1 2.3 4.0 4.0
Marital Status 100.0 100.0 100.0 100.0 100.0
Single 24.7 25.6 20.7 20.2 31.8
Married 59.7 57.5 66.3 68.2 52.7
Divorced/Separated 11.8 12.4 11.3 9.2 13.2
Widowed 3.7 4.5 1.8 2.4 2.4
Education 100.0 100.0 100.0 100.0 100.0
1–8 years 7.6 9.1 5.0 4.4 4.9
High school no matriculation 13.2 13.0 14.9 13.6 12.6
High school with matriculation 21.5 20.6 23.8 21.2 27.4
Vocational 14.1 13.6 17.6 14.7 14.0
Baccalaureate degree 30.4 30.0 28.2 32.6 31.1
Masters degree or higher 13.1 13.7 10.5 13.4 10.0
Nativity status 100.0 100.0 100.0 100.0 100.0
Native-born 75.2 70.7 84.2 84.8 83.7
Foreign-born 0–5 3.1 3.8 1.6 0.9 2.5
Foreign-born 6–10 4.5 5.7 2.3 1.8 2.7
Foreign-born 11+ 17.2 19.8 11.8 12.5 11.0

document residents’ notifications of change of address. The balances attest to a
tendency among Israelis to reject five districts in favor of the Central District and
Jewish settlements in the West Bank (Column A). The biggest losers in terms of net
migration are the Jerusalem and Tel Aviv districts, each having a negative balance of
slightly more than 80,000 people. A substantial deficit is also observed for the two
peripheral districts, the Northern and Southern, which lost 40,000 and 34,000
inhabitants, respectively. Haifa District posted a much more moderate loss. Notably,
these numbers are the sums of annual records; a detailed look at yearly balances (not
shown here) suggests that the gains and losses of the various districts are very
consistent with few deviations from the trend, especially in the Haifa and Tel Aviv
districts.
The trends reported above reflect the balances (positive or negative) and, to a
large extent, the size of gains or losses of the various areas among the Jewish
population (Column B). Non-Jews move on a much smaller scale. Unlike their Jewish
peers, the non-Jewish population in the Haifa, Tel Aviv and Southern districts gains
from internal migration (Column C).
For each district, I calculated the share of the internal migration balance in the
overall growth of the local population (the other components being natural movement
and international migration). The proportion of internal migration in districts that lost
population ranges from 9 percent for the Haifa and Southern districts to one-third for
the Tel Aviv district. Conversely, the positive migration balance of the Central district
and the West Bank accounts for 29.8 percent and 28 percent, respectively, of their
population growth during the research period (Column D). Since the overwhelming
majority of migrants are Jews, when the share of migration balances in growth is
calculated the effects are much larger among this population than among the total
population (Column E). This is especially salient for districts that have large non-
Jewish populations (Jerusalem, Northern, Haifa, and Southern), which are now
removed from the denominator. Although the positive net migration of non-Jews in
the Tel Aviv district was rather small, it contributed significantly (7.8 percent) to the
growth of this population in the district (Column F).
Table 7. Inter-District Migration Balance and Share of Internal Migration in
District’s Population Growth, 2000–20161
Migration balance
(thousands)
Percent of migration balance in
population growth
Total
(A)
Jews
(B)
Non-Jews
(C)
Total
(D)
Jews
(E)
Non-Jews
(F)
Jerusalem -88.5 -83.4 -2.1 -25.7 -41.5 -1.5
Northern -40.4 -22.2 -5.9 -11.6 -20.9 -3.1
Haifa -17.9 -17.7 +2.8 -9.3 -22.3 +3.5
Central +209.2 -192.7 +2.1 +29.8 +32.8 +3.2
Tel Aviv -81.5 -85.1 +0.9 -33.3 -43.3 +7.8
Southern -34.1 -34.1 +2.9 -9.2 -17.1 +2.0
West Bank +62.2 +62.2 – +28.0 +28.0 – 1) The calculations are based on data from the 2000–2017 Statistical Abstracts.
Note: The total also includes people with no religion.

I also calculated plots of net migration rate against log population density (see Rees et
al., 2016) for the country’s fifteen sub-districts. Population density is a proxy for the
extent of urbanization of a given area. Accordingly, positive slopes indicate that more
densely populated areas are gaining through net internal migration whereas less dense
areas are losing inhabitants: “The steeper the slope, the greater the rate of
redistribution” (Charles-Edwards, Bell, Bernard, and Zhu, 2018).
The results of linear regressions for the fifteen sub-districts, weighted by
population (to reduce the influence of sparsely populated areas on the overall line fit),
show for 1985 a rather flat slope that nevertheless heads in a negative direction
(Figure 3). This means that less dense areas are gaining population from internal
migration. This characteristic intensified in 1995, whereas the negative slope became
steeper. In 2005, however, the trend turned around: the gains from net internal
migration were largest in the most populous sub-districts.
Figure 3. Fitted Slopes Capturing the Relationship between
NMR and Population Density, 1985, 1995, 2005
1985

1995

2005
7.2 Five-Year Migration between Districts
By using the census items that look into current and five-years-previous places of
residence, it is possible to construct a matrix of districts of origin and destination and
to measure migration flows between each pair of districts. These data, based on
respondents’ answers to the aforementioned questions, include residential changes
that are not reported to the Population Authority and are therefore missing from the
vital statistics (in Section 7.1). They probably include a large number of students,
young singles who left their parents’ home to rented dwellings, and still others who
purchased a new dwelling but did not sell their previous one and for various reasons
do not apprise the government authorities of their change of address. It is likely that
these people disproportionally prefer large cities and especially Tel Aviv. Given that
most inter-district migrants are Jews, the analysis that follows from the 2008 Israeli
census focuses solely on this population.6
Migration between the Tel Aviv and Southern districts follows many streams and
counter-streams, as the absolute number of migrants suggests (Table 8, upper panel).
Both districts also gained a large number of in-migrants from other districts. A large
inflow of more than 10,000 migrants from a single district was also observed in the
Northern and Haifa districts (from each other), in the Southern District (from the
Central district) and in the West Bank (from Jerusalem).
6 This analysis is adopted from: Rebhun, 2015

The migration balances in the lower panel of Table 8 show that four districts lost
population: Northern, Haifa, Jerusalem, and Southern. While the Northern District
lost population to all other districts, the Haifa, Jerusalem, and Southern districts each
had a positive migration balance vis-à-vis at least one district. Perhaps the most
salient finding pertains to the Southern district, which had positive migration balances
with four districts that were, however, too small to compensate for its large negative
balances with the Tel Aviv and Central districts. Three areas gained population:
Central, Tel Aviv, and the West Bank. Still, each had a negative migration balance
with at least one district.
I also calculated migration rates for each district. They include out-migration
figures constructed on an “at risk” basis, in-migration rates based on the end-of-period
population, and net migration rates based on the surviving beginning-of-period
population. Salient migration rates were found for in-migration to the Tel Aviv
district and the West Bank and out-migration rates from Jerusalem district and the
West Bank. The latter finding is probably associated with Israel’s unilateral
withdrawal in 2005 from Gaza. Apparently, some of the evacuated Gaza settlers did
not relocate to Jewish settlements in the West Bank and moved into one of the
districts of sovereign Israel—mainly the Southern district, where the government
provided them with temporary dwellings.
Insofar as a strong correlation exists between migration to a given area and
migration from the same area, net migration may not be efficient in redistributing the
population. In fact, net migration often accounts for a small proportion of total in- and
out-migration. Here we estimate the subtraction of migration in one direction from
migration in the opposite direction by using the measure of migration “efficiency”,
which expresses the ratio of net migration to a given district to total in- and out-
migration multiplied by 100 (Long, 1988). The efficiency measure ranges from 100,
when migration is only in one direction, to 0 when there are as many in-migrants as
out-migrants. In the former case, the attractiveness or lack of attractiveness of an area
is clear and unequivocal; in the latter case, it is ambiguous.
The most efficient five-year migration was from the Jerusalem and Southern
districts (Table 8). Net migration from Jerusalem was 18.1 percent of “gross”
migration (meaning that in-migration compensated for 81.9 percent of migration from
the district); the efficiency of out-migration from the Southern district was very
similar at 17.1 percent. The efficiency of out-migration from the Northern and Haifa
districts was basically the same. For the Central district and the West Bank, which
gained population, the efficiency for the overall redistribution of the population was
very similar at 10.5 percent. The efficiency of in-migration to the Tel Aviv district
was slightly lower (7.1 percent).
The total efficiency of five years of inter-district migration in redistribution the
Israeli Jewish population was 10.6 percent. This means that every 100 moves between
districts brought about a net redistribution of about eleven persons. This rather low
efficiency suggests that consideration should be given to the importance of counter-
movements, acute heterogeneity in motives for migration, and the likelihood that
many people have reasons to settle in places that others are leaving.

Table 8. Inter-District Five-Year Migration Streams and Rates of Migration:
Jews in Israel, 2003–2008
District of residence, 2008
District of
residence,
2003
Northern Haifa Center Tel
Aviv
Jerusalem Souther
n
West
Bank-
Gaza
Total out-
migration
Inter-district streams
Northern - 10,876 7,100 10,252 3,472 3,731 1,492 -36,923
Haifa 10,583 - 8,766 11,782 3,146 3,493 1,058 -38,828
Central 5,984 7,520 - 43,114 7,566 12,308 6,838 -83,330
Tel Aviv 4,785 6,122 53,526 - 6,374 8,359 4,394 -83,560
Jerusalem 2,352 2,475 10,783 12,425 - 4,749 13,629 -46,413
Southern 3,300 2,981 16,011 15,537 4,673 - 2,060 -44,562
WBG 1,483 850 6,636 3,217 6,909 4,780 - -23875
Total in-
migration
+28,487 +30,824 +102,822 +96,327 +32,140 +37,420 +29,471 357,491
Net migration
Northern - +293 +1,116 +5,467 +1,147 +431 +9
Haifa -293 - +1,246 +5,660 +671 +458 +208
Central -1,116 -1,246 - -10,412 -3,217 -3,703 +202
Tel Aviv -5,467 -5,660 +10,412 - -6,051 -7,178 +1,177
Jerusalem -1,147 -671 +3,217 +6,051 - +76 +6,720
Southern -431 -458 +3,703 +7,178 -76 - -2,720
WBG -9 -208 -202 -1,177 -6,720 +2,720 -
Total gain
or loss
-8,463 -7,950 +19,492 +12,767 -14,246 -7,196 +5,596
Out-mig.
rate
0.09 0.08 0.08 0.09 0.12 0.07 0.16
In-mig. rate 0.07 0.06 0.09 0.11 0.08 0.06 0.19
Net-mig.
rate
-0.02 -0.02 +0.02 +0.02 -0.04 -0.01 +0.04
Efficiency -12.9 -11.4 +10.5 +7.1 -18.1 -17.1 +10.5
Total
efficiency
10.6
1) Source: Rebhun 2015
7.3 Rural/Urban Migration
Net exchanges between different types of localities reshape the distribution of the
population between urban and rural areas and attest to urbanization and counter-
urbanization processes. While the former patterns are typical of developmental
processes associated with modernization, the latter reflect highly developed
populations (Charles-Edwards, Bell, Bernard, and Zhu, in this volume).
Israel’s official statistics include annual data on migration balances between
urban localities and rural localities. Although this does not suffice to retrieve
information on the overall number of people who participated in these flows—with
which a metric of migration efficiency could be generated—such data do illuminate
urban vs. rural preferences and how they change over time. Figure 4 points to a

tendency among Jews to move from urban localities to agricultural and non-
agricultural rural settlements. In the annual population exchange by type of locality,
rural localities recorded a net gain in the nearly forty years between 1978 and 2016.
Within the fluctuations of this net gain, one interval of time is especially salient: the
early 1990s, with its high migration surplus for rural areas. Since the turn of the
twenty-first century, the net gain of rural areas has been quite stable at approximately
5,000–7,000 people each year. Accordingly, although the proportion of rural residents
among Jews diminished (because urban areas grew more rapidly), the absolute
number of Jewish rural residents nearly doubled (from 325,000 in 1983 to 638,000 in
2016) (ICBS, 2017). Notably, some of this internal migration from city to
countryside, especially in northern Israel, reflects a “ruralization” process of sorts in
which population leaps over major cities’ suburbs into their more rural hinterland
(Kirschenbaum, 1992: 85).
Among non-Jews, the data in Figure 3 attest to a small but consistent annual loss
of rural residents to urban localities.
Figure 4. Net Rural Gain or Loss from Internal Migration:
Total Population, Jews, and Non-Jews, 1978–2016 (Thousands)
The census questions on current and five-years-previous places of residence
provide information on the extent of relocation between different types of localities.
Thus, it becomes possible to calculate the effectiveness of migration (MERru), i.e., the
balance between rural to urban flows and vice versa.7 Given Israel’s nature as a
developed country, it is not surprising that the effectiveness ratio is negative, i.e., that
7 MERru= (Mru-Mur)/(Mru+Mur)*100 whereas MRU is the number of migrants from rural to
urban localities and MUR is the number of migrants from urban to rural localities. The values
of this measure vary from -100 to +100, with positive values signifying a net gain for urban
areas and negative values a net balance for rural areas. The magnitude of the indicator reflects
the power of movement in redistributing the population (Charles-Edwards, Bell, Bernard, and
Zhu, in this volume).

counter-urbanization is taking place (Table 9). The magnitude of this measure
increased significantly over time: from -3.5 for the five-year period between 1978 and
1983 to -36.8 for the 2003–2008 interval. These measures for the total population,
however, embody two contradictory trends among Jews and non-Jews: while Jews
tend more to move from urban to rural localities—a trend that intensified during the
research period—non-Jews have reached an advanced stage of urban transformation,
which gained momentum during the research years. Thus, the effectiveness measure
more than tripled from +21.8 in the earlier period to +68.2 in the later one.
Table 9. Migration Effectiveness Index, 1978–1983 and 2003–2008
Total Jews Non-Jews
1978–19831 -3.5 -4.7 +21.8
2003–20082 -36.8 -41.4 +68.2 1) Calculated on the basis of data from ICBS, Internal Migration, Part A, 1983 Census of
Population and Housing, Publication No. 16, pp. 306–308, 1988.
2) My analysis of data from the 2008 Census of Population and Housing.
8. Informed Interpretations of Internal Migration in Israel
Israelis are a dynamic population that exhibits high rates of both short- and long-
distance migration. Their resettlement is spread across the entire country, involves
different types of localities, and is characterized by streams and counter-streams albeit
with preferences for several well designated areas. Likewise, this migration is
selective in many respects. These findings should be interpreted in the context of five
major dimensions of Israeli society that we define as nativity, religio-ethnicity,
ideology, regionalism, and structurality. These dimensions do not necessarily operate
independently; they may often be interrelated, i.e., people move in reference to two or
more of these considerations.
Nativity. Israel is a young country. The unprecedented growth of its population is
largely attributed to massive waves of immigration. Many of its inhabitants are first
and second generation in the country. Whether survivors of the Holocaust, Jews from
Muslim countries, immigrants from the former USSR, or Black Jews from Ethiopia,
all shared fundamental political and socioeconomic hardship that pushed them out of
their origin countries; all reached Israel with scanty economic capital and, in some
cases, poor education. The timing of their immigration, their human capital, and the
availability of housing determined their initial areas of settlement in central or
peripheral areas, localities and neighborhoods of low or middle class, and often in
absorption centers (residential intake facilities) or temporary accommodation
provided by governmental authorities. Many of these immigrants and, especially, their
offspring experienced social and economic mobility by which they improved their
standard of living in a process that involved spatial relocation. Since the large influxes
of immigrants to Israel have been intermittent over the past seventy years, they have
ensured, albeit with some fluctuations, high rates of internal migration.
Religio-ethnicity. Israel was founded as the state where the Jewish people
realizes its right to self-determination. This central constant is reflected, among other
things, in Israeli immigration and naturalization law and in characteristics such as the
national anthem, language, education, symbols, and festivals. Throughout the Middle
East conflict, a salient division of the Israeli population is between Jews and non-
Jews, most of the latter being Arabs. This, in turn, has generated social, economic,
and cultural separation of the two sectors, which perforce is also physical. Non-Jews

are a highly segregated population. The overwhelming majority reside in Arab
villages and often in a structure of large extended families. Likewise, its rate of
participation in the labor force is somewhat low as compared to their Jewish peers and
a high proportion of those who do work are concentrated in blue-collar and service
occupations including agriculture, construction, and driving; women express strong
inclination to work in teaching. The limitations that this imposes on their social and
economic opportunities crimp their spatial mobility, as reflected in significantly lower
rates of internal migration than those exhibited by Jews.
Ideology. Jewish nationalism emphasizes the nation’s “return to the land” and
promotes de-urbanization (Goldscheider, 2015). Complemented by security
considerations along with a utopian economic and social vision, a major guiding
principle of governmental policy and planning has been the de-concentration of the
Jewish population to the national periphery (Cohen, 1970; Kirschenbaum, 1982).
Special governmental preference was, and still is, given to increasing the share of
Jews in the north and south of the country. This involves the consolidation of
geopolitically important areas such as Jerusalem and the strengthening of
“development towns” in national peripheries. Since the ascent to power of the
political Right in the second half of the 1970s, there have been growing attempts to
intensify Jewish control over the disputed territories.
Regionalism. There are socioeconomic differences among areas of the country,
especially along lines of core and periphery. While these variations are to some extent
the result of the spatial dispersion of the immigrants themselves and their human
capital, they also provide reasons for people to migrate from one region to another.
The local conditions in play include employment opportunities, level of income,
housing, quality of communal services such as education, and tax advantages in areas
that the government wishes to settle with new populations. After individual
characteristics are controlled for, it is found that area contextual factors may deter or
encourage people to migrate (Rebhun, 2015). Development trends, however, may
change over time or focus simultaneously on several areas. For example, as a
development country Israel is following the lead of many similar states in advanced
processes of suburbanization, decentralization, and regional restructuring by
establishing industries and economic centers in the countryside. Even so,
unemployment in Israel remains higher in the periphery than in the center. Average
income is significantly lower in the north and south than in Tel Aviv area. And
especially large gaps are observed in recent housing completions: twice as many in
the Central district than in each of the districts of Jerusalem, Haifa, and South (ICBS,
2017).
Structurality. This explanation concerns the young age composition of the Israeli
population. The Jewish subgroup in particular, which resettles more easily than do its
non-Jewish counterparts, has exhibited rising fertility rates in recent years. This
generates large young cohorts who enter the critical ages of joining the labor market,
establishing families, and having children, all of which creating more geographic
movement. It can further be argued that the Israeli society is characterized by strong
familiality. Accordingly, parents after retirement may move in order to live close to
their children, help mind their grandchildren, and provide housekeeping services.
Conversely, two structural factors may inhibit internal migration: the growing share in
the population of the ultra-Orthodox, who consume specific religious, educational,
and economic services that are local-oriented, exhibit strong communal belonging,
and tend to be geographically stable; and high homeownership rates, which mitigate
against relocation (67 percent of Israelis own their home, as against 62 percent in

Japan, 57 percent in South Korea, and 49 percent in Hong Kong, but nowhere near
China and Singapore, at 90 percent) (Trading Economics).
9. Impacts and Implications
The patterns of internal migration in Israel are altering and reshaping the dispersion of
the country’s ethnicity and human capital. The tendency to leave peripheral areas
belonged to immigrants from developing countries in northern Africa and Asia (also
called Sephardim) and their native-born offspring who acquired educational and
occupational credentials and moved to more central parts of the country. This
relocation, to areas with an initial massive presence of people of European extraction
(Ashkenazim), enhanced ethnic mingling in the Tel Aviv and Central districts.
Concurrently, the Northern and especially the Southern districts were targeted for
construction and development ahead of mass immigration from the former USSR
(hence, from Europe) in the past twenty-five years. Many of these immigrants settled
in areas that had significant concentrations of people of Asian/African background,
abetting ethnic heterogeneity in the peripheral districts. Thus, in terms of large
geographic units, the country’s districts are more ethnically mixed today than they
were in the past, fulfilling the vision of Israel as the “melting pot” where the
ingathering of the Jewish exiles takes place.
Still, most Israelis—FSU immigrants and native-born alike—who moved to
peripheral districts have settled in major cities. Accordingly, the small towns remain
as they were: pockets of people of Asian/African ethnic background. Moreover, the
exodus from these towns of the most educationally and economically successful
inhabitants has plunged these areas into deeper socioeconomic disadvantage.
Although the ultra-Orthodox population is relatively stable, it does move,
especially following marriage. The mobile population among the ultra-Orthodox
seeks infrastructure that suits its unique religious lifestyle. This includes, among other
things, appropriate education institutions, stores that carry products with special
kosher certification, religious services, and closure of streets on the Jewish Sabbath
and festivals. Given the rapid growth of this population group (its total fertility
exceeding six children per woman), many young couples leave the major cities in
favor of new towns built especially for them. This creates another type of Jewish
geographic segregation, based on religious orientation. Since the ultra-Orthodox are
of low income in the aggregate, these towns evince a combination of religious
concentration and low economic class. Somewhat similarly, internal migration to
Jewish settlements in the disputed territories mainly attracts modern religious Jews.
Another type of concentration created by spatial relocation but involving a
different type of population has evolved in rural localities. These places, especially
those of the communal type that are characterized by detached houses, ample green
space, and high quality of life, are populated mainly by members of upper
socioeconomic strata. They have vetting committees that examine and evaluate
applicants for residence and test their suitability to the local way of life. Accordingly,
these localities are homogenous in terms of Jews vs. non-Jews and, among the former,
along religious or secular lines. The socioeconomic characteristics of the Jewish
localities are also of the sort, by and large, that assure the hegemony of people of
European background.
If so, internal migration in Israel enhances the religious, ethnic, and
socioeconomic heterogeneity of some localities and the homogeneity of others. The
former are large geographic units—districts, major cities, and several new towns—
whereas the others are mainly small rural localities and recently established cities for

the ultra-Orthodox. On top of this is acute segregation among the non-Jewish
population, which, insofar as it engages in internal migration, does so mainly between
Arab villages (although some also involves settlement in mixed cities). Hence, a
major aspect of internal migration in Israel is its implications for the religious, ethnic,
and socioeconomic dispersion of the population.
It should be added that after many years of migration across countries and
continents, the overwhelming majority of Diaspora Jews (some eight million) live
today in developed democracies where they enjoy full rights and climb to the highest
rungs of the educational and economic ladder. Barring unpredictable events, I do not
foresee any scenario that will prompt large numbers of Jews to move to Israel,
although some migration in this direction will continue at a slow pace. Since
immigrants have been a major determinant of intensive internal migration in Israel,
internal migration is likely now to stabilize at somewhat lower levels than in the past.
10. Conclusions
Among the thirty countries participating in this research project, Israel is one of the
smallest in size (only Timor-Leste ranks lower) and in population (only Timor-Leste,
Armenia, and Kyrgyzstan are less populous). However, Israel stands at the forefront
of countries with high human development. By all these measures, the differences
between Israel and most other Asian countries are substantial.
Israel also differs from other Asian countries in key migration characteristics. Its
official data sources (population registers, censuses, and surveys) provide rich and
updated information including on yearly intra- and inter-locality moves, urban/rural
migration, different types of fixed-time (five-year) migration, and insights into
lifetime and longitudinal data of changes of place of residence. Translating some of
these data into internationally comparable measures, such as ACMI for five-year
migration, it is suggested that Israelis tend to move quite intensively. Furthermore,
Israel’s MER measure of urban/rural migration stands out somewhat for its negative
sign; its magnitude has recently been on the rise. From a different perspective, it
seems that internal migration peaks at slightly older ages in Israel than in other
countries, attesting to the country’s unique life trajectory of mandatory military
service after high school (for both men and women), strong tendency to post-
secondary education, late age at marriage, and, consequently, postponed departure
from the parental nest.
The combination of structural characteristics different from those of other
countries in Asia and unique migration patterns raises speculations about several
causal relations. It is likely, however, that there are other factors that shape internal
migration patterns in Israel, including, but not limited to, the religious and ethnic
composition of the population, its being a country that absorbed large influxes of
people from abroad, and its young age structure, high educational attainment, and
governmental policy of population dispersion. These factors operate on the macro,
meso, and micro spheres. Obviously, such an examination requires a large and rich set
of data and should invoke advanced multivariate methods.
I would add that, from a global vantage point, it would be interesting to compare
Israel, located at the western end of Asia and hence geographically very close to
Europe—and a member of several major European economic and scientific
organizations—with the migration patterns of countries such as France, Germany, or
the UK. It is not unlikely that the types and intensity of internal migration in Israel
would fall somewhere between those of Asia and those exhibited by European
countries and perhaps even the United States.

Meanwhile, Israel has begun to prepare for a new population census in 2020. In
the upcoming poll, internal migration should receive at least the same attention as it
did in the previous census. This project and the voluminous publication that it will
yield should encourage the Israel Central Bureau of Statistics perhaps to add several
additional questions that would improve Israel’s comparability with neighbouring
Asian countries. This procedure should be replicated in later censuses as well.
References
Alfendari, Tobi and Daniel Shefer. 1992. Migration To and From Developing Towns
in Israel. Haifa: Technion – Israel Institute of Technology (In Hebrew).
Baron, Mira. 1990. “Labor Force Participation in Non-Metropolitan Disadvantage
Towns.” Israel Social Science Research 7.
Bartal, Ann P. and Marianne J. Koch. 1994. "Internal migration of the U.S.
Immigrants". In: John M. Abowd and Richard B. Freeman (eds.) Immigration,
Trade, and the Labor Market. Chicago and London: The University of Chicago
Press, pp. 121-134.
Ben-Moshe, Eliahu. 1989. Internal Migration Processes in Israel: Demographic,
Ethnic and Social Aspects. Jerusalem: The Hebrew University of Jerusalem
(Ph.D. Thesis) (In Hebrew).
Bogue, Donald J. 1959. The Population of the United States. New York: Free Press.
Borukhov, Eliahu. 1995. “Immigrant Housing and its Impact on the Construction
Industry.” In: Moshe Sicron and Elazar, Leshem (eds.), Profile of an Immigration
Wave: The Absorption Process of Immigrants from the Former Soviet Union,
1990-1995. Jerusalem: Magnes Press, pp. 207-231.
Braude, Kobi and Guy Navon. 2006. Internal Migration in Israel. Jerusalem:
Research Department, Bank of Israel (In Hebrew).
Brown David L. and K. A. Schafft. 2011. Rural People and Communities in the 21st
Century: Resilience and Transformation. Cambridge: Polity Press.
Charles-Edwards, Elin, Martin Bell, Aude Bernard and Yu Zhu. "Comparing Internal
Migration in the Countries of Asia: Patterns and Progress".
Cohen, Erik. 1970. The City in the Zionist Ideology. Jerusalem: Institute for Urban
and Regional Studies. The Hebrew University of Jerusalem.
DellaPergola, Sergio. 2017. “World Jewish Population, 2017.” American Jewish Year
Book, pp. 297-377.
Eisenstadt, Shmuel N. 1973. Israeli Society: Background, Development, Problems.
Jerusalem: Magnes Press.
Fulton, John A., Glenn V. Fuguitt and Richard M. Gibson. 1997. "Recent Changes in
Metropolitan-Nonmetropolitan Migration Streams". Rural Sociology 62(3): 363-
384.
Goldscheider, Calvin. 2015. Israeli Society in the 21st Century: Immigration,
Inequality, and Religious Conflict. Waltham, MA: Brandeis University Press.
Gurak, Douglas T. and Mary M. Kritz. 2000. "The Interstate Migration of U.S.
Immigrants: Individual and Contextual Determinants". Social Forces 78(3);
1017-1039.
Hasson, Shlomo. 1995. “Geographic Patterns of the Immigrants’ Internal Migration.”
In: Moshe Sicron and Elazar, Leshem (eds.) Profile of an Immigration Wave: The
Absorption Process of Immigrants from the Former Soviet Union, 1990-1995.
Jerusalem: Magnes Press, pp. 270-290 (In Hebrew).
Israel Central Bureau of Statistics. Statistical Abstract of Israel, various years.
Israel Central Bureau of Statistics. 2018. http://www.cbs.gov.il/ts/ID95ce118a110d13/

Kirschenbaum, A. 1992. “Migration and Urbanization: Patterns of Population
Redistribution and Urban growth.” In: Calvin Goldscheider (ed.), Population &
Social Change in Israel. Boulder, CO: Westview Press, pp. 65-88.
Kritz, Marry M. and June, Nogle. 1994. "Nativity Concentration and Internal
Migration among the Foreign-Born". Demography 31(3): 509-524.
Lee, ES. 1966. A Theory of Migration. Demography 3: 47-57.
Lichter, Daniel T. and David L. Brown. 2011. "Rural America in an Urban Society:
Changing Spatial and Social Boundaries". Annual Review of Sociology 37(1):
565-592.
Lipshitz, Gabriel. 1991. "Internal Migration in Israel within a Core-Periphery
Structure". The Pennsylvania Geographer, vol. 29, pp. 34-35.
_____. 1998. Country on the Move: Migration to and Within Israel, 1948-1995.
Dordrecht, Boston and London: Kluwer Academic Publishers.
Long, Larry. 1988. Migration and Redistribution Mobility in the United States. New
York: Russell Sage Foundation.
New Bold, Bruce K. 1996. "Internal Migration Patterns for US Foreign-Born in
Canada". International Migration Review 30(3): 728-747.
Newman, David. 2000. “Internal Migration in Israel: From Periphery to Center –
From Rural to Urban.” In: Daniel J. Elazar and Morton Weinfeld (eds.) Still
Moving: Recent Jewish Migration in Comparative Perspective. New Brunswick
and London: Transaction Publishers, pp. 205-226.
OECD. 2017. Secretary-General’s Report to Ministers, 2017. Paris, France.
Rebhun, Uzi. 1989/90. "Changes in the Geographical Distribution of the Israeli
Population in 1972-1983". Horizons: Studies in Geography, No. 30: 21-46 (In
Hebrew).
_____. 2004. “Major Trends in the Development of Israeli Jews: A Synthesis of the
last Century.” In: Uzi Rebhun and Chaim I. Waxman (eds.) Jews in Israel:
Contemporary Social and Cultural Patterns. Hanover and London: Brandeis
University Press/University Press of New England, pp. 3-19.
_____. 2006. “Nativity Concentration and Internal Migration among the Foreign-Born
in Israel, 1990-1995.” Revue Europeenne des Migrations Internationales (REMi),
22(1): 107-130.
_____. 2015. “Geographic Dispersion and Mobility of Jews in Israel.” In: Eli
Lederhendler and Uzi Rebhun (eds.), Research in Jewish Demography and
Identity. Boston, MA: Academic Studies Press, pp. 326-354.
Rebhun, Uzi and David L. Brown. 2015. “Patterns and Selectivities of Urban/Rural
Migration in Israel.” Demographic Research 33(5): 113-144.
Rees, Philip H., Martin Bell, Marek Kupiszewski, Dorota Kupiszewska, Philipp
Ueffing, Aude Bernard, Ellin Charles-Edwards, and John Stillwell. 2016. "The
Impact of Internal Migration on Population Redistribution: An International
Comparison". Population, Space, and Place 26(3): …
Rogers, Andrei, Sabine, Henning, and Jani, Little. 1995. The Formal Demography of
Immigration and Spatial Population Redistribution in the United States. Working
Paper 95-1. Boulder, CO, Population Program, Institute of Behavioral Science,
University of Colorado at Boulder.
Schwartz, Daphna. 1990. "A Town Profile – A New Classification of the
Development Towns". Economic Quarterly 145: 194-209 (In Hebrew).
Senor, Dan and Saul Singer. 2009. Start-Up Nation: The story of Israel’s Economic
Miracle. New York and Boston: Twelve.

Shachar, Arie. 1975. "Patterns of Population Densities in the Tel Aviv Metropolitan
Area". Environment and Planning A 7: 271-291.
Shapira, Anita. 2012. Israel: A History. Waltham, MA: Brandeis University Press.
Shefer, Daniel, Amnon Frenkel, and Stephen Roper. 2001. “Innovation and Plant
Characteristics of High-Technology Firms in Israel and Ireland.” In: Daniel
Felstein, Ronald McQuaid, Philip McCann, and Daniel Shefer (eds.), Public
Investment and Regional Economic Development. Cheltenham and Northampton:
Edward Elgar, pp. 109-119.
Sicron, Moshe. 2004. Demography: Israel's Population – Characteristics and Trends.
Jerusalem: Carmel (In Hebrew).
Trading Economics. https://tradingeconomics.com/country-list/home-ownership-rate
United Nations. 2016. Human Development Report 2016. New York, NY: United
Nations Development Programme.
White, Michael J. and Peter R. Mueser. 1994. "Changes in the Demographic
Determinants of US Population Mobility: 1940-1980. Review of Regional Studies
24: 245-264.
https://en.wikipedia.org/wiki/List_of_countries_by_home_ownership_rate
Yakobson, Alexander and Amnon Rubinstein. 2008. Israel and the Family of Nations:
Jewish Nation-State and Human Rights. London: Routledge.