Internal Migration in China
33
Internal Labor Migration in China: Trends, Geographical Distribution and Policies Kam Wing Chan Department of Geography University of Washington Seattle [email protected] January 2008
-
Upload
lester-lim -
Category
Education
-
view
33.364 -
download
3
description
A set of slides not made by myself.
Transcript of Internal Migration in China

Internal Labor Migration in China: Trends, Geographical Distribution and Policies
Kam Wing Chan
Department of GeographyUniversity of Washington
January 2008


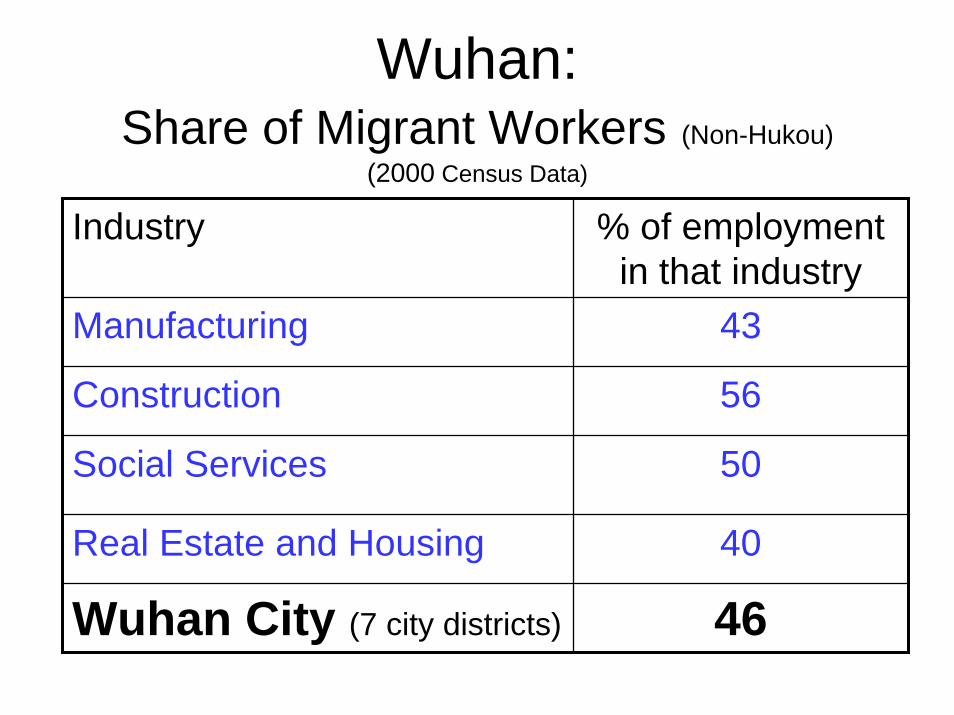
Wuhan:Share of Migrant Workers (Non-Hukou)
(2000 Census Data)
Industry % of employment in that industry
Manufacturing 43
Construction 56
Social Services 50
Real Estate and Housing 40
Wuhan City (7 city districts) 46

Urban recreation consumptionrose at 14% p.a in 1995-2005

Topics• Hukou System and Migration
Statistics• Migration Trends• Geography • Policies

(The Household Registration System, 户口制度)
• Formally set up in 1958• Divided population/society into two major types of households:
rural and urban • Differential treatments of rural and urban residents• Controlled by the police and other govt departments• Basically an “internal passport system”• Currently, the system serves as a benefit eligibility system; a tool
of institutional exclusion than controlling geographical mobility• The population of a city is divided into “local” and “outside”
population.

Ad
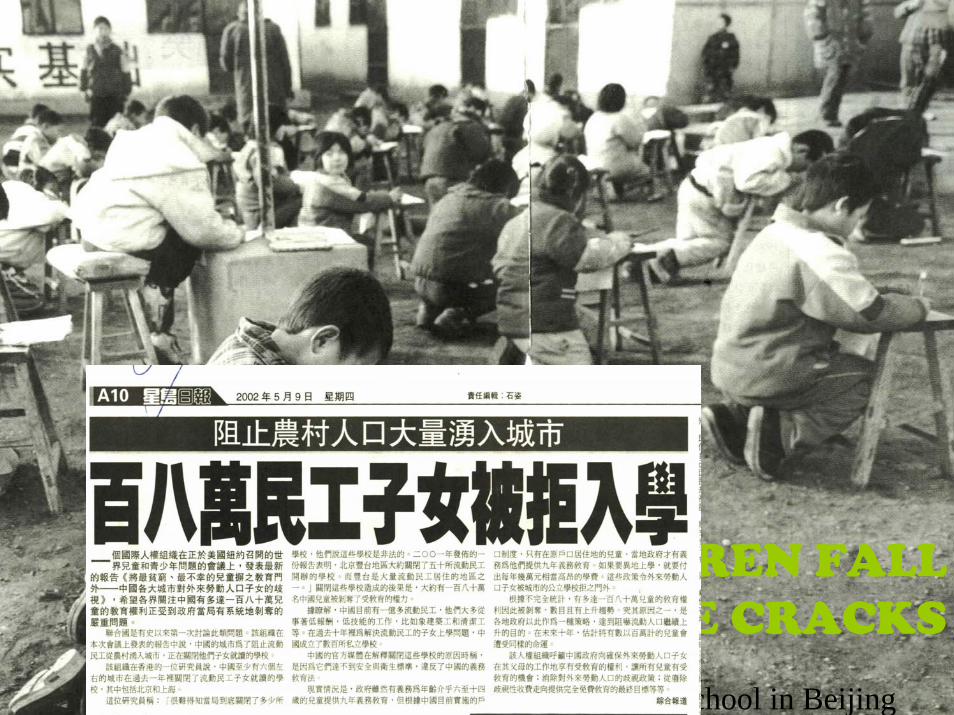
An unlicensed school in Beijing
MIGRANT CHILDREN FALL THROUGH THE CRACKS

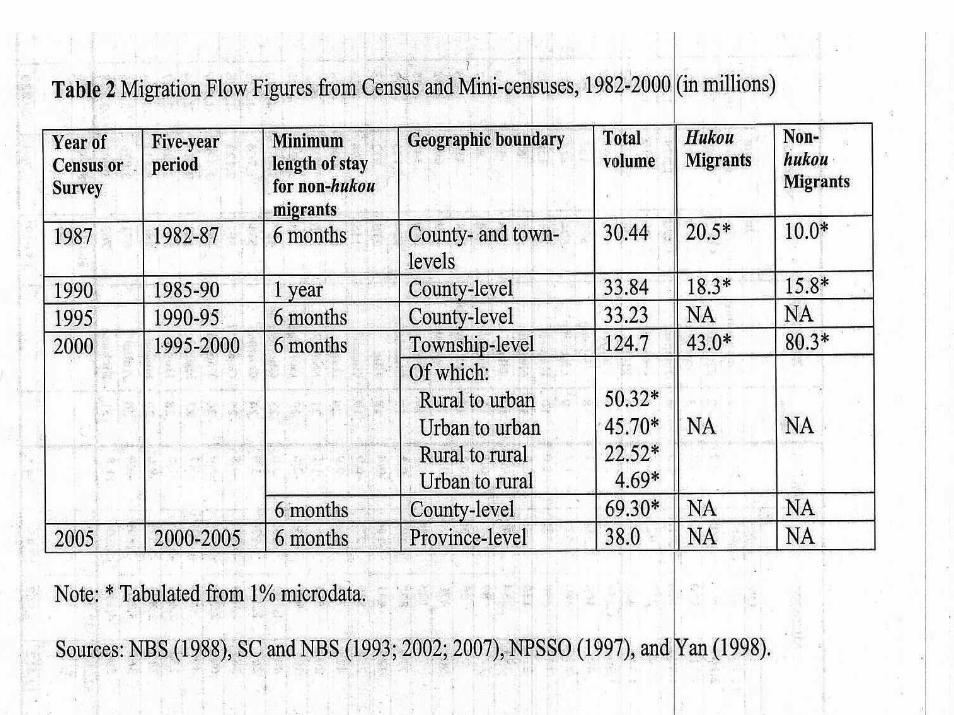
Two types of internal migrants
• Hukou Migrants: migrants with local residency rights
• Non-hukou Migrant: migrants withoutlocal residency rights – also called: non-hukou population, or more
generally, “floating population”


Wuhan:Share of Non-Hukou Migrant Workers
(2000 Census Data)
Industry % of Employment
Manufacturing 43
Construction 56
Social Services 50
Real Estate and Housing 40
Wuhan City (7 city districts) 46
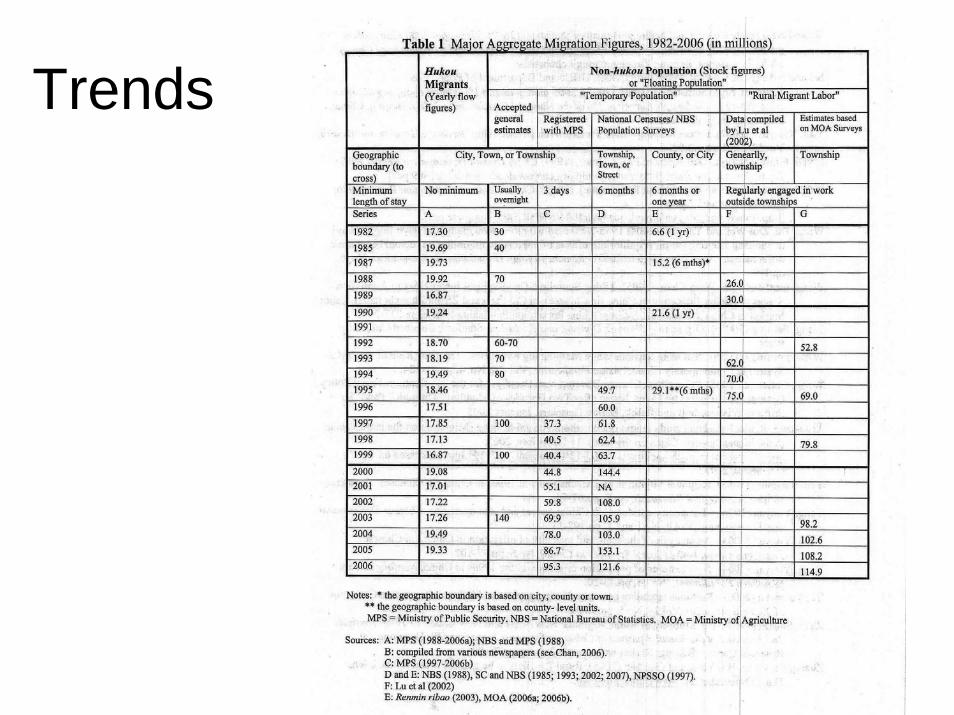
Trends

Migration Trends:Floating Population, 1982-2003
(Estimates in Millions)
0
20
40
60
80
100
120
140
1985 1988 1992 1994 1997 1999 2003


Level of Urbanization, 1990-2005
20
25
30
35
40
45
1990 1992 1994 1996 1998 2000 2002 2004
% o
f Tot
al P
opul
atio
n

Figure 3 Urban Growth and Migration Rates
0
1
2
3
4
5
6
7
1990 1995 2000
Per
cent
of U
rban
Pop
ulat
ion
Urban GrowthRate
Urban NaturalIncrease Rates
Net Urban In-migration Rate
Source: Chan and Hu (2003)
True rural-urban migration

Geography


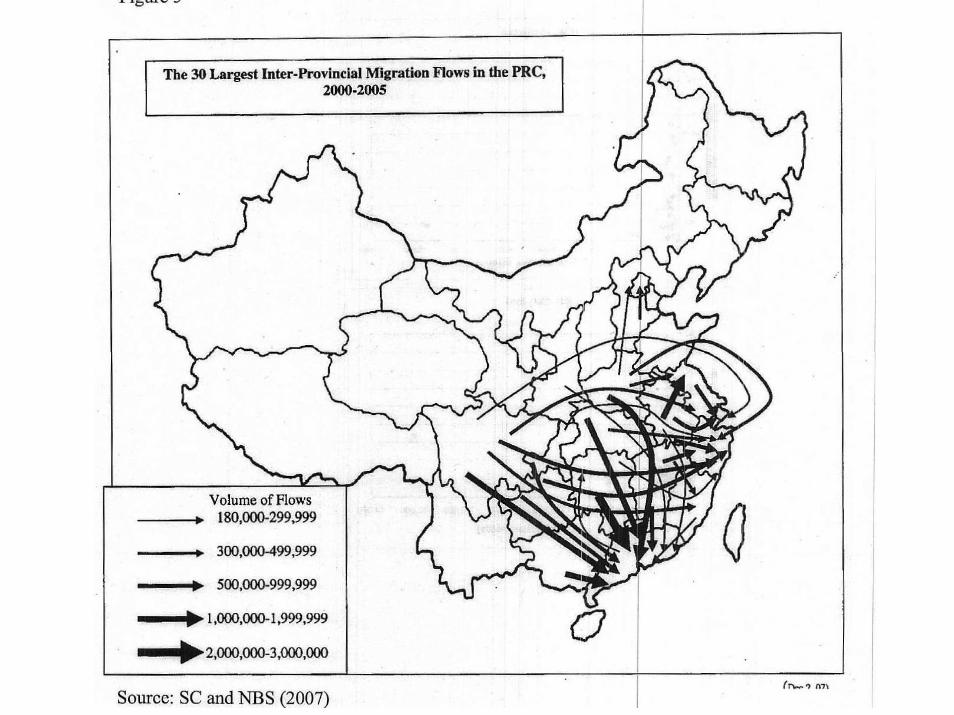

The 30 Largest Inter-provincial Migration Flows,1995-2000


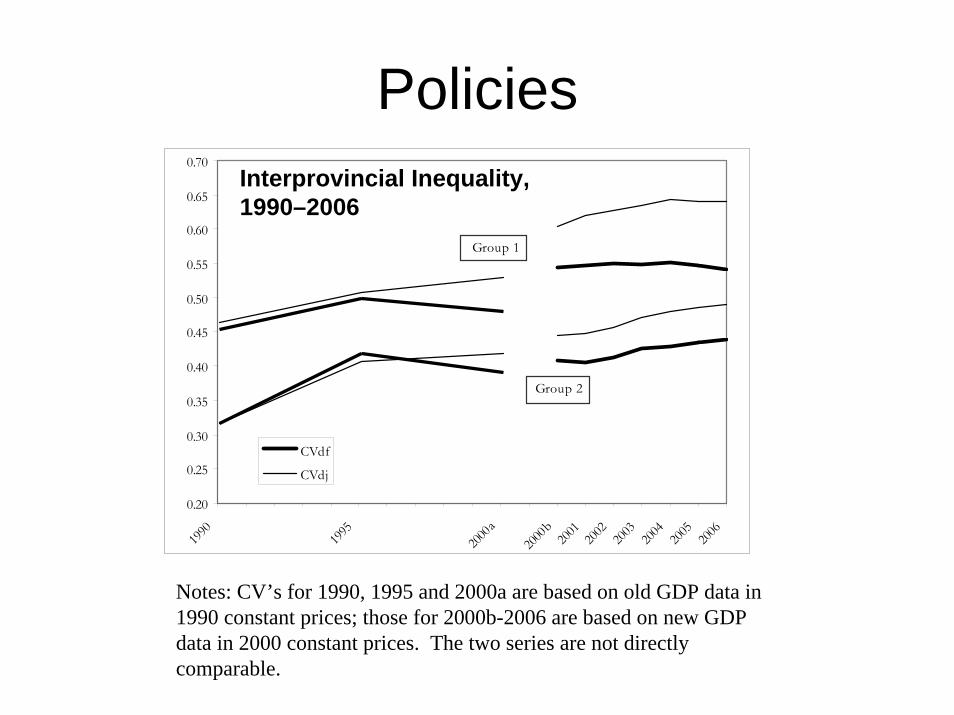
Policies
0.20
0.25
0.30
0.35
0.40
0.45
0.50
0.55
0.60
0.65
0.70
1990
1995
2000a
2000b
2001
2002
2003
2004
2005
2006
CVdf
CVdj
Group 1
Group 2
Notes: CV’s for 1990, 1995 and 2000a are based on old GDP data in 1990 constant prices; those for 2000b-2006 are based on new GDP data in 2000 constant prices. The two series are not directly comparable.
Interprovincial Inequality, 1990–2006


Urban Growth Scenarios(Population in Millions)
2000 2005 2010 2015 2020National Populationassuming 0.7% growth per year 1265.8 1306.3 1352.7 1400.7 1450.4Population Increase per year 8.1 9.3 9.6 9.9
URBAN SCENARIO 1assuming 3.5% growth per yearUrban Population 458.6 561.6 667.0 792.2 940.9Urban % 36.2 43.0 49.3 56.6 64.9Urban Population Increase per year 20.6 21.1 25.0 29.7Urban Natural Increase (0.55%) per year 2.5 3.1 3.7 4.4Net Rural-urban Migration per year 18.1 18.0 21.3 25.3URBAN SCENARIO 2assuming 4% growth p.a. in 2005-2010, and 3.5% p.a. afterUrban Population 458.6 561.6 683.3 811.5 963.8Urban % 36.2 43.0 50.5 57.9 66.5Urban Population Increase per year 20.6 24.3 25.6 30.5Urban Natural Increase (0.55%) per year 2.5 3.1 3.8 4.5Net Rural-urban Migration per year 18.1 21.2 21.8 25.9
RURAL SCENARIO 1Scenario 1Rural Population 807.3 744.7 685.7 608.5 509.5Rural % 63.8 57.0 50.7 43.4 35.1Rural Population Increase per year -12.5 -11.8 -15.4 -19.8RURAL SCENARIO 2Rural Population 807.3 744.7 669.4 589.2 486.6Rural % 63.8 57.0 49.5 42.1 33.5Rural Population Increase per year -12.5 -15.1 -16.0 -20.5
Known Forecast

Main points:• Urban Population
– 2005: 43% (560M); – 2010: 50% (675M)– 2020: 65% (950M)
• Increase of about 400M in the next 15 years
• 80% from net rural-urban migration and reclassification, about 20M per year 200-250 peasant migrants by 2020
Urban Growth Scenarios, 2005-2020
0
200
400
600
800
1000
1200
1400
1600
2000 2005 2010 2015 2020
Pop
ulat
ion
in M
illio
ns
Nationa;urban2urban1

Implications of Urban Growth• Employment?
– Jobs for the 150 M unemployed rural labor
– Many urban jobs currently off-limit to migrants
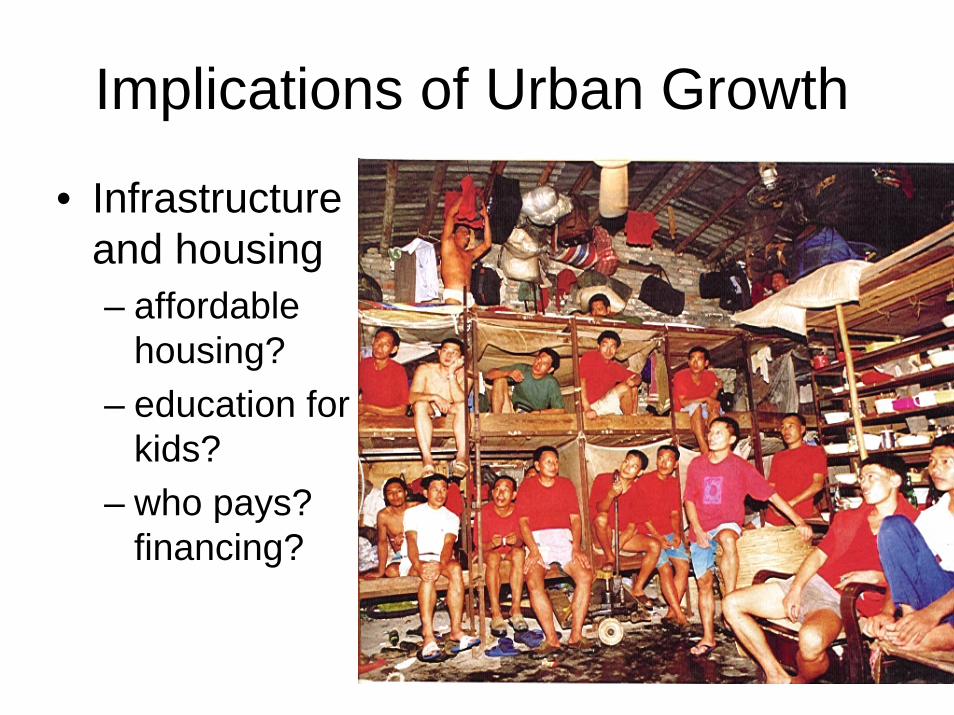
Implications of Urban Growth
• Infrastructure and housing– affordable
housing?– education for
kids?– who pays?
financing?

Implications of Urban Growth
• Urban poverty, public safety and social stability– wage arrears, unfair
compensation for land expropriated, etc
– 200 M permanent urban underclass?
– protests and riots

Thank you!