National Drought Management Authority KILIFI COUNTY ...
23
Page 1 of 23 National Drought Management Authority KILIFI COUNTY DROUGHT EARLY WARNING BULLETIN, MAY 2017 Short rains harvests Short dry spell Reduced milk yields Increased HH Food Stocks Land preparation Long rains Planting/Weeding High calving Rate Milk yields Increase Long rains harvests A long dry spell Land preparation Increased HH Food Stocks Kidding (Sept) Short rains Planting/weeding Jan Feb Mar Apr May Jun Jul Aug Sept Oct Nov Dec MAY EW PHASE Early Warning(EW) Phase Classification Livelihood Zone Stage Trend Marginal Mixed farming Alarm Deteriorating Livestock/Ranching Alarm Deteriorating Cash Cropping/Dairy Alarm Deteriorating Food Cropping Alert Deteriorating COUNTY Alarm Deteriorating Biophysical Indicators Value Normal Average Rainfall (mm) 132 50-90 VCI-3month 10.59 35-50 Production indicators Value Normal Livestock Migration Pattern From Kaloleni- Bamba-Magarini No migration Livestock Body Conditions 3-5 6-8 Milk Production ltr/hh/day 3.8 >2.4 Crop condition Germination, first weeding 2 nd weeding and flowering Access Indicators Value Normal Terms of Trade (ToT) 58 >67 Milk Consumption (% range) 1.2 >1.4 Average Water Distance for Households (Km) 4.7 ≤ 1.6 Average Grazing-Water point Distance (Km) 3.2 ≤ 3.2 Utilization indicators Value Normal MUAC (%) 59.5 ≤ 6.8 Coping Strategy Index 15.06 <13.67 Drought situation and phase classification Biophysical Indicators (Environmental indicators) The first dekad of May recorded some significant amount of rainfall with significant drop in the second and third dekads. State of water sources in the county during the month under review was 4 (declining)-below normal at this time of the year. On average pasture and browse condition remained fair to good across all livelihood zones in the county. On average, the county 3-month VCI for May recorded severe vegetation deficit with Kaloleni, Ganze and Malindi recording extreme vegetation deficit. Socio Economic Indicators (Impact Indicators) Production indicators Livestock body condition continued to record some improvement. Milk production remained low due consumption of lush pastures with no minerals. Access indicators Average return distance from water sources continued to record a decrease for both households and livestock as the surface water sources recorded some recharge. Food prices were significantly high and low supply of sifted maize meal recorded in the market. The terms of trade were unfavorable for the livestock keepers with increased maize prices. Utilization indicators The proportion of children at risk of malnutrition increased significantly in May. Most households fell either in poor or borderline category of food consumption an indication that household food shortage was evident. Households continued to employ different coping strategies to address issues of food insecurity.
Transcript of National Drought Management Authority KILIFI COUNTY ...

Page 1 of 23
National Drought Management Authority KILIFI COUNTY
DROUGHT EARLY WARNING BULLETIN, MAY 2017
Short rains harvests Short dry spell Reduced milk yields Increased HH Food Stocks Land preparation
Long rains Planting/Weeding High calving Rate Milk yields Increase
Long rains harvests A long dry spell Land preparation Increased HH Food Stocks Kidding (Sept)
Short rains Planting/weeding
Jan Feb Mar Apr May Jun Jul Aug Sept Oct Nov Dec
MAY EW PHASE Early Warning(EW) Phase Classification
Livelihood Zone Stage Trend
Marginal Mixed farming Alarm Deteriorating
Livestock/Ranching Alarm Deteriorating
Cash Cropping/Dairy Alarm Deteriorating
Food Cropping Alert Deteriorating
COUNTY Alarm Deteriorating
Biophysical Indicators Value Normal
Average Rainfall (mm) 132 50-90
VCI-3month 10.59 35-50
Production indicators Value Normal
Livestock Migration Pattern
From Kaloleni-Bamba-Magarini
No migration
Livestock Body Conditions
3-5 6-8
Milk Production ltr/hh/day
3.8 >2.4
Crop condition Germination, first weeding
2nd weeding and flowering
Access Indicators Value Normal
Terms of Trade (ToT) 58 >67
Milk Consumption (% range)
1.2 >1.4
Average Water Distance for Households (Km)
4.7 ≤ 1.6
Average Grazing-Water point Distance (Km)
3.2 ≤ 3.2
Utilization indicators Value Normal
MUAC (%) 59.5 ≤ 6.8
Coping Strategy Index 15.06 <13.67
Drought situation and phase classification Biophysical Indicators (Environmental indicators) The first dekad of May recorded some significant amount of rainfall
with significant drop in the second and third dekads.
State of water sources in the county during the month under review was 4 (declining)-below normal at this time of the year.
On average pasture and browse condition remained fair to good across all livelihood zones in the county.
On average, the county 3-month VCI for May recorded severe vegetation deficit with Kaloleni, Ganze and Malindi recording extreme vegetation deficit.
Socio Economic Indicators (Impact Indicators) Production indicators Livestock body condition continued to record some improvement.
Milk production remained low due consumption of lush pastures with no minerals.
Access indicators Average return distance from water sources continued to record a
decrease for both households and livestock as the surface water sources recorded some recharge.
Food prices were significantly high and low supply of sifted maize meal recorded in the market.
The terms of trade were unfavorable for the livestock keepers with increased maize prices.
Utilization indicators The proportion of children at risk of malnutrition increased
significantly in May.
Most households fell either in poor or borderline category of food consumption an indication that household food shortage was evident.
Households continued to employ different coping strategies to address issues of food insecurity.

Page 2 of 23
1.0 CLIMATIC CONDITIONS 1.1 Rainfall Performance 1.2 Onset
The onset of the March-May 2017 long-rains delayed, much rains were received in May and were evenly distributed.
1.2 Amount and Spatial Distribution
Figure 1a: Average amount of rainfall recorded in Kilifi County
The month of May recorded significant amount of rainfall. The amount recorded in May an increase of 407 percent compared to the previous month and 60.9 percent higher compared to the long term mean and much rains recorded in dekad one of May.
May rains recorded even spatial distribution and good temporal distribution across all livelihood zones. The food cropping, cash cropping and marginal mixed farming zone recorded the highest average of more than 150mm in May.
The amount recorded was significantly higher when compared to the long term mean at this time of the year.

Page 3 of 23
Figure1b: Kilifi County rainfall distribution
Figure 1b shows how rainfall was distributed in May compared to long term mean. The first dekad of May received significant amount of rainfall which reduced significantly during the second and third dekads of May. The graph too indicates that amount received in May was generally above the long term mean.
2.0 IMPACT ON VEGETATION AND WATER 2.1 Vegetation Condition 2.1.1 Vegetation Condition Index [VCI] The Vegetation Condition Index (VCI) compares the current NDVI to the range of values observed in the same period in previous years.
VCI-3month
As at 30th April 2017
VCI-3month
As at 31st May
2017
KILIFI
County 9.66 10.59
Ganze 6.17 9.58
Kaloleni -4.69 2.31
Magarini 12.76 11.25
Malindi 10.08 9.27
Kilifi-North 6.27 10.41
Rabai 6.37 11.22 Kilifi-South 15.66 23.58
Figure 2a: Three month Vegetation Condition Index (VCI) values for Kilifi County [Source: Boku University -Austria]
Some significant amount was recorded in May but the impact on vegetation was minimal following the previous drought experienced in the county which left the grazing ground bare. Ganze, Kaloleni and Malindi sub counties recorded extreme vegetation deficit as compared to long term of 30 years ago. KIlifi South recorded moderate vegetation deficit following significant amount received in the area.
Page 4 of 23
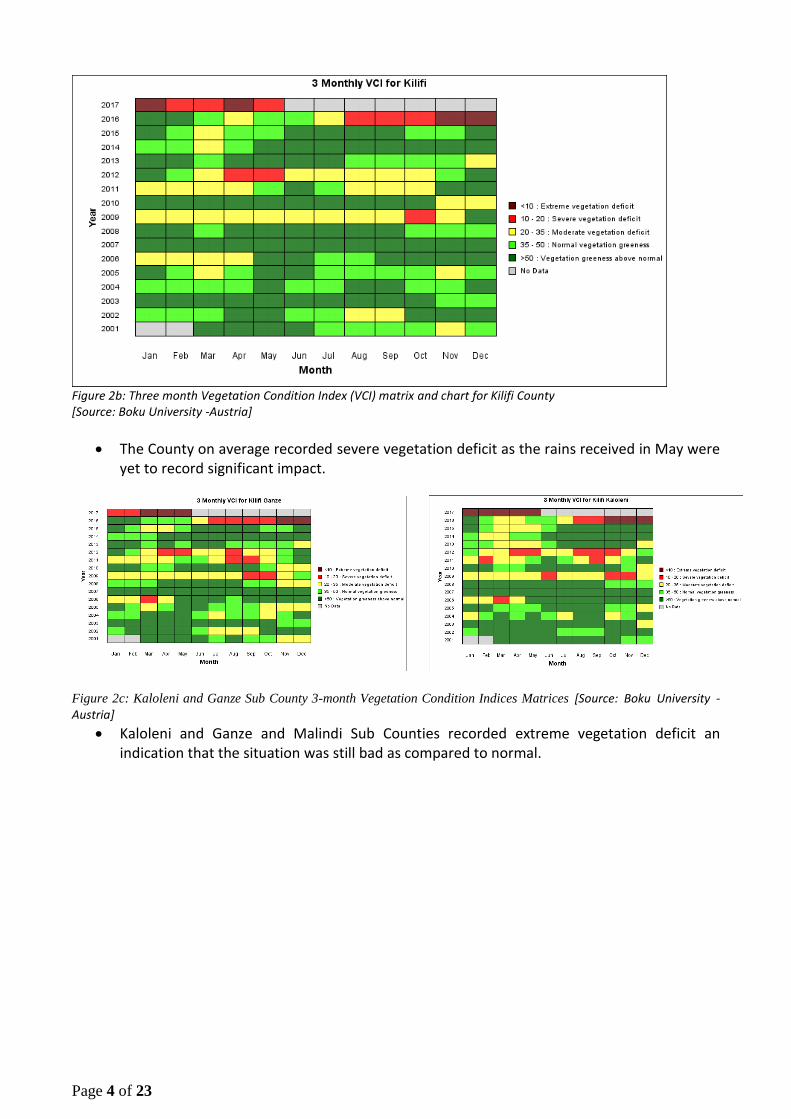
Figure 2b: Three month Vegetation Condition Index (VCI) matrix and chart for Kilifi County [Source: Boku University -Austria]
The County on average recorded severe vegetation deficit as the rains received in May were yet to record significant impact.
Figure 2c: Kaloleni and Ganze Sub County 3-month Vegetation Condition Indices Matrices [Source: Boku University -Austria]
Kaloleni and Ganze and Malindi Sub Counties recorded extreme vegetation deficit an indication that the situation was still bad as compared to normal.

Page 5 of 23
Figure 2d_1: Kilifi County Time Series Analysis for 3-month Vegetation Condition Indices [Source: Boku University -Austria]
The 3-month VCI recorded in May remained lower even compared with the minimum ever recorded in 30 years the same time. When compared to the long term mean, the current situation remains significantly poor.
The situation expected to improve as the rains continued but not much expected so far.
Figure 2d_2: NDVI analysis
The figure above compares NDVI long term and the year 2017 in dekads, it clearly shows the year 2017 NDVI has been below long term mean since January but an improvement since mid-March to last dekad of May 2017.

Page 6 of 23
2.1.2 Pasture
Figure 3a: Kilifi County Pasture Condition
Pasture condition across the county recorded an improvement with 47.1 percent recording good condition as compared to the previous month with 11.8 percent poor.
Pasture condition in Kilifi South, Kilifi North, Malindi and some parts of Ganze sub counties was fairly good with Magarini and Kaloleni recording minimal pastures regeneration.
Pasture condition remained below normal across all the livelihood zones at this time of the year.
2.1.3 Browse
Figure 3b: Kilifi County Browse Condition
In May, browse condition recorded some improvement following the rains recorded cross the county. On average, browse condition remained good with 64.7 percent across all livelihood zones recording good condition.
The browse condition in the county was below normal at this time of the year.

Page 7 of 23
2.2 Water Resource 2.2.1 Sources
Figure 4: Water sources for households in Kilifi County
Significant recharge of surface water sources was recorded in Ganze (Ganze ward) and Kaloleni sub counties.
The main water sources for domestic and livestock use across all livelihood zones in the month of May were pipeline, pans/dams, shallow wells, natural ponds and boreholes.
The larger percentage of households who relied on water pans were mainly from marginal mixed farming zone of Kaloleni and Magarini sub counties, those in the cash cropping and food cropping zones mainly relied on piped water while those who depended on rivers were households along river Sabaki in Malindi and Magarini sub counties.

Page 8 of 23
2.2.2 Household water access and utilization
Figure 5: Household average return distance to water points
The average distance from water sources for households continued recording a decrease. In May there was a decrease of 29.8 percent as compared to the previous month but still high as compared to the long term mean.
The decrease in average distance can be attributed to some recharge of the water pans and dams following enhanced rains recorded in May.
On average the 20ltr jerrycan of water was costing Kshs 15.
Average distance to water points for households during the month was significantly high compared to the long term mean.

Page 9 of 23
2.2.3 Livestock access to water
Figure 6: Average livestock return distance to water point from grazing area.
Following the rains experienced across the county, average distance from grazing areas continued to record significant (50 percent) decrease as compared to the previous month.
The decrease in average distance can be attributed to improved pasture quality and quantity and recharge of surface water sources.
Average distances expected to continue declining as pasture and browse quality and quantity improved across the livelihood zones.
The average return distance to grazing areas during the month was the same as the long term mean at this time of the year.

Page 10 of 23
3.0 PRODUCTION INDICATORS 3.1 Livestock Production 3.1.1 Livestock body condition
Livestock body condition has started to record some improvement across the livelihood zones.
Body condition for cattle remained between fair to good across the livelihood zones.
Body condition for goats and sheep was good across all livelihood zones occasioned by availability of browse following some rains and showers across the county.
3.1.2 Livestock diseases
Diarrhea was reported across all livelihood zones in cattle due to consumption fresh lush pasture.
CCPP was recorded in Ganze and Kaloleni sub counties while cases of New Castle Disease were recorded across all livelihood zones. Some cases of lumpy skin disease were also recorded in Ganze Sub County but vaccination against all these diseases is ongoing across the county.
3.1.3 Milk production
On average milk production remained low as compared to the long term mean.
Milk production expected to increase as livestock body condition recorded positive improvement as distance from grazing areas decreased significantly.

Page 11 of 23
3.2 Rain fed crop production 3.2.1. Stage and condition of food crops
Maize crop an average at knee-high in marginal and food cropping zones and in good condition as first weeding continued. In marginal areas of Magarini maize planting was the main activity as maize crop germination was recorded in the larger part of the county.
Green grams and cowpeas at germination stage and in good condition.
3.2.2. Crop harvest
Minimal harvesting of pineapples in Magarini Sub County and some harvesting of mangoes and coconuts along the coastal strip was recorded.
4.0 MARKET PERFORMANCE 4.1 Livestock Marketing 4.1.1 Cattle Prices
Figure7: Average cattle price (4 year bull/steer) in major livestock markets in Kilifi County.
Average cattle prices recorded an increase of 7.8% as compared to the previous month.
The increase can be attributed to improved body condition following availability of some pastures and water and low supply in the market.
The highest prices were recorded in the mixed farming zone while lowest were in the ranching zone of Bamba.
The average price recorded in the month of May was higher than the long term mean at this time of the year.

Page 12 of 23
4.1.2 Goat Prices
Figure 8: Average goat price (3 year old) at market level in Kilifi County.
The average market price of a 3 years medium sized goat increased by 15.9 percent as compared to the previous month and this may be attributed to good body condition as browse was available.
The highest average goat prices were recorded in the mixed farming zone and lowest were recorded in the livestock farming zone.
The average price recorded in the current month was higher than the long term mean at this time of the year.

Page 13 of 23
4.2 Crop Prices 4.2.1 Maize
Figure 9: Average maize price in Kilifi County.
Average maize price per kilogram increased significantly by 46.5 percent as compared to the previous month.
The increase in price can be attributed to depleted stock as supply was with suppliers only, significant increase in price of sifted maize meal whose availability was low in the market.
Average price expected to remain high till the next harvest.
The highest average maize price was recorded in the livestock farming zone in Bamba ward going at an average of Kss100/kg.
The average price recorded for the month under review was significantly higher compared to long term mean at this time of the year.

Page 14 of 23
4.2.2 Beans
Figure 10: Average beans price in Kilifi County.
Average beans price per kilogram increased further by 5.8 percent from Ksh117.30 recorded in the month previous month to Ksh124.10 for the month of May.
Increase average price can be attributed to depleted stock of green grams and cowpeas at household level following poor performance of the last three consecutive seasons coupled with importation cost.
The livestock farming zone recorded the highest average price of Ksh134 per kilogram while the mixed farming zone posted the lowest average price of Ksh100 per kilogram.
Average price expected to remain high till the next harvest.
The average price recorded for the month under review was higher than the long term mean price at this time of the year.

Page 15 of 23
4.3 TERMS OF TRADE
The terms of trade determines the purchasing power of livestock (goat) sellers.
Figure 11: Terms of Trade for Kilifi County
The terms of trade were unfavourable for livestock keepers in the month of May compared to the previous month.
The livestock keepers were able to buy 58 kilograms of maize by selling one goat as compared to 70.5 kilograms in the previous month.
There was variation in Terms of Trade across livelihood zones due to varying average price of maize.
The terms of trade for May were slighly compared to the long term mean at this time of the year.

Page 16 of 23
5.0 NUTRITIONAL STATUS 5.1 Milk Consumption
Figure 12: milk consumption chart
Milk consumption continued recording a decrease as production too remained low.
The consumption expected to increase as livestock body condition continued recording an improvement.
Milk prices in the market increased significantly attracting lower number of customers.

Page 17 of 23
5.2 Health and Nutritional Status 5.2.1 Mid Upper Arm Circumference [MUAC]
Figure 13: Proportion of children under five years at risk of malnutrition
The proportion of children at risk of malnutrition continued to increase as household food security declined.
Household food stress increased significantly as food prices continued increasing and household stock got depleted.

Page 18 of 23
5.2.2 Food Consumption Score
Figure 14: Food Consumption Score
Households’ food consumption remained poor and dietary diversity was also low.
Food cropping, ranching and cash cropping zones recorded highest number of households under poor food consumption bracket.
Significant number of households across all livelihood zones were under borderline food consumption.

Page 19 of 23
5.3 Coping Strategies 5.3.1 Coping Strategy Index
Figure 13: Coping Strategy Index for Kilifi County
Household food insecurity was evident in May as households tried to cope with increased food prices and unavailability of preferred food stuffs in the market.
Most employed coping strategies among households were; Reduced quantity of food consumed by adults to ensure children get enough to eat Reduction in number and meal rations per day. Opting for less preferred or cheaper meals.
Households expected to continue employing different coping strategies till next harvest.

Page 20 of 23
6.0 CURRENT ONGOING INTERVENTION MEASURES
6.1 Food- aid
Food (rice, beans, UNIMIX porridge and cooking oil) distributed by the national government across all the sub counties targeting most vulnerable households due to drought.
Distribution of food (maize flour, rice, sugar and wheat flour) to 530 households in Magarini sub county by Islamic Relief
Support to ECD education with school meals, 93schools in Ganze and Kaloleni sub counties by Plan International.
Supplementary/ therapeutic feeding program in health facilities by County Department of Health, UNICEF, IMC.
6.2 Non-food aid Purchase and installation of 8No. of 10,000ltrs water tanks in 8No. of schools in Bamba
ward, Ganze sub county by NDMA.
Cash transfers to the elderly, orphaned and vulnerable children, people with severe disability by National government.
Cash transfer by the County Government to 1750 households across the county.
Cash transfers to 1300 vulnerable households at rate of Kshs2000 per month in Kaloleni Sub County by Kenya Red Cross Society.
Cash for Asset by GoK/ WFP, World Vision, Kenya Red Cross Society and NDMA in Ganze, Kaloleni, Malindi, Rabai and Magarini Sub Counties to 12,200No.of households.
Support to irrigation farming by the county government through provision of farm inputs by agriculture department.
Vaccination against CCPP, anthrax, Rift Valley Fever and deworming across the county by Veterinary department.
Community sensitization on conservational Agriculture by County Department of Agriculture and FAO.
Launch and capacity building of the youth under Kilifi Youth Economic Empowerment Project support by the county government WFP, WV, VF, FOA, and NDMA
Livestock feed distribution to 40 households in Kaloleni Sub County under Early Warning Early Response pilot project by FAO.
Community capacity building on appropriate infant and young child feeding practices (mother-to-mother support groups) by county department of Health, Plan International and World Vision.
Promotion of maternal and child health in the county by Share progamme (International Medical Corps) in collaboration with the county department of health.
Promotion on local-poultry by Agricultural Sector Development Sector Programme across the county.

Page 21 of 23
7.0 EMERGING ISSUES Flooding on river Nzovuni and washing away of farms (approximately 50 acres) of crop.
Flash flood along rivers Sabaki washing away the crops in Malindi and Magarini sub counties
Increased food prices.
7.1 Food Security Prognosis Food insecurity expected to continue till the next harvest as food prices increased
significantly.
Following the rains and expected improvement of livestock body condition, milk production expected to increase.
Following recharge of pans and dams, water stress for households and livestock expected to decline.
If the rains continue up to end of June, some significant harvest will be recorded.
7.2 INDICATORS TO BE MONITORED
Market food prices
Household food security across all livelihood zones
Farms in areas at high risk of flooding
2017 long rains performance on crop production.

Page 22 of 23
8 RECOMMENDATIONS Water sector
Construction of mega dam to tap water from the rains recorded upstream and pouring into the Indian Ocean to support livestock, households and irrigation in the county. Excavation of water pans in Kaloleni and Ganze sub counties to boost water access during drought.
Pipeline extension Kaloleni, Ganze and Magarini sub counties which are hard hit by drought.
Agriculture Sector
Distribution of relief seeds for drought tolerant to farmers affected by floods.
Promotion of small-scale irrigation on high value crops in order to contribute to
household incomes and diversified household diet. Farmers’ sensitization on crop insurance.
Livestock Sector
Livestock feed supplementation to support the livestock whose body condition had deteriorated significantly due to lack of pasture and water stress.
Upscale quantity of livestock support programmes, Kaloleni, Ganze and Magarini sub counties.
Diversification on livestock keeping; more investment on goat, bee-keeping and local chicken following lessons learnt from recent drought
Community sensitization on early livestock off take/disposal, formation of cooperative and feed conservation.
Promote Pasture and fodder planting in the county during this rainy season and under irrigation.
Vaccination against CCPP and NCD across the county.
Livestock disease surveillance following livestock migration across the county.
Health Sector
Support for malnourished children under five years in areas recording high cases of children at risk of malnutrition.
Purchase and distribution of PUR, water treatment chemical to households accessing water
from pans and dams.
Out scale mass screening to capture cases (under-fives, pregnant and lactating women) at risk of malnutrition or already malnourished for timely intervention.
Education Sector
Upscale the number of schools under Home Grown School Meals Programme (HGSMP) to boost retention.
Support schools with installation of water harvesting structures for water harvesting during this rains’ season in Ganze, Kaloleni and Magarini sub counties.
Support to schools with food-for-fees in Kaloleni and Ganze sub counties.

Page 23 of 23
Multi-Sectoral
Frequent rapid assessment to monitor drought situation, household food security for timely and appropriate interventions.
Upscale cash transfer beneficiaries across the county
Significant investment on attitude change towards adaptation to Climate Change and Climate Smart Agriculture