Drought experience in the Júcar River Basin Authority
49
Drought experience in the Júcar River Basin Authority Javier Ferrer Head of the Hydrological Planning Department Júcar River Basin Authority
description
Drought experience in the Júcar River Basin Authority. Javier Ferrer Head of the Hydrological Planning Department Júcar River Basin Authority. Index. Júcar River Basin Authority (CHJ) and recent drought Situation indicators used by CHJ Actions during current drought 2005-08 - PowerPoint PPT Presentation
Transcript of Drought experience in the Júcar River Basin Authority

1
Drought experience in the Júcar
River Basin Authority
Javier FerrerHead of the Hydrological Planning
Department Júcar River Basin Authority

2
Index
• Júcar River Basin Authority (CHJ) and recent drought
• Situation indicators used by CHJ• Actions during current drought 2005-08
Actions to minimise environmental impacts Management and control actionsActions to obtain additional resources Saving actions

3
Júcar River Basin Authority and current drought

4
Description of the Júcar
River Basin Authority
GALICIA
PRINCIPADO DEASTURIAS
CANTABRIA
PAISVASCO
NAVARRA
ARAGON
CATALUÑA
VALENCIACASTILLA-LA MANCHA
MADRID
EXTREMADURA
ANDALUCIA
MURCIA
BALEARES
CANARIAS
LA RIOJA
CEUTA
MELILLA
CASTILLA-LEON
Júcar
Demanda total por uso
79%
17%
3%
1% 0% Agrícola
Urbano
Industrial
Ganadero
Recreativo
Demanda total por origen de los recursos
42%
52%
4%
0%
2%
Superficial
Subterráneo
Reutilización
Desalinización
Transferencias (MCT)
Surface (km2) 43.000
Permanent population 4.792.528Equivalent population due to tourism
367.322
Irrigation surface (ha) 347.275Water demand (hm3/year)
3.172

5
Three consecutive years of intense drought
0
200
400
600
800
19
40
/41
19
42
/43
19
44
/45
19
46
/47
19
48
/49
19
50
/51
19
52
/53
19
54
/55
19
56
/57
19
58
/59
19
60
/61
19
62
/63
19
64
/65
19
66
/67
19
68
/69
19
70
/71
19
72
/73
19
74
/75
19
76
/77
19
78
/79
19
80
/81
19
82
/83
19
84
/85
19
86
/87
19
88
/89
19
90
/91
19
92
/93
19
94
/95
19
96
/97
19
98
/99
20
00
/01
20
02
/03
20
04
/05
20
06
/07
año
mm
Rainfall Júcar Historical average rainfull Average since 1980
Rainfall in the Júcar system
2005/06

6
Natural discharge up to the Tous reservoir
0200400600800
1000120014001600180020002200240026002800
19
40
/41
19
42
/43
19
44
/45
19
46
/47
19
48
/49
19
50
/51
19
52
/53
19
54
/55
19
56
/57
19
58
/59
19
60
/61
19
62
/63
19
64
/65
19
66
/67
19
68
/69
19
70
/71
19
72
/73
19
74
/75
19
76
/77
19
78
/79
19
80
/81
19
82
/83
19
84
/85
19
86
/87
19
88
/89
19
90
/91
19
92
/93
19
94
/95
19
96
/97
19
98
/99
20
00
/01
20
02
/03
20
04
/05
20
06
/07
año
hm
3
Total contribution into Tous reservoir Avegare contribution of historical Natural Regime
Average since 1980 in Natural Regime
Three consecutive years of intense drought
Year 2005/06 historical minimum since 1940/41

7
Legal FrameRoyal Decree 1265/2005, of October 21st, by which exceptional administrative measures are adopted for the management of hydrological resources and for the correction of drought effects in the hydrological basins of rivers Júcar, Segura and Tajo, extended until 30th November 2008 by Royal Decree-Law 9/2007, of October 5th.
The Permanent Commission of the Governing Board, constituted on December 1st 2005, has developed a detailed follow-up of the drought evolution, meeting up monthly. Thanks to its constitution, public participation is made effective in drought management.

8
1) 1st December 20052) 21st December 2005 3) 21st January 20064) 13th February 20065) 15th March 2006 6) 18th April 2006 7) 22nd May 2006 8) 27th June 2006 9) 19th July 2006 10) 24th August 2006 11) 12th September 2006 12) 28th September 2006 13) 15th November 2006 14) 15th December 200615) 15th February 200716) 20th April 200717) 18th July 200718) 17th September 200719) 31st October 200720) 12th December 200721) 15th February 200822) 14th March 200823) 18th April 200824) 12th June 200825) 16th September 200826) 17th October 200827) 22th December 200828) 12th March 2009
Meeting Calendar

9
Composition of the Commission: RD 1265/2005Delegate organ from the Governing Board for the drought
follow-up and managementEntitled to vote (13) Presides: President of JRBA JRBA (3) : Commissioner, Technical Director, Head HPD of
the JRBA. Ministries (2): Industry (IGME) and MAPA CCAA (Autonomous Communities, 4) Users (3):
Valencia Town Hall Real del Júcar Ditch. Iberdrola, S.A.
In advisory capacity (4)• Environmental Interest Defence: Agró• Entrepreneurial Representation: AVA• Union representation: CCOO• Local Entities: Albacete municipality
Numerous “guests”

10
Global drought indicator in the Júcar system
JÚCAREvolución Indice de sequía
0,0
0,10,2
0,3
0,40,5
0,6
0,7
0,80,9
1,0
oct
-01
feb
-02
jun
-02
oct
-02
feb
-03
jun
-03
oct
-03
feb
-04
jun
-04
oct
-04
feb
-05
jun
-05
oct
-05
feb
-06
jun
-06
oct
-06
feb
-07
jun
-07
oct
-07
feb
-08
jun
-08
Special Drought Plan ApprovalOrder Ministry of Environment 698/2007 March 21st
Action Plan Approval
Permanent Commission Constitution
Drought Decree. RD 1265/2005
Entry of the Júcar system in emergency
scenario
11
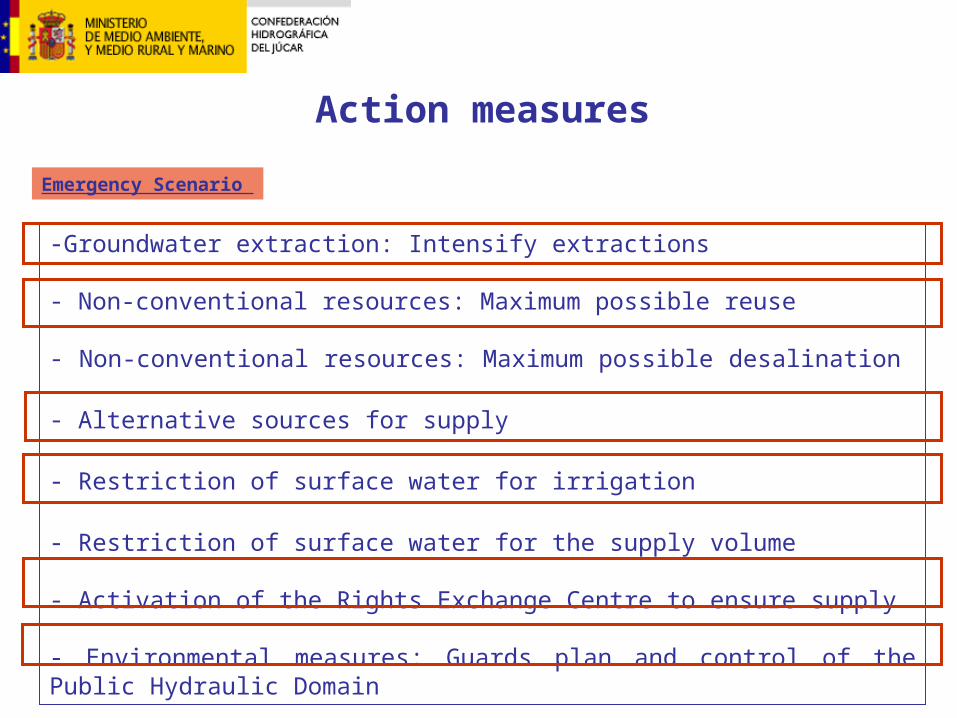
Action measures
Emergency Scenario
-Groundwater extraction: Intensify extractions
- Non-conventional resources: Maximum possible reuse
- Non-conventional resources: Maximum possible desalination
- Alternative sources for supply
- Restriction of surface water for irrigation
- Restriction of surface water for the supply volume
- Activation of the Rights Exchange Centre to ensure supply
- Environmental measures: Guards plan and control of the Public Hydraulic Domain

12
Indicators used for water resources management
Type of drought indicators:•General analysis •Drought operational indicators (official, institutional)•Drought indicators in rainfall •Total discharge indicators

13
Volume in the Júcar system
September 2008

14
Indicator Evaluation and Threshold Definition
0.5
VmaxVmin0
0.5
1
Vmed
Identify the origin of water resources associated to units with most important demand and representative indicator selection:
• Pluviometry
• River Discharge
• Volume kept in reservoirs
• Piezometric levels in aquifers
Status Index Status
0,75 – 1,00 NORMAL
0,50 – 0,75
0,30 – 0,50 PRE-ALERT
0,15 – 0,30 ALERT
0,00 – 0,15 EMERGENCY

15
SISTEMA EXPLOTACIÓN Ind Estado 30/09/2008
ÍNDICE SIST. EXPLOTACIÓN
1 0,93 2 0,49 3
Cenia-Maestrazgo 0,70
0,62
4 0,56 5 0,82 6
Mijares-Plana de Castellón 0,72
0,73
7 0,55 8 0,92 9
Palancia-Los Valles 0,54
0,70
10 0,88 11 0,00 12 0,41 13 0,44 14 0,53 15 0,43 16
Turia
0,30
0,48
17 0,39 18 0,52 19 0,50 20 0,39 21 0,38 22 0,97 23 0,19 24 0,36 25 0,85 26 0,41 27 0,49 28
Júcar
0,83
0,40
29 0,68 30
Serpis 0,63
0,64
31 Marina Alta 0,78 0,78 32 Marina Baja 0,91 0,91 33 0,79 34
Vinalopó-Alacantí 0,70
0,73
34 singular indicators in JRBA:• 9 reservoir volume• 9 piezometric level• 9 fluvial networks (3 months)• 7 pluviometers (12 months)
SISTEMA EXPLOTACIÓN Ind Estado 31/03/2008
ÍNDICE SIST. EXPLOTACIÓN
1 0,99 2 0,52 3
Cenia-Maestrazgo 0,74
0,66
4 0,39 5 0,82 6
Mijares-Plana de Castellón 0,66
0,67
7 0,35 8 0,70 9
Palancia-Los Valles 0,61
0,57
10 0,32 11 0,10 12 0,04 13 0,19 14 0,39 15 0,45 16
Turia
0,53
0,33
17 0,00 18 0,00 19 0,35 20 0,14 21 0,20 22 0,58 23 0,16 24 0,18 25 0,73 26 0,14 27 0,58 28
Júcar
0,82
0,14
29 0,53 30
Serpis 0,80
0,72
31 Marina Alta 0,82 0,82 32 Marina Baja 0,88 0,88 33 0,79 34
Vinalopó-Alacantí 0,70
0,73

16
Drought indicators JRBA (31 March 2008).
Status Index Values Scenario Inputs Scenario outputs During Condition Condition
Output Scenario
Normal - 0,50 -
Pre-alert 3 months
in a row ]0,5 - 0,30]
3 consecutive months Ie 0,50
Normal
2 consecutive months Ie 0,50 Alert
2 months in a row
]0,3 - 0,15] 6 consecutive months
Ie ]0,5 - 0,30]
Pre-alert
2 consecutive months Ie ]0,5 - 0,30]
Emergency 2 months
in a row < 0,15
6 consecutive months Ie ]0,3 - 0,15]
Alert
Drought status indicator per exploitation system
SCENARIOS
System Risk Valuation Scenario Cenia-Maestrazgo LOW NORMAL
Mijares-Plana de Castellón LOW NORMAL Palancia-Los Valles LOW NORMAL
Turia MEDIUM PRE-ALERT Júcar VERY HIGH EMERGENCY Serpis LOW NORMAL
Marina Alta VERY LOW NORMAL Marina Baja VERY LOW NORMAL
Vinalopó-Alacantí VERY LOW NORMAL
Sistema Jun Jul Ago Sep Oct Nov Dic Ene Feb Mar Cenia -Maestrazgo 0,67 0,63 0,61 0,64 0,7 0,59 0,74 0,69 0,66 0,66
Mijares -Plana de Castellón 0,66 0,66 0,65 0,72 0,73 0,66 0,68 0,67 0,66 0,67 Palancia -Los Valles 0,66 0,61 0,55 0,64 0,67 0,59 0,68 0,61 0,58 0,57
Turia 0,44 0,39 0,38 0,4 0,44 0,45 0,43 0,39 0,37 0,34 Júcar 0,29 0,26 0,23 0,23 0,22 0,19 0,16 0,14 0,14 0,14 Serpis 0,41 0,43 0,45 0,5 0,69 0,63 0,78 0,70 0,67 0,72
Marina Alta 0,51 0,51 0,55 0,69 1,00 0,92 0,96 0,89 0,90 0,82 Marina Baja 0,80 0,80 0,80 0,85 1,00 1,00 1,00 0,92 0,92 0,88
Vinalopó -Alacantí 0,74 0,73 0,83 0,95 1,00 0,86 0,87 0,80 0,82 0,73

17
Drought indicators JRBA (30 September 2008).
Status Index Values Scenario Inputs Scenario Outputs During Condition Condition
Output Scenario
Normal - 0,50 -
Pre-alert 3 months
in a row ]0,5 - 0,30]
3 consecutive months Ie 0,50
Normal
2 consecutive months Ie 0,50 Alert
2 months in a row
]0,3 - 0,15] 6 consecutive months
Ie ]0,5 - 0,30]
Pre-alert
2 consecutive months Ie ]0,5 - 0,30]
Emergency 2 months
in a row < 0,15
6 consecutive months Ie ]0,3 - 0,15]
Alert
Drought status indicator per exploitation system
SCENARIOS
System Dec Jan Feb Mar Apr May Jun Jul Aug Sep Cenia -Maestrazgo 0,74 0,69 0,66 0,66 0,58 0,71 0,71 0,70 0,66 0,62
Mijares -Plana de Castellón 0,68 0,67 0,66 0,67 0,62 0,65 0,68 0,68 0,65 0,73 Palancia -Los Valles 0,68 0,61 0,58 0,57 0,55 0,57 0,73 0,74 0,67 0,70
Turia 0,43 0,39 0,37 0,29 0,33 0,39 0,50 0,51 0,48 0,48 Júcar 0,16 0,14 0,14 0,14 0,20 0,29 0,34 0,39 0,38 0,40 Serpis 0,78 0,70 0,67 0,72 0,70 0,73 0,75 0,78 0,82 0,64
Marina Alta 0,96 0,89 0,90 0,82 0,76 0,83 0,86 0,86 0,83 0,78 Marina Baja 1,00 0,92 0,92 0,88 0,84 0,85 0,91 0,91 0,93 0,91
Vinalopó -Alacantí 0,87 0,80 0,82 0,73 0,57 0,75 0,80 0,82 0,77 0,73
System Risk Valuation Scenario Cenia -Maestrazgo LOW NORMAL
Mijares -Plana de Castellón LOW NORMAL Palancia -Los Valles LOW NORMAL
Turia MEDIUM PRE-ALERT Júcar HIGH ALERT Serpis LOW NORMAL
Marina Alta VERY LOW NORMAL Marina Baja VERY LOW NORMAL
Vinalopó -Alacantí VERY LOW NORMAL

18
Valores del Índice de estado Entradas a los escenarios Salidas de los escenarios Durante Condición Condición
Escenario de salida
Normalidad - 0,50 -
Prealerta 3 meses consecutivos
]0,5 - 0,30] 3 meses consecutivos con
Ie 0,50 Normalidad
2 meses consecutivos con Ie 0,50 Alerta 2 meses
consecutivos ]0,3 - 0,15]
6 meses consecutivos con Ie ]0,5 - 0,30]
Prealerta
2 meses consecutivos con Ie ]0,5 - 0,30] Emergencia 2 meses
consecutivos < 0,15
6 meses consecutivos con Ie ]0,3 - 0,15]
Alerta
Sistema Valoración riesgo Escenario Cenia-Maestrazgo BAJO NORMALIDAD
Mijares-Plana de Castellón BAJO NORMALIDAD Palancia-Los Valles BAJO NORMALIDAD
Turia BAJO NORMALIDAD Júcar MEDIO PREALERTA Serpis BAJO NORMALIDAD
Marina Alta BAJO NORMALIDAD Marina Baja MUY BAJO NORMALIDAD
Vinalopó-Alacantí BAJO NORMALIDAD
May Jun Jul Ago Sep Oct Nov Dic Ene Feb Cenia-Maestrazgo 0,71 0,71 0,70 0,66 0,62 0,66 0,68 0,60 0,63 0,61
Mijares-Plana de Castellón 0,65 0,68 0,68 0,65 0,73 0,74 0,72 0,68 0,68 0,68 Palancia-Los Valles 0,57 0,73 0,74 0,67 0,70 0,73 0,64 0,69 0,68 0,64
Turia 0,39 0,50 0,51 0,48 0,48 0,53 0,61 0,62 0,62 0,63 Júcar 0,29 0,34 0,39 0,38 0,40 0,44 0,51 0,46 0,47 0,49 Serpis 0,73 0,75 0,78 0,82 0,64 0,67 0,67 0,73 0,72 0,67
Marina Alta 0,83 0,86 0,86 0,83 0,78 0,62 0,67 0,51 0,56 0,56 Marina Baja 0,85 0,91 0,91 0,93 0,91 0,81 0,97 0,97 0,88 0,91
Vinalopó-Alacantí 0,75 0,80 0,82 0,77 0,73 0,57 0,61 0,58 0,61 0,60
Drought status indicator per exploitation system
SCENARIOSDrought indicators JRBA (28 February 2009).

19
Compared historical average
1940-2006
Oct 2007 – Mar 2008
Rain indicators
Oct 2007 – sep 2008

20
Júcar runoff indicatorsLatest natural discharge evolution
Discharge hm3/month Historical position
Historical series of 67 years
jun-08 jul-08ago-
08sep-
08 abr-
08may-
08 jun-08 jul-08ago-
08sep-
08
Alarcón 25.07 13.08 8.33 5.45 25 22 32 19 9 3
Contreras 31.36 13.33 9.33 8.57 22 30 45 21 10 8
Alarcón-Molinar 21.32 21.58 19.55 18.43 20 16 26 32 23 20
Contreras-Molinar-Tous 17.81 12.75 14.87 15.69 30 35 42 38 39 37
Total up to Tous 95.56 60.74 52.09 48.14 17 20 32 18 13 10
Tous-Sueca 45.23 27.58 18.75 17.15 41 61 68 67 66 57
Total140.7
9 88.32 70.84 65.28 21 29 56 44 30 19
Discharge to Alarcón ACCUMULATED in Natural Reg. since oct.
129.38
142.46
150.79
156.24 3 6 8 8 8 8
Percentile (P (q<Q)) 4% 9% 12% 12% 12% 12%
Discharge to Tous ACCUMULATED in Natural Reg. since oct.
570.70
631.44
683.53
731.67 3 4 9 9 10 10
Percentile (P (q<Q)) 4% 6% 13% 13% 14% 14%

21
Actions to minimise environmental impacts Management and control actionActions to obtain additional resourcesSaving actions
Action Plan 2005/08

22
Environmental measures
Flow maintenanceWetland surveillance

23
Surveillance and maintenance of minimum flows
Irrigation
From aquifer From Júcar
river
Júcar River0
1
23
4
5
6
78
9
10
1-ab
r-07
1-m
ay-0
71-
jun-
071-
jul-0
71-
ago-
071-
sep-
071-
oct-0
71-
nov-
071-
dic-0
71-
ene-0
81-
feb-0
81-
mar
-08
1-ab
r-08
1-m
ay-0
81-
jun-
081-
jul-0
81-
ago-
081-
sep-
081-
oct-0
81-
nov-
08
Caud
al m
3/s
Q [El Picazo] Q [Los Frailes]Q [El Picazo - SAIH] Q [Los Frailes - SAIH]

24
Júcar river in summer 1995
Objective: flow maintenance downstream from Alarcón reservoir
Júcar river in summers 2006 and 2007
Surveillance middle reach of Júcar river

25
Use reduction 2007-08
Objective: Reducing extractions in the middle section of the Júcar river, both in surface water and in groundwater with a greater effect on the river flow.
2007 Rights acquisition through reduction of irrigated surface.
2008 Rights acquisition by using less water-consuming crops (spring crops).
Public offer agreement for water rights acquisition in the middle reach of the
Júcar basin due to environmental reasons

26
20 40 60 km0
4320000
4340000
4360000
560000 580000 600000 620000 640000
TransmisividadRío J ucarCeldas Inactivas
7500 m /día2
6000 m /día2
3500 m /día2
1500 m /día2
750 m /día2
100 m /día2
10 30 5070
90
9070
50
30
Selection criteria:1. Effects on river (0-20
points)2. Offered price (0-20 points)
Extension: 28.000 has
Right volume: 148 hm3
Time frame: seasons 2007-08
2007 2008
Uses reduction 2007-08
Maximum amount
Minimum amount
0,1957 €/m3 0,13 (€/m3)
Maximum amount
Minimum amount
0.25 €/m3 0.20 (€/m3)

27
TotalHGU Presented requests: 119Right volume (hm3) 56,8Renounced volume (no economic compensation) (hm3)
22,9
Offered volume (hm3) 27,3Materialised budget (million€) 5,5Reserved volume (hm3) 6,6OPAD (I,II,III) 2008:
TotalHGU Presented requests: 234Right volume (hm3) 109,6Renounced volume (no economic compensation)(hm3)
12,5
Offered volume (hm3) 50,6Materialised budget (million€) 12,7Reserved volume (hm3) 46,5
Use reduction 2007-08
OPAD 2007:

28
-80-70-60-50-40-30-20-10
0102030405060
oct
nov
dic
ene
feb
mar abr
may jun
jul
ago
sep
Gan
anci
as-P
érdid
as (h
m3)
aH 04-05 aH 05-06 aH 06-07 aH 07-08
Picazo – Los Frailes(Monthly accumulated)
-20
-15
-10
-5
0
5
10oc
t
nov
dic
ene
feb
mar abr
may jun
jul
ago
sep
Gan
anci
as-P
érdid
as (h
m3/
mes
)
aH 04-05 aH 05-06 aH 06-07 aH 07-08
Picazo – Los Frailes aH 04-05
aH 05-06
aH 06-07
aH 07-08
oct -8,78 -4,19 -4,09 -3,87nov -2,36 -2,47 -2,62 -2,70dec 1,15 -0,69 -2,08 -2,31jan 2,44 -0,34 -1,85 -1,04feb 2,59 -0,47 -1,18 -0,72mar 0,56 -1,83 -1,12 -0,18apr -6,93 -2,89 -1,24 -0,98may -16,06 -4,73 -2,78 -2,15jun -14,95 -6,01 -4,21 -2,55jul -11,13 -9,22 -3,74 -2,86aug -10,14 -8,18 -3,93 -4,34sep -6,75 -5,83 -4,02 -3,87
aH 04-05
aH 05-06
aH 06-07
aH 07-08
oct -8,78 -4,19 -4,09 -3,87nov -11,13 -6,66 -6,71 -6,57dec -9,98 -7,36 -8,78 -8,88jan -7,54 -7,69 -10,63 -9,92feb -4,95 -8,16 -11,81 -10,64mar -4,39 -9,99 -12,93 -10,82apr -11,33 -12,88 -14,17 -11,81may -27,39 -17,61 -16,96 -13,96jun -42,34 -23,62 -21,16 -16,51jul -53,47 -32,84 -24,90 -19,37aug -63,61 -41,02 -28,84 -23,72sep -70,35 -46,85 -32,86 -27,58
Monthly and accumulated balance

29
Monitoring network in Albufera, Valencia

30
Monitoring network:
Lake level Outflow in the 5
canals
Environmental measures
Albufera LakeRamsar Wetland

31
0
100
200
300
400
500
600
1-oc
t
1-no
v
1-dic
1-en
e
1-fe
b
1-m
ar
1-ab
r
1-m
ay
1-ju
n
1-ju
l
1-ag
o
1-se
p
(mm
.s.n
.m.)
Lake level in Pujol canal 2007/ 08 Lake level in Pujol canal 2006/ 07Average level Lake level in Pujol canal 2005/ 06
Levels in Albufera lake

32
-200
20406080
100120
1-oc
t
1-no
v
1-dic
1-en
e
1-fe
b
1-m
ar
1-ab
r
1-m
ay
1-ju
n
1-ju
l
1-ag
o
1-se
p
Salidas
acu
mul
adas
(hm
3)
Salidas Gola Pujol 2006/ 07 Salidas Gola Pujol 2007/ 08
0102030405060708090
100
1-oc
t
1-no
v
1-dic
1-en
e
1-fe
b
1-m
ar
1-ab
r
1-m
ay
1-ju
n
1-ju
l
1-ag
o
1-se
pApor
tes
acum
ula
dos
(hm
3)Salidas Gola Perellonet 2006/ 07 Salidas Gola Perellonet 2007/ 08
0
50
100
150
200
250
300
350
400
1-oc
t
1-nov
1-dic
1-en
e
1-fe
b
1-m
ar
1-ab
r
1-m
ay
1-ju
n
1-ju
l
1-ag
o
1-se
p
Salid
as a
cum
ula
das
(hm
3)
Salidas Totales 5 Golas 2006/ 07
Salidas Totales 5 Golas 2007/ 08
Calibrated outflow in the 5 canals
0102030405060708090
100
1-oc
t
1-no
v
1-dic
1-en
e
1-fe
b
1-m
ar
1-ab
r
1-m
ay
1-ju
n
1-ju
l
1-ag
o
1-se
pApor
tes
acum
ula
dos
(hm
3)
Salidas Gola Perelló 2006/ 07 Salidas Gola Perelló 2007/ 08

33
Management and control measures

34
Júcar management simulation model

35
Campaign forecast 2007/2008 (calculation from April 1st 2008) Supply in 2006/07 Discharge 2005/06 (blue) Dreadful discharge 1993/94 (orange)
159179 187
207226
247268
312335
365
320
269 266
0
50
100
150
200
250
300
350
400
01-o
ct-0
7
oct
nov
dec jan
feb
mar
apr
may jun jul
aug
sep
mes
Stor
ed v
olum
e in
Ala
rcón
, Con
trer
as a
nd
Tou
s (h
m3)
Hidro_05_06 Hidro_93_94 2007/ 08
2006/ 07 2005/ 06 Minimum Volume

36
For additional resources
• Supply from other rivers• Use of drought wells (joint use)• Used water reuse

37
Historical analysis of water supplySupply for the metropolitan area of
Valencia with surface water from rivers Júcar and Turia
0
20
40
60
80
100
120
1996
/97
1997
/98
1998
-99
1999
-00
2000
-01
2001
-02
2002
-03
2003
-04
2004
-05
2005
-06
2006
-07
2007
-08
hm3
Vol Total Júcar + Turia Vol River Júcar Vol River Turia

3814519126Total
40 40General Community from Canal Júcar-Turia
5 14Mayor de la Villa and Honor de Corbera Ditch
1486Cullera irrigation union
88 Sueca irrigation union
3 3Real de Carcaixent Ditch
7 7Real de Escalona Ditch
68266Real del Júcar Ditch
Total premises
RepumpingWells 2008
Drought wells and re-pumping in the irrigation
system

39
Accumulated extractions in drought wells
0
5
10
15
20
25
30
35
40
45
sta
rt-m
ay
jun jul
au
g
se
p
oc
t
no
v-d
ec
jan
-fe
b
ma
r-a
pr
Vo
lum
e (
hm
3)
2006
2007
2008

40
Drought wells: flows and levels
Re-pumping in irrigation network
Monthly control Albufera Lake and Springs

41
Basic Monitoring Network
Specific drought network
Albufera Piezometry HydrometryGeneral Piezometry
Piezometry 46Piezometry =
72Piezometry and Quality 26 Quality = 33
Quality 7
Hydrometry 4Hidrometry
=4

42
0
4
8
12
16
20
24
28
32
36
40
24-m
ar-0
623
-abr
-06
23-m
ay-0
623
-jun-
0623
-jul-06
23-a
go-0
622
-sep
-06
22-o
ct-0
622
-nov
-06
22-d
ic-0
622
-ene
-07
21-f
eb-0
724
-mar
-07
23-a
br-0
723
-may
-07
23-j
un-
0723
-jul-07
23-a
go-0
722
-sep
-07
22-o
ct-0
722
-nov
-07
22-d
ic-0
722
-ene
-08
21-f
eb-0
823
-mar
-08
22-a
br-0
822
-may
-08
22-j
un-
0822
-jul-08
22-a
go-0
821
-sep
-08
22-o
ct-0
821
-nov
-08
m.s
.n.m
GWB Valencia South Plain
2929-5-44 08.26.031 (Carlet)
2930-1-17 08.26.044 (Carcaixent)
2830-8-27 08.27.036 (Alcàntera del Xuquer)
2929-1-40 08.27.091 (Picassent)
2930-5-112 08.26.115 (Manuel)
2929-6-163 08.26.110 (Alzira)
2830-4-43 08.27.009 (Gavarda)
2930-1-35 08.26.047 (Masalavés)
2930-1-3 08.26.043 (Alzira)
2829-4-40 08.26.002 (Carlet)

43
WWW.CHJ.ES
Enero de 2009

44
EDAR Pinedo II. Extension Quart-Benatger Carraixet Paterna-Fte. del Jarro
TOTALUDA Tradit. I. Vega
de Valencia.Rest of Ditches
Del Oro Ditch Tradit. I. Vega de Valencia.Rest of Ditches
Tradit. I. Vega de Valencia.Rest of Ditches
Tradit. I. Vega de Valencia.Rest of Ditches
Tradit. I. Vega de Valencia.Real Ac de Moncada
User Favara Ditch (B)
Del Oro Ditch (G) Ditches of Andarella (B), Xirivella (B), Benager (B), Faitanar (B) y Favara (G)
Rascanya Ditch (B) Tormos Ditch (G) Real de Moncada Ditch (B)
(thousand m3)(thousand m3) (thousand m3) (thousand m3) (thousand m3) (thousand m3) (thousand m3)
2005/06 6.015 22.156 0 0 0 0 28.171
2006/07 6.781 50.153 9.008 3.791 603 829 71.165
2007/08 9.946 66.857 12.782 3.444 214 913 94.157
Volumes of treated water reused during drought

45
Water conservation and saving measures

46
0
100
200
300
400
500
600
700
800
900
Vol
um
en (h
m3)
2004-05 2005-06 2006-07 2007-08
Suministros anuales Turia y Júcar(Superf_Júcar+Superf_Turia+Abast. Valencia_Turia+Abast.
Valencia_Júcar+Reutilización+Pozos+Rebombeos)
Abast. Valencia_Turia Abast. Valencia_Júcar Superf_Turia Superficial_Júcar
Bombeos Rebomb Reutilización
Supply Valencia_Turia Supply Valencia_Júcar Surf_TuriaSurf_Júcar Pumping Re-pumpingReuse Supply Valencia Surf Turia+Jucar

47
Emergency works2005-08

48
Main investments in:Improvement in the supply guarantee for urban areas and sources for alternative resourceImprovement in drinking water treatment systemsImprovement in the efficiency of irrigation systems
Emergency works
Emergency Works
Budget (thousand
€)
Emergency Works 2005 19.285,0
Emergency Works 2006 35.286,0
Emergency Works 2007 15.350,0
Emergency Works 2008 (in course) 4.940,0
Total 74.861,0

49
Thank you for your
attention!