Handbook for principals and NAPLAN coordinators — NAPLAN ...

2014 NAPLAN RESULTS 1
NATIONAL ASSESSMENT PROGRAM LITERACY AND NUMERACY
NAPLAN – 2014
A comparison of the performance of students at Prince of Peace Lutheran
College in 2014 with students in Queensland and in Australia in the five categories of Reading, Writing, Spelling, Grammar and Punctuation and
Numeracy.
Analysis is based on data for the percentage of students at or above National Minimum Standards (NMS) and for Mean Scale Scores (MSS)
Garth Hunt September 2014

2014 NAPLAN RESULTS 2
Introductory Comments
The NAPLAN testing data for Prince of Peace Lutheran College was extracted from the
Queensland Curriculum and Assessment Authority (ACAA) report called “NAPLAN 2014
Outcomes – All Queensland Schools” which was published on the QCAA website on 18 August
2014.
The data for the achievement of Queensland and Australian schools was obtained by accessing
the interactive “NAPLAN 2014 Summary Report” published on 18 August 2014 on the ACARA
(Australian Curriculum Assessment and Reporting Authority) website.
Overview of the Process
The National Assessment Program – Literacy and Numeracy (NAPLAN) is an annual assessment
for students in Years 3, 5, 7 and 9 and has been part of the school calendar since 2008.
NAPLAN tests the sorts of skills that are essential for every child to progress through school and
life, such as reading, writing, spelling and numeracy. The assessments are undertaken
nationwide, every year, in the second full week in May.
NAPLAN is made up of tests in the four areas (or ‘domains’) of:
Reading
Writing
Language conventions
o Spelling
o Grammar and punctuation (G&P)
Numeracy
You can find an easy to understand infographic that gives useful information on the NAPLAN
tests and their benefits here
Reading
Writing
Spelling
Grammar and Punctuation (G&P)
Numeracy
The NAPLAN Summary Report concentrated on two areas of achievement;
The percentage of students in each of the achievement bands which determined the
percentage of students above the National Minimum Standard (NMS – ie the National
Benchmarks)
The Mean Scale Scores
This particular analysis deals with both sets of Scores even though I believe the Mean Scale
Scores are more meaningful.
The number of students involved in NAPLAN testing during 2014 was as follows;
Year 3 68 Year 7 42
Year 5 72 Year 9 71
Total 253 students Exempt students 10
Results
The results are presented in the following document in five different sections. Each section is
based in either the number of students scoring at or above the National Minimum Standard or
the Mean Scaled Scores. The results are shown in different formats to allow comparison
between data groups.

2014 NAPLAN RESULTS 3
78
80
82
84
86
88
90
92
94
96
98
100
Reading Writing Spelling G & P Numeracy Mean
Year 5 - NAPLAN - 2014 - % at or above NMS
PoP Qld Aust
Key Findings Section 1 The percentage of students at or above the National
Minimum Standards (NMS)
The results here are presented in the form of histograms comparing the results of Prince of
Peace students with Queensland and Australian students, in each of the five categories tested.
78
80
82
84
86
88
90
92
94
96
98
100
Reading Writing Spelling G & P Numeracy Mean
Year 3 – NAPLAN – 2014 - % at or above NMS
PoP Qld Aust

2014 NAPLAN RESULTS 4
Section 1 (Cont) The percentage of students at or above the National
Minimum Standards (NMS)
Key Conclusion
The average percentage of Prince of Peace students in Years 3 and 5 achieving at or above the
National Minimum Standard is well above both Queensland and Australian schools. The results
of students in Years 7 and 9 was more variable, but is consistent with State and National
averages.
80
82
84
86
88
90
92
94
96
98
Reading Writing Spelling G & P Numeracy Mean
Year 7 - NAPLAN - 2014 - % at or above NMS
PoP Qld Aust
78
80
82
84
86
88
90
92
94
96
98
100
Reading Writing Spelling G & P Numeracy Mean
Year 9 - NAPLAN - 2014 - % at or above NMS
PoP
Qld
Aust

2014 NAPLAN RESULTS 5
Section 2 A comparison of student achievement using
Mean Scale Scores
The results below compare the average results of Prince of Peace Lutheran College students
with those of students in Queensland and in Australia.
370
380
390
400
410
420
430
440
450
460
Reading Writing Spelling G & P Numeracy Mean
Year 3 - NAPLAN - 2014 - Mean Scale Scores
PoP Qld Aust
450
460
470
480
490
500
510
520
530
540
Reading Writing Spelling G & P Numeracy Mean
Year 5 - NAPLAN - 2014 - Mean Scale Scores
PoP Qld Aust

2014 NAPLAN RESULTS 6
Section 2 (Cont) Student Achievement using Mean Scale Scores
Key Conclusions:
Our student in Years 3, 5 and 7 are achieving visibly higher results on average than Year 3, 5
and 7 students in both Queensland and Australian schools, in each of the five categories tested.
Our Year 9 students are, on average, achieving results consistent with the national average.
490
500
510
520
530
540
550
560
570
Reading Writing Spelling G & P Numeracy Mean
Year 7 - NAPLAN - 2014 - Mean Scale Scores
PoP Qld Aust
530
540
550
560
570
580
590
600
610
Reading Writing Spelling G & P Numeracy Mean
Year 9 - NAPLAN - 2014 - Mean Scale Scores
PoP Qld Aust
2014 NAPLAN RESULTS 7
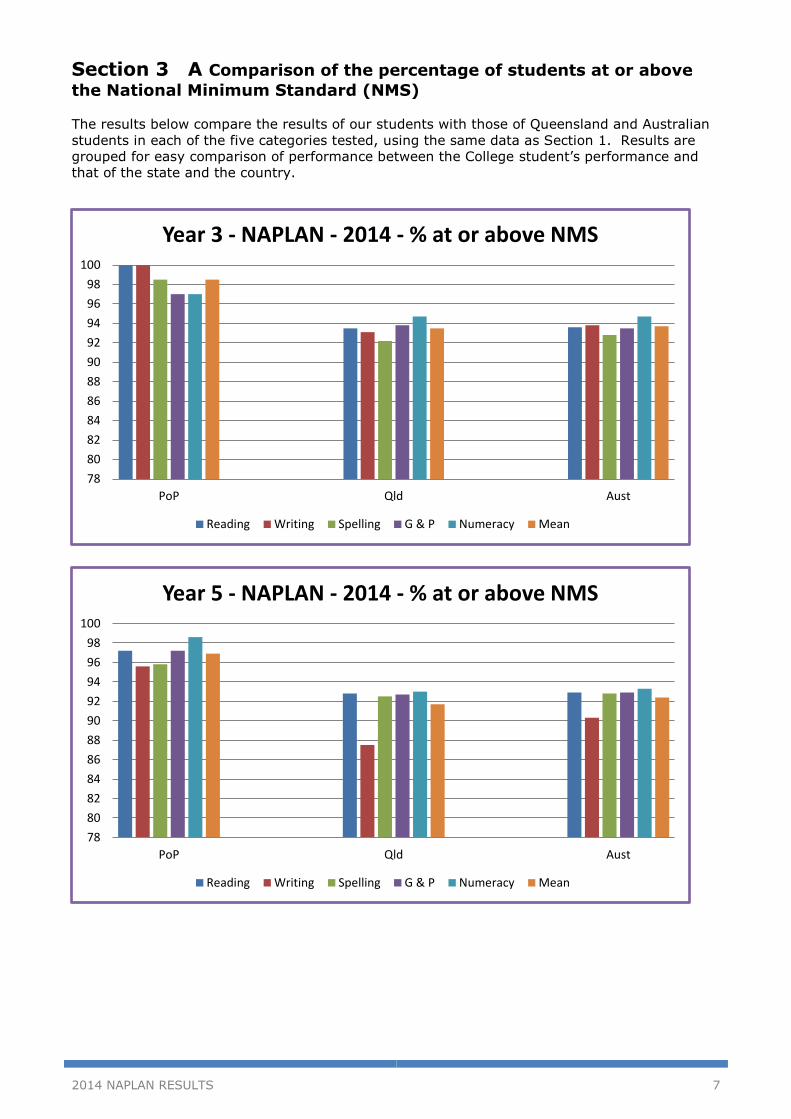
Section 3 A Comparison of the percentage of students at or above
the National Minimum Standard (NMS)
The results below compare the results of our students with those of Queensland and Australian
students in each of the five categories tested, using the same data as Section 1. Results are
grouped for easy comparison of performance between the College student’s performance and
that of the state and the country.
78
80
82
84
86
88
90
92
94
96
98
100
PoP Qld Aust
Year 3 - NAPLAN - 2014 - % at or above NMS
Reading Writing Spelling G & P Numeracy Mean
78
80
82
84
86
88
90
92
94
96
98
100
PoP Qld Aust
Year 5 - NAPLAN - 2014 - % at or above NMS
Reading Writing Spelling G & P Numeracy Mean

2014 NAPLAN RESULTS 8
Section 3 A Comparison of the percentage of students at or above the National Minimum Standard (NMS)
78
80
82
84
86
88
90
92
94
96
98
100
PoP Qld Aust
Year 7 - NAPLAN - 2014 - % at or above NMS
Reading Writing Spelling G & P Numeracy Mean
78
80
82
84
86
88
90
92
94
96
98
100
PoP Qld Aust
Year 9 - NAPLAN - 2014 - % at or above NMS
Reading Writing Spelling G & P Numeracy Mean

2014 NAPLAN RESULTS 9
Section 4 Comparisons of Mean Scale Scores
The results below compare the results of our students with those of Queensland and Australian
students in each of the five categories tested, using the same data as Section 2. Results are
grouped for easy comparison of performance between the College student’s performance and
that of the state and the country.
370
380
390
400
410
420
430
440
450
PoP Qld Aust
Year 3 - NAPLAN - 2014 - Mean Scale Scores
Reading Writing Spelling G & P Numeracy Mean
450
460
470
480
490
500
510
520
530
PoP Qld Aust
Year 5 - NAPLAN - 2014 - Mean Scale Scores
Reading Writing Spelling G & P Numeracy Mean

2014 NAPLAN RESULTS 10
Section 4 (Cont) Comparisons of Mean Scale Scores
490
500
510
520
530
540
550
560
570
PoP Qld Aust
Year 7 - NAPLAN - 2014 - Mean Scale Scores
Reading Writing Spelling G & P Numeracy Mean
530
540
550
560
570
580
590
600
610
PoP Qld Aust
Year 9 - NAPLAN - 2014 - Mean Scale Scores
Reading Writing Spelling G & P Numeracy Mean

2014 NAPLAN RESULTS 11
Section 5 Comparison of the average result for each category The table below shows the comparative results for the percentage of students at or
above the National Benchmark (the NMS – National Mean Score)
The table below shows the comparative results for the average scores for each group,
based on results from each of the five testing areas for each student ie. the average of the combined score per student for each group
Year 3 Year 5 Year 7 Year 9
POP 98.5 96.9 92.3 88.6
Qld 93.5 91.7 91.9 88.6
Aust 93.7 92.4 92.7 89.4
7880828486889092949698
100
NAPLAN - 2014 - Average of '% at or above NMS'
POP Qld Aust
Year 3 Year 5 Year 7 Year 9
PoP 429 503.2 546 574.4
Qld 402.9 484.7 533.6 567.6
Aust 412.1 491.6 538.5 574.7
350
400
450
500
550
600
NAPLAN - 2014 - Average of 'Mean Scale Scores
PoP Qld Aust
2014 NAPLAN RESULTS 12
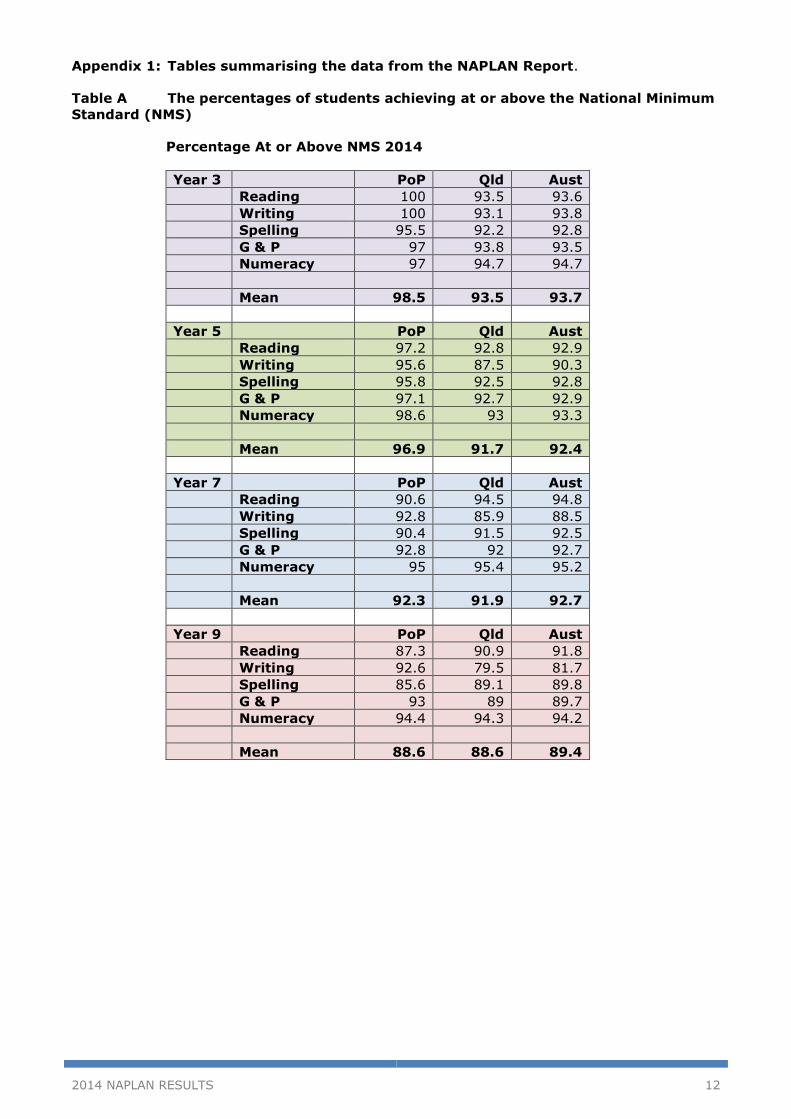
Appendix 1: Tables summarising the data from the NAPLAN Report.
Table A The percentages of students achieving at or above the National Minimum
Standard (NMS)
Percentage At or Above NMS 2014
Year 3 PoP Qld Aust
Reading 100 93.5 93.6
Writing 100 93.1 93.8
Spelling 95.5 92.2 92.8
G & P 97 93.8 93.5
Numeracy 97 94.7 94.7
Mean 98.5 93.5 93.7
Year 5 PoP Qld Aust
Reading 97.2 92.8 92.9
Writing 95.6 87.5 90.3
Spelling 95.8 92.5 92.8
G & P 97.1 92.7 92.9
Numeracy 98.6 93 93.3
Mean 96.9 91.7 92.4
Year 7 PoP Qld Aust
Reading 90.6 94.5 94.8
Writing 92.8 85.9 88.5
Spelling 90.4 91.5 92.5
G & P 92.8 92 92.7
Numeracy 95 95.4 95.2
Mean 92.3 91.9 92.7
Year 9 PoP Qld Aust
Reading 87.3 90.9 91.8
Writing 92.6 79.5 81.7
Spelling 85.6 89.1 89.8
G & P 93 89 89.7
Numeracy 94.4 94.3 94.2
Mean 88.6 88.6 89.4

2014 NAPLAN RESULTS 13
Table B Mean Scale Scores 2014
Year 3 PoP Qld Aust
Reading 453 409.7 418.6
Writing 426 390.1 402.1
Spelling 405 400.3 411.9
G & P 436 421.2 426.2
Numeracy 425 393.3 401.8
Mean 429 402.9 412.1
Year 5 PoP Qld Aust
Reading 526 495.9 500.7
Writing 473 457.2 468.2
Spelling 491 489 497.7
G & P 526 499.9 504.1
Numeracy 500 481.4 487.2
Mean 503.2 484.7 491.6
Year 7 PoP Qld Aust
Reading 563 541.6 545.8
Writing 538 505.2 511.5
Spelling 543 536.8 545.3
G & P 575 540.7 543.9
Numeracy 554 543.5 545.9
Mean 546 533.6 538.5
Year 9 PoP Qld Aust
Reading 593 571.4 580.2
Writing 550 543.6 550.1
Spelling 570 575.1 581.7
G & P 576 567.8 573.5
Numeracy 583 580.3 587.8
Mean 574.4 567.6 574.7

Page 14
Appendix 2: The distribution of results within achievement bands
The following tables show the school’s results for each year level in each of the five domains
tested. It shows the percentage of Prince of Peace students achieving in each band, as well as the
percentage of students in Queensland schools achieving in each band.
% Distribution of Achievement Bands: 2014 Year 3
Reading Writing Spelling Gram & Punct Numeracy
Band School State School State School State School State School State
6 or above 34.3 20.9 9.1 8.7 14.9 16.3 34.3 25.3 25.4 11.4
5 34.3 21.0 43.9 23.0 25.4 22.2 26.9 22.2 29.9 20.4
4 16.4 23.6 30.3 30.5 26.9 24.4 17.9 22.3 22.4 27.9
3 10.5 17.9 16.7 22.0 14.9 18.0 13.4 15.5 11.9 23.0
2 4.5 10.1 0.0 9.0 16.4 11.3 4.5 8.5 7.5 11.8
1 0.0 5.0 0.0 5.3 1.5 3.0 1.7 3.0 3.0 3.9
Exempt 0.0 1.5 0.0 1.6 0.0 1.5 0.0 1.5 0.0 1.4
N.B. The shaded band represents the National minimum standard for Year 3
% Distribution of Achievement Bands: 2014 Year 5
Reading Writing Spelling Gram & Punct Numeracy
Band School State School State School State School State School State
8 or above 19.4 12.9 2.9 2.9 4.2 8.5 21.1 15.0 9.7 6.6
7 19.4 19.4 10.1 10.1 22.5 19.7 31.0 19.8 18.1 16.1
6 33.3 26.0 31.9 26.1 39.4 28.7 26.8 25.2 40.3 28.4
5 22.2 22.2 37.7 31.2 19.7 23.1 12.7 20.7 19.4 27.5
4 2.8 12.2 13.0 17.2 9.9 12.4 5.6 11.9 11.1 14.6
3 2.8 5.6 4.4 10.8 4.2 5.9 2.8 5.7 1.4 5.4
Exempt 0.0 1.6 0.0 1.7 0.0 1.6 0.0 1.6 0.0 1.6
N.B. The shaded band represents the National minimum standard for Year 5
% Distribution of Achievement Bands: 2014 Year 7
Reading Writing Spelling Gram & Punct Numeracy
Band School State School State School State School State School State
9 or above 18.6 8.6 4.8 3.9 11.9 7.6 31.0 11.0 12.5 10.1
8 11.6 17.5 23.8 10.2 21.4 18.6 9.5 17.5 15.0 17.0
7 34.9 28.8 28.6 21.7 23.8 28.2 23.8 25.2 37.5 27.3
6 18.6 26.2 23.8 29.3 21.4 23.9 14.3 24.0 17.5 26.7
5 7.0 13.4 11.9 20.8 11.9 13.3 14.3 14.2 12.5 14.3
4 or below 4.7 3.6 2.4 12.1 4.8 6.6 2.4 6.1 0.0 2.7
Exempt 4.7 1.9 4.8 2.0 4.8 1.9 4.8 1.9 5.0 1.9
N.B. The shaded band represents the National minimum standard for Year 7
% Distribution of Achievement Bands: 2014 Year 9
Reading Writing Spelling Gram & Punct Numeracy
Band School State School State School State School State School State
10 4.2 4.0 2.9 3.7 5.6 5.4 2.8 4.6 4.2 5.8
9 26.8 12.9 10.1 9.0 9.9 14.4 15.5 12.2 11.3 13.7
8 28.2 25.6 31.9 18.7 32.4 26.7 23.9 23.9 31.0 26.2
7 18.3 29.8 18.8 25.3 25.4 27.1 29.6 28.4 33.8 30.9
6 9.9 18.8 18.8 22.7 12.7 15.5 21.1 20.0 14.1 17.8
5 or below 9.9 7.3 14.5 18.7 11.3 9.1 4.2 9.2 2.8 4.0
Exempt 2.8 1.8 2.9 1.8 2.8 1.8 2.8 1.8 2.8 1.7
N.B. The shaded band represents the National minimum standard for Year 9