Module 1.7: Point Loading of a 3D Cantilever Beam Table of ...
19
UCONN ANSYS –Module 1.7 Page 1 Module 1.7: Point Loading of a 3D Cantilever Beam Table of Contents Page Number Problem Description 2 Theory 2 Geometry 4 Preprocessor 6 Element Type 6 Material Properties 7 Meshing 8 Loads 9 Solution 15 General Postprocessor 15 Results 18 Validation 19
Transcript of Module 1.7: Point Loading of a 3D Cantilever Beam Table of ...

UCONN ANSYS –Module 1.7 Page 1
Module 1.7: Point Loading of a 3D Cantilever Beam
Table of Contents Page Number
Problem Description 2
Theory 2
Geometry 4
Preprocessor 6
Element Type 6
Material Properties 7
Meshing 8
Loads 9
Solution 15
General Postprocessor 15
Results 18
Validation 19

UCONN ANSYS –Module 1.7 Page 2
Problem Description:
Nomenclature:
L =110m Length of beam
b =10m Cross Section Base
h =1 m Cross Section Height
P=1000N Point Load
E=70GPa Young’s Modulus of Aluminum at Room Temperature
=0.33 Poisson’s Ratio of Aluminum
This is a simple, single load step, structural analysis of a cantilever beam. The left side of the
cantilever beam is fixed while on the end of the right side, there is a point load of 1000N. The
objective of this problem is to demonstrate a typical ANSYS APDL procedure with a
familiarized problem, finding Von Mises’ stresses and total deflection throughout the beam.
Theory uses Beam Theory to validate our answer. Beam theory is not an exact answer for 3D
structures; it is an approximation of the answer.
Theory
Von Mises Stress
Assuming plane stress, the Von Mises Equivalent Stress can be expressed as:
(1.7.1)
During our analysis, we will be analyzing the set of nodes through the top center of the cross
section of the beam:
Due to symmetric loading about the yz cross sections, analyzing the nodes through the top center
will give us deflections that approximate beam theory. Additionally, since the nodes of choice
are located at the top surface of the beam, the shear stress at this location is zero.
( . (1.7.2)
Using these simplifications, the Von Mises Equivelent Stress from equation 1 reduces to:
(1.7.3)
. . . . . (.) . . . . .
. . . . . . . . . . .
. . . . . . . . . . .
y
z

UCONN ANSYS –Module 1.7 Page 3
Bending Stress is given by:
(1.7.4)
Where
and
.
From statics, we can derive:
(1.7.5)
Plugging into equation 1.7.4, we get:
= 66kPa (1.7.6)
Beam Deflection
(1.7.7)
Plugging in equation 1.7.5, we get:
(1.7.8)
Integrating once to get an angular displacement, we get:
(1.7.9)
At the fixed end (x=0),
, thus 0
(1.7.10)
Integrating again to get deflection:
(1.7.11)
At the fixed end.y(0)= 0 thus , so deflection ( is:
(
)
(1.7.12)
The maximum displacement occurs at the point load( x=L)
(1.7.13)
WARNING: In three dimensional cantilever beams, beam theory is just an approximated answer,
it is NOT exact.

UCONN ANSYS –Module 1.7 Page 4
Geometry
Opening ANSYS Mechanical APDL
1. On your Windows 7 Desktop click the Start button
2. Under Search Programs and Files type “ANSYS”
3. Click on Mechanical APDL (ANSYS) to start
ANSYS. This step may take time.
Preferences
1. Go to Main Menu -> Preferences
2. Check the box that says Structural
3. Click OK
1
2
3
1
2
3

UCONN ANSYS –Module 1.7 Page 5
Title and Triad:
To add a title
1. Utility Menu -> ANSYS Toolbar -> type /prep7 -> enter
2. Utility Menu -> ANSYS Toolbar -> type /Title, “ Title Name” -> enter
The Triad in the top left will block images along the way.
To get rid of the triad, type
/triad,off in Utility Menu -> Command Prompt
Beam:
1. Go to ANSYS Main Menu -> Preprocessor -> Modeling -> Create -> Volumes ->
Block -> By Dimensions. This will open a new window, Create Block by Dimensions,
where the Geometry will be created.
2. In Create Block by Dimensions ->X1,X2 X-coordinates ->input 0 -> tab 2 input 10
3. In Create Block by Dimensions ->Y1,Y2 Y-coordinates ->input 0 -> tab 2 input 1
4. In Create Block by Dimensions ->Z1,Z2 Z-coordinates ->input 0 -> tab 2 input 110
5. Then hit Ok to create the 3-Dimensional Cantilever Beam
2
2
3 4
5

UCONN ANSYS –Module 1.7 Page 6
This will generate a cantilever beam as shown:
SAVE_DB
Since we have made considerable progress thus far, we will create a temporary save file for our
model. This temporary save will allow us to return to this stage of the tutorial if an error is made.
1. Go to Utility Menu -> ANSYS Toolbar ->SAVE_DB This creates a save checkpoint
2. If you ever wish to return to this checkpoint in your model generation, go to Utility
Menu -> RESUM_DB
Preprocessor
Element Type
1. Go to Main Menu -> Preprocessor -> Element Type -> Add/Edit/Delete
2. Click Add
3. Click Solid -> 8node 185
4. Click OK
5. Click Close
*For more information Solid185 click Help
1. Go to ANSYS 12.1 Help ->Search Keyword Search ->type ‘Solid185’ and press Enter
2. Go to Search Options ->SHELL185
WARNING: It is VERY HARD to delete or modify inputs and commands to your model once they
have been entered. Thus it is recommended you use the SAVE_DB and RESUM_DB functions
frequently to create checkpoints in your work. If salvaging your project is hopeless, going to Utility
Menu -> File -> Clear & Start New -> Do not read file ->OK is recommended. This will start your
model from scratch.
2
3
5
4
*
UCONN ANSYS –Module 1.7 Page 7
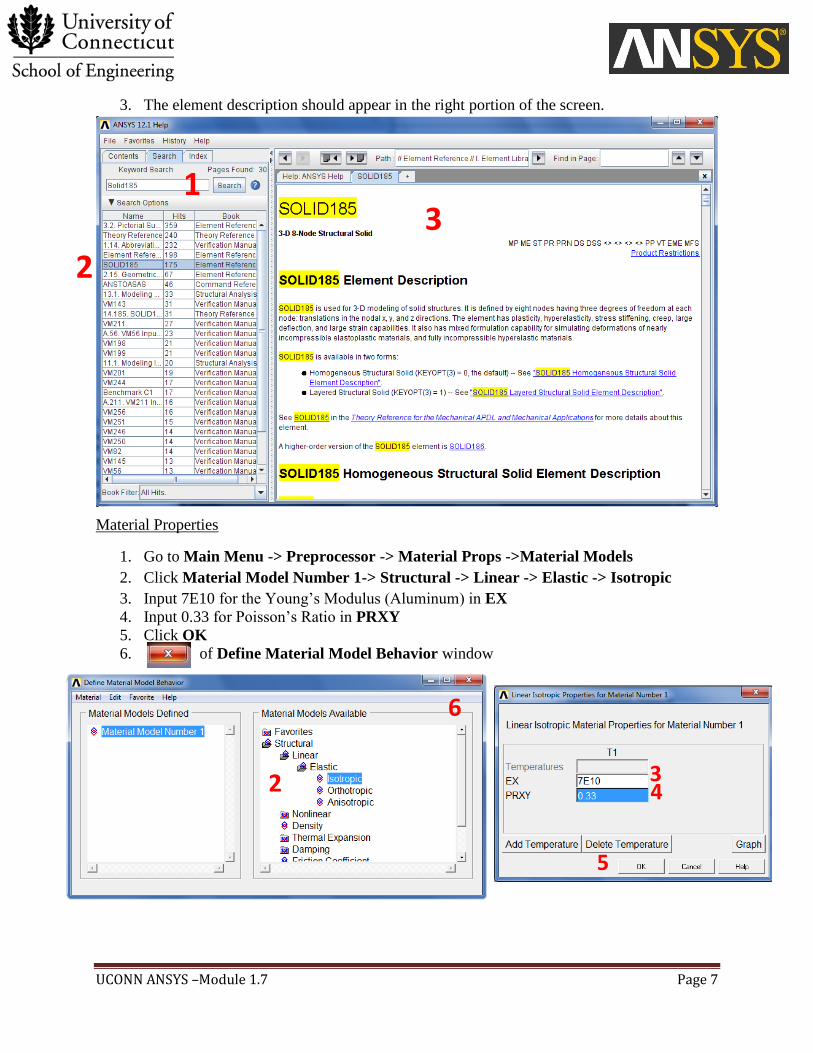
3. The element description should appear in the right portion of the screen.
Material Properties
1. Go to Main Menu -> Preprocessor -> Material Props ->Material Models
2. Click Material Model Number 1-> Structural -> Linear -> Elastic -> Isotropic
3. Input 7E10 for the Young’s Modulus (Aluminum) in EX
4. Input 0.33 for Poisson’s Ratio in PRXY
5. Click OK
6. of Define Material Model Behavior window
3 4
5
1
2
3
2
6

UCONN ANSYS –Module 1.7 Page 8
Meshing
1. Go to Main Menu -> Preprocessor -> Meshing ->
Mesh Tool
2. Go to Size Controls: -> Global -> Set
3. Under SIZE Element edge length put 0.5.
The SIZE Element edge length puts 1 element
every distance you enter. This will do 2 elements
every 1 meter.
4. Click OK
5. Click Mesh
6. Click Pick All
After meshing, pick the Front View . Your beam should look like the image below:
2
3
4
5
6
UCONN ANSYS –Module 1.7 Page 9
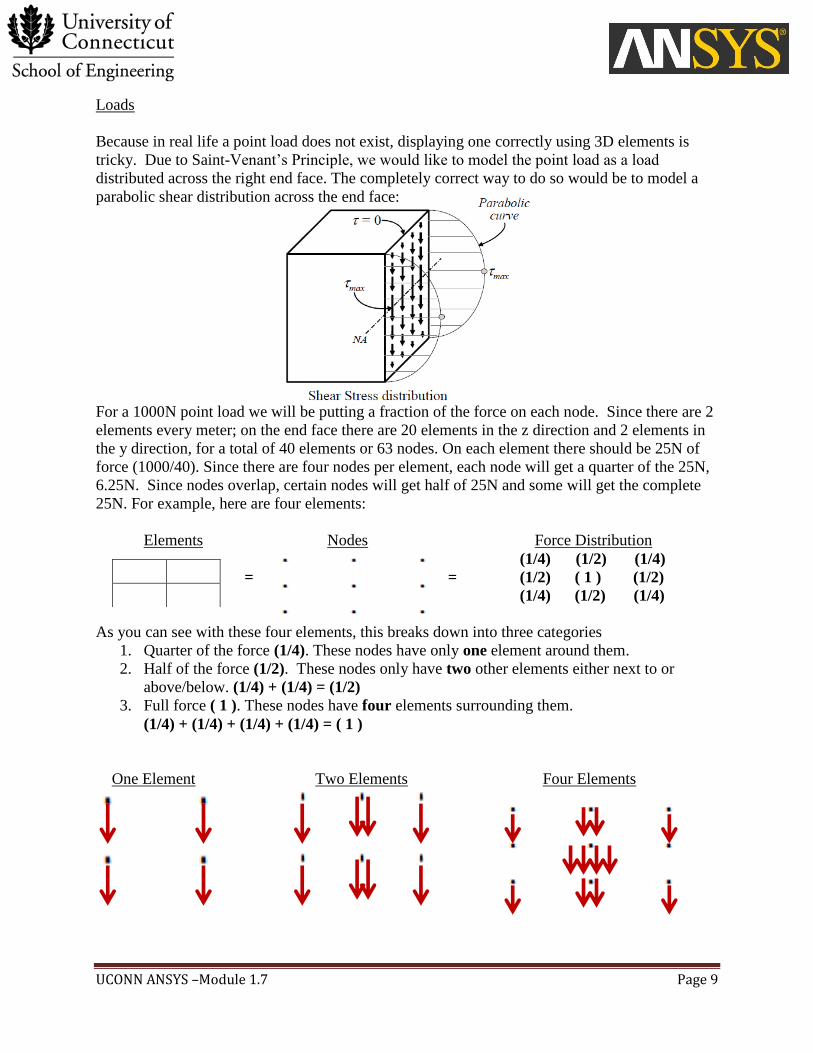
Loads
Because in real life a point load does not exist, displaying one correctly using 3D elements is
tricky. Due to Saint-Venant’s Principle, we would like to model the point load as a load
distributed across the right end face. The completely correct way to do so would be to model a
parabolic shear distribution across the end face:
For a 1000N point load we will be putting a fraction of the force on each node. Since there are 2
elements every meter; on the end face there are 20 elements in the z direction and 2 elements in
the y direction, for a total of 40 elements or 63 nodes. On each element there should be 25N of
force (1000/40). Since there are four nodes per element, each node will get a quarter of the 25N,
6.25N. Since nodes overlap, certain nodes will get half of 25N and some will get the complete
25N. For example, here are four elements:
Elements Nodes Force Distribution
. . . (1/4) (1/2) (1/4)
= . . . = (1/2) ( 1 ) (1/2)
. . . (1/4) (1/2) (1/4)
As you can see with these four elements, this breaks down into three categories
1. Quarter of the force (1/4). These nodes have only one element around them.
2. Half of the force (1/2). These nodes only have two other elements either next to or
above/below. (1/4) + (1/4) = (1/2)
3. Full force ( 1 ). These nodes have four elements surrounding them.
(1/4) + (1/4) + (1/4) + (1/4) = ( 1 )
One Element Two Elements Four Elements

UCONN ANSYS –Module 1.7 Page 10
Six Elements
Point Load
1. Go to Utility Menu -> Plot -> Nodes
2. Go to Utility Menu -> Plot Controls -> Numbering…
3. Check NODE Node Numbers to ON
4. Click OK
5. Click the Left View to orient the
cantilever beam horizontally down the z-axis
6. Shift the beam the left to view the far nodes more
closely by pressing the Pan Model Left button
then zoom in on the far right nodes using the
Zoom in button or scrolling with the mouse
7. Use the Dynamic Model Mode and right clicking and dragging diagnally down
slightly
3
4

UCONN ANSYS –Module 1.7 Page 11
The resulting graphic should be as shown:
This is one of the main advantages of ANSYS Mechanical APDL vs ANSYS Workbench in that we
can visually extract the node numbering scheme.
Quarter Load
1. Go to Main Menu -> Preprocessor ->Loads ->Define Loads ->
Apply ->Structural -> Force/Moment -> On Nodes
2. Click Pick -> Single
3. Click List of Items and input 85,87,65,64
This will select the four corner nodes of the cross sectional area
4. Click Ok
5. Under Lab Direction of Force/mom select FY
6. Under Value Force/moment value type -25/4
7. Press OK
Force arrows will now appear on the selected nodes
5
6 7
4
3
2

UCONN ANSYS –Module 1.7 Page 12
Half Load
1. Go to Main Menu -> Preprocessor ->Loads ->
Define Loads ->Apply ->Structural -> Force/Moment ->
On Nodes
2. Click Pick -> Single
3. Click Min, Max, Inc and input 88,106,1
This will select the nodes from 88 to 106 using an increment
of 1 on the top row of the cross section.
4. Click Ok
5. Under Lab Direction of Force/mom select FY
6. Under Value Force/moment value type -25/2
7. Press Apply
8. Repeat Steps 2-7 and input: 66,84,1
This will select the nodes from 66 to 84 using an increment of 1
on bottom row of the cross section.
9. Now click List of Items and input 107,86
This selects nodes 86 and 107, the beginning and end nodes of
the middle row of the cross section.
10. Click Ok
11. Under Lab Direction of Force/mom select FY
12. Under Value Force/moment value type -25/2
13. Press Ok
Additional force arrows will now appear on the selected nodes.
2
3
4
5
6
7 13
USEFUL TIP: If you wish to assign new force values, pick the nodes of
interest and replace that component of force with 0 before assigning new
values. This will delete the previous force assignment.

UCONN ANSYS –Module 1.7 Page 13
Full Load
1. Go to Main Menu -> Preprocessor ->Loads ->Define Loads ->Apply ->Structural ->
Force/Moment -> On Nodes
2. Click Pick -> Single
3. Click Min, Max, Inc and input 108,126,1
This will select the nodes from 108 to 126 using an increment of 1
selecting the middle nodes of the middle row, excluding the initial and
end nodes.
4. Click Ok
5. Under Lab Direction of Force/mom select FY
6. Under Value Force/moment value type -25
7. Press Ok
To view the cross section go to Utility Menu -> Plot Controls -> Numbering…-> Check
NODE Node Numbers to Off -> Click OK then click Front View and zoom out if needed.
The resulting graphic should be as shown:
As you can see ANSYS takes into account larger and smaller forces, expressed by arrow size.
If end face does not resemble this graph:
1. Go to Main Menu -> Preprocessor ->Loads ->Define Loads ->Apply ->Structural ->
Force/Moment ->On Nodes
2. Click Pick All
3. Under Lab Direction of Force/mom select FY , Under Value Force/moment value type 0
4. Press Ok
5. Redo the steps above. Check correct number orientation is used.
2
3
4
5
6
7

UCONN ANSYS –Module 1.7 Page 14
Displacement (Fixed End)
1. Click the Left View to see along the z-axis
2. Go to Main Menu -> Preprocessor -> Loads ->
Define Loads ->Apply ->Structural -> Displacement -> On Nodes
3. Click Pick -> Box
4. With your cursor, drag a box around the first set of nodes on the
far left side of the beam:
5. Click OK
6. Click All DOF to secure all degrees of freedom
7. Under Value Displacement value put 0. The left face is now a fixed end.
8. Click OK
5
4
6
7
8
WARNING: Selecting the wrong/wrong amount of nodes will result in a wrong answer; make
sure the only nodes selected are only the end set as shown.
3
UCONN ANSYS –Module 1.7 Page 15
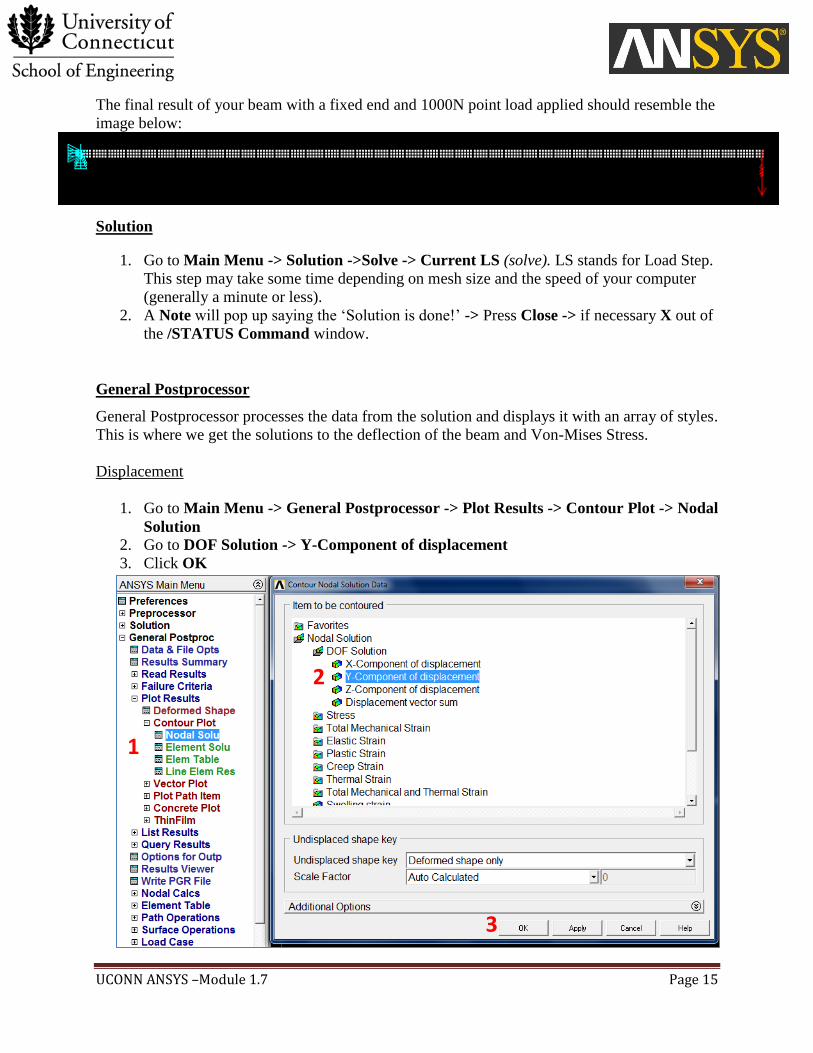
The final result of your beam with a fixed end and 1000N point load applied should resemble the
image below:
Solution
1. Go to Main Menu -> Solution ->Solve -> Current LS (solve). LS stands for Load Step.
This step may take some time depending on mesh size and the speed of your computer
(generally a minute or less).
2. A Note will pop up saying the ‘Solution is done!’ -> Press Close -> if necessary X out of
the /STATUS Command window.
General Postprocessor
General Postprocessor processes the data from the solution and displays it with an array of styles.
This is where we get the solutions to the deflection of the beam and Von-Mises Stress.
Displacement
1. Go to Main Menu -> General Postprocessor -> Plot Results -> Contour Plot -> Nodal
Solution 2. Go to DOF Solution -> Y-Component of displacement
3. Click OK
2
3
1

UCONN ANSYS –Module 1.7 Page 16
Let’s change some plotting options and enhance the aesthetics.
4. Go to Utility Menu -> PlotCtrls -> Style ->
Contours -> Uniform Contours…
5. Under NCOUNT enter 9
6. Under Contour Intervals click
User Specified
7. Under VMIN enter -0.0075
The beam deflects in the –Y direction so
The max deflection is treated as a minimum
8. Under VMAX enter 0
9. Since we will be using 9 contour
intervals, we will enter 0.0075/9 for VINC
10. Click OK
11. Utility Menu -> ANSYS Toolbar -> type /Title, 3D Cantilever Beam Deflection -> enter
Resulting Answer:
Maximum Deflection= 0.007443 m
5
6
9
10
7 8

UCONN ANSYS –Module 1.7 Page 17
Equivalent (Von-Mises) Stress
1. Go to Main Menu -> General Postprocessor -> Plot Results -> Contour Plot ->
Nodal Solution-> Stress -> von Mises stress
2. Click OK
3. To get rid of the previous Plot Settings, go to PlotCtrls -> Reset Plot Ctrls…
4. Go to Utility Menu -> Plot -> Replot
Aesthetics
5. Click the Isometric View to see a better view of your cantilever beam.
6. Utility Menu -> ANSYS Toolbar -> type /Title, 3D Cantilever Beam Von Mises
Stress -> enter
7. Go to Utility Menu -> PlotCtrls -> Style -> Contours -> Uniform Contours…
8. Under NCOUNT enter 9
9. Under Contour Intervals click User Specified
10. Under VMIN enter 0
11. Under VMAX enter 61000
12. Under VINC enter 61000/9
13. Click Ok
Resulting Answer:
Maximum Stress= 60446 Pa

UCONN ANSYS –Module 1.7 Page 18
Results
Max Deflection Error
The percent error (%E) in our model max deflection can be defined as:
(
) = 2.19% (1.7.14)
This is a good error baseline considering mesh size used. There is an assumed deviation in the
ANSYS results from the theoretical answers due to Beam Theory. Beam Theory is a derived
equation solely for one dimensional cases. When an extra degree is added, this assumes a linear
displacement in that extra degree of movement. As mesh is increased, nonlinear lines approach
linearity. In the validation section, it is shown that with increased mesh size, these values
converge to a closer representation of the theoretical value.
Max Equivalent Stress Error
Using the same definition of error as before, we derive that our model has 8.41% error in the
max equivalent stress. The reason for the elevated stress level is singularity resulting from
Poisson’s effect at the fixed support. In the validation section, it is shown that with increased
mesh size, the analytical answers for Max Equivalent stress are closely represented in nodes
close to but not at the region where singularity occurs. The effect of singularity is also reduced
with the implementation of higher order elements.

UCONN ANSYS –Module 1.7 Page 19
Validation