MIS 4596 Capstone Presentation: PESTY Team Red Fox: Jack FarrowGregory KrolikowskiMentor: Niraj...
15
MIS 4596 Capstone Presentation: PESTY Team Red Fox: Jack Farrow Gregory Krolikowski Mentor: Niraj Patel Andy Lin Sean O’Neill
-
Upload
preston-peters -
Category
Documents
-
view
218 -
download
1
Transcript of MIS 4596 Capstone Presentation: PESTY Team Red Fox: Jack FarrowGregory KrolikowskiMentor: Niraj...

MIS 4596 Capstone Presentation: PESTY
Team Red Fox:
Jack Farrow Gregory Krolikowski Mentor: Niraj Patel
Andy Lin Sean O’Neill

What’s the Problem?

The Solution: Pesty
PESTY
Jack Dempsey Farrow
Orkin+Angie's List+Amazon+Uber

Why Pesty? Because the Other Guys…
.
Are Hard To Find
Are Too Slow
Don’t Sell to DIY-ers
Have Limited Reach

Pesty Solution Demonstration

Pesty User Persona: Amy Chen
Persona InformationName: Amy Chen Age: 40Gender: FOccupation: Stay-at-home momMarital status: MarriedChildren? 2 childrenCity/state of residence: Alpharetta, GAOwns/rents: OwnsNumber of years at current residence: 5Do-it-yourself skills: High"Ick-factor" scale (1 to 10): 4

Pesty Systems Architecture
Analytics
Mobile Platforms:AndroidiOSWindows 8.1+
PaaS Hosted Architecture:Database ServersSecure Application ServersWeb Servers
4G LTE /HTTP/HTTPS
Pesty: A THIN-CLIENT, WEB/MOBILE HYBRID Application

Revenue Model
PESTY REVEN
UE
Extermination Contract Commissio
ns
Customer Membershi
ps
Remote Diagnosis
FeesAmazon Affiliate
Revenues
YouTube Channel
Revenues

Execution Plan
Develop a Minimum Viable Product (MVP)
Roll Out MVP to Pest Control “Hot Spots”:• S
outhern, Western States & High-Bedbug Cities
Update Product Annually or Semi-Annually• C
oincides with Mobile OS Updates from Big Three

Thanks for Viewing!
Team Red Fox
Temple University, Spring 2015

Appendix

The Business Environment
Target Customer Groups• R
esidential customers
• Small Pest Control Operators (PCOs)
Competition• P
est applications
• Major PCOs
Industry Snapshot• 5
% annual growth
• Contracts linked to home sales
Desired Attributes• A
ccurate
• Quick
• Decision-making tool
Strategy: One-Stop Instant Solution
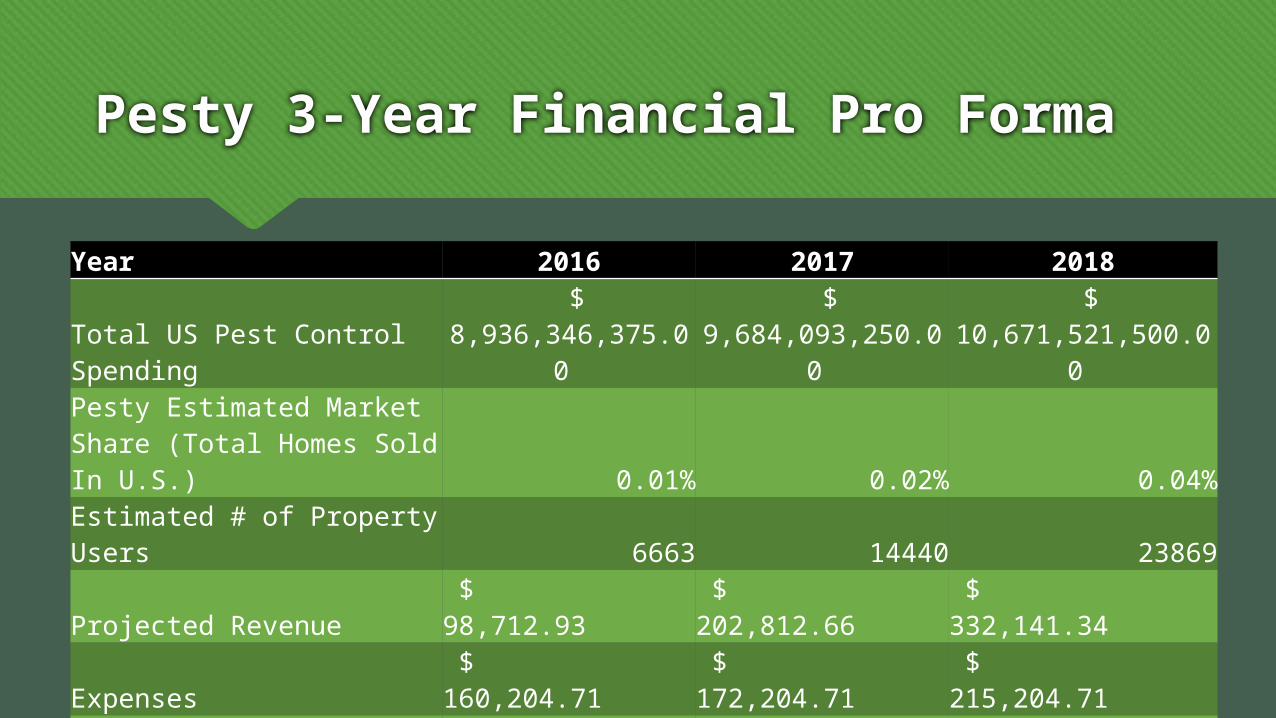
Pesty 3-Year Financial Pro Forma
Year 2016 2017 2018
Total US Pest Control Spending $ 8,936,346,375.00 $ 9,684,093,250.00 $ 10,671,521,500.00
Pesty Estimated Market Share (Total Homes Sold In U.S.) 0.01% 0.02% 0.04%Estimated # of Property Users 6663 14440 23869Projected Revenue $ 98,712.93 $ 202,812.66 $ 332,141.34 Expenses $ 160,204.71 $ 172,204.71 $ 215,204.71 EBIT $ (61,491.78) $ 30,607.96 $ 116,936.63 Taxes $ - $ 2,662.89 $ 10,173.49 TOTAL $ (61,491.78) $ 27,945.06 $ 106,763.15

Pesty Revenue and Cost Projections
..\cost_projections\pesty_cost_estimates_v1.7.xlsx

Data Model
..\ERD_diagrams\pesty_ERD_v1.2.pdf