

MEKH_Presentation_final
71
Overview of European residential markets A focus on the CEE countries Christophe Dromacque, VaasaETT Budapest, Hungary May 12 th 2014
-
Upload
christophe-dromacque -
Category
Documents
-
view
27 -
download
0
Transcript of MEKH_Presentation_final

Overview of European residential markets
A focus on the CEE countries
Christophe Dromacque, VaasaETT
Budapest, Hungary
May 12th 2014

Outline
• Introducing VaasaETT
• HEPI – Media and market professionals
• Household Energy Price Index developments
• Retail Vs. wholesale prices in European markets
• Overview of European electricity and gas prices
• Insights into energy affordability indicators
• Market competition indicators
• Relationship between energy prices and market competition
• Discussions

Best Practice, Data, Analysis &
Expertise from around the World
Customer Psychology & Behaviour
Customer Lifetime Value(Switching and Loyalty, Prices/Savings/Margins, Billing/CRM, Branding, New Offerings
Smart Energy Issues(smart grid, demand response, dynamic pricing, feedback, smart billing energy efficiency, smart home, distributed generation)
Our Key Focus

VaasaETT 4
‘DSM program database’
• About 140 residential and I&C pilot
programs
• Over 500 sample groups
• 630,000+ participants
• 75% organised after 2005
• Results measured: energy
conservation, peak clipping and
financial savings
Uncover the potential of residential
demand response through a mass
pilot comparison
http://esmig.eu/resource/empower-demand-report-phase-i

€4.5 EU funded project to provide best
practice for smart grid technology,
regulation and consumer engagement in
smart grid. Partners include ENEL,
Iberdrola, ENEL, EDF and others.
More info at: http://www.advancedfp7.eu/
Smart Energy Projects
A major European Union funded project for
the EU Director General of Energy to
develop a cross border balancing market
platform (Virtual Power Plant).
More info at: http://www.ebadge-fp7.eu/
Equal partners in €4.1m EU funded project
to build a platform for the realistic DR and
Energy Efficiency modeling of energy
market stakeholders and consumer
behaviour.
More info at: http://www.cassandra-fp7.eu/Energy efficiency trials - University of Coventry - UK
Energy efficiency and TOD trials – Residential
building - Sweden
Energy efficiency and TOD trials – Shopping
center - Milan, Italy

Smart Energy Research
• A project for the European Commission’s Information Society
and Media Directorate General.
• Measured the potential of the Smart Grid to lower Green House
Gas emissions around Europe.
• Analysis of the potential impact of residential, commercial and
industrial demand response, feedback and informative billing.
• The report is available at:
http://www.capgemini.com/sites/default/files/resource/pdf/Dema
nd_Response__a_decisive_breakthrough_for_Europe.pdf
• Partnered with Capgemini and Enerdata.
• Explored the current development of Demand Response
throughout the EU-15, to quantify its future potential, and to
identify the pre-requisites for the efficient fulfillment of its
potential by 2020.
• The report is available at: http://ec.europa.eu/digital-
agenda/en/news/methodologies-measure-potential-smart-grids-
green-house-gas-reductions

Smart Grid Global Impact ProjectAnnual Report and Global Road-show, Powered by VaasaETT
www.smartgridimpact.com

Market data and monitoring
Energy pricesHEPI
CompetitionUCSRP
Energy affordability

HEPI in figures
23 countries
500 million people
97% of the EU-28 population
200 subscribers to the monthly update
1,400 people downloaded the annual report
652 visits to the HEPI website over the past 30
days (UK, USA, Netherlands, Germany, Belgium)

HEPI in the media: BBC
BBC

HEPI in the media: FT

HEPI in the media: Platts power in
Europe

HEPI used for market monitoring: DG
ENER
COMMISSION STAFF WORKING DOCUMENT Energy prices and costs report

HEPI used for market monitoring:
ACER/CEER
Annual Report on the Results of Monitoring the Internal Electricity and Natural Gas Markets in 2011

Abstract from call for tender by DG
SANCO

Household Energy Price Index
developments

Evolution of residential energy and distribution
prices excluding taxes in the EU

Evolution of residential energy and distribution
prices excluding taxes in the EU

Evolution of residential energy and distribution
prices excluding taxes in the EU

Evolution of residential energy and distribution
prices excluding taxes in the EU

Evolution of residential energy and distribution
prices excluding taxes in the EU

Evolution of residential energy and distribution
prices excluding taxes in the EU

Evolution of residential energy and distribution
prices excluding taxes in the EU

Evolution of residential energy and distribution
prices excluding taxes in the EU
EU-15 (Jan 2009=100)
Electricity Gas
Latest 117 107
Highest 118 110
Lowest 96 81

Evolution of residential energy and distribution
prices excluding taxes in the EU
EU-15 (Jan 2009=100)
Electricity Gas
Latest 117 107
Highest 118 110
Lowest 96 81

Evolution of residential energy and distribution
prices excluding taxes in the EU-22

Evolution of residential energy and distribution
prices excluding taxes in the EU-22
EU-22 (Jul 2013=100)
Electricity Gas
Latest 103 100
Highest 103 101
Lowest 100 99

Retail Vs. wholesale prices in European
markets
Please note that the following information relate to State capital cities unless specified otherwise

Average monthly end-user electricity prices excluding taxes
in EU-15 countries vs. average monthly wholesale price on
key European power exchanges (2009-2013)

Two examples of the evolution end-user Vs. wholesale
prices – electricity
Sweden Austria

Average monthly end-user gas prices excluding
taxes in EU-15 countries vs. average monthly
wholesale price on key European exchanges
(2009-2013)

Two examples of the evolution end-user Vs. wholesale
prices - gas

Overview of European electricity prices
Please note that the following information relate to State capital cities unless specified otherwise

Residential end-user electricity price (includes all taxes)
Average

Residential end-user electricity price (includes all taxes)
Average

Residential end-user electricity price at PPS
Average

Residential end-user electricity price at PPS
Average

Residential electricity price evolution adjusted for inflation
(2013/2012)
Average

Residential end-user electricity price breakdown (H2 2013)

Residential end-user electricity price breakdown (H2 2013)

Residential end-user electricity price breakdown (H2 2013)

Overview of European gas prices
Please note that the following information relate to State capital cities unless specified otherwise

Residential end-user gas price (includes all taxes)
Average

Residential end-user gas price (includes all taxes)
Average

Residential end-user gas price at PPS
Average

Residential gas price evolution adjusted for
inflation (2013/2012)
Average

Residential end-user gas price breakdown (H2 2013)

Insights into energy affordability indicators
Please note that the following information relate to State capital cities unless specified otherwise
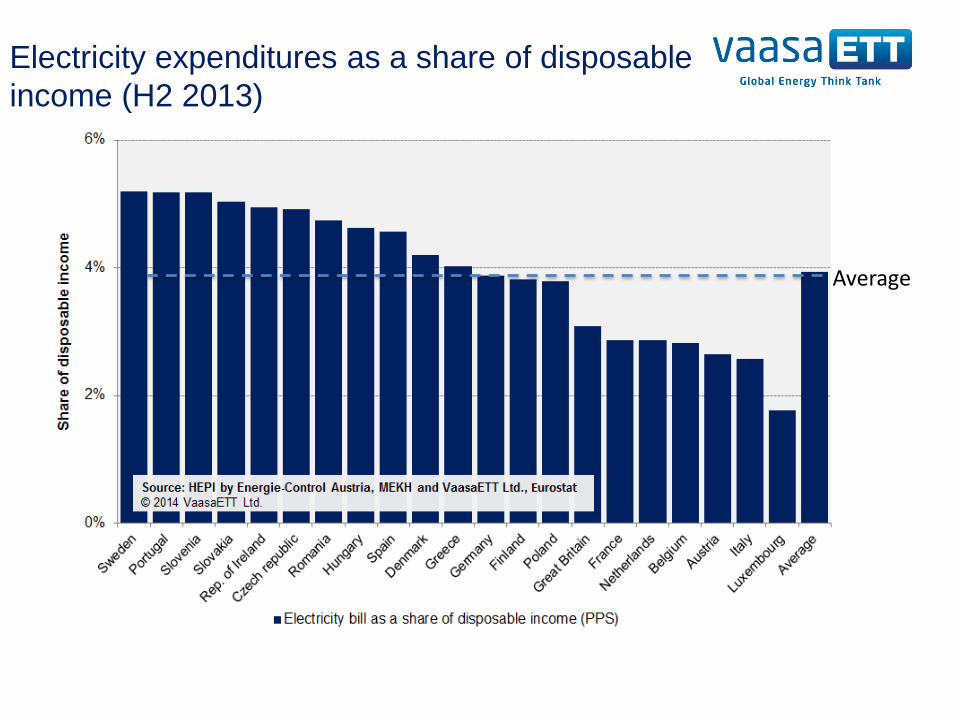
Electricity expenditures as a share of disposable
income (H2 2013)
Average

Electricity expenditures as a share of disposable
income (H2 2013)
Average

Gas expenditures as a share of disposable
income (H2 2013)
Average

Gas expenditures as a share of disposable
income (H2 2013)
Average

Market competition indicators


Electricity: Residential customer choice as of December 2013

Gas: Residential customer choice as of December 2013

Number of electricity suppliers

Number of gas suppliers

Relationship between energy prices and
market competition

Potential savings from switching electricity supplier (2013)

Potential savings from switching gas supplier (2013)

R²=0.2155

R²=0.1096

R² = 0.00001
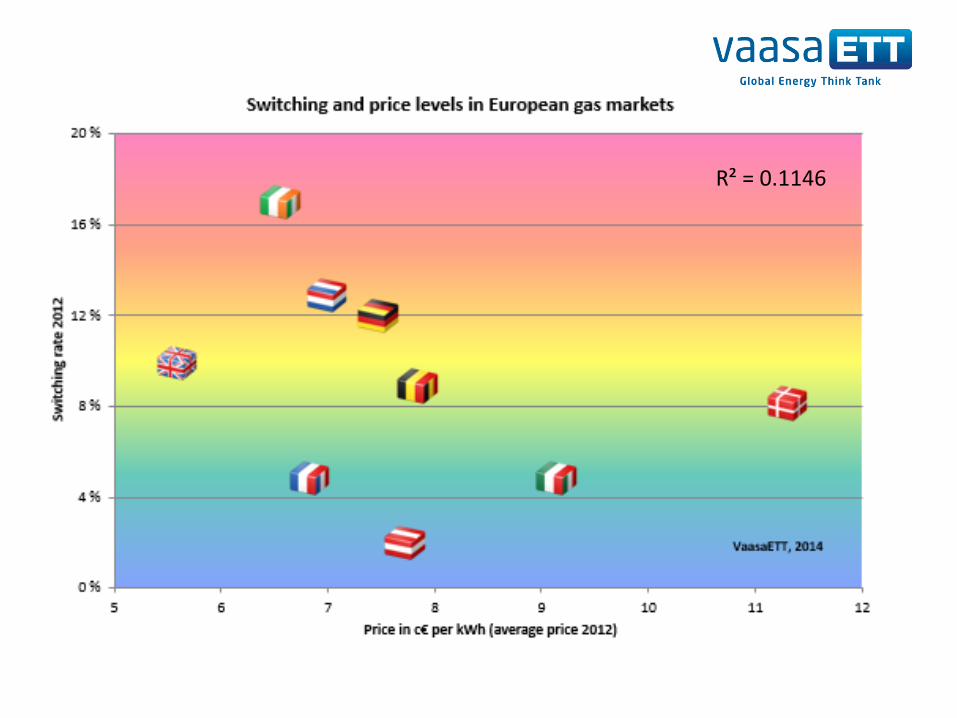
R² = 0.1146

Discussions
Next year?
SME prices?

Aims of HEPI
VaasaETT 69
Aims
• Reflect the prices typically paid by residential customers in Member States;
• Comparable prices for household energy consumption (both electricity and gas);
• In relatively short time intervals (monthly);
• Taking into account different national consumption patterns (typical consumption levels);
• Reflecting different emerging tariff schemes, such as fixed tariffs, variables tariffs, green tariffs offered by incumbents and competitors;
• Clearly separating out between the price for energy as a commodity, distribution and transmission charges, associated taxes and VAT.

Data characteristics
VaasaETT 70
Data characteristics
All prices and other statistics relate to:
• The first day of the month the data is collected;
• Customers in the State capital city area of the state considered;
• To ensure comparability, sign in and other temporary bonuses and other forms of non-monetary benefits are not taken into account since they can distort the overall tariff offered, especially in cases where they are offered on a “one-off” basis;
• Standing fees are added to the price per kWh so that the entire end-user cost is taken into account;
• Exchange rate = 3-month moving average
• 97% rule.

Step 1: Background market data
1 Typical residential customer consumption level
2Proportion of residential customers who have never changed contact (who are still on their by-default contract)
3Proportion of residential customers who have never changed supplier (who are still supplied by their local incumbent supplier)
4 Incumbent or historical supplier for state capital city
5 Main competitor to the incumbent or historical supplier for state capital city
VaasaETT 71
Current methodology


