
Market Research Report : Crm market in india 2015 - Sample
30
CRM Market – India July 2015
-
Upload
netscribes-inc -
Category
Services
-
view
53 -
download
0
Transcript of Market Research Report : Crm market in india 2015 - Sample

CRM Market – India
July 2015
2 CRM MARKET IN INDIA 2015.PPT
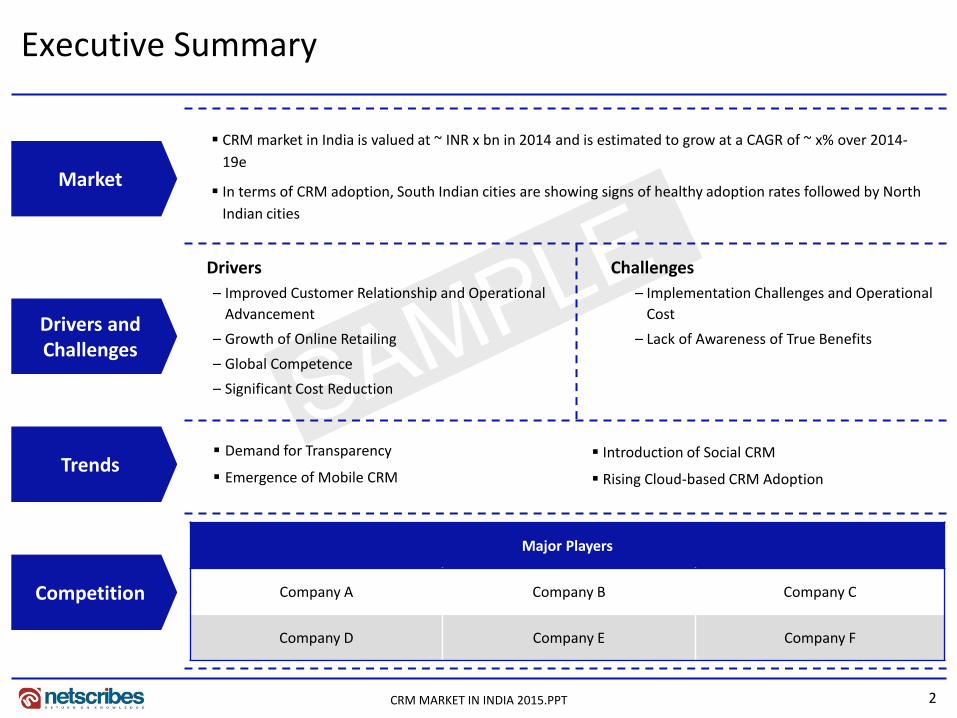
Executive Summary
Market
Drivers and Challenges
Trends
Competition
CRM market in India is valued at ~ INR x bn in 2014 and is estimated to grow at a CAGR of ~ x% over 2014-
19e
In terms of CRM adoption, South Indian cities are showing signs of healthy adoption rates followed by North
Indian cities
Demand for Transparency
Emergence of Mobile CRM
Drivers
– Improved Customer Relationship and Operational
Advancement
– Growth of Online Retailing
– Global Competence
– Significant Cost Reduction
Challenges
– Implementation Challenges and Operational
Cost
– Lack of Awareness of True Benefits
Major Players
Company A Company B Company C
Company D Company E Company F
Introduction of Social CRM
Rising Cloud-based CRM Adoption

3 CRM MARKET IN INDIA 2015.PPT
•Macroeconomic Indicators
•Introduction
•Market Overview
•Types, Modules and Features
•CRM Use in SMBs
•CRM Selection Criteria
•Drivers and Challenges
•Key Trends
•Scope of CRM in Key Sectors
•Competitive Landscape
•Strategic Recommendations
•Appendix

4 CRM MARKET IN INDIA 2015.PPT
SAMPLE Macroeconomic Indicators (3/3)
Lending Rate: Annual
x x x x x x x x x x x x %
Per Annum
2014-15 y4
x4
2013-14 y3
x3
2012-13 y2
x2
2011-12 y1
x1
Max Min
Trade Balance: Annual
Commercial Bank Rates: Key Lending Rates as Prescribed by RBI (All Commercial Banks including SBI) - Minimum Rate General
N.B.: 2012-13 encompasses figure for Apr – Nov 2012
FDI: Annual
D
C
B
A
INR
tn
2014-15
x4
2013-14
x3
2012-13
x2
2011-12
x1
D
C
B
A
INR bn
2013-14
y4
2012-13
y3
2011-12
y2
2010-11
y1

5 CRM MARKET IN INDIA 2015.PPT
SAMPLE CRM Adoption Process
X • X
X • X
X • X
X • X
X • X

6 CRM MARKET IN INDIA 2015.PPT
SAMPLE Over the years, CRM has evolved from point solution to 360 degree enterprise-wide initiative in India
CRM Market Overview - India
X
X
X
X
X
0
2018e
a5
2017e
a4
2016e
a3
2015e
a2
2014
a1
INR bn
X
2019e
a6
• XX
• XX
• XX
• XX
x
z
y
Others Salesforce Oracle
Top 2 players are holding
~a% share in the CRM market

7 CRM MARKET IN INDIA 2015.PPT
SAMPLE CRM Adoption Rate among Organization of all Size
• XX • XX • XX
Organization Type Service Industry Product Industry
X
X
X
X-X%
X-X%
X-X%
X-X%
X-X%
X-X%

8 CRM MARKET IN INDIA 2015.PPT
SAMPLE Increased awareness and interest level of base-level SMBs in technology clearly indicates India's technological progress
Business Challenge ICT Spending
X
X
X
X
X
X
X
X
X
X
0
bn
2018e
Y
2014e
X
Business Challenge ICT Spending
Breakup
X
X
X
X
X
X
X
X
X
X
0 X
X
X
2014e
100.0%
Software Licensing and SaaS
Hardware
IT Services
• XX
• XX
• XX
• XX
Spending on IT service (implementation,
support and training) and Software Licensing
and SaaS: XX%

9 CRM MARKET IN INDIA 2015.PPT
SAMPLE SMB CRM spending share in the overall SMB software spending
Business Challenge CRM Market India
Segmentation Business Challenge IT Software
Spending - SMBs
0 10 20 30 40 50 60 70 80 90
2014 XX X Y
bn
CRM spending Others
• XX
• XX
• XX
• XX
X
Y
Large Business Small and Medium Business
Note: Base figure = INR X bn

10 CRM MARKET IN INDIA 2015.PPT
SAMPLE
Large presence of SMBs in India proves to be highly beneficial for CRM vendors
• XX
XX
• XX
XX
CRM Implementation Benefits
Some potential benefits of CRM implementation
Benefits Description
X X
X X
X X
X X

11 CRM MARKET IN INDIA 2015.PPT
SAMPLE CRM Selection Criteria (X/X)
Deciding Factors
IT Manpower
• XX
Customizability and Integration with other Solutions
• XX
User Volume
• XX

12 CRM MARKET IN INDIA 2015.PPT
SAMPLE Enhancement of customer care operations is catalyzing CRM adoption
Improved Customer Relationship and Operational Advancement Impact
• XX
• XX
• XX
• XX
• XX
• X
• X
• X
• X
X
• X
• X
• X
• X
X

13 CRM MARKET IN INDIA 2015.PPT
SAMPLE CRM solutions are used by various highly reputed and respected companies around the globe
Global Competence Impact
• XX
Expansion
•X
Achieving Global Standard
•X
Operational Efficiency
•X

14 CRM MARKET IN INDIA 2015.PPT
SAMPLE …hinder its adoption in India
Implementation Challenges and Operational Cost (x/x)
Vendor Name Cost Structure* (Per month/user)
X X X X
X X X
X X
X X X X
X X X X
X X X X
Note: *Data as of August 2013, Other details have been taken from the website; May vary depending on the requirement SAP does not provide stand alone CRM generally, and it requires a minimum of 15 user subscription Sugra CRM: Price based on an annual subscription with a minimum of five users

15 CRM MARKET IN INDIA 2015.PPT
SAMPLE Social CRM offers open-ended interaction among employees and numerous consumers in the social networks
Introduction of Social CRM
Social CRM is gaining popularity
• X
• X
• X
Social CRM
X
X
X
X
X
X
Traditional CRM
Social CRM
Participant Process and Channel Time of Interaction
Social CRM
Traditional CRM
Social CRM
• X
• X
• X
• X

16 CRM MARKET IN INDIA 2015.PPT
SAMPLE Cloud Computing is catching up with the Software-as-a-Service (SaaS) CRM solution
Rising Cloud-based CRM Adoption (x/x)
Many companies are now implementing on demand CRM for better results
• X
• X
• X
Company A
• X
• X
• X
• X
Company B
• X
• X
• X
• X
Company C
17 CRM MARKET IN INDIA 2015.PPT
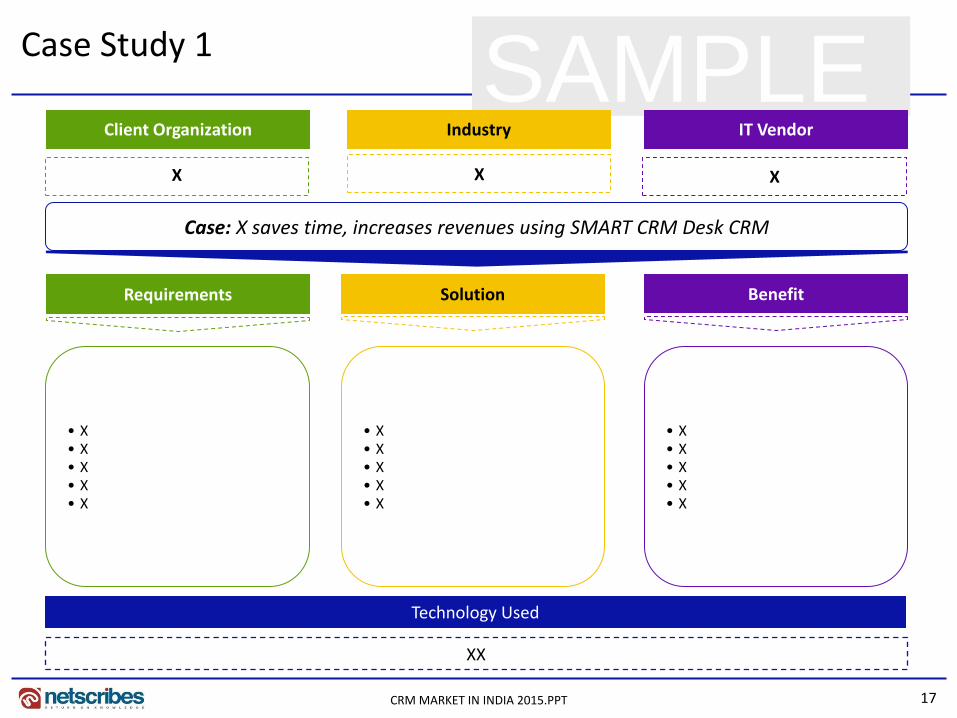
SAMPLE Case Study 1
Case: X saves time, increases revenues using SMART CRM Desk CRM
Solution Requirements Benefit
• X • X • X • X • X
• X • X • X • X • X
• X • X • X • X • X
Technology Used
XX
Client Organization IT Vendor
X X
Industry
X

18 CRM MARKET IN INDIA 2015.PPT
SAMPLE Porter’s Five Forces Analysis
Competitive Rivalry • X
Bargaining Power of Buyers • X
Threat of New Entrants • X
Impact X
Impact X
Impact X
Bargaining Power of Suppliers • X
Impact X
Threat of Substitutes • X
Impact X

19 CRM MARKET IN INDIA 2015.PPT
SAMPLE Key Ratios of 3 Major Private Companies – Operational Basis (FY 2014) (x/x)
Competitive Benchmarking (3/3)
x
x
x
x
x
Oracle
x
SAP
x
Salesforce
x
Asset Turnover Ratio
• XX
• XX
• XX
x
x
x
x
x
x3
SAP
x2 x1
Salesforce
x3
x2
x1
Oracle
x3 x2 x1
Debtors Turnover Ratio
2012 2014 2013

20 CRM MARKET IN INDIA 2015.PPT
SAMPLE
Key People
Products and Services
Company Information Offices and Centres – India
Corporate Address X
Tel No. X
Fax No. X
Website X
Year of Incorporation X
Ticker Symbol X
Stock Exchange X
Public: Foreign Company – Company A(1/4)
Head Office Pune
Name Designation
X X
X X
X X
X X
Note: The list of products and services is not exhaustive
Category Products/Services
Amdocs Products X

21 CRM MARKET IN INDIA 2015.PPT
SAMPLE Financial Snapshot Key Ratios
Financial Summary
• The company earned a net profit of INR 26.1 bn in FY 2014, as compared to net profit of INR 25.8 bn in FY 2013
• The company reported total income of INR 220.9 bn in FY 2014, registering an increase of 5% over FY 2012
• The company earned an operating margin of 13.89% in FY 2014, a decrease of 0.48 percentage points over FY 2013
• The company reported debt to equity ratio of 0.06 in FY 2014, an increase of 1.26 per cent over FY 2013
Key Financial Performance Indicators
Indicators Value (23/06/2014) Market Capitalization (INR mn) 546029.19
Total Enterprise Value (INR mn) 465229.2
EPS 2.88
PE Ratio 19.64
Particulars y-o-y change
(2014-13) 2014 2013 2012 2011
Profitability Ratios
Operating Margin -0.48 13.89% 14.37% 13.57% 12.70%
Net Margin -0.48 11.83% 12.31% 12.00% 10.89%
Profit Before Tax Margin -0.47 13.72% 14.19% 13.54% 12.43%
Return on Equity -0.16 12.43% 12.59% 12.90% 11.47%
Return on Capital Employed -0.06 12.44% 12.50% 12.36% 11.15%
Return on Working Capital 0.65 40.52% 39.87% 45.36% 41.77%
Return on Assets -0.22 9.56% 9.78% 9.53% 8.72%
Return on Fixed Assets -3.23 171.53% 174.76% 159.22% 156.49%
Cost Ratios
Operating costs (% of Sales) 0.48 86.09% 85.61% 86.37% 87.28%
Administration costs (% of Sales)
-0.02 12.49% 12.51% 13.08% 12.89%
Interest costs (% of Sales) -0.01 0.10% 0.11% 0.10% 0.09%
Liquidity Ratios
Current Ratio -4.97% 2.02 2.12 1.92 1.96
Cash Ratio -3.92% 1.19 1.23 1.05 1.16
Leverage Ratios
Debt to Equity Ratio 1.26% 0.06 0.06 0.07 0.08
Debt to Capital Ratio 1.18% 0.06 0.06 0.06 0.08
Interest Coverage Ratio 5.13% 142.33 135.38 139.39 140.34
Efficiency Ratios
Fixed Asset Turnover 1.57% 12.33 12.14 11.68 12.30
Asset Turnover 1.18% 0.69 0.68 0.70 0.69
Current Asset Turnover 0.27% 1.47 1.47 1.59 1.61
Working Capital Turnover 5.17% 2.91 2.77 3.33 3.28
Capital Employed Turnover 2.64% 0.99 0.96 1.00 0.97
Improved Decline
Net Profit/Loss Total Income
30
20
300
10
0
200
100
0
INR bn INR bn
2014
26.1
220.9
2013
25.8
209.6
2012
20.7
172.4
2011
17.0
156.3
Public: Foreign Company – Company A(2/4)
Note: Financials of the parent company (Amdocs Ltd. NYSE:DOX) has been provided

22 CRM MARKET IN INDIA 2015.PPT
SAMPLE Key Business Segments Key Geographic Segments
Business Highlights
Description News
Overview X
Launch X
Acquisition X
100%
50%
0%
2014
220,625
73% 70% 72% 73%
17%13%12%14%13%
0%
50%
100%
2014
15%
2013
16%
2012 2011
14%
Rest of the World Europe North America
Public: Foreign Company – Company A(3/4)
X
Providing Integrated Products and Services
23 CRM MARKET IN INDIA 2015.PPT
SAMPLE Private: Foreign Company – Company A – SWOT Analysis (4/4)
• X •X
• X • X
T O
W S
24 CRM MARKET IN INDIA 2015.PPT
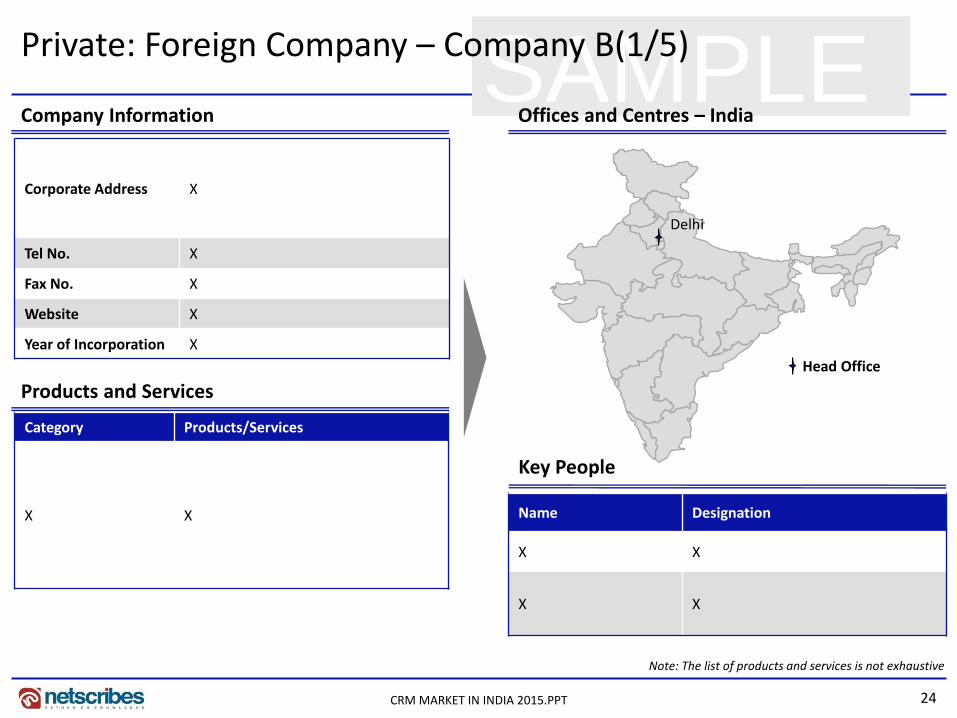
SAMPLE Private: Foreign Company – Company B(1/5)
Key People
Products and Services
Company Information Offices and Centres – India
Category Products/Services
X X Name Designation
X X
X X
Corporate Address X
Tel No. X
Fax No. X
Website X
Year of Incorporation X
Note: The list of products and services is not exhaustive
Delhi
Head Office

25 CRM MARKET IN INDIA 2015.PPT
SAMPLE Shareholders of the Company Ownership Structure
Name No. of Shares held
X X
X X
X X
100%
Foreign Holdings
Note: Shareholding pattern as on AGM dated 29th Sep 2014
Private: Foreign Company – Company B(2/5)

26 CRM MARKET IN INDIA 2015.PPT
SAMPLE Private: Foreign Company – Company B(3/5)
Financial Snapshot Key Ratios
Financial Summary
• The company earned a net profit of INR 681.1 mn in FY 2014 as compared to net profit of INR 590.1 mn in FY 2013
• The company reported total income of 7,925.4 mn in FY 2014, registering an increase of 17% over FY 2013
• The company earned an operating margin of 12.26% in FY 2014 a decrease of 0.92 percentage points over FY 2013
• The company reported a current ratio of 0.84% in FY 2014 registering a decrease of 27.48% over FY 2013
Particulars y-o-y change
(2014-13) 2014 2013 2012 2011
Profitability Ratios
Operating Margin -0.92 12.26% 13.18% N.A. N.A.
Net Margin -0.15 8.59% 8.74% N.A. N.A.
Profit Before Tax Margin -0.92 12.26% 13.18% N.A. N.A.
Return on Equity -0.97 17.82% 18.78% N.A. N.A.
Return on Capital Employed -2.90 25.42% 28.33% N.A. N.A.
Return on Working Capital -801.48 -375.32% 426.16% N.A. N.A.
Return on Assets -2.11 15.24% 17.35% N.A. N.A.
Return on Fixed Assets -9.05 23.66% 32.71% N.A. N.A.
Cost Ratios
Operating costs (% of Sales) 0.92 87.74% 86.82% N.A. N.A.
Administration costs (% of Sales)
N.A. N.A. N.A. N.A. N.A.
Interest costs (% of Sales) N.A. N.A. N.A. N.A. N.A.
Liquidity Ratios N.A.
Current Ratio -27.48% 0.84 1.16 2.07 N.A.
Cash Ratio -47.10% 0.23 0.43 0.55 N.A.
Leverage Ratios
Debt to Equity Ratio N.A. N.A. N.A. N.A. N.A.
Debt to Capital Ratio N.A. N.A. N.A. N.A. N.A.
Interest Coverage Ratio N.A. N.A. N.A. N.A. N.A.
Efficiency Ratios
Fixed Asset Turnover -22.24% 1.93 2.48 N.A. N.A.
Asset Turnover -5.59% 1.24 1.32 N.A. N.A.
Current Asset Turnover 30.49% 5.80 4.44 N.A. N.A.
Working Capital Turnover -194.66% -30.60 32.33 N.A. N.A.
Capital Employed Turnover -3.52% 2.07 2.15 N.A. N.A.
Improved Decline
800
600
400
200
0
8,000
6,000
4,000
2,000
0
INR mn INR mn
2014
681.1
7,925.4
2013
590.1
6,751.1
Net Profit/Loss Total Income

27 CRM MARKET IN INDIA 2015.PPT
SAMPLE Business Highlights
Private: Foreign Company – Company B(4/5)
Description News
Overview X
Featured Adobe Products for CRM
X
Launch X
Strategic Partnership X
Acquisition X

28 CRM MARKET IN INDIA 2015.PPT
SAMPLE Private: Foreign Company – Company B – SWOT Analysis (5/5)
• X • X
• X • X
T O
W S
29 CRM MARKET IN INDIA 2015.PPT
SAMPLE X
Strategy Adoption Area
X
Regional Growth X
Strategic Recommendations (x/x)
• X
• X
• X
• X

30 CRM MARKET IN INDIA 2015.PPT
Thank you for the attention
About Netscribes, Inc. Netscribes, Inc. is a knowledge-consulting and solutions firm with clientele across the globe. The company’s expertise spans areas of investment & business research, business & corporate intelligence, content-management services, and knowledge-software services. At its core lies a true value proposition that draws upon a vast knowledge base. Netscribes, Inc. is a one-stop shop designed to fulfil clients’ profitability and growth objectives.
CRM Market – India report is part of Netscribes’ Technology Series. For any queries or customized research requirements, contact us at:
Disclaimer: This report is published for general information only. Although high standards have been used in the preparation, “Netscribes” is not responsible for any loss or damage arising from use of this document. This document is the sole property of Netscribes and prior permission is required for guidelines on reproduction.
Phone: +91 22 4098 7600 E-Mail: [email protected]