
March12 alzantot
10
WATCHING THE WATCHERS: AUTOMATICALLY INFERRING TV CONTENT FROM OUTDOOR LIGHT EFFUSIONS Presenter: Moustafa Alzantot (UCLA) Authors : Yi Xu, J. Frahm, Fabian Monrose University of North Carolina Paper published in ACM CCS 2014
Transcript of March12 alzantot

WATCHING THE WATCHERS: AUTOMATICALLY INFERRING TV CONTENT FROM OUTDOOR LIGHT EFFUSIONS
Presenter: Moustafa Alzantot (UCLA)
Authors : Yi Xu, J. Frahm, Fabian MonroseUniversity of North CarolinaPaper published in ACM CCS 2014
Introduction
We are all familiar with flickering lights of content playing on TV screens in our living rooms at night.
This paper presents an attack that exploits the emanations of light, can be noticed through the window, to reveal the program being watched.
The kind of programs being watched presents a privacy a threat as it can reveal information about religious beliefs, political view points, and interests. TV subscriber watching habits are considered private under the
US Video Privacy Act of 1998.

Research Question
Can we infer the content being watched by matching the brightness change in room.
Compute average pixel brightness of each frame in video as the mean brightness, use the gradient of mean brightness as a descriptor for the video.
How to perform matching efficiently ?
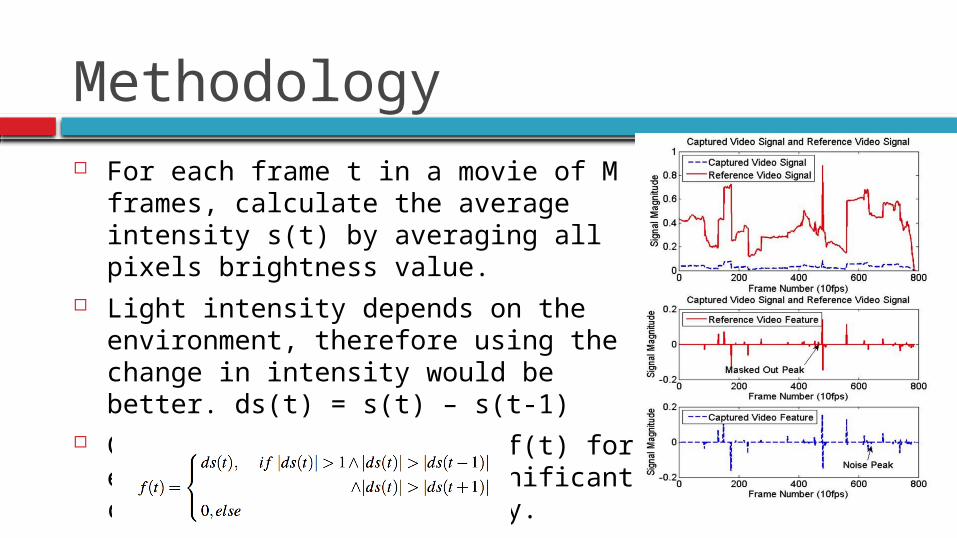
Methodology For each frame t in a movie of M
frames, calculate the average intensity s(t) by averaging all pixels brightness value.
Light intensity depends on the environment, therefore using the change in intensity would be better. ds(t) = s(t) – s(t-1)
Compute a feature vector f(t) for each movie by keeping significant changes in light intensity.
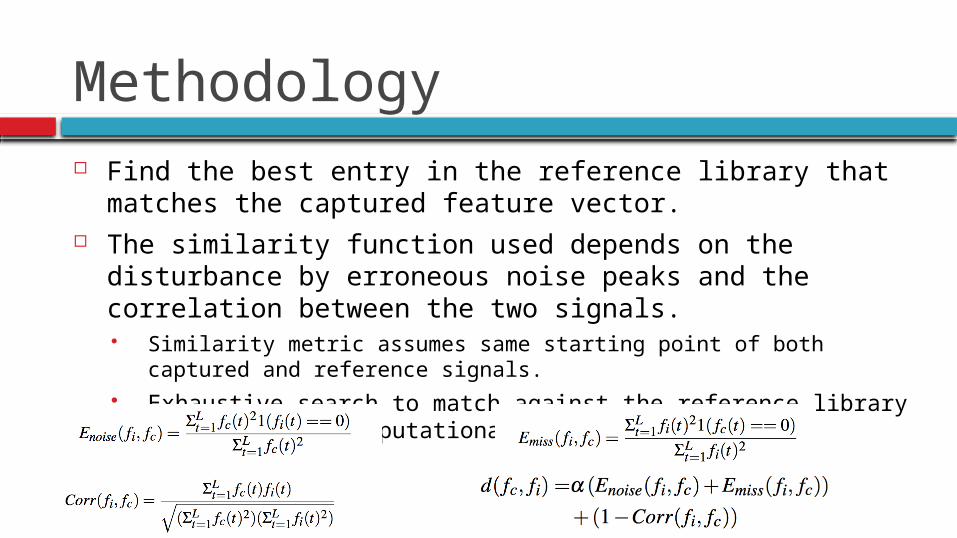
Methodology Find the best entry in the reference library that matches
the captured feature vector. The similarity function used depends on the disturbance by
erroneous noise peaks and the correlation between the two signals. Similarity metric assumes same starting point of both captured and
reference signals. Exhaustive search to match against the reference library adds a
lot of computational burden.
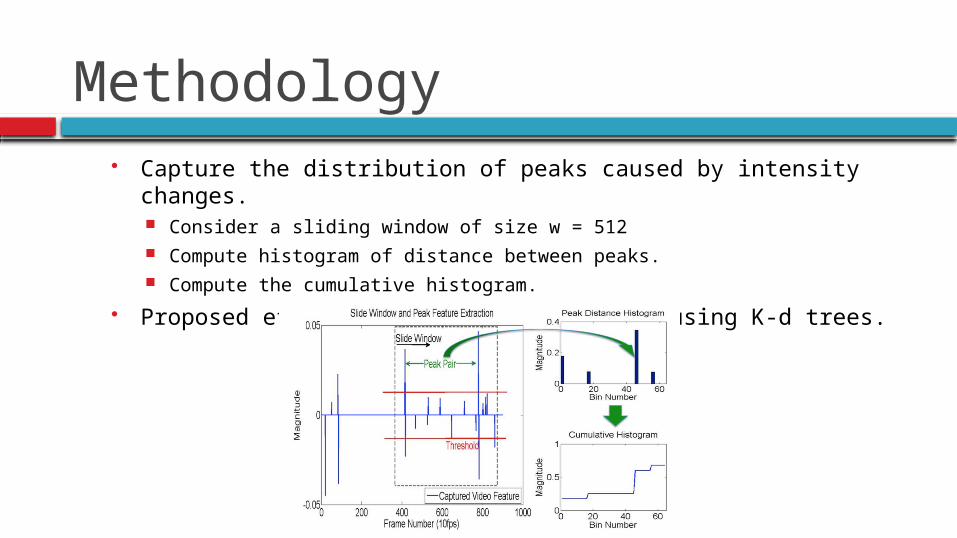
Methodology Capture the distribution of peaks caused by intensity changes.
Consider a sliding window of size w = 512 Compute histogram of distance between peaks. Compute the cumulative histogram.
Proposed efficient searching algorithm using K-d trees.
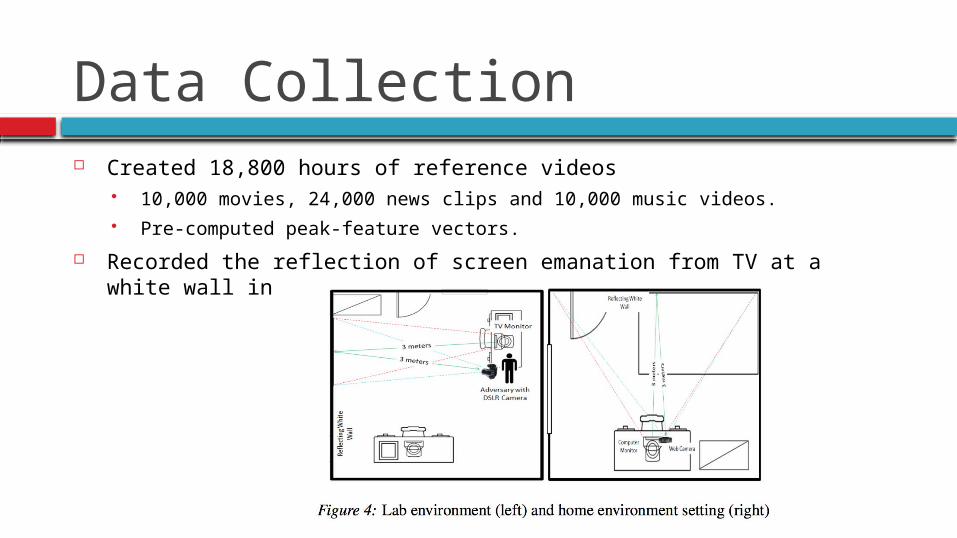
Data Collection Created 18,800 hours of reference videos
10,000 movies, 24,000 news clips and 10,000 music videos. Pre-computed peak-feature vectors.
Recorded the reflection of screen emanation from TV at a white wall in both lab and home environments.

Results
Randomly selected 62 test videos to be played from the reference library.
Accuracy when room lights are off:

Results
Accuracy with room lights ON: Study the influence of room light on the
attack Captured 5 videos in three different
illumination
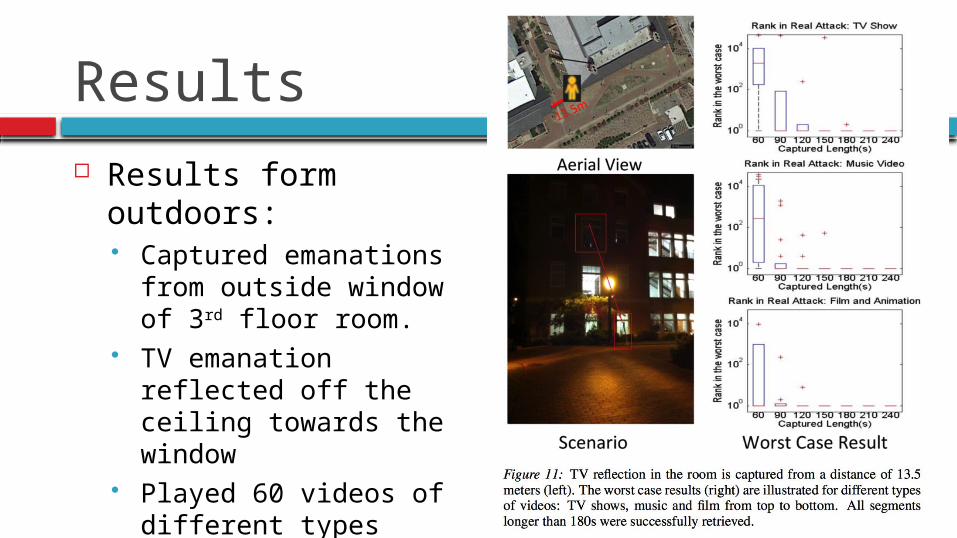
Results Results form outdoors:
Captured emanations from outside window of 3rd floor room.
TV emanation reflected off the ceiling towards the window
Played 60 videos of different types (music, films, TV show).