Limiting Reactants in Chemical Analysis: Influences of Metals
26
14 Limiting Reactants in Chemical Analysis: Influences of Metals and Ligands on Calibration Curves and Formation Constants for Selected Iron-Ligand Chelates Mark T. Stauffer, William E. Weller, Kimberly R. Kubas and Kelly A. Casoni University of Pittsburgh at Greensburg, Greensburg, Pennsylvania USA 1. Introduction 1.1 The limiting reactant concept in chemical analysis The concept of the limiting reactant in chemical reactions is one of the fundamental concepts learned by all students enrolled in introductory courses in chemistry at the high school and early undergraduate levels. Practicing chemists, and just about every technical professional involved in at least some aspect of chemistry, use the concepts of stoichiometry, and particularly the limiting reactant concept, in the workplace daily. In the practice of analytical chemistry, one makes use of an analytical method that relies upon a chemical reaction of an analyte (i.e., a chemical species present in a sample to be analyzed, for which concentration and other information is to be sought) with a suitable analytical reagent to generate a desired product, which yields a signal due to a change in a physical property (e.g., color, temperature, current, conductivity, etc.) of the product that is quantifiable and can be related to analyte concentration. The balanced chemical equation for the reaction must also be known. In a chemical analysis, the analyte is deliberately made the limiting reactant, with the analytical reagent added in excess, to ensure that all of the analyte reacts to yield the product and its signal, which in turn are proportional to the analyte concentration. The stoichiometric ratios among the analyte, analytical reagent, and product must be established for the analytical determination to yield reliable results. Analytical chemistry makes use of chemical reactions that reach equilibrium. The Law of Mass Action (Baird, 1999) describes the relatively fixed ratio of product to reactant concentrations at the equilibrium state. For a generic chemical reaction described by a balanced equation, the Law of Mass Action is described in Equation 1: aA ሺaqሻ + bB ሺaqሻ ⇌ cC ሺaqሻ + dD ሺaqሻ K= [C] c [D] d [A] a [B] b (1) In Equation 1, the uppercase and lowercase letters represent the reactants and products and their stoichiometric coefficients, respectively, the square brackets represent mole/L www.intechopen.com
Transcript of Limiting Reactants in Chemical Analysis: Influences of Metals
14
Limiting Reactants in Chemical Analysis: Influences of Metals and Ligands
on Calibration Curves and Formation Constants for Selected Iron-Ligand Chelates
Mark T. Stauffer, William E. Weller, Kimberly R. Kubas and Kelly A. Casoni
University of Pittsburgh at Greensburg, Greensburg, Pennsylvania USA
1. Introduction
1.1 The limiting reactant concept in chemical analysis
The concept of the limiting reactant in chemical reactions is one of the fundamental concepts learned by all students enrolled in introductory courses in chemistry at the high school and early undergraduate levels. Practicing chemists, and just about every technical professional involved in at least some aspect of chemistry, use the concepts of stoichiometry, and particularly the limiting reactant concept, in the workplace daily. In the practice of analytical chemistry, one makes use of an analytical method that relies upon a chemical reaction of an analyte (i.e., a chemical species present in a sample to be analyzed, for which concentration and other information is to be sought) with a suitable analytical reagent to generate a desired product, which yields a signal due to a change in a physical property (e.g., color, temperature, current, conductivity, etc.) of the product that is quantifiable and can be related to analyte concentration. The balanced chemical equation for the reaction must also be known. In a chemical analysis, the analyte is deliberately made the limiting reactant, with the analytical reagent added in excess, to ensure that all of the analyte reacts to yield the product and its signal, which in turn are proportional to the analyte concentration. The stoichiometric ratios among the analyte, analytical reagent, and product must be established for the analytical determination to yield reliable results.
Analytical chemistry makes use of chemical reactions that reach equilibrium. The Law of
Mass Action (Baird, 1999) describes the relatively fixed ratio of product to reactant
concentrations at the equilibrium state. For a generic chemical reaction described by a
balanced equation, the Law of Mass Action is described in Equation 1:
aA 岫aq岻+ bB 岫aq岻 ⇌ cC 岫aq岻+ dD 岫aq岻 K= [C]
c[D]
d
[A]a[B]
b (1)
In Equation 1, the uppercase and lowercase letters represent the reactants and products and
their stoichiometric coefficients, respectively, the square brackets represent mole/L
www.intechopen.com
Stoichiometry and Research – The Importance of Quantity in Biomedicine
312
concentrations of the species at equilibrium, and K is the equilibrium constant, which is the
numerical value of the product-to-reactant concentration ratio. The magnitude of the
equilibrium constant K indicates the extent of conversion of reactants to products upon
attainment of equilibrium. As K values are generally either greater than or less than unity, a
K value of 1016 is considered very large and characteristic of a reaction that goes essentially
to completion (i.e., the equilibrium favors the products). Conversely, K = 10-5 represents a
reaction in which there is partial formation of products and most of the reactants still intact
(i.e., the equilibrium favors the reactants) (Brown et al., 2006). Metal-ion chelation reactions
have values of K that are generally much greater than unity, indicating that such reactions
proceed spontaneously, without energy assistance from outside (Harris, 2010)
Complexation of a metal ion Mn+ with a coordinating ligand L, both in aqueous solution,
proceeds sequentially in a manner analogous to that described by Equations 2-4:
Mn+ 岫aq岻+ L 岫aq岻⇌ MLn+ 岫aq岻 Kf1= [MLn+]範Mn+飯[L]
(2)
MLn+ 岫aq岻+L 岫aq岻⇌ ML2n+ 岫aq岻 Kf2=
[ML2n+]範MLn+飯[L]
(3)
ML2n+ 岫aq岻+ L 岫aq岻⇌ ML3
n+ 岫aq岻 Kf3= [ML3
n+]範ML2n+飯[L]
(4)
Each step in the overall complexation process reaches equilibrium and thus has an
associated equilibrium constant, Kf, the formation or stability constant, the magnitude of
which denotes the strength or tightness of binding of Mn+ by L (Butler, 1998). The stepwise
coordination sequence described by Equations 2-4 may be described as well in terms of
summary, or overall, formation constants, described by Equations 5–7, and denoted by the
lowercase Greek βx, in which x is the number of individual complex-forming reaction steps
that contribute to the overall complexation reaction (Butler, 1998):
Mn+ 岫aq岻+ L 岫aq岻⇌ MLn+ 岫aq岻 1=
[MLn+]範Mn+飯[L] (5)
Mn+ 岫aq岻 + 2 L 岫aq岻 ⇌ ML2n+ 岫aq岻
2=
[ML2n+]範Mn+飯[L]
2 (6)
Mn+ 岫aq岻 + 3 L 岫aq岻 ⇌ ML3n+ 岫aq岻
3=
[ML3n+]範Mn+飯[L]
3 (7)
Ligands that are weak acids can undergo dissociation of their acidic hydrogens during
metal-ion complexation, in a manner similar to that shown in Equations 8 and 9 for the
diprotic weak acid Tiron (1,2-dihydroxybenzene-3,5-disulfonic acid disodium salt, Na2H2L)
(Cheng et al., 1992):
H2L2- 岫aq岻⇌ H+岫aq岻+ HL- (aq) Ka1= 範H+飯[HL-]
[H2L2-] (8)
HL貸 岫aq岻 ⇌ H+岫aq岻+ L2- (aq) Ka2= 範H+飯[L2-]
[HL-] (9)
www.intechopen.com
Limiting Reactants in Chemical Analysis: Influences of Metals and Ligands on Calibration Curves and Formation Constants for Selected Iron-Ligand Chelates
313
The deprotonation steps occur sequentially, with each step possessing its own acid dissociation or acid ionization constant, Ka. Ka values are less than unity; the smaller the magnitude of Ka, the more difficult the acidic hydrogen is to ionize. Weak bases, on the other hand, can directly chelate a metal ion such as Fe2+, and can also undergo protonation at low pH.
1.2 Spectrophotometric determinations of metal ions
One of the most established and widely used analytical methods employed by analytical chemists and many other technical professionals, for determination of a plethora of analytes in a wide variety of samples, is ultraviolet-visible spectrophotometry, also known as UV-visible spectrophotometry, UV-vis, spectrophotometry, or colorimetry. As this topic alone is immense in scope, and most readers are perhaps already familiar with spectrophotometry, the reader is referred to any number of references on this subject (Thomas, 1996; Skoog et al., 2007; Kellner, 1998). Most metal ions such as iron are weakly absorbing species that can be made very strongly absorbing via complexation of iron ions with an appropriate complexing agent, which is usually selective for a particular valence of iron (i.e., Fe2+ or Fe3+) (McBryde, 1964; Stookey, 1970).
As with any analytical method, UV-visible spectrophotometry requires prior knowledge, e.g,, the stoichiometric ratio of metal ion to ligand, of the chemical reaction that occurs between the metal ion and its chelating ligand, equilibrium information such as formation constants, and the useful concentration range for determination of the metal analyte. Knowledge of the stoichiometry of the metal-ion complexation required for the spectrophotometric determination of a given metal ion guides the analyst in proper selection of the amount of ligand to use to ensure complete coordination of the metal ion analyte.
As this chapter will focus on the stoichiometric aspects of the spectrophotometric determination of iron (as Fe2+) using the clinical iron-marking chelators Ferene S and Ferrozine, one needs to know about Beer’s Law (Thomas, 1996; Skoog et al., 2007; Kellner, 1998; Harris, 2010), which is perhaps most familiar as
A = εbC (10)
The molar absorptivity (ε, in L mole-1 cm-1), is a function of the wavelength used for absorbance measurements and the nature of the analyte (Harris, 2010); thus, it is actually a measure of the light-absorbing ability of the analyte in its absorbing form. The term b is the path length of the cuvet or sample container used for absorbance measurements. For the
most sensitive results, the wavelength of maximum absorption (λmax) should be used in a spectrophotometric analysis, to yield the maximum absorptivity possible.
1.3 Stoichiometry of metal ion chelates
Perhaps the best known and most widely used spectrophotometric method for studying metal-ion complex stoichiometry is the method of continuous variations (Harvey & Manning, 1950). Also known as the Job method (Job, 1928), it is best suited for metal-ion complex systems in which only one complex predominates. Additionally, the chelate in question must follow Beer’s Law.
www.intechopen.com
Stoichiometry and Research – The Importance of Quantity in Biomedicine
314
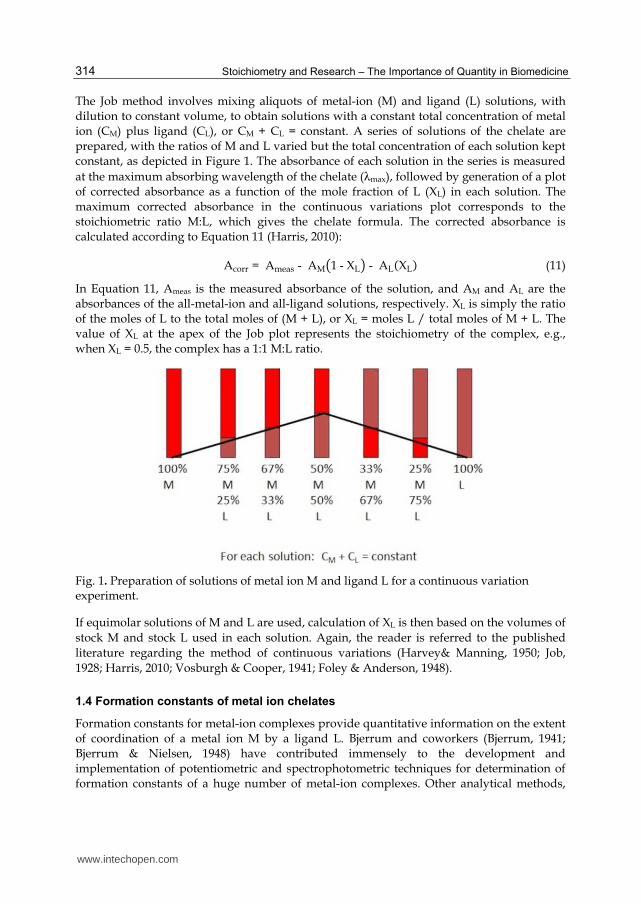
The Job method involves mixing aliquots of metal-ion (M) and ligand (L) solutions, with dilution to constant volume, to obtain solutions with a constant total concentration of metal ion (CM) plus ligand (CL), or CM + CL = constant. A series of solutions of the chelate are prepared, with the ratios of M and L varied but the total concentration of each solution kept constant, as depicted in Figure 1. The absorbance of each solution in the series is measured
at the maximum absorbing wavelength of the chelate (λmax), followed by generation of a plot of corrected absorbance as a function of the mole fraction of L (XL) in each solution. The maximum corrected absorbance in the continuous variations plot corresponds to the stoichiometric ratio M:L, which gives the chelate formula. The corrected absorbance is calculated according to Equation 11 (Harris, 2010):
Acorr = Ameas - AM盤1- XL匪 - AL岫XL岻 (11)
In Equation 11, Ameas is the measured absorbance of the solution, and AM and AL are the absorbances of the all-metal-ion and all-ligand solutions, respectively. XL is simply the ratio of the moles of L to the total moles of (M + L), or XL = moles L / total moles of M + L. The value of XL at the apex of the Job plot represents the stoichiometry of the complex, e.g., when XL = 0.5, the complex has a 1:1 M:L ratio.
Fig. 1. Preparation of solutions of metal ion M and ligand L for a continuous variation experiment.
If equimolar solutions of M and L are used, calculation of XL is then based on the volumes of
stock M and stock L used in each solution. Again, the reader is referred to the published
literature regarding the method of continuous variations (Harvey& Manning, 1950; Job,
1928; Harris, 2010; Vosburgh & Cooper, 1941; Foley & Anderson, 1948).
1.4 Formation constants of metal ion chelates
Formation constants for metal-ion complexes provide quantitative information on the extent of coordination of a metal ion M by a ligand L. Bjerrum and coworkers (Bjerrum, 1941; Bjerrum & Nielsen, 1948) have contributed immensely to the development and implementation of potentiometric and spectrophotometric techniques for determination of formation constants of a huge number of metal-ion complexes. Other analytical methods,
www.intechopen.com
Limiting Reactants in Chemical Analysis: Influences of Metals and Ligands on Calibration Curves and Formation Constants for Selected Iron-Ligand Chelates
315
e.g., NMR, have been employed for formation constant determinations (Irwin et al., 1996). In this chapter, the focus will be on the pH-based potentiometric and spectrophotometric methods for determination of the overall formation constant ┚3 for the Ferene S and Ferrozine chelates of iron(II).
The Bjerrum pH-spectrophotometric method (Billo, 2001) utilizes low values of pH to
promote only partial complexation and thus permits calculation of equilibrium
concentrations of the chelate, free metal ion, and free ligand, and subsequently, the overall
formation constant. The procedure involves preparation of a series of solutions, all of the
same volume and containing the same concentrations of metal ion and ligand, but at
different low values of pH. The absorbance of each solution is measured at the wavelength
of maximum absorption (λmax) for the chelate (MLn), and the chelate concentration in each
solution is calculated from Beer’s Law:
岷MLn峅= AMLn
εMLnb (12)
From here, the equilibrium concentrations of free M ([M]) and free L in all its forms at the
selected pH ([L’]) are calculated according to Equations 13 and 14:
岷M峅= CM - [MLn] (13)
範L'飯= CL' - n[MLn] (14)
From the Ka of the ligand and the pH (to yield [H+]), the concentration of free ligand in its unprotonated form ([L]) is calculated from the fraction of free L to free L’ in solution (i.e., ┙L = [L]/[L’]). For a monoprotic weak acid or a weak monobase, ┙L is described by Equation 15.
┙L = Ka
Ka + [H+] (15)
The concentration of free L is then calculated by Equation 16:
岷L峅 = ┙L [L'] (16)
Having now obtained [M], [L], and [MLn], one can calculate the overall formation constant,
┚n, for the complexation reaction
M 岫aq岻 + n L 岫aq岻 ⇌ MLn (aq) (17)
by use of its ┚n expression:
┚n =
[MLn]岷M峅[L]n (18)
The Bjerrum pH-potentiometric method makes use of a pH titration of a solution containing known concentrations of metal ion M, ligand L, and an acid. If the ligand is a weak acid, then no additional acid is necessary. If the ligand is a weak base, then either a stoichiometric amount of strong acid (e.g., HCl) is added, or the conjugate acid of the weak base ligand is used. Details on the procedures used in this type of formation constant determination are obtainable from the published literature (Rossotti & Rossotti, 1961; Martell & Motekaitis,
www.intechopen.com
Stoichiometry and Research – The Importance of Quantity in Biomedicine
316
1992). The calculations involved in obtaining formation constants (usually stepwise formation constants, or Kf values) for the complex MLn are extensive and involved. The reader is referred to appropriate texts on the pH-potentiometric method and its variations (Rossotti & Rossotti, 1961; Martell & Motekaitis, 1992).
1.5 The ligands Ferene S and Ferrozine in the spectrophotometric determination of iron, and their role as iron markers in clinical analysis
Two organic molecules that are known chelating agents for iron in its divalent state, Ferene
S and Ferrozine, have been selected by the authors for a study of the effects of the iron-to-
ligand ratio on the linearity of calibration curves produced for the spectrophotometric
determination of iron by these two chelators, and on the determination of formation
constants for the iron chelates of the two ligands.
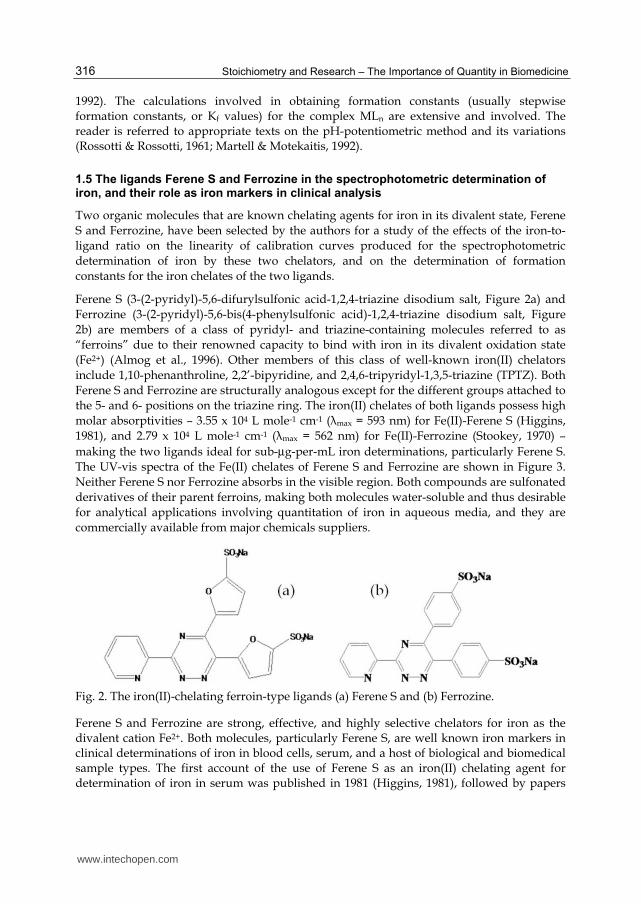
Ferene S (3-(2-pyridyl)-5,6-difurylsulfonic acid-1,2,4-triazine disodium salt, Figure 2a) and
Ferrozine (3-(2-pyridyl)-5,6-bis(4-phenylsulfonic acid)-1,2,4-triazine disodium salt, Figure
2b) are members of a class of pyridyl- and triazine-containing molecules referred to as
“ferroins” due to their renowned capacity to bind with iron in its divalent oxidation state
(Fe2+) (Almog et al., 1996). Other members of this class of well-known iron(II) chelators
include 1,10-phenanthroline, 2,2’-bipyridine, and 2,4,6-tripyridyl-1,3,5-triazine (TPTZ). Both
Ferene S and Ferrozine are structurally analogous except for the different groups attached to
the 5- and 6- positions on the triazine ring. The iron(II) chelates of both ligands possess high
molar absorptivities – 3.55 x 10⁴ L mole-1 cm-1 (λmax = 593 nm) for Fe(II)-Ferene S (Higgins,
1981), and 2.79 x 10⁴ L mole-1 cm-1 (λmax = 562 nm) for Fe(II)-Ferrozine (Stookey, 1970) –
making the two ligands ideal for sub-µg-per-mL iron determinations, particularly Ferene S.
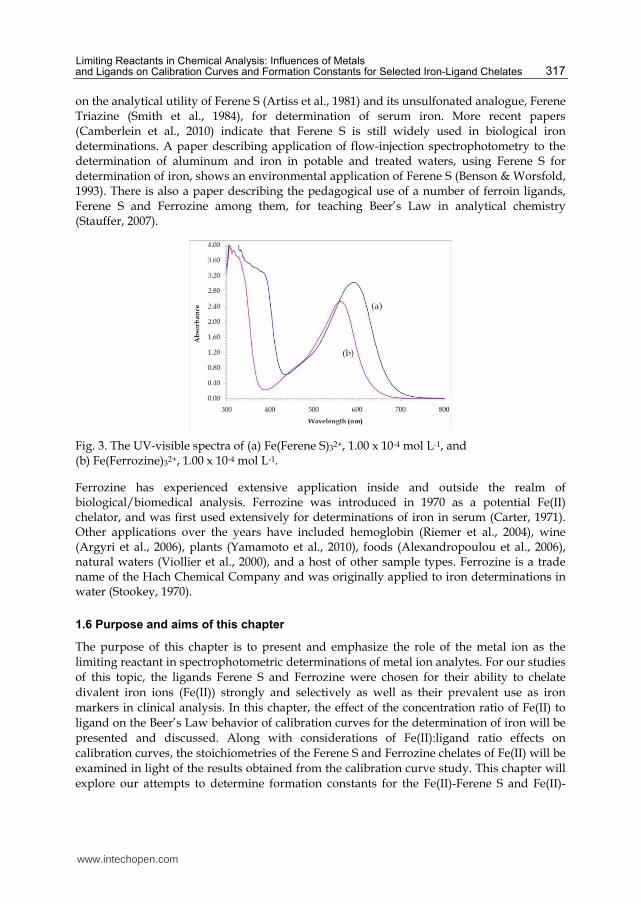
The UV-vis spectra of the Fe(II) chelates of Ferene S and Ferrozine are shown in Figure 3.
Neither Ferene S nor Ferrozine absorbs in the visible region. Both compounds are sulfonated
derivatives of their parent ferroins, making both molecules water-soluble and thus desirable
for analytical applications involving quantitation of iron in aqueous media, and they are
commercially available from major chemicals suppliers.
Fig. 2. The iron(II)-chelating ferroin-type ligands (a) Ferene S and (b) Ferrozine.
Ferene S and Ferrozine are strong, effective, and highly selective chelators for iron as the divalent cation Fe2+. Both molecules, particularly Ferene S, are well known iron markers in clinical determinations of iron in blood cells, serum, and a host of biological and biomedical sample types. The first account of the use of Ferene S as an iron(II) chelating agent for determination of iron in serum was published in 1981 (Higgins, 1981), followed by papers
www.intechopen.com
Limiting Reactants in Chemical Analysis: Influences of Metals and Ligands on Calibration Curves and Formation Constants for Selected Iron-Ligand Chelates
317
on the analytical utility of Ferene S (Artiss et al., 1981) and its unsulfonated analogue, Ferene Triazine (Smith et al., 1984), for determination of serum iron. More recent papers (Camberlein et al., 2010) indicate that Ferene S is still widely used in biological iron determinations. A paper describing application of flow-injection spectrophotometry to the determination of aluminum and iron in potable and treated waters, using Ferene S for determination of iron, shows an environmental application of Ferene S (Benson & Worsfold, 1993). There is also a paper describing the pedagogical use of a number of ferroin ligands, Ferene S and Ferrozine among them, for teaching Beer’s Law in analytical chemistry (Stauffer, 2007).
Fig. 3. The UV-visible spectra of (a) Fe(Ferene S)32+, 1.00 x 10⁻⁴ mol L-1, and (b) Fe(Ferrozine)32+, 1.00 x 10⁻⁴ mol L-1.
Ferrozine has experienced extensive application inside and outside the realm of biological/biomedical analysis. Ferrozine was introduced in 1970 as a potential Fe(II) chelator, and was first used extensively for determinations of iron in serum (Carter, 1971). Other applications over the years have included hemoglobin (Riemer et al., 2004), wine (Argyri et al., 2006), plants (Yamamoto et al., 2010), foods (Alexandropoulou et al., 2006), natural waters (Viollier et al., 2000), and a host of other sample types. Ferrozine is a trade name of the Hach Chemical Company and was originally applied to iron determinations in water (Stookey, 1970).
1.6 Purpose and aims of this chapter
The purpose of this chapter is to present and emphasize the role of the metal ion as the
limiting reactant in spectrophotometric determinations of metal ion analytes. For our studies
of this topic, the ligands Ferene S and Ferrozine were chosen for their ability to chelate
divalent iron ions (Fe(II)) strongly and selectively as well as their prevalent use as iron
markers in clinical analysis. In this chapter, the effect of the concentration ratio of Fe(II) to
ligand on the Beer’s Law behavior of calibration curves for the determination of iron will be
presented and discussed. Along with considerations of Fe(II):ligand ratio effects on
calibration curves, the stoichiometries of the Ferene S and Ferrozine chelates of Fe(II) will be
examined in light of the results obtained from the calibration curve study. This chapter will
explore our attempts to determine formation constants for the Fe(II)-Ferene S and Fe(II)-
www.intechopen.com
Stoichiometry and Research – The Importance of Quantity in Biomedicine
318
Ferrozine chelates by spectrophotometry and potentiometry, and to gain insights into the
binding of Fe(II) by each of the two ligands. The chapter will conclude with presentation
and discussion of an application of Ferene S to the spectrophotometric determination of iron
outside the realm of clinical analysis, e.g., in abandoned mine drainage (AMD) and other
natural waters.
2. Experimental section
2.1 Equipment, reagents, solutions
2.1.1 Equipment and reagents
Spectral measurements were made with a Hitachi Model U-3010 scanning double-beam UV-
visible spectrophotometer (Hitachi High Technologies America, San Diego, CA, USA) and
1.00-cm quartz cuvets (Fisher Scientific, Inc., Pittsburgh, PA, USA), a battery-operated WPA
Colourwave 7500B eight-filter colorimeter and 1.00-cm plastic cuvets (Biochrom, Ltd.,
Cambridge, UK), and a Vernier SpectroVis diode-array spectrophotometer plus battery-
operated LabQuest microprocessor with software (for operation of the SpectroVis
spectrophotometer), and 1.00-cm plastic cuvets (Vernier Software & Technology, Beaverton,
OR, USA). A Perkin-Elmer AAnalyst 100 flame atomic absorption spectrophotometer with
air-acetylene flame, 10-cm single-slot burner head, and Lumina iron hollow cathode lamp
Model No. N3050126 (Perkin-Elmer Corporation, Norwalk, CT, USA), was used for
verification of total iron concentration in some field determinations of iron. Adjustments of
pH for optimum color formation of the Fe2+-Ferene S and Fe2+-Ferrozine chelate solutions,
and for carrying out pH titrations of ligand and chelate solutions, were made with an
Oakton pHTestr 30 handheld combination electrode pH meter with built-in temperature
probe (Fisher Scientific, Inc.). Temperature control for the spectrophotometric and
potentiometric formation constant experiments was achieved using an Isotemp Model 2340
programmable constant temperature water bath (Fisher Scientific, Inc.).
Ferene S (3-(2-pyridyl)-5,6-difurylsulfonic acid-1,2,4-triazine disodium salt) and Ferrozine
(3-(2-pyridyl)-5,6-bis(4-phenylsulfonic acid)-1,2,4-triazine disodium salt) were purchased
from GFS Chemicals, Inc. (Powell, OH, USA) and Sigma-Aldrich (St. Louis, MO, USA) and
used without further purification. Other reagents include hydroquinone (C4H6O2, reducing
agent for Fe3+), sodium acetate trihydrate (NaC2H3O2 . 3H2O, pH buffering agent), iron(II)
ammonium sulfate hexahydrate (Fe(NH4)2(SO4)2 . 6H2O), potassium hydrogen phthalate
(KHC8H4O4), concentrated hydrochloric acid (12 mole HCl L-1), sodium hydroxide (NaOH),
1000 mg Fe L-1 stock standard solution, and NIST-traceable pH 5.00 buffer solution (Fisher
Scientific, Inc.).
2.1.2 Solution preparation
Aqueous solutions of hydroquinone were prepared at 2-3% (w/v) concentration. Aqueous solutions of sodium acetate were prepared at 2.0 mole NaC2H3O2 L-1 concentration. Dilute (1 mole L-1) solutions of HCl and NaOH were prepared from reagent grade concentrated HCl and NaOH pellets, respectively. Solutions of the water-soluble Ferene S and Ferrozine were easily prepared. Aqueous stock solutions of Ferene S and Ferrozine were prepared at concentrations between 5.00 x 10⁻³ to 5.00 x 10⁻² mole ligand L-1. Standard aqueous Fe stock
www.intechopen.com
Limiting Reactants in Chemical Analysis: Influences of Metals and Ligands on Calibration Curves and Formation Constants for Selected Iron-Ligand Chelates
319
solutions (1000 mg Fe L-1 or 1.79 x 10⁻² mole Fe L-1, Fisher Scientific, Inc.) were used to prepare aqueous Fe working standard solutions (100 mg Fe L-1 or 1.79 x 10⁻³ mole Fe L-1), according to established procedures (McBride, 1980). Calibration standards ranging from 0.05 – 10 mg Fe L-1 (or approximately 10-6 – 10-4 mole Fe L-1) were prepared from the working standard. The 1 mole L-1 NaOH titrant solution for the pH titrations of the ligands and their Fe(II) chelates was standardized against potassium hydrogen phthalate.
2.2 Experimental procedures
2.2.1 Calibration curve study for Fe(II)-Ferene S and Fe(II)-Ferrozine chelates
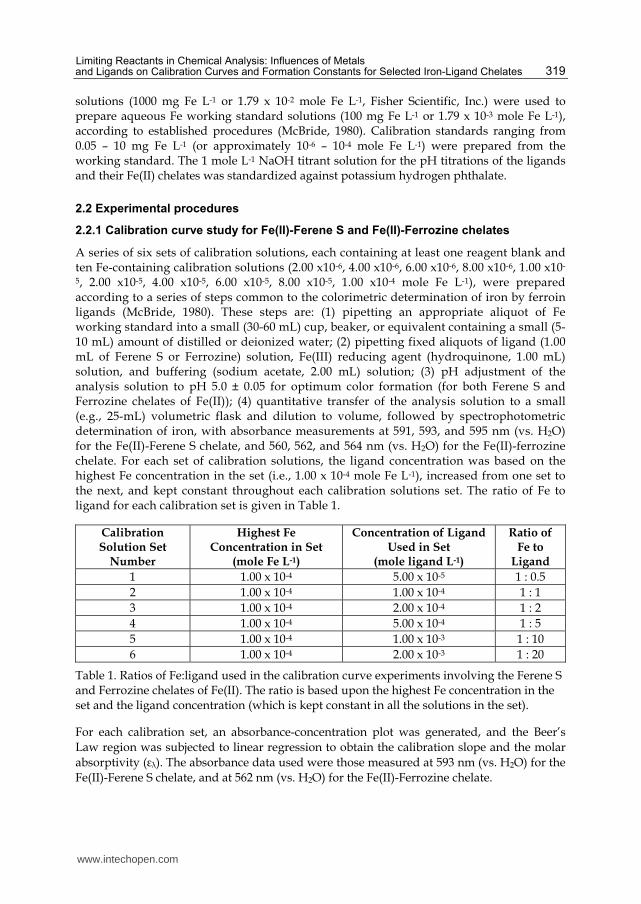
A series of six sets of calibration solutions, each containing at least one reagent blank and ten Fe-containing calibration solutions (2.00 x10⁻⁶, 4.00 x10⁻⁶, 6.00 x10⁻⁶, 8.00 x10⁻⁶, 1.00 x10-
5, 2.00 x10⁻⁵, 4.00 x10⁻⁵, 6.00 x10⁻⁵, 8.00 x10⁻⁵, 1.00 x10⁻⁴ mole Fe L-1), were prepared according to a series of steps common to the colorimetric determination of iron by ferroin ligands (McBride, 1980). These steps are: (1) pipetting an appropriate aliquot of Fe working standard into a small (30-60 mL) cup, beaker, or equivalent containing a small (5-10 mL) amount of distilled or deionized water; (2) pipetting fixed aliquots of ligand (1.00 mL of Ferene S or Ferrozine) solution, Fe(III) reducing agent (hydroquinone, 1.00 mL) solution, and buffering (sodium acetate, 2.00 mL) solution; (3) pH adjustment of the analysis solution to pH 5.0 ± 0.05 for optimum color formation (for both Ferene S and Ferrozine chelates of Fe(II)); (4) quantitative transfer of the analysis solution to a small (e.g., 25-mL) volumetric flask and dilution to volume, followed by spectrophotometric determination of iron, with absorbance measurements at 591, 593, and 595 nm (vs. H2O) for the Fe(II)-Ferene S chelate, and 560, 562, and 564 nm (vs. H2O) for the Fe(II)-ferrozine chelate. For each set of calibration solutions, the ligand concentration was based on the highest Fe concentration in the set (i.e., 1.00 x 10⁻⁴ mole Fe L-1), increased from one set to the next, and kept constant throughout each calibration solutions set. The ratio of Fe to ligand for each calibration set is given in Table 1.
Calibration Solution Set
Number
Highest Fe Concentration in Set
(mole Fe L-1)
Concentration of Ligand Used in Set
(mole ligand L-1)
Ratio of Fe to
Ligand
1 1.00 x 10⁻⁴ 5.00 x 10⁻⁵ 1 : 0.5
2 1.00 x 10⁻⁴ 1.00 x 10⁻⁴ 1 : 1
3 1.00 x 10⁻⁴ 2.00 x 10⁻⁴ 1 : 2
4 1.00 x 10⁻⁴ 5.00 x 10⁻⁴ 1 : 5
5 1.00 x 10⁻⁴ 1.00 x 10⁻³ 1 : 10
6 1.00 x 10⁻⁴ 2.00 x 10⁻³ 1 : 20
Table 1. Ratios of Fe:ligand used in the calibration curve experiments involving the Ferene S and Ferrozine chelates of Fe(II). The ratio is based upon the highest Fe concentration in the set and the ligand concentration (which is kept constant in all the solutions in the set).
For each calibration set, an absorbance-concentration plot was generated, and the Beer’s
Law region was subjected to linear regression to obtain the calibration slope and the molar
absorptivity (ελ). The absorbance data used were those measured at 593 nm (vs. H2O) for the
Fe(II)-Ferene S chelate, and at 562 nm (vs. H2O) for the Fe(II)-Ferrozine chelate.
www.intechopen.com
Stoichiometry and Research – The Importance of Quantity in Biomedicine
320
Absorption spectra of Ferene S and Ferrozine, and their Fe(II) chelates, were measured from 300-800 nm (vs. H2O) using the Hitachi U-3010 spectrophotometer.
2.2.2 Stoichiometries of Fe(II)-Ferene S and Fe(II)-Ferrozine chelates
The method of continuous variations was employed for determination of the stoichiometries of the two Fe(II) chelates. For each chelate, three series of solutions, of total concentrations (Fe(II) + ligand) of 5.00-6.00 x 10⁻⁵, 1.00 x 10⁻⁴, and 2.50 x 10⁻⁴ mol L-1 and containing from 11 to 15 solutions each, were prepared according to the common steps outlined in section 2.2.1 and analyzed for Fe. In each series, the moles of Fe and ligand were varied in accordance with the method of continuous variations while keeping the total moles of all solutions in the series constant. The measured absorbances (at 593 nm vs. H2O for Fe(II)-Ferene S and 562 nm vs. H2O for Fe(II)-Ferrozine) were corrected as recommended by the Job method, and the mole fraction of ligand (XL) calculated for each solution in the series. The corrected absorbances were plotted as a function of XL, and the Fe:ligand ratio for the chelates determined from the apex of each plot (Stauffer, 2007).
2.2.3 Determination of Ka for conjugate acids of Ferene S and Ferrozine
The determination of acid dissociation constants (Ka) for Ferene S and Ferrozine was performed by manual pH titration. For each ligand, a 50.00-mL titration solution containing 0.01 mole ligand L-1 and 0.10 mole KCl L-1 to maintain constant ionic strength was prepared and transferred to a beaker, which was placed in a constant-temperature water bath at 20oC and allowed to stand for several minutes before the titration began. Titration of Ferrozine was carried out using the monosodium salt; titration of Ferene S was performed in the presence of a mole equivalent of HCl (per mole of Ferene S) added to the titration solution before dilution to volume. The titration solution was stirred manually (glass stirring rod) for at least 5 seconds after addition of each increment of standard NaOH, followed by measurement of the solution pH (no stirring) with a calibrated Oakton pHTestr 30 handheld pH meter, with combination glass electrode. The titration was carried out from the initial solution pH (usually pH 2.0-3.0) to pH 11.5-12.0. Between 60-100 data points were collected for each titration. The pKa of each ligand was determined graphically (Harris, 2010).
2.2.4 Determination of formation constants for Fe(II)-Ferene S and Fe(II)-Ferrozine chelates
Both spectrophotometric and potentiometric methods (Billo, 2001; Martell & Motekaitis,
1992; Rossotti & Rossotti, 1961) were employed for the determination of the overall
formation constant (┚3) for the Fe(II)-Ferene S and Fe(II)-Ferrozine chelates.
For the spectrophotometric experiments, a series of solutions containing known, fixed concentrations of Fe(II) and ligand were prepared according to the common protocol given in section 2.2.1, except that no sodium acetate solution was added, and the pH of the solutions in the series ranged from 1.20 to 2.80 via adjustment with dilute HCl and NaOH. The solutions were placed in a constant-temperature bath at 20oC for 30-60 minutes prior to measuring the absorbance of each solution (593 nm vs. H2O for Fe(II)-Ferene S and 562 nm vs. H2O for Fe(II)-Ferrozine). For the Fe(II)-Ferene S chelate, four series of 5-11 solutions, ranging in pH from 1.20-2.80, and with each solution
www.intechopen.com
Limiting Reactants in Chemical Analysis: Influences of Metals and Ligands on Calibration Curves and Formation Constants for Selected Iron-Ligand Chelates
321
containing 2.00 x 10⁻⁵ mole Fe(II) L-1, were prepared and analyzed for Fe in the manner just described. The Fe(II):Ferene S concentration ratios in the four series were 1:1, 1:4, 1:5, and 1:10, respectively. For the Fe(II)-Ferrozine chelate, two series made up of 7-11 solutions with the same Fe(II) concentration in each solution, the same pH ranges, and with 1:1, 1:4, 1:5, and 1:10 Fe(II):Ferrozine ratios, were prepared and analyzed for Fe in the aforementioned manner.
For the potentiometric experiments, 50.00-mL titration solutions containing 1:1, 1:2, 1:3, and 1:4 ratios of Fe(II):Ferene S, in which the Fe(II) concentration was 5 x 10⁻³ mol L-1 and which were prepared in a manner analogous to that described in section 2.2.3, were titrated with standard 1 mole NaOH L-1 titrant solution and measured for pH in the same manner as described in section 2.2.3. In the titrations involving Ferene S, one mole equivalent of HCl was added for every mole of Ferene S in the titration mixture. For the titrations involving Ferrozine, Fe(II):ligand ratios of 1:2 and 1:4 were used, and the Fe(II) concentration was kept at 1.88 x 10⁻⁴ mol L-1 in both experiments.
2.2.5 Applications of Ferene S to the determination of iron in natural waters
Samples of abandoned mine drainage (AMD) and other types of natural waters were analyzed for total Fe (as Fe(II)) by the spectrophotometric Ferene S method, according to the common protocol described earlier in section 2.2.1. Water samples that contained suspended solids or coarser debris were filtered by established procedures (Stauffer, 2007; Stauffer et al., 2007). If necessary, samples were digested by traditional wet ashing or microwave digestion (Eperesi et al., 2010); the digestion step was, in the bulk of determinations, unnecessary.
AMD samples that were investigated for Fe(II)/Fe(III) speciation were analyzed for Fe, as Fe(II) and Fe(III), by the spectrophotometric Ferene S method, in a somewhat different manner. Between 50-200 µL of water sample were used for this determination, along with 80.0 µL of 0.01-0.05 mole Ferene S L-1 solution and 80.0 µL of 2-3% (w/v) hydroquinone solution. An aliquot of pH 5.00 buffer solution (KHP/NaOH), ranging from 1640-1790 µL, was selected to bring the total volume of the analysis solution to 2000 µL (2.000 mL). The color-forming reaction was carried out in a 1.00-cm plastic cuvet, with calibrated adjustable-volume micropipettors used for transfer of solution and sample aliquots to the cuvet. Absorbance measurements were made at 590 nm (vs. H2O) with a WPA Colourwave 7500B colorimeter, or at 593 nm (vs. H2O) with a Vernier SpectroVis diode-array spectrophotometer, operated in kinetics mode. Once the desired sample volume was selected, the appropriate volume of pH 5.00 buffer solution was added first, followed by the Ferene S solution aliquot and then the sample aliquot. At this point, the solution volume in the cuvet was 1.920 mL. Upon addition of the sample to the cuvet, with brief (2-3 seconds) stirring, absorbance measurements were initiated and recorded at a predetermined time interval throughout the course of the determination. When the absorbance began to plateau after an initial increase, hydroquinone solution was added to the cuvet (with brief stirring) to reduce Fe(III) to Fe(II). Depending on the amount of Fe(III) present in the sample, an additional absorbance increase occurred, with subsequent leveling of absorbance to a fairly constant value. All recorded absorbances were corrected to a total volume of 2.000 mL for the Fe determination, with an average corrected absorbance (Acorr,1) calculated from the first plateau (due to Fe(II)) and one (Acorr,2) calculated from the second plateau (due to total Fe).
www.intechopen.com
Stoichiometry and Research – The Importance of Quantity in Biomedicine
322
Blanks and calibration standards were analyzed for Fe in the same manner. The calibration factor obtained was expressed in terms of the total Fe concentration in the standard as Fe(II). The concentrations of Fe(II) and total Fe were determined from Acorr,1 and Acorr,2, respectively. The concentration of Fe(III) was determined by the difference between the total Fe and Fe(II) concentrations.
2.3 Data manipulations
Data and results from the calibration curve, stoichiometry, formation constant, and Ferene S
application studies were processed using Microsoft® Excel™.
3. Results and discussion
3.1 Study of calibration curves for iron(II) chelates of Ferene S and Ferrozine
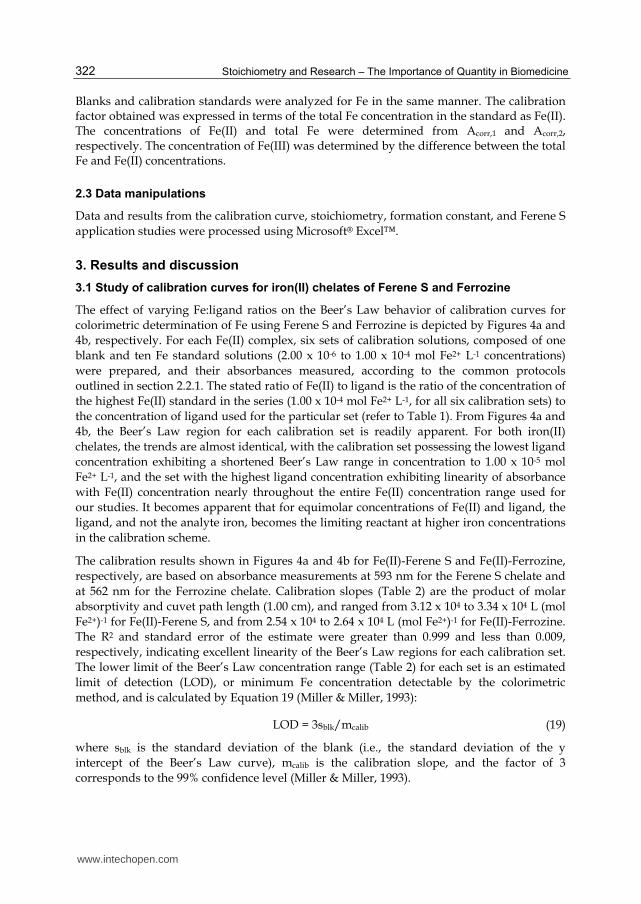
The effect of varying Fe:ligand ratios on the Beer’s Law behavior of calibration curves for
colorimetric determination of Fe using Ferene S and Ferrozine is depicted by Figures 4a and
4b, respectively. For each Fe(II) complex, six sets of calibration solutions, composed of one
blank and ten Fe standard solutions (2.00 x 10⁻⁶ to 1.00 x 10⁻⁴ mol Fe2+ L-1 concentrations)
were prepared, and their absorbances measured, according to the common protocols
outlined in section 2.2.1. The stated ratio of Fe(II) to ligand is the ratio of the concentration of
the highest Fe(II) standard in the series (1.00 x 10⁻⁴ mol Fe2+ L-1, for all six calibration sets) to
the concentration of ligand used for the particular set (refer to Table 1). From Figures 4a and
4b, the Beer’s Law region for each calibration set is readily apparent. For both iron(II)
chelates, the trends are almost identical, with the calibration set possessing the lowest ligand
concentration exhibiting a shortened Beer’s Law range in concentration to 1.00 x 10⁻⁵ mol
Fe2+ L-1, and the set with the highest ligand concentration exhibiting linearity of absorbance
with Fe(II) concentration nearly throughout the entire Fe(II) concentration range used for
our studies. It becomes apparent that for equimolar concentrations of Fe(II) and ligand, the
ligand, and not the analyte iron, becomes the limiting reactant at higher iron concentrations
in the calibration scheme.
The calibration results shown in Figures 4a and 4b for Fe(II)-Ferene S and Fe(II)-Ferrozine,
respectively, are based on absorbance measurements at 593 nm for the Ferene S chelate and
at 562 nm for the Ferrozine chelate. Calibration slopes (Table 2) are the product of molar
absorptivity and cuvet path length (1.00 cm), and ranged from 3.12 x 10⁴ to 3.34 x 10⁴ L (mol
Fe2+)-1 for Fe(II)-Ferene S, and from 2.54 x 10⁴ to 2.64 x 10⁴ L (mol Fe2+)-1 for Fe(II)-Ferrozine.
The R2 and standard error of the estimate were greater than 0.999 and less than 0.009,
respectively, indicating excellent linearity of the Beer’s Law regions for each calibration set.
The lower limit of the Beer’s Law concentration range (Table 2) for each set is an estimated
limit of detection (LOD), or minimum Fe concentration detectable by the colorimetric
method, and is calculated by Equation 19 (Miller & Miller, 1993):
LOD = 3sblk/mcalib (19)
where sblk is the standard deviation of the blank (i.e., the standard deviation of the y
intercept of the Beer’s Law curve), mcalib is the calibration slope, and the factor of 3
corresponds to the 99% confidence level (Miller & Miller, 1993).
www.intechopen.com
Limiting Reactants in Chemical Analysis: Influences of Metals and Ligands on Calibration Curves and Formation Constants for Selected Iron-Ligand Chelates
323
Fig. 4. Calibration curves for spectrophotometric determination of Fe(II) using (a) Ferene S and (b) Ferrozine at varying ratios of Fe(II) to ligand.
Table 2. Calibration slopes (L (mol Fe)-1) and corresponding Beer’s Law concentration ranges (mol Fe L-1) for the calibration plots for Fe(II)-Ferene S (Figure 4a) and Fe(II)-Ferrozine (Figure 4b).
www.intechopen.com
Stoichiometry and Research – The Importance of Quantity in Biomedicine
324
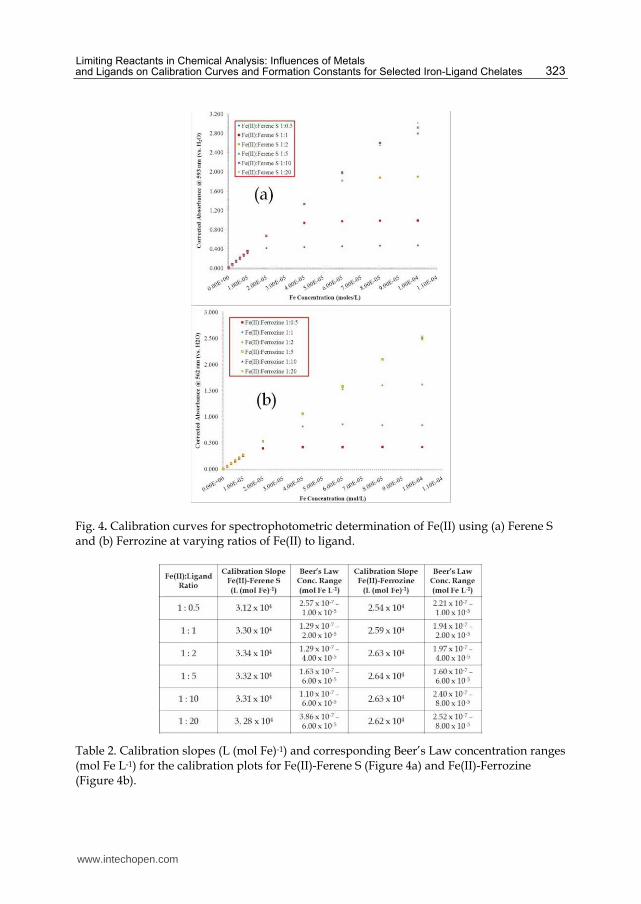
3.2 Stoichiometries of the iron(II) chelates of Ferene S and Ferrozine by the method of continuous variations
The stoichiometries of the iron(II) chelates of Ferene S and Ferrozine were investigated by
the method of continuous variations (a.k.a. Job method) according to the procedure
described in section 2.2.2, and are illustrated by the Job plots of Figures 5a and 5b for Fe(II)-
Ferene S and Fe(II)-Ferrozine, respectively. For all six Job plots, the Fe(II):ligand ratio
corresponding to the apex of each plot is 1:3 (XL = 0.75) and is readily apparent from the
shape of each plot. Thus, the stoichiometry of Fe(II)-Ferene S and Fe(II)-Ferrozine is 1:3 for
each chelate, indicating compositional formulae of Fe(Ferene S)32+ and Fe(Ferrozine)32+. The
1:3 stoichiometry found in our studies agrees with published findings for the Ferrozine
chelate (Gibbs, 1976) and those for the unsulfonated analogue of Ferene S (Smith et al.,
1984).
Fig. 5. Continuous variation plots for (a) Fe(Ferene S)32+ and (b) Fe(Ferrozine)32+, at three different total concentrations of Fe(II) + ligand (in mol L-1).
The degree of sharpness at the apex of a continuous variations plot gives a qualitative
estimate of the tightness of binding of the metal ion by the ligand in a complex, and can also
be used for determination of an overall formation constant for the complex if there is
sufficient rounding at the apex (Harris, 2010). The lower-concentration Job plots shown in
Figures 5a and 5b appear quite rounded at their apices relative to the highest-concentration
Job plots. Upon closer inspection of each Job plot individually, it was found that the lower-
concentration plots are much sharper than expected; the roundedness observed in Figures
5a and 5b may simply be a result of plotting together three continuous variations plots of
differing total concentrations. Yet, in the Job plots of Figures 5a and 5b, there is slight
rounding at the apex evident in all of them, which may be characteristic of the chelates
themselves or due to the concentrations of Fe(II) and ligand employed in these experiments.
Nonetheless, the sharp apices of the continuous variation plots of Figures 5a and 5b indicate
strong coordination of Fe2+ by Ferene S and Ferrozine. The results obtained for Fe(Ferene
S)32+ and Fe(Ferrozine)32+ appear to be typical of stoichiometric Fe(II):ligand ratios for other
ferroins, e.g. 1,10-phenanthroline and 2,2’-bipyridine (Stauffer, 2007 and references cited
therein).
www.intechopen.com
Limiting Reactants in Chemical Analysis: Influences of Metals and Ligands on Calibration Curves and Formation Constants for Selected Iron-Ligand Chelates
325
3.3 Determination of formation constants for the chelates of Ferene S and Ferrozine with iron(II)
Prior to determination of formation constants for the Fe(II) chelates of Ferene S and Ferrozine, determination of the pKa of each ligand was carried out by pH titration, according to the procedure described in section 2.2.3, followed by graphical analysis of the generated titration curves to obtain the pKa of each ligand from the midpoint of the buffer region (Harris, 2010). The pKa values of Ferene S and Ferrozine were found to be 3.13 and 3.21, respectively. Our experimental pKa for Ferrozine is in fairly good agreement with the published value (Thompsen & Mottola, 1984). Attempts to locate a published pKa for Ferene S were unsuccessful; the experimental pKa for Ferene S appears to be a reasonable one, in view of the structural similarities between Ferene S and Ferrozine.
Potentiometric determination of formation constants for Fe(Ferene S)32+ and Fe(Ferrozine)32+
proved exceedingly difficult; thus, values of the overall formation constants (┚3) of both
chelates were determined spectrophotometrically, as described in sections 1.4 and 2.2.4. The
log10┚3 values ranged from 16.30 to 16.82 (mean = 16.45 ± 0.25, %RSD = 1.5) for Fe(Ferene
S)32+, and from 17.24 to 18.01 (mean = 17.46 ± 0.37, %RSD = 2.1) for Fe(Ferrozine)32+. The
average log10┚3 results indicate that ┚3 is not affected by changes in ligand concentration, as
predicted by LeChatelier’s Principle. The results also indicate that Ferrozine chelates Fe(II)
more tightly than Ferene S. The experimental log10┚3 obtained for Ferrozine differs from a
published value (Thompsen & Mottola, 1984) by about 2 units; the difference is most likely
due to any number of experimental factors, such as temperature control, instrument
problems, or differences in the methods for determination of log10┚3. Attempts to find a
published value for comparison with our experimental log10┚3 for Fe(Ferene S)32+ were
unsuccessful. Again, the structural similarities between Ferene S and Ferrozine suggest that
the overall formation constant for Fe(Ferene S)32+ may be reasonable.
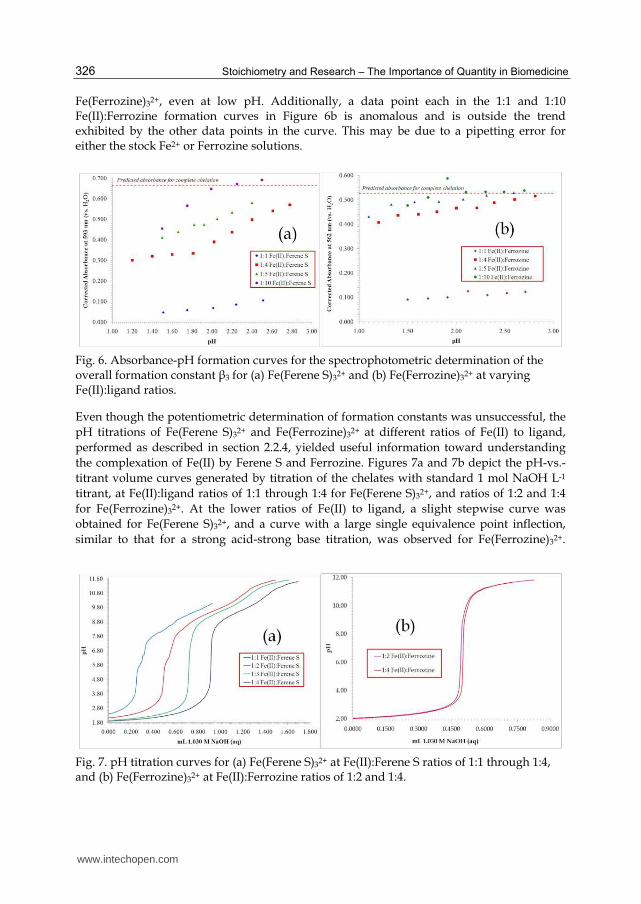
Figures 6a and 6b are the absorbance-pH curves (“formation curves”) associated with the spectrophotometric determination of ┚3 for Fe(Ferene S)32+ and Fe(Ferrozine)32+ and, as such, illustrate the formation of the two chelates at low pH, at which partial complexation is expected to occur due to competition between Fe2+ and H+ for the binding site on the ligand. For Fe(Ferene S)32+ and Fe(Ferrozine)32+, a predicted absorbance for complete chelation was calculated using Beer’s Law and a cuvet path length of 1.00 cm and a Fe(II) concentration of 2.00 x 10⁻⁵ mol L-1. This absorbance is indicated in Figures 6a and 6b by a dashed line. The results provided by Figures 6a and 6b suggest that while ┚3 does not appreciably change due to increasing ligand concentration, the extent of complexation does. This trend is observed for both Fe(Ferene S)32+ and Fe(Ferrozine)32+, and even more so for Fe(Ferrozine)32+, as its formation curves at higher Ferrozine concentrations are closer together near the predicted absorbance for complete chelation than are the formation curves for Fe(Ferene S)32+. The 1:10 Fe(II):Ferrozine formation curve in particular shows that, as pH increases beyond a value of 2.00, Fe(II) is essentially completely chelated by Ferrozine. A similar trend is observed for the 1:10 Fe(II):Ferene S formation curve. For both chelates, the 1:1 Fe(II):ligand formation curves are expected to give much lower absorbances, as the ligand now becomes the limiting reactant and only partial complexation occurs. It was noted that, even for the 1:1 Fe(II):ligand experiments, the indigo color of Fe(Ferene S)32+ and the magenta color of Fe(Ferrozine)32+ are readily formed and apparent. This suggests tight binding of Fe(II) by the ligands and a tendency to preferentially form Fe(Ferene S)32+ and
www.intechopen.com
Stoichiometry and Research – The Importance of Quantity in Biomedicine
326
Fe(Ferrozine)32+, even at low pH. Additionally, a data point each in the 1:1 and 1:10 Fe(II):Ferrozine formation curves in Figure 6b is anomalous and is outside the trend exhibited by the other data points in the curve. This may be due to a pipetting error for either the stock Fe2+ or Ferrozine solutions.
Fig. 6. Absorbance-pH formation curves for the spectrophotometric determination of the overall formation constant ┚3 for (a) Fe(Ferene S)32+ and (b) Fe(Ferrozine)32+ at varying Fe(II):ligand ratios.
Even though the potentiometric determination of formation constants was unsuccessful, the
pH titrations of Fe(Ferene S)32+ and Fe(Ferrozine)32+ at different ratios of Fe(II) to ligand,
performed as described in section 2.2.4, yielded useful information toward understanding
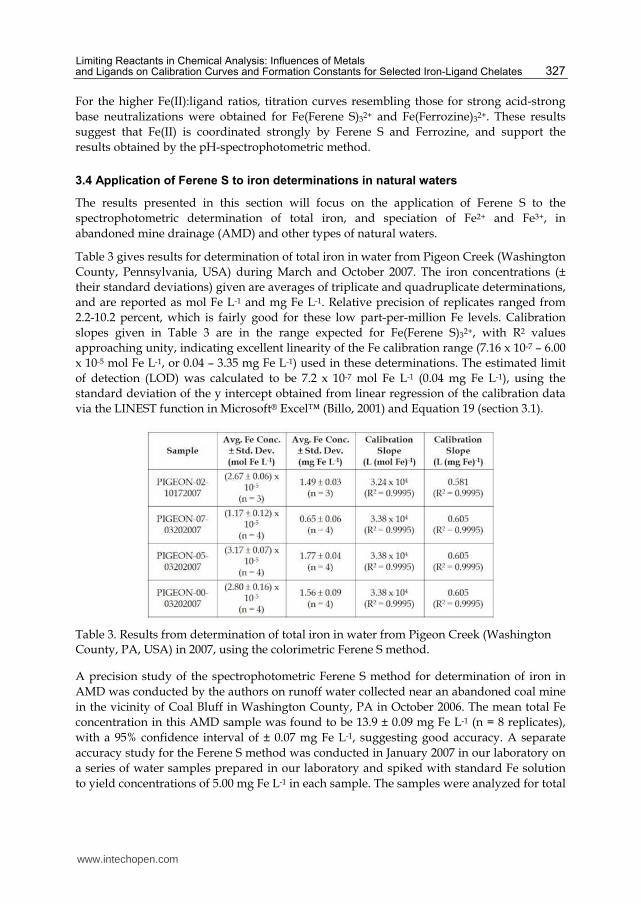
the complexation of Fe(II) by Ferene S and Ferrozine. Figures 7a and 7b depict the pH-vs.-
titrant volume curves generated by titration of the chelates with standard 1 mol NaOH L-1
titrant, at Fe(II):ligand ratios of 1:1 through 1:4 for Fe(Ferene S)32+, and ratios of 1:2 and 1:4
for Fe(Ferrozine)32+. At the lower ratios of Fe(II) to ligand, a slight stepwise curve was
obtained for Fe(Ferene S)32+, and a curve with a large single equivalence point inflection,
similar to that for a strong acid-strong base titration, was observed for Fe(Ferrozine)32+.
Fig. 7. pH titration curves for (a) Fe(Ferene S)32+ at Fe(II):Ferene S ratios of 1:1 through 1:4, and (b) Fe(Ferrozine)32+ at Fe(II):Ferrozine ratios of 1:2 and 1:4.
www.intechopen.com
Limiting Reactants in Chemical Analysis: Influences of Metals and Ligands on Calibration Curves and Formation Constants for Selected Iron-Ligand Chelates
327
For the higher Fe(II):ligand ratios, titration curves resembling those for strong acid-strong
base neutralizations were obtained for Fe(Ferene S)32+ and Fe(Ferrozine)32+. These results
suggest that Fe(II) is coordinated strongly by Ferene S and Ferrozine, and support the
results obtained by the pH-spectrophotometric method.
3.4 Application of Ferene S to iron determinations in natural waters
The results presented in this section will focus on the application of Ferene S to the
spectrophotometric determination of total iron, and speciation of Fe2+ and Fe3+, in
abandoned mine drainage (AMD) and other types of natural waters.
Table 3 gives results for determination of total iron in water from Pigeon Creek (Washington
County, Pennsylvania, USA) during March and October 2007. The iron concentrations (±
their standard deviations) given are averages of triplicate and quadruplicate determinations,
and are reported as mol Fe L-1 and mg Fe L-1. Relative precision of replicates ranged from
2.2-10.2 percent, which is fairly good for these low part-per-million Fe levels. Calibration
slopes given in Table 3 are in the range expected for Fe(Ferene S)32+, with R2 values
approaching unity, indicating excellent linearity of the Fe calibration range (7.16 x 10⁻⁷ – 6.00
x 10-5 mol Fe L-1, or 0.04 – 3.35 mg Fe L-1) used in these determinations. The estimated limit
of detection (LOD) was calculated to be 7.2 x 10⁻⁷ mol Fe L-1 (0.04 mg Fe L-1), using the
standard deviation of the y intercept obtained from linear regression of the calibration data
via the LINEST function in Microsoft® Excel™ (Billo, 2001) and Equation 19 (section 3.1).
Table 3. Results from determination of total iron in water from Pigeon Creek (Washington County, PA, USA) in 2007, using the colorimetric Ferene S method.
A precision study of the spectrophotometric Ferene S method for determination of iron in
AMD was conducted by the authors on runoff water collected near an abandoned coal mine
in the vicinity of Coal Bluff in Washington County, PA in October 2006. The mean total Fe
concentration in this AMD sample was found to be 13.9 ± 0.09 mg Fe L-1 (n = 8 replicates),
with a 95% confidence interval of ± 0.07 mg Fe L-1, suggesting good accuracy. A separate
accuracy study for the Ferene S method was conducted in January 2007 in our laboratory on
a series of water samples prepared in our laboratory and spiked with standard Fe solution
to yield concentrations of 5.00 mg Fe L-1 in each sample. The samples were analyzed for total
www.intechopen.com
Stoichiometry and Research – The Importance of Quantity in Biomedicine
328
iron (as Fe2+) by the common protocols outlined in section 2.2.1, with determination of the
percent recovery of iron in each sample. Iron recoveries for the spiked water samples ranged
from 100.6 – 101.4 percent, indicating essentially complete recovery of Fe and good
accuracy. Additionally, our group has compared total Fe results for samples determined by
the spectrophotometric Ferene S method to total Fe for the same samples determined by
flame atomic absorption spectrophotometry (FAAS). Table 4 lists average Fe concentrations
(in mg Fe L-1) found in water from clean and AMD-contaminated portions of Gillespie Run
(Allegheny County, PA, USA), determined by the colorimetric Ferene S method and by
FAAS. The results from Table 4 indicate good agreement between the spectrophotometric
Ferene S and FAAS methods.
Table 4. Comparison of the colorimetric Ferene S method with flame atomic absorption
spectrophotometry (FAAS) for determination of total iron in abandoned mine drainage
(AMD).
Current work in our laboratory involves, among other things, the use of the
spectrophotometric Ferene S method for speciation of iron (i.e., Fe2+, Fe3+, and total Fe) in
runoff from abandoned mines and other natural waters. The experimental approach used in
these studies is given in section 2.2.5. In the speciation experiments, a spectrophotometer or
colorimeter with absorbance-versus-time measurement capability is used to monitor
formation of Fe(Ferene S)32+ due to Fe2+ present in the sample. Upon chelation of Fe2+
initially present in the sample, the absorbance reaches a temporary plateau, at which time a
reducing agent, e.g., hydroquinone, is added to reduce any Fe3+ present to Fe2+. Depending
on the concentration of Fe3+, the absorbance at 590 nm (or 593 nm) increases accordingly
until it reaches a maximum value and levels off, allowing for subsequent determination of
total iron, and then Fe3+, in the sample. Figure 8a shows results from initial experiments that
addressed the amount of hydroquinone reducing agent to add to achieve rapid, successful
reduction of Fe(III) to Fe(II). For these investigations, 1120.0 µL of a 3.04 x 10⁻⁵ mol Fe3+ L-1
solution was pipetted into a 3.00-mL capacity, 1.00-cm path length plastic cuvet containing
800.0 µL of pH 5.00 KHP/NaOH buffer solution and 80.0 µL of 9.76 x 10⁻³ mol Ferene S L-1
chelating solution. A kinetic absorbance-time run at 590 nm, using a WPA Colourwave
CO7500 B colorimeter, was initiated upon addition of the sample. At t = 240 s, 20.0 µL of 2%
aqueous hydroquinone was pipetted into the cuvet (with brief mixing), followed by a
significant increase and eventual leveling of the absorbance at 590 nm, indicating reduction
of Fe3+ to Fe2+. This process required approximately 9 minutes, using 20.0 µL of 2%
www.intechopen.com
Limiting Reactants in Chemical Analysis: Influences of Metals and Ligands on Calibration Curves and Formation Constants for Selected Iron-Ligand Chelates
329
hydroquinone. A second experiment, using 80.0 µL of 2% aqueous hydroquinone reducing
agent and performed under the same conditions as before, required 3-5 minutes to achieve
complete reduction of Fe3+ to Fe2+. All absorbances in both experiments were adjusted to the
total solution volume in the cuvet after addition of hydroquinone. Sine wave-like
fluctuations of the absorbance at the plateaus of both absorbance-time curves are attributed
to insufficient mixing after addition of hydroquinone. Conversion of Fe3+ to Fe2+, expressed
as the percent ratio of the concentration of Fe3+ initially present and the Fe2+ concentration
determined at the end of the kinetic run (via the average absorbance at 590 nm at the plateau
and Beer’s Law), was found to be 103 and 107%, respectively, for the two experiments.
Though the conversions are rather high, they do suggest essentially complete reduction of
Fe3+ to Fe2+.
Fig. 8. Determination of (a) the amount of hydroquinone reducing agent to add for conversion of 3.04 x 10⁻⁵ mol Fe3+ L-1 solution to Fe2+, and (b) the speciation of a synthetic sample containing 2.95 x 10⁻⁵ mol Fe2+ L-1 and 1.52 x 10⁻⁵ mol Fe3+ L-1.
Further recovery experiments were conducted, involving speciation of iron in synthetic
samples containing known concentrations of Fe(III) and Fe(II) and analyzed for Fe2+ by the
procedures described in section 2.2.5. The purpose of these experiments was to check the
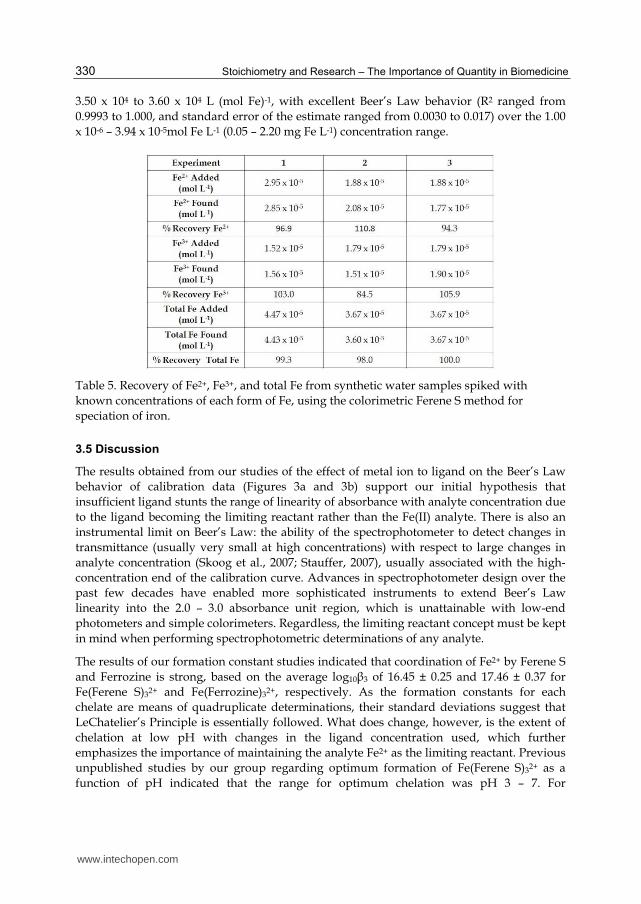
iron recovery and efficiency of reduction of Fe3+ to Fe2+. Table 5 gives the added and found
Fe2+, Fe3+, and total Fe concentrations (in mol Fe L-1) for three such recovery experiments,
and Figure 8b illustrates the absorbance-time curve obtained for one of these recovery runs.
The recoveries obtained for the forms of Fe in the samples are generally good, despite the
high recoveries of 110.8 and 105.9%, and the rather low recovery of 84.3%. The recoveries
suggest that complete Fe recoveries, and Fe(II)/Fe(III) speciation, are possible with this
method. In Figure 8b, there is a very small leveling point prior to addition of hydroquinone,
at which point apparent reduction of Fe3+ to Fe2+ was occurring, possibly promoted by
Ferene S. Our group plans to further investigate this tendency.
Average Fe(II) and Fe(III) results from the speciation of Fe2+ and Fe3+ in AMD samples
collected from a mine runoff tributary of Gillespie Run, and analyzed for Fe by the
procedure given in section 2.2.5, were found to be 33.7 ± 0.5 mg Fe2+ L-1 and 0.6 ± 0.2 mg Fe3+
L-1 for one sample, and 35.5 ± 1.0 mg Fe2+ L-1 and 0.7 ± 0.2 mg Fe3+ L-1 for a different sample.
These results suggest that the form of iron in AMD is mainly Fe2+, with a very small Fe3+
concentration present. Calibration slopes associated with these determinations ranged from
www.intechopen.com
Stoichiometry and Research – The Importance of Quantity in Biomedicine
330
3.50 x 10⁴ to 3.60 x 10⁴ L (mol Fe)-1, with excellent Beer’s Law behavior (R2 ranged from
0.9993 to 1.000, and standard error of the estimate ranged from 0.0030 to 0.017) over the 1.00
x 10-6 – 3.94 x 10⁻⁵mol Fe L-1 (0.05 – 2.20 mg Fe L-1) concentration range.
Table 5. Recovery of Fe2+, Fe3+, and total Fe from synthetic water samples spiked with
known concentrations of each form of Fe, using the colorimetric Ferene S method for
speciation of iron.
3.5 Discussion
The results obtained from our studies of the effect of metal ion to ligand on the Beer’s Law
behavior of calibration data (Figures 3a and 3b) support our initial hypothesis that
insufficient ligand stunts the range of linearity of absorbance with analyte concentration due
to the ligand becoming the limiting reactant rather than the Fe(II) analyte. There is also an
instrumental limit on Beer’s Law: the ability of the spectrophotometer to detect changes in
transmittance (usually very small at high concentrations) with respect to large changes in
analyte concentration (Skoog et al., 2007; Stauffer, 2007), usually associated with the high-
concentration end of the calibration curve. Advances in spectrophotometer design over the
past few decades have enabled more sophisticated instruments to extend Beer’s Law
linearity into the 2.0 – 3.0 absorbance unit region, which is unattainable with low-end
photometers and simple colorimeters. Regardless, the limiting reactant concept must be kept
in mind when performing spectrophotometric determinations of any analyte.
The results of our formation constant studies indicated that coordination of Fe2+ by Ferene S
and Ferrozine is strong, based on the average log10┚3 of 16.45 ± 0.25 and 17.46 ± 0.37 for
Fe(Ferene S)32+ and Fe(Ferrozine)32+, respectively. As the formation constants for each
chelate are means of quadruplicate determinations, their standard deviations suggest that
LeChatelier’s Principle is essentially followed. What does change, however, is the extent of
chelation at low pH with changes in the ligand concentration used, which further
emphasizes the importance of maintaining the analyte Fe2+ as the limiting reactant. Previous
unpublished studies by our group regarding optimum formation of Fe(Ferene S)32+ as a
function of pH indicated that the range for optimum chelation was pH 3 – 7. For
www.intechopen.com
Limiting Reactants in Chemical Analysis: Influences of Metals and Ligands on Calibration Curves and Formation Constants for Selected Iron-Ligand Chelates
331
Fe(Ferrozine)32+, the published pH range for optimum chelation is pH 3 – 9 (Gibbs, 1976;
McBride, 1980). The tendency of both ligands to readily chelate Fe2+ even at low pH values
was suggested by qualitative observations of formation of the indigo and magenta colors of
Fe(Ferene S)32+ and Fe(Ferrozine)32+, respectively, further suggesting that the 1:3 chelates are
formed preferentially, though incompletely, even at low pH. The pH titration curves for
Fe(Ferene S)32+ and Fe(Ferrozine)32+ at varying Fe(II):ligand ratios (Figures 7a and 7b)
provide some support for this hypothesis, as do the absorbance-pH formation curves
(Figures 6a and 6b) from the pH-spectrophotometric formation constant experiments. The
absorbance-pH formation curves show that for a typical Fe(II):ligand ratio, e.g., 1:4, that can
be used in colorimetric determinations of iron using either of these ligands, that a significant
absorbance (ca. 0.3 – 0.4) is obtained even at pH values as low as 1.20 (Figures 6a and 6b),
which signifies extensive chelate formation at such low pH. The pH titration curves for
Fe(Ferene S)32+ and Fe(Ferrozine)32+ at the 1:4 Fe2+:ligand ratio resemble strong acid-strong
base titration curves, suggesting that competition between Fe2+ and H+ for the coordination
site on the ligand occurs overwhelmingly in favor of Fe2+, leaving H+ to be titrated by
standard base. The indigo and magenta colors of Fe(Ferene S)32+ and Fe(Ferrozine)32+,
respectively, were already intense at the start of the titrations, even for the low Fe(II):ligand
ratios and added acid.
The application our group selected was the spectrophotometric determination of iron in natural waters, using a ligand that would yield lower detection limits for iron, particularly in consideration of the US Environmental Protection Agency (USEPA) mandated limit of 0.3 mg Fe L-1 for water (Heakin, 2000). The idea of using Ferene S was appealing due to the high molar absorptivity (published value of 3.55 x 10⁴ L mol-1 cm-1) (Higgins, 1981). The results given in Figures 8a and 8b, and Tables 3 – 5, suggest that the colorimetric Ferene S method is suitable for accurate and precise determinations of iron in natural waters, and that speciation of Fe2+ and Fe3+ in abandoned mine drainage is feasible with Ferene S. The portability of the Ferene S method has also made it useful in our attempts to determine iron in runoff from old coal mines on-site, in a “real-time” manner. The method has been microscaled so that solution mixing and absorbance measurements can be performed in the same 1-cm cuvet. The Ferene S reagent is not prohibitively expensive, is available from major chemicals suppliers, and is water-soluble. Portable, battery-operated clorimeters and spectrophotometers are inexpensive, low-maintenance, and yield reliable absorbance and transmittance measurements.
4. Conclusions, future directions
In this chapter, the concept of the limiting reactant in analytical chemistry was examined through studying the effects of the metal ion to ligand ratio on calibration curves, determinations of stoichiometries, and determination of formation constants for the iron(II) chelates of Ferene S and Ferrozine, two well known chelating agents for the spectrophotometric determination of iron in serum and other biomedical samples. The results of our studies for both chelates show that using insufficient ligand for spectrophotometric determination of iron produces premature deviations from Beer’s Law that are not instrumental but due to the ligand becoming the limiting reactant. The results further indicate that the formation constant of each chelate is relatively unaffected by changes in ligand concentration, but that the extent of complexation is influenced by
www.intechopen.com
Stoichiometry and Research – The Importance of Quantity in Biomedicine
332
increasing the concentration of ligand used. The results of our studies for the two chelates also indicate good agreement of molar absorptivities and stoichiometries with published values, and some disagreement with the published formation constant for Fe(Ferrozine)32+ due most likely to experimental differences in the methods employed. Finally, an application of Ferene S to the colorimetric determination of total and speciated (Fe2+, Fe3+) iron in natural waters was presented and discussed.
Future plans for this research include continuation of efforts toward further development,
implementation, and refinement of the field-portable colorimetric determination and
speciation of iron in natural waters using Ferene S. Work on using Ferene S for
spectrophotometric quantitation of iron in sample types other than natural waters continues
in our laboratory. Additionally, other ferroin ligands besides the two examined in this
chapter will be investigated for use in colorimetric quantitation of iron in various sample
types. Finally, ferroin ligands and other types of iron(II) and even iron(III) complexing
agents will be explored for pedagogical use in effective teaching of the limiting reactant
concept in analytical chemistry courses.
5. Acknowledgements
The authors gratefully acknowledge the moral and financial support of the University of
Pittsburgh at Greensburg in this endeavor. The generous support of the McKenna
Foundation, the Fisher Fund of the Pittsburgh Foundation, the Society for Analytical
Chemists of Pittsburgh (SACP), and the Spectroscopy Society of Pittsburgh (SSP) is
gratefully acknowledged for making this research possible. MTS thanks his wife, Resa, for
her moral support and patience during this work, his colleagues in the Chemistry
Department at Pitt-Greensburg for their support and input, his former and current research
students as well as the many students who enrolled in his analytical chemistry and
instrumental analysis courses over the past several years for their contributions to this
research, and to Mrs. Cynthia Genard for helping with administrative functions during the
last few weeks of manuscript preparation.
6. References
Alexandropoulos, I.; Komaitis, M. & Kapsokefalou, M. (2006). Effects of iron, ascorbate, meat, and casein on the antioxidant capacity of green tea under conditions of in vitro digestion. Food Chemistry, Vol. 94, No. 3, (February 2006), pp. 359-365, ISSN 0308-8146
Almog, J.; Hirshfeld, A.; Glattstein, B.; Sterling, J. & Goren, Z. (1996). Chromogenic reagents for iron(II): studies in the 1,2,4-triazine series. Analytica Chimica Acta, Vol. 22, pp. 203-208, ISSN 0003-2670
Argyri, K.; Komaitis, M. & Kapsokefalou, M. (2006). Iron decreases the antioxidant capacity of red wine under conditions of in vitro digestion. Food Chemistry, Vol. 96, No. 2, (May 2006), pp. 281-289, ISSN 0308-8146
Artiss, J. D.; Vinogradov, S. & Zak, B. (1981). Spectrophotometric study of several sensitive reagents for serum iron. Clinical Biochemistry, Vol. 14, No. 6, (December 1981), pp. 311-315, ISSN 0009-9120
Baird, J. K. (1999). A Generalized Statement of the Law of Mass Action. Journal of Chemical Education, Vol. 76, No. 8, (August 1999), pp. 1146-1150, ISSN 0021-9584
www.intechopen.com
Limiting Reactants in Chemical Analysis: Influences of Metals and Ligands on Calibration Curves and Formation Constants for Selected Iron-Ligand Chelates
333
Benson, R. L. & Worsfold, P. J. (1993). A flow-injection approach to the continuous monitoring of residual coagulants (aluminium and iron) in potable and treated waters. Science of the Total Environment, Vol. 135, No. 1-3, (August 1993), pp. 17-25, ISSN 0048-9697
Billo, E. J. (2001). Excel® for Chemists: A Comprehensive Guide, 2nd edition, Wiley-VCH, ISBN 0-471-39462-9, New York, New York, USA
Bjerrum, J. (1941). Metal Ammine Formation in Aqueous Solution, P. Haase & Son, OL 15056032M, Copenhagen, Denmark
Bjerrum, J. & Nielsen, E. J. (1948). Metal Ammine Formation in Aqueous Solution. VI. Stability and Light Absorption of Copper Ethylenediamine Ions. Acta Chemica Scandinavica, Vol. 2, pp. 297-318, ISSN 0001-5393
Brown, T. L.; LeMay, H. E. & Bursten, B. E. (2006). Chemistry: The Central Science, 10th edition, Pearson Education, Inc., ISBN 0-13-146489-2, Upper Saddle River, New Jersey, USA
Butler, J. N. (1998). Ionic Equilibrium: Solubility and pH Calculations, John Wiley & Sons, ISBN 0-471-58526-2, New York, New York, USA
Camberlein, E.; Abgueguen, E.; Fatih, N.; Cannone-Hergaux, F.; Leroyer, P.; Turlin, B.; Ropert, M.; Brissot, P. & Loreal, O. (2010). Hepcidin induction limits mobilisation of splenic iron in a mouse model of secondary iron overload. Biochimica et Biophysica Acta – Molecular Basis of Disease, Vol. 1802, No. 3, (March 2010), pp. 339-346, ISSN 0925-4439
Carter, P. (1971). Spectrophotometric Determination of Serum Iron at the Submicrogram Level with a New Reagent (Ferrozine). Analytical Biochemistry, Vol. 40, pp. 450-458, ISSN 0003-2697
Cheng, K. L.; Ueno, K. & Imamura, T. (1992). Handbook of Organic Analytical Reagents, 2nd edition, CRC Press, ISBN 9780849342875, Boca Raton, Florida, USA
Eperesi, C. A.; Nelson, D. E. & Stauffer, M. T. (2010). Preliminary Investigations of Correlations Between Total Mercury in Tuna and Quality Control, and Mercury Recoveries using Microwave Digestion. Spectroscopy Letters, Vol. 43, No. 7, (November-December 2010), pp. 597-601, ISSN 0038-7010
Foley, R. T. & Anderson, R. C. (1948). Spectrophotometric Studies on Complex Formation with Sulfosalicylic Acid. Journal of the American Chemical Society, Vol. 70, No. 3, (March 1948), pp. 1195-1197, ISSN 0002-7863
Gibbs, C. R. (1976). Characterization and Application of FerroZine Iron Reagent as a Ferrous Iron Indicator. Analytical Chemistry, Vol. 48, No. 8, (July 1976), pp. 1197-1201, ISSN 0003-2700
Harris, D. C. (2010). Quantitative Chemical Analysis, 8th edition, W. H. Freeman & Co., ISBN 978-1-4292-1815-3, New York, New York, USA
Harvey, Jr., A. E. & Manning, D. L. (1950). Spectrophotometric Methods of Establishing Empirical Formulas of Colored Complexes in Solution. Journal of the American Chemical Society, Vol. 72, No. 10, (October 1950), pp. 4488-4493, ISSN 0002-7863
Higgins, T. (1981). Novel Chromogen for Serum Iron Determinations. Clinical Chemistry, Vol. 27, No. 9, pp. 1619-1620, ISSN 0009-9147
Irwin, A. E.; DeRamos, C. M. & Stout, B. E. (1996). Solution and Solid State 13C NMR Studies of Alginic Acid Binding with Alkaline Earth, Lanthanide, and Yttrium Metal Ions. Humic and Fulvic Acids, Chapter 15, ACS Symposium Series, Vol. 651, (November 14, 1996), pp. 244-258, ISSN 0097-6156
Job, P. (1928). Formation and Stability of Inorganic Complexes in Solution. Annales de Chimie et du Physique, Vol. 9, pp. 113-163, ISSN 0365-1444
www.intechopen.com
Stoichiometry and Research – The Importance of Quantity in Biomedicine
334
Kellner, R. A. (1998). UV-Vis Spectrophotometry, Emission and Luminescence, In: Analytical Chemistry, Kellner, R. A.; Mermet, J.-M.; Otto, M. & Widmer, H. M., Eds., pp. 527-540, Wiley-VCH, ISBN 3-527-28610-1, Weinheim, Germany
Martell, A. E. & Motekaitis, R. J. (1992). Determination and Use of Stability Constants, John Wiley & Sons, ISBN 978-0-471-18817-9, New York, New York, USA
McBride, L. (1980). The Iron Reagents, 3rd edition, G. Frederick Smith Chemical Co., Columbus, Ohio, USA
McBryde, W. A. E. (1964). A Spectrophotometric Reexamination of the Spectra and Stabilities of the Iron(III)-Tiron Complexes. Canadian Journal of Chemistry, Vol. 42, No. 8, (August 1964), pp. 1917-1927, ISSN 0008-4042
Miller, J. C. & Miller, J. N. (1993). Statistics for Analytical Chemistry, 3rd edition, Ellis Horwood Limited, ISBN 0-13-030990-7, Chichester, West Sussex, United Kingdom
Riemer, J.; Hoepken, H. H.; Czerwinska, H.; Robinson, S. R. & Dringen, R. (2004). Colorimetric ferrozine-based assay for the quantitation of iron in cultured cells. Analytical Biochemistry, Vol. 331, No. 2, (August 2004), pp. 370-375, ISSN 0003-2697
Rossotti, F. C. & Rossotti, H. (1961). The Determination of Stability Constants, McGraw-Hill, New York, New York, USA
Skoog, D. A.; Holler, F. J. & Crouch, S. R. (2007). Principles of Instrumental Analysis, 6th edition, Cengage Learning, ISBN 9780495012016, Florence, Kentucky, USA
Smith, F. E.; Herbert, J.; Gaudin, J.; Hennessy, D. J & Reid, G. R. (1984). Serum Iron Determination Using Ferene Triazine. Clinical Biochemistry, Vol. 17, (October 1984), pp. 306-310, ISSN 0009-9120
Stauffer, M. T. (2007). Undergraduate Analytical Chemistry: To Use and Evaluate Organic Chelators for Spectrophotometric Determination of Iron. Spectroscopy Letters, Vol. 40, No. 3, (May-June 2007), pp. 439-452, ISSN 0038-7010
Stauffer, M. T.; Hunter, L. J. & Troncone, S. K. (2007). Determination of Iron in Abandoned Mine Drainage by UV-Vis Spectrophotometry and Flame Atomic Absorption Spectrophotometry. Spectroscopy Letters, Vol. 40, No. 3, (May-June 2007), pp. 429-437, ISSN 0038-7010
Stookey, L. L. (1970). Ferrozine – A New Spectrophotometric Reagent for Iron. Analytical Chemistry, Vol. 42, No. 7, (June 1970), pp. 779-781, ISSN 0003-2700
Thomas, M. (1996). Ultraviolet and Visible Spectroscopy, 2nd edition, John Wiley & Sons, Ltd., ISBN 0-471-96743-2, West Sussex, England, United Kingdom
Thompsen, J. C. & Mottola, H. A. (1984). Kinetics of the Complexation of Iron(II) with Ferrozine. Analytical Chemistry, Vol. 56, No. 4, (April 1984), pp. 755-757, ISSN 0003-2700
Viollier, E.; Inglett, P. W.; Hunter, K.; Roychoudhury, A. N. & Van Cappellen, P. (2000). The ferrozine method revisited: Fe(II)/Fe(III) determination in natural waters. Applied Geochemistry, Vol. 15, No. 6, (July 2000), pp. 785-790, ISSN 0883-2927
Vosburgh, W. C. & Cooper, G. R. (1941). Complex Ions I. The Identification of Complex Ions in Solution by Spectrophotometric Measurements. Journal of the American Chemical Society, Vol. 63, No. 2, (February 1941), pp. 437-442, ISSN 0002-7863
Yamamoto, M.; Nishida, A.; Otsuka, K.; Komai, T. & Fukushima, M. (2010). Evaluation of the binding of iron(II) to humic substances derived from a compost sample by a colorimetric method using ferrozine. Bioresource Technology, Vol. 101, No. 12, (June 2010), pp. 4456-4460, ISSN 0960-8524
www.intechopen.com
Stoichiometry and Research - The Importance of Quantity inBiomedicineEdited by Dr Alessio Innocenti
ISBN 978-953-51-0198-7Hard cover, 376 pagesPublisher InTechPublished online 07, March, 2012Published in print edition March, 2012
InTech EuropeUniversity Campus STeP Ri Slavka Krautzeka 83/A 51000 Rijeka, Croatia Phone: +385 (51) 770 447 Fax: +385 (51) 686 166www.intechopen.com
InTech ChinaUnit 405, Office Block, Hotel Equatorial Shanghai No.65, Yan An Road (West), Shanghai, 200040, China
Phone: +86-21-62489820 Fax: +86-21-62489821
The aim of this book is to provide an overview of the importance of stoichiometry in the biomedical field. Itproposes a collection of selected research articles and reviews which provide up-to-date information related tostoichiometry at various levels. The first section deals with host-guest chemistry, focusing on selectedcalixarenes, cyclodextrins and crown ethers derivatives. In the second and third sections the book presentssome issues concerning stoichiometry of metal complexes and lipids and polymers architecture. The fourthsection aims to clarify the role of stoichiometry in the determination of protein interactions, while in the fifthsection some selected experimental techniques applied to specific systems are introduced. The last section ofthe book is an attempt at showing some interesting connections between biomedicine and the environment,introducing the concept of biological stoichiometry. On this basis, the present volume would definitely be anideal source of scientific information to researchers and scientists involved in biomedicine, biochemistry andother areas involving stoichiometry evaluation.
How to referenceIn order to correctly reference this scholarly work, feel free to copy and paste the following:
Mark T. Stauffer, William E. Weller, Kimberly R. Kubas and Kelly A. Casoni (2012). Limiting Reactants inChemical Analysis: Influences of Metals and Ligands on Calibration Curves and Formation Constants forSelected Iron-Ligand Chelates, Stoichiometry and Research - The Importance of Quantity in Biomedicine, DrAlessio Innocenti (Ed.), ISBN: 978-953-51-0198-7, InTech, Available from:http://www.intechopen.com/books/stoichiometry-and-research-the-importance-of-quantity-in-biomedicine/limiting-reactants-in-chemical-analysis-influences-of-metals-and-ligands-upon-calibration-curves-and

© 2012 The Author(s). Licensee IntechOpen. This is an open access articledistributed under the terms of the Creative Commons Attribution 3.0License, which permits unrestricted use, distribution, and reproduction inany medium, provided the original work is properly cited.