Life history and production studies of Sialis californica ...
125
AN ABSTRACT OF THE THESIS OF KHAJA MOHAMMED AZAM for the DOCTOR OF PHILOSOPHY (Name) (Degree) in ENTOMOLOGY presented on (Degree) June 17, 1968 (Date) Title: LIFE HISTORY AND PRODUCTION STUDIES OF SIALIS CALIFORNICA BANKS AND SIALIS ROTUNDA BANKS (MEGALOPTERA:SIALIDAE) Abstract approved: Redacted for Privacy Norman H. Anderson Comparative ecological studies of Sialis californica Banks and Sialis rotunda Banks were made in Western Oregon from 1966 to 1968. Field collections for S. rotunda were made in fish holding pond at the Oak Creek laboratories, 5 miles west of Corvallis, Benton County, and for S. californica in enriched sections of Berry Creek experi- mental stream, 13 miles north of Corvallis. Life histories were determined in aquaria, in laboratory streams and the natural habitats. S. rotunda, predominantly a pond species, completed its life cycle in one year in all situations. S. californica, commonly a stream species, took one or two years depending on oviposition time and food availability. Both species were reared successfully in the laboratory through all stages of their life cycle. There are ten larval instars. The larvae are carnivorous and feed on insects and other small benthic organisms.
Transcript of Life history and production studies of Sialis californica ...

AN ABSTRACT OF THE THESIS OF
KHAJA MOHAMMED AZAM for the DOCTOR OF PHILOSOPHY(Name) (Degree)
in ENTOMOLOGY presented on(Degree)
June 17, 1968(Date)
Title: LIFE HISTORY AND PRODUCTION STUDIES OF SIALIS
CALIFORNICA BANKS AND SIALIS ROTUNDA BANKS
(MEGALOPTERA:SIALIDAE)
Abstract approved: Redacted for PrivacyNorman H. Anderson
Comparative ecological studies of Sialis californica Banks and
Sialis rotunda Banks were made in Western Oregon from 1966 to 1968.
Field collections for S. rotunda were made in fish holding pond at the
Oak Creek laboratories, 5 miles west of Corvallis, Benton County,
and for S. californica in enriched sections of Berry Creek experi-
mental stream, 13 miles north of Corvallis.
Life histories were determined in aquaria, in laboratory
streams and the natural habitats. S. rotunda, predominantly a pond
species, completed its life cycle in one year in all situations. S.
californica, commonly a stream species, took one or two years
depending on oviposition time and food availability. Both species
were reared successfully in the laboratory through all stages of their
life cycle. There are ten larval instars. The larvae are carnivorous
and feed on insects and other small benthic organisms.

Biweekly or monthly samples were collected from the two loca-
tions for density, biomass, growth rate and production studies.
Density and biomass of S. rotunda in the pond were much higher than
for S. californica in the stream. Enrichment with sucrose and urea
resulted in differences in density and biomass of S. californica
between the four experimental sections at Berry Creek. The
unenriched section usually had a high density but low or similar
biomass compared with the enriched sections which had few individuals.
The lower density in the enriched sections was associated with
unfavorable substrate conditions for early-instar larvae because of
dense mats of the filamentous bacterium, Sphaerotilus natans.
Larger larvae were not hindered by the S. natans filaments and had
rapid growth because food was abundant.
Production of both species was calculated by two methods:
(1) Ricker's (1946) method, the product of growth rate and mean
biomass; and (2) Allen's (1951) graphical method, using numbers
per m2 and mean individual weight at each sampling date, The
results from both methods were comparable, with the graphical
method usually providing a slightly higher estimate of production.
Annual production of S. rotunda in the pond was 13.18 Kilocalories/
m2. This was more than double the production of S. californica in
any of the sections of Berry Creek. In Berry Creek, the population
in the unenriched section had low growth rate but the density of larvae

resulted in high biomass and a comparable production to that in the
enriched sections. The accumulated annual production was:
unenriched, 4. 94 Kilocalories; enriched, 6, 34 Kilocalories.
The relationship between larval growth and food consumption
rate was established by experiments in laboratory streams during
summer and winter. These data were used to estimate food con-
sumption by field populations. In the pond, S. rotunda larvae con-
sumed 137 gms/m2/year. In Berry Creek, individuals in enriched
sections consumed one and half to two times more food than did
individuals in the unenriched section.

Life History and Production Studies ofSialis californica Banks and Sialis rotunda Banks
(Megaloptera:Sialidae)
by
Khaja Mohammed Azam
A THESIS
submitted to
Oregon State University
in partial fulfillment ofthe requirements for the
degree of
Doctor of Philosophy
June 19 69

APPROVED:
Redacted for PrivacyAssociate Professor of Entomology
in charge of major
Redacted for Privacy
Chairman of the Department of Entomology
Redacted for Privacy
Dean of Graduate School
Date thesis is presented June 17, 1968
Typed by Gwendolyn Hansen for Khaja Mohammed Azam

ACKNOWLEDGEMENTS
I am indebted to Dr. Norman H. Anderson, Associate Professor
of Entomology, for his counsel, guidance, constant encouragement
throughout the course of the investigation and for his editorial efforts
in the preparation of this thesis. Respectful appreciation is extended
to Dr. Paul 0. Ritcher, Chairman, Entomology Department, for his
many generous and valuable suggestions during the author's stay in
this Department.
Sincere appreciation to Dr. Gerald E. Davis, Associate
Professor, Fisheries and Wildlife Department, for his helpful sug-
gestions during the study. Thankful appreciation is extended to
Drs. Charles E. Warren, Paul Oman, for their helpful criticisms
and to Dr. Scott W. Overton for his statistical assistance.
Thanks to Dr. B. D. Burks, Insect Identification and Parasite
Introduction Research Branch, U. S. Department of Agriculture, for
identifying the parasite, to Dr. Robert Koontz for his photographic
assistance, and to my colleague, Richard Kimerle, for discussing
various aspects of research.
This research was supported in part by U. S. Public Health
Service Research Grant No. WP 157.

TABLE OF CONTENTS
INTRODUCTION
Page
1
MATERIALS AND METHODS 4
Oak Creek Fish Pond 4
Berry Creek Stream 5
Field Experiments 11
Cages 11
Pit-fall Traps 12
Laboratory Experiments 12Caloric Conversion 13
LIFE HISTORY OF SIALIS ROTUNDA AND SIALISCALIFORNICA 16
General Morphology 16Head 16Thorax 20Abdomen 20
Habitat Preferences 21Laboratory Life-history Studies 23
Egg Stage 26Larval Development 2 6
Pupal Stage 31
Adult Stage 32Field Life-history Studies 37
Egg Stage 37Larval Development 38
Pupal Stage 38Adult Stage 40
Growth, Length-weight and Length-headwidthRelationships 41
Analysis of Food and Feeding Habits 45
Food Habits in Natural Habitats 47
Parasites, Predators and Diseases 50
SUMMARY - COMPARISON OF LIFE CYCLE OF THETWO SIALIS SPECIES 55

Page
DENSITY, BIOMASS AND GROWTH RATES OF FIELDPOPULATIONS 57
PRODUCTION 70
FOOD CONSUMPTION 83
Laboratory Food Consumption Experiments 83Estimate of Food Consumption by Field Populations 89
DISCUSSION AND CONCLUSIONS 95
BIBLIOGRAPHY 103
APPENDICES 107

Figure1.
2.
3.
4.
5.
6.
7.
8.
9.
10.
11.
12.
13.
14.
LIST OF FIGURES
Diagram of Berry Creek Experimental Streamshowing research facilities.
Stream flow and maximum and minimum tem-perature in Berry Creek.
Page
6
9
Gorman-Rupp centrifugal pump sampler. 10
Laboratory stream at Aquatic EntomologyLaboratory, Oak Creek. 14
Mature larva of Sialis rotunda. 18
Mature larva of Sialis californica. 18
Structures of Sialis larva. 19
Adult of Sialis rotunda. 22
Egg mass of Sialis rotunda. 27
Egg mass of Sialis californica. 27
Hatching of egg mass of Sialis rotunda. 28
Pupa of Sialis rotunda. 33
Pupa of Sialis californica. 33
Copulation position in Sialis rotunda. 35
15 and 16. Growths of Sialis rotunda and Sialis californicalarvae in Aquarium, Laboratory Stream andField Cages.
17 and 18. Length-Weight and Length-Headwidth relation-ships in Sialis rotunda and Sialis californicalarvae.
43
44

Figure Page
19 and 20. Head-widths of all instars of reared Sialisrotunda and Sialis californica larvae. 46
21. Parasitized egg mass of Sialis californica. 52
22. Comparison of life-cycle of Sialis rotundaand Sialis californica in the field. 56
23. Numbers of Sialis rotunda larvae/m 2 in Pondduring May 19 67 to May 19 68. 58
24. Biomass of Sialis rotunda larvae/m2 in Pondduring May 19 67 to May 19 68.
25. Numbers of different age groups of Sialiscalifornica larvae/m2 in four sections ofBerry Creek from December 1965 toDecember 1967.
26. Biomass of different age groups of Sialiscalifornica larvae/m2 in four sections ofBerry Creek from December 1965 toDecember 1967.
27. Mean Weight of Sialis rotunda larvae at eachsampling interval in Pond from May 1967 toMay 1968.
28. Mean Weight of different age groups of Sialiscalifornica larvae in four sections of BerryCreek.
29. Graphical representation for Computation ofProduction of Sialis rotunda larvae in Pondby Allen's Method.
30. Monthly Mean Biomass, Production andAccumulated Production of Sialis rotunda larvaefor twelve months in Oak Creek Pond.
58
59
60
67
68
76
80
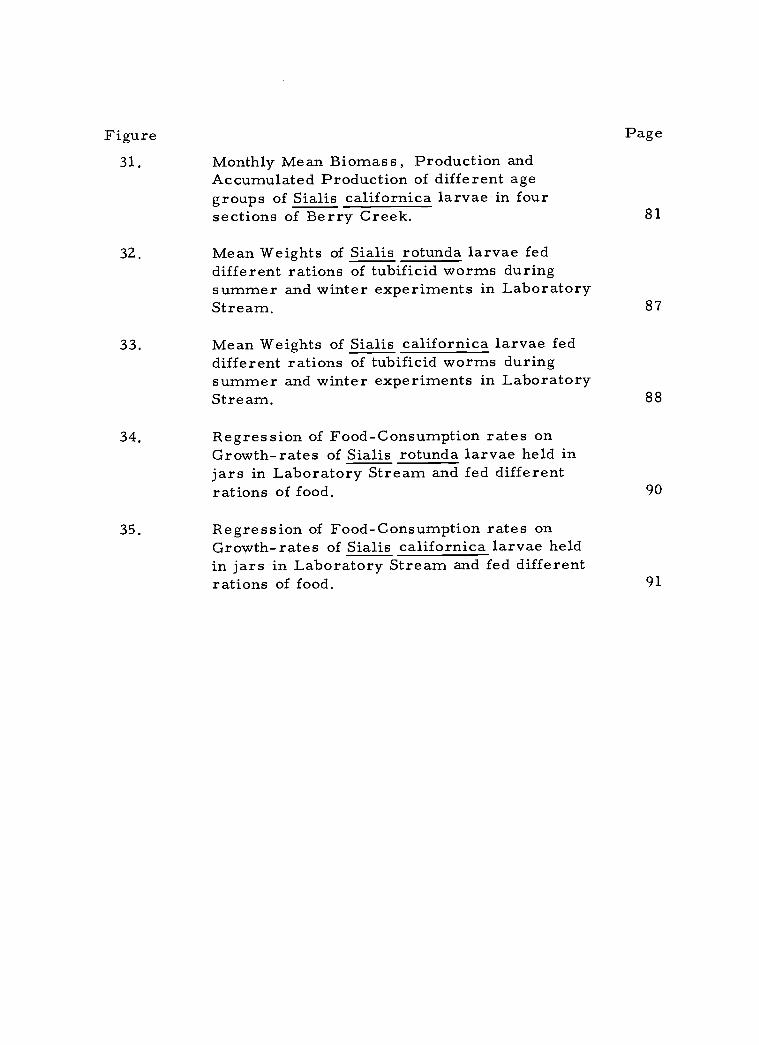
Figure31. Monthly Mean Biomass, Production and
Accumulated Production of different agegroups of Sialis californica larvae in foursections of Berry Creek.
32. Mean Weights of Sialis rotunda larvae feddifferent rations of tubificid worms duringsummer and winter experiments in LaboratoryStream.
33. Mean Weights of Sialis californica larvae feddifferent rations of tubificid worms duringsummer and winter experiments in LaboratoryStream.
34. Regression of Food-Consumption rates onGrowth-rates of Sialis rotunda larvae held injars in Laboratory Stream and fed differentrations of food.
35. Regression of Food-Consumption rates onGrowth-rates of Sialis californica larvae heldin jars in Laboratory Stream and fed differentrations of food.
Page
81
87
88
90
91

LIST OF TABLES
Table Page
1. Mean percent dry weight and mean caloric values pergram dry weight of experimental materials. 15
2. Distinguishing characteristics of the larvae ofS. rotunda and S. californica.
3. Size, weight, and duration of stages of S. rotundareared at 68°-74° F.
17
24
4. Size, weight, and duration of stages of S. californicareared at 68° -74° F. 25
5. Sex-ratio of S. rotunda from field collections. 41
6. Relative occurrence of identifiable organisms in fecalpellets of S. californica from the Metolius River. 49
7. Relative occurrence of identifiable organisms in fecalpellets of S. rotunda from Oak Creek pond. 49
8. Relative occurrence of identifiable organisms in fecalpellets of S. californica from experimental sections ofBerry Creek. 51
9. Growth rates, mean biomass, and production ofS. rotunda in Oak Creek pond during 1967-1968. 72
10. Daily growth rate, mean biomass, and productionof S. californica of GO
1in four sections of Berry
Creek. 73
11. Daily growth rate, mean biomass, and productionof S. californica of GO
2and GN
1in four sections of
Berry Creek. 74
12. Daily growth rate, mean biomass, and productionof S. californica of GN
2in four sections of Berry Creek. 75
13. Comparison of production of S. rotunda and S.californica by Ricker's method and Allen's method. 77

Table
14. Food received by S. rotunda larvae in laboratorygrowth-rate experiments.
15. Food received by S. californica larvae in laboratorygrowth-rate experiments.
Page
84
85
16. Estimate of food consumption of field populations ofS. rotunda in Oak Creek pond and S. californica infour sections of Berry Creek. 93
17. Comparison of production of Sialis spp. with estimatesfor other insects. 101
LIFE HISTORY AND PRODUCTION STUDIES OFSIALIS CALIFORNICA BANKS AND SIALIS ROTUNDA BANKS
(MEGALOPTERA:SIALIDAE)
INTRODUCTION
Aquatic insects are of direct economic importance in at least
three major respects: beneficial as fish food; harmful as blood-
sucking biting flies and potential carriers of diseases of man and
animals; and either beneficial or harmful in connection with water
pollution and sewage disposal. Aquatic insect larvae are generally
the most conspicuous and adaptive animals in the freshwater environ-
ment. In general, this is the energy-storing stage, and the stage at
which many of the restrictive habitat-partitioning mechanisms are
in effect.
To understand the role of insects in aquatic communities it is
necessary to recognize the species and to study their biology. Unfor-
tunately, such information is not available for most taxa. It is the
purpose of this study to provide such data for Sialis californica Banks
and Sialis rotunda Banks.
Biological studies of S. californica were initiated as part of a
larger program designed to elucidate the important energy pathways
in a woodland stream ecosystem. Warren et al. (1964), Reese (1966),
McIntyre (1967) and Earnest (1967) have reported on production of
various trophic levels in Berry Creek, Corvallis, Oregon.

2
S. californica was an abundant carnivore in the stream and possibly
a competitor for food with the fish. Thus the present study was under-
taken to assess the role of S. californica. When S. rotunda was found
nearby, it was decided to expand the research to include a comparison
of the two species.
The objectives of the study were: (1) to describe major
morphological and ecological differences between the larvae of S.
rotunda and S. californica; (2) to determine their life histories; (3) to
study the food habits of the larvae; (4) to obtain an estimate of the
production of the species in two habitats; and (5) to estimate food
consumption.
The Megaloptera are a small order of primitive insects called
alder flies and dobson flies, distributed throughout the temperate
and tropical regions of the world. This order is represented by only
two families, Sialidae and Corydalidae, the former with only one
genus, Sialis Latreille in the Nearctic region (Ross, 1937). Sialis,
the alder flies, are found throughout the United States and Canada
with a distinctive eastern and western grouping of species.
Previously no life history or production studies had been made
on S. rotunda or S. californica. The information in the literature on
the life history of other species of Sialis is meagre and confusing.
Most of the literature pertains to systematics and deals with identifica-
tion of adults.

3
The first description of a Sialis larva, S. fuliginosa Pictet, was
published over two centuries ago by Rosel in 1749 (Cuyler, 1956).
Needham and Betten (1901) and Davis (1903) gave biological data on
Sialis infumata Newman, while the bionomics of the common European
species, Sialis lutaria L. was described by Lestage (1918), Syms
(1934), and Dubois and Geigy (1935). The latter represents the only
thorough investigation with a complete account of development and
metamorphosis as well as extensive information on the habitat of the
larva. Ross (1937) contributed a monograph of the Nearctic genus
Sialis and briefly summarized observations made previously by other
workers. Townsend (1939) and Flint (1964) have described four new
species of Sialis. Cuyler (1956) recorded 20 species of Megaloptera
in Eastern United States. He listed 13 species of Sialis and described
two larvae, S. itasca and S. americana. He gave a very brief
description of the habitats where the larvae were collected.
Most of the freshwater production studies have dealt with fish
populations. A few studies provided estimates of the relative turn-
over in insect populations, eg. Anderson and Hooper (1956), Dugdale
(1955), Hayne and Ball (1956), and Waters (1966).

4
MATERIALS AND METHODS
Oak Creek Fish Pond
Population studies of S. rotunda were made in a small fish
holding pond near Oak Creek Fisheries Laboratory, five miles west
of Corvallis. The pond was dug in 1960 and, until 1964, was fertilized
for fish studies. The only fish in the pond during the present study
was the Western mosquito fish, Gambusia affinis (Baird and Girard).
The pond is almost circular with a surface area of 70 square
meters and a maximum depth of 65 cms. Water level was maintained
through its supply from a spring-fed stream. Water temperature was
recorded on a Taylor Weather-Hawk thermograph. The vegetation
around the pond was alder (Alnus spp.), willow (Salix spp.), rushes
(Scirpus spp. ) and sedge (Cyperus spp.).
Samples were taken from May 1967 to May 1968. Four samples
were taken with a six-inch Ekman dredge at approximately two week
intervals from May to November and at monthly intervals from
November to May. Samples were collected on 18 sampling dates
during the total study period.
The samples were taken to the laboratory where they were
washed through a 60-mesh sieve and the larvae were sorted from the
debris. Measurements of length, head-width and weight were made

5
for each individual. The larvae were kept in a refrigerator for two
days in bottles with some water, to collect the feces for food habit
studies, and then returned to the pond.
Berry Creek Stream
The field work for S. californica was initiated at Berry Creek,
a small woodland stream that has been described in detail by Warren
et al. (1964). It is located approximately 13 miles north of Oregon
State University campus and flows in a general northerly direction
into Soap Creek, which enters the Luckiamute River, a tributary of
the Willamette River, draining foot-hills along the western edge of
the valley. A 1,500 foot section of the stream has been brought under
flow control by means of a diversion dam and a bypass channel. Water
enters the experimental stream through a regulating valve. The flow
is continuously recorded at two V-notch weirs, one immediately below
the dam and the other where the water leaves the experimental section
(Figure 1). The lower third of the controlled part of the stream has
been divided into four experimental sections, each consisting of a
riffle and a pool, numbered I, II, III, and IV proceeding downstream.
At the upstream end of each section, Saran screens (32 meshes/in.2)
supported by box-like structures have been fixed to prevent the move-
ment of fish, most of the insects and other organisms from one
section to another. The pool areas of the sections I, II, III, and IV,

/ \....` I --": .... -- \
io' ,- -; - `... ...,-,... .....
,,,./ ,..... ....
-...
P_Lo--1---( ss e04\`.. 44 \
N. ..\...... 04..........
`...` / r ...`N. .0 .....\ .0 ......\ ,\ -..
Ns N.Ns \\
o', I.ttcy" FENCEBARBED CONS MINT TEINIIERATuRE EXPENNEEN
I
AND MICROSCOPY LBORATORY (0 wATER STONCE .9 I
--,
MUM AND NUTRIENT ADDITION FACILITY/ f I Li R } ., T.......,,c0, (
..----,
PLO. RECORDER
AQUARIUM SNECE NMIRE - ENCLOSEDENCLOSED /..1n
/s..e..c.,-...,
... R'.., .....
--...-
-",250 GALLON
FOOT ONDGE
STOCK TOAK 5 ---
)ISM SCREEN sIcISF:1421,05 _INSECT ..,,, X::,,G, ..0 < " , ..............--.. ..--..
,c`,,,C -1'...-....4), , -7 0 F5.1 MN() INSECT /". ''''''..., 0-----.... /
O:'''..';.K.., I. ( ( ......,...io,,L, ---
N ...MA re.-...
RAP ,,,,,,,, - - , -..-.. -0 S .ErNS°
f '"- .....5.!..-;'./ C.0", , .....
FOOT Wu OGE
. 'T."-..\
.\/,... /. .5
,M ',S.SSEEN \IZT:3''% 1 01,_
\ -- ..... , -, .... l TTN.............. .---
E SECT ON = T.11'''.7-.A.,,
,k,,, .... ( -__
%NSE.ckA.N...7: 'i. "--,P ,s(-:.. ...-
IS\0,
F 5 N --:
- SrOP --------
.:',2;''ClAT':.7:- ----;C-.\....0'//-- --(-- ' \-. 'I ';:s>:7-. '-'
r ?to' ,--, /..,../.--":s,..,..,' .. ,_...
,,.- s,>/EL roor PAT! --j- .\ \'°'''' C".:'''.....-
...... ...)..... ),MAN 1 T NANCE
\ II ,:, ,ChOP REMOVED) !EC4 r'..°Z,,,F,,,,,,E, \,_..-.' .....2,.,... (CHOPY ,MOVE01 _,;.1,-047 OIL Mq,CHED ':'''''. ' S,LENS ,-- F 00 T RP 1 , :./..----- '''''''',...1--1- -7Q:._ \I.-7cl' --:,- --,-;
o, (I FOOT DMDC E-'
''. CIRCE''' 'II.' 7 ,i'
\l ,--........._ , , OAF GROVE
r -) y
rr,",:/',,---.,,,-- _.), 0 .,,T.0 s,----.,\-":.'
---.:-.-........... , , ECI -..-
/-PYIN,EL$OME TER
r"1 C r
lb 1,_
.) \ (I.... DOUGLAS Ftq .:,,,,,,
...)
,"-....,,.....,........,l. .....2.2..............
4 0 0220-110 v,.-,...r POKER LINT
0
111
111NOTE DENSE CANOPY OF MAPLE. ASM. FIR.
OAR AND ALDER BORDERING STREAMEXCEPT WHERE REMOVED FOREXPERIMENTAL PURPOSES 111.=.1.1=11.:=1111.=
0 100 200SCALE - FEET
BYPASS CANAL 100 CFS CAPACITY FOR 50 YEAR FLOOD
Figure 1. Diagram of Berry Creek Experimental Stream showing research facilities.
LINEDCANAL 4 TAE

7
where the present studies were made are 24. 49, 15. 42, 15.85 and
17.76 m2, respectively.
A major objective of the Berry Creek project is to measure
trout production with different amounts of enrichment. Since 1960,
sectionsIII and IV had been enriched by introducing solutions of
sucrose and of urea at the upstream end of section III at an approximate
concentrations of 4.0 and 0.5 mg/liter, respectively. Enrichment
resulted in dense growths of the filamentous bacterium, Sphaerotilus
natans. This nuisance organism is common in streams polluted with
organic wastes. The importance of Sphaerotilus in the food chain at
Berry Creek has been extensively discussed by Warren et al. (1964).
The point of introduction of solutions was moved to the upstream end
of section II in March 1965. Part of forest canopy over sections II
and IV had been removed during earlier studies to determine the effect
of light intensity and quantity of leaf fall on the stream community.
The stream is shaded by red alder (Alnus rubra Nutt. ), big leaf
maple (Acer macrophyllum Pursh.), Oregon white oak (Quercus
garryana Dougl.), black cottonwood (Populus trichocarpa Torr. and
Gray), and Oregon ash (Fraxinus latifolia Benth).
Further changes were made during the present studies. When
the study began in May 1966, the stream was in the above described
condition. In February 1967, it was flushed by blocking the diversion
canal and channelling all of the flow through the experimental section.

8
The freshet removed the accumulated debris from the stream and
greatly reduced the population of Sialis and also other organisms.
Enrichment of all sections was completely stopped after this time.
In September 1967, screens between the sections were removed which
allowed the free movement of organisms from one section to another.
Stream flow through the controlled sections was maintained at
0.5 cu. ft. /sec. except during low flow in the summer months. Water
temperature was recorded throughout the period of study by a
thermograph. Figure 2 represents the record of water flow and
temperature.
Monthly samples of S. californica were taken from the pools,
I, II, III, and IV from May 1966 to December 1967. Samples taken
by Dr. N. H. Anderson from December 1965 to April 1966 have also
been included in the results.
At the beginning of the study, samples were collected using a
rectangular box enclosing 0.23 m2 bottom area. The bottom of the
sampler had a four-inch layer of foam rubber to give a tight fit on
the substrate. The substrate of the enclosed area was removed with
an aquatic net. With this method we were not able to collect early-
instar larvae. An improved technique that was efficient in collecting
all larvae was the pipe sampler (Figure 3). The sampler consisted
of a one meter length of aluminum irrigation pipe that enclosed an
area of 0.029 m2. The pipe had five holes evenly spaced throughout

70
60
50
Stream temperatureA y, Stream flow
30
D J FMAM1965 1966
A S 0 N D J
1967F MAM
1ASOND J F
1968
Figure 2. Stream flow and maximum and minimum temperature in Berry Creek,
2. 0
1. 8
1. 6
0. 8
0. 6
0. 4
0. 2
o

Figure 3. Gorman-Rupp centrifugal pump sampler.

11
its length, plugged with rubber stoppers. One end of the pipe was
fixed with foam rubber to form a seal on the substrate. When the
sampler was in place, a Gorman-Rupp centrifugal pump, fitted with
two cm tubing was used to pump out the material from the area
enclosed. Timely removal of the rubber stopper immediately below
the water level permitted the replacement of water evacuated by the
pump. The outlet tubing from the pump was placed in a 50-mesh wire
bucket to collect the sample.
On each sampling date, 14 samples were collected: 8 from
section I, 5 from section II, 5 from section III, and 6 from section IV.
Each sample was placed separately in a bottle and taken to the
laboratory where they were washed, sorted, and measured in the same
manner as described for S. rotunda. These larvae were also kept in
the refrigerator for two days to collect the feces and then returned to
their respective stream sections.
Field Experiments
Cages
To determine the length of the larval stage under field condi-
tions, cages of 60 cm X 45 cm X 45 cm were kept in the pond and the
stream. The cages were wooden frames covered on the sides and
bottom with 0. 333 nitex screen. One cage was set up with natural

12
substrate on July 10, 1967, in the pond with 20 larvae of S. rotunda,
and two cages in the stream on December 22, 1966, with 12 larvae of
S. californica in each cage. Food was added approximately two to
three week intervals and the larvae were measured at the same time.
Tubificid worms from a culture maintained at Fisheries Laboratory
were put into the cage as food for S. rotunda. At Berry Creek, the
substrate was collected from the pools, washed through sieves and the
organisms obtained in this way were used as food for S. californica.
Pit-fall Traps
To collect the larvae leaving the water to pupate, two 3 foot-
boards were inserted into the soil in the form of V near the edge of
water. A jar with some soil was kept at the junction of two boards
where the two arms of the V unite. The larvae leaving the water from
the open side migrated and fell into the bottle. The width of the
opening at the water's edge was three feet, so each trap collected
the larvae migrating from a known length of pond or stream side.
Laboratory Experiments
Laboratory experiments were conducted in an aquarium with a
temperature range of 68°-74°F. throughout the year, and in a
laboratory stream with great daily and seasonal fluctuations.
The laboratory stream is located at the Aquatic Entomology

13
Laboratory at Oak Creek. It consists of a divided wooden trough,
measuring 234 X 30 X 24 cm through which the water is recirculated
(Figure 4). A water current was maintained by a 51-cm paddle wheel
driven by an electric motor. Water temperatures were recorded with
a thermograph. The rearing jars used in laboratory stream had
openings of 5.0 cm X 2.5 cm on each side. The windows and tops
were covered with 0. 333 nitex screen, which permitted the water to
flow through the jars. Two or three small rocks were put in the jars
to simulate a more natural habitat.
Life cycle studies of S. rotunda and S. californica were made
in the aquarium with constant air bubbling and also in the laboratory
stream. Food consumption studies were conducted in the laboratory
stream in different seasons.
Larvae were reared through all instars in small jars, submerged
in water. They were taken out of the water when ready to pupate and
placed individually on damp soil. The adults were enclosed in screen
cages of 20 cm X 20 cm X 45 cm for mating and oviposition.
Caloric Conversion
Growth rates, biomass, production and food consumption values
were converted into caloric equivalents. A Parr semi-micro bomb
calorimeter No. 1411 was used for these determinations.
The mean percent dry weights and mean caloric values

14
Figure 4. Laboratory stream at Aquatic EntomologyLaboratory, Oak Creek.

15
determined for the materials used in the experiments are given in
Table 1.
Table 1. Mean percent dry weight and mean caloric values per gramdry weight of experimental materials.
MaterialsPercent dry Kilocalories per gm dry weight
weight Range Mean
S. rotunda larvae 1 6. 2 5. 312-5. 352 5.332
S. californica larvae 18. 2 5. 376 -5. 419 5.398
Tubificid worms 1 6. 2 5. 336-5. 98 6 5.491
From Brocksen et al. (1968).

16
LIFE HISTORY OF SIALIS ROTUNDAAND SIALIS CALIFORNICA
General Morphology
Though the mature larvae of S. rotunda and S. californica can
be readily distinguished by color patterns, the younger larvae cannot
be separated in this manner. A comparative study revealed few
morphological characters that would separate the two species, other
than the shape of the labrum. Distinguishing features are given in
Table 2 and the mature larvae are compared in Figures 5 and 6.
The following description of larvae of S. rotunda and S.
californica gives the characters thought to be of generic significance.
Head (Figure 7a)
Prognathous, quadrate, flattened, smooth and shiny; each
lateral eye spot with six ocelli; antenna (Figure 7b), four-segmented,
basal segment 0. 3 mm, shorter and wider than others, second
segment 0. 6 mm, third segment 0. 38 mm and fourth segment
0. 38 mm; epicranial suture, distinct, the frontal arms originating
approximately 2/3 distance from base of head to epistomal suture;
occipital suture incomplete on dorsal side; clypeus narrow, apical
margin elevated laterally; labrum (Figure 7c), semicircular, pro-
duced apically into a bifid flap, antero-lateral margin crenulated;
17
Table 2. Distinguishing characteristics of the larvae of S. rotundaand S. californica.
Characters S. rotunda S. californica
Head
Labrum
Thorax
Abdomen
Tracheal gills
Size range(mature larvae)
Light to dark brown withslight blackish tinge;uniform on all portions ofhead.
Apex bifid (cleft), distalmargin with 11-12 crenula-tions on each side, deeperthan S. californica.
Dark brown with mid-dorsal furrow.
Black with a prominentmedian whitish band fromfirst to last abdominalsegment. Intersegmentalmembrane and bases ofgills light.
Whitish.
14-18 mm.
Light to dark brown,anterior portion fromfrontal arms darkerthan posterior portion.
Apex bifid, 12-13shallow crenulationson each side.
Brown with mid-dorsal furrow.
Uniform reddishbrown.
Slightly pigmented.
16-22 mm.

18
Figure 5. Mature larva of Sialis rotunda.
Figure 6. Mature larva of Sialis californica.

LabrumClypeus Mandible
a. Head
d. Mandible
Coxa
Ocelli
Epicranialsuture
Occipitalsuture
1-0 mm
Trochanter
Femur
0.5 non
Palpus
g. Leg
Tibia
Tarsus
1-" nye,
19
c. Labrum
e. Maxilla
Lacinia
Palpus
Li gulo .-
Mentum
Submentum
f. Labium
h. Abdomen
Figure 7. Structures of Sialis larva.
14 non
0-5m,
20
mandible (Figure 7d), large, pointed at apex, convex on outer margin,
with two large teeth on mesal margin; maxillae (Figure 7e), well
developed, each possessing a cardo, stipes, 2-toothed lacinia, cone-
shaped galea and a four-segmented palpus; labium (Figure 7f), narrow,
consisting of submentum, mentum and ligula; labial palpi 3-segmented.
Thorax
Pro-, meso- and meta notum sclerotized with a mid-dorsal
furrow and much broader than long; meso- and metanotum slightly
concave anteriorly and convex posteriorly; a pair of minute spiracles
in membrane between pro- and meso-thorax. The three pairs of legs
are clothed with rows of long and short setae and similar in structure;
coxa flattened and long; tarsus with a pair of unequal claws (Figure 7g).
Abdomen
Robust, ten-segmented, broadened anteriorly and tapering
posteriorly to a caudal filament. First seven segments with thin
walled, segmented gills (or filaments), bearing a few long setae and
traversed by trachae; gills four-segmented on segments 1 and 2,
and five-segmented on segments 3 to 7. Segment 10 (Figure 7h),
broad at base with two furrows originating from base and extending
posteriorly for a short distance; segment terminating in a long,
flexible median setiferous filament.

21
The adults of both the species are similar in form and smoky-
black in color, but S. rotunda is much smaller than S. californica and
slightly lighter in color (Figure 8). Genitalia provide the best
characters for separation of species, although other characters are
of value. Ross (1937) described the characteristics of adults of
Nearctic species.
Males of S. rotunda can easily be separated from S. californica
males. In the former, the head is elevated between the eyes, forming
a ridge bearing a blunt point surmounted by a conspicuous, thick tuft
of black setae. In S. rotunda the clypeus also has a similar tuft of
setae, but this is absent in S. californica.
Habitat Preferences
According to published reports, Sialis larvae occupy a wide
range of habitats. Davis (1903) and Ross (1937) stated that the larvae
of various species of Sialis inhabit a variety of fresh water situations,
including small streams, large rivers and lakes, and for the same
species it may be equally variable. Dubois and Geigy (1935) found
S. lutaria in a Swiss lake where the bottom consisted of chalk with
sparse vegetation and Miall (1895) reported the same species from
both mud-bottomed ponds and slow streams. Needham and Betten
(1901) stated that the larvae of American species occur in weedy and
trashy areas. Davis (1903) found larvae of S. infumata in

22
Figure 8. Adult of Sialis rotunda.

23
sandy-bottomed streams.
In the present study S. rotunda and S. californica were found
to occupy different habitats. S. rotunda was collected from ponds and
other lentic situations with a muddy substrate, whereas S, californica
has been collected mostly in pools in streams. Collections from
locations other than the study sites have further confirmed this
ecological separation of the two species. However, in some sites
the larvae do occur together. For example, in a backwater of the
Metolius River where the water velocity was slow and organic debris
had accumulated both species were obtained.
A record of water depth and substrate was kept of the places
where samples were taken in routine collections at Berry Creek and
Oak Creek pond. Larvae of both species were obtained\ from the
water depths of 5 cm to 65 cm, but maximum numbers were present
at a depth of 15 cm to 25 cm.
Laboratory Life-history Studies
The eggs of both species were collected in the field in June 1966
and rearing of all stages was conducted in aquaria and laboratory
streams for determination of the life cycle.
Measurements of different stages and durations of egg stage,
different larval instars, pupal and adult stages are summarized in
Tables 3 and 4 for S. rotunda and S. californica respectively.

Table 3. Size, weight, and duration of stages of S. rotunda reared at 680-740F.
No. ofspeci-
Body length (mm) Head width (mm) Weight (mgs) Duration of stages (days)
Stage mens Min. Max, Mean Min. Max. Mean Min. Max. Mean Min. Max. Mean
Egg 12 8 10 8,3
Larvalinstar I 14 1. 13 1.20 1. 16 0.26 0.30 0. 29 0.03 0.03 0.03 10 14 12. 2
II 11 1.50 1.90 1.69 0.30 0.38 0.35 0.11 0.11 0.11 12 16 14.6
III 9 1. 75 2. 40 2. 17 0.38 0. 53 0.45 0.20 0.20 0.20 5 7 6. 0
IV 9 2. 25 3.20 2. 60 0. 45 0.60 0. 53 0.45 0.45 0. 45 5 8 5.5
V 9 3. 50 4. 10 3.82 0; 53 0, 68 0.62 0.56 1.20 0.94 7 9 7.6
VI 9 4.20 5. 10 4. 74 0. 68 0. 83 0. 77 1.05 2. 45 1. 85 6 10 7. 3
VII 9 5.02 6.00 5. 31 0. 75 0. 98 0. 91 1. 80 3. 65 3. 45 5 11 8. 5
VIII 9 6. 50 8.00 7. 22 0.98 1.20 1.08 4.43 7. 90 5. 80 16 35 28.0
IX 8 8.00 11.50 10. 89 1. 28 1. 58 1. 44 7. 90 22. 8 15. 59 30 53 47.0
X 8 12.00 16.50 13.8S 1. 80 2.48 2.07 23.70 55.90 37. 90 35 108 88. 14
Pupa 21.20 5 7 5.4
Adult Male 4.944 7 5.0
Female 7.88

Table 4. Size, weight, and duration of stages of S. californica reared at 68°-74° F.
No. ofspeci- Body length (mm) Head width (mm) Weight (mgs) Duration of stages (days)
Stage mens Min. Max. Mean Min. Max. Mean Min. Max. Mean Min. Max. Mean
Egg 12 8 12 8. 4
Larvalinstar I 11 1. 13 1. 20 1. 18 0. 26 0.30 0.29 0.03 0.03 0.03 10 14 11. 6
II 9 1. 58 1. 80 1. 67 0. 30 0.38 0.36 0. 11 0. 11 0. 11 10 17 13. 8
III 9 1. 80 2.78 2. 30 0.4S 0.53 0. 47 0.20 0.20 0.20 4 6 5. 2
IV 8 2.25 3. 20 2, 65 0. 53 0, 60 0.57 0.65 0.65 0.65 4 9 5. 9
V 8 3.50 4.50 3.90 0.68 0.75 0.70 1.25 1.95 1.70 5 9 5.9
VI 8 5.00 6.00 5. 40 0. 83 0. 98 0. 88 3. 20 4. 75 4.3S 5 8 6. 8
VII 8 6.00 7.50 6. 90 1. 05 1.28 1. 17 4. 35 7.40 6. 30 7 10 8. 5
VIII 7 9. 00 10. 50 9. 80 1, 50 1.65 1.59 8.60 19. 75 15. 85 21 46 32.0
IX 7 11. 50 13.00 12. 30 1. 80 2. 10 1. 95 21.20 39.60 30. 20 65 87 76.0
X 7 15. 50 17.00 16. 40 2. 40 2. 93 2.57 48. 40 80. 50 68. 50 81 124 101.0
Pupa 44.60 5 8 6.6
Adult Male 6. 454 8 5.0
Female 12.63

26
Egg Stage
Eggs of both species are cylindrical, rounded at the top and
with a curved process. The egg masses of the two species can be
easily differentiated. S. rotunda eggs are laid in an almost vertical
position (Figure 9) and the number of eggs in each mass ranges from
300 to 500. Freshly laid eggs are brown, turning to dark brown as
they develop. S. californica eggs are laid in a slanting position with
most of the surface area exposed (Figure 10) and each egg mass con-
tains 400 to 700 eggs. Freshly laid eggs are pale in color and
become brown near hatching.
The eggs of both species hatch within 8 to 12 days, depending
on the temperature.
In the laboratory, the eggs were kept in petri plates with moist
blotting paper. Hatching takes place during the night, very often
between 10 and 11 p.m. Practically all of the larvae emerge
simultaneously (Figure 11), by tearing a slit in the micropylar end
with their head and legs.
Larval Development
There are no published records of Sialis spp. being success-
fully reared for a complete generation, so accurate data were not
available on the durations, and the differences in size and structure

Figure 9. Egg mass of Sialis rotunda.
Figure 10. Egg mass of Sialis californica.

28
'4144'ciT
. 41.**;titA: reI I, V. if
'11A.
ft Weak. NF...*NO e-s Allow -
,1.*
40,0 /111111.1. VIM a, ...10.140111010111
+OP
4111.
Figure 11. Hatching of egg mass of Sialis rotunda.

29
of the successive instars. Dubois and Geigy (1935) failed to rear
S. lutaria through its stages and resorted to comparative measure-
ments of larvae dredged from the lake. Such difficulties in the past
led to different conclusions by different workers in regard to the
larval period and number of instars. In the present studies, no dif-
ficulty was found in rearing Sialis through all stages. The number of
instars and the duration of each is given in Tables 3 and 4. Though
mortality was high in the first instar, several hundred larvae were
reared individually during this study.
The first-instar larvae were quite active from the time of
hatching and spent most of the time swimming. Their bodies were
almost transparent and tracheal trunks could easily be seen extending
along each side. They possess all of the appendages. The gills and
antennae were segmented as described earlier for full grown larvae.
They were provided with finely chopped tubificids as food. Though
they grasped food with the mandibles, food consumption was minimal
and most of the development in this instar depends on food reserves
from the egg. The alimentary canal can easily be seen through the
transparent cuticle and usually it was empty.
The second-instar larvae were similar to the first instar, with
a slight increase in length and head-width. The alimentary canal
was noticeably distended after feeding on tubificids. There was no
development in coloration, so it was still not practicable to separate

30
the larvae of the two species. Though the larvae swim frequently,
they were less active than the first-instar larvae. The duration of
these two instars was longer in both species compared to next five
instars (Tables 3 and 4).
The third-instar larvae developed coloration and the species
could be separated by microscopic observation. S. rotunda larvae
developed a light black color and S. californica, a slight pinkish tinge.
They do not swim as much and mostly stay at bottom of the jar resting
or walking. They fed on small tubificids which did not have to be
chopped.
The other larval instars had a progressive increase in intensity
of coloration. From the fourth instar onward the species could be
recognized without using a microscope. The size and amount of food
was increased as they grew. On an average they required three or
four tubificids (about 0. 6 mg per worm) in the later instars.
Moulting generally took place during the night, but at times
occurred during the day. In moulting, the cuticle splits along the
dorso-median line of the head, prothorax and mesothorax. The head
and the thorax were drawn out first, then the legs and finally the
abdomen. The newly moulted larva was very soft and whitish on the
head and body, changing to the characteristic color and becoming
sclerotized within few hours.
Individual rearing in aquaria showed that there were ten larval

31
instars in both species. Mean duration of the larval stage was 204
days for S. rotunda and 275 days for S. californica when reared at
68°-74°F. However, because these specimens were reared at a
high temperature and had an excess of food provided, the rate of
development was presumably faster than it would be under field con-
ditions.
Results from rearings in the artificial streams in an unheated
building more closely approximate field conditions. This study
started on September 20, 1966, with twelve individuals of each species,
using window jars described earlier through which the water flows
constantly. Food was provided in the same way as for larvae in
aquaria. The larvae used at this time were not newly hatched but had
completed their early development in the field. Both the species
completed their life cycle the following spring so larval development
was slower than under aquarium conditions. S. rotunda started
pupating in March and all individuals pupated by early May 1967,
whereas S. californica pupated by early June. Growth in these con-
ditions is compared with growth in field cages in Figures 15 and 16.
Pupal Stage
Under laboratory conditions, the mature larvae could not leave
the water to pupate, so some mortality occurred at this stage. Care-
ful observation revealed a characteristic type of behaviour that

32
enabled me to detect the specimens that were ready to pupate.
The larvae did not feed, became sluggish and curled up on their
side. When such changes were observed, the larvae were taken out
of water and kept in a jar of soil where they transformed to pupae
within two to three days. Pupation usually took place during the night.
Freshly-moulted pupae of both species had almost the same
color and body shape as the larvae, except they possessed wing pads
and lacked tracheal gills. Figures 12 and 13 show the pupae of
S. rotunda and S. californica respectively. The pupae do not form
any cocoon and lie with body curled within the pupal cell. Near
emergence the pupae became black and adults emerged within five
to eight days in both species.
Adult Stage
In the laboratory, adults emerged at different times of the year.
The first adult of S. rotunda was obtained in October 1966 and of
S. californica in February 1967. After that time, many adults
emerged, with maximum emergence in April-May.
The adults reared in the laboratory were confined in screened
cages with small twigs of plants and some water, and mating behavior
and oviposition were observed.
Copulation has also been studied and described for other Sialis
species by Killington (1932) and Dubois and Geigy (1935). In addition,

33
Figure 12. Pupa of Sialis rotunda.
Figure 13. Pupa of Sialis californica.

34
Geigy and Dubois (1935) studied the physiology of senses of S. lutaria
to determine the factors which direct the males towards females.
The antennae and labrum were regarded as the most likely loci of the
perceptive organ. He mentioned that when the labrum was amputated,
the males pursued the females only when they chanced to encounter
them and then only dilatorily, and without affecting copulation. When
both the labrum and the antennae were removed, the males lost com-
pletely their ability to orient themselves without reference to the
female.
The ovaries of the females and the testes of males are mature
when they emerge. Several males pursue a female and attempt to
force themselves underneath the female as she walks around. After
one male is chosen, the pair face each other and vibrate their
antennae for a few seconds, after which the female moves a short
distance, followed quickly by the male. The male goes head-first
under the tip of the female's wings. If his advances are accepted,
the female stops, and the male takes his position below her abdomen.
The male then elevates the tip of his abdomen between the wings, into
the copulatory position (Figure 14). In the laboratory copulation
lasted for about five to ten minutes. Dubois and Geigy (1935) reported
that a transparent, gelatinous spermatophore is introduced into the
vagina and the female draws the sperm packet into her body by
gradually inverting the evaginated vagina. Killington (1932) reported

35
Figure 14. Copulation position in Sialis rotunda.

36
a different mechanism of sperm transfer. A few minutes after
separation, the female bent her abdomen forward between her legs
and ate the spermatophore. In the present study this behaviour was
never observed.
Although Dubois and Geigy (1935) failed to obtain oviposition of
S. lutaria in captivity, no difficulty was experienced in the present
study. The mated females laid eggs either the same day or next day
on leaves and on the walls of cages. A sticky substance is secreted
before oviposition. This material firmly attaches the eggs to the sur-
face. The female bends the tip of her abdomen to touch the substrate
and swings the abdomen towards left and right of the mesal line and
deposits a row of eggs. After one transverse row is completed she
moves forward slightly and completes another row. The number of
eggs in each row varies from 4 or 5 to 20 or 25, depending on the
shape of the substrate. Egg masses of S. rotunda are narrower than
those of S. californica because the smaller female cannot swing her
abdomen as far to the sides and also because she bends the abdomen
into an almost vertical position to deposit the eggs vertically.
S. californica females can swing the abdomen in a wider arc as the
eggs are laid in a slanting position. Females can deposit a second
mass of eggs.

Field Life-history Studies
Egg Stage
37
The eggs are laid in the field on vegetation or any other object
that projects over the water. S. rotunda eggs were observed at Oak
Creek pond in May and June of 1966, 1967 and 1968. In all these
years many egg masses were present on the vegetation around the
pond.
S. californica eggs were present at Berry Creek. It was
practically impossible to count the numerous egg masses laid in
May-June of 1966 in the experimental area of stream. Egg patches
were numerous in sections I, II, and III but not in section IV, due to
lack of favorable vegetation or objects over the water in the latter.
In section I, certain branches, which projected over the water, were
completely covered with egg masses. In 1967 there was a marked
decrease in the number of eggs because of flushing the stream in
February 1967, which washed away most of the larvae from the
stream.
The eggs of both species hatch in eight to twelve days depending
on temperature. The eggs were parasitized by a hymenopterous
parasite which is discussed later.

38
Larval Development
Cage studies provided good information about the development
and duration under natural conditions, even though the amount of food
supplied differed from that available in the field.
In the pond cage, all the larvae of S. rotunda completed their
life cycle in one year and similar conclusions were drawn from field
collected larvae, because after June, no older larvae were found in
samples.
Out of 24 larvae of S. californica in two cages at Berry Creek,
about 15 larvae completed their life cycle in one year and four larvae
were carried over to the second year, the others dying at different
times. These results support the idea that the life cycle can take
one or two years depending upon conditions. In the routine collections
from different sections of Berry Creek, the majority of the larvae in
enriched sections were developing fast because of abundant food and
apparently completed their life cycle in one year. Many larvae in the
unenriched section I were apparently taking two years. This dif-
ference has now been confirmed by the field rearing.
Pupal Stage
Collections of larvae which leave the water and migrate to shore
for pupation were made by fixing pit-fall traps at certain places near

39
pond and stream. S. rotunda larvae begin to pupate as soon as the
weather warms up in the spring. Pupation extends from April to
June, usually occurring during May. S. californica larvae pupate
from May to early July with most of the pupation in June.
During the 1966 pupation period 12 pit-fall traps were fixed at
Berry Creek. Twelve larvae were collected in the traps and brought
to the laboratory where they pupated and emerged into adults. During
1967, three traps were fixed at the pond and 16 at the Berry Creek.
At the pond 134 larvae of S. rotunda were obtained in three traps,
with their respective numbers in each trap being 51, 19 and 64
(Appendix I). It was noted that the trap with the maximum number
of larvae was located at a place where there was sparse vegetation
that did not obstruct the migration of larvae leaving water and also
the water depth was less at that end. The trap which collected the
fewest larvae was in a grassy area and also the water was deeper at
that end. In the field many pupal exuviae were collected on the ground
surface near pond.
Only four larvae were obtained from Berry Creek traps in
1967; the decrease from 1966 was because there were not many
larvae left in the stream after flushing.

40
Adult Stage
S. rotunda adults were first seen in mid-April but maximum
emergence occurred during May. The first adult of S. californica was
observed at Berry Creek as early as May 4, and a few more adults
were seen by the end of May but maximum emergence occurred during
mid-June.
The adults of both species, especially the males, are active
during warmest hours of mid-day, swarming on vegetation along the
shore. The adult females do not fly much and mostly walk on the
plants. They were observed to fall down into the bushes on slight
touch. The abdomen is swollen and heavy. Dissection of a few adults
has shown that the ovaries completely fill the abdomen and also extend
into the thorax.
Dubois and Geigy (1935) found whitish and yellow pollen
scattered over the head and thorax of some adults and this led to the
supposition that the adults visit flowers to feed. In the present study,
however, adults were found at different parts of the plants and also
were found to lick the flowers, but their feeding is doubtful. Dissec-
tions also showed that the alimentary canal is not developed.
Studies of sex-ratio have indicated that in order to establish a
true ratio for Sialis adults, laboratory reared individuals should be
considered. Adults collected from the field and also reared in the

41
laboratory were separated into two sexes by a study of genitalia.
Field collections of adult S. rotunda were made by sweeping
with an insect net from April 22, 1967 to May 25, 1967. The sex-
ratio of all the collected individuals is given in Table 5.
Table 5. Sex-ratio of S. rotunda from field collections.
Sex-ratio (%)Date Males Females Total Males Females
April 22, 1967 17 2 19 89.5 10.5
April 31, 1967 9 4 13 69.0 31.0
May 5, 1 967 21 14 35 60.0 40. 0
May 11, 1967 43 18 61 70.5 29.5
May 25, 1967 4 5 9 44.4 55. 6
Total 94 43 137 70.2 29.8
In the laboratory rearings, out of 34 adults of the same species,
14 were males and 20 were females (ratio = 41.2:58.8).
As mentioned earlier, it is difficult to collect the females in
the field since at the slightest touch, they fall into the bushes. They
do not fly much because of the heavy abdomen.
Growth, Length-weight and Length-headwidth Relationships
The life history studies began with the attempt to raise the two
Sialis species from egg to adult, primarily to obtain the number of
instars, the total duration of life cycle and to find morphological

42
differences between the successive instars. As the studies went on,
the idea of recording some data on growth was conceived and carried
into effect by measuring their lengths, head widths and weights.
The growth obtained for both species under different situations
of aquarium, laboratory stream and field cages are presented in
Figures 15 and 16 for S. rotunda and S. californica respectively.
Both species had similar growth curves under aquarium conditions.
The curves for the laboratory stream specimens differed from those
in aquarium, but again there was no difference between species, as
conditions of temperature and food were the same for both species.
However, the difference in growth of S. rotunda and S. californica in
field cages is attributed to effects of food. As mentioned earlier,
S. rotunda larvae were given tubificid worms from a culture at the
Fisheries Laboratory, whereas S. californica larvae were provided
food from substrate of Berry Creek. The curves thus represent the
effects of different factors of growth, i. e. , aquarium with high tem-
perature and optimum food, laboratory stream with fluctuations of
temperature and optimum food, and cages with natural fluctuation of
temperature and different amounts of food.
The logarithmic relationships between length and weight, and
head-width and weight for both species are presented in Figures 17
and 18. These relationships are based on a large quantity of data
obtained during routine field sampling and also from laboratory-reared

43
Aquarium
A-6 Lab, StreamField Cage
J J A SOND
Sialis californica
Months
J FM AM J
A S ON DMonths
F M AM
Figures 15 and 16. Growths of Sialis rotunda and Sialiscalifornica larvae in Aquarium, Labo-ratory Stream and Field Cages.

44
1. 5
1. 2
Vo O. 9
0 O. 6
0. 3
Sialis rotunda
Length and Weight
-0. 2 0
1. 5
1. 2
0, 9
0. 3
Length and Head Width
0.2 0.4 0.6 0. 8 1.0 1. 2 1. 4 1. 6 1. 8 2. 0
Log. Weight (mg) or Head-Width (mm)
Sialis californica
Length and Weight
Length and Head Width
-0.2 0 0.2 0.4 0.6 0.8 1.0 1.2 1.4 1.6 1.8 2.0
Log. Weight (mg) or Head-Width (mm)
Figures 17 and 18. Length-Weight and Length-Headwidthrelationships in Sialis rotunda andSialis californica larvae.

45
specimens. These relationships were used in converting the lengths
to weights when only lengths were measured.
An attempt was made to determine whether head-width measure-
ments could be used to separate the instars. Measurements were
made on aquarium-reared larvae at each successive moult. Figures
19 and 20 represent the trend by which head-widths increase from
instar to instar for S. rotunda and S. californica, respectively.
There was a difference in the head-width measurements from
one instar to the next, but it is difficult to separate the early instars
as there is some overlap. However, larvae from the fifth instar
onwards can be separated on the basis of head-width measurements.
Even the specimens collected from variable field populations can be
separated with accuracy in the later instars.
Analysis of Food and Feeding Habits
The feeding behaviour of the larvae of both species was
observed in aquaria by providing different kinds of food organisms
collected from the natural habitat. The larvae consume small prey
without chewing. If the prey is larger then they capture it with their
mandibles, manipulate part into their pharynx, and sever the
remainder.
Feeding tests were made in the laboratory, using chironomid
larvae, tubificid worms, mayfly nymphs, caddis worms, damselfly

46
2.25
1.88
1. SO
1. 13
0.75
0.38
2.63
2.25
1. 88
1. 50
1. 13
0. 75
0.38
Sialis rotunda
T1411-4-1-
ea 4.s-tam--MO-_
I II III IV V VI VII VIII IX X
Instars
Sialis californica
In
. . . 4
I II III IV V VI VII VIII IX X
Instals
Figures 19 and 20. Head-widths of all instars of reared Sialisrotunda and Sialis californica larvae.

47
naiads and water mites. They ate all of these organisms except water
mites. Cannibalism was also frequent in aquaria.
Davis (1903) reported that larvae of S. infumata in captivity
consumed soft bodied caddis worms, small larvae of Chauliodes
(Megaloptera) and individuals of their own species. Dubois and
Geigy (1935) performed feeding experiments with larvae of S. lutaria
in which they fed oligochaete worms, nymphs of Ephemeroptera, and
larvae of Trichoptera and Diptera.
Food Habits in Natural Habitats
An attempt was made to determine the kinds of food organisms
that were consumed in the natural habitats. In the beginning many
difficulties were experienced. At each collection time certain
individuals were preserved in alcohol:formalin (9:1), but when these
specimens were dissected, most of them were empty. It was found
that this was due to regurgitation of food when the larvae were put
in preservative. Later it was observed that if larvae were kept alive
in some water for a day or two after the collections, they passed out
the undigested parts in the form of small pellets covered with a
peritrophic membrane. Analysis of the pellets gave qualitative, but
not quantitative, data since the sclerotized parts in the feces could
be identified. Moreover, this technique permitted returning the
larvae to the field site after the data were obtained.
48
Large collections of S. californica larvae also made in back-
waters at the Metolius River for these studies. Five collections
were made from July 19 67 to January 19 68.
The pellets containing parts of chironomid larvae, mayfly
nymphs and crustacean shells could easily be separated. Moreover,
the pellets with aquatic worms could also be recognized based on
comparisons with pellets from laboratory reared specimens.
In the Metolius River samples, mayfly nymphs were always
an important component of the diet (Table 6). Chironomids were
usually a major item but they decreased (9%) in November and to zero
in the small January sample. The most interesting part of Metolius
food habits study was that Crustacea (ostracods), were a common food
item in most samples. Worms were also an important source of food.
Other items, listed as miscellaneous, include caddisflies and stone-
flies as well as unidentified organisms.
In the pond, the most important source of food for S. rotunda
was tubificid worms (Table 7). Bottom samples indicated that these
w orms were a dominant benthic organisms in pond. Mayfly nymphs
and chironomid larvae were not found in all fecal samples. Crustacea
were an uncommon food item at this site. The miscellaneous
organisms included damselfly naiads, small Sialis larvae and
unidentified organisms.
Chironomid larvae and mayfly nymphs were the two important

49
Table 6. Relative occurrence of identifiable organisms in fecal pellets of S. californica from theMetolius River.
Month
No. ofSialis
Chironomids
Percentage of total number identified
Mayflies Worms Crustace a Miscellaneouslarvae
July 51 29.4 15.7 17.7 23. 5 13.7
August 67 38. 8 22. 4 22. 4 5. 9 10. 5
September 41 19.5 34.2 2.4 24.4 19, 5
November 32 9.4 31.2 18.8 0 40.6
January 11 0 27.3 18.2 9, 1 45.4
Table 7. Relative occurrence of identifiable organisms in fecal pellets of S. rotunda from OakCreek pond.
Season
No. ofSialis
Chironomids
Percentage of total number identified
Mayflies Worms Crustacea Miscellaneouslarvae
Summer 108 27. 8 20.4 42. 4 3.6 5.8
Fall 96 16.3 19.4 48.9 6.8 8.6
Winter 67 7.7 16.4 61.0 0 14.8
Spring 78 11.8 17.8 37.7 1.5 31.2

50
kinds of food for S. californica in Berry Creek (Table 8). The
contents of many of the pellets could not be identified, in part because
of the varied fauna in the stream.
There does not seem to be any major difference in the choice
of food during different seasons. In general, the Sialis larvae are
indiscriminate feeders, and the benthic organisms that are abundant
form the major part of their diet.
Parasites, Predators and Diseases
The eggs of both S. rotunda and S. californica were parasitized
by the hymenopterous parasite Trichogramma semblidis (Aurivillius).1
The parasitized eggs turned completely black (Figure 21).
Dr. Burks (in litt) stated that this is a Holarctic species
restricted to the eggs of aquatic insects in nature, although it can be
reared on Ephestia eggs in the laboratory. It has two types of males,
a winged and wingless form. All the males obtained from the para-
sitized eggs of S. rotunda and S. californica were wingless.
There is considerable literature on T. semblidis and Salt (1937)
discussed in detail the correct naming of the parasite. Lestage (1918)
reported parasitism of Sialis eggs as Trichogamma evanescens W. ,
1 Determined by Dr. B. D. Burks, Insect Identification andParasite Introduction Research Branch, U. S. Department ofAgriculture.

51
Table 8. Relative occurrence of identifiable organisms in fecal pelletsexperimental sections of Berry Creek.
of S. californica from
SeasonStreamsection
No. ofSialis Percentage of total number identified
Chironomids Mayflies Worms Miscellaneouslarvae
Fall 1966 I 64 18. 5 20. 7 13. 1 47.7
II 31 32.5 25.6 16.0 25.8
III 21 36.1 25.0 19.4 19.4
IV 24 41.7 16.6 16.6 25.0
Winter 1966- I 39 34. 3 17. 4 13. 8 34, 51967
II 12 25.0 43.7 6.3 25.0
III 14 35, 7 28.6 7. 1 28.6
IV 10 28. 6 40. 5 0 30. 9
Summer 1967 I 7 0 20, 0 0 80.0
II 38 18.4 29, 7 15.4 37. 1
III 26 26.9 15.0 15.6 43. 1
IV 24 33, 3 11. 1 13. 4 42. 3
Fall 1967 I 4 0 0 0 100.0
II 12 18.2 27.3 18.2 36.3
III 4 0 0 0 100.0
IV 5 40.0 0 0 60.0
Winter 1967 I 3 0 0 0 100.0
II 18 11. 5 35, 4 0 53. 1
III 6 0 0 0 100.0
IV 0 0 0 0 0

52
Figure 21. Parasitized egg mass of Sialis californica.

53
a misidentification of T. semblidis. According to Balduf
(1939), Silvestri (1908) made a thorough study of this parasite as
related to hosts other than S. lutaria.
The extent of parasitization was about 14% in S. rotunda com-
pared with 37 to 65% in S. californica (Appendix II). The difference
in the level of parasitization between the species results from the
time of egg-laying and probably the egg laying position. The
occurrence of T. semblidis is synchronized with the oviposition
period of S. californica (June - July), whereas the peak period for
S. rotunda eggs is in May, and only the latest egg masses are subject
to parasitization. S. rotunda eggs are laid in an almost vertical
position, thus only exposing the ends of the eggs. The eggs of
S. californica are laid in slanting position, thereby exposing much
of the surface area for the parasite to deposit its eggs into the host
eggs. When parasitization occurs most of the eggs of S. californica
in a mass are attacked whereas parasitization of S. rotunda eggs
occurs sparsely.
Fish are predators of Sialis. Warren et al. (1964) and
McIntyre (1967) reported S. californica larvae in the stomach contents
of cutthroat trout from experimental sections of Berry Creek. The
older Sialis larvae themselves are predators of young larvae, as
found in the food habit studies.
The larvae are subject to attack by an unidentified fungus. The

54
fungus first appears at the tip of the tracheal gill, gradually penetrat-
ing to entire gill and then to other gills. The larvae turn black and
die. The fungus infection in laboratory rearing was only two to three
percent.

55
SUMMARY - COMPARISON OF LIFE CYCLE OF THETWO SIALIS SPECIES
The life-histories of S. rotunda and S. californica in the field
are compared diagrammatically in Figure 22 and are summarized
below:
S. rotunda. This species completes its life cycle in one year
in Western Oregon. The adults emerge from April to June. Oviposi-
tion commences in late-April or early May and larvae first occur
about two weeks later. The larval stage lasts about 10 to 11 months
and pupation occurs in April and May.
S. californica. The present study indicates that this species
takes one or two years to develop, depending on oviposition time and
food availability. The adults emerge from May to July. Oviposition
commences in mid-May when both males and females are found, and
the larvae first occur about late May. Most of the larvae take one
year to develop but those hatching from eggs laid in late July may
take two years if enough food is not available.
In the aquarium and laboratory stream both species completed
their life cycle in one year. In the cages all larvae of S. rotunda and
about 75% of S. californica developed in one year.

56
Sialis rotunda
Adult/
Eggs
Larvae
-Pupae
Sialis californica
Adults
lggs
Larvae
< Adults
2-year Larvae
Pupae
< Adults
AMJJ ASONDJF MA M J
MonthsJ
I
Figure 22. Comparison of life-cycle of Sialis rotundaand Sialis californica in the field.

57
DENSITY, BIOMASS AND GROWTH RATES OFFIELD POPULATIONS
In the study of insect populations, the numbers and biomass
are important. The density and biomass of S. rotunda larvae are
given in Figures 23 and 24 for the Oak Creek pond from May 1967 to
May 1968. In Figures 25 and 26, the data are given for S. californica
larvae in the four experimental sections of Berry Creek during the
entire sampling period from December 1965 to December 1967.
Hatching of S. rotunda started in May and the larval population
increased to a maximum by mid-July. The numbers decreased at a
uniform rate until March, and then markedly more in late April and
May when the larvae left the water to pupate. Throughout the summer,
growth rate was high so the biomass increased with time (Figure 24)
until winter. The decrease in numbers and biomass during February
is probably a sampling error whereas the increase in biomass during
March is a real effect, because moulting and rapid growth occur at
this time when water temperature begins to increase.
It was found that larvae of this species were almost uniformly
distributed in the pond and there were no major factors causing
fluctuation in numbers except natural mortality. In addition,
sampling of the mud bottom with an Ekman dredge was more accurate
than the methods used for the stream study.

0
600
0I
200
::..::: --
::".'-:---;:::,:::.:::;::: ..*.. !100 -1.:::::::'..y::::: :::::::::. :::::::;::
i.:.:::.7.:*::.:-..:L'i-1:.:.::.::::,-.:.::1":.:::''''''''''''''' !-:%:'::
MJJ ASON1967
D
1968F MA
12
10, 5
! 9
7, 5(N,
6b0
4, 5-
03
1. 5
.....1r:.;...
M MJ J AS ON1967
Figure 23. Numbers of Sialis rotunda larvae/m.2in Pond during May 1967 to May 1968.
J
1968A
Figure 24. Biomass of Sialis rotundalarvae/m2 in Pond duringMay 1967 to May 1968.

D J F M A M J J A S O N D J F M A M J J A S O N D1965 1966 1967
200
3100
900
" 600
co 200
z
D J F MAMJ J AS 0 NDJ FMAMJ J A SONO1965 1966 1967
100
II
D J F M A M J J A S O N D J F M A M J J A S O N D1965 1966 1967
200
100
Iv
GO1
GO2
GN1
F.: GN2
D JFMAMJJASONDJFMAMJ JASOND1965 1966 1967
Figure 25. Numbers of different age groups of Sialis californica larvae/m2 in four sectionsof Berry Creek from December 1965 to December 1967.

8ti
N6
Nv4
2 20
cal
DJ F MAMJ J A SONDJ F MAMJJ ASOND1965 1966 1967
III
D J F M A M J J A S O N D J F M A M J J A S O N D1965 1966 1967
Figure 26.
10
.18
0
/"° 4
CQ
.2 2
Cd
0
6
DJ FMAMJ J ASONDJ FMAMJ J AS OND1965 1966 1967
Iv
GO1
GO2
ED GN1
Erd GN2
.2
D J FMAMJ J A S 0 ND J F MAM J J A S O ND1965 1966 1967
Biomass of different age groups of Sialis californica larvae/m2 in four sectionsof Berry Creek from December 1965 to December 1967.

61
The population data for S. californica are more variable and
difficult to interpret than for S. rotunda: (1) the pool habitat was
variable and difficult to sample, (2) a satisfactory sampling procedure
was not developed at the start of the program, (3) the species has a
complex life cycle, and (4) the stream was subjected to several
experimental procedures and to flushing during the study period.
Though the manipulations had an undesirable effect with respect to
calculations of annual production, they were useful in elucidating
some aspects of the life cycle, and in demonstrating the effects of
enrichment on growth and development.
The following abbreviations are used to designate different age
groups of S. californica:
GO1. Collected from December 1965 to May 1966. This group
pupated in May and June 1966 and may have represented one and two
year old individuals.
GO2. Collected from June 1966 to January 1967 (Flushing
occurred in February 1967). These larvae developed from eggs laid in
1965 but did not pupate in 1966.
GN1. Collected from July 1966 to January 1967 along with GO2
larvae. This group consisted of younger larvae from eggs laid in
1966 by GO1 adults.
GN2. Collected from June 1967 to December 1967. These
developed from eggs laid in May and June, 1967.

62
From December 1965 to July 1966 (GO1), the samples were
obtained with the box sampler and aquatic dip net. Most small larvae
were not collected. This was not a serious error during winter and
early spring as most of the larvae were large. However, when eggs
began hatching in May or June and no early instars were collected in
either June or July, the pipe sampling method was initiated. The
larvae collected in June and July were holdovers from the 1965 genera-
tion which did not develop fast and were probably from eggs laid very
late in the season. The error introduced by not collecting small
larvae in June and July 1966 was not too great because of their small
biomas s.
Section I had the lowest number and biomass of mature larvae
(GO1) and section II had the maximum. The number of larvae dropped
to a minimum in all four sections by May 1966 when pupation occurred.
The number of GO2 larvae was highest in section I in most
months. For example, based on the August samples, when pipe
sampling started, the number per m2 of this group of larvae in the
four sections was: I, 68; II, 41; III, 27; and IV, 34. However, mean
weight (mg) per larva in the sections was: 51.9, 74. 3, 76.7 and
77. 9, respectively. This indicates the relative quantities of food that
had been available in the four sections. Monthly estimates of the
benthic pool organisms were not made. However, all insects in the
December benthos samples were counted and measured. These

63
collections are considered typical of the relative standing crop in the
four sections, and correlate well with the observed differences in
biomass of S. californica. The number per m2 of benthic organisms
was: section I, 7841; section II, 18, 248; section III, 19,070; and
section IV, 17,450. Moreover, the food organisms in enriched
sections were much larger than in section I. For example, the mean
length of 50 chironomid larvae from each section was: 2.5 mm;
4.4 mm; 3.9 mm; and 5.1 mm, in sections I, II, III and IV
respectively.
A marked difference occurred in the numbers of GN1
larvae
between the unenriched section I and the enriched sections from
August onwards. For example, in August, section I had more larvae
than three sections combined, but the biomass was approximately
equal in each section. Thus, even though fewer larvae developed in
sections II, III and IV, their rapid growth rate under the enriched
conditions tended to equalize the biomass in each section. Larvae
under 4 mm were rarely collected in the enriched sections,
especially in sections III and IV, even though egg masses were
numerous on the overhanging vegetation. It is believed that the main
cause of mortality was the growth of Sphaerotilus in the enriched
sections. Laboratory observations showed that small larvae get
entangled in the Sphaerotilus filaments, their tracheal gills get
covered with the sticky material and the larvae eventually die. Thus

64
only a few larvae survived that occurred along the edge of the pools
or other suitable situations, where Sphaerotilus was sparce. The
larger larvae are not inhibited by the Sphaerotilus, and those that
survive the critical early stages develop very fast because of
abundant food.
From May 1967 to December 1967, the S. californica population
consisted of a single age group, GN2, because practically all of the
larvae that remained after flushing pupated in May (Figure 25). Egg
deposition was not as high as in 1966, indicating the apparent
catastrophic removal of larvae from the stream during flushing,
which influenced the number of adults. Though stream flow was still
controlled at 0.5 c. f. s. , the creek was in a more natural condition
than in previous years, and the data are probably more typical for
S. californica populations under Western Oregon conditions than
previously. Much of the accumulated detritus was removed by
flushing, the enrichment was stopped and the barriers between sec-
tions were removed.
The differences in numbers and biomass in the four sections
(Figures 25 and 26) are attributed to available food, habitat suitability,
and gradient of the stream. For example, in August 1967, the num-
ber of larvae per m2 were 13, 171, 75 and 70 in sections I, II, III
and IV respectively and the mean individual weight (mg) was: 1.56,
1.75, 5.22 and 20.08. By autumn the numbers of larvae had declined

U 65
drastically. This was caused by a lack of food, which resulted in
starvation, cannibalism, and/or downstream dispersal. The larvae
in section II also were sparce and had poor growth. The pools in
sections III and IV were deeper, with silt substrate so they still had
abundant food. The habitat for Sialis was probably improved in that
the mats of Sphaerotilus were no longer present. With abundant food
available, the larvae in these two sections developed very fast.
The growth rate data were obtained by measuring the larvae of
both species caught in routine collections. It was apparent in the
early work that growth rates varied substantially in different sections
of the stream. Consequently it would not be possible to establish a
single standard growth curve for production studies for the four
sections. Therefore, growth rates were calculated separately for
the pond and each age group and each stream section.
The mean biweekly or monthly growth rates were computed
according to the following method:
W2 - W1 (Gain or loss in mgs)
W1 + W2 (Mean weight in gms)2
T (Number of days in interval)
W1 = Mean individual weight at time 1.
W2 = Mean individual weight at time 2.
T = Number of days during time 1 and time 2.

66
This relative growth rate is expressed as milligrams of
growth per gram of biomass per day (mg/gm/day). To estimate
production, all the figures were converted to calories and the growth
rate is expressed as cal/Kcal/day. The values obtained are given in
Table 9 for S. rotunda and in Tables 10 to 12 for S. californica.
The growth rate values varied considerably from month to
month. Such variation is expected with animals like insects where
moulting is the main factor responsible. It is very difficult to
measure actual tissue weight changes of the larvae. The larvae
take on water at the time of moult (Wigglesworth, 1965). The per-
centage of dry weight is low at actual moulting time and increases
as the larvae approach the next moult. The number of moults in
Sialis is greater than that in many other insects. In addition, sampling
error might be responsible for some of the differences in growth rates.
The growth curves were also drawn for S. rotunda (Figure 27)
and S. californica (Figure 28) from the mean weight at each sampling
time. These curves were fitted by eye. Mean weights read from
these curves for each month are given in Appendices III and IV for
S. rotunda and S. californica, respectively. These data were used
to compute production by Allen's graphical method.
In S. rotunda (Figure 27), development was rapid after hatching
and then slowed down because of low water temperature. Development
rate increased again in the spring until the time of pupation in

70o0
F.300
40
30
20
10
mk
M J J A S 0 N D J F M A1967 1968
Figure 27. Mean Weight of Sialis rotunda larvae at each sampling interval inPond from May 1967 to May 1968.

J1966
J A S 0 N D J1967
J1966
A S 0 N D J1967
J1967
J A S 0 N
Figure 28. Mean Weight of different age groups of Sialis californica larvae infour sections of Berry Creek.
D
I
IV
III
III

69
April - May.
In Berry Creek (Figure 28) the growth curves of all sections for
the GO1 group were similar, because only the mature larvae which
emerged during following May and June were obtained in the samples.
The GO2
and GN1
groups show the effect of enrichment on growth.
Unenriched section I had low growth in both cases compared to other
three enriched sections. The enrichment effect is even more evident
in growth curves of GN2. Section II had high growth when it was
being enriched, but after flushing and stopping the enrichment pro-
gram, it is just equal to section I. Sections III and IV, although not
being enriched, still had high growth in the GN2
group because of more
accumulated organic matter and more midges as food for
S. californica.

70
PRODUCTION
Production has been estimated for S. rotunda and S. californica
by two methods: (1) by a mathematical procedure, involving the
product of growth rate and mean biomass (Ricker, 1946), and (2) by
the graphical method presented by Allen (1951).
Ricker's formula for production is:
B = kF;
, ,where: B = Production rate in cal/m2 /day.
k = Relative growth rate in cal/Kcal/day.
P = Mean biomass in Kcal/m2.
The calculation of relative growth rate, k, is described in a
previous section. The mean biomass, P, in a sampling interval
is the sum of the biomass at the start and end of the interval, divided
by two. This was converted to Kilocalories/m2. The value of B
obtained as production rate in cal/m2/day was multiplied by the
number of days in the sampling interval and divided by 1000 to obtain
production in terms of Kilocalories/m2 for that interval. The values
per m2 for one year for S. rotunda, and for four age groups of S.
californica in their respective periods in each stream section were
obtained by summing the positive or negative values of respective
intervals .

71
Monthly and total production values, mean biomass and growth
rate values are given in Table 9 for S. rotunda and in Tables 10 to 12
for S. californica. Production in this sense is consistent with the
definition given by Ricker (1958): "the total elaboration of new body
substance in a stock in a unit of time, irrespective of whether or not
it survives to the end of that time. " During certain months production
values were negative. The importance of considering such values as
negative production has been discussed by Warren et al. (1964).
Three graphs are required to compute production by Allen's
method: (1) mean weight per individual, plotted against time; (2)
numbers per m2 plotted against time; and (3) the weights plotted
against numbers, for each sampling date, obtained from the smoothed
curves (1) and (2). The area under the curve, equals production. An
example of calculations for this method is given in Figure 29 to
estimate the production of S. rotunda in the pond. The numbers and
mean wet weights per individual obtained from smoothed curves prior
to computation of production are given in Appendices III and IV for
S. rotunda and S. californica, respectively.
Table 13 summarizes the total production values of both species.
In general the two methods gave comparable results, with the graphi-
cal method usually providing a slightly higher estimate.
Production values for S. rotunda (Table 9) are for one generation
for one year. There is not much difference in the values obtained

72
Table 9. Growth rates, mean biomass, and productionin Oak Creek pond during 1967 -1968.
of S. rotunda
MonthGrowth Rate
(cal/Kcal/day)Mean Biomass
(Kcal/m2)Production(Kcal/m2)
May 19 67 51.78 0.07 0.06
June I 60. 34 0.21 0.19
June II 50.2 9 0. 62 0.47
July I 13. 40 1.09 0.20
July II 33. 32 1. 69 1.01
August I 1 6. 7 6 2. 36 0. 55
August II 27. 32 3. 17 1. 39
September I 18. 62 4. 54 1.52
September II 5. 91 5. 28 0.50
October I 36. 36 6. 02 2 41
October II 21.25 7. 63 2.59
November 0. 90 9,10 0.25
December 2. 22, 9. 07 0. 64
January 1968 -2. 25 7. 46 -0. 50
February 4. 15 7. 41 0. 89
March 4. 82 7. 51 1.09
April -0. 55 5.29 -0.08
Total 13. 18
Mean 5. 18

Table 10. Daily growth rate, mean biomass, and production of S. californica of GO1 in four sections of Berry Creek.
Section I Section U Section III Section IV
Growth Mean Produc- Growth Mean Produc- Growth Mean Produc- Growth Mean Produc-Rate Biomass tion Rate Biomass tion Rate Biomass tion Rate Biomass tion(cal/ (Kcal/ (Kcal/ (cal/ (Kcal/ (Kcal/ (cal/ (Kcal/ (Kcal/ (cal/ (Kcal/ (Kcal/Kcal/ m2) m2) Kcal/ m2) m2) Kcal/ m2) m2) Kcal/ m2) m2)
Month day) day) day) day)
Jan. 1966 13.87 2.28 0.67 1. 78 2.61 0.102.59} 8.81 1.19 9.34 4.76 2.31
Feb. 1.40 2.46 0.11 4.32 3.56 0.48
Mar. 3.07 2, 95 0.26 4.64 7. 58 1.02 3.07 4.61 0. 41 0. 75 5. 15 0. 11
Apr. 3.29 1.80 0. 16 5. 83 4. 06 0.64 1. 62 2. 43 0. 11 3. 34 3. 58 0. 32
May 3.29 0.38 0.05 -11. 88 0. 53 -0.26 -10. 80 0. 32 -0. 14 -10. 31 1. 27 -0. 54
Totals 1.25 2.59 0.96 2.20
Means 1. 97 4, 20 2. 71 2. 95

Table 11. Daily growth rate, mean biomass, and production of S. californica of GO2 and GN1 in four sections of Berry Creek.
Month
Section I Section II Section III Section N
GrowthRate
(cal/Kcal/day)
MeanBiomass(Kcal/
m2)
Produc-tion
(Kcal/m2)
GrowthRate
(cal/Kcal/day)
MeanBiomass(Kcal/
m2)
Produc-tion
(Kcal/m2)
GrowthRate
(cal/Kcal/day)
MeanBiomass(Kcal/
m2)
Produc-tion
(Kcal/m2)
GrowthRate
(cal/Kcal/day)
MeanBiomass(Kcal/
m2)
Produc-tion(Kcal/
m2)
GO2
Jul. 1966 3. 90 2.30 0.25 2.73 2. 47 0. 19 24.38 0. 63 0. 43 21.62 1. 30 0. 79Aug. 6.83 2. 94 0.72 16.23 4.38 2.56 4.15 1. 70 0.25 1.28 2. 35 0. 11Sept. 3. 53 2.60 0.28 5. 06 2. 96 0. 45 0. 68 2. 35 0.05 1. 81 2. 47 0. 13Oct. 1. 96 1, 88 0. 11 0. 84 2. 95 0.07 -2. 37 2. 30 -0. 16 2. 47 2. 40 0, 18Nov. 2.04 2.41 0. 17 1. 43 3.69 0. 18 2. 41 2. 31 0. 19 -0.39 2. 71 -0.04Dec. -1.01 2. 46 -0, 08 -1. 02 3. 41 -0. 10 -0. 85 2. 37 -0.06 -0. 98 2. 40 -0.07Jan. 1967 -1.00 1.84 -0.05 1.80 1.86 0.09 3.23 2. 47 0.22 1.78 2. 18 0. 11
Totals 1.40 3.44 0. 92 1.21Means 2. 35 3. 10 2.02 2, 26
GN1
Aug. 1966 13.08 1.57 0.74 26. 32 1.38 1, 31 36. 37 1. 53 1. 57 28.02 1. 42 1. 43Sept. 15.24 1. 31 0, 60 12. 06 1. 33 0.48 12. 38 1. 75 0. 59 6. 17 1.28 0.'24Oct. 6. 53 1. 46 0.29 10. 89 1. 85 0.60 3. 33 1. 67 0. 17 7. 19 1. 52 0. 33Nov. 8.25 1.09 0.31 6.06 2. 40 0.50 3.87 1.77 0.23 3.92 1.76 0.23Dec. 3.44 2. 14 0.22 -2. 76 1. 85 -0. 15 1.09 2. 21 0.07 -2. 82 1. 56 -0. 13Jan, 1967 2.72 1. 88 0. 14 5. 96 1. 31 0.22 -2. 70 1. 87 -0. 14 4.00 1. 44 0. 16
Totals 2. 30 2. 96 2. 49 2. 26Means 1. 58 L 69 1.80 1. 50

Table 12. Daily growth rater mean biomass, and production of S. californica of GN2 in four sections of Berry Creek.
Month
Section I Section II Section III Section IV
Growth Mean Produc- Growth Mean Produc- Growth Mean Produc- Growth Mean Produc-Rate Biomass tion Rate Biomass tion Rate Biomass tion Rate Biomass tion(cal/ (Kcal/ (Kcal/ (cal/ (Kcal/ (Kcal/ (cal/ (Kcal/ (Kcal/ (cal/ (Kcal/ (Kcal/Kcal/ m2) m2) Kcal/ m2) m2) Kcal/ m2) m2) Kcal/ m2) m2)
day) day) day) day)
June 1967 86. 73 0.02 0.02 32. 84 0.05 0.02 127. 18 0.07 O. 13 130. 10 0. 12 0. 23
July 22. 53 0, 03 0.02 44. 44 0. 11 0, 15 33. 31 0. 24 0.25 43.34 0, 38 0.51
Aug. 47.36 0.03 0.04 50. 28 0, 24 0.35 9, 30 0. 39 0.11 25.98 1.01 0.76
Sept. 5. 13 0.03 0.01 6. 53 0. 33 0, 06 30. 75 0. 57 0. 53 13, 90 1, 22 0. 53
Oct. 7. 52 0.04 0.01 4. 39 0. 29 0.04 18. 40 0. 73 0. 42 4. 19 1.03 0. 13
Nov. 4. 70 0.04 0.01 6. 32 0. 24 0.05 5.09 0. 74 0. 11
Dec. 2. 54 0. 20 0.02 -3. 68 1. 33 -0. 16
Totals 0. 11 0.69 1.39 2. 16
Means 0.02 0, 21 0. 58 0. 75

600
400
Sz
200
40
30
20
10
M J1967
J AS ON D J F M AM1968
0
Sz
10 20 30 40Mean Weight (mg)/individual
MJ J A S ON D J F MA M1967 1968
Figure 29. Graphical representation for Computation of Production of Sialis rotunda larvae inPond by Allen's method: (i) Numbers of larvae /m2 (ii) Mean Weight (mg) perindividual (iii) Production (Mean Weight vs. Numbers). CT,

Table 13. Comparison of production of S. rotunda and S. californica by Ricker's method and Allen'smethod.
S. rotunda(May, 1967-April, 1968)
Production Kcal/m2Ricker Allen
13.18 12.74
Section I Section II Section III Section IV
S. californica
ProductionKcal/m2
ProductionKcal/m2
ProductionKcal/m2
ProductionKcal/m2
Ricker Allen Ricker Allen Ricker Allen Ricker Allen
GO1(Jan. 1966-May 1966)
GO7(Jury 1966-Jan. 1967)
GN1(Aug. 1966-Jan. 1967)
GN2(June 1967-Dec. 1967)
1.25
1.40
2.30
0.11
1.31
1.62
2.60
0.16
2.59
3.44
2.96
0.69
2.83
3.32
2.77
0.99
0.96
0.92
2.49
1.39
0.97
1.53
2.49
1.50
2.20
1.21
2.26
2.16
2.90
1.70
1.89
1.90

78
between Ricker's (13. 18 Kcal/m2) and Allen's (12.74 Kcal/m2)
methods. These values represent the production estimates from a
natural habitat without any enrichment or undue disturbances.
For comparing the production values of the different sections of
Berry Creek, only the results obtained by Ricker's method are
presented, though the difference between the two methods is not
great. It is realized that these production estimates are subject to
considerable error. Nevertheless, when the data are considered as
three experiments (GO1, GO2 + GNi, and GN2), the relative produc-
tion is a useful method of comparing Sialis in the four sections.
Production for the age group GO1
(Table 10) was greater in
enriched sections II (2. 59 Kcal/m2) and IV (2.20 Kcal/m2) compared
with section I (1.25 Kcal/m2). Section III, though enriched, had low
production (0.96 Kcal/m2), because the number of surviving indi-
viduals was small.
In the GO2
experiment (Table 11), section II had more than
twice the production (3. 44 Kcal/m2) of unenriched section I
(1.40 Kcal/m2). Sections III (0.92 Kcal/m2) and IV (1.21 Kcal/m2)
had low production because the biomass was low in these sections.
The biomass was contributed by very few individuals, whereas in
section I, though almost equal in total to sections III and IV, was
composed of many small individuals.
In GN1
group (Table 11), section II as before had the maximum

79
production (2. 96 Kcal/m2) and the other three had almost similar
values (I, 2. 30; III, 2. 49; and IV, 2.26 Kcal/m2).
Pronounced changes occurred in all four sections after flush-
ing and stopping the enrichment program. Section II which had
maximum production during the enrichment period, had low produc-
tion (0. 69 Kcal/m2) in the GN2 experiment (Table 12). Section I was
also seriously affected (0. 11 Kcal/m2). Section III and IV became
somewhat more suitable habitats for young larvae after flushing.
Section III in this experiment had 11-fold (1. 39 Kcal/m 2) and section
IV, 18-fold (2.16 Kcal/m2) more production than section I. It is
significant that this high production in section IV was realized even
though no larvae were collected in this section in the last two months
of study.
Monthly production, accumulated production, and biomass per
m2 for S. rotunda in the pond and for S. californica in the four experi-
mental sections are presented in Figures 30 and 31, based on data
obtained by Ricker's method. The production values of GO2
are
added to that of GN1, because the two age groups occurred at the
same time. The values of negative production are marked dark.
Though the data for Berry Creek are not complete for twelve
consecutive months for all age groups, the part of production missed
was not great. Most of the annual production occurs during the
summer and fall months, and data are available for that period for


6
4
GO1
GO2
+ GN1
0
1
7
6
4
2
0
-1
6
(.3 4
2
-1
6
4
2
0
-1
81- Mean Biomass.---- Production
Accumulated Productiony Negative Production
GN2
\\ i.
/ --// \
\ / ,, \\ /
ft
II
/A
7, III
JFMAMJJASOND J JASOND1966 1967
Figure 31. Monthly Mean Biomass, Production and AccumulatedProduction of different age groups of Sialis californicalarvae in four sections of Berry Creek.

82
GO2
and GN1
groups which were present together. In addition, data
of GO1
for five months represent the production of old larvae. The
only part missed is the production of young larvae which occurred
along with GO1
larvae but could not be sampled. The summation of
production values obtained for GO1, GO2
and GN1
which are for about
one year, is 4. 95, 8. 99, 4. 37 and 5. 67 Kilocalories/m2 for sections
I, II, III, and IV, respectively.
A comparison between the production values of S. rotunda in the
pond and S. californica in the unenriched section I of Berry Creek will
show the role of these carnivores in two different ecosystems.
Production values in the pond and in the stream section I were 13.18
and 4.95 Kilocalories/m2, respectively. The pond is a relatively
stable and closed system and had a Sialis production about three times
greater than the stream section which was subject to many variable
changes. Moreover, the experimental stream section was being
compared during a period when stream flow was held relatively
constant. The estimate of 4.95 Kcal/m2 for production of Sialis is
probably much higher than would be expected in a natural stream.
In Berry Creek after the flushing of the stream, production for2seven months was only 0.11 Kcal/m .

83
FOOD CONSUMPTION
Laboratory Food Consumption Experiments
Davis and Warren (1968) reviewed various methods of estimating
food consumption. They suggested that the most reliable method was
to conduct laboratory growth rate studies at various times of the year
at several rations of available food. The growth rate of the organisms
in nature can then be used to estimate the amount of food consumed.
They mention that this method is relatively simple, but its accuracy
depends upon the untested assumption that the energy costs of activity
in aquaria or jars are similar to the cost in nature.
Growth rates were determined at several food consumption rates
for both species of Sialis during the summer of 1967 and winter 1967-
1968. Specimens were reared individually in jars placed in the
laboratory stream.
In the summer experiment, 24 individuals of each species were
used. Twenty individuals were fed on different rations of tubificid
worms (average weight of 0.6 mg per worm) and the other four larvae
were starved. The amount of food was increased for certain individ-
uals mid way through the experiment. The amount of food received
by each larva is given in Tables 14 and 15.
The winter feeding experiment was conducted in the same

84
Table 14. Food received by S. rotunda larvae in laboratory growth-rate experiments.
IndividualNo. 1-15 16 -30 31-45 46 -60 Total Mean/day
Number of tubificids received (days)
SummerExpt. 1 - 5 15 15 15 15 60 1
6 - 10 30 30 30 30 120 2
11 - 12 30 30 60 60 180 3
13 - 17 60 60 60 60 2 40 4
18 - 20 60 60 90 90 300 5
21 - 2 4 0 0 0 0 0 0
WinterExpt. 1 - 5 7. 5 7.5 7. 5 7. 5 30 0. 5
6 - 12 22.5 22.5 22.5 22.5 90 1. 5
13 - 20 45.0 45.0 45.0 45.0 180 3. 0
21 - 24 0 0 0 0 0 0

85
Table 15. Food received by S. californica larvae in laboratorygrowth- rate experiments.
IndividualNo. 1-15 16 -30 31-45 46 -60 Total Mean/day
Number of tubificids received (days)
SummerExpt. 1 - 5 15 15 15 15 60
6 - 10 30 30 30 30 120 2
11 - 12 30 60 75 75 240 4
13 - 15 75 75 75 75 300 5
1 6 - 20 75 90 112.5 112.5 390 6. 5
21 - 24 0 0 0 0 0 0
WinterExpt. 1 - 5 7.5 7.5 7. 5 7.5 30 0.5
6 - 10 22.5 22.5 22.5 22.5 90 1. 5
11 - 15 45.0 45.0 45.0 45.0 180 3.0
1 6 - 18 0 0 0 0 0 0

86
manner, using 24 larvae of S. rotunda and 18 larvae of S. californica.
The rations were reduced because the larvae were not consuming
much at this time of the year (Tables 14 and 15).
The results for mean growth with different rations are given in
Figures 32 and 33 for S. rotunda and S. californica, respectively.
Each increase in ration resulted in greater growth. The highest
rations were considered maximum because some food was not con-
sumed. The number of moults were almost constant for most indi-
viduals within each group. During 60 days of the summer experiment,
the larvae of both species moulted twice with all rations except the
highest one. On the latter they moulted three times. In winter, only
the larvae with the highest ration completed an instar.
The growths were significantly different during summer and
winter experiments for both species. These differences are attributed
to seasonal temperatures, as the kind of food given in both the experi-
ments were same. The field growth in winter months was also
similar to laboratory data.
The starved larvae lived for a remarkable length of time,
although they lost some weight and none moulted. This indicates the
possibility of living in the field at a very low level of food for a long
time.
Out of 20 larvae of each species during summer, three larvae
of S. rotunda and two of S. californica died during the 60 days

04' 70rw
a) 0H 50
30
20
10
00 50
30°
20
10
Summer
87
5 worms/day
4 worms/day
3 worms/day
2 worms/day
- 1 worm/day
Starved
15 30
Days
Winter
45 60
15 30
Days
45
3 worms/day
1 1/2 worms/day
1/2 worm/day
-- Starved
60
Figure 32. Mean Weights of Sialis rotunda larvae fed differentrations of tubificid worms during summer and winterexperiments in Laboratory Stream.

rx. 700
so°
90
"i; 60
b0
30
or.,so°
sa,
oE- 30.
20
10
Summer88
6 1/2 worms/day
=1011INMENW, t--15
5 worms/day4 worms/day
. 2 worms/day
- 1 worm/day
30 45 60
Days
Winter
Starved
3 worms/day1 1/2 worms/day
1/2 worm/day
. Starved
15 30 45 60Days
Figure 33. Mean Weights of Sialis californica larvae feddifferent rations of tubificid worms during sum-mer and winter experiments in Laboratory Stream.

89
experiment, which is probably due to natural mortality. Of the
starved individuals, two S. rotunda and one S. californica died before
the end of the experiment. During the winter experiment, two fed
larvae and one starved larva of S. rotunda died, whereas there was
no mortality in S. californica.
Estimate of Food Consumption by Field Populations
Relative daily growth rates and food consumption rates of the
experimental larvae were computed for estimating food consumption by
field populations. The experimental data of growth rate-food con-
sumption rate were variable, especially in the summer experiments.
Much of the variability can be attributed to error in measuring actual
tissue weight changes of the larvae during moult cycle. As men-
tioned earlier the percentage of dry weight is low at actual moulting
time and increases as the larvae approach next moult. Such varia-
tions have also been reported by Davis and Warren (1965) from their
studies with Plecoptera.
Data from the summer and winter experiments with both species
were fitted to regression lines (Figures 34 and 35):
f3ZXY
2
where X = Food consumption rate in calories/Kilocalorie
body weight/day.

50 100 150 200 250 300
Food Consumption rate (Cal/Kcal/Day)
Summer 1967
Winter 1967-1968
350 400
Figure 34. Regression of Food-Consumption rate on Growth-rate of Sialis rotundalarvae held in jars in Laboratory Stream and fed different rations of food.
0

150 200 250 00 350Food Consumption Rate (Cal/Kcal/Day)
Summer 1967
A, Winter 1967-1968
Figure 35. Regression of Food-Consumption rate on Growth-rate of Sialis californicalarvae held in jars in Laboratory Stream and fed different rations of food. ..o

92
Y = Growth rate in calories/Kilocalorie body
weight/day.
The values of 1 obtained were:
S. rotunda: Summer experiment = 0.129
Winter experiment = 0.059
S. californica: Summer experiment = 0.295
Winter experiment = 0.104
The formula used to give a good fit was for a regression line
through the origin of X and Y. Growth rates were not determined
at very low rations of food consumption, but it is obviously not
realistic to have a straight line relationship in this part of the graph.
The lines were extrapolated (broken lines) toward a point represent-
ing a growth rate of zero at an assumed level of food consumption
allowing for a maintenance ration. The lines for summer experiments
were also extrapolated at high growth rates to estimate the food con-
sumption rates of very early instar larvae.
The estimates of total amount of food consumed per m2 during
a given interval were obtained by multiplying the daily food consump-
tion rate (read from the regression line) by the mean biomass/m 2,
by the number of days in the interval.
The food consumption estimates for S, rotunda in the pond for
one year and for all age groups of S. californica in each stream
section are given in Table 16. The estimates are expressed as

Table 16. Estimate of food consumption of field populations of S. rotunda in Oak Creek pond and S. californica in four sections of Berry Creek.(prey = chironomid of mean length 3. 5 mm)
S. rotunda
Food consumed
Kcal/ Gms/m2 m2
Prep Prey/Pond(70 m2)
Number (Thousands)
118.74 137.39 354 24, 787
S. californica
AgeGroups
Section I Section II Section III Section IV
Kcal/xn2
Food consumedGins/ Prey/ Prey/
m pool(24. 49
m2)
No. (1, 000)
Kcal/m
Food consumedGms/ Prey/
m m
No.
Prey/pool
(15. 42m2)
(1, 000)
Kcal/m2
Food consumedGms/ Prepm2
No.
Prey/pool
(15. 85m2)
(1, 000)
Kcal/m2
Food consumedGins/ Prep
m2
No.
(17. 76
m2)(1, 000)
GO1
GO2
GN1
GN2
5.27
7.37
10.20
0. 41
5.35
7.50
10.38
0. 41
14 338
19 473
27 655
1 26
12.42
13.57
11.79
2.79
12.63
13.81
11.99
2.84
33
36
31
7
502
549
477
113
5.46
6.23
10.22
6. 18
5.55
6.34
10.40
6.29
14
16
27
16
237
259
425
257
11.90
6.92
8.87
7. 16
12.11
7.04
9.03
7. 28
31
18
23
19
554
322
413
333

94
Kilocalories equivalents of food consumed/m2 and as grams (wet
weight) of food consumed/m2. These values are also expressed in
terms of numbers of chironomid larvae consumed/m2 and the con-
sumption by the entire Sialis population in the pond and pools of each
stream section of Berry Creek. Mean weight for an "average"
chironomid was taken as 0. 388 mg, based on specimens 3. 5 mm in
length.
Based on these data, one larva of S. rotunda consumed an
average of 2. 6 chironomids/day and about 940 chironomids during
the larval period. The entire population was estimated to consume
9617. 3 grams in a year.
In Berry Creek a substantial number of chironomids were con-
sumed by S. californica, which otherwise was potentially available to
trout. The larvae in unenriched section I consumed much less com-
pared to enriched sections II, III, and IV. During the enrichment
program one Sialis larva in section I consumed 2.08 chironomids/day,
whereas in enriched sections II, III, and IV, the consumption was
3. 23, 3. 00, and 3. 55 chironomids/day, respectively.

95
DISCUSSION AND CONCLUSIONS
Apparently, this is the first detailed study of the life history of
American Sialis, covering all the stages and habits during the life
cycle. An important ecological finding was different habitat prefer-
ences of the two species. This was evident not only in the two study
areas, but also from collections made at many other locations in
Oregon. The important factors segregating their distribution within
the habitats seem to be appropriate substrate and water current; with
muddy substrate and still water for S. rotunda and flowing water with
organic debris for S. californica.
Both the species are indiscriminate feeders and can have a
considerable effect on the density of prey population if the predators
occur in significant numbers. Moreover, food consumption experi-
ments at different levels of available food revealed that they are
adapted for survival during intervals of low prey density, in that
they can live for a considerable length of time without prey.
Though previous workers failed to rear Sialis in the laboratory,
it is felt from the present study that it is not too difficult to colonize
them in the laboratory. There is high mortality in the early instars,
especially first and second, and this is suspected to be the reason
which discouraged other workers from continuing further rearings.
The high mortality in the early instars also occurs in nature, as has

96
been demonstrated by comparing the number of larvae obtained in
samples and the number of eggs laid. Thus once they complete few
early instars in about one month, it is easy to rear them for the rest
of their life cycle of about eight to nine months. Cannibalism can be
minimized by providing suitable substrate and enough food. Provision
could be made for the larvae to leave the aquarium or any other
colonizing site at the time of pupation. It has been demonstrated that
the adults will mate and oviposit in laboratory cages, so these species
could be colonized and mass-reared for experimental purposes. This
insect has been used in many physiological and anatomical studies
(Dethier, 1942; DuBois, 1938; Selman, 1961, 1965; Shaw, 1955;
Staddon, 1955), and would be useful for some ecological experiments,
such as predator-prey and competition studies.
Differences in density and biomass of the two species are a
result of the habitat in which they occur. Even though Berry Creek
had low numbers and biomass compared to population in a natural
pond, the S. californica population was much higher than would occur
in a stream having a natural flow regime. The favorability of the
pools at Berry Creek had been enhanced by the accumulation of silt
and organic matter in the pools because of controlled flow conditions.
It was more difficult to obtain accurate samples at Berry Creek
because of the uneven nature of substrate, whereas the pond had a
muddy substrate which was very easy to sample with Ekman dredge.

97
In addition, several experimental procedures and flushing of the
stream affected the density and biomass as compared with the more
stable conditions in the pond, so the data for S. rotunda are more
accurate than for S. californica.
Differences in density and biomass of S. californica between
the four experimental sections of Berry Creek resulted primarily
from the effects of enrichment with sucrose and urea. This treatment
led to development of the bacterium, Sphaerotilus natans. Though
removal of the forest canopy resulted in differences in number of egg
masses deposited, this was not an important factor in determining
population size.
The growth of Sphaerotilus caused a heavy mortality of early
instar larvae in the enriched sections. McIntyre (1967) reported that
growths of Sphaerotilus increase the food base for small trout, but
may decrease the suitability of streams as spawning areas. A similar
effect is believed to have occurred with S. californica; growth of
Sphaerotilus was unfavorable for early-instar larvae because they
become entangled in the filaments, but larger larvae were not
impeded by the bacterium, and developed rapidly because food was
abundant.
Growth rate measurements indicated striking differences
between enriched and =enriched sections. The increased growth
rate in enriched sections was obviously due to abundant food,

98
especially chironomids and mayflies. The effect of enrichment was
confirmed by the results after flushing and stopping of enrichment in
that growth rate in section II decreased considerably.
A number of methods of estimating production are available.
Juday (1940) and Lindamen (1941) have expressed the annual production
of plankton and bottom fauna in lakes as the product of average stock
and the number of "turnovers"--apparently equivalent to the annual
number of life cycles. As pointed out by Allen (1951), "this method
actually gives an underestimate of the annual production because it is
based on the incorrect assumption that the stock of every generation
at any moment of sampling must be equal to the total production of
that generation, whereas the stock at any moment must be less than
the total production, both by the amount that has been embodied in the
individuals which have died prior to sampling, and by the amount which
will be added by the further growth of the surviving individuals after
the sampling date." In general, two methods available are
theoretically satisfactory. Ricker's (1946) mathematical procedure
demands laborious calculations but has been considered to yield
valuable results. Allen (1951) presented a graphical method and
discussed its advantages. It provides a convenient means of smoothing
the results prior to computation where the data are subject to
irregular error, due to sampling and similar causes, when the data
are accurate the graphical method shows the effects of real

99
irregularities and fluctuations due to seasonal and other causes. It
was felt in the present study that sampling difficulties would cause
many irregularities, especially in Berry Creek, so production was
computed by this method and compared with Ricker's method. In
general the two methods gave comparable results, with the graphical
method usually being a slightly higher estimate.
Production in the pond was greater than in any of the sections
of Berry Creek, even if that latter is extrapolated to a period of 12
months by adding some probable value for the period when production
was not determined.
The differences in the production of different age groups in
four sections of Berry Creek are attributed to differences both in
numbers of individuals, biomass contributed and to different growth
rates. Though the growth rates in section I were not high compared
with the rates of other sections during enrichment program, the
numerical superiority in section I led to high biomass resulting in
comparable production estimates in other sections. Davis and
Warren (1965) found a somewhat similar relationship of production
to biomass during their laboratory stream experiments with sculpins
(Cottus perplexus Gilbert and Evermann). Production rates increased
with increase of biomass up to an optimal level and decreased with
further increase of biomass. However, in Berry Creek the density
or biomass of S. californica never seemed to have reached the

100
maximum. Section II had high biomass during enrichment program
and the production was also correspondingly highest. The percent
mortality of early instars in this section was probably similar to
mortality in the other enriched sections, but high population density
may have resulted from downstream drift from section I. Section I,
because of the highest number of individuals compared with all other
sections had equal or slightly more biomass than enriched sections
and this resulted in comparable production to other sections.
In the post-flushing period (GN2), the biomass in sections I and
II was considerably less than that in sections III and IV. This resulted
in much less production in the former even though relative growth
rates are always high in early instars. In section III and IV growth
rates were also high and, coupled with a higher biomass than in
sections I and II, this resulted in 11-18 fold greater production in III
and IV. This example indicates the value of production as an ecologi-
cal parameter. An estimate is obtained of the amount of energy fixed
by a species compared with biomass or numbers which only reflect the
standing crop.
The comparative annual production figures from different studies
of insects are given in Table 17. Sialis species in the present study
have high production values and this is particularly striking because
most of the results are for the herbivore trophic level.

101
Table 17. Comparison of production of Sialis spp. with estimates forother insects.
Location Annual Production gms/m2
Oak Creek pond (S. rotunda) 15. 26
Berry Creek (S. californicaUnenriched section) 5.03
Berry Creek (S. californicaEnriched section) 6. 45
*
Afon Hirnant Stream (Carnivores) 0.Hynes (1961)
Afon Hirnant Stream (Herbivores) 3. 47
Valley Creek, Minnesota (Mayfly,Baetis vagans, Ephemeroptera) 9. 10 Waters (1966)
Data for age groups GO1 + GO2 + GN1 only.
The analysis of data in terms of food received by single individ-
ual per day has shown that the individuals in enriched section con-
sumed one and half to two times more food compared to unenriched
section. Though confidence limits of the population food consumption
estimates were not established, the estimates will be in the right
order of magnitude. No examples were found in the literature to
enable a comparison to be made between the food consumed by a
population of Sialis and other comparable predators.
In general, food conversion efficiencies were higher in early
instars of both species and also during months with high temperature.
In comparing the two species, S. californica had a higher conversion

102
efficiency than S. rotunda.
In Berry Creek, the cutthroat trout (Salmo clarki clarki
Richardson) is the principal product of interest to man. Warren et al.
(1964) have shown increased production of trout in the enriched sec-
tions and also an increase in its food organisms. Chironomids were
the insect group that increased most strikingly in the diet of trout
after enrichment. Sialis has been reported in variable amounts in
the stomach contents of trout by Warren et al. (1964) and McIntyre
(1967), but not as an important food item. The production of Sialis
is not of much importance in view of its minor role as a food for trout.
However, its presence as a food resource could be of value at certain
times because it may be available to fish during the months when other
organisms are not available.
103
BIBLIOGRAPHY
Allen, K. R. 1951. The Horokiwi stream: a study of a trout popula-tion. Wellington. 231 p. (New Zealand. Marine Departmentof Fisheries. Bulletin 10)
Anderson, R. 0. and F. F. Hooper. 1956. Seasonal abundance andproduction of littoral bottom fauna in a southern Michigan lake.Transactions of American Microscopical Society 75:259-270.
Balduf, W. V. 1939. The bionomics of entomophagous insects.Chicago, John S. Swift. 384 p.
Brocksen, R. W. , G. E. Davis and C. E. Warren. 1968. Competi-tion, food consumption and production of sculpins and troutin laboratory stream communities. Journal of WildlifeManagement 32:51-75.
Cuyler, R. D. 1956. Taxonomy and ecology of Sialoid Megalopteraof east-central North Carolina with key to and descriptions oflarvae of genera known to occur in United States. Master'sthesis. Raleigh, North Carolina State University. 150 numb.leaves.
Davis, G. E. and C. E. Warren. 1965. Trophic relations of asculpin in laboratory stream communities. Journal of WildlifeManagement 29:846-871.
Davis, G. E. and C. E. Warren. 1968. Estimation of food consump-tion rates. In: Methods of assessment of fish production infreshwaters, ed. by W. E. Ricker. Oxford, BlackwellScientific Publications. P. 204-224. (International BiologicalProgram. Handbook no. 3)
Davis, K. C. 1903. Sialidae of North and South America: aquaticinsects in New York State. Albany. 517 p. (New York. StateMuseum. Bulletin 68)
Dethier, V. G. 1942. Lateral ocelli of caterpillars. Journal of CellComparative Physiology 19:301-313.
Dethier, V. G. 1943. Lateral ocelli of caterpillars. Journal ofCell Comparative Physiology 22:116-126.

104
Du Bois, A. M. and R. Geigy. 1935. Beitrage zur Oekologie,Fortpflanzungsbiologie and Metamorphose von Sialis lutaria L.Review Suisse Zoologie 42:1 69-248.
Du Bois, A. M. 1938. Determination in egg: Sialis, Megaloptera.Review Suisse Zoology 45:1-92.
Dugdale, R. C. 1955. Studies in the ecology of the benthic Dipteraof lake Mendota. Ph. D. thesis. Madison, University ofWisconsin. 99 numb, leaves.
Earnest, R. D. 1967. Production of the snail, Oxytrema silicula(Gould), in an experimental stream. Master's thesis. Corvallis,Oregon State University. 51 numb, leaves.
Flint, 0. S. 1964. New species and new state records of Sialis(Neuroptera:Sialidae). Entomology News 75:9-13.
Geigy, R. and A. M. Du Bois. 1935. SinnesphysiologischeBeobachtungen uber dis Begattung von Sialis lutaria L. ReviewSuisse Zoologie 42:447-457.
Hayne, D. W. and R. C. Ball. 1956. Benthic productivity asinfluenced by fish predation. Limnology and Oceanography1 :162 -175,
Hynes, H. B. N. 1961. The invertebrate fauna of a Welsh mountainstream. Archiv fur Hydrobiologie 57:344-388.
Juday, C. 1940. The annual energy budget of an inland lake.Ecology 21:438-450.
Killington, F. J. 1932. On the pairing of Sialis fuliginosa.Entomologist 65:66-67.
Lestage, J. A. 1918. Notes biologiques sur Sialis lutaria L.Annales de Biologie Lacustre 9:25-40.
Lindeman, R. L. 1941. Seasonal food-cycle dynamics in a senescentlake. American Midland Naturalist 26:636-673.
McIntyre, J, D. 1967. Food relations and production of cutthroattrout, Salmo clarki clarki (Richardson), in an experimentalstream. Master's thesis. Corvallis, Oregon State University.68 numb, leaves.

105
Miall, L. C. 1895. The natural history of aquatic insects. London,Macmillan. 395 p.
Needham, J. G. and C. Betten. 1901. Aquatic insects in theAdirondacks. Albany. P. 383-612. (New York. State Museum.Bulletin 47)
Reese, W. H. 1966. Physiological ecology and structure of benthiccommunities in a woodland stream. Ph. D. thesis. Corvallis,Oregon State University. 134 numb, leaves.
Ricker, W. E. 1946. Production and utilization of fish populations.Ecological Monographs 1 6:374-391.
Ricker, W. E. 1958. Handbook of computations for biologicalstatistics of fish populations. Ottawa. 300 p. (Canada.Fisheries Research Board. Bulletin 119)
Rosel, Von R. 1749.. Sialis lutaria. In: Insekten Belustigungen:2:61.(Cited in: Cuyler, R. D. Taxonomy and ecology of SialoidMegaloptera of east-central North Carolina with key to anddescriptions of larvae of genera known to occur in United States.Master's thesis. Raleigh, North Carolina State University,1 9 56. 150 numb, leaves)
Ross, H. H. 1937. Nearctic alderflies of the genus Sialis. Chicago.p. 57-78. (Illinois. Natural History Survey. Bulletin 21)
Slat, G. 1937. The egg parasite of Sialis lutaria. Parasitology29:539-558.
Selman, B. J. 1961. Tolerance to drying in the haemocytes ofSialis. Journal of Insect Physiology 6:81-83.
Selman, B. J. 1965. The circulatory system of the alder fly,Sialis lutaria. Proceedings of the Zoological Society of London144 :487 -535.
Shaw, J. 1955a. Ionic regulation and water balance in Sialis larva.Journal of Experimental Biology 32:355-382.
Shaw, J. 1955b. Permeability of cuticle in Sialis larva. Journal ofExperimental Biology 32:330-352.

106
Silvestri, F. 1908. Contribuzioni alla conoscenza biologica degliImenotteri parasitti. Boll. Lab. Zool. Gen. e Agraria 3:29-83. (Cited in: Balduf, W. V. The bionomics of entomophagousinsects. Chicago, John S. Swift, 1939. p. 384)
Stadden, B. W. 1955. Nitrogen excretion in aquatic insects: Sialis.Journal of Experimental Biology 32:84-94.
Syms, E. E. 1934. Biological note on British Megaloptera. 1934-1935. Proceedings of the South London Entomological andNatural History Society. p. 121-124.
Townsend, L. H. 1939. A new species of Sialis from Kentucky.Proceedings of the Entomological Society of Washington 41:224-226.
Warren, C. E. , J. H. Wales, G. E. Davis and P. Doudoroff. 1964.Trout production in an experimental stream enriched withsucrose. Journal of Wildlife Management 28:617-660.
Waters, T. F. 1966. Production rate, population density and driftof a stream invertebrate. Ecology 47:595-604.
Wigglesworth, V. B. 1965. The principles of insect physiology.London, Methuen. 741 p.

APPENDICES

107
Appendix I. Larvae of S.at Oak Creek
rotunda obtained in pit-fall traps on shorePond in 1967.
Date Trap No. 1 Trap No. 2 Trap No, 3
April 5 6 0 0
April 7 0 2 0
April 12 1 0 3
April 17 0 3 4
April 21 1 5 7
April 27 5 0 10
May 2 8 2 11
May 6 4 0 8
May 10 6 2 4
May 15 9 0 2
May 19 0 0 3
May 25 4 3 6
June 2 2 0 1
June 12 3 1 2
June 16 0 0 0
June 30 2 1 3
Total 51 19 64

108
Appendix II. Record of Parasitization. of S. rotunda eggs at Oak Creek pond and S. californica eggsat four sections of Berry Creek.
S. rotunda
Month and Total egg ParasitizedYear masses counted egg masses
May 16,
May 23
June 2
June 7
June 10
June 14
June 16
Total
1967 20
31
25
16
21
19
15
147
0
0
2
3
5
5
6
21
S. californica
Month andYear
Section I
Total Parasitized
Section II
Total Parasitized
Section III
Total Parasitized
Section IV
Total Parasitized
June 14, 1966 134 97 55 31 14 3
May 22, 1967 4 0 3 0 8 0 0 0
May 31 11 3 8 2 11 0 0 0
June 8 21 8 12 8 15 2 0 0
June 14 32 11 14 7 19 4 0 0
June 23 34 26 15 11 31 16 0 0
Total (1967) 102 48 52 28 84 22

109
Appendix III. Numbers /m2 and mean weight/individual (mg) ofS. rotunda larvae in Oak Creek pond obtained bysmoothing of curves to compute production accord-ing to Allen's method.
Month No. /m2 Mean weight
May 19 67 387 O. 1 4
June I 389 0. 36
June II 410 0. 9 6
July I 495 1.50
July II 581 2. 55
August I 540 4.25August II 502 6. 25
September I 461 8.75September II 444 12.00
October I 417 16. 25
October II 407 21. 60
November I 371 27.50
November II 351 28.75
December I 332 29.00
December II 318 29. 50
January I, 1968 30 3 30.00January II 290 30.50February I 276 31.25February II 2 68 32.00March I 260 33.00March II 240 34. 25
April I 205 36.75April II 1 65 37. 50
May I 110 37. 50

Appendix N. Numbers/ m2and mean weight/individual (mg) of S. californica larvae of different age groups in four sections of Berry Creek
obtained by smoothing of curves to compute production according to Al lengs method,
Section I Section II
MonthNo/m2
GO1
Meanwt
Nc/m
GO2
Meanwt
GN1
No/m2
GN2
Mean No/ Meanwt m2 wt
GO1
No/ Meanm2 wt
GO2
No/ Meanm2 wt
GN1 GN2
No/ Mean No/ Meanm2 wt m2 wt
Dec. 1965Jan. 1966Feb.Mar.
48443939
49.066.069, 074. 5
161
138
113
91
61, 564, 370. 881.0
Apr. 9 84.0 9 95. 5May 9 95. 5 4 95. 5June 75 36. 3 91 37.7July 65 40. 6 300 3. 6 73 48. 5 112 5, 2Aug. 56 51. 9 250 5. 8 57 74.3 96 14. 6Sept. 49 57.7 208 9, 2 43 83. 0 84 23. 0Oct. 43 61.2 170 11.2 33 88. 7 74 29. 3Nov. 37 64.0 133 14, 8 28 91. 5 64 33, 5Dec. 31 65.0 105 16.4 25 94.0 54 37. 5Jan. 1967 26 65.0 81 17.7 23 95.0 44 36.6
June 1967 111 0. 14 920 0. 05
July 167 0. 29 540 0. 30Aug. 33 1. 60 330 1. 80Sept. 18 1. 80 178 2. 10Oct. 16 2. 30 82 2. 40Nov. 13 2, 70 60 3. 00Dec. 0 0 41 3.20

Appendix IV. Continued
Section III Section IV
GO1
GO2 GN1
GN2 GO1 GO2
GN1 GN2
No/ Mean No/ Mean No/ Mean No/ Mean No/ Mean No/ Mean No/ Mean No/ Mean
m2 m2 rn2 m2 m2 m2 m2 m2Month m wt wt wt m wt m wt m wt m wt m wt
Dec. 1965Jan, 1966
7557
66. 269.2
8778
47. 963. 5
Feb. 40 79. 4 70 79. 4Mar, 22 87. 1 61 81. 3
Apr. 4 91. 2 26 89. 1
May 4 91. 2 4 89. 1
June 30 32, 8 39 39, 8
July 30 66.8 68 5. 2 37 71.0 55 9. 3
Aug. 30 76.7 62 25, 2 34 77.8 51 28. 2
Sept. 30 78.2 57 35.0 31 82. 3 47 36. 0
Oct. 30 78, 2 51 41. 5 29 85.0 42 42. 2
Nov. 30 79. 1 47 46. 2 26 87.4 38 46.0Dec. 30 79. 1 40 47. 7 23 89.0 33 48, 0
Jan. 1967 30 84.8 34 47.7 20 89.3 29 49.5
June 1967 55 1.2 51 2. 4
July 103 4.0 70 9, 3
Aug. 75 5.2 65 20, 5
Sept. 53 14,2 47 31. 3
Oct. 37 25.4 29 35.7Nov. 25 29.7 0 0
Dec. 21 29, 7 0 0