DARLINGTONIA CALIFORNICA PHYTOTELMA ORGANISMS: …
54
DARLINGTONIA CALIFORNICA PHYTOTELMA ORGANISMS: SPATIAL RELATIONS WITHIN THE METACOMMUNITY By Stefani Brandt A Thesis Presented to The Faculty of Humboldt State University In Partial Fulfillment of the Requirements for the Degree Master of Science in Biology Committee Membership Dr. Michael Camann, Committee Chair Dr. Erik Jules, Committee Member Dr. Michael Mesler, Committee Member Dr. Edward Metz, Committee Member Dr. Erik Jules, Program Graduate Coordinator December 2017
Transcript of DARLINGTONIA CALIFORNICA PHYTOTELMA ORGANISMS: …
DARLINGTONIA CALIFORNICA PHYTOTELMA ORGANISMS:
SPATIAL RELATIONS WITHIN THE METACOMMUNITY
By
Stefani Brandt
A Thesis Presented to
The Faculty of Humboldt State University
In Partial Fulfillment of the Requirements for the Degree
Master of Science in Biology
Committee Membership
Dr. Michael Camann, Committee Chair
Dr. Erik Jules, Committee Member
Dr. Michael Mesler, Committee Member
Dr. Edward Metz, Committee Member
Dr. Erik Jules, Program Graduate Coordinator
December 2017

ii
ABSTRACT
DARLINGTONIA CALIFORNICA PHYTOTELMA ORGANISMS:
SPATIAL RELATIONS WITHIN THE METACOMMUNITY
Stefani Brandt
The California pitcher plant, Darlingtonia californica, provides a unique setting to
research community ecology because it harbors small ponds of water, or phytotelmata, in its
modified leaves. Each phytotelma hosts a unique community of various invertebrates who
live among carcasses of drowned plant prey. These pitchers and their inquiline communities
are relatively small yet abundant in the wild, resulting in an ideal natural setup for
community composition comparisons. There have been no previous studies that research D.
californica inquiline communities across multiple geographic regions concurrently. This
study sought to survey phytotelma communities throughout the range of D. californica at
three spatial scales- regions (the largest geographic scale), fens (a more localized scale), and
pitchers (the smallest scale). Community composition metrics were calculated to compare
richness, evenness, diversity, and abundance among the four regions. Seven taxa and 14,358
individuals were recorded in the 93 pitchers sampled in National Forests throughout
southern Oregon and northern California. Non-metric multidimensional scaling ordination
showed slight groupings of samples within regions. Community composition of pitchers was
more similar within regions than between regions and within fens than between fens.
Statistical analyses showed that region predicted variance between pitchers, and that all of

iii
the paired combinations of regions were significantly different from one another except for
the two highest elevation regions. Further tests showed some significant differences in
individual species’ abundance between regions, but not in univariate community
composition metrics. The D. californica phytotelma communities were then compared to
those of other pitcher plant species.

iv
ACKNOWLEDGEMENTS
Thank you to the California Native Plant Society and the Humboldt State University
Biology Graduate Student Association for granting research funding towards my project. I
appreciate the permission to collect these beautiful plants from the Rogue River-Siskiyou,
Six Rivers, Shasta-Trinity, and Plumas National Forests. Many thanks to my advisor
Michael Camann for providing guidance and advice throughout the entire process of my
Graduate experience. A special thank you to my committee members - Dr. Jules, Dr. Mesler,
and Dr. Metz- who have provided direction with my project, compelling and entertaining
conversations (often unrelated to Darlingtonia), and companionship in the Biology
Department. The most rewarding part of this Master’s degree has been my teaching
experience, so a major thank you to all of my teaching supervisors - Courtney Otto, Michael
Camann, Kristine Brenneman, Mihai Tomescu, Edward Metz, Michael Mesler, and Robin
Bencie - and to the 668 students I’ve been lucky enough to share a classroom with. I would
not have been able to get by without the academic consultations and social experiences with
some of my fellow graduate students- Erin Alvey, Melissa DeSiervo, Mason London, and
especially Jay Jackson and Kate Ludwig. The unconditional support from Taylor Strawn and
Jay Jackson have been a grounding and inspirational force throughout the entirety of this
research project. This report is dedicated to the memory of my friend and fellow HSU
Biology graduate student, Zach Badaoui.

v
TABLE OF CONTENTS
ABSTRACT ............................................................................................................................ ii
ACKNOWLEDGEMENTS .................................................................................................... iv
METHODOLOGY .................................................................................................................. 5
Sampling Design & Selection Methods ............................................................................... 5
Community Assessment ...................................................................................................... 7
Data Analysis ....................................................................................................................... 8
RESULTS AND DISCUSSION ............................................................................................ 11
The Inquiline Species ........................................................................................................ 11
Community Analysis ......................................................................................................... 15
Interpretation And Comparison ......................................................................................... 18
Future ................................................................................................................................. 24
LITERATURE CITED .......................................................................................................... 27
APPENDIX ........................................................................................................................... 44
Region and Fen Descriptions ............................................................................................. 44

vi
LIST OF TABLES
Table 1. Species abundances organized by region. The last row is the proportion of total
abundance found at each region. The last column represents the species’ abundance out of
the total abundance. ............................................................................................................... 32
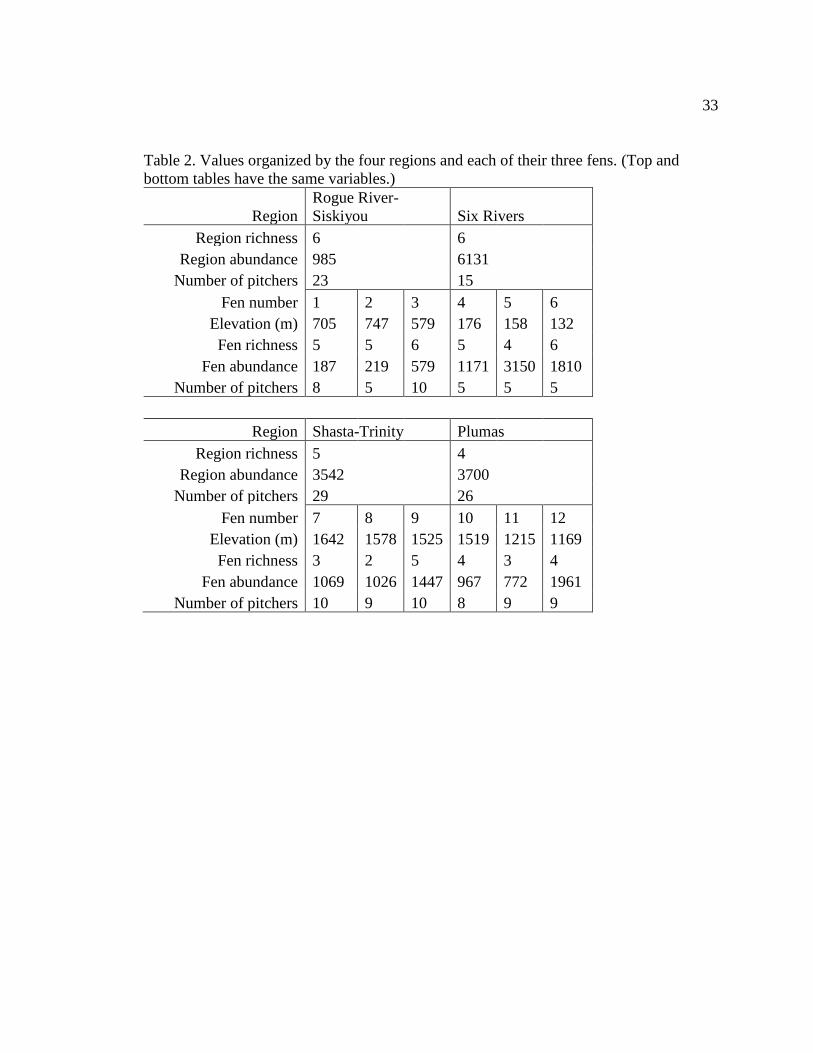
Table 2. Values organized by the four regions and each of their three fens. (Top and bottom
tables have the same variables.) ............................................................................................. 33
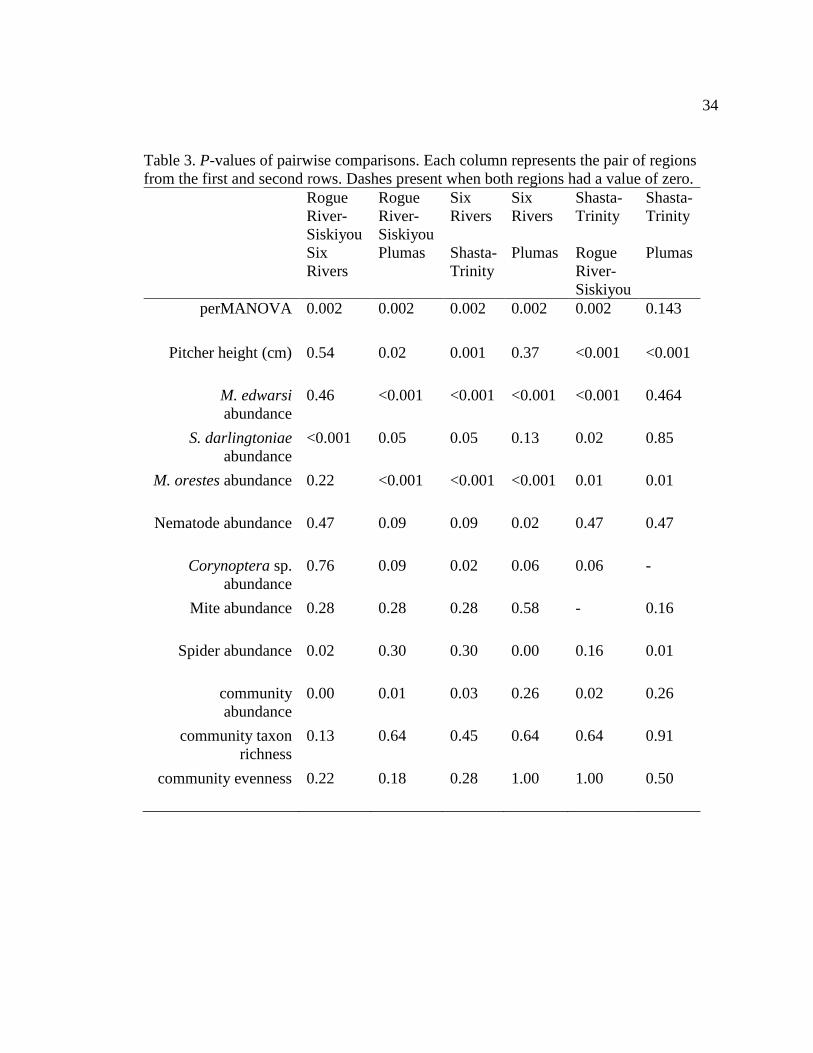
Table 3. P-values of pairwise comparisons. Each column represents the pair of regions from
the first and second rows. Dashes present when both regions had a value of zero. .............. 34
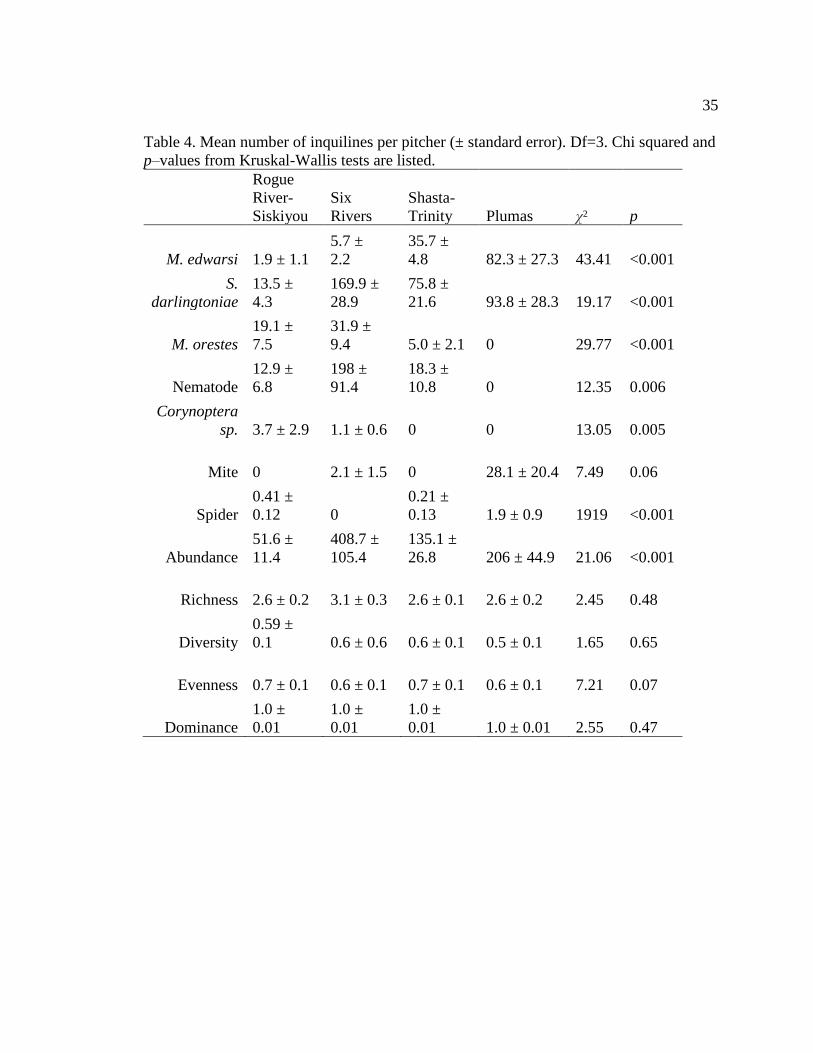
Table 4. Mean number of inquilines per pitcher (± standard error). Df=3. Chi squared and p–
values from Kruskal-Wallis tests are listed. .......................................................................... 35
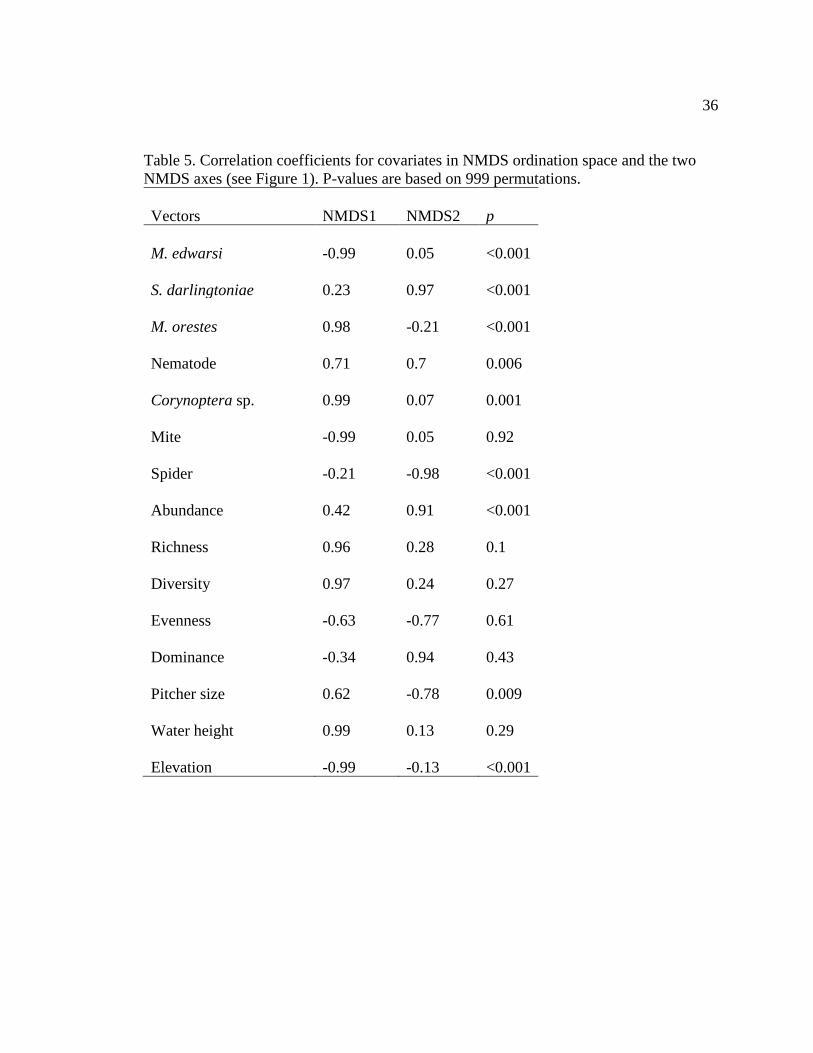
Table 5. Correlation coefficients for covariates in NMDS ordination space and the two
NMDS axes (see Figure 1). P-values are based on 999 permutations. .................................. 36
vii
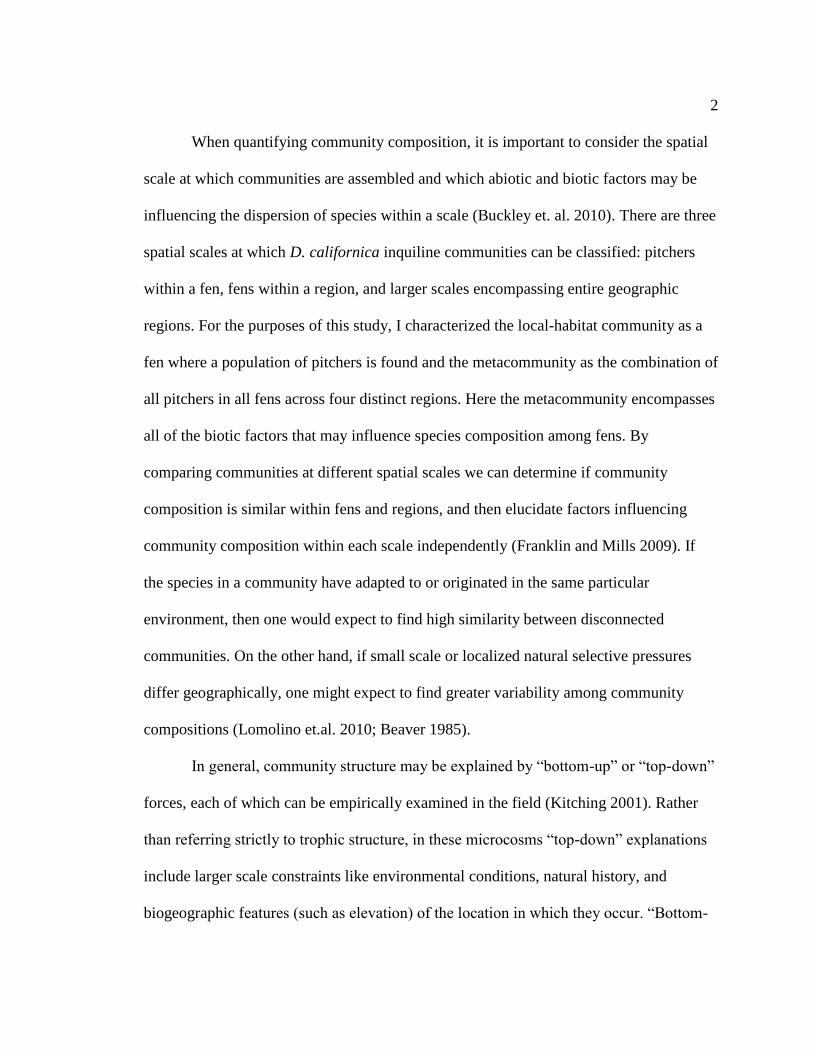
LIST OF FIGURES
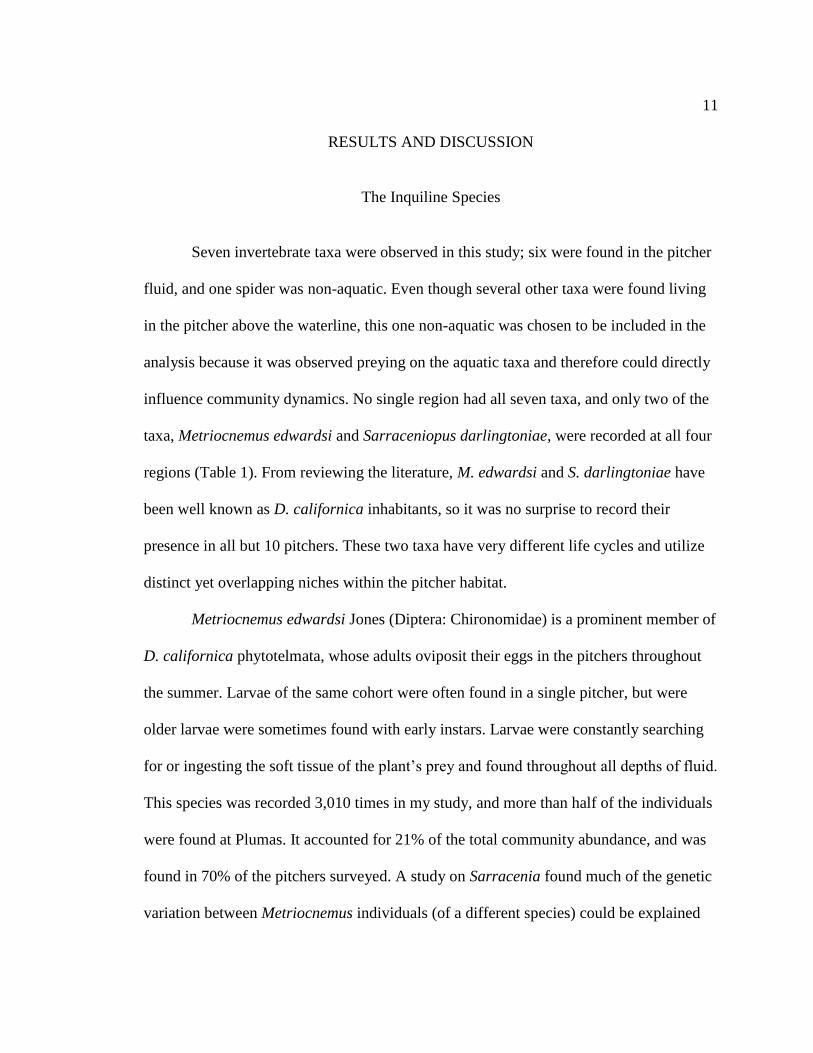
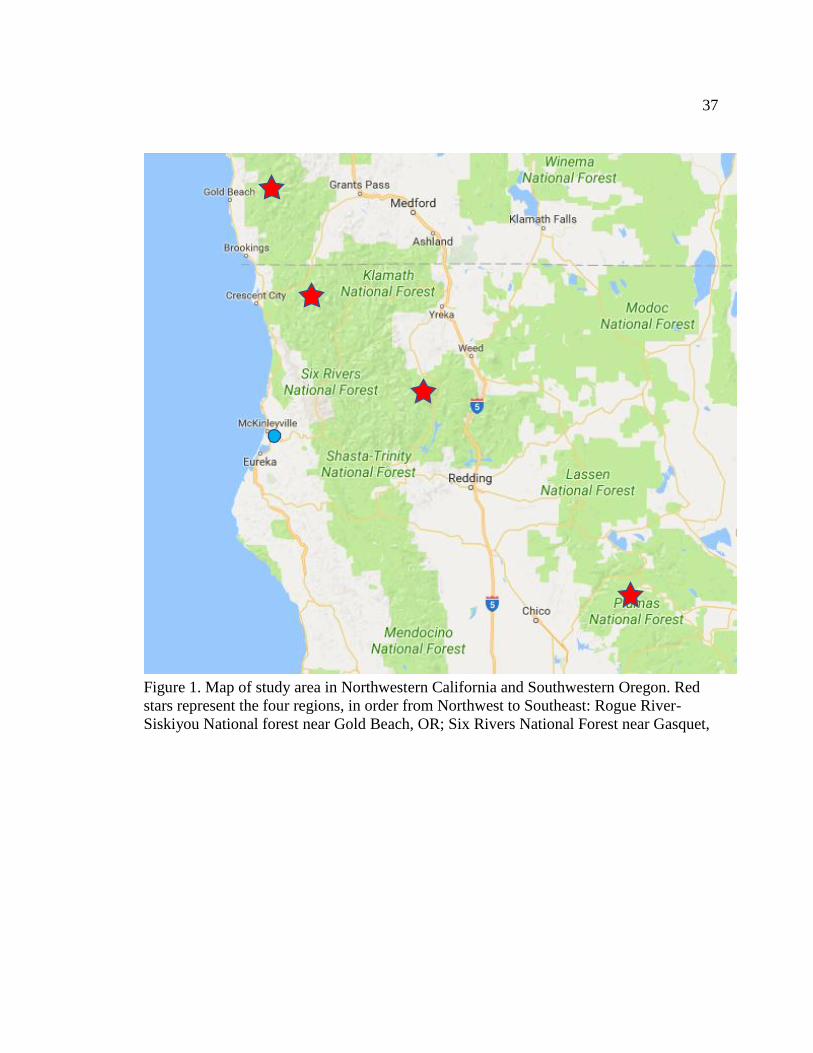
Figure 1. Map of study area in Northwestern California and Southwestern Oregon. Red stars
represent the four regions, in order from Northwest to Southeast: Rogue River-Siskiyou
National forest near Gold Beach, OR; Six Rivers National Forest near Gasquet, ................ 37
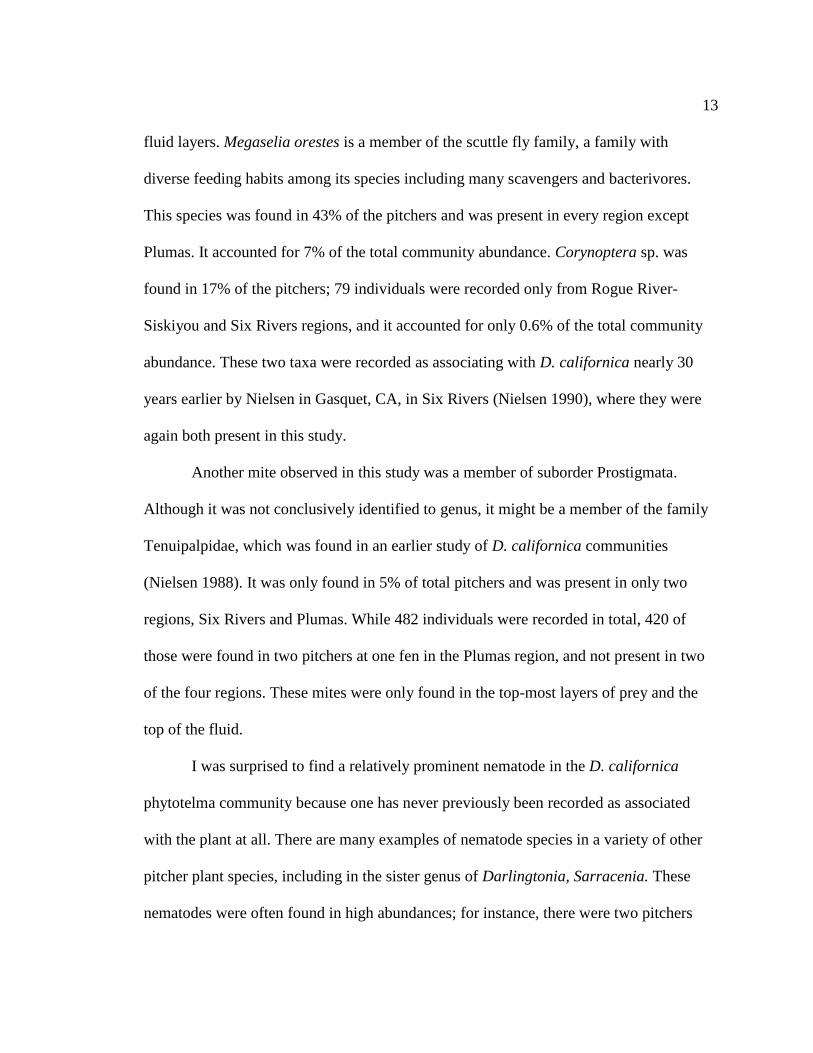
Figure 2. A typical Darlingtonia californica habitat growing in and around a small stream. 38
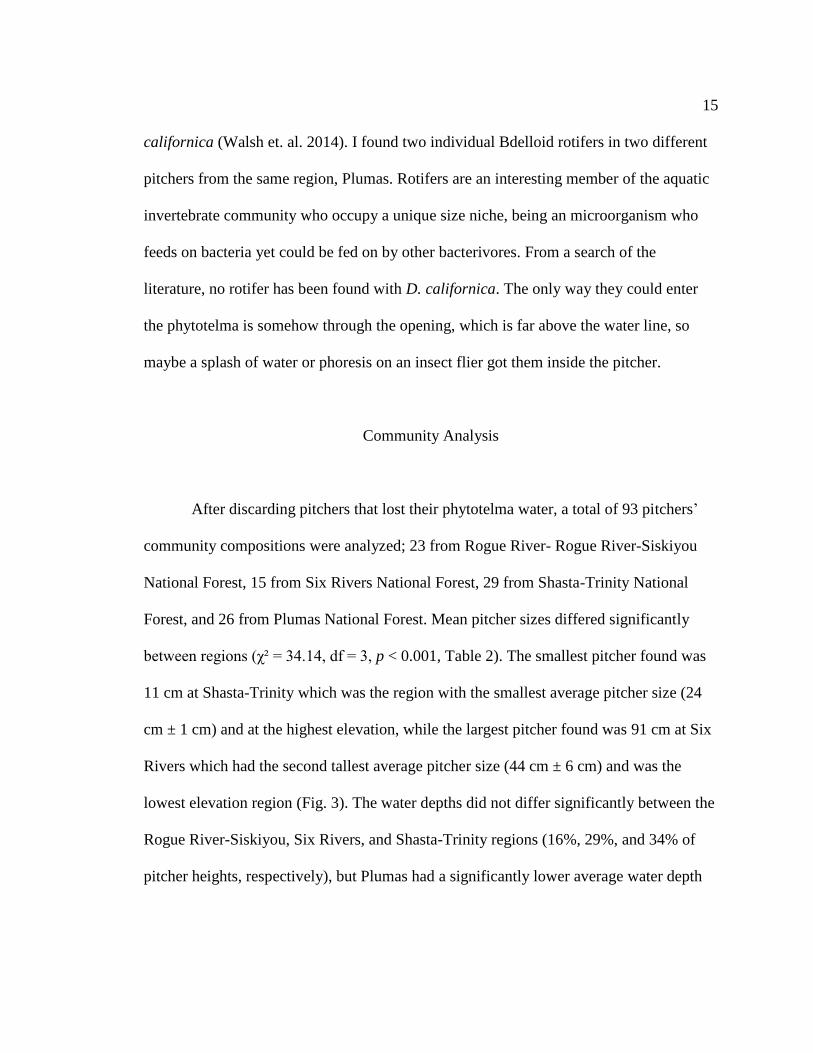
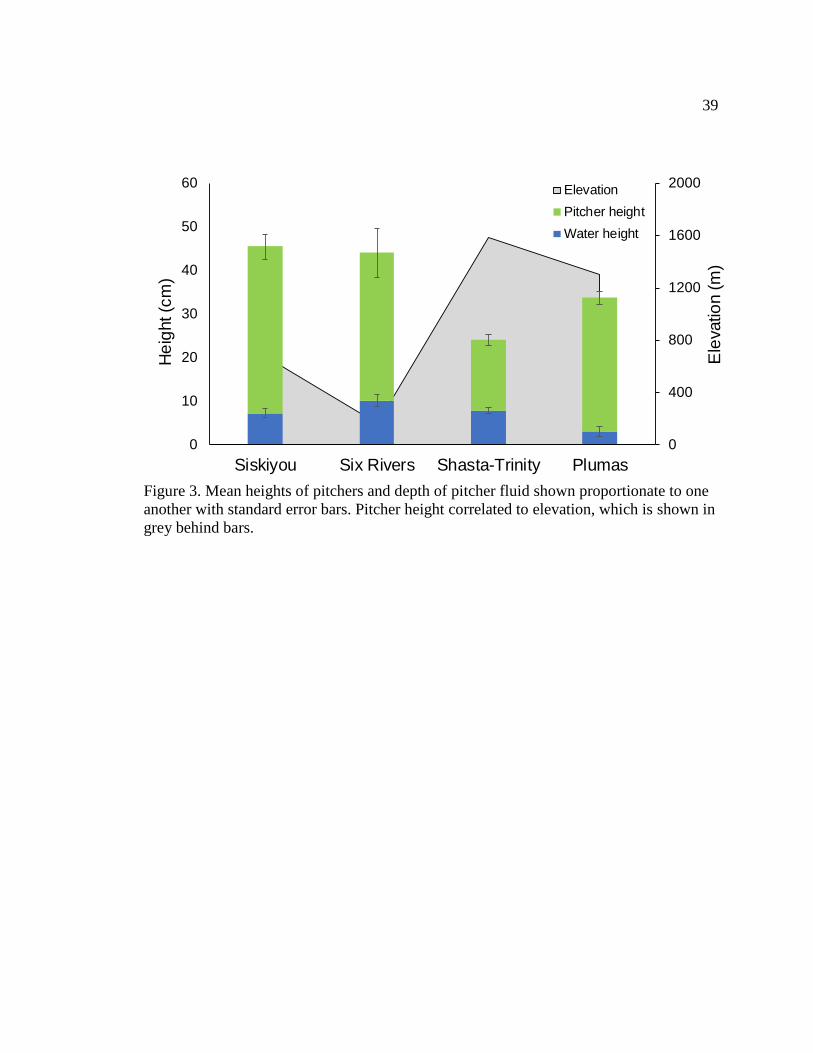
Figure 3. Mean heights of pitchers and depth of pitcher fluid shown proportionate to one
another with standard error bars. Pitcher height correlated to elevation, which is shown in
grey behind bars. .................................................................................................................... 39
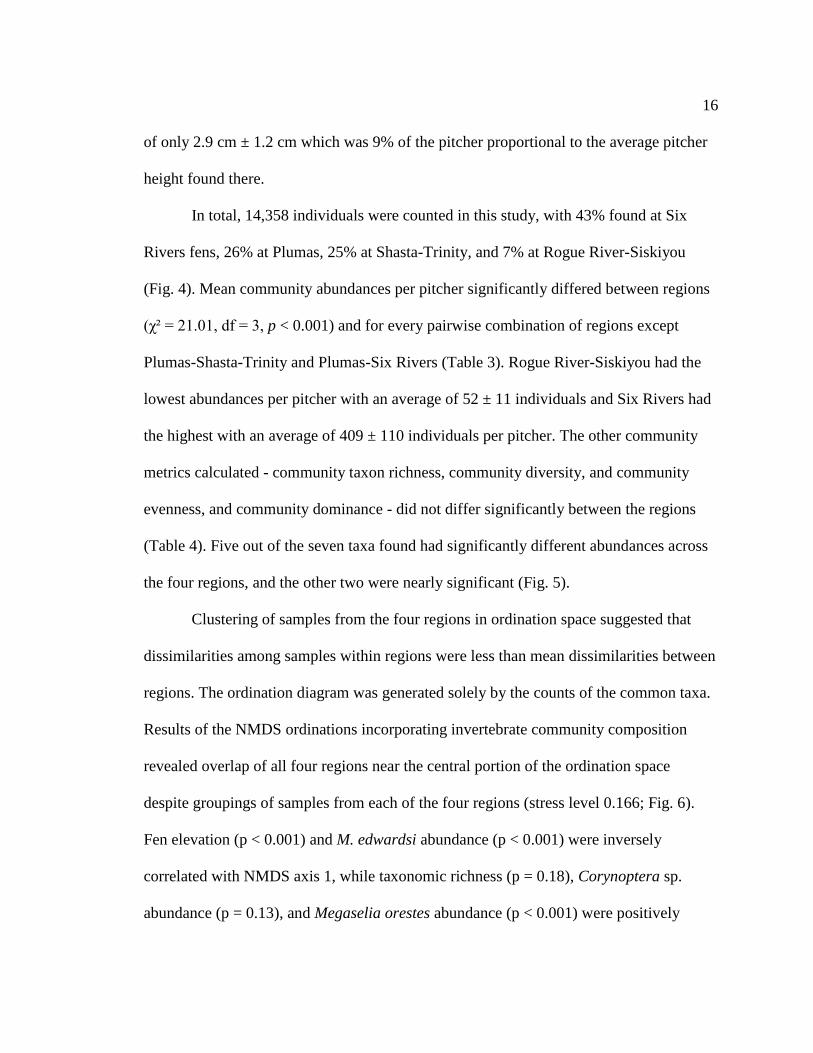
Figure 4. Total abundances of all taxa combined grouped by region and stratified by fen
within regions. Although abundances were significantly different from one another, the
differences did not correlate to elevation. (Sample sizes (n= number of pitchers sampled)
were Siskiyou n= 23; Six Rivers n= 15; Shasta-Trinity n= 25; Plumas n= 26). ................... 40
Figure 5. Abundances of each taxon grouped by fens, with fens color coded by region. From
left to right: S. darlingtoniae, nematode, M. edwarsi, M. orestes, mite, Corynoptera sp.,
spider. ..................................................................................................................................... 41
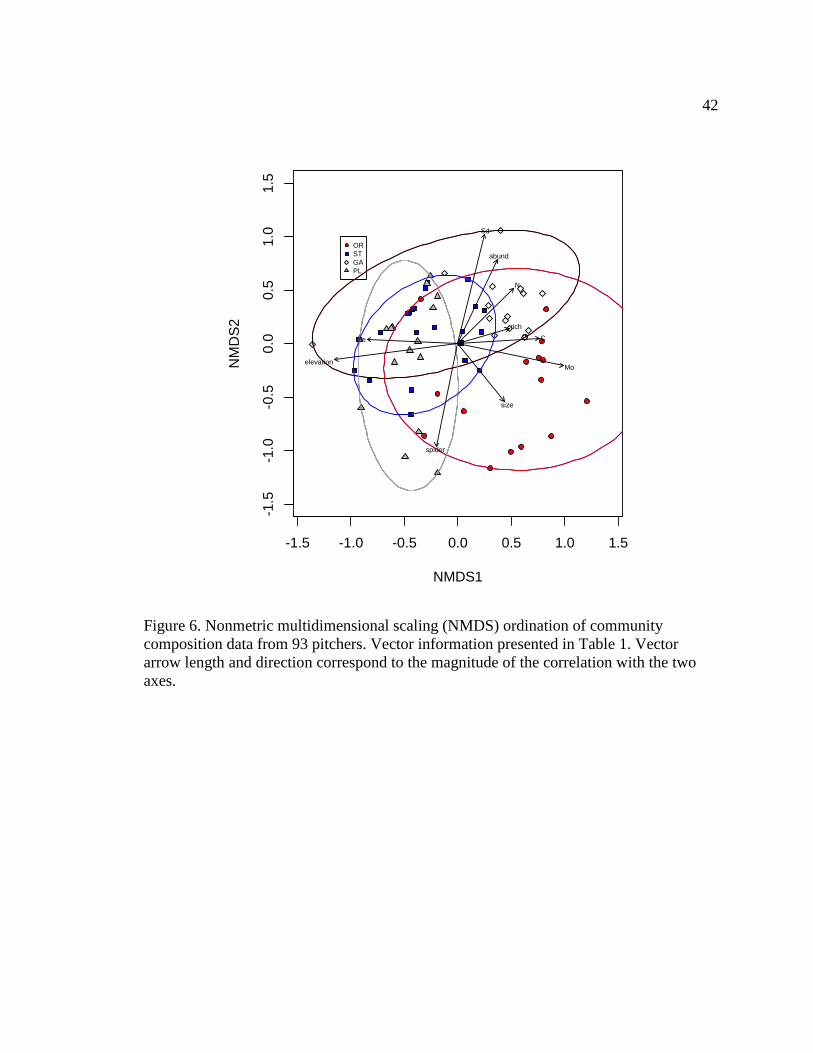
Figure 6. Nonmetric multidimensional scaling (NMDS) ordination of community
composition data from 93 pitchers. Vector information presented in Table 1. Vector arrow
length and direction correspond to the magnitude of the correlation with the two axes. ...... 42
Figure 7. A dendrogram of Bray-Curtis mean dissimilarity by region. (OR= Siskiyou; GA=
Six Rivers; PL= Plumas; ST= Shasta-Trinity.) Each region’s segment terminated to the
within-region dissimilarity value represented on the y-axis. The closer any two are on the
dendrogram, the less dissimilar they are between regions. For example, Siskiyou (OR) had
more within-region dissimilarity than the group containing the other three regions. Plumas’
(PL) segment is reversed because it had more dissimilarity within the region than the
combination of Plumas and Shasta-Trinity (ST). .................................................................. 43

1
INTRODUCTION
The charismatic California pitcher-plant, Darlingtonia californica Torrey
(Sarraceniaceae), is the sole carnivorous pitcher plant found west of the Rocky
Mountains whose range extends from northern California to western Oregon. It is
distinctly different from other carnivorous pitcher plants with its fully hooded pitcher
covering, and its lack of producing digestive enzymes (Ellison & Farnsworth 2004). It is
also taxonomically distinct as a monotypic species within genus Darlingtonia (Baldwin
et. al. 2012). Like all pitcher plants, the highly modified leaves function at as a
phylotelma, or “plant - pond” where a host of aquatic invertebrates live within the fluid of
the pitcher (Fish 1985). These inquiline communities are interconnected through the
trophic interactions of their food web (Kitching 2001; Beaver 1985) and share a
mutualistic relationship with the host pitcher by providing the plant with nutrients
through decomposition in exchange for a well-protected and resource-rich home
(Adlassnig et al. 2010). The relatively undisturbed inquiline organisms inside each
pitcher represents a discrete community, and because of this configuration, pitcher plants
are favorable model systems for studying spatial patterns of community composition
(Buckley et al. 2010). Numerous studies have examined the communities of pitcher
plants but most have focused on Sarracenia purpurea, found in the eastern United States
(Ellison et. al. 2012). Of those studies conducted using D. californica phytotelma, none
have attempted to quantify the community across the entirety of its range.
2
When quantifying community composition, it is important to consider the spatial
scale at which communities are assembled and which abiotic and biotic factors may be
influencing the dispersion of species within a scale (Buckley et. al. 2010). There are three
spatial scales at which D. californica inquiline communities can be classified: pitchers
within a fen, fens within a region, and larger scales encompassing entire geographic
regions. For the purposes of this study, I characterized the local-habitat community as a
fen where a population of pitchers is found and the metacommunity as the combination of
all pitchers in all fens across four distinct regions. Here the metacommunity encompasses
all of the biotic factors that may influence species composition among fens. By
comparing communities at different spatial scales we can determine if community
composition is similar within fens and regions, and then elucidate factors influencing
community composition within each scale independently (Franklin and Mills 2009). If
the species in a community have adapted to or originated in the same particular
environment, then one would expect to find high similarity between disconnected
communities. On the other hand, if small scale or localized natural selective pressures
differ geographically, one might expect to find greater variability among community
compositions (Lomolino et.al. 2010; Beaver 1985).
In general, community structure may be explained by “bottom-up” or “top-down”
forces, each of which can be empirically examined in the field (Kitching 2001). Rather
than referring strictly to trophic structure, in these microcosms “top-down” explanations
include larger scale constraints like environmental conditions, natural history, and
biogeographic features (such as elevation) of the location in which they occur. “Bottom-

3
up” explanations include intra- and interspecific interactions, and pitcher-specific
resource (such as pitcher and water height) and chemical qualities (Kitching 2001). It is
known that there is some degree of community structure heterogeneity (or, patchiness)
between phytotelmata (Sunahara & Mogi 2004), but it is unclear if this patchiness is also
characteristic of community structure at other spatial scales, as in, for example, between
nearby fens or between geographical regions within the range of D. californica.
Most of the previous research has not focused on the co-evolved symbiotic
relationship between D. californica and its inquiline aquatic invertebrates, but it has been
argued that their affiliation is an intimate obligate mutualism (Ellison et al. 2012).
Darlingtonia californica does not produce its own digestive enzymes; instead, it relies on
the community of organisms within the phytotelma to break down and mineralize prey
while providing a habitat and food for this community of insects. Without this
mineralization process, the plant would not have the means to absorb the necessary
chemical components for life (Adlassnig et. al. 2010). This dependence on an aquatic
community is particularly interesting because D. californica is the most insect-dependent
carnivorous plant with 76% of its nitrogen derived from insects (Schultze et. al. 1997).
This strong dependence of mutualistic activity suggests that the host plant has coevolved
via reciprocal selection to some degree with the inquiline communities presented in this
study.
The community composition of inquiline organisms in D. californica has been
described at least twice in the past four decades, yet attention of the species-specific
interactions between inquiline organisms and D. californica are poorly understood
4
(Aditya et.al. 2008). In 1990, Nielsen performed a study on the arthropods associated
with D. californica which resulted in seven aquatic species and very little similarity of
inquiline community compositions among 124 pitchers in three fens in Gasquet, CA
(Nielsen 1988). Another study found only two species of aquatic arthropods in 119 D.
californica pitchers in Butterfly Valley, Plumas county, CA (Naeem 1988). This
inconsistency of community composition between and within regions could have been
due to sampling differences, or it could have been a product of real biogeographical
differences between communities.
To examine the spatial patterns of inquiline community structure, I quantified the
invertebrate biodiversity within D. californica pitchers, along with selected elements of
abiotic conditions, across three levels of space – 1) the pitcher, 2) the fen, and 3) the
region – and compared the within and between levels of similarities. My objectives were
to first quantify the spatial patterns of community structure among phytotelma-associated
species between fens and regions, and second, determine if select abiotic and biotic
factors explain community structure.

5
METHODOLOGY
Sampling Design & Selection Methods
The diversity and abundance of phytotelma species were studied on three nested
spatial scales. To characterize D. californica communities at the largest possible scale, I
sampled four regions across the range of D. californica: Gold Beach in the Rogue River-
Siskiyou National Forest, OR; Gasquet in the Six Rivers National Forest, CA; Mount
Eddy in Shasta-Trinity National Forest, CA; and Quincy in Plumas National Forest, CA
(Fig. 1). (The regions will be referred to as Rogue River-Siskiyou, Shasta-Trinity, Six
Rivers, and Plumas respectively, see appendix.) These four regions were chosen because
they stretch across the majority of the range of D. californica. To see if there is variation
on a more localized geographic scale, I collected pitchers from three different fens per
region, totaling twelve fens. Fen elevations (m) were measured. To account for pitcher
habitat variation I collected ten pitchers at each of the twelve fens, for a total of 120
pitchers. Pitcher variables included pitcher height (cm) and pitcher fluid depth (cm).
Permits for collection were required from each National Forest since D.
californica is a protected plant, and sample size was limited by each jurisdiction’s
collection protocol. At each fen, ten pitchers were collected no less than one meter apart
from each other. Darlingtonia californica forms below-ground or surface-level rhizomes
that connect rosettes of pitchers together (personal observation, Fig. 2). Rosettes
generally consist of a small mound of last year’s browning leaves as well as the present

6
season’s new leaves. The first leaf to emerge each year is almost always the tallest in the
rosette. New leaves can continue emerging throughout the growing season but become
significantly smaller towards autumn. Pitchers first fill up with sterile water (Hepburn et.
al 1927) and then open up to the environment at the rim near the top of the pitcher
(although there is debate as to whether or not the pitcher fluid is truly sterile before
opening).
Pitchers of about the same age were collected, since abundance of aquatic insect
immatures has been shown to be positively correlated with phytotelma size (Aditya et.al.
2008). I systematically moved through fen collections starting with the lowest elevation
on June 30th, 2015 and finished with the highest elevation on August 19, 2015. Average
height of pitchers often differed between fens, even within one region, so instead of
always choosing a pitcher at one particular height (say, 70 cm), the second tallest pitcher
in the rosette was the one selected, which resulted in the pitchers having a greater chance
of being the same age. To qualify for selection the pitcher could not have major
abnormalities such as holes in the leaf wall, damage to the opening of the pitcher, or large
arachnid occupants. To minimize the fluid loss, I carefully snapped off individual
pitchers at the base and placed them in a large Ziploc® bag. The bags were set in a cooler
with towel-wrapped ice packs for transport, all while ensuring that the pitchers were held
vertically.
7
Community Assessment
No more than 18 hours after collecting pitchers from a region, the 30 pitchers
were brought to the Biocore Laboratory at Humboldt State University where a dissecting
microscope and camera were used to identify and count each living individual in each
pitcher. Only the aquatic macroinvertebrates were counted because they were expected to
be a more exclusive community due to their highly specific niche, therefore lowering my
chances of counting taxa that might not be direct D. californica associates. Five intact
pitchers were collected from each fen to rear larvae to adulthood for identification, as
parasitoid hymenoptera have previously been found this way (Nielsen 1990), but all
community members perished before any adults were ever collected. Since laboratory
conditions differ greatly from their natural ones, there was a limited amount of time
before the communities started to change, so the decision to limit the sampling to only
aquatic invertebrates also opened up time that was allotted to maximizing the sample
size. The entire contents of the phytotelma, including the pitcher wall and insides of
decomposing carcasses, was searched for living individuals. It was important to count
each living individual, as the interactions of species may play more of a role in
community composition than environmental factors (Dezerald et. al. 2016). If a single
taxon exceeded 1,000, I stopped counting higher and recorded the abundance as 1,000.
Microorganisms (including Rotifers) were not surveyed equally among pitchers or
regions; instead, I chose pitchers haphazardly based on unusually high community
richness or simply because there was extra time available, therefore conclusions cannot
8
be drawn regarding their presence or absence in any region. Spiders inhabiting the space
inside of a pitcher just above the water level, who may play a role in the community of
interest, were the only non-aquatic taxon recorded. Pitcher fluids from two systematically
chosen pitchers per fen were further investigated for rotifers using a compound
microscope. Along with the abundances of each taxon, the pitcher’s height (the lower
most part of the pitcher to the top of its hood), and depth of water were measured.
Data Analysis
This study used exploratory data analysis as well as hypothesis testing to identify
patterns of community structure and potentially relevant covariates. I attempted to falsify
the hypothesis that community composition is the same in all pitchers, and therefore
independent of fen and region. Five community structure metrics- taxon richness,
community abundance, community diversity (Brillouin index), community evenness
(Camargo index), and community dominance (estimated as the proportion of community
composition accounted for by the three most abundant species) - were calculated for
comparison between regions. Kruskal-Wallis non-parametric tests were performed to test
for any differences between regions in individual taxon abundances and community
metrics. Any significant Kruskal-Wallis tests that indicated significant differences were
followed by pairwise Wilcoxon rank-sum tests to determine where the differences
between regions lie.

9
The Non-metric MultiDimensional Scaling (NMDS) axes are sometimes
described as pseudo-gradients (after a necessary rotation of the ordination space) because
they relate measured environmental covariates to the unknown environmental gradients
presumed to structure community composition. The location of each sample in ordination
space is ordered along the two NMDS axes. Correlations between covariates and the
NMDS axes help us interpret the habitat conditions represented by pseudo-gradients.
Greater dissimilarity indicates community assemblages that differ.
Taxa were removed from the ordination if they were present in fewer than 10% of
the pitchers which is a standard for accounting for sampling effort. Species abundance,
taxon richness, community diversity, community evenness, and community dominance
metrics were each calculated and treated as covariates. The abiotic data included as
covariates were pitcher water level (height:cm), size (height:cm) of pitcher, and
elevation. Incorporating all of the previous considerations, NMDS ordination was
performed using 10,000 permutations and visualized by grouping pitchers by region. In
order to account for the multiple nested spatial scales I compared the Bray-Curtis
dissimilarities between and within regions and fens. This allowed for an equal
comparison of pitcher community variability between multiple scales of space.
Samples were analyzed for differences in community composition against
multiple variables using Permutational Multivariate Analysis of Variance
(perMANOVA) to assess the likelihood that observed differences among discrete groups
of samples might have occurred by chance. This tested the null hypothesis that the
centroids and dispersions of groups do not differ from one another. The same set of
10
community composition data used in the ordination was used for perMANOVA, with
covariates elevation (m), region, size (height) of pitcher, pitcher water depth (height), as
well as interactions between any two or more of the covariates. For this perMANOVA,
999 permutations were used. To further compare which regions differed significantly
from one another, I also performed a pairwise perMANOVA with a p-value adjustment
for multiple comparisons.
11
RESULTS AND DISCUSSION
The Inquiline Species
Seven invertebrate taxa were observed in this study; six were found in the pitcher
fluid, and one spider was non-aquatic. Even though several other taxa were found living
in the pitcher above the waterline, this one non-aquatic was chosen to be included in the
analysis because it was observed preying on the aquatic taxa and therefore could directly
influence community dynamics. No single region had all seven taxa, and only two of the
taxa, Metriocnemus edwardsi and Sarraceniopus darlingtoniae, were recorded at all four
regions (Table 1). From reviewing the literature, M. edwardsi and S. darlingtoniae have
been well known as D. californica inhabitants, so it was no surprise to record their
presence in all but 10 pitchers. These two taxa have very different life cycles and utilize
distinct yet overlapping niches within the pitcher habitat.
Metriocnemus edwardsi Jones (Diptera: Chironomidae) is a prominent member of
D. californica phytotelmata, whose adults oviposit their eggs in the pitchers throughout
the summer. Larvae of the same cohort were often found in a single pitcher, but were
older larvae were sometimes found with early instars. Larvae were constantly searching
for or ingesting the soft tissue of the plant’s prey and found throughout all depths of fluid.
This species was recorded 3,010 times in my study, and more than half of the individuals
were found at Plumas. It accounted for 21% of the total community abundance, and was
found in 70% of the pitchers surveyed. A study on Sarracenia found much of the genetic
variation between Metriocnemus individuals (of a different species) could be explained

12
by landscape variables such as density of pitchers within bogs and bog size (Rasic &
Keyghobadi 2011). This suggests that environmental information other than what was
collected in this study could help explain the community-scale distribution patterns of M.
edwardsi.
Sarraceniopus darlingtoniae Fashing & O’Connor (Arachnida: Histiostomatidae)
was often found in the same pitchers as M. edwardsi. Unlike holometabolous insects,
mites go through multiple nymphal stages before becoming adults, who resemble the
largest nymphs. In most pitchers there were multiple life stages present together. Little is
known about the biology or ecology of this particular species, probably in part because it
is restricted to such a limited habitat. It is restricted to D. californica pitchers and is an
obligatory inhabitant. These mites are able to move out of pitchers in certain nymphal
stages and so disperse to new pitchers this way. Sarraceniopus darlingtoniae was found
in 67% of the pitchers sampled and was present in all four regions. It was the most
abundant taxon in this study at 6103 individuals, and it accounted for 42.5% of the total
community abundance. It was found in the highest numbers in Six Rivers, which had an
average abundance of 170 individuals in each pitcher, and found least frequently in
Rogue River-Siskiyou with only 14 individuals on average per pitcher. These mites were
seen all throughout the pitcher, including below the water level deep within the pitcher
fluid at times.
Two additional semi-aquatic flies were far less abundant: Corynoptera sp.
(Diptera: Sciaridae), and Megaselia orestes Borgmeier (Diptera: Phoridae). Both species
are detritivores and were observed actively foraging on prey carcasses near the top of the
13
fluid layers. Megaselia orestes is a member of the scuttle fly family, a family with
diverse feeding habits among its species including many scavengers and bacterivores.
This species was found in 43% of the pitchers and was present in every region except
Plumas. It accounted for 7% of the total community abundance. Corynoptera sp. was
found in 17% of the pitchers; 79 individuals were recorded only from Rogue River-
Siskiyou and Six Rivers regions, and it accounted for only 0.6% of the total community
abundance. These two taxa were recorded as associating with D. californica nearly 30
years earlier by Nielsen in Gasquet, CA, in Six Rivers (Nielsen 1990), where they were
again both present in this study.
Another mite observed in this study was a member of suborder Prostigmata.
Although it was not conclusively identified to genus, it might be a member of the family
Tenuipalpidae, which was found in an earlier study of D. californica communities
(Nielsen 1988). It was only found in 5% of total pitchers and was present in only two
regions, Six Rivers and Plumas. While 482 individuals were recorded in total, 420 of
those were found in two pitchers at one fen in the Plumas region, and not present in two
of the four regions. These mites were only found in the top-most layers of prey and the
top of the fluid.
I was surprised to find a relatively prominent nematode in the D. californica
phytotelma community because one has never previously been recorded as associated
with the plant at all. There are many examples of nematode species in a variety of other
pitcher plant species, including in the sister genus of Darlingtonia, Sarracenia. These
nematodes were often found in high abundances; for instance, there were two pitchers

14
with over 1,000 nematodes, and most of the pitchers with nematodes had over 100
individuals. They were found in all regions except for Plumas, and 3,630 individuals
were recorded in total among the other three regions. They accounted for 25% of the total
abundance, but likely comprised a small fraction of the total biomass because of their
small size. It is possible that these nematodes are endoparasites of insects and they
emerge only after their host’s death by pitcher carnivory. Sometimes all nematodes were
found at the very base of the pitcher fluid, while other times they were found scattered
throughout the fluid and carcasses.
The final taxon recorded was a spider of the family Linyphiidae who was
associated with the aquatic community as a predator. These spiders were observed with a
high diversity of insects captured in their webs which included at least four from this
study- S. darlingtoniae, unknown mite, M. edwardsi and M. orestes. Spiders were found
in 24% of all pitchers, but never recorded in Six Rivers. They were never recorded in Six
Rivers, but it is possible that their presence may have been recorded in some pitchers that
had to be removed from the study (due to lack of fluid). Though there were 42
individuals found (accounting for 0.3% of the community abundance) 22 of those
individuals were very young and recorded in only two pitchers, while the rest of the
pitchers had only a single older individual.
I searched for rotifers in a select few pitchers collected each region. I was told of
their presence in D. californica (David Armitage, personal communication), and I
observed their presence in nearby creek water samples. Since their excrement provides
nitrogen and phosphorus, they could be important players in mineral nutrition for D.
15
californica (Walsh et. al. 2014). I found two individual Bdelloid rotifers in two different
pitchers from the same region, Plumas. Rotifers are an interesting member of the aquatic
invertebrate community who occupy a unique size niche, being an microorganism who
feeds on bacteria yet could be fed on by other bacterivores. From a search of the
literature, no rotifer has been found with D. californica. The only way they could enter
the phytotelma is somehow through the opening, which is far above the water line, so
maybe a splash of water or phoresis on an insect flier got them inside the pitcher.
Community Analysis
After discarding pitchers that lost their phytotelma water, a total of 93 pitchers’
community compositions were analyzed; 23 from Rogue River- Rogue River-Siskiyou
National Forest, 15 from Six Rivers National Forest, 29 from Shasta-Trinity National
Forest, and 26 from Plumas National Forest. Mean pitcher sizes differed significantly
between regions (χ² = 34.14, df = 3, p < 0.001, Table 2). The smallest pitcher found was
11 cm at Shasta-Trinity which was the region with the smallest average pitcher size (24
cm ± 1 cm) and at the highest elevation, while the largest pitcher found was 91 cm at Six
Rivers which had the second tallest average pitcher size (44 cm ± 6 cm) and was the
lowest elevation region (Fig. 3). The water depths did not differ significantly between the
Rogue River-Siskiyou, Six Rivers, and Shasta-Trinity regions (16%, 29%, and 34% of
pitcher heights, respectively), but Plumas had a significantly lower average water depth
16
of only 2.9 cm ± 1.2 cm which was 9% of the pitcher proportional to the average pitcher
height found there.
In total, 14,358 individuals were counted in this study, with 43% found at Six
Rivers fens, 26% at Plumas, 25% at Shasta-Trinity, and 7% at Rogue River-Siskiyou
(Fig. 4). Mean community abundances per pitcher significantly differed between regions
(χ² = 21.01, df = 3, p < 0.001) and for every pairwise combination of regions except
Plumas-Shasta-Trinity and Plumas-Six Rivers (Table 3). Rogue River-Siskiyou had the
lowest abundances per pitcher with an average of 52 ± 11 individuals and Six Rivers had
the highest with an average of 409 ± 110 individuals per pitcher. The other community
metrics calculated - community taxon richness, community diversity, and community
evenness, and community dominance - did not differ significantly between the regions
(Table 4). Five out of the seven taxa found had significantly different abundances across
the four regions, and the other two were nearly significant (Fig. 5).
Clustering of samples from the four regions in ordination space suggested that
dissimilarities among samples within regions were less than mean dissimilarities between
regions. The ordination diagram was generated solely by the counts of the common taxa.
Results of the NMDS ordinations incorporating invertebrate community composition
revealed overlap of all four regions near the central portion of the ordination space
despite groupings of samples from each of the four regions (stress level 0.166; Fig. 6).
Fen elevation (p < 0.001) and M. edwardsi abundance (p < 0.001) were inversely
correlated with NMDS axis 1, while taxonomic richness (p = 0.18), Corynoptera sp.
abundance (p = 0.13), and Megaselia orestes abundance (p < 0.001) were positively
17
correlated with the first axis. Spider abundance (p < 0.001) and pitcher size (p < 0.001)
were inversely related to the second NMDS axis, while Sarraceniopus darlingtoniae
abundance (p < 0.001), total inquiline invertebrate abundance (p < 0.001), and nematode
abundance (p = 0.003) were positively correlated with the second axis (see Table 5 for
complete list of vectors).
Based on the Bray-Curtis dissimilarity index, there was a greater mean
dissimilarity, or distance, between regions (0.77) than within regions (0.63) when
comparing community compositions of individual pitchers. This indicates that the
pitchers sampled in my study have greater similarity within any single region than among
all four regions (Fig. 7). Another Bray-Curtis dissimilarity index value was calculated to
compare individual pitchers’ community composition between fens, which resulted in
greater dissimilarity between fens (0.75) than within fens (0.62).
PerMANOVA suggests that community composition differs between regions.
Elevation, region, pitcher size, and pitcher water depth, along with their interactions,
accounted for 55% of the total variation in community composition in the perMANOVA
performed. Geographic region (r² = 0.15, pseudo-F=7.61, p = 0.001) and elevation (r² =
0.12, pseudo-F=2.01, p = 0.001) significantly predicted community composition
variation between pitchers, while the other variables and all combinations of interactions
were not significant predictors. Since the perMANOVA only indicates whether one or
more groups are significantly different and not exactly which group(s) differ, the pairwise
perMANOVA provided some clarity. Pairwise perMANOVA showed that five out of the
six combinations of pairs of regions had significantly different community compositions

18
(p = 0.001), while differences among the 6th pair - Shasta-Trinity and Plumas - were not
as well supported (p = 0.12).
Interpretation And Comparison
One of the most straightforward hypotheses regarding “top-down” community
assemblage is that some biogeographical force(s) cause inherent large-scale habitat
differences (Kitching 2001). The four regions studied here have very different average
elevations and are subject to different climatic forces, all of which can have an effect on
community composition (Hodkinson 2005). Regional elevation was correlated with
variation in community composition; however, I did not find evidence that the regions
differed significantly from one another with respect to community indices of taxon
richness, community diversity, community evenness, or community dominance. This
suggests that it is the abundance of any one (or more) taxon that is driving differences in
community composition between pitchers, and that the apparent exclusion of any given
species is in some way, related to elevation.
Changes in temperature, precipitation (rain and snow), the pressure of
atmospheric gases, wind speed, and UV-radiation are all associated with changes in
altitude (Barry 1992) and have been suggested as factors influencing the dispersion of
terrestrial invertebrates (Hodkinson 2005). These differences influence the phenology of
the plant itself, in addition to the life-cycles of the insects within the pitchers, potentially
limiting the dispersal of species outside of their elevation thresholds within a season
19
(Hodkinson 2005). Although plants along elevational clines tend toward lower stature at
greater elevation (Korner 1989) we did not find that pitcher size significantly influenced
community structure. The highest elevation region, Shasta-Trinity, did have an average
pitcher size that was significantly smaller than all of the other three regions, but it did not
have the lowest inquiline species richness and had the second highest community
evenness.
Another important factor that may determine community composition is the stage
of disassembly, since these phytotelma are indeed ephemeral. As the pitcher ages and
accumulates prey, the chemical composition and volume of the fluid and quality of
resources enter a state of fluctuation (Adlassnig et. al 2011). The habitat changes to that
of a harsher environment, potentially driving low-tolerant species away (O’Neill 2016).
This state of flux occurs in individual pitchers as they senesce, but is also occurring
among other pitchers in a fen (Adlassnig et. al 2011). When I compared the dissimilarity
of communities in pitchers at the fen level, I found that communities were more similar
amongst pitchers in the same fen than those of other fens, suggesting that changes in the
pitcher fluid or fen water are more likely to be influenced by local environmental
variation, related to permanence, rather than metacommunity spatial relationships (Urban
2004).
The climate has been warming at an unprecedented rate since the end of the last
glacial period and there are numerous examples where a warming climate has led to
changes in species’ relative abundances and geographic ranges, caused extinctions, and
created transient and novel communities dominated by generalist species and interactions

20
(Blois et al. 2013). In my study I re-surveyed D. californica fens from regions previously
described in 1986 and 1988. By comparing the communities I found to the ones they
described, we can make some inferences about the effect that climate change may posit
for D. californica ecosystems. In 1988, Naeem censused 119 D. californica pitchers in
Butterfly Valley, Plumas National Forest, for a study on the stable coexistence of the two
commonly co-occurring species M. edwardsi and S. darlingtoniae. Naeem’s extensive
study on the community dynamics between the two species claimed that these were the
only two members of the D. californica phytotelma community and any other taxon
found would be considered a waif. My results were similar in that M. edwardsi and S.
darlingtoniae were by far the most abundant taxa in Plumas. The only other two taxa
found in this region in the present study were a nematode, which may not have been
recorded in the 1988 study, and another mite, which was only semi-aquatic and found in
relatively small numbers. David Nielson performed a comprehensive and analytical
survey of the entire D. californica pitcher invertebrate community, aquatic and otherwise,
in Gasquet, CA in Six Rivers during 1986. He found 21 total invertebrate species after a
census of 124 pitchers from three fens within five kilometers of each other, and for the
sake of comparison there were six aquatic invertebrate taxa found in his study. There
were likewise six invertebrate inquiline taxa at my Six Rivers fens, all of them aquatic.
Four of the six found in my study were also found in Nielson’s survey, and the other two
are the unknown mite, which very well may be one of the ones found in his study, and the
nematode which may have been unrecorded in his study. All of our fens were in the same
general area near the city limits of the small town of Gasquet, CA. I did not find evidence
21
that the fen had changed significantly throughout the decades (as seen by our similar
aquatic community composition results); although we do not have empirical data to
compare. It may not be surprising that such a specific and specialized microhabitat has
remained mostly unchanged in this relatively short period of time.
Both rotifers and nematodes have been found in many other species of pitcher
plants (Adlassnig et. al 2011) but to my knowledge, this is the first study to find
nematodes and rotifers in the pitcher fluid of D. californica. These are interesting
members of the aquatic invertebrate community who occupy a unique size niche being
microorganisms who feed on bacteria yet could be fed on by other bacteriovores (Walsh
et. al. 2014). Since the excrement of bdelloid rotifers provides nitrogen and phosphorus,
they could be important players in mineral nutrition for D. californica (Walsh et. al.
2014).
The pitchers of Darlingtonia and Sarracenia sp. have similar inquiline
communities and even have several members from the same genera (Metriocnemus,
Sarraceniopus). However, the average number of arthropod species found in a pitcher in
my study was three, whereas other pitcher plant species’ averages are generally higher.
Some examples of other pitcher plants include Sarracenia purpurea’s 165 inquiline
species, Nepenthes ampullaria’s 59 species, and Heliamphora nutans’ 15 species
(Adlassnig et.al 2011). Interestingly, insect diversity is no lower in the range of D.
californica than any of these other pitcher plant species’ (Lomolino et. al. 2010).
Perhaps my most striking finding was the absence of mosquitoes associated with
D. californica, despite observations of adult mosquitos at each fen I surveyed. Virtually
22
all phytotelmata, including entities like tree holes and leaf axils, contain at least one
species of mosquito who regularly spends its larval and pupal stages as a prominent
member of the aquatic community. Many phytotelmata have several mosquito species,
often each specialized to a unique niche in the microhabitat. Mosquitoes have even been
shown to increase the nitrogen yield of carnivorous plants by acting as keystone predators
on bacterivores and increasing bacterial abundance, solidifying their mutualistic
interaction with the host plant (Mouquet et.al. 2008). Pitcher plants offer an ideal space
for mosquitoes to grow through the first few life cycle stages due to their limited water
depth, absence of water current, lack of larger freshwater aquatic predators, and surplus
of food options for specialization in feeding.
The absence of mosquito larvae in these phytotelmata provoked much speculation
over an explanation. Perhaps in D. californica, the presence of mosquitoes may have
caused a cascading negative effect in the mutualism between the plant and the
phytotelmata community, indirectly negatively impacting the fitness of the plant itself.
This could happen if the mosquitoes lowered the fitness of a mutualistic detritivore
partner by eating it, or it could happen from something far more indirect than this. An
indirect way mosquitoes could affect the plant’s fitness is by preying upon any taxon who
acts as a keystone species upon the microbial community altering the proportions of
“good” digestive bacteria to “bad” exploiting bacteria. Mosquitoes might struggle
navigating around the hood of D. californica. If mosquitoes ever decreased the fitness of
the plant, and if an enlarged hood appeared in some plants, then it is possible that these
hooded plants would have the advantage of limiting access to ovipositing mosquitoes. If
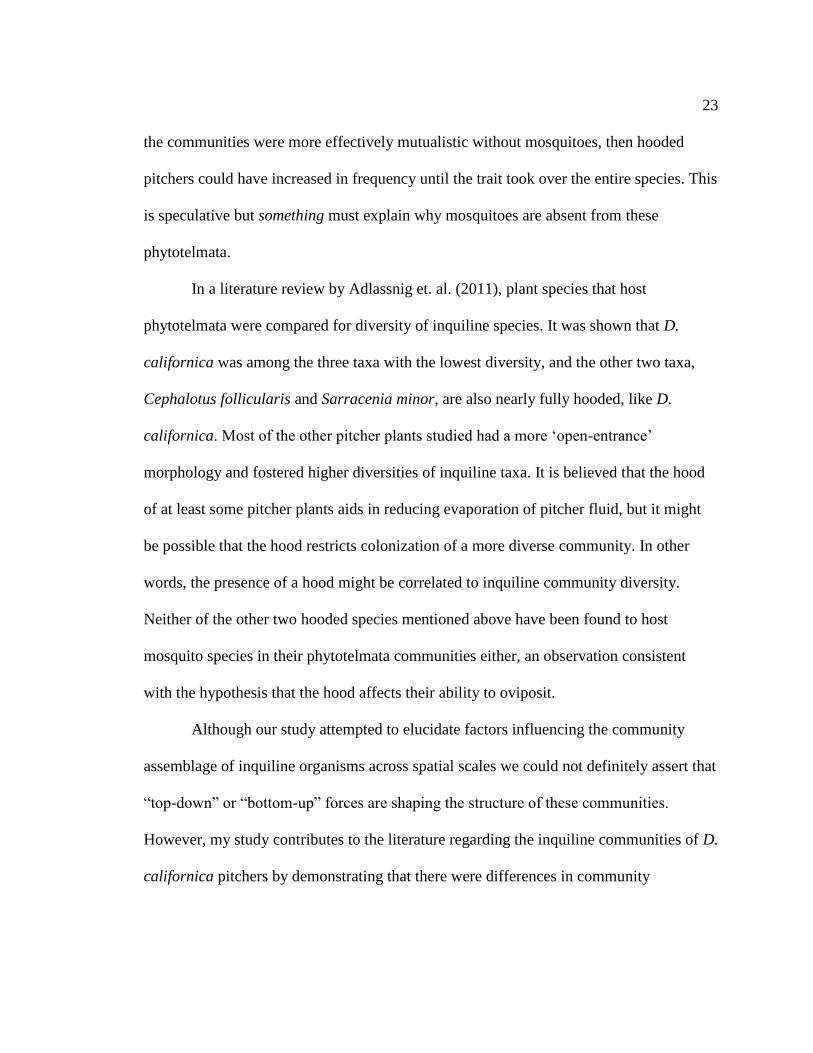
23
the communities were more effectively mutualistic without mosquitoes, then hooded
pitchers could have increased in frequency until the trait took over the entire species. This
is speculative but something must explain why mosquitoes are absent from these
phytotelmata.
In a literature review by Adlassnig et. al. (2011), plant species that host
phytotelmata were compared for diversity of inquiline species. It was shown that D.
californica was among the three taxa with the lowest diversity, and the other two taxa,
Cephalotus follicularis and Sarracenia minor, are also nearly fully hooded, like D.
californica. Most of the other pitcher plants studied had a more ‘open-entrance’
morphology and fostered higher diversities of inquiline taxa. It is believed that the hood
of at least some pitcher plants aids in reducing evaporation of pitcher fluid, but it might
be possible that the hood restricts colonization of a more diverse community. In other
words, the presence of a hood might be correlated to inquiline community diversity.
Neither of the other two hooded species mentioned above have been found to host
mosquito species in their phytotelmata communities either, an observation consistent
with the hypothesis that the hood affects their ability to oviposit.
Although our study attempted to elucidate factors influencing the community
assemblage of inquiline organisms across spatial scales we could not definitely assert that
“top-down” or “bottom-up” forces are shaping the structure of these communities.
However, my study contributes to the literature regarding the inquiline communities of D.
californica pitchers by demonstrating that there were differences in community

24
composition across different regions across the range of D. californica and by reporting
the first observation of nematodes and rotifers in the pitcher fluid.
Future
This study could be used a launching point for a myriad of other types of research
questions. The phenology of these communities could be studied by expanding the
collecting process to span over many months, analyzing pitchers from the same fen at a
regular time interval. This could result in a more complete picture of the D. californica
phytotelmata community composition and dynamics by eliminating the limiting factor of
chronology from the present study. Collecting GIS information at each fen would be an
interesting addition to be able to quantify the distance from other D. californica fens for
use as a proxy of degree of isolation of the metacommunity, which may have an effect on
insect dispersal, and therefore abundances (LeCraw et. al. 2014). It would also be
interesting to find out if there is a correlation to community composition with elemental
composition and pH of the pitcher fluid, or even serpentine presence.
Another research direction that these microhabitats could be used for is to analyze
the microbial ecosystem dynamics. Here, a student could use bacteriology skills to
measure community dynamics of a far more complex system than metazoan
invertebrates. Since the pitcher fluid is sterile before the pitcher opens, the bacterial
community is seeded by the exterior surface of the first visitor to the pitcher (whether the
plant’s prey or pitcher occupant). One could apply a modern ecological theory to their
25
more robust data set such as community succession, species interactions, environmental
drivers of diversity, environmental limitations on communities, metacommuity analyses,
or many other theories. This may also be an ideal system to empirically evaluate the
‘Geographic Mosaic Theory of Coevolution’, which states that there is geographical
variation in selective forces acting upon communities resulting in coevolutionary
‘hotspots’ and ‘coldspots’ associated with high and low biodiversity, respectively (Laine
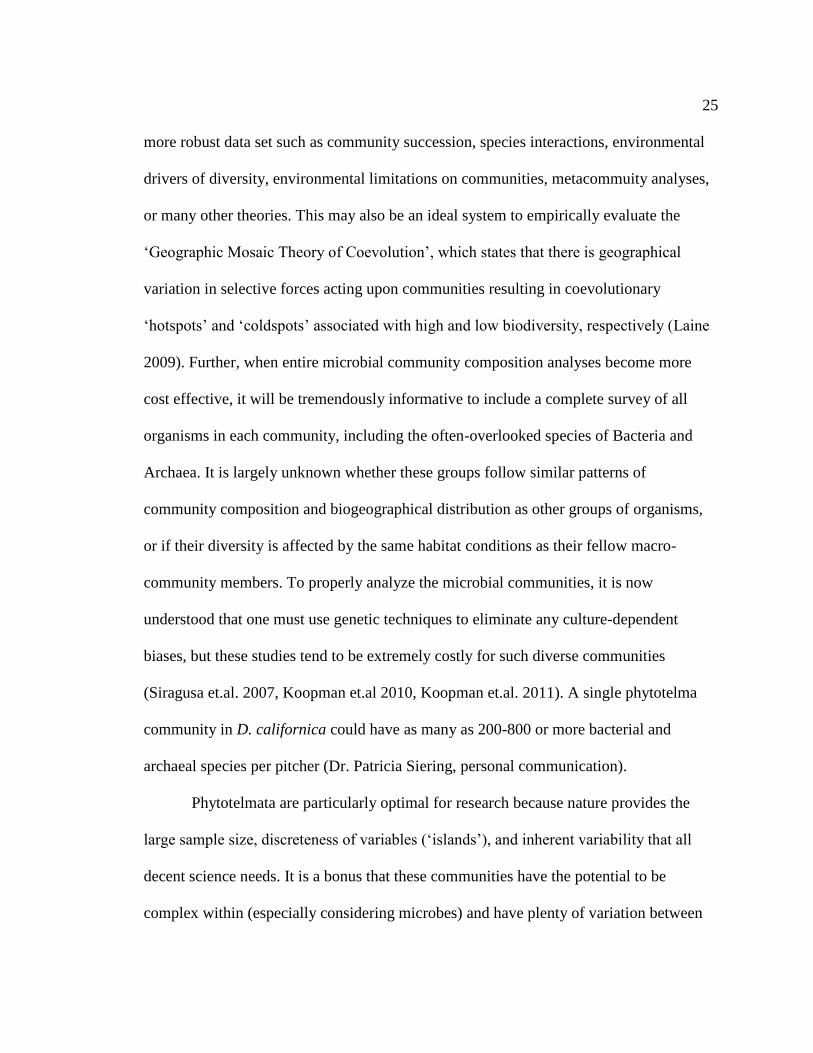
2009). Further, when entire microbial community composition analyses become more
cost effective, it will be tremendously informative to include a complete survey of all
organisms in each community, including the often-overlooked species of Bacteria and
Archaea. It is largely unknown whether these groups follow similar patterns of
community composition and biogeographical distribution as other groups of organisms,
or if their diversity is affected by the same habitat conditions as their fellow macro-
community members. To properly analyze the microbial communities, it is now
understood that one must use genetic techniques to eliminate any culture-dependent
biases, but these studies tend to be extremely costly for such diverse communities
(Siragusa et.al. 2007, Koopman et.al 2010, Koopman et.al. 2011). A single phytotelma
community in D. californica could have as many as 200-800 or more bacterial and
archaeal species per pitcher (Dr. Patricia Siering, personal communication).
Phytotelmata are particularly optimal for research because nature provides the
large sample size, discreteness of variables (‘islands’), and inherent variability that all
decent science needs. It is a bonus that these communities have the potential to be
complex within (especially considering microbes) and have plenty of variation between
26
pitchers. People are well aware of this ideal scientific opportunity in other pitcher plant
species and hundreds of studies have been published, but D. californica has received less
attention in the literature than other species. This may be due to its great geographic and
genetic isolation from any other pitcher plant taxon. Darlingtonia californica could also
be used as a model system for experimental manipulation like research on species
exclusion or common garden experiments. Considering the ideal nature of D. californica
phytotelmata for use in scientific research, I would recommend this system to an aspiring
or experienced researcher. Over time and with a large enough body of work, biologists
might even be able to utilize the information from phytotelmata research into biodiversity
conservation efforts of other types of aquatic communities, like those of ponds and lakes.
27
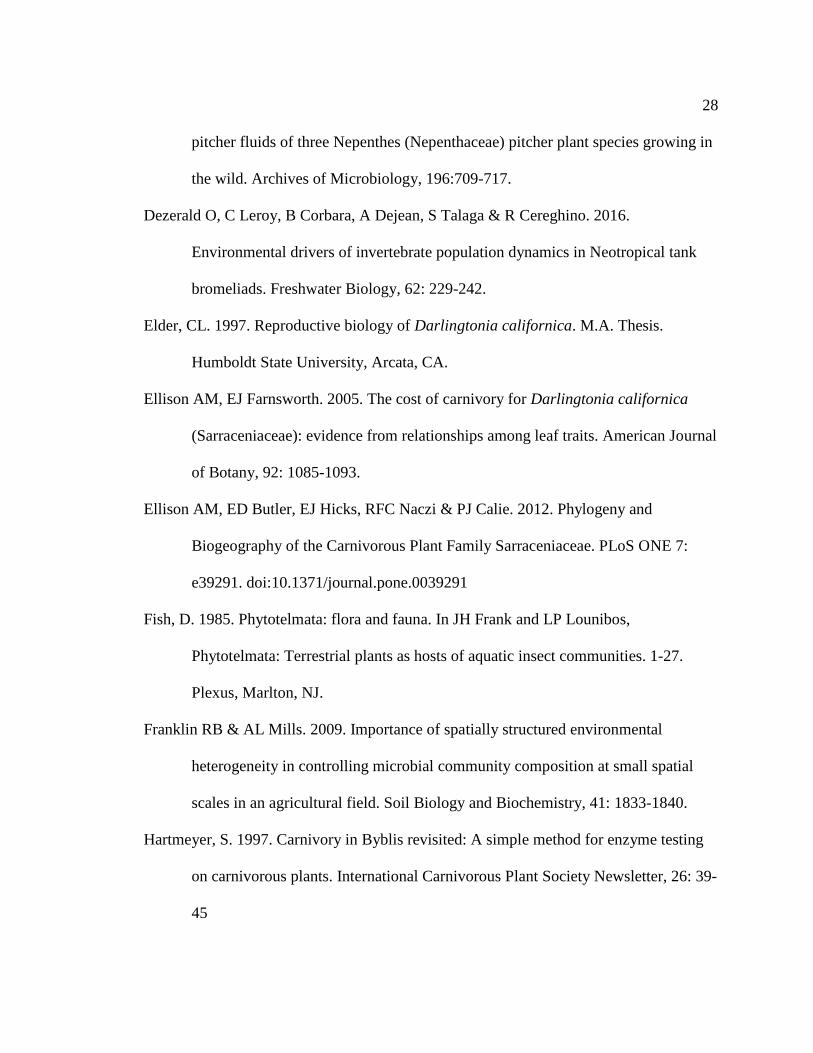
LITERATURE CITED
Aditya, G., R. Tamang, D. Sharma, F. Subba, & G. Saha. 2008. Bamboo stumps as
mosquito larval habitats in Darjeeling Himalayas, India: A spatial scale analysis.
Insect Science, 15: 245-249.
Adlassnig W, M Peroutka & T Lendl. 2010. Traps of carnivorous pitcher plants as a
habitat: composition of the fluid, biodiversity and mutualistic activities. Annals of
Botany, 107: 181-194.
Barry, RG. 1992. Mountain climatology and past and potential future climatic changes in
mountain regions – a review. Mountain Research and Development, 12: 71–86.
Baldwin BG, DH Goldman, DJ Keil, R Patterson, TJ Rosatti, DH Wilden (Eds.). 2012.
The Jepson Manual: Vascular plants of California, 2nd ed. University of
California Press, Berkeley, CA.
Beaver RA. 1985. Geographical variation in food web structure in Nepenthes pitcher
plants. Ecol. Entomol, 10:241-248.
Blois, JL, PL Zarnetske, MC Fitzpatrick & S Finnegan. 2013. Climate change and
the past, present, and future of biotic interactions. Science, 341: 499-504.
Buckley HL, TE Miller, AM Ellison & NJ Gotelli. 2010. Local- to continental-scale
variation in the richness and composition of an aquatic food web. Global Ecology
and Biogeography, 19:711-723
Chou LY, CM Clarke, GA Dykes. 2014. Bacterial communities associated with the
28
pitcher fluids of three Nepenthes (Nepenthaceae) pitcher plant species growing in
the wild. Archives of Microbiology, 196:709-717.
Dezerald O, C Leroy, B Corbara, A Dejean, S Talaga & R Cereghino. 2016.
Environmental drivers of invertebrate population dynamics in Neotropical tank
bromeliads. Freshwater Biology, 62: 229-242.
Elder, CL. 1997. Reproductive biology of Darlingtonia californica. M.A. Thesis.
Humboldt State University, Arcata, CA.
Ellison AM, EJ Farnsworth. 2005. The cost of carnivory for Darlingtonia californica
(Sarraceniaceae): evidence from relationships among leaf traits. American Journal
of Botany, 92: 1085-1093.
Ellison AM, ED Butler, EJ Hicks, RFC Naczi & PJ Calie. 2012. Phylogeny and
Biogeography of the Carnivorous Plant Family Sarraceniaceae. PLoS ONE 7:
e39291. doi:10.1371/journal.pone.0039291
Fish, D. 1985. Phytotelmata: flora and fauna. In JH Frank and LP Lounibos,
Phytotelmata: Terrestrial plants as hosts of aquatic insect communities. 1-27.
Plexus, Marlton, NJ.
Franklin RB & AL Mills. 2009. Importance of spatially structured environmental
heterogeneity in controlling microbial community composition at small spatial
scales in an agricultural field. Soil Biology and Biochemistry, 41: 1833-1840.
Hartmeyer, S. 1997. Carnivory in Byblis revisited: A simple method for enzyme testing
on carnivorous plants. International Carnivorous Plant Society Newsletter, 26: 39-
45

29
He Z, TJ Gentry, CW Schadt, L Wu, J Liebich, SC Chong, Z Huang, W Wu, B Gu, P
Jardine, C Criddle & J Zhou. 2007. Geochip: a comprehensive microarray for
investigating biogeochemical, ecological, and environmental processes. The
IMSE Journal, 1: 67-77.
Hepburn, J S, FM Jones & EQ St. John. 1927. Biochemical studies of the North
American Sarraceniaceae. Transactions of Wagner Free Institute of Science of
Philadelphia, 11: 1-91.
Hodkinson ID. 2005 Terrestrial insects along elevation gradients: species and community
responses to altitude. Biological Reviews, 80: 489-513
Kitching RL. 2001. Food Webs in Phytotelmata: "Bottom-Up" and "Top-Down"
Explanations for Community Structure. Annual Review of Entomology, 46: 729-
760.
Koopman MM & BC Carstens. 2011. The microbial Phylogeography of the carnivorous
plant Sarracenia alata. Microbial Ecology, 61: 750-758.
Koopman MM, DM Fuselier, S Hird & BC Carstens. 2010. The carnivorous Pale Pitcher
Plant harbors Diverse, Distance, and Time-dependent Bacterial Communities.
Applied and Environmental Microbiology, March; 1851-1860.
Korner C. 1989. The nutritional status of plants from high altitudes. Oecologia, 81;
379- 391
Laine, AL. 2009. Role of coevolution in generating biological diversity: spatially
divergent selection trajectories. Journal of Experimental Botany, 60; 2957-2970
LeCraw, RM, DS Srivastava & GQ Romero. 2014. Metacommunity size influences
30
aquatic community composition in a natural mesocosm landscape. Oikos, 123;
903-911
Lomolino M, BR Riddle, RJ Whittaker, JH Brown & MV Lomolino. 2010. “Community
Biogeography." Biogeography. Sunderland, MA: Sinauer Associates. Textbook;
Print.
Nielsen DW. 1987. The arthropod associates of Darlingtonia californica, M.S. Thesis,
Humboldt State University, Arcata, CA.
Nielsen DW. 1990. Arthropod Communities Associated with Darlingtonia
californica. Entomological Society of America, 83; 189-200.
O’Neill BJ. 2016. Community disassembly in ephemeral ecosystems. Ecology, 97;
3285-3292.
Peterson CN, S Day, BE Wolfe, AM Ellison, R Kolter & A Pringle. 2008. A keystone
predator controls bacterial diversity in the pitcher-plant (Sarracenia purpurea)
microecosystem. Environmental Microbiology, 10; 2257-2266.
Rasic G & N Keyghobadi. 2011. From broadscale patterns to fine-scale processes:
habitat structure influences genetic differentiation in the pitcher plant midge
across multiple spatial scales. Molecular ecology, 21; 223-236.
Ratsirarson J & JA Silander. 1996. Structure and dynamics in Nepenthes
madagascariensis pitcher plant micro-communities. Biotropica, 28; 218-227.
Schulze, W, ED Schulze, JS Pate, & AN Gillison. 1997. The nitrogen supply from soils
and insects during growth of the pitcher plants Nepenthes mirabilis, Cephalotus
follicularis and Darlingtonia californica. Oecologia, 112; 464-471.

31
Siragusa AJ, JE Swenson & DA Casamatta. 2007. Culturable Bacteria present in the
Fluid of the Hooded-Pitcher plant Sarracenia minor based on 16S rDNA gene
sequence data. Microbial Ecology, 54; 324-331.
Sunahara T & M Mogi. 2004. Searching clusters of community composition along
multiple spatial scales: a case study on aquatic invertebrate communities in
bamboo stumps in West Timor. Population ecology, 46; 149-158
Urban MC. 2004. Disturbance heterogeneity determines freshwater metacommunity
structure. Ecology, 85; 2971-2978.
Walsh EJ, HA Smith & RL Wallace. 2014. Rotifers of temporary waters. Hydrobiology,
99; 3-19.

32
Table 1. Species abundances organized by region. The last row is the proportion of total
abundance found at each region. The last column represents the species’ abundance out
of the total abundance.
Rogue
River-
Siskiyou
Six
Rivers
Shasta-
Trinity Plumas Total
percent
of total
M. edwarsi 49 85 1156 1720 3010 21%
S. darlingtoniae 234 2549 1820 1500 6103 43%
M. orestes 412 479 121 0 1012 7%
Nematode 220 2970 440 0 3630 25%
Corynoptera sp. 63 16 0 0 79 1%
Mite 0 32 0 450 482 3%
Spider 7 0 5 30 42 0%
total abundance 985 6131 3542 3700 14358 100%
percent of total 7% 43% 25% 26% 100% .
33
Table 2. Values organized by the four regions and each of their three fens. (Top and
bottom tables have the same variables.)
Region
Rogue River-
Siskiyou Six Rivers
Region richness 6 6
Region abundance 985 6131
Number of pitchers 23 15
Fen number 1 2 3 4 5 6
Elevation (m) 705 747 579 176 158 132
Fen richness 5 5 6 5 4 6
Fen abundance 187 219 579 1171 3150 1810
Number of pitchers 8 5 10 5 5 5
Region Shasta-Trinity Plumas
Region richness 5 4
Region abundance 3542 3700
Number of pitchers 29 26
Fen number 7 8 9 10 11 12
Elevation (m) 1642 1578 1525 1519 1215 1169
Fen richness 3 2 5 4 3 4
Fen abundance 1069 1026 1447 967 772 1961
Number of pitchers 10 9 10 8 9 9
34
Table 3. P-values of pairwise comparisons. Each column represents the pair of regions
from the first and second rows. Dashes present when both regions had a value of zero. Rogue
River-
Siskiyou
Rogue
River-
Siskiyou
Six
Rivers
Six
Rivers
Shasta-
Trinity
Shasta-
Trinity
Six
Rivers
Plumas Shasta-
Trinity
Plumas Rogue
River-
Siskiyou
Plumas
perMANOVA 0.002 0.002 0.002 0.002 0.002 0.143
Pitcher height (cm) 0.54 0.02 0.001 0.37 <0.001 <0.001
M. edwarsi
abundance
0.46 <0.001 <0.001 <0.001 <0.001 0.464
S. darlingtoniae
abundance
<0.001 0.05 0.05 0.13 0.02 0.85
M. orestes abundance 0.22 <0.001 <0.001 <0.001 0.01 0.01
Nematode abundance 0.47 0.09 0.09 0.02 0.47 0.47
Corynoptera sp.
abundance
0.76 0.09 0.02 0.06 0.06 -
Mite abundance 0.28 0.28 0.28 0.58 - 0.16
Spider abundance 0.02 0.30 0.30 0.00 0.16 0.01
community
abundance
0.00 0.01 0.03 0.26 0.02 0.26
community taxon
richness
0.13 0.64 0.45 0.64 0.64 0.91
community evenness 0.22 0.18 0.28 1.00 1.00 0.50
35
Table 4. Mean number of inquilines per pitcher (± standard error). Df=3. Chi squared and
p–values from Kruskal-Wallis tests are listed.
Rogue
River-
Siskiyou
Six
Rivers
Shasta-
Trinity Plumas χ² p
M. edwarsi 1.9 ± 1.1
5.7 ±
2.2
35.7 ±
4.8 82.3 ± 27.3 43.41 <0.001
S.
darlingtoniae
13.5 ±
4.3
169.9 ±
28.9
75.8 ±
21.6 93.8 ± 28.3 19.17 <0.001
M. orestes
19.1 ±
7.5
31.9 ±
9.4 5.0 ± 2.1 0 29.77 <0.001
Nematode
12.9 ±
6.8
198 ±
91.4
18.3 ±
10.8 0 12.35 0.006
Corynoptera
sp. 3.7 ± 2.9 1.1 ± 0.6 0 0 13.05 0.005
Mite 0 2.1 ± 1.5 0 28.1 ± 20.4 7.49 0.06
Spider
0.41 ±
0.12 0
0.21 ±
0.13 1.9 ± 0.9 1919 <0.001
Abundance
51.6 ±
11.4
408.7 ±
105.4
135.1 ±
26.8 206 ± 44.9 21.06 <0.001
Richness 2.6 ± 0.2 3.1 ± 0.3 2.6 ± 0.1 2.6 ± 0.2 2.45 0.48
Diversity
0.59 ±
0.1 0.6 ± 0.6 0.6 ± 0.1 0.5 ± 0.1 1.65 0.65
Evenness 0.7 ± 0.1 0.6 ± 0.1 0.7 ± 0.1 0.6 ± 0.1 7.21 0.07
Dominance
1.0 ±
0.01
1.0 ±
0.01
1.0 ±
0.01 1.0 ± 0.01 2.55 0.47
36
Table 5. Correlation coefficients for covariates in NMDS ordination space and the two
NMDS axes (see Figure 1). P-values are based on 999 permutations.
Vectors NMDS1 NMDS2 p
M. edwarsi -0.99 0.05 <0.001
S. darlingtoniae 0.23 0.97 <0.001
M. orestes 0.98 -0.21 <0.001
Nematode 0.71 0.7 0.006
Corynoptera sp. 0.99 0.07 0.001
Mite -0.99 0.05 0.92
Spider -0.21 -0.98 <0.001
Abundance 0.42 0.91 <0.001
Richness 0.96 0.28 0.1
Diversity 0.97 0.24 0.27
Evenness -0.63 -0.77 0.61
Dominance -0.34 0.94 0.43
Pitcher size 0.62 -0.78 0.009
Water height 0.99 0.13 0.29
Elevation -0.99 -0.13 <0.001
37
Figure 1. Map of study area in Northwestern California and Southwestern Oregon. Red
stars represent the four regions, in order from Northwest to Southeast: Rogue River-
Siskiyou National forest near Gold Beach, OR; Six Rivers National Forest near Gasquet,

38
Figure 2. A typical Darlingtonia californica habitat growing in and around a small stream.
39
Figure 3. Mean heights of pitchers and depth of pitcher fluid shown proportionate to one
another with standard error bars. Pitcher height correlated to elevation, which is shown in
grey behind bars.
0
400
800
1200
1600
2000
0
10
20
30
40
50
60
Siskiyou Six Rivers Shasta-Trinity Plumas
Ele
vatio
n (
m)
He
ight (c
m)
Elevation
Pitcher height
Water height

40
Figure 4. Total abundances of all taxa combined grouped by region and stratified by fen
within regions. Although abundances were significantly different from one another, the
differences did not correlate to elevation. (Sample sizes (n= number of pitchers sampled)
were Siskiyou n= 23; Six Rivers n= 15; Shasta-Trinity n= 25; Plumas n= 26).
0
1000
2000
3000
4000
5000
6000
7000
SISKIYOU SIX-RIVERS SHASTA-TRINITY PLUMAS
To
tal ab
und
ance
of all
taxa
Site 3
Site 2
Site 1

41
Figure 5. Abundances of each taxon grouped by fens, with fens color coded by region.
From left to right: S. darlingtoniae, nematode, M. edwarsi, M. orestes, mite, Corynoptera
sp., spider.
0
50
100
150
200
250
300
Me
an a
bund
ance
pe
r site
Siskiyou
Six Rivers
Shasta-Trinity
Plumas
42
Figure 6. Nonmetric multidimensional scaling (NMDS) ordination of community
composition data from 93 pitchers. Vector information presented in Table 1. Vector
arrow length and direction correspond to the magnitude of the correlation with the two
axes.
-1.5 -1.0 -0.5 0.0 0.5 1.0 1.5
-1.5
-1.0
-0.5
0.0
0.5
1.0
1.5
NMDS1
NM
DS
2OR
ST
GA
PL
Me
Sd
Mo
N
C
spider
abund
rich
size
elevation

43
0.5
0.6
0.7
0.8
0.9
Me
an d
issim
ilarity
OR
GA
PL
ST
Figure 7. A dendrogram of Bray-Curtis mean dissimilarity by region. (OR= Siskiyou;
GA= Six Rivers; PL= Plumas; ST= Shasta-Trinity.) Each region’s segment terminated
to the within-region dissimilarity value represented on the y-axis. The closer any two
are on the dendrogram, the less dissimilar they are between regions. For example,
Siskiyou (OR) had more within-region dissimilarity than the group containing the
other three regions. Plumas’ (PL) segment is reversed because it had more
dissimilarity within the region than the combination of Plumas and Shasta-Trinity
(ST).
44
APPENDIX
Region and Fen Descriptions
The range of Darlingtonia californica stretches diagonally from the northern
Sierra Nevada mountains to the far northwest corner of California and continues in a
narrow stretch along the coast through most of Oregon. Populations of the plant are not
contiguous throughout its range, and it can be found in a variety of habitats and
microhabitats. Darlingtonia californica is found outside of the four regions sampled, but
this study was also limited by denial of permission from other US Forest Service stations.
This study sampled pitchers for community composition from 12 fens, three chosen by
government officials in each of the four regions, each of which is described below.
Rogue River-Siskiyou National Forest, Oregon: This was the northernmost region
in the study, and the only one beyond California’s border. Although populations of D.
californica reach at least 150 miles north of here, stretching most of the Oregon coast,
this region was chosen for its proximity to HSU, and because I had permission to take
samples. All three fens were within the Rogue River-Siskiyou National Forest. No
serpentine rock was visibly exposed, although Chamaecyparis lawsoniana, a serpentine
affiliate, was present on one fen. Pseudotsuga menziesii and Thuja plicata were the major
conifers here, and Rhododendron occidentale was present at all three fens. The first fen
sampled in Oregon was in a fen with a couple centimeters of above-ground water,
pebble-sized rocks, and some deep mud. There were many downed and mostly-soaked

45
logs present in the fen. Rare Gentiana plurisetosa was present. Peat moss covered the
ground in spaces between grass clumps and other plants, so very little water was exposed.
Large trees bordered the outside of the fen but caused little shadow over pitchers. The
second fen had more canopy cover from alders and low branches of Pseudotsuga
menziesii. Darlingtonia californica was scattered throughout a lightly flowing stream
with rocks averaging around 30 cm wide throughout the growing area, with many rosettes
attached to these rocks. Very little mud or peat moss occurred on the ground surface. At
fen three there was a large pond adjacent to the population of D. californica sampled.
Small D. californica plantlets were seen floating in ‘self-made’ islands with peat moss.
Pitchers were collected near a foot trail in an area with deep mud where no rocks or water
were present. Most of the vegetation around the pond was Quercus vaccinifolium and
azalea, and large trees were absent from the immediate vicinity.
Six Rivers National Forest, California: This region had high levels of serpentine
determined both by observations of exposed rock and presence of serpentine-indicating
plants. These fens were almost directly due south of the Rogue River-Siskiyou fens and
represent one of the farthest northwest populations of D. californica in California. The
Smith River or one of its forks was never more than about 1 kilometer away, and it was
the lowest elevation region at 155m above sea level. Pitchers from fen four, the first fen
sampled in this region, were collected from a ditch directly adjacent to California state
highway 199 with flowing water. Chamaecyparis lawsoniana and Pinus jeffreyi were
present and causing about 20% canopy cover over the group of sampled pitchers. Small
trees of Chamaecyparis lawsoniana and Pinus jeffreyi also caused scattered canopy cover

46
at fen five, and young Azalea shrubs were abundant. Pinguicula, another carnivorous
plant was also present. Water was slightly flowing over boulders and bedrock, and peat
moss covered around 30% of the ground. fen six had Chamaecyparis lawsoniana, Pinus
jeffreyi, Alnus sp., and tree-like Rhododendron occidentale covering about 40% of the
sampled population with their canopy. Darlingtonia californica plants were growing on
mats of moss-covered bedrock with a very slight water flow.
Shasta-Trinity National Forest, California: Fens at this mountainous California
region were the highest elevation fens in this study with an average elevation of 1582
meters above sea level. The pitchers were significantly shorter than the other four
regions, with the average pitcher height being only 24cm. Fen seven was unique because
D. californica was sparsely spread among tall grass in a large open fen/prairie containing
a diverse plant community. The ground was mostly deep mud with tiny streams of water
throughout, and no bedrock or stone was visible. This fen is at the highest point of
California State Highway 3, where it meets the Pacific Crest Trail. At fen eight, pitchers
were collected in a flowing stream running adjacent to California state highway 3, about
two miles south of fen one. Large rocks averaging around 75 cm lined the stream and D.
californica was found in fragmented patches of relatively small rosettes every 5 meters or
so. There was about 20% canopy cover coming from Pseudotsuga menziesii, Pinus
monticola, Alder, and Rhododendron. Fen nine was in the Trinity Alps Wilderness off of
the Swift Creek trail. Abies concolor and Salix sp. Trees stretched across the small stream
causing 40% canopy cover. Large boulders and various sized rocks lined the small
stream, and most of the rosettes were submerged at their base by flowing water.
47
Plumas National Forest, California: Near the northern Sierra Nevada mountains,
this was the eastern- and southern- most region sampled. Fens here were sampled near
the Feather River at an average elevation of 1301 meters, and exposed serpentine rock
was evident in all of the fens. At fen ten, pitchers were collected directly beside a rocky
forest road with no canopy cover. Water was cascading over bedrock and D. californica
was found growing sparsely and spread-out in an area with high diversity of habitat
features. Fen eleven was in a ditch with lightly flowing water and pebble-sized rocks on
the side of unpaved forest road near Butterfly Valley with about 20% canopy cover.
Finally, fen twelve was on a mostly open hillside with high abundances of graminoids
and grasses growing on bedrock mixed with smaller rocks. The ground was muddy with
moss throughout and little-to-no flowing water.