
LabVIEW Statechart Module Tutorial - search...
26
LabVIEW Statechart Module Tutorial Overview This NI LabVIEW Statechart Module tutorial is designed for the LabVIEW online evaluation environment, so it does not depend on any hardware. It covers the basics of creating a statechart- based application. Introduction to Applications Built with Statecharts With an existing statechart-based application, this section illustrates how you can use statecharts. The application is a ceiling fan that has variable speeds and a light that can be toggled on/off. Additionally, this application makes use of a synchronous statechart architecture. Synchronous architectures periodically read inputs and write to outputs and are not dependent on an external trigger to cause the statechart to evaluate conditions. Synchronous applications are best suited for real-time, field-programmable gate array (FPGA), and embedded applications. 1. Open Ceiling Fan (sync).lvproj. Expand LV Statechart.lvsc. 2. Statecharts consist of triggers, inputs, outputs, state data, and a diagram. Open Edit Triggers and Groups. This section is where you can add external triggers that can cause a state transition. Because you are dealing with a synchronous statechart, no triggers have been created. Click OK.
Transcript of LabVIEW Statechart Module Tutorial - search...

LabVIEW Statechart Module Tutorial
Overview
This NI LabVIEW Statechart Module tutorial is designed for the LabVIEW online evaluation
environment, so it does not depend on any hardware. It covers the basics of creating a statechart-
based application.
Introduction to Applications Built with Statecharts
With an existing statechart-based application, this section illustrates how you can use statecharts.
The application is a ceiling fan that has variable speeds and a light that can be toggled on/off.
Additionally, this application makes use of a synchronous statechart architecture. Synchronous
architectures periodically read inputs and write to outputs and are not dependent on an external
trigger to cause the statechart to evaluate conditions. Synchronous applications are best suited for
real-time, field-programmable gate array (FPGA), and embedded applications.
1. Open Ceiling Fan (sync).lvproj. Expand LV Statechart.lvsc.
2. Statecharts consist of triggers, inputs, outputs, state data, and a diagram. Open Edit
Triggers and Groups. This section is where you can add external triggers that can cause a state
transition. Because you are dealing with a synchronous statechart, no triggers have been created.
Click OK.

3. Open Inputs.ctl. Here you can see four different input values – light, fan, switch, and stop
buttons.
4. Open Outputs.ctl. This has two indicators – a light status LED and fan status numeric
indicator.

5. Also included inside a statechart is StateData.ctl. State data is a control that can act as a set
of temporary variables that are accessible only within the statechart.
6. Open Diagram.vi. This is now the statechart logic for the ceiling fan. Statecharts are
primarily made of regions, states, and transitions. A region is a container for one or more
states, a state is the condition that the statechart is in, and a transition is a means to move
between states.
7. Double-click the transition that goes between Fan Off and Fan On.

8. This brings up the Configure Transition dialog window, where the LabVIEW code that
defines a transition is located. The tabs Guard and Action define where the LabVIEW code is
written. A guard is a conditional that is evaluated to determine whether a transition should be
executed, while the action tab specifies a behavior of the system when a transition is taken. Click
OK.

9. Double-click the Fan On state.
10. This brings up the Configure State dialog for the fan.
11. States have several types of actions. Entry actions are executed every time the state is
entered, and exit actions are executed when the state is exited. You can make additional actions
depending on the behavior in the system. Click OK.
12. Looking at the statechart, the behavior is described as follows: initially, the statechart is in
the Switch Off state. Once the switch is turned on, you enter the Switch On superstate. In this
state, you contain two orthogonal regions that act independently of each other. Inputs can change
the light from the Light Off state to Light On and likewise for the Fan Off and Fan On states.
Ultimately, you can terminate the statechart by the Stop input.
13. Switching back to the Project Explorer window, open the FanLightDemo – Sync.vi.
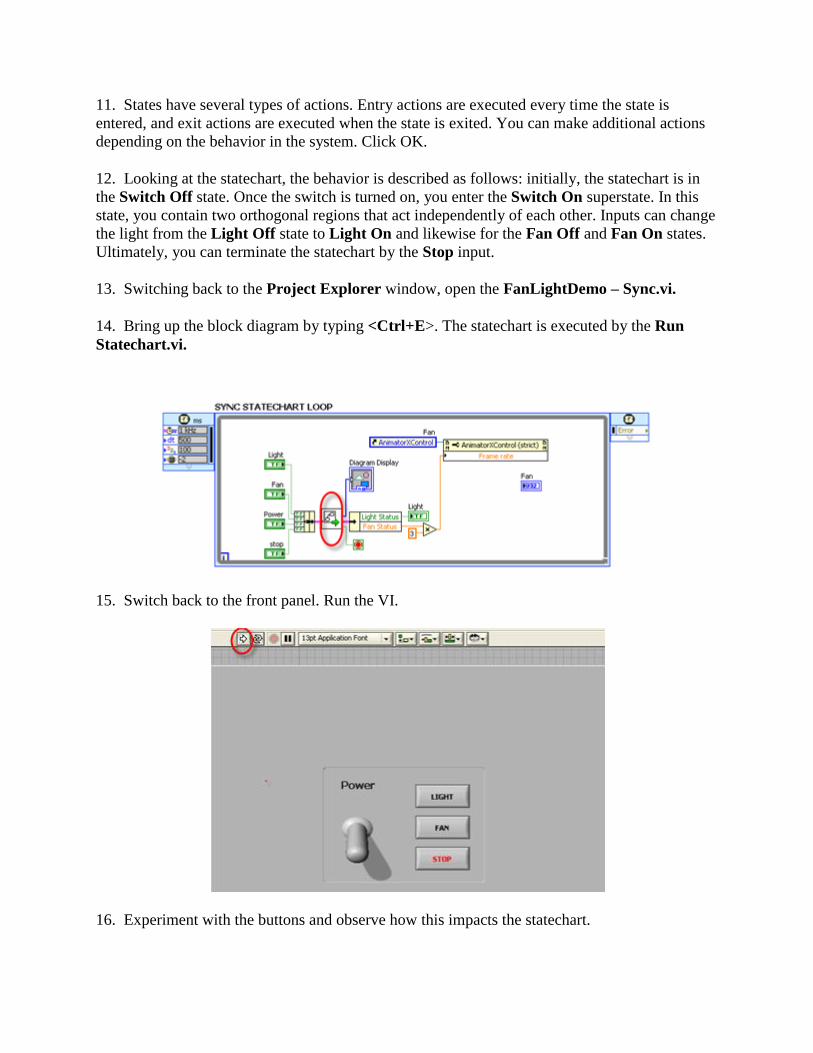
14. Bring up the block diagram by typing <Ctrl+E>. The statechart is executed by the Run
Statechart.vi.
15. Switch back to the front panel. Run the VI.
16. Experiment with the buttons and observe how this impacts the statechart.

Creating a Statechart Application
This section covers developing a statechart and integrating it into your application, which
simulates the heating and cooling of a water tank. It consists of a tank being heated to a user-
defined temperature, after which the tank is cooled to another user-defined temperature. The
system has an emergency switch that stops the process at any point.
First you need to create your project.
1. From the LabVIEW Getting Started screen, select Empty Project.

2. Right-click My Computer and select New >> Statechart.
3. Save the statechart as Temperature Monitor.
4. You have created the statechart file structure in the Project Explorer window.
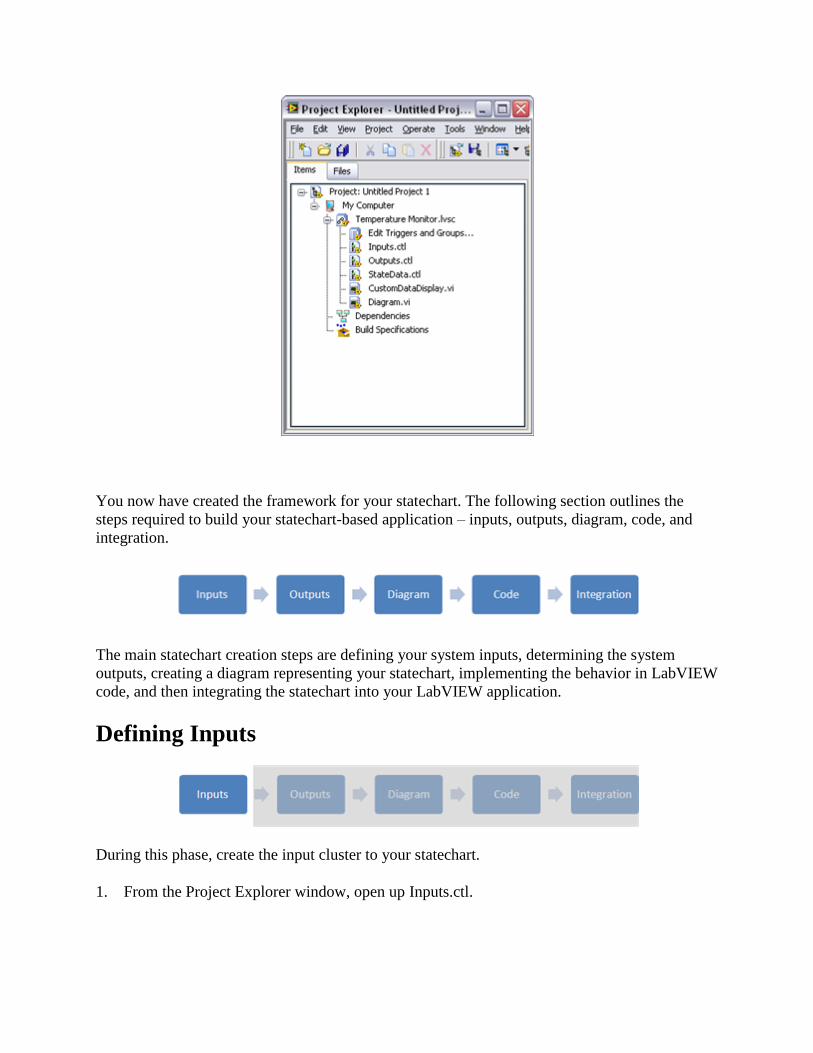
You now have created the framework for your statechart. The following section outlines the
steps required to build your statechart-based application – inputs, outputs, diagram, code, and
integration.
The main statechart creation steps are defining your system inputs, determining the system
outputs, creating a diagram representing your statechart, implementing the behavior in LabVIEW
code, and then integrating the statechart into your LabVIEW application.
Defining Inputs
During this phase, create the input cluster to your statechart.
1. From the Project Explorer window, open up Inputs.ctl.

2. Rename the button as “Stop.”
3. Add three numeric controls for High Temperature, Low Temperature, and Current
Temperature. The completed input cluster should look like the image below.
4. Open StateData.ctl. You can use this control for temporary values and internal state data. In
this example, maintain a copy of the current temperature. Rename the control to Temperature.

Determining Outputs
Now that you have completed the inputs to your system, you can create the output of your
statechart.
1. From the Project Explorer window, open Outputs.ctl.
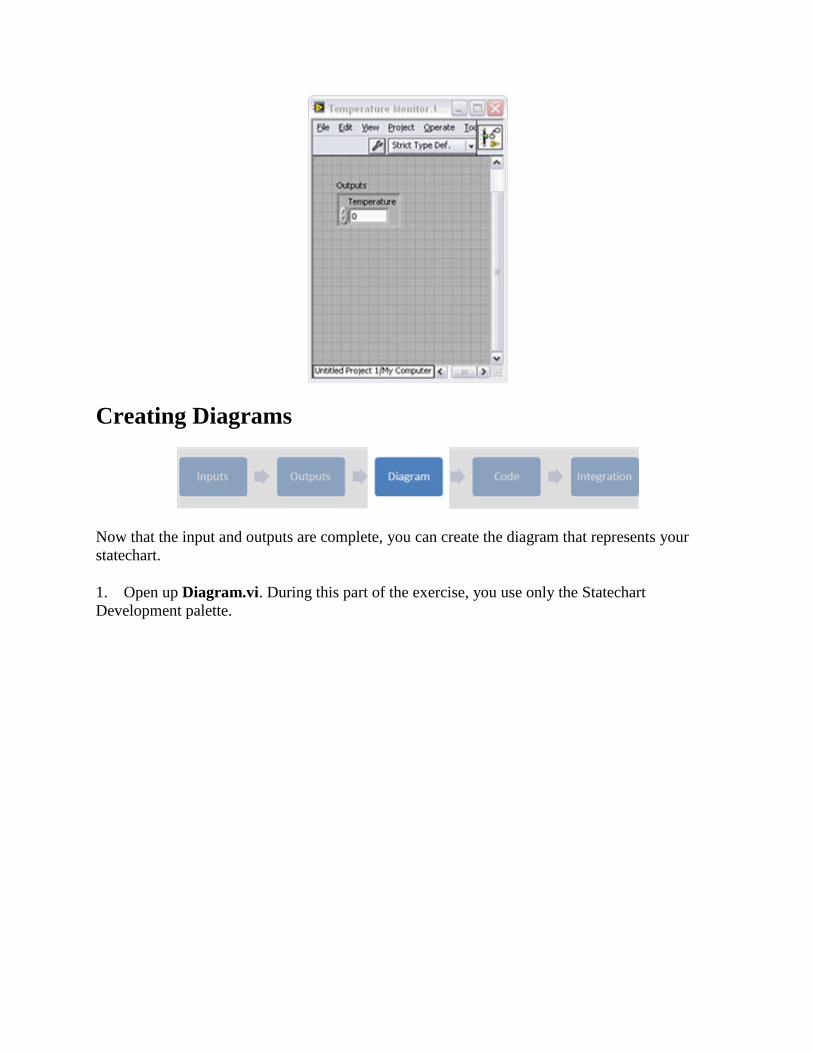
2. Rename the numeric indicator as Temperature. The completed output cluster should look
like the image below.
Creating Diagrams
Now that the input and outputs are complete, you can create the diagram that represents your
statechart.
1. Open up Diagram.vi. During this part of the exercise, you use only the Statechart
Development palette.

2. Create a state named Controller. Within this state, create a region called Temperature
Control. Additionally, the diagram requires an Initial pseudostate and a transition. The diagram
should look like this:
3. Within the Temperature Control region, add two additional states called Heating and
Cooling. These states need to be connected by a transition. Within this region, you need to add
initial pseudostate and a transition. The diagram should now look like this:

4. Outside the controller state, add a Terminal pseudostate. Add a transition from the
controller state to the terminal and a transition from the cooling state to the terminal block. The
diagram should look like the image below. This is the completed statechart diagram for your
application.

Implementing Code
With your diagram complete, you now can implement your LabVIEW code into the statechart.
1. Right-click the transition entering the Heating State. Select Configure Transition.
2. In the configure state dialog, under the Action tab, wire Inputs.Current Temperature to
StateData.Temperature.
3. Right-click the Heating state. Select Configure State.
4. In the Configure State dialog, create a static reaction by pressing the Create button in the
bottom left of the window. Select the newly created static reaction and navigate to the Action
Tab. Within the action tab, add the value of 1 to the Statedata.Temperature. Wire this value to
Statedata.Temperature and Output.Temperature. Click OK.
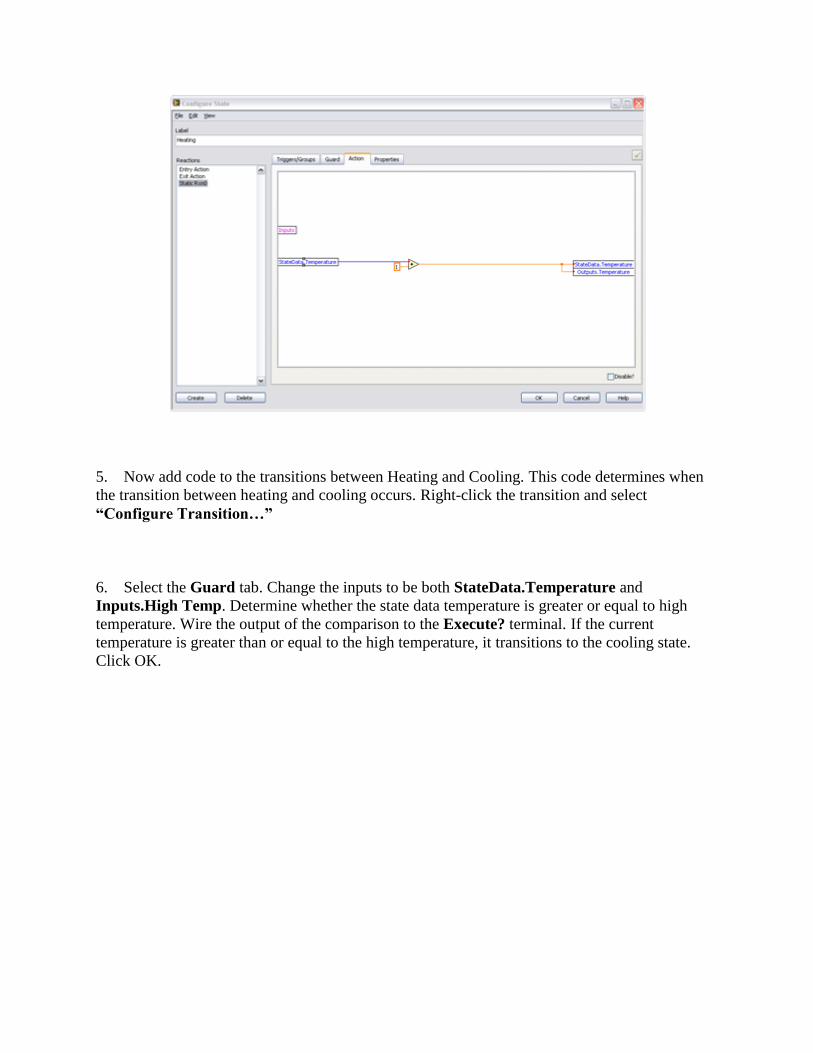
5. Now add code to the transitions between Heating and Cooling. This code determines when
the transition between heating and cooling occurs. Right-click the transition and select
“Configure Transition…”
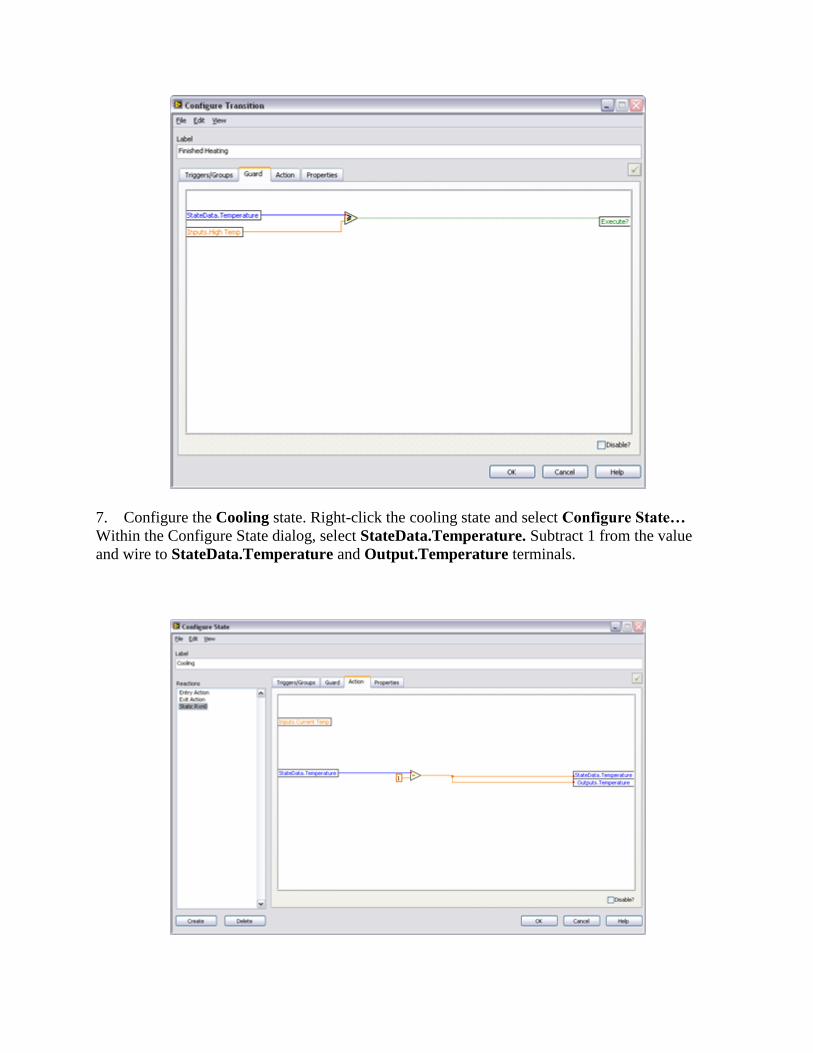
6. Select the Guard tab. Change the inputs to be both StateData.Temperature and
Inputs.High Temp. Determine whether the state data temperature is greater or equal to high
temperature. Wire the output of the comparison to the Execute? terminal. If the current
temperature is greater than or equal to the high temperature, it transitions to the cooling state.
Click OK.
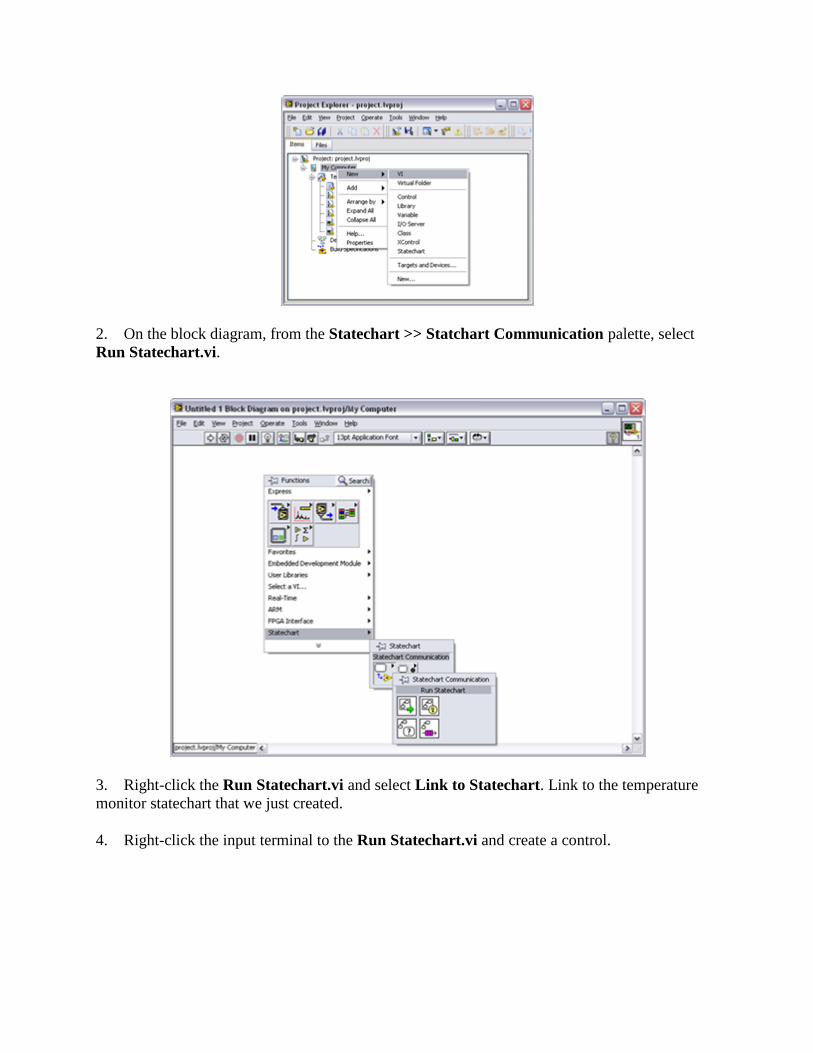
7. Configure the Cooling state. Right-click the cooling state and select Configure State…
Within the Configure State dialog, select StateData.Temperature. Subtract 1 from the value
and wire to StateData.Temperature and Output.Temperature terminals.

8. Configure the transition leaving the cooling state. Right-click the transition and select
Configure Transition. In the guard code, compare whether StateData.Temperature is less than
or equal to Input.Low Temp. If this is true, the transition should execute. Wire the output of this
comparison to the Execute? terminal.
9. Configure the transition leaving the Controller state and ending at the terminal state. In the
guard code, wire Input.Stop to the Execute? terminal.

10. Now the statechart diagram is complete with the functionality that you need. The final step
is to generate the code for the statechart by clicking the Generate LabVIEW Code for this
Statechart button.

Integrating the Statechart into Your Application
You have completed your statechart. Next, call and execute your statechart from your LabVIEW
application.
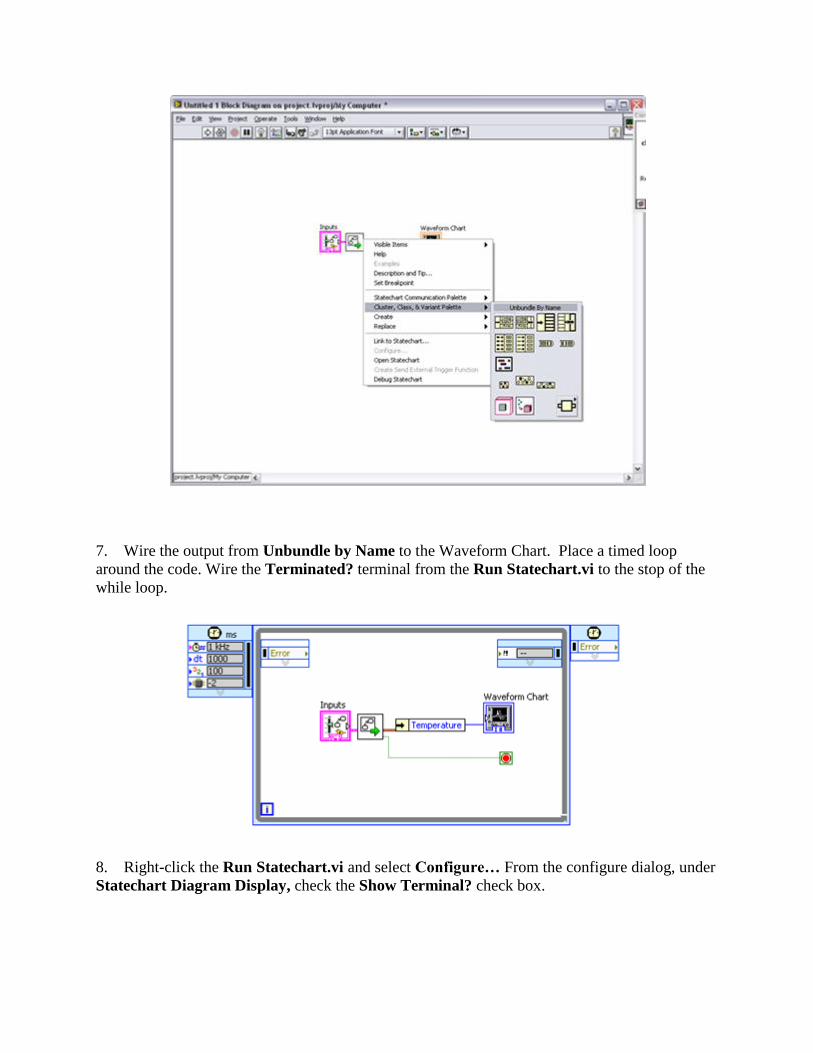
1. From the Project Explorer window, create a new VI.
2. On the block diagram, from the Statechart >> Statchart Communication palette, select
Run Statechart.vi.
3. Right-click the Run Statechart.vi and select Link to Statechart. Link to the temperature
monitor statechart that we just created.
4. Right-click the input terminal to the Run Statechart.vi and create a control.

5. Switch to the front panel and add a Waveform Chart to the user interface.
6. Switch back to the block diagram. Right-click the Run Statechart.vi output terminal and
select Cluster, Class, & Variant Palette >> Unbundle by Name.
7. Wire the output from Unbundle by Name to the Waveform Chart. Place a timed loop
around the code. Wire the Terminated? terminal from the Run Statechart.vi to the stop of the
while loop.
8. Right-click the Run Statechart.vi and select Configure… From the configure dialog, under
Statechart Diagram Display, check the Show Terminal? check box.

9. Create an indicator for the Diagram Display terminal of the Run Statechart.vi. The
completed code should look as follows:
10. Enter values for current temperature, high temperature, and low temperature and run the VI.
The completed front panel should look as follows.

More Information and Examples
Here are a few bundled examples of applications built with the LabVIEW Statechart Module.
Fan Demo (Asynchronous) – The ceiling fan demo using asynchronous architectures.
SPI Statechart Demo – SPI protocol developed using statecharts.
PackML – Package Machine Language machine model.
For more shipping examples, in LabVIEW, go to the menu option Help>>Find Examples… to
open the Example Finder.
Browse under Toolkits and Modules >> Statechart to find additional statechart examples.
For more information on the LabVIEW Statechart Module, visit ni.com/statechart.


![Tutorial: LabVIEW MathScriptders.kilicaslan.nom.tr/doc/19/42/LabVIEW MathScript.pdf6 LabVIEW MathScript Tutorial: LabVIEW MathScript [End of Example] 3.2 HELP You may also type help](https://static.fdocuments.net/doc/165x107/5e9941194c6bb22c6123c750/tutorial-labview-mathscriptpdf-6-labview-mathscript-tutorial-labview-mathscript.jpg)
