Korea’s Emission Trading System - the PMR · Korea’s Emission Trading System : An Attempt of...
21
Korea’s Emission Trading System : An Attempt of Non-Annex I Party Countries to Reduce GHG Emissions Voluntarily 2015.03.12 Junwon Hyun* and Hyungna Oh** *Fellow, Korea Legislation Research Institute: [email protected] **Associate Professor, College of International Studies, Kyung Hee University: [email protected]
Transcript of Korea’s Emission Trading System - the PMR · Korea’s Emission Trading System : An Attempt of...

Korea’s Emission Trading System : An Attempt of Non-Annex I Party Countries to Reduce GHG Emissions Voluntarily
2015.03.12
Junwon Hyun* and Hyungna Oh**
*Fellow, Korea Legislation Research Institute: [email protected] **Associate Professor, College of International Studies, Kyung Hee University: [email protected]

Overview of the KETS
▷KETS was launched on January 1, 2015
- Cap = 573 Mt CO2e in 2015, 2/3 of the country’s total emissions
- 23 Sub-sectors in the 5 sectors
- Second largest after the EU ETS
- 1st nationwide ETS in operation in Asia

Today’s Talk Plan
▷The institutional framework for the KETS
▷Key contents of the KETS
▷Recent issues
▷Policy Implications

I. Institutional Framework for the KETS
1. Background
Welcomed by the international society
Not based on national consensus à Weak base
+ Opposition from the business sector & Weak MOE
A Former President, Lee (2010) - A Pledge at the Copenhagen meeting: - A national emission reduction target of 30 percent by 2020
under the BAU scenario.
Strong legal bases - Defining important steps and timelines by laws
Governance - PCGG reflecting the president’s will - Multiple governance (MOE+PCGG, MOSF)
Make up for the weak base

2. Legal Bases for the KETS
1) Related Laws and Plans
,
*Full name: the Act on Allocation and Trading of Greenhouse Gas Emissions Allowances (2012)
2012 Establishment of Emission Trading Act* and its Enforcement Decree (2012), legal bases for the implementation of the ETS
2010 A reduction target announced (GHG emissions cut of 30% by 2020 under the BAU scenario)
2010 Establishment of “Framework Act” and its Enforcement Decree: a comprehensive plan to achieve reduction targets
January 2014 “Mater plan”for the ETS finalized
2011 Emission forecasts and reduction targets for each sector announced.
September 2014 “Allocation Plan”for the ETS finalized

2) Defining important steps and timelines by laws
→ the cancellation of the ETS becomes very difficult since it needs a series of legal procedures,which take a significant time and efforts.
Adoption Procedures (Lead authority)
Legal Timeline
Nationwide (B2009 =B2013)
ETS Total Sub-sectors Entity level
BAU 2009
BAU 2013 Cap Designation
/Allocation Designation/Allocation
Pledge at the Copenhagen meeting (2010), President
- ○
Framework Act (2010), PCGG
- ○
Emission Trading Act & its Enforcement Decree (2012), PCGG
- ○
Roadmap (January 2014), Multiple (MOE)
2013 ○
Master Plan (January 2014), MOSF
By Jan 1, 2014 ○ ○
Allocation Plan (September 2014), MOE
By Jul 1, 2014 ○ ○ ○/○
Allocation Approval Committee, MOE
○ ○ ○/○ ○/○
Opposition from the business sector Defined by the Enforcement Decree
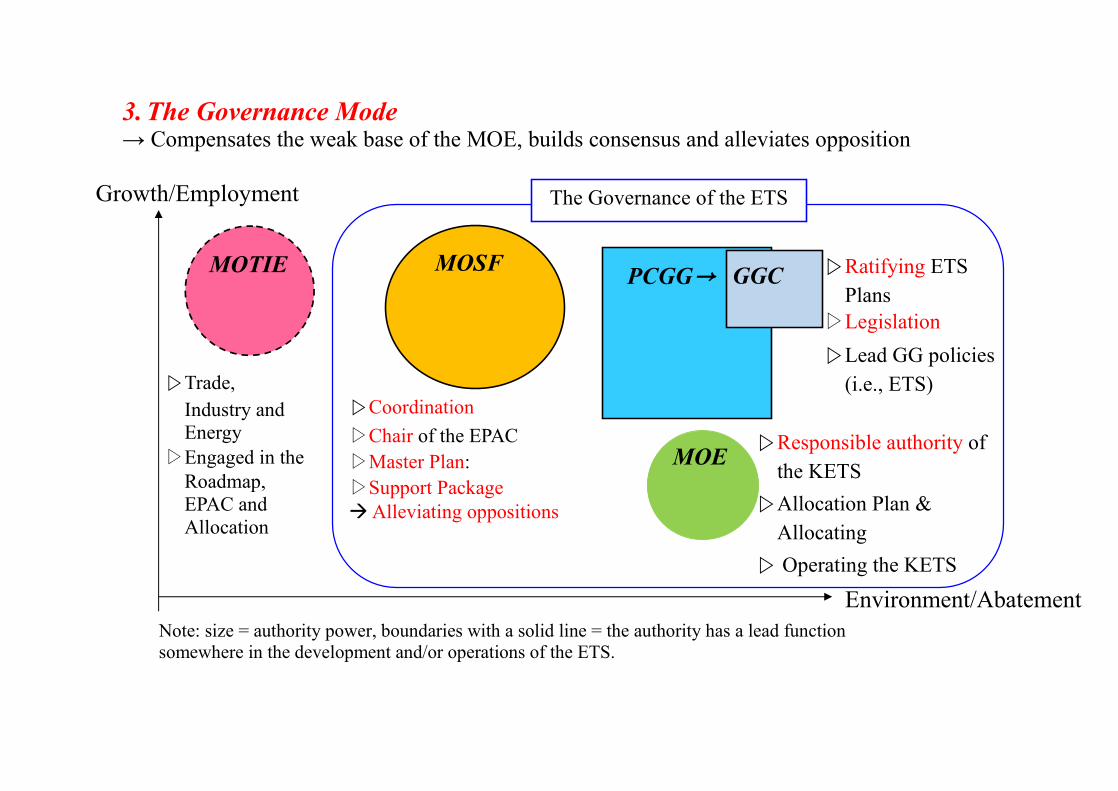
3. The Governance Mode → Compensates the weak base of the MOE, builds consensus and alleviates opposition
Growth/Employment
Note: size = authority power, boundaries with a solid line = the authority has a lead function somewhere in the development and/or operations of the ETS.
Environment/Abatement
MOTIE MOSF
▷Coordination ▷Chair of the EPAC ▷Master Plan: ▷Support Package à Alleviating oppositions
PCGG→
▷Trade, Industry and Energy
▷Engaged in the Roadmap, EPAC and Allocation
GGC ▷Ratifying ETS Plans
▷Legislation ▷Lead GG policies
(i.e., ETS)
MOE
The Governance of the ETS
▷Responsible authority of the KETS
▷Allocation Plan & Allocating
▷ Operating the KETS

4. Other Institutional Preparations
l Target Management System
- A step-stone to the ETS
- Provides Emission data and MRV experiences
l Registry à GIR
l KRX (January 2014) à a single market for permit-trading
l KECOà MRV

II. Key Contents of the KETS
1. Main focus of the 1st 3 Commitment Periods (2015-17; 2018-20; 2021-25) - Proposed by the 1st Master Plan
1st Commitment Period
(2015~2017) 2nd Commitment Period
(2018~2020) 3rd Commitment Period
(2021~2025) Main goal ▪ Settlement of the KETS ▪Reduction(considerable) ▪Reduction(significant)
System operation
▪Allow covered entities to choose flexible compliance methods as much as possible conditional on accurate MRV
▪Establishment of an accurateMRV system
▪Expanding the scope of the KETS
▪Making advanced MRV
▪Inducement of voluntary reduction in preparation for post-2020 climate change regime
▪Lowering barriers: 3rd party-participation, offshore offsets or linking can be considered
Allocation
▪Base: Grandfathering ▪Get balanced with the TMS
▪Introducing non-free permits
▪Advancement of the allocation method, such as benchmarking
▪Decrease the proportion of free allocated permits (at most 90%)
▪Settlement of advanced allocation method
Source: Master Plan, Ministry of Strategy and Finance, Jan. 2014.
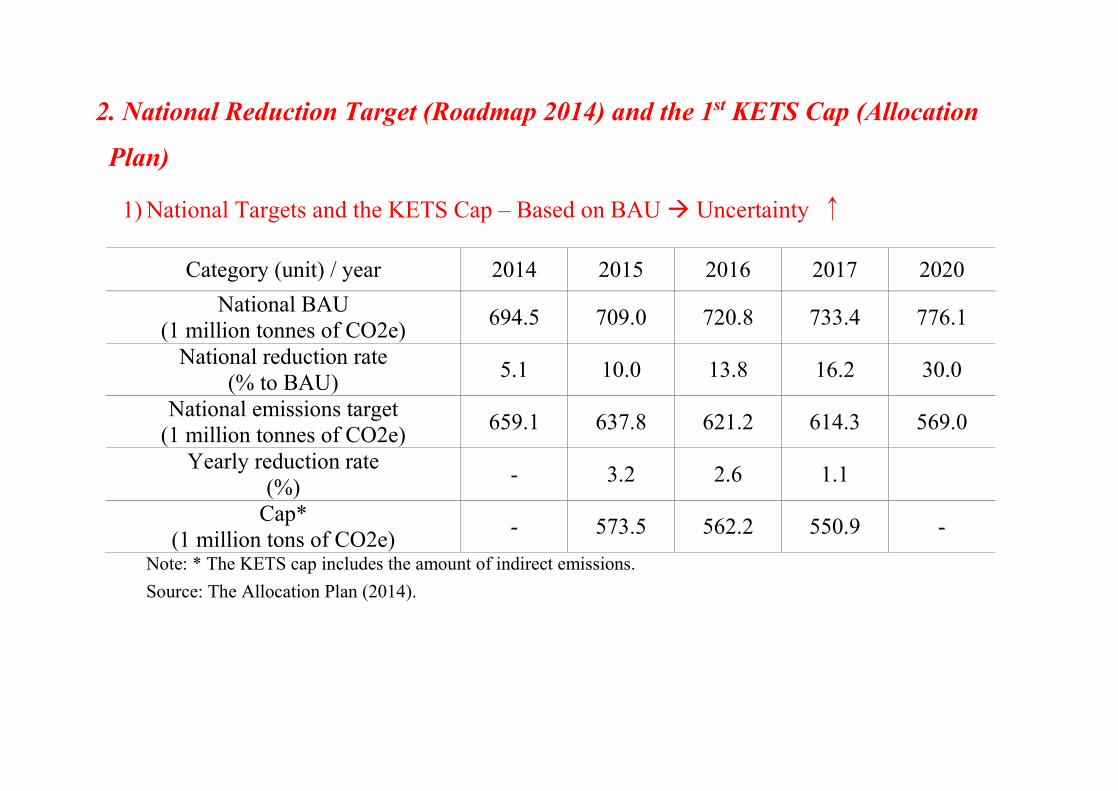
2. National Reduction Target (Roadmap 2014) and the 1st KETS Cap (Allocation
Plan)
1) National Targets and the KETS Cap – Based on BAU à Uncertainty ↑
Category (unit) / year 2014 2015 2016 2017 2020 National BAU
(1 million tonnes of CO2e) 694.5 709.0 720.8 733.4 776.1
National reduction rate (% to BAU) 5.1 10.0 13.8 16.2 30.0
National emissions target (1 million tonnes of CO2e) 659.1 637.8 621.2 614.3 569.0
Yearly reduction rate (%) - 3.2 2.6 1.1
Cap* (1 million tons of CO2e) - 573.5 562.2 550.9 -
Note: * The KETS cap includes the amount of indirect emissions. Source: The Allocation Plan (2014).

2) KETS Cap for the 1st Commitment period (2015-2017) – Solid caps! But inflexible due
to partitioning caps across sectors
(1 Million KAU or 1 MtCO2e)
Industry Business 2015 2016 2017 2017 Total number of emission permits 573.46 562.18 550.91 1,686,55Pre-allocated emission permits 543.23 532.58 521.92 1,597,73Emission permits in reserve 88.82Combustion Power sector· 250.19 245.28 240.38 735.82
Industry
Oil refining 19.15 18.78 18.40 56.33 Mining 0.25 0.24 0.24 0.72
Steel Processing, etc. 103.28 101.26 99.23 303.78 F-gas processing 0.68 0.66 0.65 1.99
Cement 43.52 42.67 41.81 128.00 Petrochemical 48.86 47.90 46.94 143.70
Paper 7.63 7.48 7.33 22.44Wood 0.38 0.38 0.37 1.13Textile 4.70 4.61 4.52 13.83
Glass·Ceramics 6.26 6.14 6.02 18.42 Non-ferrous metals 6.89 6.75 6.62 20.26
Machinery 1.42 1.39 1.36 4.17 Electricity·Electronics 2.88 2.82 2.76 7.17

Display Processing, etc. 6.71 6.57 6.44 19.72 F-gas processing 2.44 2.39 2.34 7.17
Semiconductor Processing, etc. 8.25 8.09 7.93 24.27 F-gas processing 2.20 2.16 2.12 6.48
Motor vehicle 4.24 4.16 4.08 12.48Ship building 2.68 2.63 2.58 7.89
Food & beverages 2.53 2.48 2.44 7.45 Transportation Aviation 1.29 1.26 1.24 3.79
Buildings Buildings 4.02 3.94 3.86 11.82 Communications 3.09 3.03 2.97 9.09
Public sector/Waste
Water service 0.77 0.75 0.74 2.25 Waste materials 8.92 8.74 8.57 26.23
* LNG gas manufacturing and fugitive emissions (2 million tons of CO2e, 7.6 million tons of CO2e, respectively, as of 2020)included.

3. Inclusion of Indirect Emissions
l Rational - Electricity pricing in Korea à End-users have little incentive to reduce electricity
consumption
- Benchmark number is used for calculation of the indirect emissions
* Direct emissions: mostly grandfathering
* Indirect emissions: benchmarking (CO2 intensity of the power generation)
l Merits: as proposed
l Drawbacks - doubled payments for one action,
- complicated formula needed to compute BAU and reductions by the regulator as well as
entities,
- possibly an excuse from the business sector (mostly, sensitive sectors) when a carbon tax is
imposed in the future
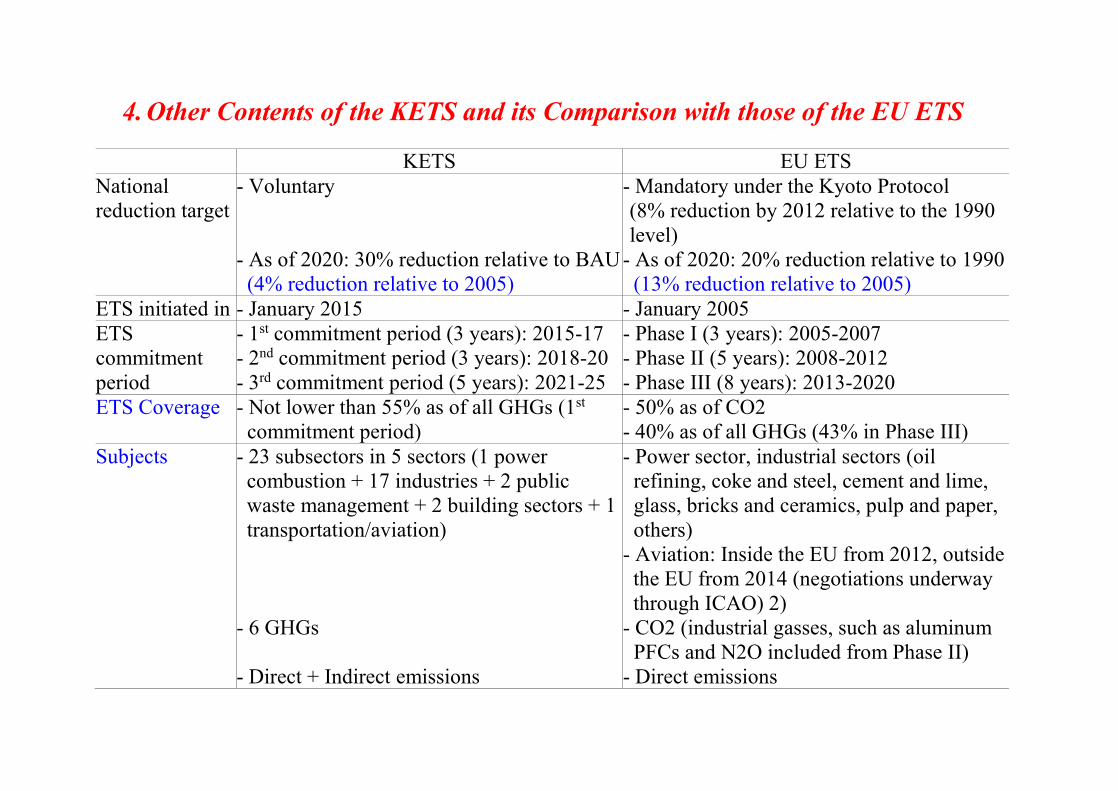
4. Other Contents of the KETS and its Comparison with those of the EU ETS
KETS EU ETS National reduction target
- Voluntary - As of 2020: 30% reduction relative to BAU
(4% reduction relative to 2005)
- Mandatory under the Kyoto Protocol (8% reduction by 2012 relative to the 1990 level)
- As of 2020: 20% reduction relative to 1990 (13% reduction relative to 2005)
ETS initiated in - January 2015 - January 2005 ETS commitment period
- 1st commitment period (3 years): 2015-17 - 2nd commitment period (3 years): 2018-20 - 3rd commitment period (5 years): 2021-25
- Phase I (3 years): 2005-2007 - Phase II (5 years): 2008-2012 - Phase III (8 years): 2013-2020
ETS Coverage - Not lower than 55% as of all GHGs (1st commitment period)
- 50% as of CO2 - 40% as of all GHGs (43% in Phase III)
Subjects - 23 subsectors in 5 sectors (1 power combustion + 17 industries + 2 public waste management + 2 building sectors + 1 transportation/aviation)
- 6 GHGs - Direct + Indirect emissions
- Power sector, industrial sectors (oil refining, coke and steel, cement and lime, glass, bricks and ceramics, pulp and paper, others)
- Aviation: Inside the EU from 2012, outside the EU from 2014 (negotiations underway through ICAO) 2)
- CO2 (industrial gasses, such as aluminum PFCs and N2O included from Phase II)
- Direct emissions

Covered entities - A facility that has emitted 25,000 tons or more of CO2e or
- A firm that has emitted 125,000 tons or more of CO2e per year during the preceding three years
- New entrants (same criteria are applied) - Voluntarily participating business entities
- An installation that has emitted 25,000 tons or more of CO2e per year during the preceding three years
- New entrants (same criteria are applied) - Voluntary participants
Number of eligible entities
- 525 entities (243 firm entities and 282 facility entities)
- 5,000 business entities across 30 countries (11,500 installations)
Target reduction rates in ETS-covered sectors
- 30% reduction relative to BAU in 2020 or 4% reduction relative to 2005 (same as the national reduction target rate)
- Reduction rate for the 1st commitment period = 2% linear reduction on an annual basis (same for each industrial sector)
- Reduction of 21% relative to 2005 by 2020 - Phase III reduction rate = 1.74% linear
reduction on an annual basis (equivalent to annual 5% reduction relative to 2010)
How to determine a Cap
- Estimated BAU, historical records & reduction potential by sectors are reflected in a bottom-up manner
- Bottom-up reflection of NAPs of each country by the end of Phase II
- Reflection of a harmonized single EU-wide Cap starting in Phase III
Cap - 1st commitment period (1 billion tons of CO2e): 16.867 (annual=5.62)

How to allocate - Free allocation * 1st commitment period: Grandfathering (basic), benchmark (on 3 items: oil refining, gray cement clinker, aviation)
* 2nd commitment period and afterwards: extended application of benchmark cases
- non-free allocation: auction
- Free allocation * Phase I, II: Grandfathering (basic),
benchmark (partly) * Phase III: benchmark (basic),
Grandfathering (auxiliary) - non-free allocation: auction
Ratio of free allocation
- 1st commitment period: 100% - 2nd commitment period: 97% or lower - 3rd commitment period: 90% or lower - Sensitive sectors will receive 100% of their
allowances for free. ① Trade intensity > 30% ② Production cost > 30% ③ Trade intensity > 10% + Production
cost > 5%
- Phase I: 95% - Phase II: 90% - Phase III (excluding power sector):
80% in 2013 → about 30% in 2020 → 0% in 2027 [0% for power sector from 2013]
- Up to 100% free allocation for EITE sectors(based on trade intensity) 3)
BM calculation - Average BM (total GHG/total activity) - top 10% average Allocation unit - Firm & facility - Installation Emission permits
- Permit of 1tCO2e emission per 1 KAU - Permit of 1tCO2e emission per 1 EAU
Offset - 1st and 2nd commitment periods: Domestic offset alone is recognized (upper limit:
- CERs (offshore) and ERUs (onshore) recognized (Upper limit for Phase
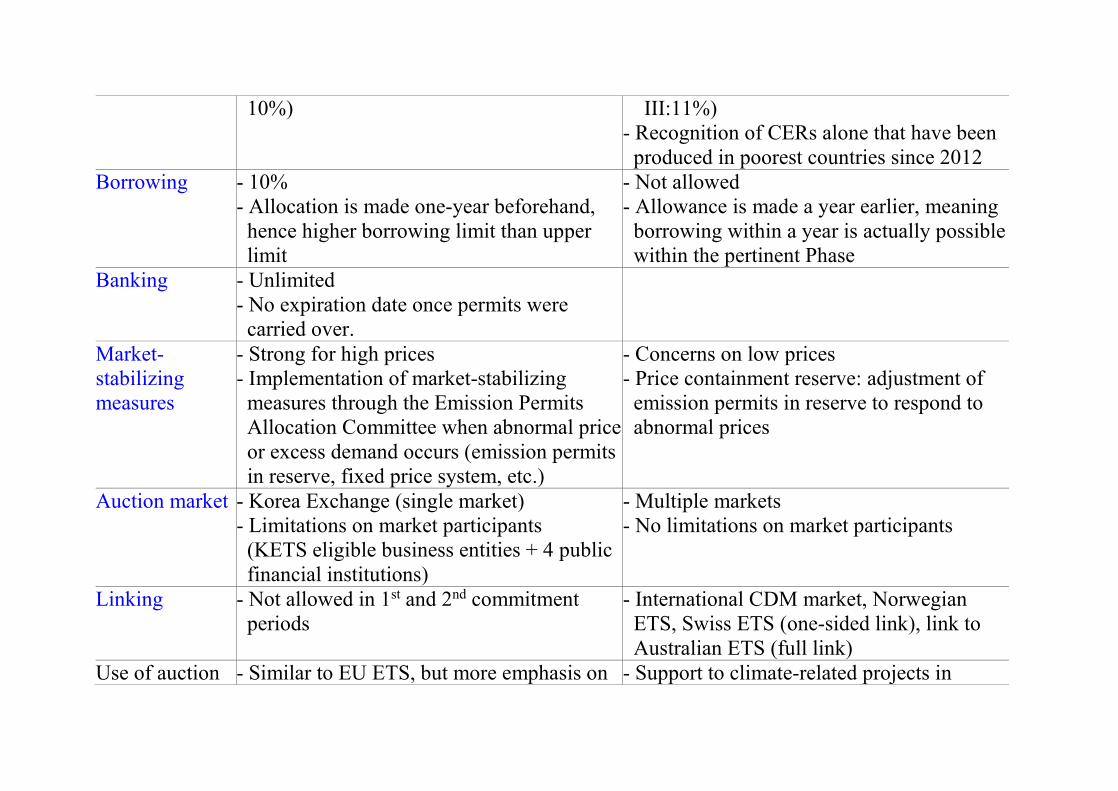
10%) III:11%) - Recognition of CERs alone that have been
produced in poorest countries since 2012 Borrowing - 10%
- Allocation is made one-year beforehand, hence higher borrowing limit than upper limit
- Not allowed - Allowance is made a year earlier, meaning
borrowing within a year is actually possible within the pertinent Phase
Banking - Unlimited - No expiration date once permits were
carried over.
Market-stabilizing measures
- Strong for high prices - Implementation of market-stabilizing
measures through the Emission Permits Allocation Committee when abnormal price or excess demand occurs (emission permits in reserve, fixed price system, etc.)
- Concerns on low prices - Price containment reserve: adjustment of
emission permits in reserve to respond to abnormal prices
Auction market - Korea Exchange (single market) - Limitations on market participants
(KETS eligible business entities + 4 public financial institutions)
- Multiple markets - No limitations on market participants
Linking - Not allowed in 1st and 2nd commitment periods
- International CDM market, Norwegian ETS, Swiss ETS (one-sided link), link to Australian ETS (full link)
Use of auction - Similar to EU ETS, but more emphasis on - Support to climate-related projects in

revenue financing the operation expenses of KETS and using supportive financial resources for industrial sectors
- Little emphasis on climate finance for developing countries
developing countries (climate finance) - Investment in onshore renewable energy,
EU targets, adaptation, assistance to low-income households in difficulties brought by the increase in electricity rates, afforestation projects, support for carbon storage (CCS) projects
Failure to comply with the obligation to surrender emission permits
- A failed entity shall return emission permits that are leftover, or pay penalty surcharges (three-times the market price within the scope of 100,00 won per tCO2e
- A failed entity shall pay penalty surcharges of 100 euros per tCO2e and be obliged to surrender emission permits additionally (a list of failed entities to be disclosed) 4)
Upper and lower limits for permit prices
- Lower limit: none - Upper limit: none (actually 100,00 won per
tCO2e)
- Upper and lower limits: none
Note:1) Subjects of the Target Management System are ‘road’ and ‘railway’ besides 23 subjects eligible for ETS. 2) ICAO = International Civil Aviation Organization, 3) Emissions-intensive trade exposed (EITE), 4) Penalty surcharge in Phase I=40 euros/tCO2e.Source: Constructed by authors, using data such as the Allocation Plan (Sep. 2014), EDF/IETA (May 2013).
Source: Act on the Allocation and Trading of Greenhouse-Gas Emission Permits

III. Recent Issues
1. Market Stabilization Measures
l A Reference price (10,000K-won, approximately $9) - This reference price was proposed by the Allocation Plan, as a reference price for the
government to consider the use of market stabilization measures.
- Prices above this reference price have been observed without actual trading.
Source: KRX
KAU prices Quantity traded

l MOE requested a temporary transfer of a duty (to make decisions on market stabilization
measures) assigned to the Allocation Committee to the MOE.
l Roles of the 4 Public Financial Institutions on this issue will be defined soon.
l Researchers concern on high permit prices from the 2nd commitment period (2018~)
2. Continued Opposition from the business sector
l Prepare cases against the government (or BAU, sectoral BAU, Allocation Plan, and
others)

IV. Lessons
l For developing countries, a comprehensive sunrise policy is required to adopt the ETS
- Consistent and strong willingness
- Legal bases
- Multiple governance
- Institutional preparations (emission data & MRV system)
- Consensus building
- Transparency & Accountability
- Supplementary measures compensating losses of vulnerable groups
l Global actions to get fair carbon-prices
- Strong opposition is based on a fear of carbon-leakage and a loss in price competitiveness
Thanks !!!