
Key factors for sustainable cost recovery in the context of community ...
79
WHO Collaborating Centre since 1968 Key Factors for Sustainable Cost Recovery in the Context of Community-Managed Water Supply Occasional Paper Series OP 32 E
Transcript of Key factors for sustainable cost recovery in the context of community ...
WHO Collaborating Centre since 1968
Key Factors for Sustainable Cost Recovery in the Context of Community-Managed Water Supply
Occasional Paper Series OP 32 E

Key Factors for Sustainable Cost Recovery
in the context of community-managed water supply
by François Brikké and Johnny Rojas
Occasional Paper Series 32-E
November 2001
IRC International Water and Sanitation Centre Delft, The Netherlands

Copyright © IRC International Water and Sanitation Centre (2001) IRC enjoys copyright under Protocol 2 of the Universal Copyright Convention. Nevertheless, permission is hereby granted for reproduction of this material, in whole or part, for educational, scientific, or development related purposes except those involving commercial sale, provided that (a) full citation of the source is given and (b) notification is given in writing to IRC, P.O. Box 2869, 2601 CW Delft, the Netherlands.

iii
Table of contents Acknowledgements v Introduction 1 Context and historical perspective 1 Is there a right strategy for cost recovery? 2 1. Planning for cost recovery 5 1.1 Demand-driven approach 5 1.2 Costs and cost recovery 8 1.3 Willingness to pay 15 1.4 Setting an adequate institutional framework 21 1.5 Accompanying measures and capacity-building 25 2. Cost recovery in practice 26 2.1 Setting an appropriate tariff 26 2.2 Optimising costs 32 2.3 Access to other sources of funding 36 2.4 Effective financial management 43 2.5 Service efficiency 49 Figures: Figure 1 Cost recovery options 13 Figure 2 Defining a tariff according to the distance between water point and household location 27 Boxes: Box 1 An example of facilitation by an institution in designing a cost recovery system 7 Box 2 Vicious circles and cost recovery 11 Box 3 The use of the marginalisation index in Mexico 11 Box 4 Cross subsidy in Venezuela favours the poor 12 Box 5 An alternative way to measure WTP: community workshops 20 Box 6 Operation and maintenance costs 33 Box 7 Bangladesh, the Grameen Bank 42 Tables: Table 1 Strategies for improving cost recovery 3 Table 2 Factors influencing technology choice with their specific O&M criteria 9 Table 3 Overview of various cost analysis tools 15 Table 4 Community management and cost recovery 22 Table 5 Gradual transfer of managerial and financial responsibilities from government to communities of existing rural water supply systems, in Namibia 23 Table 6 Operation & maintenance tasks for a handpump 23 Table 7 Operation & maintenance tasks for a pump or diesel engine 24 Table 8 Distribution of responsibilities for administrative and support activities linked to O&M 24 Table 9 Different ways of defining a tariff (Senegal River Basin project) 27 Table 10 The distribution of costs and periodicity of expenditure for a public standpost with pump 33 Table 11 Overview of characteristics of main micro-credit options 41 Table 12 Basic financial management issues for budgeting 44 Table 13 Basic financial management issues in organising financial flows 46 Table 14 Basic financial issues for good financial administration 47 Table 15 Financial management issues and possible options 49

iv
Annexes: Annex 1 Example of tariff calculation for a handpump 52 Annex 2 Example of tariff calculation for a piped system with treatment 54 Annex 3 Format of a water service bill 59 Annex 4 Format for budgeting 60 Annex 5 Forms for bookkeeping, financial administration and control and monitoring 61 Annex 6 Example of a behaviour study 64 Annex 7 Bibliography 66

v
Acknowledgements Special thanks should be given to the professionals who have actively contributed to the development of this document, in particular, Hanington Odame, Elisabeth Lucas, Christine van Wijk, Dick de Jong, Teun Bastemeyer, Bob Boydell and Jan Teun Visscher. The ideas described in this paper have been developed through an extensive bibliographical research and a survey of 12 projects worldwide. It has been subsequently discussed in an international meeting of experts on cost recovery, held in Delft (The Netherlands) in January 2001, and organised jointly by IHE and IRC. The Ministry of Housing, Spatial Planning and Environment (VROM) of the Netherlands provided financial support for the organisation of this meeting. IRC International Water and Sanitation Centre

vi
Key Factors for Sustainable Cost Recovery
1
Introduction Context and historical perspective Cost recovery is still today one of the major obstacles to achieving a sustainable drinking water supply in developing countries, despite major efforts in the sector over the past decades. The Expert Meeting on Cost Recovery1 held in Delft, in January 2001, and a literature review of the subject, have highlighted a number of major problems concerning cost recovery: • obtaining good cost data on water supply and sanitation, • the need to differentiate between capital and recurrent costs, • lack of awareness by communities of the costs of safe water and sanitation and who is responsible
for meeting them, • methodological problems with studies on willingness to pay and demand, • knowing how to derive equitable tariffs from willingness to pay and demand studies, • tariffs do not cover all costs, • equity objectives are rarely taken into account in existing cost recovery principles, • poor regulation and enforcement, • monopoly problems, political interference and cultures of non-payment, • poor management capacity of communities, • misuse of funds. It was thought2 for a time in the 1970s that appropriate technology that communities could afford would contribute to solving the problem. The 1980s brought an understanding of community involvement that grew later into community management and gender awareness. Community financing came to be considered as a community affair, which communities could resolve, if they were given responsibility for it, and if they participated in the whole project cycle. In the early 1990s, the International Community stated in Dublin that “water has an economic value in all its competing uses and that it should be recognised as an economic good”. This was the springboard for a new era during which professionals took various positions. Economists argue that “the basic principle behind user charges (urban or rural) is that users should pay the economic cost of water services, as the economic price of water should ensure the optimum economic efficiency of water charges. The appropriate cost for users to pay is the long run marginal economic cost, which is approximated by the average incremental cost derived from the least cost method analysis3”. However, rural or low-income urban communities who are managing their system have problems in understanding this language and applying its concept. Social scientists give an “emphasis on water as a basic need4” and fear the economic approach as a possible threat to equity, as it does not fully allow for the social dimension. Environmentalists agree that “managing water as an economic good is an important way of encouraging conservation and protection of water resources5”, mainly by including the cost of preserving water in user charges and by applying the principle of the polluter pays. Governments and municipalities, who are going bankrupt because consumers don’t pay for services, apply the “principle of ‘user pays’ so strictly that the plight of the poor is overlooked6”.
Furthermore, when considering specifically drinking water and not water resources in general, sector professionals today prefer to mention water as a social and economic good rather than only as an economic good. According to this view, it is not water but the services involved in providing safe water that have a price; hence water should be considered as a commodity rather than as a good.
1 Organised by IHE and IRC 2 Adapted from Poverty and water supply and sanitation services, by Len Abrams, 1999 3 From Handbook for the Economic Analysis of Water Supply Projects, Asian Development Bank, 1999. Page
190. 4 From Water as an economic good, by Desmond Mc Neil. In: Vision 21 : Water for People. 5 From Dublin Statement, 1992, extract of principle 4. 6 From Cost recovery at all costs ? in Maru A Pula, Issue N. 16, March 2000.

OP-32-E
2
Clearly, however, the concept of water as an economic good has helped considerably to trigger the principle that water services have a price which consumers should pay, and this has been a definite, not yet sufficient, step towards improved cost recovery. More recently, specialists and governments have understood that development had to be demand–driven, in order to encourage feelings of ownership and willingness to pay. Finally, today, there is a trend towards believing that the involvement of the private sector is essential for financial efficiency and sustainability. So, what has to be done to reach sustainable cost recovery? One would be tempted to say that the solution lies in a balanced application of all the concepts and principles mentioned above, a sort of syncretism where everything mixes in a melting pot. Decades of conceptual evolution, directly or indirectly linked with cost recovery, have managed to highlight some commonly accepted basic principles, such as the fact that users should pay for water services, and that communities should have a role in managing their water supply and adopt a gender perspective. At the same time, one of the results of this evolution has been to show that there are no blueprints generally applicable to all situations and contexts. There are however certain factors which can contribute to sustainable cost recovery, and which can be adjusted or adapted to local circumstances. These problems become even more crucial, as communities are progressively made responsible, or co-responsible, for the financial management of their water supply system, and as consumers begin to pay for a service they were not paying for in the past. Is there a right strategy for cost recovery? The Business Partners for Development (BPD) Water and Sanitation Cluster7 has recently made an interesting survey on eight water supply projects world-wide8 (see Table 1), and came up with the following conclusions:
"One reason that cost recovery is a difficult goal to achieve is that it is affected by so many factors and so many different parts of project design and operation. Many water and sanitation projects begin without fully acknowledging the importance of these interrelationships. The service level (e.g. public standposts, in-house taps, etc) or the institutional structure, for example, is often chosen before a project even begins – either because the project aims to reform an existing water or sanitation system or because the project planners felt they had identified the best technical solution. In this situation, the cost recovery problem is seen as the need to collect enough revenue from users to cover the cost of the system that was installed. The challenge then becomes getting people to use the system and getting people to pay. ( In this non optimal situation), strategies might include: 1. education and awareness campaigns for consumers, 2. improved customer relations, 3. introducing disconnection for non-payment, 4. altering institutional structures to change incentives to charge and to pay, or 5. revising tariff structures and connection fees; possibly through implementing different tariff structures for the poor. Getting people to cover the cost of a specific service is important, but is not the only approach to improving cost recovery. Changing the cost or the characteristics of that service can also contribute to improving cost recovery. This perspective introduces another set of possible strategies for achieving cost recovery: 1. changing technologies or service levels,2. improving service quality or reliability, or 3. reducing operational costs."
7 Business Partners for Development - Water and Sanitation Cluster. E-mail: [email protected] C/o Water Aid, First Floor, Prince Consort House, 27 - 29 Albert Embankment, London SE1 7UB, United
Kingdom 8 By Kristin Komives and Linda Stalker Propoky (October 2000). Cost Recovery in the focus projects: Results,
Attitudes, Lessons and Strategies (draft).

Key Factors for Sustainable Cost Recovery
3
Table 1: Strategies for improving cost recovery (from the BPD research and survey report)
Cost Recovery Strategy Projects with stand-posts
Projects with private connections and standposts
Projects with private household connections
Haiti
Senegal
S. Africa:
BoTT
S. Africa:
Kw
aZulu
Argentina
Bolivia
Colom
bia
Indonesia
Rewards and sanctions • Rewards for households that pay ! • Cut-off in case of non-payment !1 ! 2 ! ! ! !Tariff and fee structure • Payment options/pay over time !3 ! ! ! ! !• Block tariff with low price first block • Means-tested subsidy (for poor households) • Targeted subsidy (for poor neighbourhoods) ! • Lower connection fee ! ! ! !Billing, charging, payment • Change frequency of payments
! • Improve billing system & delivery
! ! • Increase/change payment points
! ! ! ! !Customer relations / education • Improve customer relations
! ! ! ! ! ! !• Pre-project information
! ! ! ! ! • Education campaigns
! ! ! ! ! ! !Institutions and organisations • Problem solving committees ! • Village committees to run system ! ! • Group households into single customer ! • Train/create standpost vendors ! !4 Service, technology and costs • Improve quality or type of service ! ! ! ! ! ! ! !• Pre-payment technology ! ! • Lower cost technology ! ! ! • Reduce O & M costs !
1. If the standpost operator does not pay for the bulk water, the standpost is turned off and is not turned back on again
until the operator pays her debt. 2. Penalties exist on paper but are rarely enforced. 3. After first 50% of the fee is paid. 4. In standpost projects financed by ENDA.

OP-32-E
4
The BPD Report mentions also that: “A few projects are trying to improve cost recovery, not by improving revenue collection but by increasing water consumption. These projects are using hygiene education programs to explain the importance of using water for bathing and washing, and of having sanitation technologies (e.g. toilet) in the home”. The report shows that there are no set formula to improve cost recovery, but rather a blend of possibilities which should be adapted to local circumstances and context. This report wishes, however, to propose that setting an appropriate strategy for cost recovery can be seen in a wider perspective. Cost recovery should not only be seen as trying to apply a series of corrective measures for insufficient revenue collection, but rather that it is part of an integral approach which can be planned for right from the start. It relies on a series of mutually dependent factors, which have been grouped into two main chapters: 1. Planning for cost recovery; and 2. Putting cost recovery into practice. Planning for cost recovery includes:
• the way the project has been introduced; demand-driven projects respond better to local realities and expectations;
• a decision about what costs should be recovered and by whom, in an equitable way; technological choices have a definite impact on level of recurrent costs;
• an analysis about the willingness to pay of communities; • the setting of an adequate institutional framework in order to manage the system in a financially
sustainable way; • defining accompanying measures, such as setting an appropriate legal and policy framework,
educational and/or promotional campaigns and capacity-building activities. Putting cost recovery into practice includes:
• setting an appropriate tariff; there are different types of tariffs which communities can choose from, according to the context;
• optimising costs; this means being able to identify and estimate costs as well as to minimise them; • access to other sources of funding; tariffs in most cases do not cover all costs, making it essential
to analyse other potential financial sources; • effective financial management; this encompasses budgeting; revenue collection, bookkeeping
and accountability; financial control and monitoring; • service efficiency as the best passport for an operator; this will cover system performance and
reductions in unaccounted for water, as well as improving relationship with users. This report will review each one of these elements, and try to highlight their key characteristics and advantages / disadvantages. The objective of this report is to provide the reader with sufficient insight into the various factors affecting cost recovery, so that they can subsequently be discussed and tested within a project team and with communities. Finally, IRC together with other sector professionals wish to develop this Occasional Paper into a Technical Guide that will include a wide variety of examples from the field.

Key Factors for Sustainable Cost Recovery
5
1. Planning for cost recovery 1.1 Demand - driven approach 1.1.1 The importance of demand Expressed demand by communities and consumer groups for an improved water supply service can have a direct influence on cost recovery, in two ways. The first is related to the consumer's habits and expectations, and the second to the water committee that will be managing a water supply system. At consumer level Projects which take into consideration consumer demand, analyse in a participatory way the habits and expectations of consumers, in terms of water use and volume of consumption. The presence of alternative sources of water and the desired service level will be assessed and projects designed correspondingly. These projects are better adjusted to real life situations and can be based on realistic estimates of water consumption with predictable revenues from the sale of water. However, projects are still not adequately assessing community demand. Projects are developed where it becomes clear that demand for the service, measured by volume of consumption, is too low to achieve cost recovery. A great number of field reports mention that with current prices and low consumption levels, operators are unable to collect enough revenue to cover costs. This is particularly a problem in areas where there are alternative sources of cheap water. Competition from alternative sources is not a problem in areas where the primary alternative is water sold at a high-cost by water vendors9.
"When demand is not sufficient to achieve cost recovery, system operators are stuck with the problem of having to increase demand in order to achieve cost recovery. Some projects are trying to use education campaigns to increase water demand. Others have considered lowering prices. However, lowering water prices is a dangerous way to improve cost recovery, unless the price elasticity of demand is known. Price decreases could actually reduce revenue collection if the quantity of water sold does not increase enough to compensate for the lower price"10.
In addition, projects which match the desired service levels of communities while at the same time creating a full awareness of the financial implications, are likely to influence willingness to pay by communities and therefore contribute positively to cost recovery. At water committee level Participatory assessments of water demand imply that communities make a committed contribution towards designing an improved water supply system. This commitment can generate a feeling of ownership of and responsibility for the system, expressed through the community or user group managing it (for example, a Water Committee). The Committee will strive to run the system in an effective and efficient way.
9 BPD Report 10 BPD Report

OP-32-E
6
1.1.2 Findings of a study involving 88 services in 15 countries
Research was conducted in 15 countries by several institutions (listed below11). It had the following two main objectives: • to investigate possible linkages between sustained, well used, community-managed rural water
services and participatory approaches which respond to demand and encourage equity with regard to gender and the poor;
• to develop and test a participatory methodology, now called Methodology for Participatory Assessment (MPA), which allows women and men in the community to take part in assessing their service and quantifies the outcomes of participatory tools for statistical analysis. Participatory tools are tools used for the empowerment of communities by development workers. Possible outcomes range from improved community management, improved willingness to pay and financial management, as well as improved service.
The study covered 88 community-managed water services in 18 projects in 15 countries. Services were selected at random but the projects volunteered. This affected the distribution of the services, which was skewed towards services with relatively better results. Nevertheless, there was enough variation to find significant differences. Significant linkages were indeed found. The most important findings on cost recovery were as follows: • The more demand responsive the projects, the better the services were sustained (with both
women and men have a say decisions about service planning, including arrangements for local financing).
• The more communities were empowered (i.e., they had authority and local control during construction and management and they had been trained), and the better they accounted for the use of this power to the users, who were also the tariff payers, the better the services were sustained.
• Well-sustained services were also better used, with higher percentages of people having access to the water and a greater shift towards using only improved services, at least for drinking water.
• Users contributed to investment costs, through cash in 62% of the cases, and with their labour in 90% of the services.
• In half of the services, user payments covered operation and maintenance (O&M) costs; one quarter also paid for repairs and one quarter made some profit.
• The study found significant associations between more effective cost recovery and democratic decision-making on technology choice and maintenance arrangements, the involvement of women, better accounting and budgeting, and more timely payments.
• All the communities included better-off, intermediate and poor households, yet only 9 of the 88 services had differential tariffs.
• Within households, it was common for drinking water to be used for productive purposes, and this was seldom reflected in tariffs. Poor and better-off households both used water productively, when they could, but the better-off households had more opportunity to benefit from such uses. Through involving small amounts, they were one of the reasons for water shortages. On 88 water services, 28% had seasonal shortages and 10% never supplied enough water to meet primary household needs. In some services, productive uses were banned. In many cases it would have been better to design for these uses and their payment in participatory planning, as they could have generated income to sustain the service.
• Agency policies and approaches have significant influence on effective and sustainable service delivery.
11 Organisations involved: IRC International Water and Sanitation Centre and World Bank Water and
Sanitation Program with partners or consultants CINARA, Latin America; PAID, West Africa; ITN Philippines, The Philippines; Socio-Economic Unit Foundation, India; ICON, Nepal; Marga Institute, Sri Lanka; University of Indonesia, Indonesia; Institute of Water Development, Zimbabwe; Ministry of Water Resources and CMTS-East Africa, Kenya; Department of Water Affairs and Forestry, South Africa; Dept. of Water Cabinet’s Office, Zambia.

Key Factors for Sustainable Cost Recovery
7
1.1.3 Implementing a demand-driven approach A demand-driven approach plans and designs a project taking the point of view and desire of communities as a starting point. It is effective when implemented in a participatory way. In a conventional working methodology, a ‘top-down’ approach, the planner presents a prepared project to the communities. In a participatory ‘sharing’ approach, the planner becomes a facilitator, promoting a process whereby communities design, learn and make decisions. The planner uses his/her own experience, and those of community members, to raise their awareness and to make them fully responsible for the choices they make. Many professionals will be unfamiliar with facilitation as a working style. Facilitation works best when certain values are accepted and practised not only by the facilitator, but also by the entire group. These include: • Democracy, in which each actor (men, women, planner and communities) has an opportunity to
participate without discrimination; • Responsibility, by which each actor is responsible for his/her experiences and behaviour; and • Cooperation, so that the facilitator and the communities work together to achieve one collective
goal.
Box 1: An example of facilitation by an institution in designing a cost recovery system
The majority of the population of the community of El Hormiguero, in Colombia are black people, with a low educational level. Their main economical activity is the extraction of sand from the Cauca River. The water is provided through a deep well pump, using high levels of electricity. The community receives water for eight hours a day, and has to pump water for four hours every day. A support institution, Cinara, has facilitated the process since the water system was developed. The system was managed by a community organisation and by 1997 it was not receiving enough money to cover recurrent costs. Users paid a monthly flat rate of US$ 0.95. The water board was considering an increase in the tariff, but they knew that many users were reluctant to pay more, and they did not have information about the real costs of the water service. The first step was to develop a cost and tariff study for the water supply system. The conclusion was that tariffs should be raised but users had to make the decision. The water board decided to call a general meeting. Cinara was the facilitator to that meeting. The first step during the meeting was a role-play known as ‘the bus dynamic’, using a scenario with similar costs problems. After the role-play, participants were asked about the similarities between the water service and the transportation service. The dynamics allowed the participants to identify the main costs for the water service and to calculate the tariffs for their water pumping system. Cinara then showed the cost and tariffs study for the system considering different stages of cost recovery, from the recovery of recurrent costs up to full cost recovery. The community saw the necessity of covering the total costs of the system through higher tariffs in order to keep a good quality service. They decided to pay a monthly flat rate of US$ 2.2, which represented an increase of more than 100% of the initial tariff.
Source: Cinara
The effectiveness of a participatory approach depends on having a good working attitude, and on the use of participatory techniques12. The participation of communities, both men and women, in the design and implementation of improved services can contribute to a greater commitment to taking responsibility for the service, since they will have to manage, operate and maintain it, as well as pay for its functioning. Designing a cost recovery system is a community concern and the community should be involved in all stages of its design, if the system is to be accepted, and sustainable. Gender considerations are especially relevant for cost recovery because men and women have unequal access to and control over water and other resources including land, time and credits. It is also important because women do more domestic work than men, including handling and paying for water. Finally, it is important because men and women have different productive uses of water.
12 See for references on participatory techniques: Dayal, R. ; Wijk-Sijbesma, C.A. van; Mukherjee, N. (2000). Methodology for
participatory assessments with communities, institutions and policy makers : linking sustainability with demand, gender and poverty. Washington, DC, USA, UNDP-World Bank Water and Sanitation Program

OP-32-E
8
Ideally, setting a cost recovery system using a demand-driven approach would encompass the following steps: • Community requests The community requests the agency to support an improvement in the water service, possibly preparing the way through promotion and mobilisation campaigns. Men’s and women’s expectations, preferences and motivation should be assessed in a participatory way. • Participatory baseline survey A needs and problem analysis with the community would, in this case, focus on cost recovery. Questions would include: • What are the economic activities of men and women within the community?
• What is the income level of these activities?
• Is this income sufficient to cover costs of possible improved system?
• Are there important seasonal variations?
• Who is paying for water, men or women?
• What has been the habit of the community in paying for water?
• What is the community’s perception of the improved water supply system? • Discussions with the community Discussion should identify the most sustainable technology, and consider all O&M issues, financial implications and commitment to long-term management. Clarification should be made about any necessary adjustments to the existing O&M system, defining the responsibilities of the various in the development of the project. • Formal agreement on technology selection Agreement is between the community and all partners, once the community has made its informed choice. Is the technology and service level affordable, manageable and agreed between all partners? • Definition of tariff and rules The community becomes aware of costs they have to cover, determines a tariff and submits it to an Assembly for approval. The community will establish rules on billing and collection. • Support During the development of the project, the community receives support for training in financial management and monitoring.
1.2 Costs and cost recovery 1.2.1 Technology choice The choice of technology has an impact on O&M costs. Communities should be made aware of the financial implications of operating, maintaining, managing, rehabilitating and replacing a given technology. The emphasis should not always be on minimising investment costs, but also on analysing the O&M costs that community can afford and are willing to pay. Table 2 provides a list of criteria generally used in the process of choosing technology and highlights specific O&M criteria. The challenge for the planner will be to give proper financial weight to the O&M criteria, and to assess the ability and willingness of the consumers to pay these costs. The capacity of communities to manage the complexity of a particular system might require strengthening.

Key Factors for Sustainable Cost Recovery
9
Table 2: Factors influencing technology choice with their specific O&M criteria13 General criteria Specific O&M criteria
Technical factors • Demand (present and future consumption
patterns) versus supply • Capital costs • Extension capacity • Compatibility with norms and legal
framework • Compatibility with existing water supply
systems • Comparative advantages • Technical skills needed within or outside the
community
• Dependence on fuel, power, chemicals • Quality and durability of materials • Availability / cost of spare parts and raw material • Operation and maintenance requirements • Compatibility with users (men and women)
expectations and preferences • Availability of trained personnel within the community • Availability of mechanics, plumbers, carpenters,
masons in or outside of the community • Potential for local manufacturing • Potential for standardisation
Environmental factors • Availability, accessibility and reliability of
water sources (springs, ground water, rainwater, surface water, streams, lakes and ponds)
• Seasonal variations • Water quality and treatment needed • Water source protection
• O&M implications of water treatment • O&M implications of water source protection and
wastewater drainage • Existence and use of alternative traditional water
sources • Waste water drainage
Institutional factors • Legal framework • National strategy • Existing institutional set up • Support from government, Non Government
Organisations, External Support Agencies • Stimulation of private sector • Practice of know-how transfer
• Roles of different stakeholders and ability/willingness to take responsibilities (O&M system)
• Availability of local artisans • Potential involvement of private sector • Training and follow-up • Availability and capacity of training • Skills requirement • Monitoring
Community and managerial factors • Local economy • Living patterns and population growth • Living standards and gender balance • Household income and seasonal variations • Users preferences • Historical experience in collaborating with
different partners • Village organisation and social cohesion
• Managerial capacity and need for training • Capacity of organisation • Acceptance of Committee by the community • Gender balance in committee • Perception of benefits from improved water supply • Felt need • Availability of technical skills • Ownership
Financial factors • Capital costs • Budget allocations and subsidy policy • Financial participation of users • Local economy
• Ability and willingness to pay • Level of recurrent costs • Tariff design and level of costs to be met by the
community • Costs of spare parts and their accessibility • Payment and cost recovery system to be put in place • Financial management capacity (bookkeeping etc;) of
the community Experience shows that non-technical issues play a considerable role in determining the effectiveness of O&M. For this reason, those involved in O&M assessment and development should have skills in a range of relevant disciplines: social development, economics, health and management, as well as engineering. It is important that the process is consultative and carried out in partnership with the operators and users of schemes.
13 Brikké F. (2001) Linking Technology Choice with Operation and Maintenance for Low-Cost Water
Supply and Sanitation

OP-32-E
10
Restoring defective schemes (rehabilitation) can provide an economic alternative to investment in new projects, but that decision should not be automatic. Just as with a new scheme, the rehabilitation option has to be evaluated by balancing community needs, preferences and its capacity to sustain the project, with the potential for support by the water agency. In assessing scope for rehabilitation, the community and the agency need to review together what made the system break down, analyse the problems and recommend feasible technologies. Furthermore, rehabilitation should not simply be a matter of replacing broken equipment or infrastructure. The most common cause of failure is organisational. If a risk analysis is carried out for each water supply option, an attempt can be made to anticipate factors that may change and affect O&M. This will not be easy, especially in unstable economies where inflation and the availability of imported equipment and spare parts are difficult to predict. A comparison of technologies can indicate the degree of risk attached to each option. It is difficult to find comparable and accurate data on recurrent costs. Indeed, recurrent costs vary widely from one project or country to another, in terms of what has been included in the calculations. Moreover there are large differences in wage, equipment and material costs. The data is only valid for the context in which a particular project has been developed, but it can give an idea of the importance of these costs. Another difficulty mentioned in reports, is deciding how to present recurrent costs, (e.g. cost per m3, cost per capita, cost per year, cost per household). The most relevant way to present recurrent costs in the context of community-managed water supply systems would be cost per household, since households are the basic economic unit, and costs could be compared to affordability for each household. However, cost per m3 can allow a better comparison between projects and countries, since the size of households and their consumption can vary greatly from one country to another. 1.2.2 Aiming for equity
What is the scope of equity ? “Something that is equitable is fair and reasonable in a way that it gives equal treatment to everyone”14. In the context of community water supply equity implies that all social groups in a community can have access to the benefits of an improved water supply system, proportionally to their basic needs. The potential benefits of an improved water supply are as follows: • accessibility (both physically and financially), • convenience (comfort and cultural acceptance), • continuity (both in quality and in quantity), • impact (on health and possibly income generation). Financial accessibility means that the amount of water needed for drinking, cooking, essential hygiene and production of subsistence food should be affordable. By “all social groups of a community” we mean the rich and the poor, men and women. There are within communities several social groups that are particularly vulnerable socially, economically and culturally. These groups are composed of women (especially single heads of families), elderly people, people with disabilities, children, and indigenous groups. Everyone within the range of an improved service, whatever their social status or economic condition, should therefore be able to have access to its benefits, as water is recognised worldwide as a basic human need. In some way, this already gives a social dimension to water supply, which planners and decision-makers cannot deny. Recognising this means integrating a social dimension into a cost recovery strategy. This will require an ability to evaluate the needs and priorities of different social groups.
14 According to the Collins Cobuild English Dictionary
Key Factors for Sustainable Cost Recovery
11
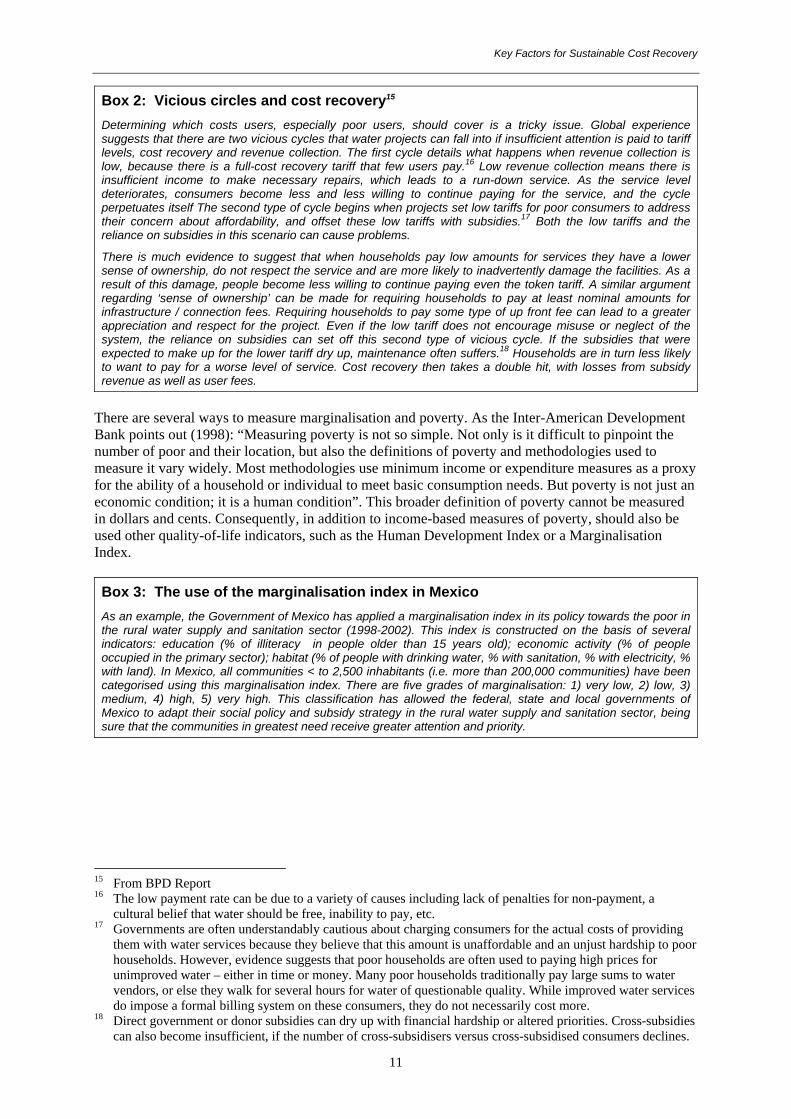
Box 2: Vicious circles and cost recovery15 Determining which costs users, especially poor users, should cover is a tricky issue. Global experience suggests that there are two vicious cycles that water projects can fall into if insufficient attention is paid to tariff levels, cost recovery and revenue collection. The first cycle details what happens when revenue collection is low, because there is a full-cost recovery tariff that few users pay.16 Low revenue collection means there is insufficient income to make necessary repairs, which leads to a run-down service. As the service level deteriorates, consumers become less and less willing to continue paying for the service, and the cycle perpetuates itself The second type of cycle begins when projects set low tariffs for poor consumers to address their concern about affordability, and offset these low tariffs with subsidies.17 Both the low tariffs and the reliance on subsidies in this scenario can cause problems.
There is much evidence to suggest that when households pay low amounts for services they have a lower sense of ownership, do not respect the service and are more likely to inadvertently damage the facilities. As a result of this damage, people become less willing to continue paying even the token tariff. A similar argument regarding ‘sense of ownership’ can be made for requiring households to pay at least nominal amounts for infrastructure / connection fees. Requiring households to pay some type of up front fee can lead to a greater appreciation and respect for the project. Even if the low tariff does not encourage misuse or neglect of the system, the reliance on subsidies can set off this second type of vicious cycle. If the subsidies that were expected to make up for the lower tariff dry up, maintenance often suffers.18 Households are in turn less likely to want to pay for a worse level of service. Cost recovery then takes a double hit, with losses from subsidy revenue as well as user fees.
There are several ways to measure marginalisation and poverty. As the Inter-American Development Bank points out (1998): “Measuring poverty is not so simple. Not only is it difficult to pinpoint the number of poor and their location, but also the definitions of poverty and methodologies used to measure it vary widely. Most methodologies use minimum income or expenditure measures as a proxy for the ability of a household or individual to meet basic consumption needs. But poverty is not just an economic condition; it is a human condition”. This broader definition of poverty cannot be measured in dollars and cents. Consequently, in addition to income-based measures of poverty, should also be used other quality-of-life indicators, such as the Human Development Index or a Marginalisation Index. Box 3: The use of the marginalisation index in Mexico As an example, the Government of Mexico has applied a marginalisation index in its policy towards the poor in the rural water supply and sanitation sector (1998-2002). This index is constructed on the basis of several indicators: education (% of illiteracy in people older than 15 years old); economic activity (% of people occupied in the primary sector); habitat (% of people with drinking water, % with sanitation, % with electricity, % with land). In Mexico, all communities < to 2,500 inhabitants (i.e. more than 200,000 communities) have been categorised using this marginalisation index. There are five grades of marginalisation: 1) very low, 2) low, 3) medium, 4) high, 5) very high. This classification has allowed the federal, state and local governments of Mexico to adapt their social policy and subsidy strategy in the rural water supply and sanitation sector, being sure that the communities in greatest need receive greater attention and priority.
15 From BPD Report 16 The low payment rate can be due to a variety of causes including lack of penalties for non-payment, a
cultural belief that water should be free, inability to pay, etc. 17 Governments are often understandably cautious about charging consumers for the actual costs of providing
them with water services because they believe that this amount is unaffordable and an unjust hardship to poor households. However, evidence suggests that poor households are often used to paying high prices for unimproved water – either in time or money. Many poor households traditionally pay large sums to water vendors, or else they walk for several hours for water of questionable quality. While improved water services do impose a formal billing system on these consumers, they do not necessarily cost more.
18 Direct government or donor subsidies can dry up with financial hardship or altered priorities. Cross-subsidies can also become insufficient, if the number of cross-subsidisers versus cross-subsidised consumers declines.
OP-32-E
12
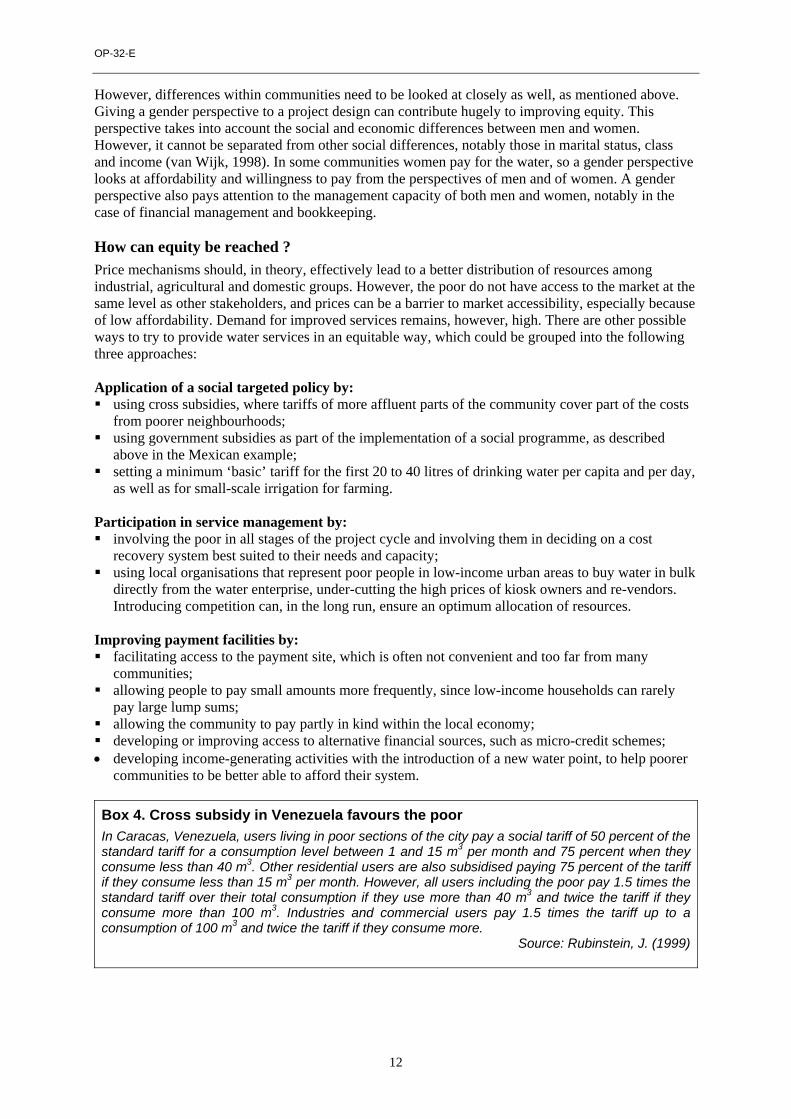
However, differences within communities need to be looked at closely as well, as mentioned above. Giving a gender perspective to a project design can contribute hugely to improving equity. This perspective takes into account the social and economic differences between men and women. However, it cannot be separated from other social differences, notably those in marital status, class and income (van Wijk, 1998). In some communities women pay for the water, so a gender perspective looks at affordability and willingness to pay from the perspectives of men and of women. A gender perspective also pays attention to the management capacity of both men and women, notably in the case of financial management and bookkeeping. How can equity be reached ? Price mechanisms should, in theory, effectively lead to a better distribution of resources among industrial, agricultural and domestic groups. However, the poor do not have access to the market at the same level as other stakeholders, and prices can be a barrier to market accessibility, especially because of low affordability. Demand for improved services remains, however, high. There are other possible ways to try to provide water services in an equitable way, which could be grouped into the following three approaches: Application of a social targeted policy by: " using cross subsidies, where tariffs of more affluent parts of the community cover part of the costs
from poorer neighbourhoods; " using government subsidies as part of the implementation of a social programme, as described
above in the Mexican example; " setting a minimum ‘basic’ tariff for the first 20 to 40 litres of drinking water per capita and per day,
as well as for small-scale irrigation for farming. Participation in service management by: " involving the poor in all stages of the project cycle and involving them in deciding on a cost
recovery system best suited to their needs and capacity; " using local organisations that represent poor people in low-income urban areas to buy water in bulk
directly from the water enterprise, under-cutting the high prices of kiosk owners and re-vendors. Introducing competition can, in the long run, ensure an optimum allocation of resources.
Improving payment facilities by: " facilitating access to the payment site, which is often not convenient and too far from many
communities; " allowing people to pay small amounts more frequently, since low-income households can rarely
pay large lump sums; " allowing the community to pay partly in kind within the local economy; " developing or improving access to alternative financial sources, such as micro-credit schemes; • developing income-generating activities with the introduction of a new water point, to help poorer
communities to be better able to afford their system. Box 4. Cross subsidy in Venezuela favours the poor In Caracas, Venezuela, users living in poor sections of the city pay a social tariff of 50 percent of the standard tariff for a consumption level between 1 and 15 m3 per month and 75 percent when they consume less than 40 m3. Other residential users are also subsidised paying 75 percent of the tariff if they consume less than 15 m3 per month. However, all users including the poor pay 1.5 times the standard tariff over their total consumption if they use more than 40 m3 and twice the tariff if they consume more than 100 m3. Industries and commercial users pay 1.5 times the tariff up to a consumption of 100 m3 and twice the tariff if they consume more.
Source: Rubinstein, J. (1999)

Key Factors for Sustainable Cost Recovery
13
1.2.3 What costs should be recovered? Once costs have been identified, it is essential to determine how and to what extent the community will cover or recover these. The following questions can be discussed with the community right from the start of the project and should preferably result in a mutual agreement: " Should only basic O&M costs be recovered? " Should initial investment costs be recovered? " Should replacement and rehabilitation costs be recovered? " Should costs of sanitation and wastewater management be included in the recovery cost system? If
yes, is the community aware of the financial implications of integrating sanitation and water supply costs?
" Should the provision of the service aim for full cost recovery? If yes, can it be done in phases? The question of cost recovery of wastewater management should preferably be considered as part of an integral strategy to ensure the availability of clean and safe water sources in the long term. If wastewater management is not taken into account, many water supply systems may have to treat water at incremental costs (because of pollution and/or depletion of water sources), making it necessary to recover a major percentage of it from users and therefore raising tariffs. The inclusion of wastewater management costs in a water tariff is very rare in rural and low-income urban areas, and this is the reason why the inclusion of wastewater and water management in one single tariff is not discussed here. It does not mean that wastewater management should not be considered; in fact, it should be discussed together between planners and communities, in order to determine its outcome. However, appropriate domestic and collective behaviour can contribute to better wastewater management particularly within the close habitat surroundings. The question of which costs should be recovered is often a dilemma for both planners and communities. The way out of the dilemma is to try to discuss this question, and to review various possible options. In the discussion below, “full cost recovery” means recovering O&M and replacement costs, as well as part or all of investment costs, and “O&M costs” means coverage of recurrent costs of operation and maintenance only. Figure 1: Cost recovery options
Time
AABBCC
DDEE
Full costrecovery
Recoveryof O&Mcosts only
Immediate full cost recovery
} Progressive full costrecovery
Recovery of O&M costs only
$
Recovery of O&M costsonly, with initial use ofsubsidies

OP-32-E
14
• Option A: Immediate full cost recovery Introducing full cost recovery right at the beginning of the project can be done with communities that have a good record of paying for services, and where community organisations managing the service have proper management skills. Introducing this strategy requires that communities and community organisations are fully aware of its financial implications, and are both able and willing to pay. This option is rarely chosen, because in many countries it is still considered that covering the initial investment and the replacement costs is a government responsibility. • Options B & C: Progressive full cost recovery In these cases full cost recovery is introduced progressively either through phases or through a continuous adjustment. In option B, only O&M costs only are covered to start with. In a second phase, community organisations become responsible for full cost recovery. It is difficult to define with accuracy the proper timing to “switch” to full cost recovery. It is therefore essential that community organisations managing the service, and male and female users, are aware right from the start that they will eventually be responsible for full cost recovery, and that they accept this principle. The timing may be determined according to agreed steps in a process of increasing managerial responsibility and ownership. Assistance from the agency may be an incentive to accept an additional financial burden provided the conditions have been agreed in advance. In option C, the agreement allows for periodic adjustment of the tariff structure and financial responsibilities over time, which leads to a more permanent improvement in cost recovery. It is important to avoid lack of clarity or too frequent changes that could discourage communities. During the period when communities recover only some of the costs, it is essential to define who will cover or recover the other costs, and how. • Option D: Recovery of O&M costs only This option accepts that community organisations will not aim for full cost recovery, but will recover only O&M costs at community level. This is widely practised in the provision of rural water supplies in developing countries, because of the assumption that, in most cases, it is difficult to ask communities to recover all the costs through a tariff. Even in these situations, it is of paramount importance to reach formal agreements about who is financially responsible and for what. In fact, there should be clarity about the reasons why part of the costs are not or cannot be covered by the communities. This should be part of the agreement, as conditions may change later on. • Option E: Recovery of O&M costs only, with initial use of subsidies This consists of introducing progressively an “O&M costs recovery only”, mainly by subsidising costs (for example the price of spare parts, the cost of fuel) at the beginning, and providing free technical support for some maintenance. Although this approach can be necessary for poor communities, the use of subsidies can send wrong signals to a market, especially for spare parts. Just as in D, some arrangement will need to be made about who will recover the other costs that the community will not cover, and how. 1.2.4 Analysing costs and benefits Cost can be analysed during various phases of the project cycle, although cost studies are very often carried out during the planning and evaluation phases. Cost records and cost comparisons can be used as monitoring tools, both by project staff and communities. One of the major drawbacks of cost analysis though, is that it often requires experienced and skilled professionals. Analysing costs is often associated with the analysis of benefits, since benefits are seen as somehow justifying costs. Benefits associated with a project intervention refer to a wide range of outcomes such as: a) Health: Reductions in water-borne diseases, fewer work days or school days lost to illness, less
money spend on medical care; b) Social gains: May stimulate community uptake of other, unrelated projects connected with
environmental health or the position of women; c) Economic and financial gains: Saves cash, as the new system replaces water vendors and delivers
water at the lowest cost, improves agriculture, attracts external sources of revenue into the village; d) Institutional impact: The reorganisation or creation of structures and management capacity will
strengthen institutions.

Key Factors for Sustainable Cost Recovery
15
Table 3: Overview of various cost analysis tools
Cost analysis tools
Application in the project cycle
Cost recording Expenditure is recorded in books. It is advisable to group costs by category, as this makes it easier to analyse, when monitoring expenses or unusual increases.
Monitoring
Cost comparisons Cost can be compared by time, across similar alternative projects or by specific cost item, such as equipment, lifecycle of materials, construction costs etc.
Planning Monitoring Evaluation
Cost-benefit analysis This is expressed as a ratio of costs (in monetary terms) versus benefits (also quantified in monetary terms). Benefits such as health and social improvements are difficult to quantify in monetary terms.
Planning Evaluation
Cost-effectiveness analysis This Is expressed as the ratio of the costs (quantified in monetary terms) versus effects (not quantified in monetary terms). The definition of effectiveness and effects can be difficult and is often subjective.
Implementation Monitoring Evaluation
Cost utility analysis This is expressed as the ratio of costs versus outcomes (not necessarily in monetary terms), while the outcomes are ranked. This is similar to the perceived cost-benefit analysis (ratio) where groups of users, often divided into men and women, rich/poor, different ethnic groups, identify the level of benefits and costs for themselves from a system or project. From their own perspective, they answer the question: Are the benefits greater than costs?
Planning Evaluation
Least cost analysis Estimates the costs of alternative schemes or different possible outcomes.
Planning
Marginal cost analysis Looks at the cost of additional outputs or inputs in a project or programme (discounting the cost of what has already been done). A typical question is: What will be the additional output of this additional input?
Planning
Sensitivity analysis Estimates the expected outcome of the project according to different scenarios.
Planning
1.3 Willingness to pay Willingness to pay (WTP) is an expression of the demand for a service, and it is a strong pre-requisite for cost recovery because it is a measure of user satisfaction of a service and of the desire of users to contribute to its functioning. This desire is normally associated with the users’ willingness to contribute in monetary terms, but it can also be in kind. Some users cannot contribute cash for investment, but can for example provide voluntary labour for trench digging, transport, pipe laying, and can provide local materials, such as gravel and sand. This approach can be seen also in their contribution to maintenance activities through free labour. There is no systematic correlation between willingness and ability to pay. In numerous urban and even rural areas, the poor are paying much more for their water than the water costs paid by better-off communities. It is therefore necessary to determine the conditions affecting demand and willingness to pay. Direct techniques for the estimation of WTP are based on the observation of what people actually do in order to ensure water provision, including how much money they have to pay for it. Indirect ways draw conclusions from users’ responses to hypothetical questions about their willingness to pay for water and sanitation (W&S) services. WTP studies are carried out to understand what level of W&S services people want, why and how much they are willing to pay for it. If people would be happy to pay more for a better service, or are not willing to pay because the existing service does not match their expectations, this information can be used to find ways to improve the service and increase revenue. Another way to improve willingness to pay is to improve relationships between consumers and the organisation managing the water supply service. Increased mutual trust and confidence that the service will be delivered as promised can be achieved through better information and communication. This
OP-32-E
16
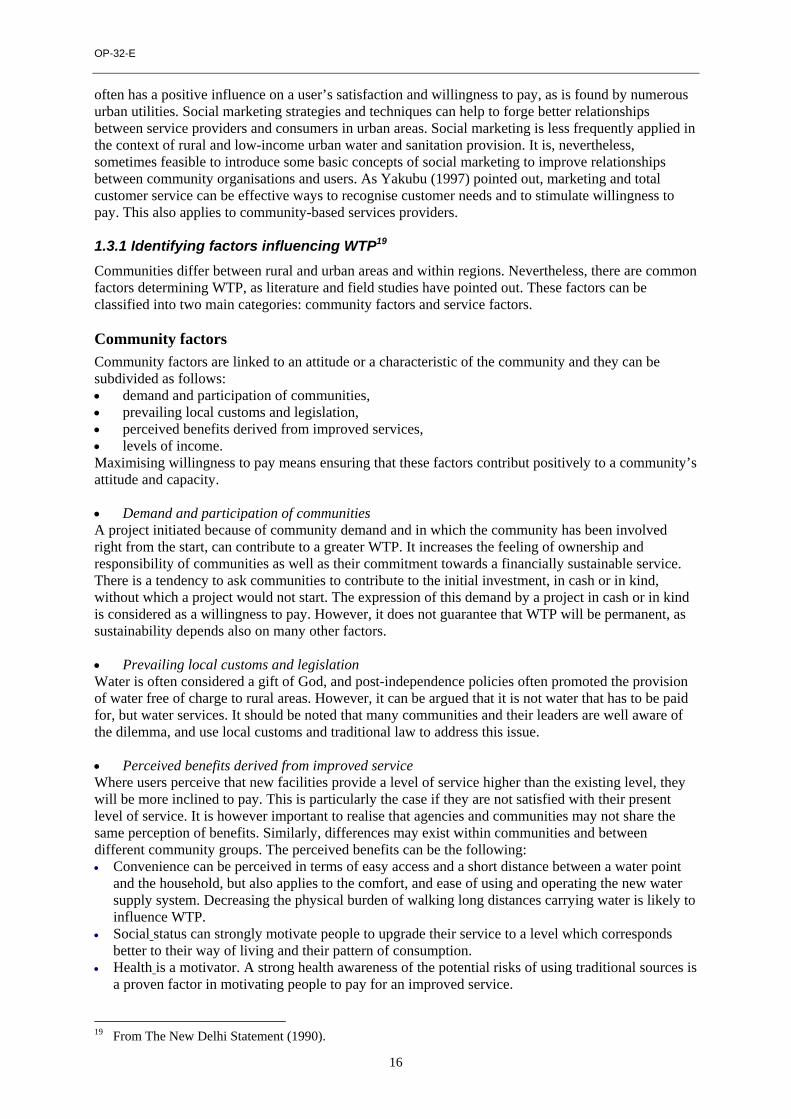
often has a positive influence on a user’s satisfaction and willingness to pay, as is found by numerous urban utilities. Social marketing strategies and techniques can help to forge better relationships between service providers and consumers in urban areas. Social marketing is less frequently applied in the context of rural and low-income urban water and sanitation provision. It is, nevertheless, sometimes feasible to introduce some basic concepts of social marketing to improve relationships between community organisations and users. As Yakubu (1997) pointed out, marketing and total customer service can be effective ways to recognise customer needs and to stimulate willingness to pay. This also applies to community-based services providers. 1.3.1 Identifying factors influencing WTP19 Communities differ between rural and urban areas and within regions. Nevertheless, there are common factors determining WTP, as literature and field studies have pointed out. These factors can be classified into two main categories: community factors and service factors. Community factors Community factors are linked to an attitude or a characteristic of the community and they can be subdivided as follows: • demand and participation of communities, • prevailing local customs and legislation, • perceived benefits derived from improved services, • levels of income. Maximising willingness to pay means ensuring that these factors contribut positively to a community’s attitude and capacity. • Demand and participation of communities A project initiated because of community demand and in which the community has been involved right from the start, can contribute to a greater WTP. It increases the feeling of ownership and responsibility of communities as well as their commitment towards a financially sustainable service. There is a tendency to ask communities to contribute to the initial investment, in cash or in kind, without which a project would not start. The expression of this demand by a project in cash or in kind is considered as a willingness to pay. However, it does not guarantee that WTP will be permanent, as sustainability depends also on many other factors. • Prevailing local customs and legislation Water is often considered a gift of God, and post-independence policies often promoted the provision of water free of charge to rural areas. However, it can be argued that it is not water that has to be paid for, but water services. It should be noted that many communities and their leaders are well aware of the dilemma, and use local customs and traditional law to address this issue. • Perceived benefits derived from improved service Where users perceive that new facilities provide a level of service higher than the existing level, they will be more inclined to pay. This is particularly the case if they are not satisfied with their present level of service. It is however important to realise that agencies and communities may not share the same perception of benefits. Similarly, differences may exist within communities and between different community groups. The perceived benefits can be the following: • Convenience can be perceived in terms of easy access and a short distance between a water point
and the household, but also applies to the comfort, and ease of using and operating the new water supply system. Decreasing the physical burden of walking long distances carrying water is likely to influence WTP.
• Social status can strongly motivate people to upgrade their service to a level which corresponds better to their way of living and their pattern of consumption.
• Health is a motivator. A strong health awareness of the potential risks of using traditional sources is a proven factor in motivating people to pay for an improved service.
19 From The New Delhi Statement (1990).
Key Factors for Sustainable Cost Recovery
17
• Quantity of water is a factor when it is available in a continuous and reliable manner (with appropriate yield or pressure) and not subject to seasonal variations.
• Opportunity cost of time, in terms of the value that users attach to the time they spend in collecting water, in comparison to other activities they could be busy with.
• Potential of income-generating activities. Water use can be linked to productive activities such as garden irrigation and livestock watering.
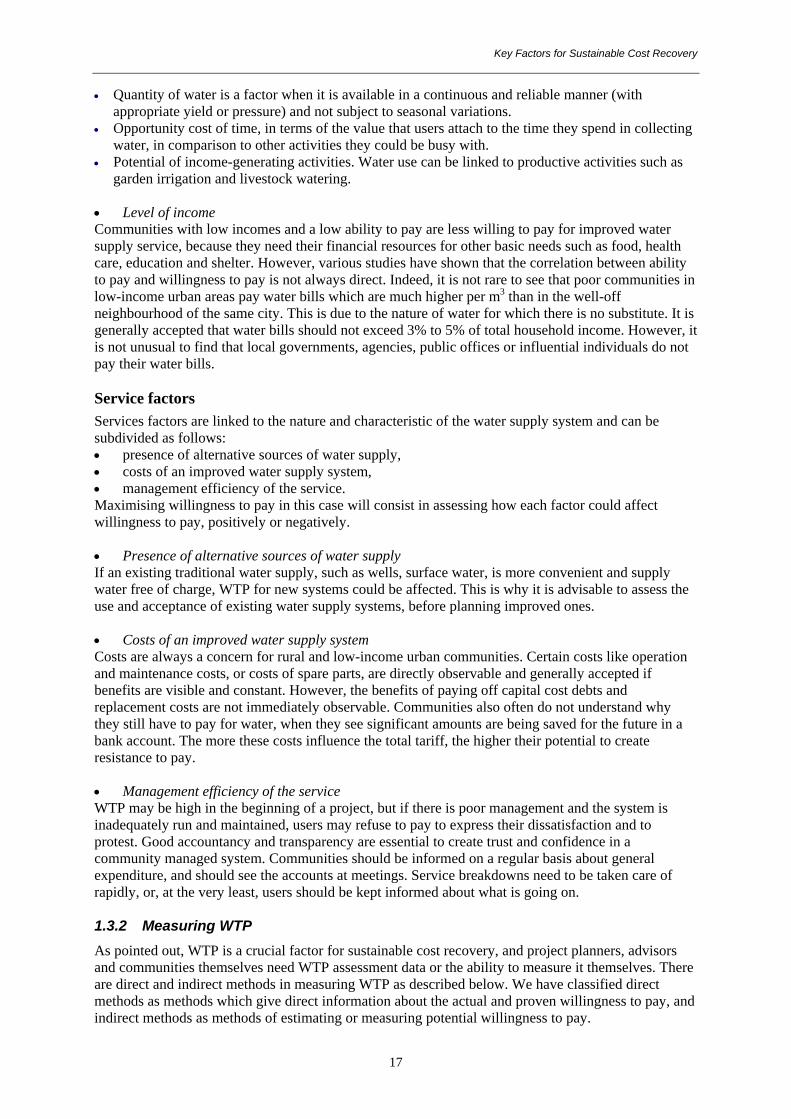
• Level of income Communities with low incomes and a low ability to pay are less willing to pay for improved water supply service, because they need their financial resources for other basic needs such as food, health care, education and shelter. However, various studies have shown that the correlation between ability to pay and willingness to pay is not always direct. Indeed, it is not rare to see that poor communities in low-income urban areas pay water bills which are much higher per m3 than in the well-off neighbourhood of the same city. This is due to the nature of water for which there is no substitute. It is generally accepted that water bills should not exceed 3% to 5% of total household income. However, it is not unusual to find that local governments, agencies, public offices or influential individuals do not pay their water bills. Service factors Services factors are linked to the nature and characteristic of the water supply system and can be subdivided as follows: • presence of alternative sources of water supply, • costs of an improved water supply system, • management efficiency of the service. Maximising willingness to pay in this case will consist in assessing how each factor could affect willingness to pay, positively or negatively. • Presence of alternative sources of water supply If an existing traditional water supply, such as wells, surface water, is more convenient and supply water free of charge, WTP for new systems could be affected. This is why it is advisable to assess the use and acceptance of existing water supply systems, before planning improved ones. • Costs of an improved water supply system Costs are always a concern for rural and low-income urban communities. Certain costs like operation and maintenance costs, or costs of spare parts, are directly observable and generally accepted if benefits are visible and constant. However, the benefits of paying off capital cost debts and replacement costs are not immediately observable. Communities also often do not understand why they still have to pay for water, when they see significant amounts are being saved for the future in a bank account. The more these costs influence the total tariff, the higher their potential to create resistance to pay. • Management efficiency of the service WTP may be high in the beginning of a project, but if there is poor management and the system is inadequately run and maintained, users may refuse to pay to express their dissatisfaction and to protest. Good accountancy and transparency are essential to create trust and confidence in a community managed system. Communities should be informed on a regular basis about general expenditure, and should see the accounts at meetings. Service breakdowns need to be taken care of rapidly, or, at the very least, users should be kept informed about what is going on. 1.3.2 Measuring WTP As pointed out, WTP is a crucial factor for sustainable cost recovery, and project planners, advisors and communities themselves need WTP assessment data or the ability to measure it themselves. There are direct and indirect methods in measuring WTP as described below. We have classified direct methods as methods which give direct information about the actual and proven willingness to pay, and indirect methods as methods of estimating or measuring potential willingness to pay.

OP-32-E
18
Analysing actual habits and behaviour Direct measures are based on observing what people actually do (behaviour) and how much people are actually paying for water services. Three types of tools are used to measure directly WTP: • actual payment habits studies; • initial contribution to investment, • actual behaviour studies. • Actual payment habits studies These studies assess the present behaviour of consumers, such as cash payment to caretaker or water point committee, as well as to vendors. Advantages and disadvantages of actual payment habits studies
Advantages Disadvantages • Can be done using available socio-economic
survey teams or staff • Can use some of the information already
gathered during initial survey or feasibility study • Results are easy to analyse and understand
• Not all observed behaviour is necessarily directly linked to water supply
• Answers during surveys might be biased through lack of experience on the part of the questioner or by the use of a questionnaire which is too prescriptive
• Initial contribution to investment One way to measure WTP at the beginning of a project is to assess the direct financial contribution of communities towards the construction costs of a new water supply scheme. This contribution can be done in cash or in kind.
Advantages and disadvantages of initial contribution to investment Advantages Disadvantages
• Monetary contribution is a direct expression of demand and possibly WTP
• Easy to measure and appreciate
• Initial contributions does not necessarily prove a long term WTP, as WTP depends also on many other factors
• Contributions in kind are not easy to estimate, and are not always taken into account
• Actual behaviour studies Actual behaviour studies assess the present payment behaviour of consumers, such as direct cost savings, indirect cost savings (calories, time, money) and opportunity cost of time. Time spent in collecting water, and the effort required to collect water is often used as a measure of WTP. Field work for actual behaviour studies can include: 1) observation of the present water sources, 2) interviews with water providers, 3) mapping the routes used for providers to deliver water and the routes used for users to fetch it, and 4) household interviews (WASH, 1988b). Using discrete choice models it is possible to describe the probability of a household choosing each of the water sources as a function of the source and that household’s characteristics (WASH, 1988b). Advantages and disadvantages of actual behaviour studies
Advantages Disadvantages • Behaviour of users is an indicator of the
amounts they would be willing to pay • Allows an assessment of the impact of
different factors on the likelihood of a household making a particular choice
• Planners can use the information about WTP to design policies (about credits, tariffs, subsidies), allocate resources, and design water supply systems
• Due to the long time period needed for study it could be much more expensive than contingent valuation study
• Requires a long study period because it is difficult to know about the behaviour of people
• Correlation between factors studied and WTP not always straight forward

Key Factors for Sustainable Cost Recovery
19
Analysing potential behaviour The indirect approach draws conclusions about potential behavioural changes that an improved system is likely to bring in relation to WTP. This approach draws part of its conclusions from responses to hypothetical questions. Some of these tools can be complex in their application and require experienced professionals. • Benefit Transfer Methodology According to Boyle and Bergstrom (cited by Brookshire, 1992) benefit transfer is “the transfer of existing estimates of non-market values to a new study which is different from the study for which the values were originally estimated”. In other words, the behaviour of a group that already has been studied is projected onto a second group to predict the second group’s willingness to pay for the good or service in question (Briscoe et al, 1995). The strategy of benefit transfer depends on the validity of models used to extrapolate from behaviour or valuation of benefits in one area to populations of known characteristics in other areas. The application of benefit transfer studies should be done following three criteria: 1) population characteristics should be similar for both areas; 2) the non-market commodities have to be the same, and 3) the researcher cannot switch welfare measurements from willingness to pay to willingness to accept. Advantages and disadvantages of benefit transfer methodology
Advantages Disadvantages • May reduce the biases of the contingent
valuation method because it does not use surveys
• Requires little additional data collection • It is cheaper because it does not require a
long fieldwork • Produces quick information about
household’s WTP
• Comparison across time without new information is problematic, since observed variables in the equation may have changed
• The estimates are valid only for the range of variables occurring in the sample observed in the first site
• Predictable component of behaviour may be overwhelmed by unobservable effects
• It does not consider household opinions • Hypothetical behaviour studies (contingent valuation method) Another approach is to ask users directly what would be their choice given a specific price, termed the contingent valuation (CV) method, since user responses are contingent, or dependent on pre-determined conditions. As Whittington (1998) pointed out the CV studies “try to determine the maximum amount the respondents would be willing to pay for the proposed (or hypothetical) good or service in the context of the existing institutional regime within which individuals are free to allocate their personal financial resource”. WTP surveys frequently include three parts: 1) socio-demographic information collection about users (education, family size, education, work
category, and so on; 2) information collection about the project (benefits, costs, level of service, way of payment,
financing) and WTP; and, 3) economic situation of users (incomes, expenditures, sources of incomes and expenditures, etc) as
well as their perception about the provision of the good or service. Once the survey is carried out, models are used to estimate benefits via a demand function, used to derive an individual’s maximum willingness to pay. By varying the price and assessing the demand response, price and demand elasticity ratios can be determined. Data availability and (perceived) non-rational behaviour severely limits this approach in rural areas (See Annex 6 for an example of a hypothetical behaviour study).

OP-32-E
20
Advantages and disadvantages of hypothetical behaviour studies Advantages Disadvantages
• If carefully designed and conducted, produces reliable estimates of the future demand for water
• Users have the opportunity to choose what they want and what they are able and willing to pay
• If behavioural models are used, it is possible to estimate the impact of changes in prices, policies, and welfare on the demand
• Planners can use the information about WTP to design policies (about credits, tariffs, subsidies), allocate resources, and design water supply systems
• Hypothetical bias: because the user is not well aware of the nature of the good or service surveyed
• Strategic bias: when users think they could influence the decision about the project with their answers
• Compliance bias: users give replies they believe the questioners would find most satisfactory
• Expensive method which requires good knowledge about the communities
• The bidding game method and the referendum method The bidding game method is also an hypothetical behaviour study, presented as a negotiation between the interviewer and the respondent, moving within a range of potential prices for a water supply improvement until bidding settles at a final value. The summation of WTP bids for all the households served by a project is an estimate of the total benefits of a project and can be compared with the costs of the project to decide whether the investment is justified. Models derived from the bidding game describe the probability that a particular family will use a new water source. This method causes some problems because responses could be influenced in some way by the interviewer. The answers about WTP are always around the first price mentioned or starting point of the survey. The Referendum method uses an ended question, such as: ‘Would you be willing to pay X monthly for the provision of drinking water supply?’ It could be argued that this method is more suitable because people act as they do in a market place. • Community Workshops The development of studies to assess a community’s demand or willingness to pay for water supply projects is often expensive. Contingent valuation or actual behaviour studies require complex techniques and procedures that a community cannot carry out by itself. For this reason it may be better to support and guide communities to carry out more simple studies to obtain general data and a good insight into their own WTP. One possibility is the development of community workshops where institutions act as facilitators and users express their WTP through voting. Box 5. An alternative way to measure WTP: community workshops Studies like the bidding game require sound procedures and experienced interviewers. An alternative approach that works particularly well if the community has confidence in the agency staff facilitating the project and in rural areas are community workshops. One or two meetings can be held with user groups to discuss with different kind of users about their willingness to pay for improved services. The starting point of the meeting should be the presentation of clear information about cost, tariffs, benefits and the financial arrangements required for each technology or level of service. At this point some special techniques can be used (for example pictures, films, drawing, charts) to help users to understand the dimension of the project. In addition, the language used by field staff has to be simple and understandable. Users then can vote on the different options, and facilitators will ask users to explain the reasons why they are willing to pay or not (users can write down their opinions or facilitators can provide some cards that users can choose). This approach requires the ability of both men and women to take part in votes and a high level participation by users. If the improvement proves to be financially feasible, a formal agreement has to be established with all users before the system is introduced.
This technique requires the participation of a representative sample of users (in quantity and quality) and the provision of clear and understandable information for users about cost, tariffs, benefits, financial options, etc.

Key Factors for Sustainable Cost Recovery
21
Advantages and disadvantages of community workshops Advantages Disadvantages
• An easy and fast method to obtain household’s WTP
• Does not require complex techniques and programs
• Considers broadly household opinions • Can be carried out by the community itself
• More difficult to carry out in large communities • Household opinions can be influenced by community
leaders • Difficult for women to participate in decision making
process or their participation can be highly influenced by men
• Responses do not give any information about reason why households decide to pay or not
1.4 Setting an adequate institutional framework 1.4.1 Management and cost recovery Appropriate management capacity and skills are required to run a service efficiently, especially those skills related to budgets, organising bills, collection, recording expenses and revenue, monitoring, and applying sanctions. An assessment of the management capacity of the community is therefore crucial. If capacity building activities are too complex to organise for a given technology, it might be necessary to consider another technology that requires fewer management skills. The management structure will influence the way that cost recovery is going to be organised, as described in table 4. These options show the implications that each type of community management structure has on the organisation of cost recovery. In order to contribute to efficiency, planners and communities will have to determine which management structure is the most appropriate considering the choice of technology and the capacity of the community. 1.4.2 Partnership and cost recovery Although the tendency today is to promote full cost recovery at community level, it is a fact that tariffs alone are usually not sufficient to cover all costs. Given this situation, there is a need to define clearly the financial responsibilities of each of the actors involved: the community, the national government, the local authority, NGOs, donor-supported projects, and possibly others such as churches, individuals or the private sector. Partnership and cost-sharing arrangements can be sought. The role of various actors in financing is closely related to their managerial and operational/technical responsibilities. The more complex the technology, the more communities depend on partnerships with other main stakeholders, while the Government or local authorities retain the job of defining a subsidy and pricing policy. The financial arrangements of cost sharing require all the various bodies to define their responsibilities precisely, and to seal these in an agreement or a contract. Financial arrangements can be quite different depending on whether we are dealing with new schemes or with existing schemes. For new schemes, responsibilities can be discussed right from the beginning and be a pre-condition for the project. One should however realise that agreements and contracts are not always sufficient to guarantee that financial arrangements will be respected. Indeed, the legal status of communities needs to be specified so that communities can fight for their rights and be empowered. Even in these circumstances, administrative and jurisdictional procedures might be too expensive, cumbersome and time consuming for communities. In addition to agreements, communities also need to be able to turn for help to a department accredited to defend them. For existing schemes, responsibilities can evolve over time. The task of dividing financial, managerial and operational responsibilities among government agencies, local authorities and communities for existing systems can be cumbersome. Demand responsive processes whereby communities have a say in the selection of technology are not relevant in these cases, as the technology exists already. For example, in order to overcome this problem, the Government of Namibia has chosen to transfer responsibilities gradually through in three phases over a period of seven to ten years, as follows: 1. Capacity-building; 2. Operation and maintenance; 3. Full-cost recovery (Table 5).

OP-32-E
22
Table 4: Community management and cost recovery
Forms of community management and possible implication on cost recovery
A Water Committee Responsible of all activities (managerial, operational, technical and financial) of a particular scheme, covering a larger area than a neighbourhood, possibly the whole community. Same as above, but need for greater organisation and financial management capacity. A Village Association A village association is responsible for all development activities concerning the village, including water and sanitation. Higher degree of organisation needed using the whole capacity of the village. Financial organisation and use of resources not always specifically oriented towards water and sanitation. A Coordinating Water Committee A Water Committee coordinating several other smaller tap or neighbourhood committees. The larger water committee is responsible for overall managerial and financial matters, while the smaller committees are responsible for operation, maintenance and collecting fees. A Water Committee contracting a private body A water committee contracts a private body (an individual, a mechanic, a group of skilled workers or a firm). The Water Committee fixes prices and rules, while the private body collects fees, pays the bills for O&M and reports to the Water Committee. Delegated responsibility by local authority Delegated management transfers part of the management of a service to someone else or to another body. The following options differ in terms of managerial and financial responsibility.
• Management contracts to a committee or an individual The municipality remains responsible for the service for investments and for tariff setting, but delegates its management to a committee or an individual, under a remuneration contract. Under this option, the municipality organises and plans cost recovery; the committee or the individual just executes the terms of the contract.
• Special management contract to a committee or an individual This is the same as the management contract above, but remuneration is based on an agreement with the municipality for a percentage of the collected tariffs. The committee or the individual has a direct interest in the efficient management of the service, since it receives a percentage of revenues, but necessarily an interest in integrating a social dimension.
• Leasing / renting contractual arrangements with a committee or water association The municipality establishes a contract with a committee or association. The municipality retains responsibility for investment; the committee or association is responsible for operating and maintaining the service, and is paid through collected tariffs. The association has control over the tariff, but does not fix it. It has like an interest in efficient management for better revenue, but not necessarily in facilitating access to all members of the community.
• Public administration (co-operative association) Distinct legal status, and financial autonomy. Controlled by an Assembly of Associates, where the municipality is one member among others, under the authority of the Municipal Council. Associates are free to determine their cost recovery strategies, and the result is a consensus among all stakeholders.
• Concession to community associations Associations created by a General Assembly of users, with the authorisation of the Municipal Council. They manage and operate the system in an autonomous way, unless cost sharing arrangements are made between the community and the municipality.
Clear financial arrangements allow for an effective cost recovery because communities are more willing to participate when they have a sense of justice and clarity. These agreements also define their ownership. In conclusion, clear financial arrangements allow: • contributions towards full cost coverage, • clarity about who is going to finance the water supply system (governments, donors,
communities), • financial flows that bring in money at the right moment, • a commitment between financial parties, • a formalised arrangement.

Key Factors for Sustainable Cost Recovery
23
Table 5: Gradual transfer of managerial and financial responsibilities from government to communities of existing rural water supply systems, in Namibia
Responsibilities Phase 1 Capacity-building
Phase 2 Operation & Maintenance
Phase 3 Full Cost Recovery
Ownership of installations ! : 100% Leasehold agreement ": 100 %
Buying of consumables (fuel,
oil, grease) ! : 100%
Gradual phasing out ! : 75% ": 25%
! : 50% ": 50%
! : 25% ": 75 %
": 100 %
Financing of routine
maintenance ! : 100% ! : 75% ": 25 % ": 100 %
Major repairs and replacement
Operational responsibility ! : 80% # : 20%
Financial responsibility ! : 100%
Operational responsibility ! : 80% # : 20% Financial responsibility
! : 100%
Operational responsibility "80% # : 20%
Financial responsibility
"100%
Legenda Source: Directorate of the rural water supply of Namibia (1998) ! = Government (Rural Water Supply Directorate)
" = Community (Water Point Association, including local caretaker)
# = Private sector (Workshops with specialised equipment and staff) Possible distribution of responsibility for the O&M of a handpump The following example corresponds to a situation where communities own and manage their handpumps. Communities still depend on specialised mechanics for technical know-how and services, for which they have to pay. Moreover, transferring some responsibilities to communities still leaves the government with responsibility for water quality control, development of an effective spare parts distribution system, and in many cases, rehabilitation and replacement. Unfortunately, water quality control is rarely, if at all, done in rural areas, and it may be necessary to include simple water quality control devices which communities can afford. Table 6: Operation & maintenance tasks for a handpump
O&M tasks Operational responsibility
Financial responsibility
Monitor handpump use and encourage proper use; check all nuts and bolts, and tighten if necessary; measure output per stroke and compare with expected output; check and adjust pump handle and stuffing box; grease or oil all hinge pins, bearings, or sliding parts; clean the pump, well head, concrete apron, and drainage area; check well head, concrete apron, drainage area; repair cracks; record all operation and maintenance activities in notebook.
" "
Disassemble pump, check drop pipe, cylinder, leathers and foot valve. Check corrosion and wear. Repair or replace if necessary.
"& # " Conduct water test for micro-biological contamination; conduct water level check and well yield test. ! ! In case of contamination, locate and correct source of contamination, and disinfect; adjust cylinder setting if necessary; reconditioning or replacement of handpump when fully worn
# or ! "& ! Manage a stock of spare parts, tools and supplies "& # & !
Legenda Source : Adapted from Wash (1993) " = Community # = Local mechanic / private sector ! = Government

OP-32-E
24
Possible distribution of responsibilities for the O&M of a pump, diesel engine and standpost This following example corresponds to a system which is managed by communities. The government remains responsible for major repairs, replacement and water quality control. This distribution of responsibilities may not stay the same for ever. If communities are to be empowered to become fully responsible, these financial responsibilities are likely to change. Table 7: Operation & maintenance tasks for a pump or diesel engine
O&M tasks Operational Responsibility
Financial responsibility
Operate engine daily safely and efficiently; perform regular checks and adjustments (fuel, oil, filters, belts etc.); regularly replace engine oil, filters and pump oil if applicable; check all pipelines, tanks, valves for leaks breaks, and repair; monitor standpost use to encourage proper use; check all standposts for leaks, wear, tear, and repair if needed; flush all pipes periodically; clean standpost concrete aprons and drainage area, and repair; record all operation and maintenance activities in log book; manage a stock of fuel and oil, ensuring proper storage and security. Maintain special fuel log. Develop schedules for preventive maintenance
" "
Perform regular checks and adjustments on alternator, starter, radiator, valves and injectors; "& # " Conduct water test for micro-biological contamination; locate and correct source of contamination; disinfect; establish historical records of all engines, pumps and other ! ! Measure water output periodically, at well head and standpost. Assess leakage and initiate leak detection needed and repairs; periodically conduct complete overhauls on engine, pumps and associated equipment; conduct well engine/pump rehabilitation and / or replacement
"& # "& ! Management of a stock of parts, tools, and supplies "& # & !
Source: Adapted from Wash (1993) " = Community # = Local mechanic / private sector ! = Government Administrative and support activities linked to O&M The following example shows how administrative tasks and support activities can be distributed between the community and the Government agency. It shows clearly that most of the tasks that are related directly to the community or within the community’s boundaries can become the community’s operational and financial responsibility. Support activities are the operational responsibility of other organisations, government agencies or NGOs. This situation has evolved in recent projects, where the community is also asked to pay for support services once the project has been handed over. The debate is not yet closed on this issue. Table 8: Distribution of responsibilities for administrative and support activities linked to O&M
Administrative and support tasks linked to O&M Operational responsibility
Financial responsibility
Conduct technical and socio-economic participatory studies "& $ $ Prepare annual budgets and long term financial estimates; analyse O&M tasks for use in planning and budgeting; collect, analyse, monitoring results, and conduct follow-up support or training of necessary
"& $ "& $ Develop and evaluate technical & management training for water system operators; develop and evaluate financial & management training for community managers provide on-going technical training for operators; provide on-going financial and management training for community managers; develop information and materials on hygiene education; provide technical and management support to community managers
$ $
Select and appoint operators/ contractors for O&M; delegate task responsibilities, supervise and pay salaries; keep archives, inventories and log books; collect water fees and manage revenues; make payments for purchases, loans and other obligations; respond to users complaints; organise and conduct general meetings for discussions, elections; organise community contributions for upgrading or extending the system; report urgent problems to government agency
" " Legenda Source: Adapted from Wash (1993) " = Community $ = Government and/or Non-Governmental Organizations

Key Factors for Sustainable Cost Recovery
25
1.4.3 Formalising distribution of responsibilities The next step consists of sealing the distribution of financial responsibilities through an agreement or contract which describes the rights and obligations of each party, and defines the mechanisms for dealing with breaches of this agreement. In many countries, the Water Committee does not have a proper legal status. This puts the Water Committee in a vulnerable position in the event of any material, financial, contractual or legal problem, and is a reason why the legal status of the Water Committee should be part of the agreement. The usual forms of legal status include the following: • The Municipality officially registers a Committee which has been elected by a General Assembly
of users. The Assembly must produce a “constituting” Act. • The Water Committee is registered at the Chamber of Commerce as a non-profit making
association. • The Water Committee is registered at the Chamber of Commerce as an association with an
economic interest, which gives it the right to operate under a concession and to make contractual arrangements with local authorities.
• The Water Committee operates under the legal mandate of a Development Association.
1.5 Accompanying measures and capacity-building 1.5.1 Establishing an enabling environment Government agencies and sector NGOs can play a major role in supporting activities at local level and national level, which can contribute to improved financial sustainability. This support can include establishing a clear legal framework and policy on cost recovery, by which Governments clarify the “rules of the game” for communities, water enterprises and local authorities, so that each is aware of its rights and obligations. The sector policy should either specify the level of water rates or outline the legal parameters within which communities can determine their own water rates. Governments can also give incentives to private or local operators. Today, governments are beginning to promote education campaigns about the benefits of safe drinking water, the need to protect water resources and the beneficial effects of the proper use of water. Other support can include giving clear and accurate information before the start of a project and promoting hygiene education. These steps make users more aware of their responsibilities for their own water supply. This can contribute to willingness to pay. 1.5.2 Capacity-building Training community members, especially members of the Water Committee, in financing and other issues is very important to sustain services. Training needs to be adjusted to ensure it is not too far from the community, it is not too long, and it matches the appropriate level of education for community members. These issues, and others, are especially important to ensure that women as well as men are trained. In many cases, communities need training on bookkeeping and financial management. They might need to discuss with local authorities what to do in the event of major problems, and will need to rely on support from the private sector. Communities must be ready and able to fight for their rights. Training might also be needed for project staff, who often see cost recovery as secondary to technical issues. They will need to be aware that cost recovery is a key factor in sustainable water supplies and that it needs to be planned for right from the start. This implies that some provision has been made by support organisations for training and capacity building, in order to achieve sustainable cost recovery.

OP-32-E
26
2. Cost recovery in practice 2.1 Setting an appropriate tariff “Although tariffs cannot remedy all financial deficiencies and ensure complete viability of a water or wastewater system, they do go a long way to achieving financial sustainability” WASH (1991). The use of tariffs as a mechanism to cover the cost of water supply services has increased in rural and low-income areas, mainly due to the following factors: • an acknowledgement that the service of water should be paid by users, • the general and progressive implementation of new development models, whereby communities
are responsible for and own, (or are co-responsible for and co-own) their water supply scheme, • the trend towards decentralising the management of public services, • decreases in government recurrent costs funding. A tariff is the price a user is expected to pay for a service. It should preferably meet all costs, or at least cover operation and maintenance costs, depending on the chosen strategy. A tariff is also a mechanism used to regulate demand by, for instance, discouraging wasting water. It can also be used to promote the supply of water for the poor, by applying a ‘social’ price. It can further be used as a tool to protect the environment by including, for instance, a pollution penalty, or the costs of environmental protection and conservation. Finally, water tariffs are often used as a political tool in local communities, which can create a situation where they are no longer realistic, and do not meet all costs. It is therefore important to sensitise local politicians to the importance of tariffs that are able to cover costs. Consumers have, in theory, a predictable behaviour pattern in the event of price variations, analysed in terms of price elasticity. Price elasticity is the relationship between demand for water and the price for water20. Demand can be elastic, which means that demand increases when prices decrease; the sensitivity of demand to price variation in this case is high. Or, demand can be rigid, which means that demand does not increase significantly with price variations; the sensitivity of demand for water to price variations in this case is low. However, due to the very nature of water, which has no substitute as a good, people are ready to pay for improved services, especially if benefits are proven, and so price variations do not always affect demand. It has been reported that poor people in low-income areas often pay higher tariffs than better-off social groups in better-off areas. 2.1.1 Types of tariff It is proposed to describe two elements in tariff classification: • classification by user or usage; • classification of tariffs by rate category. • Classification by user or usage Classification by user or usage can be useful since it takes into consideration their different characteristics such as: consumption levels, productive use of water, domestic use of water, ability to pay, type of household, and number of family members. Furthermore, classification of users can clarify information for the water enterprise or water committee. The number and designation of user classes can vary, but almost every utility has the following categories: a) residential, b) commercial, c) industrial, d) institutional, e) government, f) wholesale. In some densely populated rural areas, consumption patterns can be similar to the one in urban areas and users can therefore be classified into various categories which need to be defined. A sub-classification of residential areas can also be made according to socio-economic strata, and the tariff level defined accordingly.
20 Definition in page 87 of Economie Générale, Tome 1, by Michel Bialès. Foucher, Paris, 1990.

Key Factors for Sustainable Cost Recovery
27
The example below shows different ways tariffs are collected for 95 water points surveyed in the region of Saint-Louis in the Senegal River basin project. Table 9: Different ways of defining a tariff (Senegal River Basin project)
Type of tariff Frequency Remarks
Per capita 1% Used mainly in socially homogenous communities Per man 3% Can be used in monogamous societies
Per married woman 6% Can actually represent a family unit, or used for family headed by single women
Per household 17% Can be used when average size of households is known and more or less the same in the community
Per plot 33% Corresponds to the traditional habitat entity Per bucket 0% Social distinction not taken into account.
Per head of livestock 40% Used in communities where livestock is an important aspect of economic life, and where the number of heads is known
Per herd 11% Used in communities where livestock is an important aspect of economic life, and where the number of heads is not known
Per carriage 44% In this project, corresponds to the most common way of collecting water
Source: Adapted from Programme Solidarité Eau (1994)
The above classification shows within a wide variety of tariff definitions within one region. However, tariffs defined per plot, per carriage and per head of livestock are the ones most commonly adopted in this area. This is due to the nature of the economic life and the priorities of this region. Tariffs can and should be adapted to local situations. Another way of classifying users, derived from an example in Mauritania, is based on the distance between the water point and the user’s home. The closer you live to the water point the more expensive is the water, and vice versa. Each family living from 5m to 50 m from a water point pays 10 UM (the local currency) per day. Families living from 50m to 100m from the water point pay 5 UM per day. Families from 100m to 300m from the water point pay 2 UM.
Source : Adapted from Programme Solidarité Eau, 1994 Figure 2: Defining a tariff according to the distance between water point and household location
From 100 m to 300 m, tariff = 2
From 50 m to 100m, tariff = 5 UM
From 5m to 50 m, tariff = 10 UM
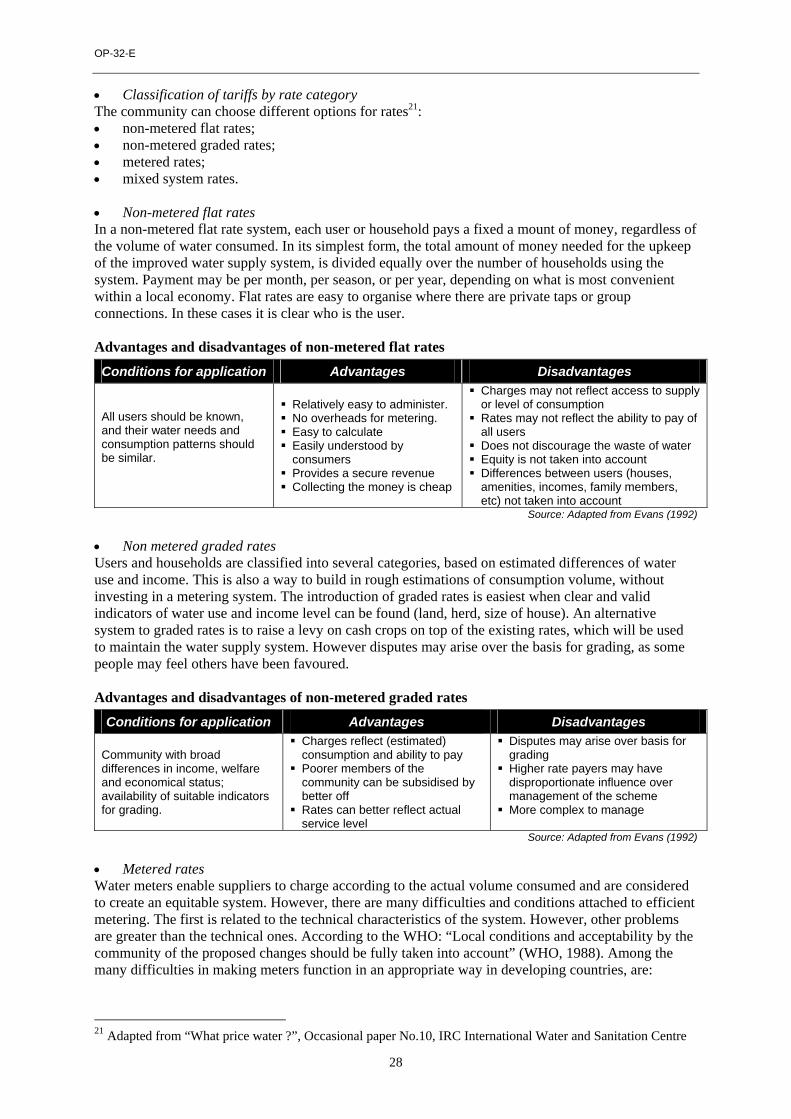
OP-32-E
28
• Classification of tariffs by rate category The community can choose different options for rates21: • non-metered flat rates; • non-metered graded rates; • metered rates; • mixed system rates. • Non-metered flat rates In a non-metered flat rate system, each user or household pays a fixed a mount of money, regardless of the volume of water consumed. In its simplest form, the total amount of money needed for the upkeep of the improved water supply system, is divided equally over the number of households using the system. Payment may be per month, per season, or per year, depending on what is most convenient within a local economy. Flat rates are easy to organise where there are private taps or group connections. In these cases it is clear who is the user. Advantages and disadvantages of non-metered flat rates
Conditions for application Advantages Disadvantages
All users should be known, and their water needs and consumption patterns should be similar.
" Relatively easy to administer. " No overheads for metering. " Easy to calculate " Easily understood by
consumers " Provides a secure revenue " Collecting the money is cheap
" Charges may not reflect access to supply or level of consumption
" Rates may not reflect the ability to pay of all users
" Does not discourage the waste of water " Equity is not taken into account " Differences between users (houses,
amenities, incomes, family members, etc) not taken into account
Source: Adapted from Evans (1992) • Non metered graded rates Users and households are classified into several categories, based on estimated differences of water use and income. This is also a way to build in rough estimations of consumption volume, without investing in a metering system. The introduction of graded rates is easiest when clear and valid indicators of water use and income level can be found (land, herd, size of house). An alternative system to graded rates is to raise a levy on cash crops on top of the existing rates, which will be used to maintain the water supply system. However disputes may arise over the basis for grading, as some people may feel others have been favoured. Advantages and disadvantages of non-metered graded rates
Conditions for application Advantages Disadvantages
Community with broad differences in income, welfare and economical status; availability of suitable indicators for grading.
" Charges reflect (estimated) consumption and ability to pay
" Poorer members of the community can be subsidised by better off
" Rates can better reflect actual service level
" Disputes may arise over basis for grading
" Higher rate payers may have disproportionate influence over management of the scheme
" More complex to manage
Source: Adapted from Evans (1992) • Metered rates Water meters enable suppliers to charge according to the actual volume consumed and are considered to create an equitable system. However, there are many difficulties and conditions attached to efficient metering. The first is related to the technical characteristics of the system. However, other problems are greater than the technical ones. According to the WHO: “Local conditions and acceptability by the community of the proposed changes should be fully taken into account” (WHO, 1988). Among the many difficulties in making meters function in an appropriate way in developing countries, are:
21 Adapted from “What price water ?”, Occasional paper No.10, IRC International Water and Sanitation Centre

Key Factors for Sustainable Cost Recovery
29
a) low reliability of the water supply; b) difficulties in reading the meters; c) the frequency with which users break meters or make illegal by-pass connections; d) high demands on administrative capacities (reading, billing, collecting, control, etc…); e) lack of familiarity with the concept in rural and low-income urban areas, lack of information, and
a belief that water is unlimited. If properly reinforced, metering induces users to avoid water wastage, which will reduce long-term costs or unaccounted water losses. Individual household meters are not only expensive to install, they also need to be read regularly and they make the administration more complex. Staff are needed to read meters, write bills and accept payments. Metering therefore requires administrative and management capacity. The added cost of installing and operating meters, as well as billing and collecting the money, may outweigh the benefits, notably in rural areas. A major constraint to user participation in piped systems with metered connections, is the high connection fee which water agencies charge to individual households wishing to install a private tap. One way to alleviate this problem is to spread the connection fee over time, and include it in the monthly water rate. Block rates are rates metered by “blocks” that vary according to consumption levels. Apart from a basic rate, which is fixed at a point where it is affordable by the poor, consumers may be charged a price proportionate to the volume consumed, with ranges or “blocks” (from 0 to 10 m3; from 10 to 20 m3, etc.). It is sometimes argued that rates for each block should decline at higher rates of consumption because of possible economies of scale. It is doubtful, however, that there are significant economies of scale on a per consumer basis. Considering the growth in services needed in developing countries, the most appropriate policy is an increasing block structure, with progressively increasing tariffs. Advantages and disadvantages of metered rates
Conditions for application Advantages Disadvantages Should have sufficient demand and willingness to pay for house connections. Good management capacity is needed as well as efficiency to ensure: a) cost-effectiveness and consumer satisfaction; b) efficient maintenance and leakage control.
" Charges reflect volume of water consumed
" Helps to reduce the consumption of water
" Makes it possible for poor people to access a minimum level of water consumption
" Demand can be regulated, and water resources conserved, by use of progressive rates
" Only one parameter: cost per m3 " Accounting made easier
" Raises cost of service due to higher overheads for meter reading, billing, collecting payments, policing delinquency
" Feasible, if reliable water supply " Difficult to define what is the
minimum level of water consumption for poor people
" Users frequently break meters or make illegal by-pass connections
" Meters need maintenance " Long delays in payment
Source: Adapted from Evans (1992) • Mixed system rates House connections together with standposts Another option to cover costs is to combine private paid connections with free public standposts. When there are enough private connections it becomes possible to finance the cost of public taps for the lowest income groups from a surplus of the rates paid by the private users. However, households which can afford to take a house connection do not always do so, when there are enough free standposts. This system should be accompanied by sensitisation and information campaigns promoting private tap connections.

OP-32-E
30
Advantages and disadvantages of a mixed system (house connections together with standpost)
Conditions Advantages Disadvantages Suitable where there is adequate demand for, and willingness to pay for, household connections, and where poor households cannot afford individual connections.
" Offers consumers choice of service level
" Rates reflect level of service " Poor can benefit from subsidised
or free basic service
" May be difficult to optimise balance between house connections and standpost
" Higher rate payers may have disproportionate influence over management of the scheme
Source: Adapted from Evans (1992) Water re-vending Water may be obtained by small-scale vendor groups, or individuals, from private or municipal taps, and sold either from a public vending kiosk or sold door-to-door. In this system, users pay for water by container or bucket purchased, at a price that is higher than the price paid originally. Profit margins can be outrageously high, especially in low-income urban areas, where communities do not have an alternative. Furthermore, the quality of water is not guaranteed through all these intermediary steps. The main disadvantage of water re-vending is its high price. Often users pay more for 20 litres of water with this system than those who are supplied 500 litres per day from a piped system (Whittington, 1989). Advantages or disadvantages of a mixed system (Water vending)
Conditions Advantages Disadvantages
High demand for water; very little alternative in water provision.
" Users buy the quantity of water at a negotiated price
" Water distribution is easy " Users who live far from alternative
water sources can save time and effort
" Generation of employment and demand of local products
" Risk of pollution during water transport and manipulation
" Users pay high prices compared with the prices in water systems with private taps
" There are no rules and policies for regulation
Source: Adapted from Evans (1992)
2.1.2 Tariff calculation Non metered flat rates (See Annex 1 for example)
As mentioned earlier, tariffs are linked to the costs of supplying and treating water. However, the amount is linked to a specific cost recovery strategy or is the result of a social policy. It is proposed to distinguish two types of tariffs: a) basic tariff; b) real cost tariff. Basic Tariff includes only the recovery of basic operation, maintenance and administration costs, called ‘functioning costs’. These costs are divided by the number of households.
Basic Tariff = Functioning costs per month Number of households
If such a tariff is chosen it will be appropriate to consider with the community how the other costs will be covered. Real Cost Tariff includes not only the functioning costs, but also replacement and extension costs, which have been estimated in this example as representing 25% of functioning costs. These costs vary considerably from one technology to another.
Real Cost Tariff = Functioning costs + replacement and extension costs = 1.25 x functioning costs per month Number of households Number of households

Key Factors for Sustainable Cost Recovery
31
Real cost tariffs sometimes also include: a) environmental costs (costs of protecting and conserving water source, or treatment of used water
discharge); b) costs for ‘unaccounted for’ water (in some countries, unaccounted for water can represent up to
60% of total water produced, which represented a considerable loss in revenues; this loss can be recovered in the tariff, while correcting measures are put in place);
c) investment costs; d) depreciation costs. Metered graded rate applying a subsidy factor (see Annex 2 for example) Although tariff calculations are often developed on a project by project basis, tariffs formulas can also be determined at government level, as is the case in Colombia, which uses average costs to determine tariffs. A tariff requires information to be collected and then is determined through several steps: • calculating various costs, • defining the tariff, • setting the bill. Information required
• Classification of users by social strata In Colombia, the Public Services Law (142/1994) classifies residential users, according to their socio-economic conditions, into 6 strata with the poorest at strata 1 and richest at strata 6. Industries and institutions are classified as industrial and official users, respectively.
• Consumption ranks I. Basic consumption satisfies the basic needs of a family, fixed at 20 m3 per user per month; II. Complementary consumption, between 20 m3 and 40 m3 per user per month; III. Luxury consumption over 40 m3.
• Subsidies (Sub) and extra-charges according to consumption ranks and strata. For each strata there is a subsidy (highest for the lowest strata). Official users receive no subsidy. Industries face an extra charge and receive no subsidies.
• Calculating various costs Average Investment Cost (AIC): is the cost of present and future investments in order to produce and distribute one cubic meter of water. It includes the initial and future investment (INI and FIN), the Total Water Produced in m3 during 30 years (TWP) and the cost sharing of investments recovered by connection (variable C).
AIC($/m3) = INI + FIN * (1 – C)
TWP Average Operation and Maintenance Cost (AOMC): is the operating and maintenance cost of one cubic meter of water during the year. It takes into account the volume of water produced and the leakage index (P=30%) for the same year.
AOMC ($/m3) = Total O&M costs M3 produced * (1 – P)
Long Term Average Cost (LTAC): is the operating and maintenance cost of producing one cubic meter of water, taking into account the actual and future treatment capacity of the water supply system.
LTAC = AIC + AOMC
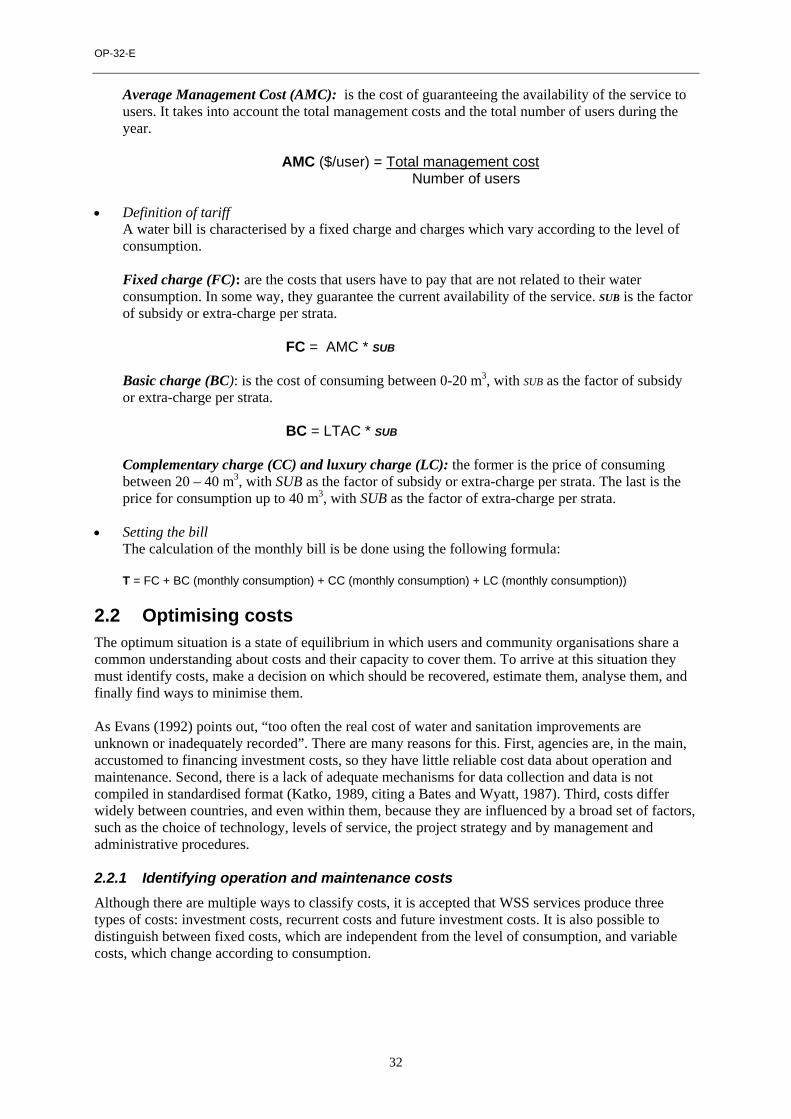
OP-32-E
32
Average Management Cost (AMC): is the cost of guaranteeing the availability of the service to users. It takes into account the total management costs and the total number of users during the year.
AMC ($/user) = Total management cost Number of users
• Definition of tariff
A water bill is characterised by a fixed charge and charges which vary according to the level of consumption.
Fixed charge (FC): are the costs that users have to pay that are not related to their water consumption. In some way, they guarantee the current availability of the service. SUB is the factor of subsidy or extra-charge per strata.
FC = AMC * SUB
Basic charge (BC): is the cost of consuming between 0-20 m3, with SUB as the factor of subsidy or extra-charge per strata.
BC = LTAC * SUB
Complementary charge (CC) and luxury charge (LC): the former is the price of consuming between 20 – 40 m3, with SUB as the factor of subsidy or extra-charge per strata. The last is the price for consumption up to 40 m3, with SUB as the factor of extra-charge per strata.
• Setting the bill
The calculation of the monthly bill is be done using the following formula: T = FC + BC (monthly consumption) + CC (monthly consumption) + LC (monthly consumption))
2.2 Optimising costs The optimum situation is a state of equilibrium in which users and community organisations share a common understanding about costs and their capacity to cover them. To arrive at this situation they must identify costs, make a decision on which should be recovered, estimate them, analyse them, and finally find ways to minimise them. As Evans (1992) points out, “too often the real cost of water and sanitation improvements are unknown or inadequately recorded”. There are many reasons for this. First, agencies are, in the main, accustomed to financing investment costs, so they have little reliable cost data about operation and maintenance. Second, there is a lack of adequate mechanisms for data collection and data is not compiled in standardised format (Katko, 1989, citing a Bates and Wyatt, 1987). Third, costs differ widely between countries, and even within them, because they are influenced by a broad set of factors, such as the choice of technology, levels of service, the project strategy and by management and administrative procedures. 2.2.1 Identifying operation and maintenance costs Although there are multiple ways to classify costs, it is accepted that WSS services produce three types of costs: investment costs, recurrent costs and future investment costs. It is also possible to distinguish between fixed costs, which are independent from the level of consumption, and variable costs, which change according to consumption.
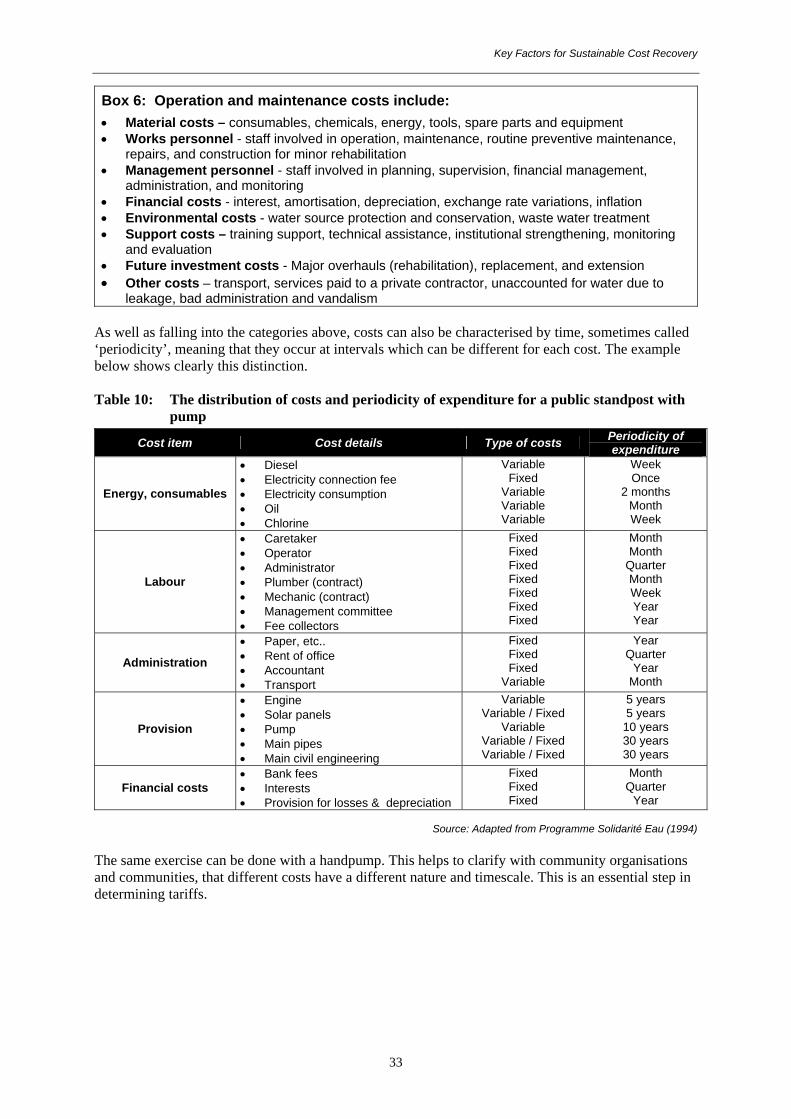
Key Factors for Sustainable Cost Recovery
33
Box 6: Operation and maintenance costs include: • Material costs – consumables, chemicals, energy, tools, spare parts and equipment • Works personnel - staff involved in operation, maintenance, routine preventive maintenance,
repairs, and construction for minor rehabilitation • Management personnel - staff involved in planning, supervision, financial management,
administration, and monitoring • Financial costs - interest, amortisation, depreciation, exchange rate variations, inflation • Environmental costs - water source protection and conservation, waste water treatment • Support costs – training support, technical assistance, institutional strengthening, monitoring
and evaluation • Future investment costs - Major overhauls (rehabilitation), replacement, and extension • Other costs – transport, services paid to a private contractor, unaccounted for water due to
leakage, bad administration and vandalism As well as falling into the categories above, costs can also be characterised by time, sometimes called ‘periodicity’, meaning that they occur at intervals which can be different for each cost. The example below shows clearly this distinction. Table 10: The distribution of costs and periodicity of expenditure for a public standpost with
pump
Cost item Cost details Type of costs Periodicity of expenditure
Energy, consumables
• Diesel • Electricity connection fee • Electricity consumption • Oil • Chlorine
Variable Fixed
Variable Variable Variable
Week Once
2 months Month Week
Labour
• Caretaker • Operator • Administrator • Plumber (contract) • Mechanic (contract) • Management committee • Fee collectors
Fixed Fixed Fixed Fixed Fixed Fixed Fixed
Month Month
Quarter Month Week Year Year
Administration
• Paper, etc.. • Rent of office • Accountant • Transport
Fixed Fixed Fixed
Variable
Year Quarter
Year Month
Provision
• Engine • Solar panels • Pump • Main pipes • Main civil engineering
Variable Variable / Fixed
Variable Variable / Fixed Variable / Fixed
5 years 5 years
10 years 30 years 30 years
Financial costs • Bank fees • Interests • Provision for losses & depreciation
Fixed Fixed Fixed
Month Quarter
Year
Source: Adapted from Programme Solidarité Eau (1994) The same exercise can be done with a handpump. This helps to clarify with community organisations and communities, that different costs have a different nature and timescale. This is an essential step in determining tariffs.

OP-32-E
34
It should be noted that expenditure on spare parts is irregular and varies according to the quality of operation and maintenance, and to the type of spare parts. Spare parts can be divided into three categories: 1) frequently needed which should be kept as close as possible to the village (shop, mechanic); 2) occasionally needed (every six months or year), which can be at a major centre close by; 3) those needed for major rehabilitation or replacement (every few years) which can be kept at the
local region or state capital. Finally, operation and maintenance costs are not only subject to a certain periodicity, they are also subject to variations due to the economic environment, inflation or exchange rate fluctuations which can influence the price of spare parts or energy. While identifying costs, it is therefore important to highlight not only cost items, but also their periodicity and possible variations over time. 2.2.2 Estimating costs Estimating investment costs is not difficult, as manufacturers advertise the price of equipment and labour wage costs are known. However, estimating recurring costs just by using experience from other similar projects can be misleading, as recurring costs vary widely from one project to another. One common method of estimating O&M costs is to use a percentage of capital costs, with the percentages used ranging from 5 to 20%. This approach frequently results in an underestimation of recurrent cost (WASH, 1988a). In this section we show how to estimate real O&M costs as accurately as possible. The main costs of O&M were showed in Box 6, as: personnel, materials, chemicals, energy and communication, transport and private contractors. Based on this list, recurrent cost can be estimated as follows22: Estimating Personnel costs a) Full time • determine O&M activities, • estimate the minimum number of personnel, • proceed with an agreement on the size and classification of all staff involved in O&M, • determine the average wage paid for each class of personnel, • sum up all wages. b) Over time • determine O&M activities that require additional time, • estimate number of personnel required for additional time, • determine the average wage paid for this personnel, • sum up all wages. Estimating Material Costs • consider two categories of materials: supplies and spare parts, • detail all the equipment, facilities and components of the water supply system, • detail the nature and frequency of O&M of each piece of equipment, facility, and component, • determine the need for each, • identify the cost of each, • determine the whole cost (and possibly determine unit costs/ m3). Estimating Chemical Costs • identify which chemicals are needed (type, form, and quantities), • identify chemical costs by using unit price information for each chemical, • calculate the annual total cost by multiplying the unit cost by the annual quantity needed.
22 Adapted from WASH (1988).

Key Factors for Sustainable Cost Recovery
35
Estimating Energy and Communication Costs a) Electrical Power • identify the characteristics of the engine and electrical devices, • determine daily running time and power consumption, • identify the unit cost of electricity and determine total (and per unit) cost. b) Fuel Costs • identify the characteristics of engines and devices which use fuel, • determine daily running time and fuel consumption, • identify cost of fuel and determine total (and per unit) cost. c) Communications Costs • list all communication equipment, • identify monthly fee per device / piece of equipment, • sum up the monthly fees. Estimating Transport Costs • identify tasks which require transport (transport of personnel and of material/supplies), • define the transport needs for each tasks, including the type of vehicle required (bus, pick-up, so
on) and the round trip distance in km or miles, • estimate the frequency of trips (by season if relevant), • estimate transport cost per kilometre or mile including fuel, lubricants, tyres, insurance,
maintenance, drivers’ wages, paying back the capital cost, • estimate the total monthly costs for transport using this information.
Estimating private contractor costs • establish which maintenance tasks will be performed by which private contractors (it is helpful to
differentiate between regular maintenance tasks and unforeseen repairs), • estimate the frequency at which each will occur, • estimate the cost per incident, preferably after discussions with private contractors, • establish an agreement with the private contractor, if possible. 2.2.3 Minimising costs An important aspect of optimising costs is reducing O&M costs. These can be significantly reduced in the following way: • Choosing a technology with low cost spare parts or low cost operation and maintenance costs.
Minimising O&M costs should be more of a priority than minimising capital investment, especially where the replacement cost will not be borne by communities. However, if a full cost recovery is agreed, planners and communities should try to minimise both capital and recurrent costs.
• Economies of scale can make an expensive water supply system more attractive financially, where costs can be spread over a large number of actual or potential users. However, this does not usually apply to wells or handpumps, which are designed for a certain number of users. Economies of scale are more applicable in the context of piped water supply.
• One way to reduce costs is to monitor with care changes in variable costs such as energy, consumables, maintenance and repair. Unusual increases in these costs should swiftly alert the organisation managing the service to possible misuse or mismanagement.
• Fixed costs cannot normally be reduced. However, like all costs, at times they can be subject to variations. One way to protect a project from unpredictable increases is to fix them in a contractual agreement between personnel and the organisation.
• It is possible to reduce transport costs by making spare parts and chemicals more accessible and available to the community.
• Planners should try, where possible, to reduce dependence on chemical use, using for example alternative water treatment technology such as a multi-stage filtration system.
• Reduce dependence on fuel or electric consumption, by using solar, gravity, or wind energy.

OP-32-E
36
• Try to firmly install a maintenance culture within the community and amongst professional staff to keep the service in good working condition and so increase the life cycle of the equipment.
• Organise preventive maintenance activities involving the users, helping to increase their sense of responsibility, and involve them in constant monitoring of the system, which leads to better functioning and may reduce expenditures on repairs.
• Organise systematic control of unaccounted for water, where users are involved in leakage control and there is a system of checks and balances in place for administrative losses.
• Install proper administrative and financial control mechanisms to avoid mismanagement of funds. One easy and effective way to do this, is to keep communities regularly informed with detailed figures, about the financial status of the organisation.
2.3 Access to other sources of funding “New strategies should aim towards increased efficiency in the use of available funds and in increased mobilisation of additional funds”23. This proposition from The New Delhi Statement (1990) was subsequently reinforced by all major sector meetings during the nineties, and is particularly valid in the context of a community-managed water supply. It will indeed be important to plan and determine financial mechanisms which cover all costs, if these are not fully covered by user’s fees. As seen earlier, tariffs are often based on the recovery of basic operation and maintenance costs, and rarely include the cost for major repairs, rehabilitation and replacement. Communities will need to tap into alternative sources, and it is proposed that planners take this into account, and facilitate /organise access to these sources. Possible alternative financial sources are: • existing community sources, • private or corporate financing, • subsidies and taxes, • credit–loan mechanisms, • grants, • specific funds. This section gives an overview of these possible alternatives to tariffs. Planners need to assess the availability, reliability and sustainability of these sources and, where they are non-existent, the possibility of developing them. 2.3.1 Tapping into existing community sources In communities with significant seasonal variations in income, it is difficult to recover costs through regular payments. An alternative is to cover the costs through community fund raising where “families do not pay regular contributions towards the cost of the community water system. Instead, money is periodically accumulated in other ways.” (van Wijk, 1989) Community fundraising options include voluntary funds, general community revenue and payment in kind. Voluntary funds Voluntary funds are built up by voluntary contributions from local leaders or community groups through public meetings, bazaars, lotteries, festivals and similar social activities. These are common to finance construction and major repairs in communities which have a tradition of fund raising and seasonal income. People contribute to finance a particular project or activity. The success of this option depends on a certain social cohesion which ensures that users contribute according to their use of water and ability to pay.
23 From The New Delhi Statement (1990).

Key Factors for Sustainable Cost Recovery
37
Advantages and disadvantages of voluntary funds
Advantages Disadvantages • Users decide on the amount of the
contribution according to their ability to pay and commitment to the project.
• Appropriate in communities with a tradition of social projects.
• Can be matched to seasonal income. • Encourages a sense of ownership. • Appropriate to finance a small proportion
of investments, minor repairs and recurrent cost particularly in communities with low-income levels and for short periods of time.
• Difficult to finance recurrent cost of water supply or sanitation systems over a long period of time.
• Difficult to know who is contributing and who is not. • Can cause disputes between users as people who
contributed the most want to make decisions in their favour.
• Some users contribute without taking into account their use of water and the benefits provided by the system.
• The total amount that can be collected is uncertain because contributions are decided by users on a voluntary basis.
General community revenue Communities can develop communal productive activities, such as cash crops or a village shop, and pay water bills with their profits. Disputes may arise over the priorities to give to the use of these resources, especially when users do not have equal access to water supply. Advantages and disadvantages of community general revenues
Advantages Disadvantages • Community members do not have to use
their income to pay WSS instalments. • Will meet the cost of a big share of the
investments if high profits are generated. • A sense of commitment and unity within
the community can be increased. • This can be the first step towards the
future development of social projects • It makes it possible to support
developments of water supply or sanitation systems.
• Equity is not ensured, if all users do not receive the same level of service
• Disputes may arise about priorities to give to the use of resources
• The level of available resources depends on the level of profits.
Payment in kind Households are sometimes given the opportunity to pay part of their contribution to the construction of their water supply in kind, by providing voluntary labour for trench digging, transport, sand pipe laying, or by providing local materials, such as gravel and sand. Payment of part of the construction costs in labour instead of money makes the system more affordable to a larger number of households than when all the payments have to be made in cash. Advantages and disadvantages of payment in kind
Advantages Disadvantages • Adapted to the local capacity and
resources. • Increases user participation and
commitment to the project. • Project takes into account the real
contribution of communities.
• Difficult to give a monetary estimation of payments in kind.
• Does not solve cash or financial problems. • Villagers can be exploited as free labour.
2.3.2 Private or cooperative financing There is an increasing trend for a greater involvement of the private sector in the provision and /or management of WSS services. There are two kinds of private interventions: through private capital and through cooperative funds.

OP-32-E
38
Private capital Private capital can be channelled into the construction of a WSS scheme, or to meet replacement, extension or recurrent costs. However, those who provide the capital involvement look for high rates of return to justify their investment, often through future contracts or ownership. It is difficult to apply this option in rural and low-income urban areas where users are not able to pay a “full-costs recovery” tariff which would include repaying investment costs and providing this rate of return. Advantages and disadvantages of private capital
Advantages Disadvantages • Effective cost recovery through clear
managerial practices. • Availability of resources to carry out large
investments. • Increases capacity to negotiate with
governments and institutions.
• Users are unlikely to participate in decision making.
• Users pay a high tariff a) to repay the investment cost, and b) to provide a profit.
• Does not necessarily take into account ability to pay, making it difficult for poor people to access the service.
Cooperative funds Cooperative funds result from an initiative by a group of users or individuals who get together to finance productive activities, not in the first place always related to WSS. The initial capital comes from contributions in cash or in kind from the members of the cooperative. Once the group has sufficient revenue, members may decide to use part of their funds to finance WSS services. However, the amount of capital available in this option depends on the results of the first stage investments. With good financial and organisational practices, this is a good way to administer WSS services. Advantages and disadvantages of cooperative funds
Advantages Disadvantages • Allows the financing of a part of major
investments such as construction or extension.
• Encourages productive activities which can produce large resources.
• Well-organised cooperatives use sound financial and organisational practices.
• Access to cooperative systems could be difficult for poor people who do not have the money to pay the instalment or registration costs.
• Financing productive activities can become more important than financing water related activities.
• They only benefit members of the cooperative.
2.3.3 Subsidies and taxes
Direct government subsidies Central government and local authorities allocate part of their budget towards constructing, operating and maintaining public services. Subsidies can also come through reducing the price of spare parts and chemicals. Authorities may also, at the request of the community, provide free technical advice, technical staff or staff for community organisation and education. The use of public resources to subsidise poor users depends on government policies and the legal framework, and also on the availability of funds. Subsidies need to be arranged in such a way that they do not discourage efficient use of water, nor send wrong economic signals to a market. Indeed, the subsidised price of parts or equipment for a particular project can compete with similar products available for sale, and therefore distort a market. Subsidies can be used as promotion tools for a particular professional group, for instance the informal and formal private sector. They can also be used to promote access to water services by marginalised groups, with subsidies adapted to various levels of marginalisation.

Key Factors for Sustainable Cost Recovery
39
Advantages and disadvantages of subsidies Advantages Disadvantages
• Allows users with low ability to pay to access WSS services.
• Tool for income redistribution. • Availability of resources to carry out large
investments.
• It is difficult to keep subsidies going for long periods due to lack of resources of governments.
• There is a trend towards cutting off public resources.
• Discourages community responsibility. • There is a tendency for political reasons to
dominate resource allocation and distribution. Taxes Municipalities can collect the necessary funds through local taxes. Payment can be linked to income level or properties, but charges may not reflect the level of water consumption. Governments are not always clear and transparent in the management of this type of resources and users are reluctant to accept new taxes. Advantages and disadvantages of taxes
Advantages Disadvantages • Takes into account the ability of users to
pay. • Does not require additional administrative
procedures because taxes are already collected at local or national level.
• Not expensive.
• Users hardly participate in decision making. • Users hardly participate in management and
allocation of resources. • High rate of non-payment of taxes, especially in
developing countries. • Bureaucracy delays resource allocation and
payment making it difficult to get money at the right time.
• There is a tendency for political reasons to dominate resource allocation and distribution.
Cross-subsidy One way to make the service equitable and affordable for all is to subsidise the poor and surcharge high-income consumers. However, in rural and low-income urban areas the majority of users have low-income levels, so funds raised from surcharging richer users in that area will not cover their subsidies. Advantages and disadvantages of taxes Advantages and disadvantages of cross-subsidies
Advantages Disadvantages • Allows users with low ability to pay to
access water supply and sanitation services.
• A tool for income redistribution.
• Requires the management of complex information about tariffs structures, consumption, users, water uses, etc. It makes community management difficult.
• Can send wrong signals about prices to subsidised users, leading to waste of water.
• Industries which are surcharged look for alternative water sources.
• Difficult to keep this financial option for a long period.
• Encourages corruption as users want to be classified to pay lower tariffs
2.3.4 Grants NGOs and donors have used grants as a type of financing mechanism for the construction of WSS systems. Nowadays, this approach conflicts with the new approach under which donors and NGOs demand an active role from communities. Grants rarely pay for recurrent costs. However, donations are still made to support water and sanitation services.

OP-32-E
40
Donations from former residents or through twinning Donations can come through former inhabitants of a village who live in a city or abroad, or in some cases where villages are twinned with other villages and cities of other countries. Advantages and disadvantages of donations
Advantages Disadvantages • Poor rural and peri-urban communities can
benefit from these funds. • Availability of resources to carry out large
investments.
• Donations can be targeted to produce political benefits.
• Can discourage the community from building up its own resources.
• Difficult to sustain these funds during political or economic changes in donor countries.
2.3.5 Credit–loan mechanisms (micro-credits) Micro-credit is financing through lending mechanisms, similar to credits given by banks, except for their nature and size. Micro-credits are generally small in volume and respond directly to the specific needs of rural or low-income urban communities. It is possible to distinguish three types of micro-credit systems (see also Table 11): • micro-credit through a bank, • micro-credit through an association, • micro-credit through individuals. A micro-credit system can be used to: • contribute to investments, • purchase material and equipment for replacement, extension and rehabilitation, • finance major unforeseen repairs, • cover short-term cash-flow problems;, • develop a stock of spares, parts and tools. The development of a micro-credit system through an association or individuals to finance important capital investments is difficult, due to the small amount of money and the short-term nature of the credit. They have, however, been instrumental in financing small individual devices, such as rooftop harvesting or a hammer and pulley system for wells. For major investments, communities still need to contact banks or rural development funds. Funds to purchase materials and equipment for replacement, extension and rehabilitation differ from initial capital investment in that their need can be foreseen. Some projects cover future replacement costs in their tariffs. In these cases, this part of the payments can be used as savings or as guarantees for possible credit. Financing unforeseen repairs and damage, together with cash flow problems, are perhaps the most frequent financial needs, because of fluctuations in income or because tariffs fail to cover costs. It is of utmost importance to ensure alternative financing to meet these contingencies. Micro-credit systems through associations would be particularly appropriate where the amounts needed are not too large. The development of a stock of spare parts and tools can be critical to sustain a rural water supply, especially when communities are isolated and geographically remote from major trading centres. Developing a micro-credit system for this type of expenditure can be most beneficial. In general, micro-credit systems can overcome financial obstacles and promote development in areas out of reach for the conventional banking system. Micro-credits, furthermore, represent a strong tool to alleviate poverty, and to offer marginal groups within a community a possible access to finance.
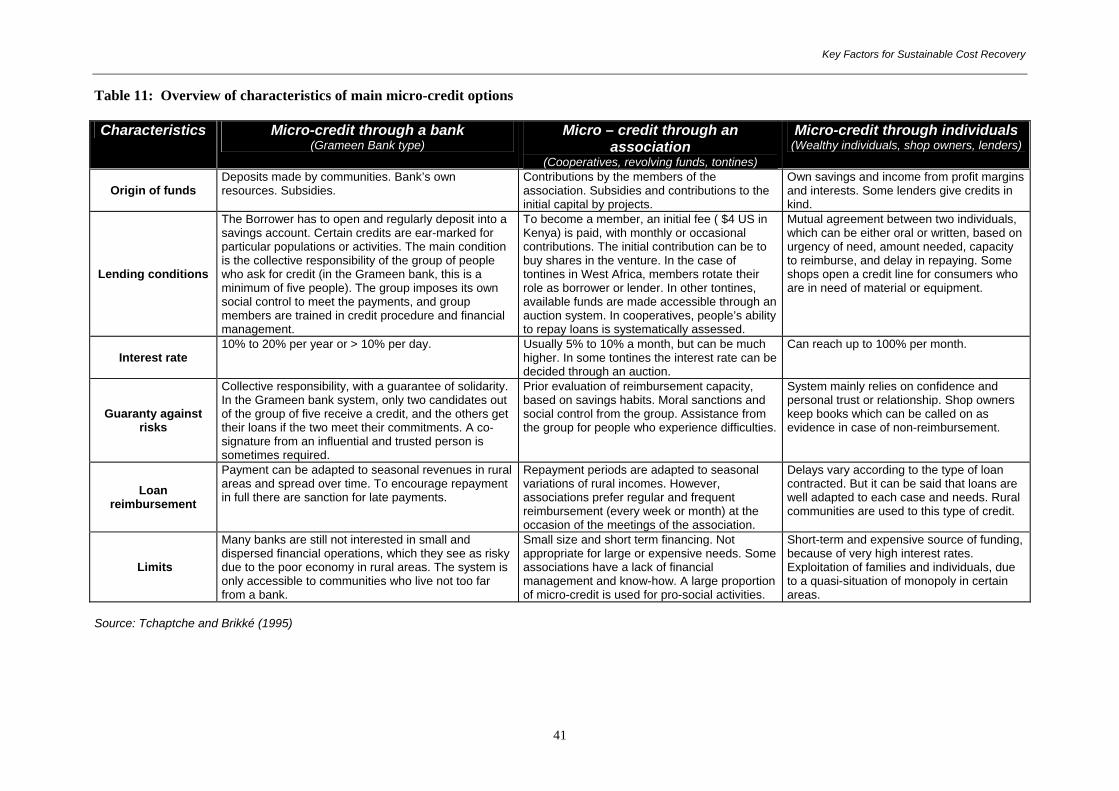
Key Factors for Sustainable Cost Recovery
41
Table 11: Overview of characteristics of main micro-credit options Characteristics Micro-credit through a bank
(Grameen Bank type) Micro – credit through an
association (Cooperatives, revolving funds, tontines)
Micro-credit through individuals (Wealthy individuals, shop owners, lenders)
Origin of funds Deposits made by communities. Bank’s own resources. Subsidies.
Contributions by the members of the association. Subsidies and contributions to the initial capital by projects.
Own savings and income from profit margins and interests. Some lenders give credits in kind.
Lending conditions
The Borrower has to open and regularly deposit into a savings account. Certain credits are ear-marked for particular populations or activities. The main condition is the collective responsibility of the group of people who ask for credit (in the Grameen bank, this is a minimum of five people). The group imposes its own social control to meet the payments, and group members are trained in credit procedure and financial management.
To become a member, an initial fee ( $4 US in Kenya) is paid, with monthly or occasional contributions. The initial contribution can be to buy shares in the venture. In the case of tontines in West Africa, members rotate their role as borrower or lender. In other tontines, available funds are made accessible through an auction system. In cooperatives, people’s ability to repay loans is systematically assessed.
Mutual agreement between two individuals, which can be either oral or written, based on urgency of need, amount needed, capacity to reimburse, and delay in repaying. Some shops open a credit line for consumers who are in need of material or equipment.
Interest rate 10% to 20% per year or > 10% per day. Usually 5% to 10% a month, but can be much
higher. In some tontines the interest rate can be decided through an auction.
Can reach up to 100% per month.
Guaranty against risks
Collective responsibility, with a guarantee of solidarity. In the Grameen bank system, only two candidates out of the group of five receive a credit, and the others get their loans if the two meet their commitments. A co-signature from an influential and trusted person is sometimes required.
Prior evaluation of reimbursement capacity, based on savings habits. Moral sanctions and social control from the group. Assistance from the group for people who experience difficulties.
System mainly relies on confidence and personal trust or relationship. Shop owners keep books which can be called on as evidence in case of non-reimbursement.
Loan reimbursement
Payment can be adapted to seasonal revenues in rural areas and spread over time. To encourage repayment in full there are sanction for late payments.
Repayment periods are adapted to seasonal variations of rural incomes. However, associations prefer regular and frequent reimbursement (every week or month) at the occasion of the meetings of the association.
Delays vary according to the type of loan contracted. But it can be said that loans are well adapted to each case and needs. Rural communities are used to this type of credit.
Limits
Many banks are still not interested in small and dispersed financial operations, which they see as risky due to the poor economy in rural areas. The system is only accessible to communities who live not too far from a bank.
Small size and short term financing. Not appropriate for large or expensive needs. Some associations have a lack of financial management and know-how. A large proportion of micro-credit is used for pro-social activities.
Short-term and expensive source of funding, because of very high interest rates. Exploitation of families and individuals, due to a quasi-situation of monopoly in certain areas.
Source: Tchaptche and Brikké (1995)

OP-32-E
42
Box 7: Bangladesh, the Grameen Bank The Grameen Bank has been created in Bangladesh on the assumption that lack of access to finance is one of the major causes of poverty. Its mechanisms rely on a system of reciprocity and mutual guarantee which replaces the usual system of material guarantee. Groups of 5 candidates are created, with similar economic status. In order to obtain a credit, candidates have to follow a two week course during which they are exposed to the philosophy, regulations and procedures of the Grameen Bank. Candidates have to submit simple plans showing how activities financed by the credit will generate enough revenue to allow the loan to be repaid. At first, only two of the five candidates can access a loan. If the repayment schedules are correctly followed than the other candidates can borrow as well. However, the goods acquired with the loan remain Bank property until the loan has been totally repaid. Repayments are usually weekly for a period not exceeding a year. So far, 56% of credits have been given to women, and the rate of full repayment is above 95%. The experience of the Grameen bank shows that rural populations are credible customers and partners.
2.3.6 Specific funds
Social and development funds Different types of funds have been established to help the water sector, most of them with a social and development aim. The principal points of attraction for these funds are low interest rates and long periods for repayment. Governments can provide credits at lower interest rates than the financial market, and these funds can be used to promote social development. Credits are allocated to institutions or local governments and it is not easy for users or community groups to access them. There is, however, a trend today to create funds which better respond to the needs of rural populations. A good example can be found in the Social Investment Funds promoted by the Inter American Development Bank. A strong feature of the Funds is their ability to tailor themselves to changing circumstances without sacrificing their efficiency and effectiveness. Through their closer contact with communities, the Funds have opened new avenues for social action and have increased public awareness of poverty issues. However, the funds respond mainly to investment needs for new construction or for major overhauls, and are not necessarily available to finance short-term needs and unforeseen breakdowns. Moreover, past experience has shown that communities still have great difficulty in accessing resources from these Funds, while project reports often mention mis-management as a major obstacle to efficiency. Since access is easier for local authorities and municipalities than for communities, it is important that communities and municipalities work in partnership. Access to these funds can be eased through the payment of a regular fee, which gives the payer a better chance of receiving a loan. Advantages and disadvantages of social and development funds
Advantages Disadvantages • Provides an enabling environment to
strengthen community capacities. • Optimises the use of resources because
financial institutions supervise construction. • Working in partnership with financial
institutions, governments and other institutions allows long-term project design and programmes.
• Credits are cheap and repayment periods are long.
• It is difficult for communities to access these funds without institutional support.
• They can produce a high degree of dependency on institutions by communities.
• Mis-management of funds.

Key Factors for Sustainable Cost Recovery
43
Village or local funds Villagers can be encouraged to create a fund at local or village level for the maintenance of their water supply. An initial deposit is put into a bank account, which is replenished through monthly or yearly contributions. The bank account attracts interest on savings, and opens access to credits, deficits, and overdrafts. Account holders can use their savings as a financial guarantee. The fund operates as a savings bank account managed by the bank. The fund can also be managed within a village or area setting, without passing through a bank. Deposits and savings operate as a revolving fund, which works as micro-credit system through an association, as described above. The principal obstacle in this situation is lack of financial management skills. 2.4 Effective financial management A great number of communities and, in some remote areas, municipalities as well, lack the financial management skills which are essential to organise, implement and efficiently control a cost recovery system. A financial management system can be said to be effective when managers can: • estimate the revenue that the service will produce over defined periods of time and the expenditure
it will need (budgeting); • collect fees from users (billing and collection); • keep all financial information and records (financial administration); and, • use indicators to control and monitor the financial performance of the enterprise (financial control
and monitoring). 2.4.1 Budgeting Budgeting is a basic aspect of financial management because it allows managers to: • plan revenue and expenditure for a determined period of time (usually one year); • determine in advance the amount of money required to cover total expenditure (wages, chemicals,
fuel, repairs, interest, and so on); • estimate the revenue that the enterprise expects to receive for tariffs, registration, connections,
loans and donations; • control actual expenditure and to compare it with planned expenditure, and to reveal possible
sources of imbalance (positive or negative) between actual and planned expenditure; • visualise the future of the committee, and answer such questions as: Where does the committee
want to go? What financial alternatives does the committee have?
This process could be separated in four main stages: 1. determining expenditure, 2. estimating expenditure over a period of time, 3. planning revenue, 4. comparing revenue and expenditure. 1. Determining expenditure This should define total expenditure and identify how much money is necessary to cover it. There are four main types of recurrent expenditure (costs) in the provision of water supply services: operation, maintenance, management (administration) and provision for future replacement (rehabilitation). In some projects, replacement costs are not considered as recurrent costs, but as future investment costs. Investment costs can be included in the budget if necessary, for example, when an enterprise has to pay off a loan for the construction of the system by instalments. One way to determine total expenditure is to list all the activities required to operate, maintain and to manage the water supply service, and then to estimate personnel, inputs and purchases required for each activity and their prices. There are two important conditions for doing this: The person doing the budgeting has to have good knowledge about all the activities needed to operate, maintain and manage the water supply system, and the prices that are paid in the market for each item. The budget should be for a defined period of time - usually one year.

OP-32-E
44
2. Estimating expenditure over shorter periods of time The overall budgeting provides a clear idea of the total amount of finance which is going to be needed over a period of time (usually one year), but does not give information about the cash flow required over short periods of time (monthly). Estimates need to be made about how much money is going to be needed at what time. Usually, this estimate is made for each month. It is impossible to provide a good service unless you know when money is needed to pay bills on time. 3. Planning revenue Revenue can be classified according to the source and the time when the money is expected to be received. Sometimes, estimates have to be made because there is a high level of uncertainty about revenue sources. To estimate revenue accurately it is necessary to have information about: the total number of users (legally and illegally connected), the number in each category of user (residential, commercial, industrial, institutions), the number of users who do not pay on time, tariffs by type of user, connection and registration costs by type of user, income from alternative financial sources, other than tariffs, the number of users estimated to connect to the system over a year. 4. Comparing revenues and expenditure A revenue and expenditure comparison allows a committee to determine the financial viability of the service. This comparison tells committees, when expenditure is higher than income, that there is a need for new income sources or a need to reduce costs. If there is a balance or a surplus the financial viability of the service has become a reality. Another important comparison is between the revenue cash flow and expenditure over a short period of time. These two financial flows should be in balance if the enterprise is to receive enough money (from users for example) to pay its bills on time. It is not possible for a system to keep functioning if the revenue money is not received in time to meet bills.
Table 12: Basic financial management issues for budgeting
Financial management issues Possible options
What costs to budget for?
• Remuneration • Tools and spare parts • Small repairs only • All repairs • Extension, rehabilitation or replacement • Fuel, power, etc. • Depreciation • Initial investment
What sources of revenue should be counted?
• Regular user payments • Village funds • Voluntary contributions • Credit schemes • Government subsidy • Private sector involvement
Does the enterprise have enough revenue to cover total costs?
• Yes, there is surplus • No, there is a deficit • There is a small deficit, so there is a need to look for
alternative financial sources or to raise tariffs • There is a big deficit, so special contributions may be
considered or the project may need to be revised 2.4.2 Revenue collection The aim of organising financial flows is to ensure that resources arrive in time to guarantee sustainable functioning of the water service. For this reason it is useful to think about: • ways of presenting bills to water users, • what the billing and collection periods will be, • providing one or more places where water bills can be paid,

Key Factors for Sustainable Cost Recovery
45
• clearly identifying a person or institution who is going to collect the money, and • identifying where the income is going to be kept (in a bank account, in cash, both, etc). For effective billing, the first requirement is to know how many users the system has and who they are. This makes it necessary to register each user. A registration form must clearly identify the user, including their name, address and category (residential, commercial, industrial). It should register whether there is a meter, and if there is, record the water consumption. It should note what bills are due to be paid by that user (eg. for registration, connection or debts from a previous water bill), and the total value of the water bill for a given period of time. The second requirement is to set an appropriate tariff structure. Where there is a water meter, the tariffs should be based on water consumption. Where there is no meter, the tariff should be based on flat rate charges or on estimates of consumption through indirect indicators, such as the number of people living in a household. The most common way of billing is by producing a water bill. Whatever the system used for billing, the most important principle is clarity: bills must contain enough information for users to understand how much they have to pay and why. Once the billing system has been defined, it is necessary to determine an appropriate collection schedule. This depends on two factors: the need for cash flow to cover expenditure, and the timescale over which the users receive their own incomes. An effective system for cost recovery always considers the timing of users’ incomes and fixes collection periods accordingly. For example, in agricultural areas, the main income is probably from seasonal crops, so those farmers receive their income once or twice a year. In such communities, it is appropriate to collect money at these same longer intervals (every six months). In areas where people receive their money more frequently, the collection intervals should be shorter (monthly). It is also important to take account of the payment culture of users – are people in this community accustomed to saving up money to pay bills, or do they prefer a ‘pay as you go’ approach? The clear identification of one or more places where users can pay their bills is a key factor towards creating a `client centred service’. At the same time, having a clear agreement about who will collect the money makes control and handling easier. The point where users pay should be both easily accessible and secure, so that users can get there without spending a lot of time on it, and without taking any risks. The person or institution who is collecting the money needs to pay attention to the hours when bills can be paid, so that they take into account people’s working hours and free time. They have to create confidence amongst users, to minimise non-payment. Depending on whether metering is in use, it is possible to use the following collection systems24: Metered connections (assuming an accurate and controllable meter reading) • In many developing countries, there is one meter for several users. This is one is meant here. • After taking account of any direct bills already sent out to individual users or group of users using
the same meter, and of any connection charges already paid, the water agency sends a formal statement to a tap committee detailing its water consumption over the preceding three months and the tariff applying to this group.
• The water agency organises separate meter-reading, billing and collection for each user. With non-metered connections: • A common system is to collect user payments through home visits. • Users and communities can decide to pay their rates at regular meetings or at the office or house
of a local functionary. • A neighbourhood collection system can be introduced, by which a central collector collects the
funds from each neighbourhood.
24 Adapted from van Wijk (1989)

OP-32-E
46
Money collected has to be kept in such a way that it is available when needed by an authorised person to meet costs. Information about the use of revenue should be given to users on a regular basis. Table 13: Basic financial management issues in organising financial flows
Financial management issues Possible options
How to collect money?
- Billing and charging group of users - Collection at water point - Home visits - In meetings - Users go to a public office - Users go to the house of the treasurer
When to collect money?
- Each time a service is provided - Monthly - After harvest - Beginning of financial year - Every sixth months
Who collects the money?
- Care taker - Operator - User group - Village Water Committee - Community leaders - Staff from an institution - Treasurer
Where to keep the money?
- In a safe - In the village account - In a bank account - In a development fund - In the house of the treasurer - In an official account
2.4.3 Bookkeeping Financial administration covers the keeping of all records, documents, information and books concerned with financial and accounting aspects. A simple but reliable system of financial records can greatly improve community management. The production of records, documents and information is necessary to: • keep clear and accurate accounts about the resources needed to provide the water service, • control income and expenditure, • make decisions based on clear and accurate information, • provide information to users who are interested in checking the financial management, • maintain the confidence and trust of users. The person who is going to keep the records should be able to do the job. This means that he/she must have some financial background or must receive training. If a committee is going to keep complex records, it should be taken into account that: • the bookkeeper will need a stronger financial background; • complicated administrative procedures (which demand more stationery and equipment) cost
more; • there could be a need to train the community to improve its understanding of more complex
figures and data. The records must be clear, simple, complete and understandable: • clear, in the sense that they show the information without hiding anything; • simple, because they have to be easy to carry out and appropriate for the type of administration; • complete, in the sense that they provide enough information to make good decisions possible, and • understandable, because they have to be easy to read and understand for all users, institutions,
water committee members, and so on.

Key Factors for Sustainable Cost Recovery
47
Records will depend on the level of information that the committee wants to provide and the legal requirements of governments about water enterprises, according to size and type. In a simple administrative structure for rural or peri-urban areas the following records could be used : • user registration forms • a diary • a bank book • budgeting records. If there is a need for more in-depth information, the following additional records can be included: • an income book • an expenditure book • an unpaid account book • a record of bills to collect • a general balance. Once funds have been collected, and regular expenses have been met, any surplus is normally kept in a safe place, such as a bank account. Many communities wonder about how to use this surplus, which may lie idle in an account, while the community has great financial needs. On this point, there are two schools of thought: 1. the surplus should be used for water projects only; 2. the surplus can be used to develop other activities, provided this money is reimbursed over time. It may be advisable to propose that the community uses part of its surplus to develop income-generating activities, working on the same principle as a revolving fund, provided that an effective system is put in place for reimbursement and for sanctions on people who do not pay, and that the persons or group who manage the fund have the capacity to do so. Table 14 contains a list of useful questions to clarify some aspects of financial administration. Table 14: Basic financial issues for good financial administration
Financial management issues Possible options
How is expenditure and income recorded?
- Log book - Daily journal - Bank book - Bookkeeping - Bank statements
Who administers the funds? Men or women
- The Committee Treasurer - A village accountant - Bank accountant - Community leaders
What are funds used for?
- Payment of expenditures related to O&M of water point
- Payment of total cost - Generating bank interest - Profit rate - Use for other development projects
Who authorizes payments?
- Operator - Treasurer - Water Committee - Village leaders - Assembly of users
Source: van Wijk (1989)

OP-32-E
48
2.4.4 Financial control and monitoring Making the management organisation accountable to users is important factor in sustaining services. This includes transparent financial management, and regular reports and accounts to community meetings. Effective control and monitoring is an on-going, regular necessity as part of financial management. This relies on accurate information, which will be mainly found in the records and books kept by the community. Control and monitoring are effective if they use clear, reliable, impartial and good quality information as a starting point. One way to be impartial is to establish a supervision committee to audit the accounts once a year. This committee should include members of the community. Sound control and monitoring includes the use of indicators that provide a good overview of what is happening, without the possibility of misunderstanding or manipulation. The final objective of control and monitoring is to inform users about the financial situation of the water supply service. Control and monitoring has three stages: 1. developing indicators and checking and analysing information, 2. presenting information to users, 3. discussing information and decision making. Example of some indicators: • Monthly revenue: shows the capacity to recover costs (should be greater than 1); • Monthly expenditure • Payment received: shows the rate of payment and therefore of non-payment; • Payment due • Average O&M cost per user: can be compared with the average tariff paid; • Level of expenditure per category : can help to detect abnormal expenditures.
Defaulting is common in most rural and peri-urban areas, and enterprises have implemented various measures to control and reduce this. Introducing educational programs to inform users and make them aware of the need to pay on time is always a good strategy. However, when educational programs do not work there is the need to implement other measures. Some of the strategies used in developing countries against defaulting were: • In the Dominican Republic, commercial agents were hired, each one responsible for 15 piped
water supplies. Agents audit the books with treasurers, collect loan repayments and accompany the treasurer on home visits to households whose payment is in arrears.
• In Honduras, users of a group, yard or house connections related to a rural water supply pay a safety margin of up to 100% of their monthly bill to cover defaulters., a sort of advance payment for the next month
• In Guatemala, names of debtors have been announced in the general meetings of the community. • Users’ group in Malawi have to maintain a safety credit with the water agency of up to a
maximum of 120% of their monthly group rate. In other cases payment in advance is encouraged through a small reduction on the user rates.
• In Colombia, the rural supply piped water programme used a simple record to register household contributions, which everyone understands and sees. This makes easy to identify families lagging behind and creates a certain degree of competition between households.

Key Factors for Sustainable Cost Recovery
49
Table 15: Financial management issues and possible options Financial management issues Possible options
What type of financial control?
− Receipts from book-keeping − Regular meetings of water committee − Double signature required to pay our from funds − Feed back to users − Cross-checking bill against meter reading − Cross-checking against bank statements − Registered auditors
How to monitor?
− Use log book − Make a quarterly review and overview of the situation on
expenditures, incomes, % of people who do not pay − Establish an independent committee to check accounts − Use indicators
How to inform users?
− Regular meetings of users − Annual meetings − Notice boards; leaflets − House to house visits − Through newspaper or radio reports
What to do with bad payers ? Particularly crucial if they include influential members of society or
public institutions.
− Analyse reasons for bad payment − Improve service − Improve relationship with the users − Campaign to increase awareness of benefits of prompt
payment − Reschedule debt − Introduce sanctions or cut-off supplies
2.5 Service efficiency Service efficiency is the direct outcome of appropriate management and is therefore a key factor in user satisfaction, willingness to pay and effective cost recovery. Efficiency implies good performance from a service that provides the best benefits/outputs for a minimum cost. 2.5.1 Performance Achieving a good performance does not mean only looking at all possible ways to reduce costs, but rather involves looking for ways to get the most benefits and best results at a cost people can afford. The difference is significant, because in the first case, the priority is given to costs, while in the second priority is given to benefits at a given cost. Appropriate management capacity and skills are necessary to run a service efficiently. Crucial skills include all those linked to budgeting, organising bills, collecting and recording expenses or revenue, monitoring, and applying sanctions. An assessment of the management capacity of the community is therefore crucial. If capacity building activities are too complex to organise for a given technology, it might be necessary to consider another technology that requires fewer management skills. A high level of unaccounted for, or non-revenue, water is an indicator of poor efficiency. According to WASH (1991) “Unaccounted for water is the difference between the volume of water produced or delivered into the network and the volume of water consumed, whether metered or not”. Many factors can produce unaccounted for water: leakage, wastage, fraud, illegal tapping, inaccurate meter readings, poor billing, and poor identification of payment centres. These factors are not only of a physical nature, but also administrative, and hence are strongly related to the managerial practices of the organisation running the service. Levels of unaccounted for water can be as high as 30% to 50%. According to WHO (1994), control of unaccounted for water is a result of efficient management, which helps the organisation managing the service to attain its objectives at the lowest cost. A programme to reduce levels of unaccounted for

OP-32-E
50
water must not only address faults, but also investigate their causes and ways to reduce them. Such a programme can be composed of the following elements: • reducing water losses to a minimum, • meeting additional demand from water made available from reducing losses (with possible
benefits for fringe areas), • ensuring that the water supply system functions as efficiently as possible for as long as possible, • increasing the useful lifetime of facilities, having an impact on O&M and replacement costs, • distributing water to as many users as possible, and ensuring that costs are minimised, • minimising the cost of production and distribution of water, • improving the billing and collection system. The problem of unaccounted for water can be reduced by involving communities in identifying sources of wastage or leaks and promoting the benefits of conservation and the rational use of water. 2.5.2 Improving relationships with users/consumers One of the possible constraints on cost recovery is the poor relationship between users and organisations managing the water service. This is partly due to lack of information on both sides, but is mainly because organisations do not consider the users as customers. The traditional approach has been to ”estimate” users’ needs, provide a level of service considered of good enough quality and then expect the users to pay. Organisations, including village committees, do not sufficiently understand (until they start suffering from financial problems) how users’ opinions and user satisfaction play a major role in defining service levels and willingness to pay. The link between users and the water committee relies on a proper flow of information on both sides. Consumers and community organisations managing and operating a water supply service each have to be aware of their rights and obligations. Consumers have the right to receive a good service and to be informed about its quality (pressure, quantity, tariffs structures, changes to tariffs, financial aspects, contracts, etc.), and also have an obligation to pay for the service according to their ability to pay. Community organisations have an obligation to deliver those rights to users and to manage and operate the system in an efficient way. Organisations should also use information from users as feedback to improve the level of service above the basic requirement. There are some questions organisations can ask themselves to address the minimum conditions for optimising the relationship between a water committee and the community. • Does the committee give users full information about the water service? • Does the committee have a mechanism for informing users about levels of service and costs? • Does the committee know user opinions and satisfaction levels with the level of service? • Does the committee have a mechanism to address consumers’ complaints? • Is the committee taking into account users’ complaints and suggestions? • Does the committee have indicators that measure the quality of the service? Improving the communication process should not be the only objective of a water committee. Such committees also have to consider users as customers and to promote the benefits of the service they provide. Social marketing is a potential tool for improving communication between users and a committee but the main idea behind this approach is to consider users as customers. As Yakubu (1997) pointed out, marketing and “total customer service” can be effective ways to recognise customer needs and to stimulate their willingness to pay. The combination of WTP studies alongside with social marketing techniques is a possible way to improve the relationship between users and enterprises, contributing to improved WTP and a higher level of cost recovery.

Key Factors for Sustainable Cost Recovery
51
Annexes

OP-32-E
52
Annex 1: Example of tariff calculation for a handpump (flat rate) a) Brief description In this example, the handpump can reach a depth of between 15-45 m. Water delivery yield is 0.30 l/s and the handpump is used by a rural community of 250 inhabitants. The majority of beneficiaries are poor and they have a water committee to manage the service. The handpump is operated by users and maintained by a caretaker. When necessary, the water committee hires a mechanic to perform major repairs. The costs are the following: Investment costs include construction costs, equipment, tools, spare parts and the drilling of the well. The main parts of the handpump are the cylinder, plunger, footvalve and pumping head (construction costs). All of these parts have a life cycle of about 10 years with proper maintenance. The equipment, tools and spare parts include: buckets, broom, brush, lubricator, spanner, screwdriver, wrench, knife, pipe threader, tackle, trowel. These tools have to be replaced every year. A private contractor does the drilling of the well. Investment cost for a deep well handpump Type of cost Value in US$ Construction costs 2000 Equipment, tools and spare parts 500 Drilling 1000 Total investment costs cost 3500
Recurrent costs include the maintenance of the handpump and the administrative tasks for the management of the system. The former includes payment of caretaker wages, the purchase of tools (bucket, spanners, wrench, trowel, screwdriver, etc), materials (grease, paint, uniform, gravel sand, cement) and spare parts (nuts, bolts, cupseals, bearings, main tubing, threads, pipe threads), and payments for a mechanic to perform major repairs. Once a year a private contractor does a maintenance service on the well to keep it functioning in a proper manner. The treasurer of the water committee manages the system. He does not receive a salary, but receive a commission. Expenditure on administrative tasks is low because bills are written by the treasurer on a simple sheet and he collects the money at his home. The treasurer delivers bills at the handpump site and does the bookkeeping every week. The total time the treasurer allocates to the system is four hours every day. Recurrent cost for one year Type of cost Value Maintenance Wage (caretaker) 150 Tools 10 Materials 40 Spare parts 100 Mechanic (big repairs) 150 Private contractors (maintenance of the well) 50 Total Maintenance 500 Management Commission (treasurer) 100 Paper 50 Unforeseen expenses 50 Total Management 200 Total recurrent cost 700
Future investment costs. In order to increase the capacity of the system for the growing number of users, an additional well will need to be drilled in ten years time. The main parts of the well will require replacement, also in ten years.

Key Factors for Sustainable Cost Recovery
53
b) Tariff calculation Basic information on yearly costs: Investment cost = US $3500 Functioning cost per year = US $700 Approximation of replacement-extension costs = 25% of functioning costs = 25% * 700 = US $200 Funds for the recovery of investment costs (RIC) = estimated 10% investment cost = 10% * 3500 = US $350 Depreciation25 = Cost (equipment, facilities, construction, buildings) / life cycle = 2000 / 10 = US $200 Provision for risk and inflation26 = 15% * depreciation = 15% * 200 = US $35 Minimum tariff (covering O&M and basic management costs)
Basic Tariff = Functioning costs per month = 700/12 = 67 = 0.27 US$ per user / month
Number of users 250 250
Real cost tariff (covering all costs)
Real Cost Tariff = Functioning costs + replat & ext. costs + RIC + Depreciation + provision for risk and inflation Number of users = (700/12) + (200/12) + (350/12) + (200/12) + (35/12) = 0.53 US$ per user / month 250
25 In this case, the depreciation affects only the main parts of the handpump (construction cost), because the equipment
(tools etc.) is replaced every year. The formula for calculating depreciation is therefore simple. 26 Provisions for risk and inflation include an annual rate of 5% for risk and 10% for inflation.

OP-32-E
54
Annex 2: Example of tariff calculation for a piped system with treatment (Metered graded rates)
a) Description A rural community in Colombia, is supplied with water and a Multi Stage Filtration System for the treatment of water, which produces drinking water for 500 users, all of them with private taps. The water service is continuous and drinking water reaches the parameters required by the Colombian law. The community manages the system through a water committee, which hired one person of the community with moderate educational level to manage the service. An operator and caretaker operate and maintain the system. The community, which is responsible for the most important decisions, elects the water committee. The costs of the water supply system are assessed for 30 years, using a discount rate of 12%. The costs are as follows (in Colombian currency of 1996): Investment costs are the initial costs and include construction of infrastructure, land, equipment, pre-feasibility studies and so on.
Initial Investment Costs (IIC) (pesos 1996) Intake 170,905.00
Sand Trap 4,533,619.00
Raw Water Main 7,363,188.00
River Crossings 8 6,414.00
Sedimentation 16,435,600.00
Upflow Roughing Filter 19,514,075.00
Dynamic Roughing Filter 7,595,377.00
Slow Sand Filter 59,071,822.00
Drainage 893,653
Water Storage Tank 26,766,841
Distribution Network 37,748,853
Water Storage Tank 2-3 7,500,000
Sand Storage 7,000,000
Design 7,000,000
Metering 91,000,000
TOTAL 292,600,347
Recurrent costs include operation, maintenance and management costs. Operation and maintenance costs are related to the functioning of the technical components of the system, and include wages for the operator and caretaker, salaries for outside experts (for example to resand filters), payments for water quality analysis, materials for minor repairs, expenditure on inputs, etc.

Key Factors for Sustainable Cost Recovery
55
Operation and Maintenance Costs (pesos 1996)
1. TOTAL EXPENDITURE IN WAGES AND SALARIES
6,076,860 1.1 Operator (1)
2,160,000 1.2 Social security (2)
471,312 1.3 Tax 3)
585,900 1.4 Caretaker (4)
1,920,000 1.5 Social security (5)
418,944 1.6 Tax
520,704 2. Outside experts (6)
180,000 3. Chemicals (7)
960,000 4. Minor repairs and maintenance (8)
240,000 5. Equipment and spare parts (9)
120,000 6. Clothing (10)
120,000 7. Water quality analysis
500,000TOTAL OPERATION AND MAINTENANCE EXPENDITURE 8,196,860 (1) Monthly salary $180.000 (2) It is 21.82% of monthly salary
(3) 27% of monthly salary (4) Monthly salary $160.000
(5) 21.82% of monthly salary (6) Hired for especial tasks, for example resanding filters (7) Chlorine $ 80.000 / month (8) $20.000/ month (9) $50.000/ month (10) $20.000/ month in uniforms for operator and caretaker
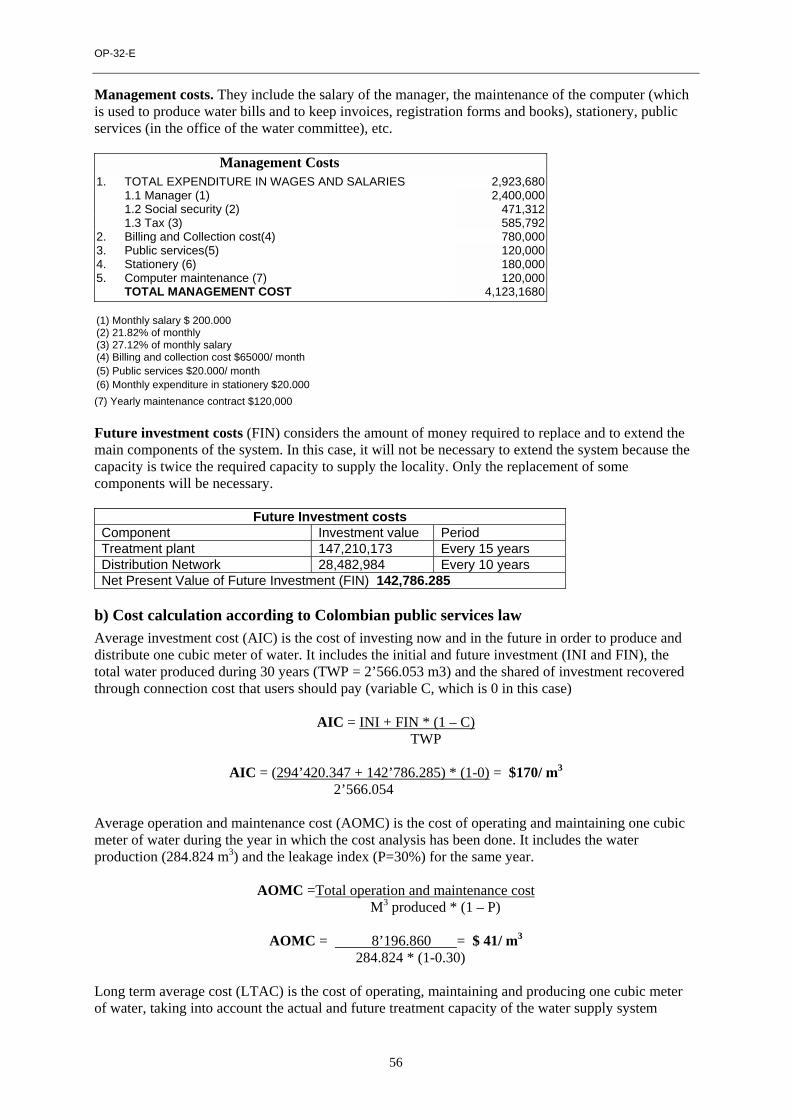
OP-32-E
56
Management costs. They include the salary of the manager, the maintenance of the computer (which is used to produce water bills and to keep invoices, registration forms and books), stationery, public services (in the office of the water committee), etc. Management Costs
1. TOTAL EXPENDITURE IN WAGES AND SALARIES 2,923,680 1.1 Manager (1) 2,400,000 1.2 Social security (2) 471,312 1.3 Tax (3) 585,7922. Billing and Collection cost(4) 780,0003. Public services(5) 120,0004. Stationery (6) 180,0005. Computer maintenance (7) 120,000 TOTAL MANAGEMENT COST 4,123,1680 (1) Monthly salary $ 200.000 (2) 21.82% of monthly
(3) 27.12% of monthly salary (4) Billing and collection cost $65000/ month (5) Public services $20.000/ month (6) Monthly expenditure in stationery $20.000 (7) Yearly maintenance contract $120,000 Future investment costs (FIN) considers the amount of money required to replace and to extend the main components of the system. In this case, it will not be necessary to extend the system because the capacity is twice the required capacity to supply the locality. Only the replacement of some components will be necessary.
Future Investment costs Component Investment value Period Treatment plant 147,210,173 Every 15 years Distribution Network 28,482,984 Every 10 years Net Present Value of Future Investment (FIN) 142,786.285
b) Cost calculation according to Colombian public services law Average investment cost (AIC) is the cost of investing now and in the future in order to produce and distribute one cubic meter of water. It includes the initial and future investment (INI and FIN), the total water produced during 30 years (TWP = 2’566.053 m3) and the shared of investment recovered through connection cost that users should pay (variable C, which is 0 in this case)
AIC = INI + FIN * (1 – C) TWP
AIC = (294’420.347 + 142’786.285) * (1-0) = $170/ m3
2’566.054 Average operation and maintenance cost (AOMC) is the cost of operating and maintaining one cubic meter of water during the year in which the cost analysis has been done. It includes the water production (284.824 m3) and the leakage index (P=30%) for the same year.
AOMC =Total operation and maintenance cost M3 produced * (1 – P)
AOMC = 8’196.860 = $ 41/ m3 284.824 * (1-0.30)
Long term average cost (LTAC) is the cost of operating, maintaining and producing one cubic meter of water, taking into account the actual and future treatment capacity of the water supply system
Key Factors for Sustainable Cost Recovery
57
LTAC = AIC + AOM
LTAC = 170 + 41 = $211/ m3 Average management cost (AMC) is the cost of guaranteeing the availability of the service to users. It includes the total management cost and the total number of users during the year in which the analysis is done.
AMC = Total management cost Number of users
AMC = 4’297.104 = $8611/user-year, 8611 = $718/user-month
499 12 c) Tariffs according to Colombian Public Services Law27 Information required Classification of users by strata28
Strata 1 = 169 users Strata 2 = 297 users Strata 3 = 163 users Official = 10 users Commercial and Industrial = 24 users
Consumption ranks Basic consumption to satisfy the basic needs of a family, fixed at 20 m3/user a month Complementary consumption is the consumption between 20 m3 to 40 m3/user a month. Luxury consumption is consumption above 40 m3. Subsidies and extra-charges according to consumption ranks and strata Strata 1 50% subsidy for fixed charges and basic consumption Strata 2 40% subsidy for fixed charges and basic consumption Strata 3 15% subsidy for fixed charges and basic consumption Official Does not receive any subsidy and does not pay any surcharge Industrial & Commercial Surcharge of 20% over all consumption ranks Charges Fixed charge (FC): this is the amount of money that users have to pay without considering their water consumption. It is to guarantee the current availability of service.
FC = AMC * SUB, where SUB is the factor of subsidy or extra-charge per strata, For our case the fixed charges are: FC1 = 718 * 0.5 = 359 FC2 = 718 * 0.6 = 431 FC3 = 718 * 0.85 = 610 FC official = 718 FC ind-com = 718 * 1.20 = 862 Basic charge (BC) is the price for consumption between 0-20 m3 and its calculation is: BC = LTAC * SUB, where SUB is the factor of subsidy or extra-charge per strata
In this case basic charges are: BC1 = 211 * 0.5 = 105 27 Tariffs and cost have been calculated according to the legal framework of the water supply service. 28 In Colombia, the Public Services Law (142/1994) established the classification of residential users into 6 strata
according to socioeconomic conditions. The poorest are classified as strata 1 and richest as an strata 6. Industries and institutions are classified as industrial and official users, respectively.

OP-32-E
58
BC2 = 211 * 0.6 = 127 BC3 = 211 * 0.85 = 179 BC official = 211 BC ind-com = 211 * 1.20 = 253 Complementary charge (CC) and luxury charge (LC): the former is the price charged for consumption between 20 and 40 m3 and the latest is the price for consumption over 40 m3. CC1,2,3 and official = LTAC = 211 CC ind-com = LTAC * 1.20 = 253 LC1,2,3 and official = LTAC = 211 LC ind-com = LTAC * 1.20 = 253 Monthly tariff The calculation of tariffs should be done using the formula:
T = FC + BC * consumption (m3/month) + CC * consumption (m3/month) + LC * consumption (m3/month) If each user consumes 45 m3/ month, the total tariff (in Colombian pesos) would be:
TS1 = 359 + (105 * 20) + (211* 20) + (211 * 5) = 7734 pesos TS2 = 431 + (127 * 20) + (211* 20) + (211 * 5) = 8,246 pesos TS3 = 610 + (179 * 20) + (211* 20) + (211 * 5) = 9,465 pesos
TS official = 718 + (211 * 20) + (211 * 20) + (211 * 5) = 10,213 pesos TS ind-com = 862 + (253 * 20) + (253 * 20) + (253 * 5) = 12,247 pesos

Key Factors for Sustainable Cost Recovery
59
Annex 3: Format of a water service bill
WATER SERVICE BILL
User name: Address:
Type of user: Date:
User code: Meter No.:
Water consumption (m3)
Actual Previous Average Month 1 Month 2 Month 3
Price per cubic meter
Fixed charge Basic consumption Another consumption
Tariffs for water consumption Other payments
Fixed charge (1) Bills (7)
Basic consumption (2) Registration (8)
Another consumption (3) Connection (9)
Total value (4=1+2+3) Fines (10)
Subsidy (5) Meter (11)
Interest (12)
Others (13)
Net payment for consumption (6=4-5)
Total Other payments
(14= 7+8+9+10+11+12+13)
TOTAL BILL AMOUNT (15=6+14)
DATE OF PATMENT TO RECEIVE DISCOUNT
LATEST DATE OF PATMENT

OP-32-E
60
Annex 4: Format for budgeting
Description Amount Amount INCOME EXPENDITURE Tariffs Personnel - Fixed Charge - Salaries - Consumption - Social security - Connection - Holidays - Training Registration - Transport Interest Fines Raw materials Reconnection - Chemicals - Spare parts Other Contributions - Power - Central government - Tools - Municipality - Donors Rent - NGOs Stationery - Other Institutions Public services Furniture Equipment Computers Interest Loan repayment Insurance
TOTAL INCOME TOTAL EXPENDITURE

Key Factors for Sustainable Cost Recovery
61
Annex 5: Forms for bookkeeping, financial administration and control and monitoring INCOME BOOK
Date Description Type of income Amount Balance Tariffs Fines Interest Registration Other Cash Kind Check
EXPENDITURE BOOK Date Description Type of expenditure Amount Balance
Operation Maintenance Management Investment Other Cash Kind Check
DIARY BOOK Date Description Income Expenditure Amount

OP 32-E
62
BANK BOOK
Date Description Draw Deposit Amount Balance Cash Cheque Cash Cheque
UNPAID ACCOUNT Date Description Amount Payment Balance Date of next payment
OUTSTANDING BILLS Date Description Amount Payment Balance Date of next charge

Key Factors for Sustainable Cost Recovery
63
BALANCE SHEET
ASSETS LIABILITIES CASH Cash Providers Banking account Contractors DEBTS Subsidy Outstanding bills Other Others STAFF COST INVENTORY Salaries and social security Raw materials Spare parts and tools TOTAL LIABILITIES BUILDINGS, SCHEME AND EQUIPMENT
Land Buildings PATRIMONY Treatment plant Capital investment Pipe lines Accumulated profit Machinery Profit over period Equipment Valuation Furniture TOTAL PATRIMONY Computers Depreciation (cr) TOTAL ASSETS TOTAL LIABILITIES AND
PATRIMONY

OP 32-E
64
Annex 6: Example of a behaviour study This study was developed in two stages. In 1988, families in Kerala State in India were surveyed about their willingness to pay for household connections to a piped water supply system and to establish future trends in their behaviour, using the Contingent Valuation Method. In 1991, the same families were surveyed again, observing their actual behaviour, to see if they behaved as they said they would (benefit revelation), and to ascertain the accuracy of the predictions. 1988 study: contingent valuation In both A and B communities, households were asked about their willingness to pay if the reliability of the service was improved. The bidding game was used to estimate WTP of the head of the household. The results were: • Monthly tariff and connection costs were determinants of WTP. An increase of 10 rupee in the
monthly tariff would cause a fall of 27% in the probability that a family would connect: while the same increase in the connection cost would cause a probability decline of 82%.
• The decision to connect had a positive correlation with high income levels, assets and schooling. • Families living in water scarce zones were probably more willing to connect than those living in
water abundant zones • A more reliable service was an important factor for those who were connected at the time of the
survey. It was not an issue for those who were not connected. 1991 study: actual behaviour This study tried to re-survey the same families of the 1988 study. There was a sample change by which they lost 25 of 200 households in B communities. However, the change affected all income groups equally, and the survey retained the original income distribution. Criteria used to establish the validity of predictions were: • The right proportion of connectors, without considering if the behaviour of the families was
accurately described • Analysis of whether families behaved as they said they would, considering three elements:
1) the proportion of the sample whose actual behaviour was correctly predicted (gross accuracy), 2) the proportion of those families who connected, whose decision was correctly predicted (specificity), 3) the proportion of families who said would not connect, and did not (sensitivity).
To answer to these questions the authors of the study compared the results of both 1988 and 1991 studies. The most important results were: • 14.9% of the families did connect (22/148), while the authors’ predictions said that 14.2 % of the
families would connect. The prediction was accurate. • 91% of the families ((15+120)/148) behaved as they said they would (gross accuracy). • The percentage of those predicted to connect who actually did connect was 71% (15/22)
(specificity). • 94% of those predicted not to connect (120/127) did not connect (sensitivity). • 75% of non-connectors indicated inability to pay the connection cost as the first reason for not
connecting. The authors predicted in 1988 that this would be the most important reason for non-connectors.
• All the families who had connected in 1991 were dissatisfied with the reliability of the system, while only 13% of non-connectors gave this as a reason for their decision not to connect.
Benefit Transfer The study tried to predict the behaviour of the families in type B communities in water scarce zones by using behavioural models to extrapolate from results in type A communities with the same problem (water scarcity). Although the communities are similar the results were disappointing, and the use of behavioural models to predict behaviour in B communities gave completely inaccurate results. For example, authors predicted that 76% of families in sites B would connect while only 16.6% of them

Key Factors for Sustainable Cost Recovery
65
did so). Gross accuracy was 41%, the accuracy of predicting connectors was 22% (specificity) while the sensitivity of predicting non-connectors was 100%. In conclusion, the contingent valuation method predicted accurately the behaviour of users and was shown to be a useful tool for this kind of studies. The benefit transfer technique produced inaccurately results and its usefulness is limited by possible differences between communities, even though similar.
OP 32-E
66
Annex 7: Bibliography Abugre, C. (1993). ‘When credit is not due to-financial services by NGO’s in Africa’. In: Small enterprise development, vol. 4, no. 4. Baldwin, G. (1983). ‘Why present value calculations should not be used in choosing rural water supply technology’. In: World development, vol 11, no. 12, p. 1075-1081. Bates, T. and Wyatt, A. (1988). The operation and maintenance of water supply systems in developing countries : a cost study. Rev.ed. Arlington, VA, USA: Water and Sanitation for Health Project.. by Kristin Komives and Linda Stalker Prokopy. (2000). Cost recovery in the Focus Projects : results, Attitudes, Lessons and Strategies (Draft). Research and Surveys series. BDP (Business Partners for Development - Water and sanitation Cluster) London, UK. Brikké, F. et al. (2001). Linking technology choice with operation and maintenance for low cost water supply and sanitation. Delft, The Netherlands, IRC International Water Supply and Sanitation Centre. Briscoe, J. et al. (1990). ‘Toward equitable and sustainable rural water supplies : a contingent valuation study in Brasil’. In: World Bank economic review, vol. 4, no. 2: 115-134.. Briscoe, J. et al. (1991). Rural water supply in Kerala, India : how to emerge from a low-level equilibrium trap. Washington, DC, USA, World Bank. Briscoe, J. et al. (1995). ‘Contingent valuation and actual behavior : predicting connections to new water systems in the state of Kerala, India’. In: World Bank economic review, vol. 9, no. 2, 373-395. Brookshire, D.and Neill, H. (1992). ‘Benefit transfers : conceptual and empirical issues’. In: Water resource research, vol. 28, no. 3, p. 651-655. Calorama (1995). Handpumps. Elburg, The Netherlands, Calorama Rural Development Service. (Low cost water supply series; no. 4) CAPRE and ANDESAPA (1996). Análisis del agua no contabilizada en sistemas de agua potable (Bajo el marco del proyecto de promoción CAPRE, ANDESAPA y sus miembros). Collignon, B and Allely, D. (1994). La gestion du service de l’eau dans les centres secondaries du bassin du fleuve Sénégal.. Paris, France, Programme Solidarité Eau Editions du Gret. (Collection études et travaux). Coyaud, D.P. (1988). Private and public alternatives for providing water supply and sewerage services. Washington, DC, USA, World Bank. (Infrastructure and urban development report; no. INV 31) Comisión de Regulación de Agua Potable y Saneamiento (1995). Resoluciones varias sobre costos y tarifas. Bogotá, Colombia, Comisión de Regulación de Agua Potable y Saneamiento. Director of the Rural Water Supply Namibia (1998). Namibia rural water supply strategy papers. Windhoek, Namibia, Director of the Rural Water Supply Namibia. Evans, P. (1992). Paying the piper. The Hague, The Netherlands, IRC International Water and Sanitation Centre. (Ocasional paper 18). Franceys, R. (1999). Strategic management and public private partnership module. Unpublished lecture notes on SUM and UIM Course. Delft, The Netherlands, IHE.

Key Factors for Sustainable Cost Recovery
67
Hofkes, E.H. (1983). Handpump maintenance : guidelines for organizing handpump maintenance systems. The Hague, The Netherlands, IRC International Water and Sanitation Centre. IRC (1989). Cost-recovery of village water supplies : a training guide for community development assistants. The Hague, The Netherlands, IRC International Water and Sanitation Centre. IRC (1997). Water resources management in rural areas: the role of institutional development. The Hague, The Netherlands, IRC International Water and Sanitation Centre. (Draft Occasional Paper). IWSA (1986). How to work in water supply: finance and billing and collection. London, UK, IWSA. IWSA (1986). How to work in water supply: finance and budgeting and control. London, UK, IWSA. IWSA (1987). How to work in water supply: finance and financial administration. London, UK, IWSA. Katko, T. (1989). The role of cost recovery in water supply in developing countries. Tampere, Finland, Tampere University of Technology. (Publication series A; no. 41). Katko, T. (1990). ‘Cost recovery in water supply in developing countries’. In: International journal of Water resource development, vol 6, no. 2, p. 86-94 Katko, T. (1991). Paying for water in developing countries. Tampere, Finland, Tampere University of Technology. Levine, H. (1990). Cost effectiveness: a primer. London, UK, SAGE Publications. (New perspectives in evaluation; vol. 4). Lundvist, J. (1992). Water scarcity in abundance : management and policy challenges. Ecodecision. SIDA, Stockholm, Sweden. Ministerio de Desarrollo Económico Colombia (1998). Servicios sostenibles de agua y saneamiento: marco conceptual. Bogotá, Colombia, Ministerio de Desarrollo Económico. OECD (1985). Cost recovery objectives and project experience in world bank-assisted water supply operations. Paris, France, Organization for Economic Co-operation and Development. OECD (1987). Pricing of water services. Paris, France, Organization for Economic Co-operation and Development.. Okun, D. and Zaroff, B. (1984). ‘Water vending in developing countries’. In: Aqua, vol. 33, no. 5, p. 289-295. PAHO (1976). Tariff manual for rural water supplies. Tegucigalpa, Honduras, Panamerican Health Organization. Palmer, I. (1998). Mvula Trust: an independent approach to rural water supply and sanitation in South Africa. UNDP-World Bank Conference. Washington, DC, USA. Pérez, M. (1996). ‘Financiación comunitaria’. In: CINARA and IRC. Curso taller internacional sobre gestión para la sostenibilidad de proyectos de abastecimiento de agua y saneamiento, Cali, 15 al 26 Abril. Cali, Colombia, CINARA.
OP 32-E
68
Pérez, M. (1997a). ‘Elementos para una política tarifaria en el sector de abastecimiento de agua y saneamiento en la zona rural’. In: Curso taller internacional gestión para la sostenibilidad en programas de abastecimiento de agua y saneamiento, Cali, 22 Sep-3 Oct 1997. Cali, Colombia, CINARA. Pérez, M. (1997b). ‘La gestión comunitaria en la prestación de servicios de abastecimiento de agua y saneamiento’. In: Curso taller internacional estión para la Sostenibilidad en programas de abastecimiento de agua y saneamiento, Cali, 22 Sep-3 Oct 1997. Cali, Colombia, CINARA. Pérez, M. (1997). ‘Recuperación de costos y financiamiento comunitario’. In: Curso taller internacional gestión para la Sostenibilidad en programas de abastecimiento de agua y saneamiento, Cali, 22 Sep-3 Oct 1997. Cali, Colombia, CINARA. Reiter, E. (1986). ‘Water meters and metering : the state of the art and future developments’. In: Aqua, vol. 35, no. 5, p. 255-258. Rogers, P.; Bhatia, R. and Huber, A. (1998). Water as a social and economic good : how to put the principle into practice. Stockholm, Sweden, Global Water Partnership. (TAC Background papers; no. 2). Rubinstein, J. (1999). The Venezuelan experience : successful tariff structure in Caracas 1993-1999. Paper presented in Special GWP seminar in water pricing, Stockholm August 1999. Serageldin, I. (1994). Water supply, sanitation, and environmental sustainability : the financing challenge. Washington, DC, USA, The World Bank. (Directions in development) Tchaptche, C and Brikké, F (1995). Le micro-crédit pour l’eau et l’assainissement.. The Hague, The Netherlands, IRC International Water and Sanitation Centre. (Série de documents occasionnels; no. 28). Tjen-A-Kwoei, H. (1986). Revenue collection for piped water supply systems : serving rural and low-income communities. The Hague, The Netherlands, IRC International Water and Sanitation Centre. UNCHS (HABITAT) (1980). Human settlements finance and management. Nairobi, Kenya, United Nations Centre for Human Settlements (Habitat). (Occasional Papers). Vaidya, C. (1994). Demand and willingness to pay for urban water and sanitation services in Baroda. (Study sponsored as a part of research cycle by HSMI, HUDCO). New Delhi, India, Community Consulting International. Vaidya, C. (1995). Urban poor's willingness to pay for water and sanitation services : a case study. New Delhi, India, Community Consulting International. WASH (1988a). Estimating operations and maintenance costs for water supply systems in developing countries. Arlington, VA, USA, Water and Sanitation for Health Project. (WASH technical report; no. 48). WASH (1988b). Water vending and development : lessons from two countries. Arlington, VA, USA, Water and Sanitation for Health Project. (WASH technical report; no. 45). WASH (1991). Principles of tariff design for water and wastewater services. Arlington, VA, USA, Water and Sanitation for Health Project. (WASH field report; no. 348). WASH (1993). Helping communities manage their water finances : a manual for extension personnel working in rural or peri-urban communities. Arlington, VA, USA, Water and Sanitation for Health Project. (WASH technical report; no. 93).

Key Factors for Sustainable Cost Recovery
69
Whittington, D. et al. (1989). Willingness to pay for water in Newala District, Tanzania : strategies for cost recovery. Arlington, VA, USA, Water and Sanitation for Health Project. ( WASH field report; no. 246). Whittington, D. et al. (1990). Cost recovery strategy for rural water delivery in Nigeria. Washington, DC, USA, World Bank. (Policy, research, and external affairs working papers urban development; no. 369). Whittington, D., Altaf, M. and Jamal, H. (1992). Willingness to pay for water in rural Punjab, Pakistan. Washington, DC, USA, UNDP- World Bank Water and Sanitation Program. (Water and sanitation repor;, no. 4). Whittington, D. (1998).’ Administering contingent valuation surveys in developing countries’. In: World development, vol. 26, no. 1, p. 21-30. WHO (1988a). Managerial and financial principles for water supply and sanitation agencies : report of the fourth consultation on institutional development : Working Group on Cost Recovery, Geneva, 21-25 November 1988. Geneva, Switzerland, World Health Organization. WHO (1988b). Draft guidelines on cost recovery in community water supply and sanitation : report on the third informal consultation on institutional development, Geneva,11-15 April 1988. Geneva, Switzerland, World Health Organization. WHO (1990). Handbook of financial principles and methods. Geneva, Switzerland, World Health Organisation. Wijk - Sijbesma, C. van (1989). What price water? : user participation in paying for community-based water supply. The Hague, The Netherlands, IRC International Water and Sanitation Centre. (Occasional paper series; no. 10). Wijk - Sijbesma, C. van (1991). Community financing and financial management. The Hague, The Netherlands, IRC International Water and Sanitation Centre. Wilson, H. (1988). Costs and financing of water supply and sanitation activities. New York, NY, USA, UNICEF. Winpenny, J. (1994). Managing water as an economic resource. London, UK, Routledge. WHO and Zambia Department of Water Affairs (1989). Sub-regional working group meeting on cost recovery and resources coverage : Mongu, Western Province, Zambia, 30 January - 3 February 1989 : working group report. Lusaka, Zambia, Zambia, Department of Water Affairs. World Bank (1983). Tariffs for water and sanitation services. Draft. Washington, DC, USA, World Bank,Transportation and Water Department. World Bank (1985). Tariff analysis. Washington, DC, USA, World Bank. World Bank (1986). World Bank policy on cost recovery in water supply. (Annex A). Washington, DC, USA, World Bank. World Bank (1998). ‘Innovative financing session overview’ In: Water and Sanitation Program. Community water supply and sanitation conference , the World Bank, Washington DC, May 5-8, 1998 : proceedings. Washington, DC, USA. World Bank. P. 22. World Bank (1999a). Making subsidies work harder. Paper presented at the 1999 Water supply and sanitation forum. Washington, DC, USA, World Bank.

OP 32-E
70
World Bank (1999b). Allocating and mitigating risk to mobilize financing. Paper presented at the 1999 Water supply and sanitation forum. Washington, DC, USA, World Bank. World Water (1988). ‘Ghana’s tariffs have mixed effects’. In: World Water; vol. 11, no. 7, p. 32-35. World Water (1986). ‘How users can contribute to rural schemes’. In: World Water; vol. 9, no. 9, p. 14-21. Yacubu, N. (1997). Water supply services: Keduna State Nigeria. Loughborough, UK, Loughborough University.

Key Factors for Sustainable Cost Recovery
71
IRC International Water and Sanitation Centre IRC facilitates the sharing, promotion and use of knowledge so that governments, professionals and organisations can better support poor men, women and children in developing countries to obtain water and sanitation services they will use and maintain. It does this by improving the information and knowledge base of the sector and by strengthening sector resource centres in the South. As a gateway to quality information, the IRC maintains a Documentation Unit and a web site with a weekly news service, and produces publications in English, French, Spanish and Portuguese both in print and electronically. It also offers training and experience-based learning activities, advisory and evaluation services, applied research and learning projects in Asia, Africa and Latin America; and conducts advocacy activities for the sector as a whole. Topics include community management, gender and equity, institutional development, integrated water resources management, school sanitation, and hygiene promotion. IRC staff work as facilitators in helping people make their own decisions; are equal partners with sector professionals from the South; stimulate dialogue among all parties to create trust and promote change; and create a learning environment to develop better alternatives. IRC International Water and Sanitation Centre PO Box 2869 2601 CW Delft The Netherlands Tel: +31 (0)15 2192939 Fax: +31 (0)15 2190955 E-mail: [email protected] Http: www.irc.nl