Thesis Defense - Personal Informatics and Context: Using Context to Reveal Factors that Affect...
158
P E R S O N A L INFORMATICS & C O N T E X T USING CONTEXT TO REVEAL FACTORS THAT AFFECT BEHAVIOR ANIND DEY Co-Chair JODI FORLIZZI Co-Chair NIKI KITTUR HCII JOHN STASKO Georgia Tech IAN LI
-
Upload
ian-li -
Category
Health & Medicine
-
view
5.944 -
download
3
Transcript of Thesis Defense - Personal Informatics and Context: Using Context to Reveal Factors that Affect...

P E R S O N A L I N F O R M A T I C S & C O N T E X T USING CONTEXT TO REVEAL FACTORS THAT AFFECT BEHAVIOR
ANIND DEY Co-Chair
JODI FORLIZZI Co-Chair
NIKI KITTUR HCII
JOHN STASKO Georgia Tech
IAN LI

2
Alice Just entered college
Started gaining weight
Family history of heart disease

3
Alice Manage her time better, so she can find opportunities to be active.

4
Pedometer

5

6

7

8
Calendar

9
CalendarLocation

10
CalendarLocation
Weight

11
CalendarLocation
Weight
Food Consumption General Health
Mood

12
CalendarLocation
Weight
Food Consumption General Health
Mood
http://personalinformatics.org/tools

13
Dashboard

14
Opportunity!
34% of U.S. adults are obese (National Health and Examination Survey, 2010)
27% of adult internet users have tracked health data online (Pew Internet Report, The Social Life of Health Information, 2011)
Thesis A personal informatics system that allows users to associate context with behavioral information can better reveal factors that affect behavior compared to systems that only show behavioral information.
15

Model of Personal Informatics
Created a model to guide the design of personal informatics systems.
16

Model of Personal Informatics
Field Studies
Showed evidence in field studies that context can reveal factors that affect behavior.
17

Model of Personal Informatics
Field Studies
Visualization Support
Explored what kinds of visualization support personal informatics systems should provide.
18

Model of Personal Informatics
Field Studies
Visualization Support
Personal Informatics Dashboard
Developed a personal informatics dashboard that makes it easier for users to associate different kinds of data in a single interface.
19

Model of Personal Informatics
Field Studies
Visualization Support
Personal Informatics Dashboard
20

Goal Create a model as a guide in designing personal informatics systems.
21

Survey and Interviews Recruited 68 people who use personal informatics tools
Asked participants what tools they use and problems they’ve encountered.
22

Sample Questions • How difficult is it to collect this personal
information? • How do you explore this collected personal
information? • What patterns have you found?
Transcript of the survey is at: http://personalinformatics.org/lab/survey
23

Analysis Identified problems that people experienced.
Affinity diagrams to identify themes.
Derived a model composed of: • 5 stages
24

COLLECTION REFLECTIONPREPARATION INTEGRATION ACTION
5 Stages
25

26
COLLECTION REFLECTIONPREPARATION INTEGRATION ACTION

27
COLLECTION REFLECTIONPREPARATION INTEGRATION ACTION
Alice Wanted to become active
Decided to track her physical activity
Chose to track step counts using a pedometer

28
COLLECTION REFLECTIONPREPARATION INTEGRATION ACTION
Pedometer

29
COLLECTION REFLECTIONPREPARATION INTEGRATION ACTION
Synchronize data to web site.

30
COLLECTION REFLECTIONPREPARATION INTEGRATION ACTION
Active
Inactive Inactive
M! T! W! Th! F! Sa! Su! M! T!

The stage when people choose what they are going to do with their new-found understanding of themselves.
31
COLLECTION REFLECTIONPREPARATION INTEGRATION ACTION

Properties of the Stages 1. Problems cascade. 2. Stages are iterative. 3. User- vs. System-driven 4. Uni- vs. Multi-faceted
32

Properties of the Stages 1. Problems cascade. 2. Uni- vs. Multi-faceted. 3. Stages are iterative. 4. User- vs. System-driven
33

1. Problems cascade. Problems in the earlier stages can affect the later stages.
34

1. Problems cascade.
35
Active
Inactive Inactive
M! T! W! Th! F! Sa! Su! M! T!

1. Problems cascade.
36
Active
Inactive Inactive
M! T! W! Th! F! Sa! Su! M! T!
1. Problems cascade. Problems in the earlier stages can affect the later stages.
Consider all the stages when building personal informatics tools.
37

2. Uni- vs. Multi-faceted Users expressed desire to see associations between different facets of their lives.
“If it were easily collected, information on food intake, calories, fat, etc., would make an interesting starting point for analysis.” User who tracks medication intake
38

2. Uni- vs. Multi-faceted
Most personal informatics are uni-faceted.
Some personal informatics tools have multi-faceted collection, but only support uni-faceted reflection.
39

2. Uni- vs. Multi-faceted
40
Active
Inactive Inactive
M! T! W! Th! F! Sa! Su! M! T!
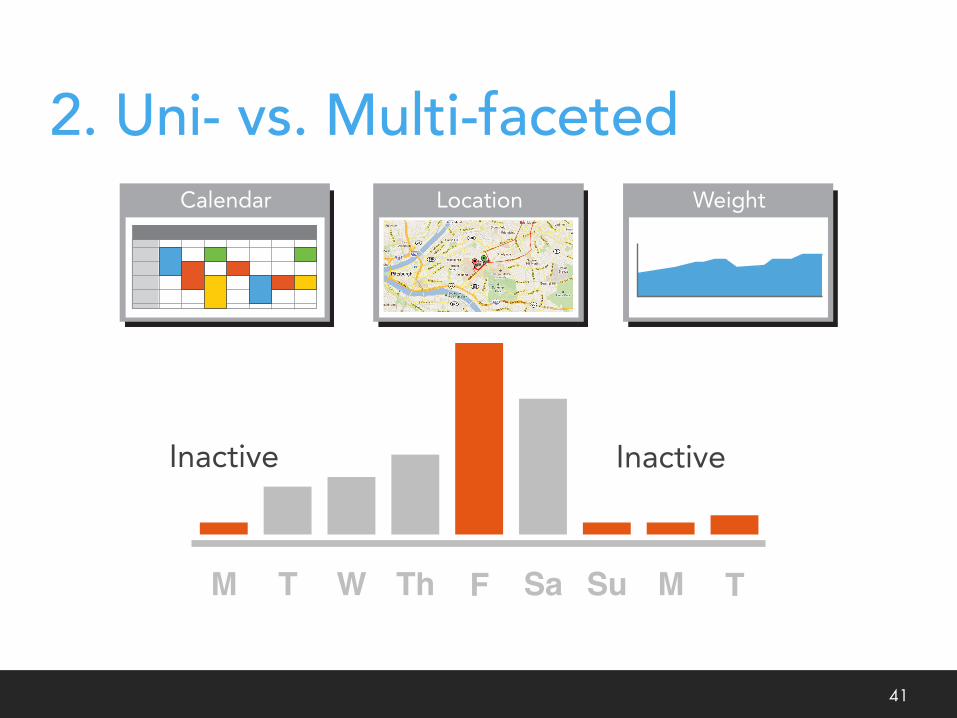
2. Uni- vs. Multi-faceted
41
Active
Inactive Inactive
M! T! W! Th! F! Sa! Su! M! T!
Calendar Location Weight

2. Uni- vs. Multi-faceted Most personal informatics are uni-faceted.
Explore support for collecting data on multiple facets of one’s life.
42

Benefits of the Model Identified the problems with existing tools.
Highlights the many challenges of building effective personal informatics tools.
A common framework for describing, comparing, and evaluating personal informatics tools.
43

44
COLLECTION REFLECTIONPREPARATION INTEGRATION ACTION

Model of Personal Informatics
Field Studies
Visualization Support
Personal Informatics Dashboard
45

Field Studies
Diary Study
IMPACT 1.0
IMPACT 2.0
46

Physical Activity Lack of physical activity is a common problem that leads to obesity, diabetes, and high blood pressure.
Lack of awareness of physical activity is one reason why people are not active.
47

Sedentary People & Walking Research suggests that they are less aware of their physical activity and how to become active. (Sallis & Hovell 1990)
Encourage walking because it is easier to integrate into daily life. (Norman & Mills 2004)
48
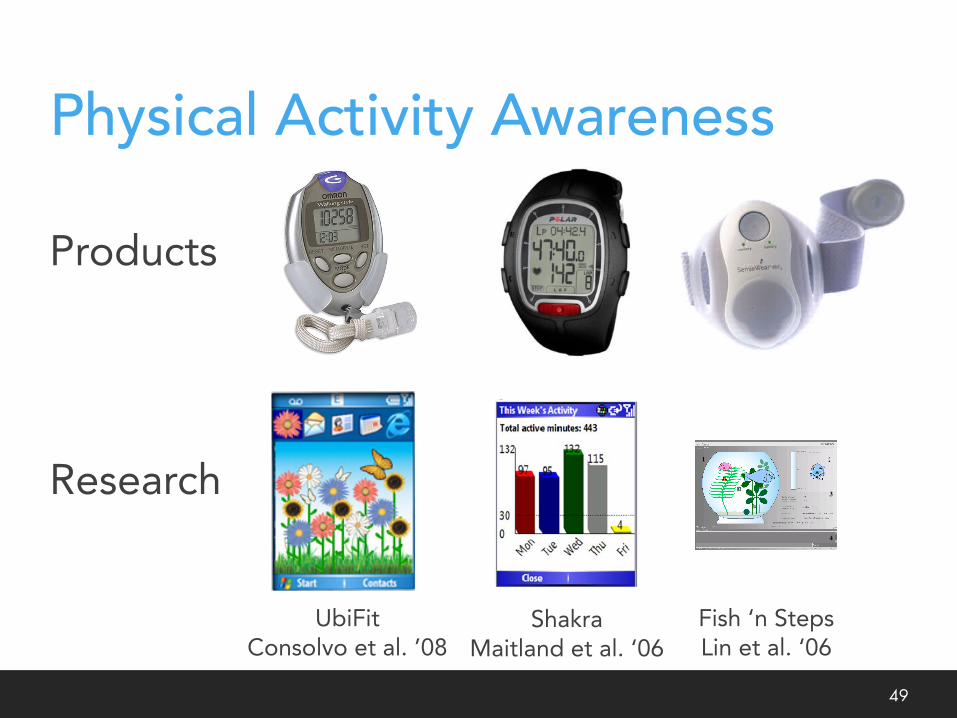
Physical Activity Awareness
49
Products
Research
UbiFit Consolvo et al. ’08
Shakra Maitland et al. ‘06
Fish ‘n Steps Lin et al. ‘06
want to wait for an update, he or she can manuallysynchronise via the Sync menu option.
Users specify in advance the peers they wish to shareresults with, but at any time they can change this list.Figure 2a shows the Compare Daily Activity screen thatusers can view to assess their performance in relation totheir peers. For a week’s overview of their own activity,users may use the Week’s Activity screen shown in Fig. 2b.In order to provide real time feedback to the user, ananimated representation of the user’s current mode ofactivity runs continuously on the main screen of theapplication. This is shown in Fig. 2c and d.
3.1 Sensing activity
The current activity of the user is inferred using patterns offluctuation in GSM signal strength and changes to the IDsof detected cells. This method has been demonstrated as areliable and unobtrusive way of sensing current activity [2],and has the advantage over the more traditional approach ofusing an accelerometer in that it does not require additionalsensor hardware as in Sensay [17] and the multimodalsensor board of [11]. Similarly, while the processing ofphysiological and biometric data could complement ourapproach, the benefits of encapsulating the system within amobile phone would be lost. An alternative approach wouldbe to utilise the positioning information available fromsome mobile phone networks, however this approachfrequently involves prohibitive cost, as well as dependingupon much of the same technology as our client basedmonitoring.
Rather like a traditional accelerometer, the levels ofsignal strength fluctuation change when a mobile phone ismoved. For example, Fig. 3 shows the total signal strengthfluctuation across all monitored cells during successive 30-stime periods whilst walking, remaining still and travelling
in a motor car. The figure illustrates that it is relatively easyto distinguish between moving and remaining stationary,but at times, the pattern of fluctuation whilst walking willmatch that of driving and vice versa. This is due to thestop–start nature of both walking and travelling in a motorcar in urban areas. When driving, a greater geographicaldistance will typically be covered over a given time periodwhen compared to that of running or walking. As such it ispossible to use the rate of change of neighbouring cells toinfer travel by car.
To classify these patterns we use an artificial neuralnetwork. The network inputs are the sum of signal strengthfluctuation across all monitored cells, and the number ofdistinct cells monitored over a given time interval. Thenetwork consists of a single layer of eight hidden neurons;weights are learnt using back propagation. The networkoutputs the currently sensed activity for the given inputvalues. The network is trained by repeatedly presenting datacollected during each method of movement.
The current activity of the user is conditionally depen-dent upon their previous activity. In order to provide instantfeedback to the user interface, the neural network deliber-ately does not model this behaviour. Instead, when deter-mining if any additional minutes have been earned, weapply task knowledge based upon the output from theneural network over the previous two and a half minutes.This enables noise to be filtered out and a more accuraterepresentation of the users’ activities achieved. For exam-ple, periods of low signal strength fluctuation such asstopping at traffic lights whilst driving can be ignored whenplaced between periods of high fluctuation where manydistinct neighbouring cells were monitored. It could beargued that activity would be more accurately inferred if alonger rolling filter had been applied to the GSM data.Introducing longer filters would have increased the likeli-hood of active minutes ‘disappearing’ from the users’
Figure 2 The phone interface. Images a and b show screens for examining relative and individual activity levels: compare Daily Activity andThis Week’s Activity Images. c and d show two of the screens showing the estimated current activity level: Stationary and Walking
Mobile Netw Appl (2007) 12:185–199 189
Fish’n’Steps: Encouraging Physical Activity with an Interactive Computer Game 263
!!
Fig. 1. One participant’s display after approximately two weeks into the trial in the Fish'n'Steps team-condition, also the public kiosk and pedometer platform, which rotated through each of the team fish-tanks. The components of the personal display include: 1) Fish Tank - The fish tank contains the virtual pets belong to the participant and his/her team members, 2) Virtual Pet – The participant’s own fish in a frontal view on the right side next to the fish tank, 3) Calcula-tions and feedback - improvement, burned calories, progress bar, personal and team ranking, etc., 4) Chat window for communicating with team members.
To evaluate the effect of Fish’n’Steps, we recruited 19 participants from the staff of Siemens Corporate Research to participate in a 14-week study. Two experimental conditions were designed to separately assess the impact of the virtual pet and the social influences. Application of the TTM to assess behavior that changed during the study demonstrated that Fish’n’Steps was a catalyst of a positive change for 14 out of 19 participants. This effect was evident in either an increase in their daily step count (for 4 participants), a change in their attitudes towards physical activity (for 3 partici-pants) or a combination of the two (for 7 participants). The greatest change in daily number of steps was by the participants who were at the TTM’s intermediate levels of the behavior change. For these participants the game provided just enough motivation to translate mental readiness into action.
While the overall findings were encouraging, there are a number of possibilities for future investigations. For example, selecting participants from our own research or-ganization limited representativeness of the sample to highly educated individuals relatively open to adopting new technologies. In addition, the game highlighted the importance of careful selection of incentives: unachievable or not challenging goals can fail to inspire the desired change.
2 Interventions for Behavior Change
There are a variety of techniques developed over the years to motivate behavior change. Traditional techniques are usually delivered by a trained specialist in either individual or group settings. Examples of these techniques include goal-setting, self-assessment, or monitoring of achieved progress [17] . Two particular approaches that influenced the current project include motivating behavior change by cultivating a
1 2
3
4

Physical activity is affected by lack of time, choice of activities, the environment, and social influence. (Sallis & Hovell 1990)
CDC suggests understanding of factors to circumvent barriers to physical activity.
Research on Factors
50

Research on Factors Diabetes awareness of blood sugar level and food consumption (Frost & Smith ’03) • Images of food associated with blood sugar
level. • Used in a class where people discussed
their images and blood sugar level. • Made a prototype, but only tested with one
person.
51

Research on Factors Asthma patients videotaping daily routines found that they are in the presence of harmful allergens more often than they realized (Rich et al. ‘00)
• Users videotaped daily routines, but a trained observer looked at the video for assessment.
52

Prototypes Step Counts
53

Prototypes Step Counts
Activity
Location
People
54
} Contextual Information

Field Studies
Diary Study
IMPACT 1.0
IMPACT 2.0
55

Goal Before building a prototype, explore what people would do when they have access to both physical activity and contextual information.
56

57
Date:
What? Where?Time
6a
7a
8a
9a
10a
11a
12p
1p
2p
3p
4p
5p
6p
7p
How active were you? With whom?
:
:
:
:
:
:
:
:
:
:
:
:
:
:
:
:
:
:
:
:
:
:
:
:
:
:
:
:
What? Where?Time How active were you? With whom?
:
:
:
:
:
:
:
:
:
:
:
:
:
:
:
:
:
:
:
:
:
:
:
:
:
:
:
:
Continue to the next page.!
SenseWear Booklet Pedometer

Takeaways “It was nice to see that I walked more than I did. There was one day when I was babysitting. I walked so much with the baby. I walked all over campus.” A1
58
Activity Location Person

Takeaways “Housework and walking to the bus stop can contribute, really. I mean, I take that for granted in terms of energy expenditure.” A4
59
Activity Location

Matching SenseWear graphs with booklet entries.
60
8 hrs 49 m...
Duration of Vi...
Not detect...
Sleep
Not detect...
Lying Do...
11346
Step Count
1 hr 43 m...
Physical Activity (2.5 ME...
438 cal
Active ...includes off-body
estimate of 4 cal1041 calori...
Total EE
- Fri Dec 8, 2006 02:03 PMSession end
End Time
- Fri Dec 8, 2006 05:14 AM
Start Time
Start5:14 AM
End2:03 PM
FRI DEC 8, 2:03 ... THU DEC 7, 2:16 ...
cindy

Summary Participants made associations between their physical activity and contextual information helping them become aware of factors that affected their physical activity.
Can a prototype support this in a field study with more people?
61

Field Studies
Diary Study
IMPACT 1.0
IMPACT 2.0
62

63
Booklet Pedometer

64

65
5
had an interface to label time segments with contextual information, including a participant’s activity, location, and
people the participant was with. In addition to the per-day
and per-week visualizations of step counts, they also used
the online service to see visualizations showing the
association between their daily activities and their number
of steps (Figure 3e, 3f, & 3g). Users carried diary booklets
with additional fields for contextual information.
FIELD STUDY
We used the IMPACT system to explore if associating
physical activity with context can produce a greater self-
awareness about one’s own behaviors and can then
motivate an improvement in physical activity. We had two
hypotheses:
H1: Users who recorded the context of their physical
activity would find more opportunities to be physically
active.
H2: Users who find more opportunities to be physically
active would increase the number of steps they take.
Participants and Method
We recruited 43 participants, 14 males and 29 females,
using a recruiting web site, newsgroups, and flyers. The
ages of the participants ranged between 19 and 55. All
participants owned a computer and had high-speed online
access at home or at work. Participants received $100 for
their participation.
Participants wore a pedometer (Omron HJ-112 Walking Style) (Figure 2a) all day throughout the duration of the
study. Participants also carried a pocket-sized diary booklet
to record the time and their step counts. When in the Plus-
Context phase, participants received a diary booklet with
additional fields for contextual information (Figure 2b).
Participants entered their booklet entries into the IMPACT
web site at their convenience.
Participants used the Baseline version of IMPACT during
the first week of the study. After the first week, participants
were randomly assigned to use the Steps-Only version or
the Plus-Context version for 3 weeks. After this period of 3 weeks, participants used the other version for 3 more
weeks.
During the Steps-Only phase, participants recorded their
step counts every time they changed activities or about once
an hour. During the Plus-Context phase, participants
recorded their step counts and the context of their activity
(the kind of activity, location, and the people they were
with). Participants were instructed to record every time they
changed their context, such as when they changed
activities, moved locations, or met with a different person.
The researchers met with the participants 4 times throughout the study: at the Start of the study, after
Baseline, after Steps-Only, and after Plus-Context. During
these meetings, participants received materials and
instructions for the phase they were about to begin.
Participants also answered questionnaires. Four participants
Baseline
a
Steps-Only
b
c
d
Plus-Context
e
f
g
Figure 3. a) Interface for recording steps. Steps-Only additions. b) One day of steps. c) Week of steps by day. d) Week of steps for each day. Plus-Context additions. e) Context labeler. f) Table and
chart showing association between steps and context. g) Steps by hour and period of day.
Day with context labels
Table and chart of steps and context
Steps by hour and by period of day

66
Pedometer Booklet Dashboard
IMPACT 1.0 3 weeks
Visualization of Steps
Steps-Only 3 weeks
Baseline 1 week
Steps
Steps Activity Location People
Steps
Visualization of Steps & Context

Participants 30 participants (B1-B30) • Sedentary. Pre-screened using Stages of
Exercise Behavior Change (Marcus et al. 1998)
Questionnaires at the end of each phase
67

Mentioned Context “It helped me realize which activities were more important. For example, I didn’t understand the importance of walking home versus taking the bus.” B8
“It turns out I get the most walking done to and from work, which I can't say I wasn't expecting, but I also had no idea that walking around Squirrel Hill for just an hour or two made such a difference.” B24
68

Of the 30 participants…
69
Mentioned Context (Activities, Location, People)
IMPACT 1.0 Visualization
of Steps and Context
13 participants
Steps-Only Visualization of Steps
7 participants
Baseline No Visualizations
6 participants

IMPACT supports reflection on context “The [visualization] I used the most was the one asking who I was with; I hadn’t realized that I was so sedentary most of the time I spent with my friends.” B1
70

Possible Improvements “IMPACT gave a lot of cool information, but having to input all the various factors was a hassle.” B4
71

Possible Improvements “IMPACT gave a lot of cool information, but having to input all the various factors was a hassle.” B4
90% reported they would continue using IMPACT if collection of context was automated.
72

Possible Improvements “IMPACT gave a lot of cool information, but having to input all the various factors was a hassle.” B4
90% reported they would continue using IMPACT if collection of context was automated.
Next: IMPACT 2.0
73

Field Studies
Diary Study
IMPACT 1.0
IMPACT 2.0
74

Automatic Collection of Steps and Location
75
Bluetooth GPS

Facilitated Collection of Activities and People
76

Automated Integration
77
Bluetooth Sync

78

79
Mobile Phone Dashboard
IMPACT 2.0
Visualization of Steps
Steps-Only
Baseline
Visualization of Steps & Context
Collected Steps Only
Collected Steps Only
Collected Steps, Activity, Location, and People

1 2 3 4 5 6 7 8
Control
Baseline Steps-Only
IMPACT 2.0
Baseline Phase Intervention Phase
80

Participants 35 participants (C1-C35) • Sedentary. Pre-screened using Stages of
Exercise Behavior Change (Marcus et al. 1998)
Questionnaires at the end of each phase
81

Results
No complaints about inputting data.
But people complained about carrying multiple devices. • “I would not like carrying two devices (GPS
and phone), that was too much.” C30
82

Awareness of factors increased for all groups between the phases
83
F[2,32] = 3.98, p = .0547
!"
!#$"
%"
%#$"
$"
&'()*+,)" -,.)/0),12,"
!"#$%&%''()*(+#,-)$'(
32,./2*" 4.)5(67,*8" -9:;3<"=#>"

Mentioned Context
84
Mentioned Context (Activities, Location, People)
IMPACT 2.0 Visualization
of Steps and Context
6 of 11 participants
Steps-Only Visualization of Steps
3 of 12 participants
Control No Visualizations
5 of 12 participants

Short-Term Benefits/Problems
85
Short-term
IMPACT 1.0 Manual Collection
Harder to collect, but more engaged
IMPACT 2.0 Automated Collection
Easier to collect, but less engaged

Long-term reflection What is the value of contextual information in the long-term?
6-months later when they were more likely to have forgotten the data
86

Follow-Up Interviews Expressed interest in comparing over long periods of time.
Curious about the peaks in physical activity.
But only those who had visualizations of contextual information had reminders of what happened during those peaks.
87

Long-Term Benefits/Problems
88
Short-term Long Term
IMPACT 1.0 Manual Collection
Harder to collect, but more engaged
No reflection opportunity
IMPACT 2.0 Automated Collection
Easier to collect, but less engaged
Has reflection opportunity

Overall Summary Provided some evidence that a system that shows context can reveal factors that affect behavior.
But the value of the data is highly dependent on the type of support.
89

COLLECTION REFLECTIONPREPARATION INTEGRATION ACTION
90

COLLECTION REFLECTIONPREPARATION INTEGRATION ACTION
91

Model of Personal Informatics
Field Studies
Visualization Support
Personal Informatics Dashboard
92

Goal Determine what kinds of questions people ask about their data.
Determine when contextual information is useful.
93

Participants 15 participants (P1-15) to interview.
94

Procedure 1-hour interviews • I observed participants using their personal
informatics tool.
95

Analysis Identified the kinds of questions people asked about their data.
Affinity diagrams to identify themes.
Derived 6 kinds of questions.
96

Six Kinds of Questions Status History
Goals Discrepancy
Details Factors
What is my current status?
97

Six Kinds of Questions Status
History Goals
Discrepancy Details Factors
What happened in the past?
98

Six Kinds of Questions Status
History Goals
Discrepancy Details Factors
What goals should I pursue?
99

Six Kinds of Questions Status
History Goals
Discrepancy Details Factors
How does my behavior compare to my goals?
100

Six Kinds of Questions Status
History Goals
Discrepancy Details Factors
What other things happened during a particular point in time?
101

Six Kinds of Questions Status
History Goals
Discrepancy Details
Factors What influences my behavior over a long period of time?
102

Importance of the Questions Not all questions are important all the time.
Some questions are more important than others as people’s information needs change.
103

Importance of the Questions Not all questions are important all the time.
Some questions are more important than others as people’s information needs change.
104
Maintenance Phase
Discovery Phase &

Maintenance Phase Participants already know how different factors affect their behavior, so they just want to know what their current status is.
Participants have already identified their goals. They are only concerned with whether they are meeting their goal.
105

Maintenance Phase Current Status
P13 just tracks the minutes that he spends on Facebook, Twitter, and other social media sites, because he already know how these affects his productivity.
106

Maintenance Phase Discrepancy
P1 uses Mint to keep track of her expenditures to see whether she is meeting the budget that she had set for herself.
107
Maintenance Phase These kinds of questions were the most important: • Status • Discrepancy
108

Discovery Phase Participants collect several types of information to find out what factors affect their behavior.
Participants are trying to figure out what their goals are.
109

Discovery Phase Finding factors that affect their behavior.
P3 has diabetes and she tracked her blood glucose levels and her food consumption to find out their interaction.
110

Discovery Phase Figuring out goals
P8 tracks the quality of her sleep so that she is better rested. She explores her sleep data to “spot trends for which I can take corrective action.”
111

Discovery Phase These kinds of questions were the most important: • History • Goals • Details • Factors
112

Discovery Phase These kinds of questions were the most important: • History • Goals • Details • Factors
113
} Contextual information & Multiple types of data

Discovery Phase These kinds of questions were the most important: • History • Goals • Details • Factors
114
Next Question What visualization features would help users find answers to these kinds of questions? }

115
Goal
History Goals
Details Factors
Timeline Sketches

Results
History: Looking back in time.
Participants generally agreed that the timeline sketches were the most appropriate for the Discovery phase.
116

Results
Goals: Seeing goals information.
“I like having the goal line...I always like being able to see what my baseline should be and if I am above or below.” P5
117
Goal

Results
Details: Seeing details to reason what happened.
“When looking at exercise there are a couple of times where I really didn’t meet my goal, so it will be really nice to be able to say ‘why didn’t I meet my goal then?’” P4
118

Results
Factors: Comparison of different kinds of data.
“The most interesting thing here is the ability to compare two different time frames because I’m really interested in the relationship between data.” P6
119

Summary Contextual information and multiple types of data is important during the Discovery phase.
Described visualization features to help people answer questions during the Discovery phase.
120

Summary Contextual information and multiple types of data is important during the Discovery phase.
Described visualization features to help people answer questions during the Discovery phase.
Next: Built a personal informatics dashboard with the visualization features.
121

Model of Personal Informatics
Field Studies
Visualization Support
Personal Informatics Dashboard
122

Goal Build a personal informatics dashboard that allows users to see multiple kinds of data together.
Develop an approach that makes it easier to build.
123

124
Goal
History Goals
Details Factors
Visualization Features

Data Integration
125
Data SourcesDashboard

Data SourcesDashboard
Data Integration
126

Problems with Data Integration Dashboard has to:
Access Data
Parse Data
Visualize Data
127

Problems with Data Integration Dashboard has to:
Access Data
Parse Data
Visualize Data
Managing many data sources w/ different APIs.
The data source loses control of the data.
128

Problems with Data Integration Dashboard has to:
Access Data
Parse Data
Visualize Data
No standard format for the different types of data that users collect.
Dashboard has to create parsers for each format.
129

Problems with Data Integration Dashboard has to:
Access Data
Parse Data
Visualize Data
Dashboard has to create visualizations for each type of data.
Duplicates creation of the visualizations.
130

Visualization Integration
131

Visualization Integration
132
Data SourcesDashboard

Visualization Integration
133
Data SourcesDashboard
Widgets

Visualization Integration
134
Data SourcesDashboard
Widgets

Benefits of Viz Integration Dashboard has to:
Accessing Data
Parsing Data
Visualizing Data
Provide an API that data sources can use.
Manage the communication between widgets.
135

Benefits of Viz Integration For the perspective of data sources:
Maintain control of the data.
They can choose how the data is visualized.
Create a widget and it can be used with widgets that others have made.
136

137
I N N E R T U B E

Implementation Programmed in Javascript.
1. Innertube API
2. Innertube Widgets
3. Innertube Dashboard
138

Innertube API Data sources create visualization widgets using static images, Javascript, and/or Flash.
Data sources use the API to communicate with the dashboard and vice versa.
139

Innertube API Get the date and range of visualizations to display.
Get the currently highlighted data point.
Change the appearance of the widget. • Set height of the widget. • Reload the widget.
140

Innertube Widgets Fitbit Steps
GPS Location
141

Innertube Widgets Weather
Sleep Busyness Energy Level Mood Notes
142

Innertube Dashboard
143

Demo of Innertube Dashboard
144

Field Study 15 participants recruited via Craigslist.
Were not tracking their physical activity.
145

Data Collection for 1 week Automatically Collected
Step Counts using Fitbit GPS Location Weather Information
Manually Collected
Mood Amount of Sleep Busyness Energy Level People Notes
146

Returned to the Lab Used Innertube while thinking-aloud. • What they were looking for • What they were finding • What problems they encountered
Answered questionnaires about Innertube.
147

Results 13 of the 15 participants agreed that Innertube was useful.
148

Results “It allowed me to factor in location, times, and activity in order for me to assess where I may be able to increase physical activity.” P12
“Seeing the temperatures of the times I went on my runs and knowing how well I did on them would allow me to determine the best condition for me to run in.” P14
149

Results “It gave me concrete contexts, in space and time, by which I could measure and evaluate my own physical activity. Interacting with that data gave me the opportunity to hypothesize about what factors influenced my own physical activity, and what specifically motivated me or discouraged me from exercising.” P9
150

Results “I thought certain widgets [factors] were less useful before I used the PI dashboard, and then I changed my mind after using it, because their usefulness became apparent to me.” P9
151

Future Work Improve the usability of the Innertube Dashboard.
Make the Innertube API available to developers. Coming soon!
Create a directory of Innertube Widgets, so people can find widgets easily.
152

Summary Described visualization integration, an easier approach to building personal informatics dashboards.
Implemented Innertube, an example of visualization integration.
153

Conclusion
154

Contributions Created a model to guide the design of personal informatics systems.
Showed evidence that contextual information can reveal factors that affect behavior.
155

Contributions Explored what kinds of visualization support personal informatics systems should provide.
Developed an easier way to build personal informatics dashboards to help users associate different kinds of data in a single interface.
156
Future Work Deploy longer field studies.
Conduct studies in other behavior domains.
Explore how to convert awareness of factors to changes in behavior (Action stage).
157

Thank you! To my committee, Anind Dey, Jodi Forlizzi, Niki Kittur, and John Stasko.
To the many who have helped along the way: Gary Hsieh, Erin Walker, Karen Tang, Scott Davidoff, Amy Ogan, Ruth Wylie, Moira Burke, Queenie Kravitz, Gabi Marcu, Rebecca Gulotta, Matt Lee, Turadg Aleahmad, Aruna Balakrishnan, Min Kyung Lee, Tawanna Dillahunt, Sunyoung Kim, Chloe Fan, Jenn Marlow, Jason Wiese, Stephen Oney, Chris Harrison, Julia Schwarz, Eliane Stampfer, Samantha Finkelstein, Aubrey Shick, Matt Easterday, Bilge Mutlu, Andy Ko, Johnny Lee, Ido Roll, Jeff Nichols, Jeff Wong, Jennie Park, Sara Kiesler, Laura Dabbish, Scott Hudson, Tessa Lau, Fernanda Viegas, Jaime Teevan, Alexandra Carmichael, Gary Wolf.
To HCII, QoLT, the Ubicomp Lab, and the Quantified Self.
To my family, Papa, Mama, Robin, and Cassandra.
This work is based on research supported by the National Science Foundation under Grant No. IIS-0325351 and EEEC-0540865.
158