Bottom-up factors influencing riparian willow recovery in ...
14
Western North American Naturalist Western North American Naturalist Volume 70 Number 3 Article 11 10-11-2010 Bottom-up factors influencing riparian willow recovery in Bottom-up factors influencing riparian willow recovery in Yellowstone National Park Yellowstone National Park Michael T. Tercek Walking Shadow Ecology, Gardiner, Montana, [email protected] Robert Stottlemyer U.S. Geological Survey, Fort Collins, Colorado, [email protected] Roy Renkin Yellowstone Center for Resources, National Park Service, Yellowstone National Park, Wyoming, [email protected] Follow this and additional works at: https://scholarsarchive.byu.edu/wnan Recommended Citation Recommended Citation Tercek, Michael T.; Stottlemyer, Robert; and Renkin, Roy (2010) "Bottom-up factors influencing riparian willow recovery in Yellowstone National Park," Western North American Naturalist: Vol. 70 : No. 3 , Article 11. Available at: https://scholarsarchive.byu.edu/wnan/vol70/iss3/11 This Article is brought to you for free and open access by the Western North American Naturalist Publications at BYU ScholarsArchive. It has been accepted for inclusion in Western North American Naturalist by an authorized editor of BYU ScholarsArchive. For more information, please contact [email protected], [email protected].
Transcript of Bottom-up factors influencing riparian willow recovery in ...

Western North American Naturalist Western North American Naturalist
Volume 70 Number 3 Article 11
10-11-2010
Bottom-up factors influencing riparian willow recovery in Bottom-up factors influencing riparian willow recovery in
Yellowstone National Park Yellowstone National Park
Michael T. Tercek Walking Shadow Ecology, Gardiner, Montana, [email protected]
Robert Stottlemyer U.S. Geological Survey, Fort Collins, Colorado, [email protected]
Roy Renkin Yellowstone Center for Resources, National Park Service, Yellowstone National Park, Wyoming, [email protected]
Follow this and additional works at: https://scholarsarchive.byu.edu/wnan
Recommended Citation Recommended Citation Tercek, Michael T.; Stottlemyer, Robert; and Renkin, Roy (2010) "Bottom-up factors influencing riparian willow recovery in Yellowstone National Park," Western North American Naturalist: Vol. 70 : No. 3 , Article 11. Available at: https://scholarsarchive.byu.edu/wnan/vol70/iss3/11
This Article is brought to you for free and open access by the Western North American Naturalist Publications at BYU ScholarsArchive. It has been accepted for inclusion in Western North American Naturalist by an authorized editor of BYU ScholarsArchive. For more information, please contact [email protected], [email protected].
387
1Walking Shadow Ecology, Box 1085, Gardiner, MT 59030. E-mail: [email protected]. Geological Survey, Fort Collins, CO 80526.3Yellowstone Center for Resources, National Park Service, Yellowstone National Park, WY 82190.
After the elimination of wolves (Canis lupusL.) in the 1920s, riparian willow (Salix spp.),aspen (Populus tremuloides Michx.), and cotton-woods (Populus balsamifera L., Populus angusti-folia James, and their hybrids) declined anestimated 50% on the northern range of Yel-lowstone National Park, which is the 153,000-haarea occupied by the park’s northern elk herdin the winter (Chadde and Kay 1991). In subse-quent decades, several researchers concludedthat the removal of wolves triggered the ripar-ian plant decline by allowing for the growth ofan unprecedentedly large elk (Cervus elaphusL.) herd that was overbrowsing the range (re -viewed in Wagner 2006). After the reintroduc-tion of wolves in 1995–1996, riparian willows onYellowstone’s northern range have shown sig-nificant growth and recruitment for the first timesince the 1920s (Ripple and Beschta 2004a,2004b, Beyer et al. 2007). Willow stands thathad averaged <80 cm in height prior to 1995in some cases grew to greater than 400 cm
(Tercek unpublished data). The prevailing ex -planation for this riparian plant recovery de -scribes a “top-down trophic cascade” in whichelk browsing increased when wolves were ab -sent and decreased again following wolf rein-troduction in 1995–1996 (Ripple et al. 2001,Beschta 2003, 2005, Larsen and Ripple 2003,Ripple and Beschta 2004a).
Height recovery of riparian plants, particu-larly willows, has not been uniform across thenorthern range since 1995, and there are 2competing explanations for this uneven recov-ery. The first explanation involves wolf-mediatedchanges in elk behavior. The second explanationascribes more importance to abiotic factors, suchas water availability, that limit plant productiv-ity to varying degrees at different sites.
The behaviorally mediated, top-down the-ory (first explanation) explains the patchy dis-tribution of tall and short willow as the resultof elk avoiding predation by wolves, and pro-ponents of this theory have explicitly denied
Western North American Naturalist 70(3), © 2010, pp. 387–399
BOTTOM-UP FACTORS INFLUENCING RIPARIAN WILLOW RECOVERY IN YELLOWSTONE NATIONAL PARK
Michael T. Tercek1, Robert Stottlemyer2, and Roy Renkin3
ABSTRACT.—After the elimination of wolves (Canis lupis L.) in the 1920s, woody riparian plant communities on thenorthern range of Yellowstone National Park (YNP) declined an estimated 50%. After the reintroduction of wolves in1995–1996, riparian willows (Salix spp.) on YNP’s northern range showed significant growth for the first time since the1920s. However, the pace of willow recovery has not been uniform. Some communities have exceeded 400 cm, whileothers are still at pre-1995 levels of <80 cm mean height. We took intensive, repeated measurements of abiotic factors,including soil and water-table characteristics, to determine whether these factors might be contributing to the varyingpace of willow recovery. Willows at all of our study sites were “short” (<250 cm max. height) prior to 1995 and haverecovered to varying degrees since. We contrasted “tall” (>250 cm max. height) willow sites where willows had escapedelk (Cervus elaphus L.) browsing with “short” willow sites that could still be browsed. Unlike studies that manipulatedwillow height with fences and artificial dams, we examined sites that had natural growth differences in height since thereintroduction of wolves. Tall willow sites had greater water availability, more-rapid net soil nitrogen mineralization,greater snow depth, lower soil respiration rates, and cooler summer soil temperatures than nearby short willow sites.Most of these differences were measured both in herbaceous areas adjacent to the willow patches and in the willowpatches themselves, suggesting that they were not effects of varying willow height recovery but were instead preexistingsite differences that may have contributed to increased plant productivity. Our results agree with earlier studies inexperimental plots which suggest that the varying pace of willow recovery has been influenced by abiotic limiting fac-tors that interact with top-down reductions in willow browsing by elk.
Key words: Yellowstone National Park, Salix, willow, wolf reintroduction, trophic cascade, abiotic factors, bottom-upfactors, riparian vegetation.
the importance of abiotic factors that mightinfluence willow growth. Ripple and Beschta(2006), for example, state that “increased willowheight is not related to patterns of moistureavailability” and that willows are often taller invalley bottoms and shorter in the adjacent up -lands because “the use of higher ground by elkis a risk-sensitive foraging strategy to avoidwolf encounters, detect wolves, and/or evadewolves.” Additional studies also advocate theview that riparian plants (including willows,aspens, and cottonwoods) are shorter in uplandhabitats exclusively because these habitats havelower perceived predation risk for elk (e.g.,Ripple and Beschta 2003, 2004a, 2004b, 2007).According to this theory, open areas and uplandhabitats have lower perceived predation riskbecause they contain fewer escape impedimentsand allow the elk to more easily see approach-ing wolves.
Recently, some aspects of the behaviorallymediated trophic-cascade theory have beencalled into question. First, Kauffman et al. (2007)found that the home ranges of Yellowstone’swolf packs do not overlap some of the riskiestareas for elk—a finding that complicates com-parisons of vegetation inside versus outsidehigh-density wolf areas (see Ripple et al. 2001).Second, elk actually perceive more rather thanless predation risk in open areas (Creel et al.2005, Creel and Winnie 2005, Fortin et al. 2005),and wolf predation occurs more often in openareas than in densely vegetated areas (Kauffmanet al. 2007). Third, elk increase rather than de -crease their consumption of willow when wolvesare nearby (Creel and Christianson 2009). Fi -nally, increased snow depth and density, whichimpede elk access to preferred herbacaeousforage, have been more strongly linked to theproportion of browsed woody stems (includingwillow) in elk diets than wolf presence or ab -sence (Christianson and Creel 2008, Creel andChristianson 2009). Taken together, these resultssuggest that abiotic factors such as snow havea stronger influence on elk browsing behaviorthan wolves. If wolves are indeed having cas-cading effects on vegetation, these effects maybe opposite from those previously suspected,and the presence of wolves may be increasingwillow consumption rather than reducing it.
The second explanation for the nonuniformpace of willow recovery focuses on abiotic lim-iting factors that influence plant productivity,rather than on factors that affect elk behavior.
In a factorial experiment with fenced exclosuresthat eliminated elk browsing and artificial beaverdams that raised the subsurface water table,Bilyeu et al. (2008) found that willows inside thefenced exclosures “remained remarkably short”and that artificially raising the water table withdams produced greater and more temporallyconsistent (from year to year) willow height in -creases than fencing. In a related study, John-ston et al. (2007) demonstrated that ambientelk browsing actually increased the growth ofwillows relative to unbrowsed (fenced) willowsbecause it improved aspects of plant architec-ture that facilitate transpiration and photosyn-thesis. They concluded that in the absence ofartificial dams, “removing browsing [with exclo-sures] suppressed above ground [willow] pro-ductivity.” If the view of Johnston et al. (2007)and Bilyeu et al. (2008) is correct, then the tallerheight of willows in low-lying areas may be due,at least in part, to these willows being closer tothe subsurface water table than willows grow-ing on more upland habitats.
Rather than using experimental fences anddams to manipulate willow height (Johnston etal. 2007, Bilyeu et al. 2008), the present studysought to determine possible abiotic differencesbetween naturally occurring (nonexperimental)“tall” and “short” (defined below) willow sites.The abiotic factors of interest were water-tabledepth, soil moisture, soil respiration rate, net soilnitrogen mineralization (an index of nutrientavailability), snow depth, and soil temperature.
We hypothesized that taller willow siteswould have abiotic conditions more favorable toprimary productivity than shorter willow sites.Such differences would support the view thatabiotic factors interact with top-down mecha-nisms (Johnston et al. 2007, Bilyeu et al. 2008)and that both top-down and bottom-up factorshave contributed to willow height recovery inYellowstone. Alternatively, no significant differ-ences between tall and short willow sites wouldsupport the view of Ripple and Beschta (2006),which explicitly denies the influence of abioticfactors on the varying pace of willow recovery indifferent parts of Yellowstone’s northern range.
We conducted our field work in or near sitesused by Bilyeu et al. (2008), Johnston et al.(2007), and Ripple and Beschta (2006, 2007).Our design contrasted willow communities of<250 cm maximum height, which are still sub -ject to browsing by elk, with nearby willowcommunities that had experienced greater
388 WESTERN NORTH AMERICAN NATURALIST [Volume 70

height recovery since 1995 and exceeded the250 cm height that is thought to prevent elkbrowsing (Keigley and Frisina 1998). All of oursites were <250 cm maximum height prior to1995 (Singer et al. 1994, Singer unpublisheddata) and have since experienced varying lev-els of growth.
This study differs from both the experimen-tal, exclosure-based and the top-down studiesjust described (Ripple and Beschta 2006, John-ston et al. 2007, Bilyeu et al. 2008) because itincluded intensive, repeated measurementsthroughout the entire year, rather than just dur-ing the peak of the growing season. This ap -proach allowed us to determine whether sitesdiffered with respect to snow depth, which mayaffect the intensity of winter elk browsing, andthe intensity of early spring runoff events,which may affect willow growth rates (NationalResearch Council 2002).
METHODS
Study Area
Yellowstone’s northern range is defined asthe 153,000-ha area that serves as winteringgrounds for the park’s northern elk herd. Afterthe wildfires and harsh winter of 1988, the sizeof the northern-range elk herd increased, and anew elk migration pattern more than doubledthe range that lies outside of Yellowstone Park(Lemke et al. 1998). Because only two-thirdsof the northern range is within the borders ofYellowstone, elk and other ungulates are ex -posed to hunting pressure in the adjacentnational forest. The size of the elk herd hasfluctuated greatly in the last 100 years, reachinga minimum of about 5000 animals in 1968, peak-ing at nearly 25,000 animals in the early 1990s,and declining to <10,000 animals in recentyears (Eberhardt et al. 2007).
Elevation ranges from approximately 1700to 3600 m, but most of the area is mid-elevation
(1950–2900 m) and dry (28–50 cm annual pre-cipitation; National Research Council 2002). Thesteppe communities contain primarily big sage-brush (Artemisia tridentata Nutt.) and grassessuch as Idaho fescue (Festuca idahoensis Elmer),with willows, aspen, and cottonwood comprisingthe bulk of woody riparian vegetation (Despain1990, National Research Council 2002).
Site Selection and Study Design
Our study (June 2005–2007) focused on 6northern-range willow communities. Three ofthese were “short” willow sites, with heights lessthan the 250 cm needed to escape elk browsing(Keigley and Frisina 1998); and 3 were “tall”willows sites, which had recovered to more than250 cm since 1995. All of our sites were <80 cmmean height prior to 1995 (Singer et al. 1994,Singer unpublished data) and have experiencedvarying rates of recovery since. The tall siteswere selected so that they not only were moreproductive (measured as leaf litter productionper square meter) but also contained a greaterproportion of surface area covered by willowthickets (Table 1). Study sites were purposelylocated in or near sites used by previous re -searchers so that comparisons could be made topast work. Our short willow sites on BlacktailDeer Plateau were directly adjacent to fencedexclosure sites used by Bilyeu et al. (2008) andJohnston et al. (2007). Our Soda Butte Creeksite was within the area studied by Ripple andBeschta (2006), and our Crystal Creek site wasnear (~100 m from) the site used by Rippleand Beschta (2005). All the study sites con-tained only the willow species Salix bebbianaSarg., Salix boothii Dorn, and Salix geyerianaAnderss., with only a very small number ofSalix drummondiana Barratt ex. Hook. on theperiphery.
Each study site contained 2 subplots: wil-low-shaded subplots and herbaceous subplots.Herbaceous subplots were adjacent to willow
2010] RIPARIAN WILLOW RECOVERY 389
TABLE 1. Descriptive statistics for site productivity and litter decomposition in intensively studied willow sites on thenorthern range of Yellowstone National Park. Height measurements were recorded in September, at the end of thegrowing season (prior to winter browsing), and therefore represent annual maxima. Standard deviations are in parentheses,and asterisks (*) indicate means that differ significantly (P < 0.05).
Mean percentMean percent Mean leaf leaf litter
Mean patch Max. patch Min. patch area covered litter production decompositionSite type height (cm) height (cm) height (cm) by willow (kg ⋅ ha–1) after 6 months
Short willow sites 170* (40) 250 90 34%* (23) 293* (122) 37% (10)Tall willow sites 313* (78) 460 140 65%* (17) 1328* (787) 37% (10)

subplots and dominated by grasses and sedges.Subplots were chosen randomly in each site bymapping a grid over the site and using randomnumbers to select locations. Water samplingand temperature measurements were at fixedlocations as described below, but all other mea-surements were duplicated at new, randomlylocated points within each subplot at the timeof measurement.
The stratification based on 2 subplot typeswithin each site was implemented in order tohelp distinguish between the effects of willowheight recovery and the potential causes of thisrecovery. If the same patterns in bottom-upfactors are seen in both herbaceous and wil-low-shaded subplots, then these patterns arelikely not due to willow shading because theherbaceous subplots do not contain willow. Anydifferences between tall and short willow sitesthat are seen in both types of subplots are like -ly due to site-specific factors (such as subsur-face water availability) rather than willow growthoccurring since 1995.
In presenting our results, we use the follow-ing conventions: each willow site is classifiedas either short or tall (Table 1) and every willowsite contained both willow-shaded and adjacentherbaceous subplots. Subplots are thus desig-nated first by the site in which they are locatedand then by subplot type: short-willow-shaded,
tall-willow-shaded, short-site-herbaceous, andtall-site-herbaceous.
Statistical Analysis
Most of the data in this study were collectedas time series, so the same variable was repeat-edly measured at the same location. Sincemeasurements collected at the same locationhave significant autocorrelation, the traditionalANOVA assumption of independent samplesis violated. To address this issue, all analyses(unless specifically noted) used a one-wayrepeated-measures ANOVA with between-sub-jects factors, which treats the repeated mea-surements at a single site as a within-subjecteffect and the different site and subplot types(tall vs. short, willow-shaded vs herbaceous) asbetween-subject effects (Meyers and Well 1995).Statistical tests were calculated with SPSS ver-sion 8.0. Even though willow-patch height is acontinuous variable on Yellowstone’s northernrange (Fig. 1), we treated it as a dichotomousvariable because our relatively small numberof study sites did not allow us to develop linearregressions between height and our responsevariables.
Site Measurements
LITTER FALL AND LITTER DECOMPOSITION
RATE.—In each subplot, ten 0.5-m2 screens were
390 WESTERN NORTH AMERICAN NATURALIST [Volume 70
Fig. 1. Frequency distribution of maximum willow patch height (height of tallest leader; cm) on the northern range ofYellowstone National Park. Data were collected during 2003–2008 (Tercek unpublished data); n = 1314.

fastened to the existing litter surface to collectannual litter fall. Samples were retained indi-vidually until weighing and determination ofmoisture content. Samples were then compos-ited by site and ground (Wiley mill or rollertable) in the lab. A subsample was retained fortotal carbon (C) and nitrogen (N) analysis.
In each subplot, 5 litter decomposition setswere installed during autumn of each year thencollected the following spring. Each set con-tained 30 nylon mesh bags with 5 g of litter ineach. Once removed from the field, each sam-ple was weighed then composited by site foroven-drying and total C and N analysis.
WATER-TABLE DEPTH AND SOIL MOISTURE AT
0–10 CM DEPTH.—Four to 10 wells constructedof slotted, 3-cm-diameter PVC pipe were in -stalled (following methods from Bilyeu et al.2008) in each site with hand augers to a depthof 150–300 cm, approximately 30 cm below thewater table. Following installation, wells werepumped dry several times to ensure properflow between the well and adjacent soil. Waterlevel below the soil surface was recorded 1–2times per week during the growing season andmonthly during the winter by using a metalrod equipped with an electrical sensor at itsbase.
Soil moisture (0–10 cm depth) was deter-mined gravimetrically each month from 10 ran-domly selected locations in each herbaceousand willow-shaded subplot. Soil moisture wascalculated as a percentage of soil dry weight.
SOIL TEMPERATURE.—Soil temperature wasmeasured every 2 hours for 2 years by dataloggers (iButton Thermochron model DS1921G,Embedded Data Systems) buried 15 cm deepin mineral soil at 10 randomly located pointswithin each site (5 points in every herbaceousor willow subplot = 10 data loggers per site ×6 sites = 60 data loggers).
SNOW DEPTH AND SNOW WATER EQUIV A -LENT.—Snow depth and snow water equivalent(SWE) were measured weekly from Decemberto April during 2 winters by using a steel tube.Six randomly selected points within each sitewere chosen each week. Care was taken not todisturb the snow cover above points that con-tained temperature data loggers or points whereN mineralization samples were to be collected.Samples were melted and weighed to deter-mine snowpack density (g ⋅ cm–3) and SWE.
NET NITROGEN MINERALIZATION RATE.—Ni -trogen (N) mineralization rates were estimated
monthly as an index of plant nutrient availabilityand nutrient recycling rate. We used the closed-top core method (Adams and Attiwill 1986).The top 10 cm of soil was sampled at 5 ran-domly located points within each subplot usinga 5.5-cm-diameter plastic tube, with pairedtubes at each sample point. Ten grams of soilfrom one of the cores, which represented a non-incubated sample, was immediately mixed with100 mL of 2M KCl. The other tube and soilcore was capped and replaced in the groundfor incubation, and displaced organic layer wasreplaced. After 30 days, the field-incubatedsample was removed and extracted in KCL asdescribed.
NO3––N (cadmium reduction) and NH4
+–N(indo-phenol) were determined on an autoana-lyzer (Lachat Instruments, Milwaukee, WI). NetNO3
––N mineralization for each 30-day periodwas estimated by the difference between ini-tial (unincubated sample) and final (incubated)NO3
––N content. Total carbon and nitrogencontent for soils was determined on a LECOCHN analyzer (LECO, St. Joseph, MI). Sam-ples were oven-dried then finely ground priorto analysis. All laboratory analyses were com-pleted by the cooperative USGS–U.S. ForestService Bioanalysis Laboratory on the ColoradoState University campus, Ft. Collins, Colorado.
SOIL CO2 EFFLUX AS AN INDEX OF SOIL AND
ROOT RESPIRATION.—We used soil CO2 effluxas an index of both plant fine-root and soil mi -crobial respiration, following the methods ofMosier et al. (2006). Our objectives were todetermine rate change as a function of soiltemperature and moisture and to define rela-tionships between soil respiration and N min-eralization rates. First the organic litter layerwas removed. Then small chambers of knownvolume and area were placed on the soil surfaceand sealed to prevent leakage. At 15-minuteintervals, gas samples from the chambers werecollected by syringe and evacuated tubes. Nomeasurements were taken after a rain whensoil moisture, temperature, and respiration ratesrapidly change. Trace gas tubes were analyzedin cooperation with the Agricultural ResearchService (ARS, Fort Collins, CO) using a fullyautomated Varian Model 3800 gas chromato-graph. Trace-gas efflux rates were determinedusing the equations of Livingston and Hutch -inson (1995). Gas flux was calculated as a func-tion of concentration change within the knownvolume of the chamber.
2010] RIPARIAN WILLOW RECOVERY 391
RESULTS
Height, Productivity, and Litter Decomposition
Our tall and short sites had significantlydifferent means (Table 1), and the maximumheights of the tall sites are some of the tallestfound on Yellowstone’s northern range (Fig. 1).Note that the height differences among oursites are the result of differential height recov-ery since 1995. All of our sites were <80 cmmean height prior to wolf reintroduction. Tallwillow sites had almost double the proportionof area covered by willow and four-fold the leaflitter production as short willow sites. Leaf litterdecomposition rate did not differ significantlybetween tall and short willow sites (Table 1).
The exclosure fences near our short willowsites on Blacktail Plateau initially might be con-sidered “escape impediments,” a factor whichwould reduce the propensity of elk to browsewillow (Ripple and Beschta 2006). Nevertheless,we do not consider the exclosures to be a con-founding influence for our analysis. If thesefences were indeed acting as escape impedi-ments, the willow in our “short” sites shouldbe taller than willow in the surrounding areas;and they were not.
Water Table Depth and Soil Moisture at 0–10 cm Depth
Tall willow sites had greater soil moistureand shallower water tables than short sites. The
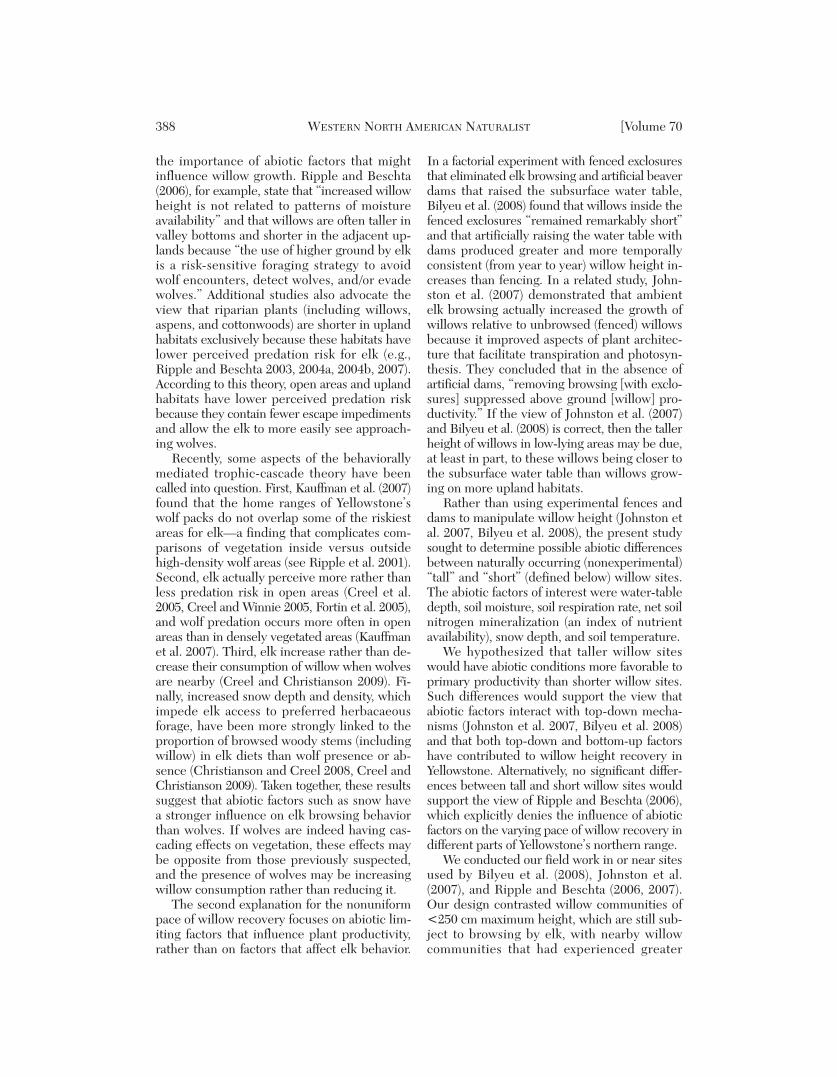
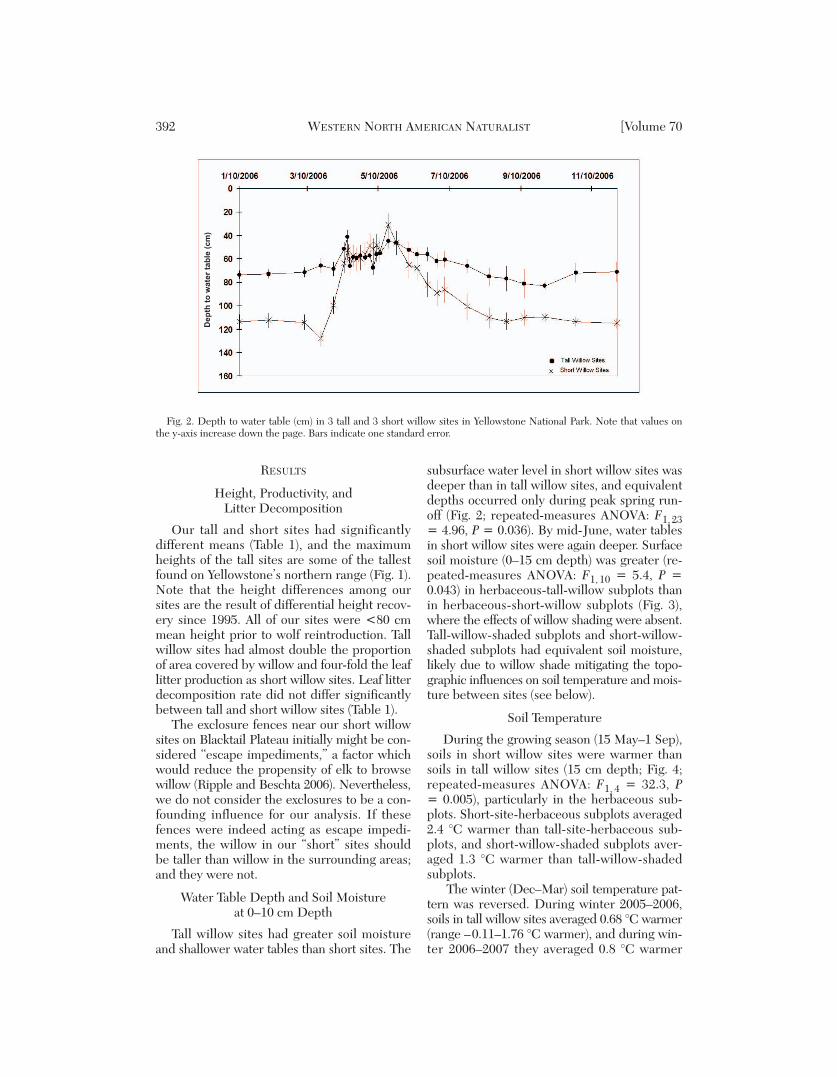
subsurface water level in short willow sites wasdeeper than in tall willow sites, and equivalentdepths occurred only during peak spring run -off (Fig. 2; repeated-measures ANOVA: F1, 23= 4.96, P = 0.036). By mid-June, water tablesin short willow sites were again deeper. Surfacesoil moisture (0–15 cm depth) was greater (re -peated-measures ANOVA: F1, 10 = 5.4, P =0.043) in herbaceous-tall-willow subplots thanin herbaceous-short-willow subplots (Fig. 3),where the effects of willow shading were absent.Tall-willow-shaded subplots and short-willow-shaded subplots had equivalent soil moisture,likely due to willow shade mitigating the topo-graphic influences on soil temperature and mois-ture between sites (see below).
Soil Temperature
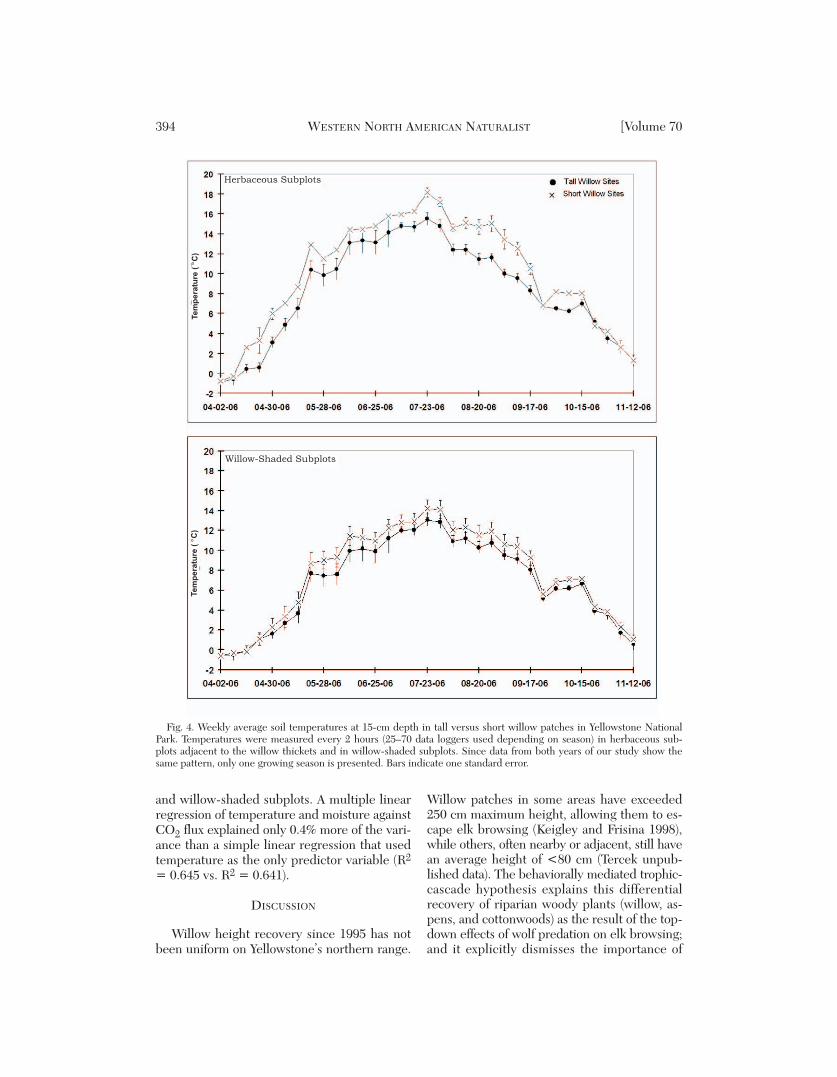
During the growing season (15 May–1 Sep),soils in short willow sites were warmer thansoils in tall willow sites (15 cm depth; Fig. 4;repeated-measures ANOVA: F1, 4 = 32.3, P= 0.005), particularly in the herbaceous sub-plots. Short-site-herbaceous subplots averaged2.4 °C warmer than tall-site-herbaceous sub-plots, and short-willow-shaded subplots aver-aged 1.3 °C warmer than tall-willow-shadedsubplots.
The winter (Dec–Mar) soil temperature pat-tern was reversed. During winter 2005–2006,soils in tall willow sites averaged 0.68 °C warmer(range –0.11–1.76 °C warmer), and during win-ter 2006–2007 they averaged 0.8 °C warmer
392 WESTERN NORTH AMERICAN NATURALIST [Volume 70
Fig. 2. Depth to water table (cm) in 3 tall and 3 short willow sites in Yellowstone National Park. Note that values onthe y-axis increase down the page. Bars indicate one standard error.
Dep
th t
o w
ate
r ta
ble
(cm
)
than soils in short willow sites. Herbaceous andwillow-shaded subplots did not have signifi-cantly different winter soil temperatures.
The winter soil temperature pattern waslikely due in part to the insulating effects ofdeeper snow in the tall willow sites.
Snow Depth and Snow Water Equivalent(SWE)
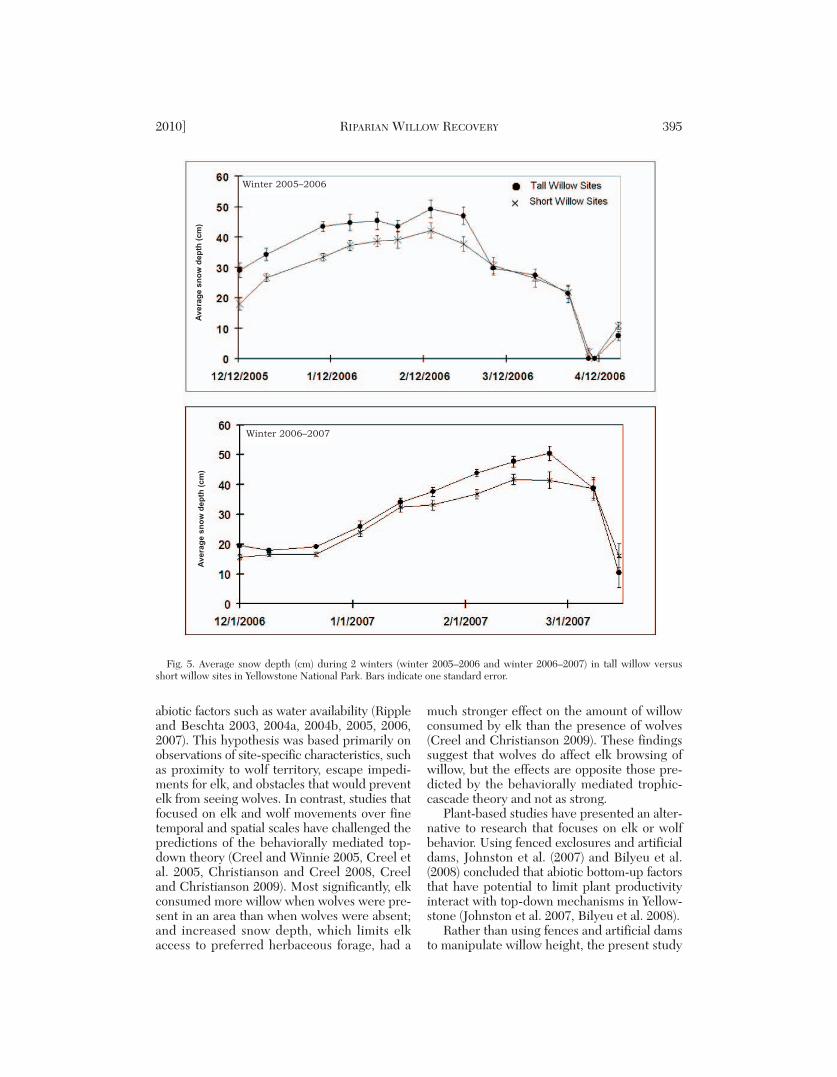
There was a positive correlation (r = 0.618,P < 0.05) between the average snow depth(calculated across the entire winter) at a siteand its average winter soil temperature. Tall wil-low sites had consistently deeper snow (mea-sured every week for 2 winters) and greaterSWE than short willow sites (Fig. 5; repeated-measures ANOVA: F1, 16 = 4.6, P = 0.047).Over 2 winters, tall willow sites had a maximumsnow depth of 50.4 cm (SE = 2.3) whereasshort willow sites had 41.4 cm (SE = 2.8). Her-baceous and willow-shaded subplots within sitesdid not differ, indicating that willows did notcause significant snow drifting that would havecontributed to greater depth in the willow-shaded subplots.
Soil Net Nitrogen Mineralization Rate
Overall, tall willow sites had more than dou -ble the net NO3
– mineralization rates of shortwillow sites (3.5 × 10⁻⁵ vs. 1.6 × 10⁻⁵ g N ⋅g–1 dry soil ⋅ day–1; factorial ANOVA: F1, 547= 5.9, P = 0.015). Willow-shaded subplots hadgreater net NO3
– mineralization rates than
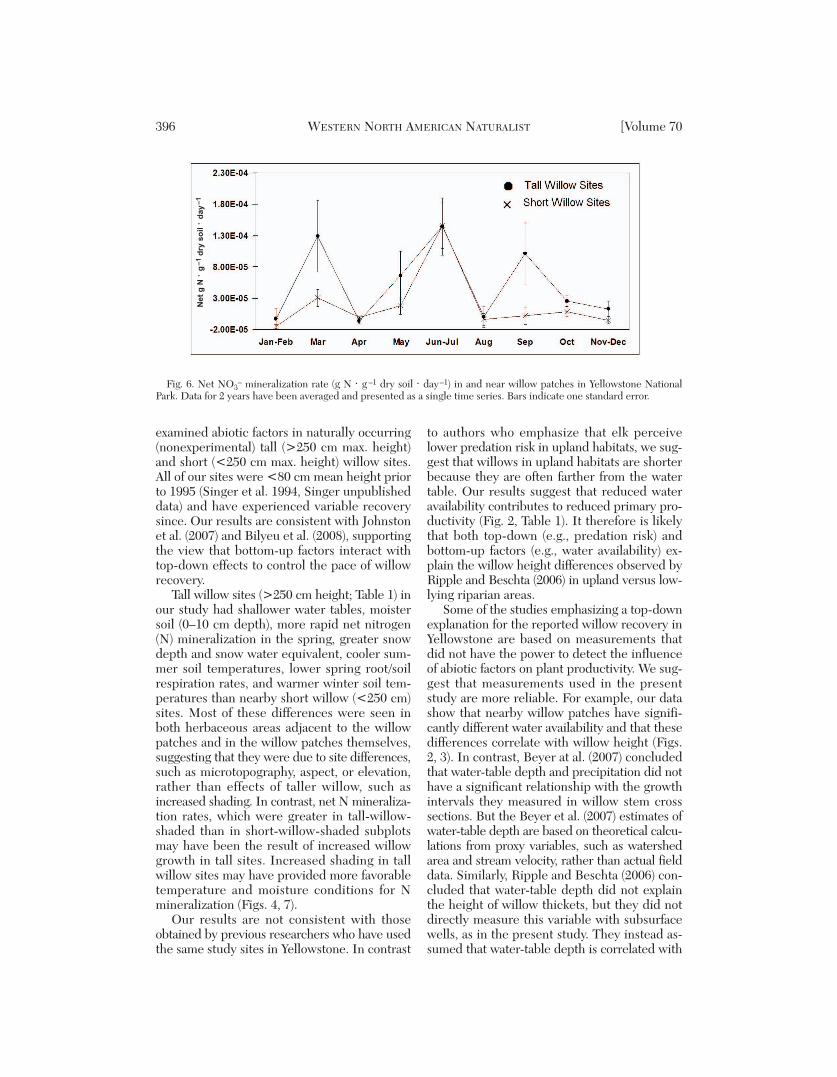
herbaceous subplots (factorial ANOVA: F1, 547= 7.3, P = 0.007). The difference between talland short willow sites was due to rapid miner-alization in the tall-willow-shaded subplots(Fig. 6) where rates were 2.9 times greater thanin short-willow-shaded subplots. In contrast,herbaceous subplots had equivalent net NO3
–
mineralization rates in tall and short sites (1.8× 10⁻⁵ vs. 1.1 × 10⁻⁵ g N ⋅ g–1 dry soil ⋅day–1, P > 0.05). The most rapid net NO3
–
mineralization rates occurred at peak snowmelt (March) in tall-willow-shaded subplots(Fig. 6). Net NH4
+ mineralization rates werenot significantly different either in tall versusshort willow sites or in herbaceous versus wil-low-shaded subplots within sites. As with netNO3
– mineralization rates, the most rapid netNH4
+ mineralization rates were observed intall-willow-shaded subplots at peak snowmelt.
Soil CO2 Efflux as an Index of Soil Respiration Rate
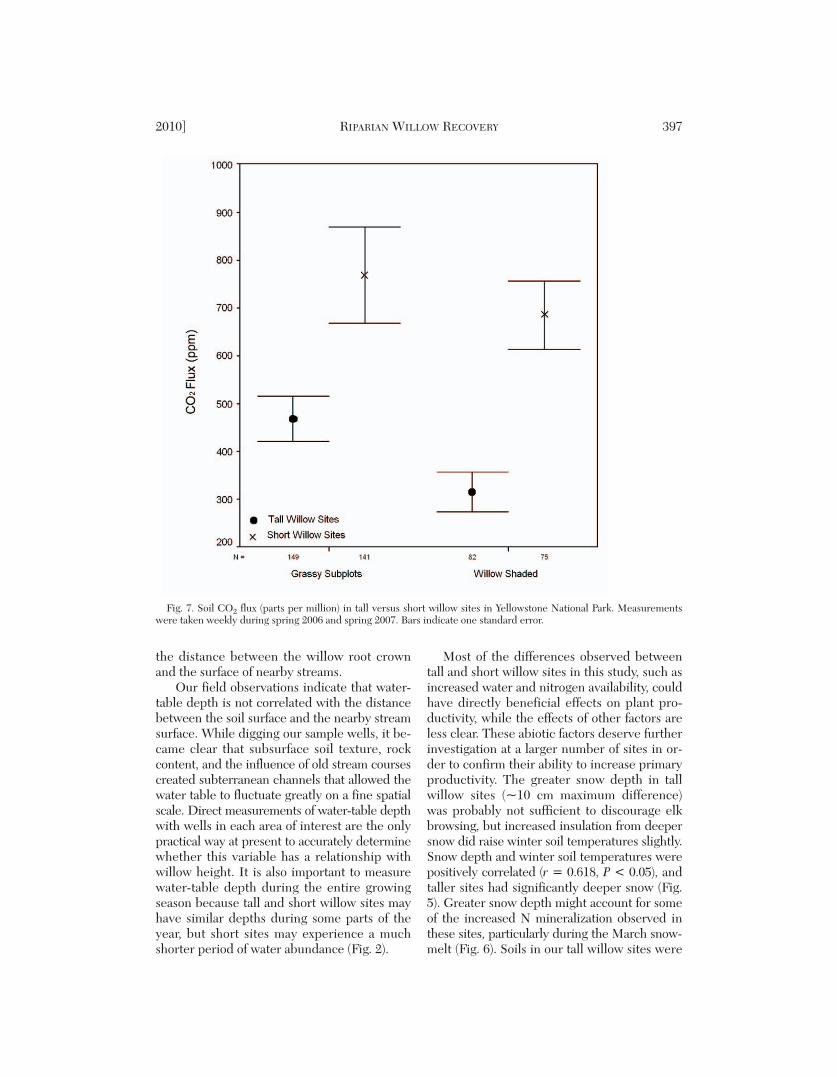
Soil CO2 efflux varied primarily as a functionof temperature. CO2 efflux had a strong corre-lation to soil temperature at the time of sam-ple collection (Pearson’s r = 0.8, P < 0.05). Asdescribed above, soils in short willow sites weresignificantly warmer than soils in tall willowsites, and herbaceous subplots were warmerthan shaded subplots in every season exceptwinter. Consequently, CO2 efflux was 2.4 timesgreater in short than tall willow sites, and thedifference was maintained in both herbaceous
2010] RIPARIAN WILLOW RECOVERY 393
Fig. 3. Percent soil moisture (gravimetric) in herbaceous subplots adjacent to tall versus short willow patches in Yel-lowstone National Park. Since the patterns were the same in both years of the study, data from 2 years have been aver-aged and presented as one year. Bars indicate one standard error.
and willow-shaded subplots. A multiple linearregression of temperature and moisture againstCO2 flux explained only 0.4% more of the vari -ance than a simple linear regression that usedtemperature as the only predictor variable (R2
= 0.645 vs. R2 = 0.641).
DISCUSSION
Willow height recovery since 1995 has notbeen uniform on Yellowstone’s northern range.
Willow patches in some areas have exceeded250 cm maximum height, allowing them to es -cape elk browsing (Keigley and Frisina 1998),while others, often nearby or adjacent, still havean average height of <80 cm (Tercek unpub-lished data). The behaviorally mediated trophic-cascade hypothesis explains this differentialre covery of riparian woody plants (willow, as -pens, and cottonwoods) as the result of the top-down effects of wolf predation on elk browsing;and it explicitly dismisses the importance of
394 WESTERN NORTH AMERICAN NATURALIST [Volume 70
Fig. 4. Weekly average soil temperatures at 15-cm depth in tall versus short willow patches in Yellowstone NationalPark. Temperatures were measured every 2 hours (25–70 data loggers used depending on season) in herbaceous sub-plots adjacent to the willow thickets and in willow-shaded subplots. Since data from both years of our study show thesame pattern, only one growing season is presented. Bars indicate one standard error.
Tem
pera
ture
( °
C)
Tem
pera
ture
( °
C)
Herbaceous Subplots
Willow-Shaded Subplots
abiotic factors such as water availability (Rippleand Beschta 2003, 2004a, 2004b, 2005, 2006,2007). This hypothesis was based primarily onobservations of site-specific characteristics, suchas proximity to wolf territory, escape impedi-ments for elk, and obstacles that would preventelk from seeing wolves. In contrast, studies thatfocused on elk and wolf movements over finetemporal and spatial scales have challenged thepredictions of the behaviorally mediated top-down theory (Creel and Winnie 2005, Creel etal. 2005, Christianson and Creel 2008, Creeland Christianson 2009). Most significantly, elkconsumed more willow when wolves were pre-sent in an area than when wolves were absent;and increased snow depth, which limits elkaccess to preferred herbaceous forage, had a
much stronger effect on the amount of willowconsumed by elk than the presence of wolves(Creel and Christianson 2009). These findingssuggest that wolves do affect elk browsing ofwillow, but the effects are opposite those pre-dicted by the behaviorally mediated trophic-cascade theory and not as strong.
Plant-based studies have presented an alter-native to research that focuses on elk or wolfbehavior. Using fenced exclosures and artificialdams, Johnston et al. (2007) and Bilyeu et al.(2008) concluded that abiotic bottom-up factorsthat have potential to limit plant productivityinteract with top-down mechanisms in Yellow-stone (Johnston et al. 2007, Bilyeu et al. 2008).
Rather than using fences and artificial damsto manipulate willow height, the present study
2010] RIPARIAN WILLOW RECOVERY 395
Fig. 5. Average snow depth (cm) during 2 winters (winter 2005–2006 and winter 2006–2007) in tall willow versusshort willow sites in Yellowstone National Park. Bars indicate one standard error.
Avera
ge s
no
w d
ep
th (
cm
)A
vera
ge s
no
w d
ep
th (
cm
)
Winter 2005–2006
Winter 2006–2007
examined abiotic factors in naturally occurring(nonexperimental) tall (>250 cm max. height)and short (<250 cm max. height) willow sites.All of our sites were <80 cm mean height priorto 1995 (Singer et al. 1994, Singer unpublisheddata) and have experienced variable recoverysince. Our results are consistent with Johnstonet al. (2007) and Bilyeu et al. (2008), supportingthe view that bottom-up factors interact withtop-down effects to control the pace of willowrecovery.
Tall willow sites (>250 cm height; Table 1) inour study had shallower water tables, moistersoil (0–10 cm depth), more rapid net nitrogen(N) mineralization in the spring, greater snowdepth and snow water equivalent, cooler sum-mer soil temperatures, lower spring root/soilrespiration rates, and warmer winter soil tem-peratures than nearby short willow (<250 cm)sites. Most of these differences were seen inboth herbaceous areas adjacent to the willowpatches and in the willow patches themselves,suggesting that they were due to site differences,such as microtopography, aspect, or elevation,rather than effects of taller willow, such asincreased shading. In contrast, net N mineraliza-tion rates, which were greater in tall-willow-shaded than in short-willow-shaded subplotsmay have been the result of increased willowgrowth in tall sites. Increased shading in tallwillow sites may have provided more favorabletemperature and moisture conditions for Nmineralization (Figs. 4, 7).
Our results are not consistent with thoseobtained by previous researchers who have usedthe same study sites in Yellowstone. In contrast
to authors who emphasize that elk perceivelower predation risk in upland habitats, we sug-gest that willows in upland habitats are shorterbecause they are often farther from the watertable. Our results suggest that reduced wateravailability contributes to reduced primary pro-ductivity (Fig. 2, Table 1). It therefore is likelythat both top-down (e.g., predation risk) andbottom-up factors (e.g., water availability) ex -plain the willow height differences observed byRipple and Beschta (2006) in upland versus low-lying riparian areas.
Some of the studies emphasizing a top-downexplanation for the reported willow recovery inYellowstone are based on measurements thatdid not have the power to detect the influenceof abiotic factors on plant productivity. We sug-gest that measurements used in the presentstudy are more reliable. For example, our datashow that nearby willow patches have signifi-cantly different water availability and that thesedifferences correlate with willow height (Figs.2, 3). In contrast, Beyer at al. (2007) concludedthat water-table depth and precipitation did nothave a significant relationship with the growthintervals they measured in willow stem crosssections. But the Beyer et al. (2007) estimates ofwater-table depth are based on theoretical calcu-lations from proxy variables, such as watershedarea and stream velocity, rather than actual fielddata. Similarly, Ripple and Beschta (2006) con-cluded that water-table depth did not explainthe height of willow thickets, but they did notdirectly measure this variable with subsurfacewells, as in the present study. They instead as -sumed that water-table depth is correlated with
396 WESTERN NORTH AMERICAN NATURALIST [Volume 70
Fig. 6. Net NO3– mineralization rate (g N ⋅ g –1 dry soil ⋅ day–1) in and near willow patches in Yellowstone National
Park. Data for 2 years have been averaged and presented as a single time series. Bars indicate one standard error.
Net
g N
⋅ g
–1
dry
so
il ⋅
day
–1
the distance between the willow root crownand the surface of nearby streams.
Our field observations indicate that water-table depth is not correlated with the distancebetween the soil surface and the nearby streamsurface. While digging our sample wells, it be -came clear that subsurface soil texture, rockcontent, and the influence of old stream coursescreated subterranean channels that allowed thewater table to fluctuate greatly on a fine spatialscale. Direct measurements of water-table depthwith wells in each area of interest are the onlypractical way at present to accurately determinewhether this variable has a relationship withwillow height. It is also important to measurewater-table depth during the entire growingseason because tall and short willow sites mayhave similar depths during some parts of theyear, but short sites may experience a muchshorter period of water abundance (Fig. 2).
Most of the differences observed betweentall and short willow sites in this study, such asincreased water and nitrogen availability, couldhave directly beneficial effects on plant pro-ductivity, while the effects of other factors areless clear. These abiotic factors deserve furtherinvestigation at a larger number of sites in or -der to confirm their ability to increase primaryproductivity. The greater snow depth in tallwillow sites (~10 cm maximum difference)was probably not sufficient to discourage elkbrowsing, but increased insulation from deepersnow did raise winter soil temperatures slightly.Snow depth and winter soil temperatures werepositively correlated (r = 0.618, P < 0.05), andtaller sites had significantly deeper snow (Fig.5). Greater snow depth might account for someof the increased N mineralization observed inthese sites, particularly during the March snow-melt (Fig. 6). Soils in our tall willow sites were
2010] RIPARIAN WILLOW RECOVERY 397
Fig. 7. Soil CO2 flux (parts per million) in tall versus short willow sites in Yellowstone National Park. Measurementswere taken weekly during spring 2006 and spring 2007. Bars indicate one standard error.
warm enough to undergo freeze-thaw cyclesduring the winter (data not shown), which hasbeen shown to stimulate the growth of a uniquemicrobial community that increases N miner-alization rates (Monson et al. 2006).
The importance of reduced root/soil respi-ration in tall willow sites deserves further study.Tall willow sites, which were more productive(Table 1), had lower soil respiration rates inboth their willow-shaded and herbaceous sub-plots, primarily because they had lower soiltemperatures (Fig. 4); but tall willow sites alsohad more rapid net N mineralization rates,which are largely controlled by the soil micro-bial community.
There are some caveats associated with thepresent study. We made intensive, repetitivemeasurements, but they were taken from a smallnumber of study sites. This small number wasprimarily due to the limited resources for thestudy and our desire to take advantage of datacollected from sites used by previous research-ers (Ripple and Beschta 2006, Johnston et al.2007, Bilyeu et al. 2008). The number of studysites used in this study is similar to the num-ber used by Johnston et al. (2007) and Bilyeuet al. (2008). Nevertheless, this study shouldbe regarded as preliminary until the patterns ob-served have been replicated across the entirenorthern range.
Our study did not measure elk browsinglevels, so it is impossible for us to make gen-eral statements about the relative importance oftop-down versus bottom-up factors. Neverthe-less, browsing levels measured in willow standsdirectly adjacent to our Blacktail Creek sitesduring our study period (Bilyeu et al. 2008)were not significantly different from thosemeasured in the same location prior to wolfreintroduction (Singer et al. 1994). This sug-gests that factors other than wolf-mediatedreductions in elk browsing are responsible forwillow height re covery in these areas. We sug-gest that the abiotic, resource-limiting, or bot-tom-up factors identified by this study deservefurther investigation. These factors may in -fluence the pace of willow recovery as muchas top-down mechanisms.
ACKNOWLEDGMENTS
This work was funded by a grant from theNatural Resources Protection Program (NRPP).We thank Linda Zeigenfuss (USGS) and Lorna
McIntyre for help with field work. We also thankChristie Hendrix and Christine Smith (NationalPark Service) for their help with research per-mits and logistics. Funding for this study wasoriginally obtained by Dr. Francis Singer (de -ceased), who spent many years as a wildlifeecologist in Yellowstone National Park. We thankDavid J. Cooper, Duncan Patten, Linda C. Zei-genfuss, Martha Apple, and 2 anonymous re -viewers for helpful comments on drafts of themanuscript.
LITERATURE CITED
ADAMS, M.A., AND P.M. ATTIWILL. 1986. Nutrient cyclingand nitrogen mineralization in eucalypt forests ofsoutheastern Australia. II. Indices of nitrogen min-eralization. Plant and Soil 92:341–362.
BESCHTA, R.L. 2003. Cottonwoods, elk, and wolves in theLamar Valley of Yellowstone National Park. Ecologi-cal Applications 13:1295–1309.
______. 2005. Reduced cottonwood recruitment followingextirpation of wolves in Yellowstone’s northern range.Ecology 86:391–403.
BEYER, H.L., E.H. MERRILL, N. VARLEY, AND M.S. BOYCE.2007. Willow on Yellowstone’s northern range: evi-dence for a trophic cascade? Ecological Applications17:1563–1571.
BILYEU, D.M., D.J. COOPER, AND N.T. HOBBS. 2008. Watertables constrain height recovery of willow on Yellow-stone’s northern range. Ecological Applications 18:80–92.
CHADDE, S., AND C. KAY. 1991. Tall-willow communitieson Yellowstone’s northern range: a test of the “nat-ural regulation” paradigm. Pages 231–262 in R.B.Keiter and M.S. Boyce, editors, The Greater Yellow-stone Ecosystem: redefining America’s wildernessheritage. Yale University Press, New Haven, CT.
CHRISTIANSON, D., AND S. CREEL. 2008. Risk effects in elk:sex-specific responses in grazing and browsing dueto predation risk from wolves. Behavioral Ecology19:1258–1266.
CREEL, S., AND J. WINNIE. 2005. Responses of elk herd sizeto fine-scale spatial and temporal variation in the riskof predation by wolves. Animal Behavior 69:1181–1189.
CREEL, S., AND D. CHRISTIANSON. 2009. Wolf presenceand increased willow consumption by Yellowstone elk:implications for trophic cascades. Ecology 90:2454–2466.
CREEL, S., J. WINNIE, B. MAXWELL, K. HAMLIN, AND M.CREEL. 2005. Elk alter habitat selection as an anti-predator response to wolves. Ecology 86:3387–3397.
DESPAIN, D.G. 1990. Yellowstone vegetation, consequencesof environment and natural history in a natural set-ting. Roberts Rinehart Publishers, Boulder, CO.
EBERHARDT, L.L., P.J. WHITE, R.A. GARROTT, AND D.B.HOUSTON. 2007. A seventy-year history of trends inYellowstone’s northern elk herd. Journal of WildlifeManagement 71:594–602.
FORTIN, D., H.L. BEYER, M.S. BOYCE, D.W. SMITH, T.DUCHESNE, AND J.S. MAO. 2005. Wolves influenceelk movements: behavior shapes a trophic cascade inYellowstone National Park. Ecology 86:1320–1330.
398 WESTERN NORTH AMERICAN NATURALIST [Volume 70

JOHNSTON, D.B., D.J. COOPER, AND N.T. HOBBS. 2007. Elkbrowsing increases above-ground growth of water-stressed willows by modifying plant architecture.Oecologia 154:467–478.
KAUFFMAN, M., N. VARLEY, D. SMITH, D. STAHLER, D. MAC-NULTY, AND M. BOYCE. 2007. Landscape heterogeneityshapes predation in a newly restored predator-preysystem. Ecology Letters 10:690–700.
KEIGLEY, R.B., AND M.R. FRISINA. 1998. Browse evaluationby analysis of growth form. Volume 1, Methods forevaluating condition and trend. Montana Fish, Wildlifeand Parks, Bozeman, MT.
LARSEN, E.J., AND W.J. RIPPLE. 2003. Aspen age structurein the northern Yellowstone Ecosystem, USA. ForestEcology and Management 179:469–482.
LEMKE, T.O., J.A. MACK, AND D.B. HOUSTON. 1998. Win-ter range expansion by the northern Yellowstone elkherd. Intermountain Journal of Sciences 4:1–9.
LIVINGSTON, G.P., AND G.L. HUTCHINSON. 1995. Enclo-sure-based measurement of trace gas exchange: ap -plications and sources of error. Pages 14–51 in P.A.Matson and R.C. Hariss, editors, Biogenic trace gases:measuring emissions from soil and waters. BlackwellScientific, London.
MEYERS, J.L., AND A.D. WELL. 1995. Research design andstatistical analysis. Lawrence Erlbaum Associates,Publishers, Hillsdale, NJ.
MONSON, R.K., D.L. LIPSON, S.P. BURNS, A.A. TURNIP -SEED, A.C. DELANY, M.W. WILLIAMS, AND S.K.SCHMIDT. 2006. Winter forest soil respiration con-trolled by climate and microbial community compo-sition. Nature 439:711–714.
MOSIER, A.R., A.D. HALVORSON, C.R. REULE, AND X.J. LIU.2006. Net global warming potential and greenhousegas intensity in irrigated cropping systems in North-eastern Colorado. Journal of Environmental Quality35:1584–1598.
NATIONAL RESEARCH COUNCIL. 2002. Ecological dynam-ics on Yellowstone’s Northern Range. National Acad-emy Press, Washington, DC.
RIPPLE, W., E. LARSEN, R. RENKIN, AND D.W. SMITH. 2001.Trophic cascades among wolves, elk, and aspen onYellowstone National Park’s northern range. Biologi-cal Conservation 102:227–234.
RIPPLE, W.J., AND R.L. BESCHTA. 2003. Wolf reintroduction,predation risk, and cottonwood recovery in Yellow-stone National Park. Forest Ecology and Manage-ment 184:299–313.
______. 2004a. Wolves and the ecology of fear: can predationrisk structure ecosystems? Bioscience 54:755–766.
______. 2004b. Wolves, elk, willows, and trophic cascadesin the upper Gallatin Range of southwestern Montana,USA. Forest Ecology and Management 200:161–181.
______. 2005. Willow thickets protect young aspen fromelk browsing after wolf reintroduction. Western NorthAmerican Naturalist 65:118–122.
______. 2006. Linking wolves to willows via risk-sensitiveforaging by ungulates in the northern YellowstoneEcosystem. Forest and Ecology Management 230:96–106.
______. 2007. Restoring Yellowstone’s aspen with wolves.Biological Conservation 138:514–519.
SINGER, F.J., L.C. MARK, AND R.C. CATES. 1994. Ungulateherbivory of willows on Yellowstone’s northern win-ter range. Journal of Range Management 47:435–443.
WAGNER, F.H. 2006. Yellowstone’s destabilized ecosystem:elk effects, science, and policy conflict. Oxford Uni-versity Press, New York, NY.
Received 16 June 2009Accepted 12 February 2010
2010] RIPARIAN WILLOW RECOVERY 399