
It’s all about peace of mind - F-Secure
59
Protecting the irreplaceable It’s all about peace of mind ANNUAL REPORT 2011
Transcript of It’s all about peace of mind - F-Secure
Protecting the irreplaceable
It’s all about peace of mindANNUAL REPORT 2011

CONTENTSF-SECurE iN briEF 1YEar 2011 iN briEF 3CEO lETTEr 2011 4bOard OF dirECTOrS’ rEpOrT 2011 6
FiNaNCial STaTEmENTS, F-SECurE CONSOlidaTEd STaTEmENT OF COmprEhENSivE iNCOmE 14STaTEmENT OF FiNaNCial pOSiTiON 15STaTEmENT OF CaSh FlOwS 16STaTEmENT OF ChaNgES SharEhOldErS’ EquiTY 17NOTES TO ThE FiNaNCial STaTEmENTS 18
F-SECurE COrpOraTiON iNCOmE STaTEmENT 38balaNCE ShEET 38CaSh FlOw STaTEmENT 39NOTES TO ThE FiNaNCial STaTEmENTS 40
audiTOrS’ rEpOrT 48COrpOraTE gOvErNaNCE STaTEmENT 49bOard OF dirECTOrS 52ExECuTivE TEam 53SummarY OF STOCk ExChaNgE rElEaSES 54iNFOrmaTiON FOr SharEhOldErS 55CONTaCT iNFOrmaTiON 56
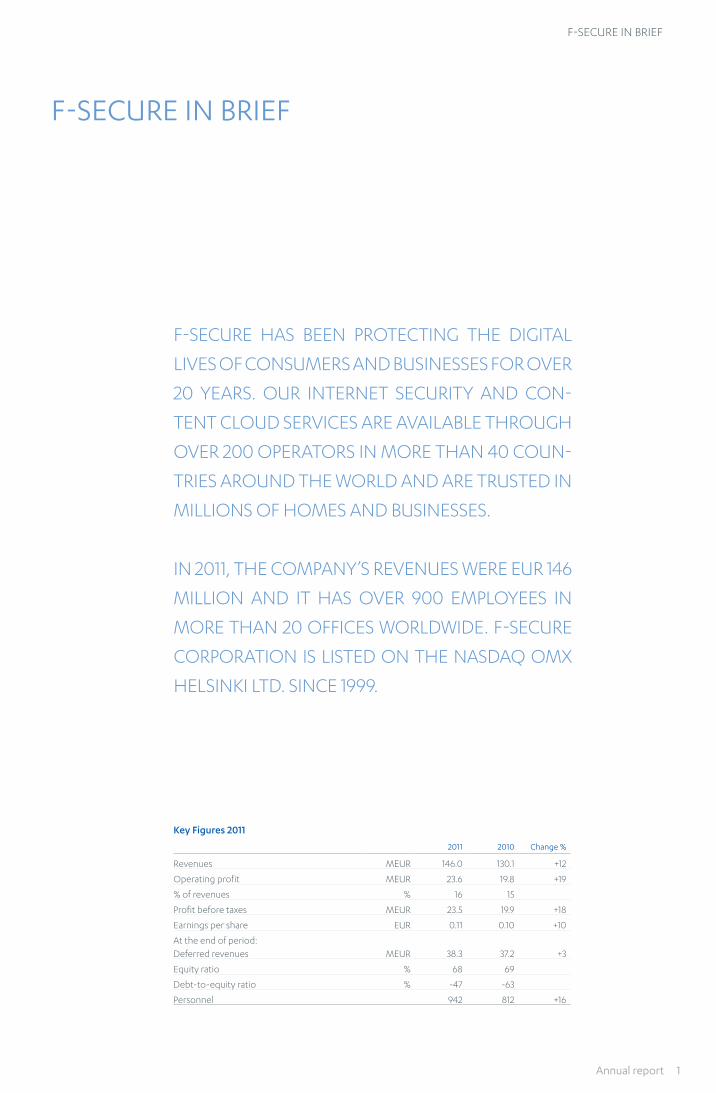
F-Secure haS been protecting the digital
liveS oF conSumerS and buSineSSeS For over
20 yearS. our internet Security and con-
tent cloud ServiceS are available through
over 200 operatorS in more than 40 coun-
trieS around the world and are truSted in
millionS oF homeS and buSineSSeS.
in 2011, the company’S revenueS were eur 146
million and it haS over 900 employeeS in
more than 20 oFFiceS worldwide. F-Secure
corporation iS liSted on the naSdaQ omX
helSinki ltd. Since 1999.
Key Figures 2011
2011 2010 Change %
revenues meur 146.0 130.1 +12
operating profit meur 23.6 19.8 +19
% of revenues % 16 15
profit before taxes meur 23.5 19.9 +18
earnings per share eur 0.11 0.10 +10
at the end of period: deferred revenues meur 38.3 37.2 +3
equity ratio % 68 69
debt-to-equity ratio % -47 -63
personnel 942 812 +16
F-Secure in brieF
F-SECURE IN bRIEF
Annual report 1
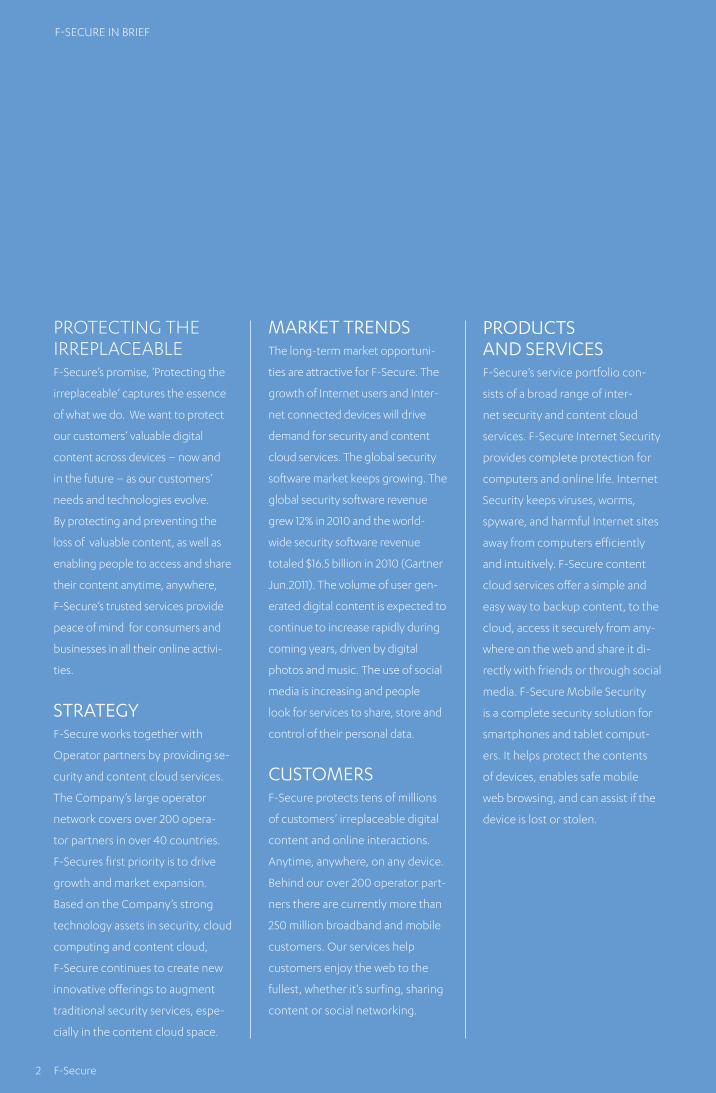
protecting the irreplaceable F-Secure’s promise, ‘protecting the
irreplaceable’ captures the essence
of what we do. we want to protect
our customers’ valuable digital
content across devices – now and
in the future – as our customers’
needs and technologies evolve.
by protecting and preventing the
loss of valuable content, as well as
enabling people to access and share
their content anytime, anywhere,
F-Secure’s trusted services provide
peace of mind for consumers and
businesses in all their online activi-
ties.
STRATEgYF-Secure works together with
operator partners by providing se-
curity and content cloud services.
the company’s large operator
network covers over 200 opera-
tor partners in over 40 countries.
F-Secures first priority is to drive
growth and market expansion.
based on the company’s strong
technology assets in security, cloud
computing and content cloud,
F-Secure continues to create new
innovative offerings to augment
traditional security services, espe-
cially in the content cloud space.
mARkET TRENdSthe long-term market opportuni-
ties are attractive for F-Secure. the
growth of internet users and inter-
net connected devices will drive
demand for security and content
cloud services. the global security
software market keeps growing. the
global security software revenue
grew 12% in 2010 and the world-
wide security software revenue
totaled $16.5 billion in 2010 (gartner
Jun.2011). the volume of user gen-
erated digital content is expected to
continue to increase rapidly during
coming years, driven by digital
photos and music. the use of social
media is increasing and people
look for services to share, store and
control of their personal data.
CUSTOmERSF-Secure protects tens of millions
of customers’ irreplaceable digital
content and online interactions.
anytime, anywhere, on any device.
behind our over 200 operator part-
ners there are currently more than
250 million broadband and mobile
customers. our services help
customers enjoy the web to the
fullest, whether it’s surfing, sharing
content or social networking.
PROdUCTS ANd SERvICESF-Secure’s service portfolio con-
sists of a broad range of inter-
net security and content cloud
services. F-Secure internet Security
provides complete protection for
computers and online life. internet
Security keeps viruses, worms,
spyware, and harmful internet sites
away from computers efficiently
and intuitively. F-Secure content
cloud services offer a simple and
easy way to backup content, to the
cloud, access it securely from any-
where on the web and share it di-
rectly with friends or through social
media. F-Secure mobile Security
is a complete security solution for
smartphones and tablet comput-
ers. it helps protect the contents
of devices, enables safe mobile
web browsing, and can assist if the
device is lost or stolen.
F-Secure in brieF
2 F-Secure
F-Secure in brieF
year 2011 in brieF
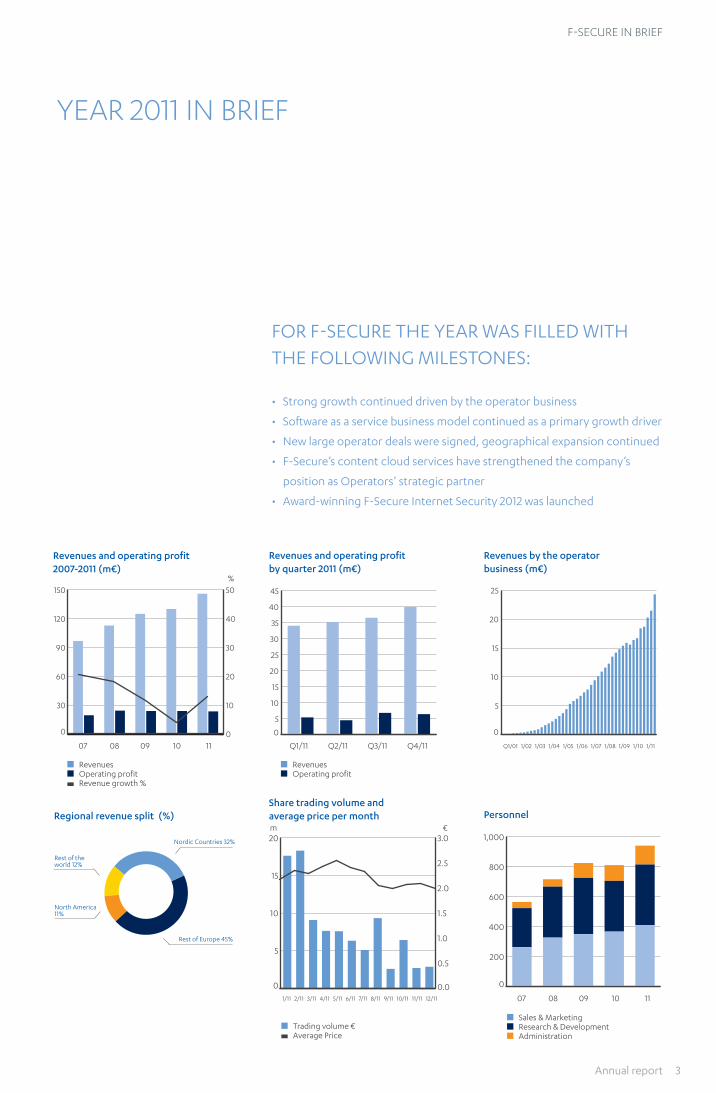
FOR F-SECURE ThE YEAR wAS FILLEd wITh ThE FOLLOwINg mILESTONES:
• Strong growth continued driven by the operator business
• Software as a service business model continued as a primary growth driver
• New large operator deals were signed, geographical expansion continued
• F-Secure’s content cloud services have strengthened the company’s
position as Operators’ strategic partner
• Award-winning F-Secure Internet Security 2012 was launched
0
5
10
15
20
25
0
30
60
90
120
150
0
10
20
30
40
50
Revenues and operating profit 2007-2011 (m€)
07 08 09 10 11
0
5
10
15
20
25
30
35
40
45
Revenues and operating profit by quarter 2011 (m€)
q1/11 q2/11 q3/11 q4/11
Revenues by the operator business (m€)
q1/01 1/02 1/03 1/04 1/05 1/06 1/07 1/08 1/09 1/10 1/11
%
Revenues Operating profit Revenue growth %
Revenues Operating profit
Regional revenue split (%)
Nordic Countries 32%
Rest of Europe 45%
North America 11%
Rest of the world 12%
0
5
10
15
20
0.0
0.5
1.0
1.5
2.0
2.5
3.0
Share trading volume and average price per month
0
200
400
600
800
1,000
Personnel
07 08 09 10 11
Sales & marketing Research & development Administration
Trading volume € Average Price
1/11 2/11 3/11 4/11 5/11 6/11 7/11 8/11 9/11 10/11 11/11 12/11
m €
Annual report 3
2011 – Accelerating and profitable growth of revenues driven by the operator channel
This years’ CEO letter is written in the heart
of Silicon Valley in Northern California. The
San Francisco Bay Area is still unique when
it comes to innovation. It is a source of
inspiration for growing businesses and
those in the process of venturing into
something new, and although several
countries have tried to mimic the area’s
success, it has always retained its edge. It
provides a good environment to reflect on
F-Secure and where the market is heading.
The entire world has lived through
challenging times during 2011 in terms of
where the global economy has been
heading. The media has been covered with
news of the economic turmoil in Europe
and the USA alike. Unemployment in both
America and Europe remains high and the
European debt crisis still remains an issue.
Strong position in operator business
The year 2011 was a busy one and full of
changes for us. Thanks to our relentless
efforts we were able to demonstrate good
performance in our business as forecasted,
resulting in strong revenues and healthy
profitability. During 2011, we executed our
strategy offering internet security and
content cloud services through our
200-plus operator partners globally. There
were globally more than 250 million
Internet broadband subscribers behind
these operators. Our product and service
offering is based on the development of
easy to use products and services for
customers for distribution by operators.
The common target group of F-Secure and
the operators is consumers, who value
good quality of service, ease of buying,
uncomplicated invoicing and local cus-
tomer support. This creates added value for
our operator partners. Together with our
operator partners, we differentiate
ourselves from both commercial and free
Internet services, thereby strengthening
our long-term growth and competitive-
ness.
The use of Internet has quickly expanded
from the PC-based world into various types
of terminal devices. As a consequence,
consumers need to be able to access their
files regardless of the device they are using,
which is creating demand for services
enabling files to be accessed elsewhere
than just on the devices on which they were
created, also allowing for files to be shared
easily. F-Secure’s background in data
security and the local presence of opera-
tors form a natural basis for the release of
personal content and other files from the
chains of local hard drives into the so-
called cloud services. Our entry into the
content cloud market has strengthened
our attractiveness as a long-term strategic
partner. Our operator business has
continued to perform very well proving the
functioning of our strategy. This is a good
basis on which to continue.
Changing over
I have been taking care of the CEO’s duties
in addition to my regular work for close to
three months. Now that our new CEO
Christian Fredrikson is taking up the reins,
I will continue to focus on my duties as the
CTO here in Silicon Valley. I warmly
welcome Christian to the company and
look forward to the new challenges that we
will take on during the forthcoming period.
At the same time, I would like to thank our
personnel for their significant contribution
and flexibility during the year. I also extend
my deepest thanks to our shareholders,
customers and partners for trusting
F-Secure.
Pirkka Palomäki
CTO and interim CEO
Nov.1, 2011–Jan.16, 2012
“The year 2011 has
been a busy one for
us. Thanks to our
relentless efforts
we were able to
demonstrate good
performance in our
business resulting in
strong revenues and
healthy profitability.”
CEO LETTER
4 F-Secure
ceo letter
exciting times are ahead
I accept the duties of F-Secure’s CEO with
an enthusiastic attitude. F-Secure is a
global, strongly growing company, with
excellent opportunities to continue this
growth.
The long-term market is attractive for
F-Secure. The number of Internet users is
growing significantly as a result of
increased numbers of both fixed and
mobile broadband connections and devices
using the Internet, such as tablets and
smartphones. These factors increase the
demand for information security services
and cloud-based storage services and
create needs for new services. Even with
better and safer operating systems than
before, the number of security threats is
still on the increase, which highlights the
need for separate information security
solutions. Cloud services, such as backup,
storage, sharing and synchronisation, are
expected to create major business oppor-
tunities for the entire software industry in
the near future. The volume of digital
content produced by users is expected to
increase rapidly in the coming years; this
applies especially to digital photos and
music. People are looking for services to
manage their personal files. F-Secure works
with operators to offer information security
and back-up services that help the opera-
tors compete with Internet-based services.
Strong growth and improved profitability
I will continue to develop F-Secure based on
the existing strategy in close co-operation
with our personnel and our operator
partners. I will use my time to meet custom-
ers and refine our growth strategy. we will
focus on strong growth and drive for a
sustainable improvement in profitability
from the next year onwards. The develop-
ment of our products and services, utilising
new business opportunities, and strength-
ening our market position, especially in the
western markets and in certain developing
geographical areas, is important for us.
Supporting this growth will also require
some new experts to join us.
Lots of opportunities are on the horizon
in the current market as operators are
developing new services for their custom-
ers, creating entirely new kinds of business
models. It is our goal to support the
operators in the implementation of these
services as an innovative and professional
partner.
Christian Fredrikson
CEO from 16 January 2012
“lots of opportuni-
ties are on the ho-
rizon in the current
market as operators
are developing new
services for their
customers, creating
entirely new kinds of
business models. it is
our goal to support
the operators in the
implementation of
these services as an
innovative and pro-
fessional partner.”
Annual report 5
board of directors’ report
In 2011, F-Secure Corporation’s business performed well mainly
because of strong sales by the operator channel and solid perfor-
mance in the traditional license business. Revenue growth was
driven by healthy demand for Internet security and content cloud
services in the operator channel. F-Secure signed several new signif-
icant operator partnerships during the year. The Board of Directors
approved a renewed growth strategy and appointed new CEO.
Financial performance and key figures
In 2011, F-Secure continued its profitable growth. Annual revenues were
in total of 146.0 million (130.1m), representing a growth of 12%. Revenue
growth through the operator channel remained strong with 26% growth
from the previous year, totaling 84.8 million (67.1m). Revenues through
other channels were, as anticipated, down by 3%, totaling 61.2 million
(63m). EBIT was 23.6 million (19.8m/21.8m excl. re-structuring costs in
Q410), representing 16% of revenues (15%/17%). Operating profit some-
what increased from the previous year.
Earnings per share were EUR 0.11 (EUR 0.10). Operating margin was
16%, approximately on the same level than in 2010. Cash flow from oper-
ations was 20.8 million positive (23.2m positive). Deferred revenues were
38.3 million at the end of December (37.2m) due to good sales in the
license business.
Total fixed costs were 115.9 million (103.2m), 12% higher than in the
previous year. The cost increases were mainly allocated to well-progress-
ing geographic expansion in Latin America, content cloud project deliv-
eries, and R&D to increase the competitiveness of PC and mobile device
(e.g. iOS, Android, Windows) solutions and content cloud development.
In the beginning of the year, F-Secure gave guidance for company
revenues and profitability, which was further defined in connection with
the publication of interim reports. The company’s revenues and profita-
bility were in accordance with the given guidance (latest guidance: reve-
nue growth 10-12 % and operating profit 16-18 % of revenues).
In 2011, the geographical breakdown of revenues was as follows: Fin-
land and Scandinavia 32% (33%), Rest of Europe 45% (46%), North Amer-
ica 11% (9%) and Rest of the World 12% (12%).
Further information on the key financial data is presented in note 27
to the financial statements.
Operator channel
The Operator channel, which includes Internet service providers, mobile
operators and cable operators, is the main channel through which
F-Secure services are delivered. F-Secure has more than 200 partners in
over 40 countries with an addressable market of over 250 million fixed
and mobile broadband customers. The total number of F-Secure’s oper-
ator partners is significantly larger than that of any other security service
vendor.
F-Secure provides, through Operators, security and content cloud
services that are easy and intuitive to use for mainstream consumers.
F-Secure currently generates a majority of its revenues from the Security
as a Service business where Operators sell security service subscriptions
to protect their customers against Internet threats. Revenue growth in
this area has been driven by increasing security subscriber numbers
within the customer base of existing and new operator partners.
Business potential has been supported by the growth of fixed and
mobile broadband connections, natural demand for security services as
well as relatively low take-up rates. Internet security services for smart-
phones and tablet devices currently generate a small portion of F-Secure
and market-wide volumes. The mobile security landscape has started to
change recently due to smartphone and tablet sales growth. Internet
users connect to the Internet increasingly often with other devices
besides computers. F-Secure monitors this development closely and
enhances its service portfolio according to market development.
Content cloud services, such as cloud-based storage, sharing and
synchronization, are expected to become a major business opportunity
for the software industry. F-Secure’s entry into content cloud services
has strengthened the Company’s position as a strategic partner to the
Operators. Overall interest in the content cloud business among Opera-
tors is high. Currently, F-Secure has tens of Operator partners, which
offer content cloud services, mostly standard on-line backup. Growth
potential is seen both in expanding new services to the current customer
base as well as providing new services for the partners already selling
F-Secure’s Internet security.
F-Secure has increased its investments, mostly in the content cloud
business but also in security services. In addition to new mainstream
operating systems, such as Android, iOS and Windows, the Company is
investing in platform development. These investments ensure the scala-
bility and competiveness of these services and allow Operators to offer
F-Secure services, both PC and mobile, to a wide subscriber base. These
investments in R&D made during the past two years will increase the
Company’s depreciation level affecting profitability during the next few
years.
The co-operation with AT&T in the area of content cloud services has
proceeded very well. F-Secure has delivered a new version of the con-
tent cloud platform for the company. The delivery was made in schedule
and according to expectations. Financials for 2011 include revenues from
AT&T project deliveries and initial commitment of subscriber revenues.
User-based subscriber revenues are expected to grow after the public
launch of services.
During 2011, F-Secure has entered into partnerships with Telefonica
and several other operators in Latin America, one of the fastest growing
Internet user markets. These long term regional partnerships enable
F-Secure to reach major wireless and mobile broadband subscriber bases
with its Internet protection and storage related services. Additional
operator partner launches in several Latin American countries are
expected to take place in the upcoming quarters.
Annual revenues by the operator channel showed growth of 26% and
totaled 84.8 million (67.1m), representing 61% (52%) of the Company’s
total revenues. The growth was driven by good security sales and
increases in subscriber numbers and supported by content cloud reve-
nues.
Other channels
Other channels consist mainly of traditional license sales to consumers
through eStore and retail, i.e. new licenses and renewals of Internet
security and online backup for PCs and mobile devices. The other chan-
nels business also includes a wide range of Internet security services to
corporate customers through the global reseller network.
board of directors’ report 2011
6 F-Secure
board of directors’ report
board of directors’ report 2011 Annual revenues in the other channels business were as anticipated,
showing a decline of 3% and totaled 61.2million (63.0m), which is 39%
(48%) of the company’s total revenues. Customer satisfaction in security
services continued at a high level, which was visible in healthy license
renewal sales. Deferred revenues at the end of December were 38.3 mil-
lion (37.2m).
Products, services and technologies and key product announcements
F-Secure develops and sells Internet security and content cloud ser-
vices that support personal computers, servers and an increasing set
of major smartphone and tablet operating systems. Services include
broad security suites such as anti-virus, browsing protection and
parental control as well as content cloud services like on-line back-up,
synching, and sharing.
F-Secure is investing further in the content cloud business and in
security services. In addition to mainstream operating systems, such as
Android, iOS and Windows, the Company is investing in platform devel-
opment. These investments ensure the scalability and competiveness of
services and allow Operators to offer F-Secure services, both PC and
mobile, to a wide subscriber base.
Cloud computing has for the past few years been at the center of the
company’s technology strategy and choices. F-Secure uses cloud for two
purposes: for Real-time Protection Network and for content cloud. Real-
time Protection Network moves certain processing and memory inten-
sive functions from the end-user device to the cloud, making the client
software one of the fastest in the industry. Furthermore, by harnessing
the collective intelligence of client systems, the real-time protection
network is able to detect and react to new emerging threats a magni-
tude faster, and to provide protection to different device categories,
such as smartphones. This technology provides reputations of files, sites
and URLs and is utilized broadly in F-Secure solutions.
F-Secure has made significant investments in content cloud technol-
ogy. F-Secure’s carrier-grade cloud storage platform gives F-Secure the
scalability and flexibility to tackle even the most complex requirements
of the largest operators in the world, while at the same time making
small deployments feasible to enable new solutions to be trialed in a fast
and incremental manner.
The combination of security and content cloud-based technologies
will in the future allow F-Secure to create new and innovative solutions
for personal computers, smartphones and other devices.
F-Secure puts emphasis on user experience design when developing
services. User experience designers, marketers and developers utilize
consumer research, focus groups and usability tests to explore con-
sumer needs and validate new product and service prototypes with con-
sumers, thereby ensuring that they are appealing and usable when intro-
duced to the public. User experience, along with technical performance,
is crucial for the commercial success of solutions and services.
During 2011 the key product announcements were as follows:
• In December, F-Secure introduced a new version of F-Secure Online
Backup, which automatically makes backup copies of pictures, music
and other important content saved on the computer and stores these
backups on secure servers on the Internet. Backup occurs automati-
cally whenever the computer is connected to the Internet.
• In December, F-Secure introduced F-Secure Mobile Backup, which
offers a worry-free way to back up a user’s mobile specific content
such as contacts, sms’s, photos and videos. The solution can also be
used to ease swapping from one phone to another and it only takes a
couple of clicks to share content stored on the device with friends
and family. The solution supports Android, Symbian, iOS and Black-
berry operating systems.
• In November, F-Secure unveiled a new version of Mobile Security,
F-Secure Mobile Security 7.5, which features improved cloud based
security and a number of new features for Parental Control, such as
Safe Applications, Safe Contacts and an End User Web Portal for man-
aging the Anti-Theft functionalities. F-Secure Mobile Security is also
available for BlackBerry.
• In November, F-Secure broadened its Security as a Service offering to
cover also resellers. F-Secure is the first security vendor to offer its
complete business portfolio as a service.
• In October, F-Secure announced a new version of its flagship Internet
security service, F Secure Internet Security™ 2012. F-Secure Internet
Security 2012 is based on new technology architecture and offers
extraordinary ease-of-use, with multi-layered protection and fast per-
formance for computers.
• In June, F-Secure introduced a new version of its mobile security
product, F-Secure Mobile Security 7. F-Secure Mobile Security 7 is a
complete security solution for smartphones and tablet computers.
• In May, F-Secure launched F-Secure Anti-Virus for Mac for home users
and businesses. The product has been designed with performance in
mind, making it easy and fast to use. It gives real-time protection
against all Mac-based threats, automatically detecting and removing
any malware.
• In May, F-Secure launched F-Secure Protection Service for Email,
which is an effective and hassle-free email security service for small
and medium enterprises. F-Secure Protection Service for Email is a
cloud-based offering powerful real-time protection for email against
unwanted content, viruses and spyware, as well as spam control.
• In March, F-Secure introduced a new Partner Portal for its resellers.
The portal provides advanced online tools for resellers that help them
to react quickly and efficiently to end-customers’ needs, boosting
sales and customer service.
• In March, F-Secure Policy Manager 10 was introduced to the corpo-
rate segment. F-Secure Policy Manager 10 delivers a new level of
effectiveness by automating daily security operations. IT security
management now requires less manual work. F-Secure Policy Man-
ager 10 automates daily operations like protecting new computers
and the removal of disconnected hosts.
• In February, a new version of F-Secure’s Protection Service for Mobile
(PSM 7) was introduced. The Protection Service for Mobile enables
operators to offer comprehensive protection and parental control for
their customers’ mobile devices.
• In January 2011, F-Secure received the “Product of the Year” award
issued by AV-Comparatives, one of the major independent testing
organizations in the industry. The testing organization described
Internet Security 2011 as a well-designed product with a clear and
easy-to-use interface.
Research and development
In 2011, the Group’s research and development expenses totaled 39.3m
(34.5m). R&D expenses were 26.9% of revenues. F-Secure capitalized
some of its R&D expenses according to accounting rules, totaling 7.8
million (2.3m) and booked write-offs of 1 million related to prior R&D
investments. For 2012, approximately 7 million of cost increase is arising
from the end of development activations of new platforms and increased
depreciations.
Market situation
During the year, the Internet security space experienced no significant
changes in the competitive landscape or in pricing levels. Usual signs of
price competition are evident in some countries in the security market,
especially in the traditional license business. Commercial interest in the
content cloud business is picking up with the introduction of new cloud
services to the market. Many of F-Secure’s traditional competitors are
also entering the content cloud business.
Financial Statements 2011 7

board of directors’ report
F-Secure’s competitive position in the operator channel has remained
strong. The growth of fixed and mobile broadband access supports the
position of operators in providing security and content cloud services.
Personnel and organization
F-Secure’s personnel totaled 942 at the end of December 2011 (812). The
number of personnel has continued to increase especially in sales and
marketing, project delivery and R&D in respect to content cloud busi-
ness.
F-Secure’s President and CEO Kimmo Alkio resigned as of October 31,
2011 in order to pursue another career opportunity. The Board immedi-
ately initiated the search for new CEO after being informed on the resig-
nation in the summer. The Board appointed Pirkka Palomäki, Chief Tech-
nology Officer, as interim CEO as of November 1, 2011. After a thorough
recruiting process, the Board appointed Christian Fredrikson as new
President and CEO as of January 16, 2012. Mr. Fredrikson joined F-Secure
from Nokia Siemens Networks, where he worked in several international
executive positions from 1994. In the process, the Board especially val-
ued his strong experience in the operator business as well as interna-
tional experience.
Currently, the Executive Team consists of the following persons:
Christian Fredrikson (President and CEO), Ari Alakiuttu (Human
Resources), Tuomas Hyyryläinen (Strategy and M&A), Samu Konttinen
(Sales and Marketing), Maria Nordgren (Channels), Pirkka Palomäki
(Chief Technology Officer), Kari Penttilä (R&D), Patrik Sallner (Profes-
sional Services) and Taneli Virtanen (Chief Financial Officer). Pirkka Palo-
mäki was acting CEO during November 1, 2011 – January 15, 2012.
President and CEO Christian Fredrikson started in his position in
F-Secure on January 16, 2012. Pirkka Palomäki continued in his previous
position as CTO based in the U.S., as of January 16, 2012.
Financing and capital structure
F-Secure’s financial position remained solid. F-Secure’s equity ratio at
the end of year was 68% (69%) and gearing ratio was 47% negative
(63% negative).
Cash flow from operations for the year was 20.8 million positive
(23.2m positive); lower than in the previous year mainly due to increased
capex and activations. Net financial income was slightly negative at 0.1m,
impacted by low interest income and exchange rates losses (0.0m).
The Company’s cash position has developed according to the longer
term efficient capital management objectives. The market value on
December 31, 2011 of the liquid assets of F-Secure was 28.1 million
(32.8m). Return on equity was 29.5% (30.3%).
Changes in exchange rates did not have material impact on sales and
costs.
Capital expenditure
F-Secure’s capital expenditure for the year was 18.7 million (10.4m), con-
sisting mainly of capitalization of development expenses for operator
platforms and applications for both security and content cloud services.
Capital management and repurchase of own shares
The objective of F-Secure’s capital management is to achieve an efficient
capital structure that ensures the functioning of business operations and
promotes the increase of shareholder value. During 2011, the Company
continued its share buy-back program. In the repurchase of own shares
between June 8 and November 11, 2012, F-Secure bought in a total of
700,000 shares.
The share buy-back program is based on the authorization of the
Annual General Meeting of March 30, 2011. The maximum number of
shares to be repurchased is 2,000,000 shares, representing a maximum
of approximately 1.3% of all shares issued by the Company. The shares
are purchased through public trading on the NASDAQ OMX Helsinki Ltd.
in accordance with its rules and at market price. These own shares will be
purchased in order to improve the Company’s financial structure, to be
used as part of the incentive compensation plan, or to be used for the
purpose of making acquisitions or implementing other arrangements
related to the Company’s business, or otherwise assigning or cancelling
the shares.
Including all shares bought, the total number of own shares held at
the end of December 2011 was 4,007,313 shares, corresponding to
approximately 2.5% of the Company’s shares and voting rights.
In January 2012, the company assigned a total of 274,923 shares to the
21 participants of the F-Secure share-based incentive program as a
reward payment. The handover date for the shares was January 13, 2012.
After the transfer, F-Secure Corporation currently holds a total of
3,732,390 of its own shares.
Shares, shareholders’ equity and option programs
In November, a total of 418,081 F-Secure shares were subscribed for with
the C warrants attached to the F-Secure 2005 Warrant Plan. In aggregate
the number of shares was increased by 418,081, which was registered in
the Finnish Trade Register on Dec 7, 2011. F-Secure received as subscrip-
tion price a total amount of EUR 618,759.88, which will be recorded in the
fund for the Company’s distributable equity. As a result of the registering
the total number of shares is currently 158,798,739. Trading with the new
shares commenced on Dec 8, 2011. The subscription period for the 2005
C warrants began on March 1, 2010 and ended on November 30, 2011.
In September, a total of 510,522 F-Secure shares were subscribed for
with the C warrants attached to the F-Secure 2005 Warrant Plan. The
issue of the 2005 Warrant Plan was approved by the Annual General
Meeting on March 23, 2005. In aggregate the number of shares was
increased by 510,522, which was registered in the Finnish Trade Register
on Sep 6, 2011. F-Secure received as subscription price a total amount of
EUR 755,572.56, which was recorded in the fund for the Company’s dis-
tributable equity. As a result of the registering the total number of shares
is 158,380,658. Trading in the new shares commenced on Sep 7, 2011.
In May, a total of 45,000 F-Secure shares were subscribed for with the
C warrants attached to the F-Secure 2005 Warrant Plan. The issue of the
2005 Warrant Plan was approved by the Annual General Meeting on
March 23, 2005. In aggregate the number of shares was increased by
45,000, which was registered in the Finnish Trade Register on May 24,
2011. F-Secure received as subscription price a total amount of EUR
66,600.00, which was recorded in the fund for the Company’s distributa-
ble equity. As a result of this registration the total number of shares is
157,870,136. Trading in the new shares commenced on May 25, 2011.
In April, a total of 285,893 F-Secure shares were subscribed for with
the C warrants attached to the F-Secure 2005 Warrant Plan. The issue of
the 2005 Warrant Plan was approved by the Annual General Meeting on
March 23, 2005. In aggregate the number of shares was increased by
285,893, which was registered in the Finnish Trade Register on Apr 12,
2011. F-Secure received as subscription price a total amount of EUR
423,121.64, which was recorded in the fund for the Company’s distributa-
ble equity. As a result of the registering the total number of shares is
157,825,136. Trading in the new shares commenced on Apr 13, 2011.
2005 D-warrants of F-Secure Corporation were listed on the NASDAQ
OMX Helsinki Ltd. and trading commenced on March 1, 2011. In connec-
tion with the 2005 Option Plan, the maximum of 4.5 million warrants will
be issued which are divided into categories A, B, C and D. Each 2005
D-warrant entitles holders to subscribe to one F-Secure share at a price
of EUR 2.09. The subscription price of the stock options shall, as per the
dividend record date, be reduced by the amount of dividend per share.
The subscription time for 2005 D-warrants began on March 1, 2011 and
will end on November 30, 2012. In aggregate the 2005 D-warrants entitle
holders to subscribe to 410,000 shares. The terms and conditions of
8 F-Secure
board of directors’ report
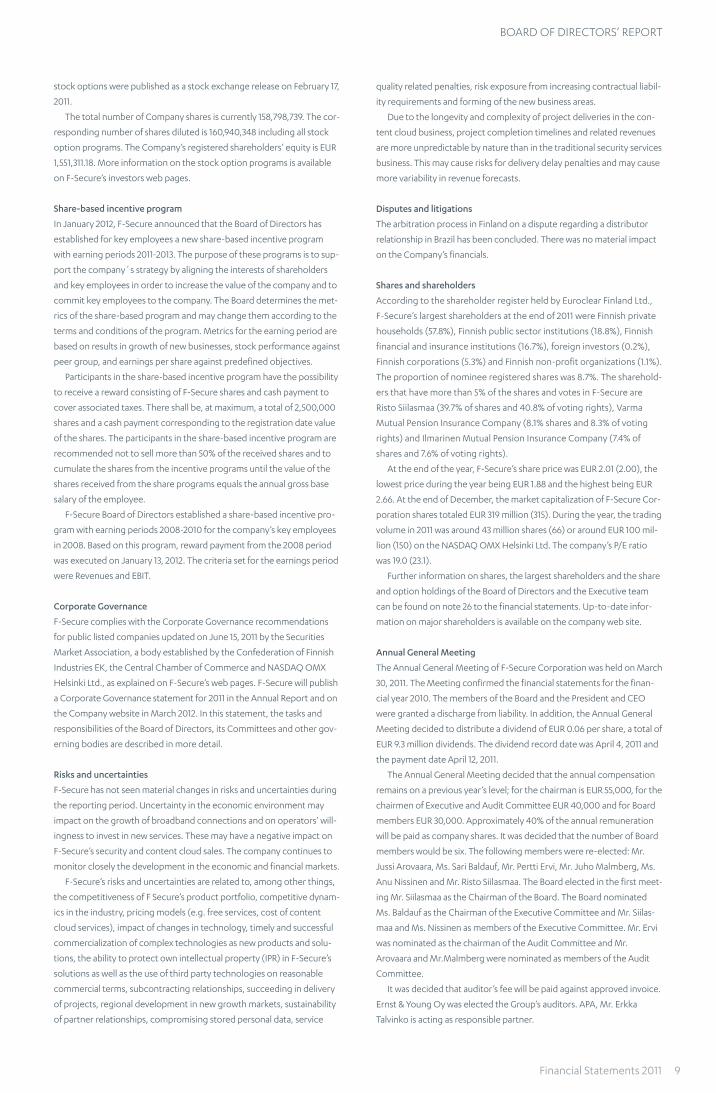
stock options were published as a stock exchange release on February 17,
2011.
The total number of Company shares is currently 158,798,739. The cor-
responding number of shares diluted is 160,940,348 including all stock
option programs. The Company’s registered shareholders’ equity is EUR
1,551,311.18. More information on the stock option programs is available
on F-Secure’s investors web pages.
Share-based incentive program
In January 2012, F-Secure announced that the Board of Directors has
established for key employees a new share-based incentive program
with earning periods 2011-2013. The purpose of these programs is to sup-
port the company´s strategy by aligning the interests of shareholders
and key employees in order to increase the value of the company and to
commit key employees to the company. The Board determines the met-
rics of the share-based program and may change them according to the
terms and conditions of the program. Metrics for the earning period are
based on results in growth of new businesses, stock performance against
peer group, and earnings per share against predefined objectives.
Participants in the share-based incentive program have the possibility
to receive a reward consisting of F-Secure shares and cash payment to
cover associated taxes. There shall be, at maximum, a total of 2,500,000
shares and a cash payment corresponding to the registration date value
of the shares. The participants in the share-based incentive program are
recommended not to sell more than 50% of the received shares and to
cumulate the shares from the incentive programs until the value of the
shares received from the share programs equals the annual gross base
salary of the employee.
F-Secure Board of Directors established a share-based incentive pro-
gram with earning periods 2008-2010 for the company’s key employees
in 2008. Based on this program, reward payment from the 2008 period
was executed on January 13, 2012. The criteria set for the earnings period
were Revenues and EBIT.
Corporate Governance
F-Secure complies with the Corporate Governance recommendations
for public listed companies updated on June 15, 2011 by the Securities
Market Association, a body established by the Confederation of Finnish
Industries EK, the Central Chamber of Commerce and NASDAQ OMX
Helsinki Ltd., as explained on F-Secure’s web pages. F-Secure will publish
a Corporate Governance statement for 2011 in the Annual Report and on
the Company website in March 2012. In this statement, the tasks and
responsibilities of the Board of Directors, its Committees and other gov-
erning bodies are described in more detail.
Risks and uncertainties
F-Secure has not seen material changes in risks and uncertainties during
the reporting period. Uncertainty in the economic environment may
impact on the growth of broadband connections and on operators’ will-
ingness to invest in new services. These may have a negative impact on
F-Secure’s security and content cloud sales. The company continues to
monitor closely the development in the economic and financial markets.
F-Secure’s risks and uncertainties are related to, among other things,
the competitiveness of F Secure’s product portfolio, competitive dynam-
ics in the industry, pricing models (e.g. free services, cost of content
cloud services), impact of changes in technology, timely and successful
commercialization of complex technologies as new products and solu-
tions, the ability to protect own intellectual property (IPR) in F-Secure’s
solutions as well as the use of third party technologies on reasonable
commercial terms, subcontracting relationships, succeeding in delivery
of projects, regional development in new growth markets, sustainability
of partner relationships, compromising stored personal data, service
quality related penalties, risk exposure from increasing contractual liabil-
ity requirements and forming of the new business areas.
Due to the longevity and complexity of project deliveries in the con-
tent cloud business, project completion timelines and related revenues
are more unpredictable by nature than in the traditional security services
business. This may cause risks for delivery delay penalties and may cause
more variability in revenue forecasts.
Disputes and litigations
The arbitration process in Finland on a dispute regarding a distributor
relationship in Brazil has been concluded. There was no material impact
on the Company’s financials.
Shares and shareholders
According to the shareholder register held by Euroclear Finland Ltd.,
F-Secure’s largest shareholders at the end of 2011 were Finnish private
households (57.8%), Finnish public sector institutions (18.8%), Finnish
financial and insurance institutions (16.7%), foreign investors (0.2%),
Finnish corporations (5.3%) and Finnish non-profit organizations (1.1%).
The proportion of nominee registered shares was 8.7%. The sharehold-
ers that have more than 5% of the shares and votes in F-Secure are
Risto Siilasmaa (39.7% of shares and 40.8% of voting rights), Varma
Mutual Pension Insurance Company (8.1% shares and 8.3% of voting
rights) and Ilmarinen Mutual Pension Insurance Company (7.4% of
shares and 7.6% of voting rights).
At the end of the year, F-Secure’s share price was EUR 2.01 (2.00), the
lowest price during the year being EUR 1.88 and the highest being EUR
2.66. At the end of December, the market capitalization of F-Secure Cor-
poration shares totaled EUR 319 million (315). During the year, the trading
volume in 2011 was around 43 million shares (66) or around EUR 100 mil-
lion (150) on the NASDAQ OMX Helsinki Ltd. The company’s P/E ratio
was 19.0 (23.1).
Further information on shares, the largest shareholders and the share
and option holdings of the Board of Directors and the Executive team
can be found on note 26 to the financial statements. Up-to-date infor-
mation on major shareholders is available on the company web site.
Annual General Meeting
The Annual General Meeting of F-Secure Corporation was held on March
30, 2011. The Meeting confirmed the financial statements for the finan-
cial year 2010. The members of the Board and the President and CEO
were granted a discharge from liability. In addition, the Annual General
Meeting decided to distribute a dividend of EUR 0.06 per share, a total of
EUR 9.3 million dividends. The dividend record date was April 4, 2011 and
the payment date April 12, 2011.
The Annual General Meeting decided that the annual compensation
remains on a previous year’s level; for the chairman is EUR 55,000, for the
chairmen of Executive and Audit Committee EUR 40,000 and for Board
members EUR 30,000. Approximately 40% of the annual remuneration
will be paid as company shares. It was decided that the number of Board
members would be six. The following members were re-elected: Mr.
Jussi Arovaara, Ms. Sari Baldauf, Mr. Pertti Ervi, Mr. Juho Malmberg, Ms.
Anu Nissinen and Mr. Risto Siilasmaa. The Board elected in the first meet-
ing Mr. Siilasmaa as the Chairman of the Board. The Board nominated
Ms. Baldauf as the Chairman of the Executive Committee and Mr. Siilas-
maa and Ms. Nissinen as members of the Executive Committee. Mr. Ervi
was nominated as the chairman of the Audit Committee and Mr.
Arovaara and Mr.Malmberg were nominated as members of the Audit
Committee.
It was decided that auditor’s fee will be paid against approved invoice.
Ernst & Young Oy was elected the Group’s auditors. APA, Mr. Erkka
Talvinko is acting as responsible partner.
Financial Statements 2011 9
board of directors’ report
It was decided that the Board of Directors may pass a resolution to
purchase a maximum of 10.000.000 shares of the Company. The amount
represents approximately 6.3% of all the shares issued by the Company.
The authorization would be valid for one year. The authorization covers
the purchase of shares through public trading on the NASDAQ OMX
Helsinki Ltd. in accordance with its rules or through a public tender offer
made to the shareholders of the Company. The consideration payable
for the shares shall be based on the market price.
The Annual General Meeting authorized the Board of Directors to
decide on a transfer of a maximum of 13.307.313 own shares of the Com-
pany either against consideration or without payment. The authorization
would be valid for one year. The Board of Directors is authorized to
transfer the shares in deviation from the shareholders’ pre-emptive
rights (directed transfer) subject to the provisions of the applicable law.
It was decided by the Annual General Meeting that the Board of
Directors is authorized to decide on the issuance of shares. The amount
of shares to be issued based on this authorization shall not exceed
40.000.000 shares. Board of Directors decides on all the conditions of
the issuance of shares. The authorization concerns both the issuance of
new shares as well as the transfer of treasury shares. The authorization is
valid for 18 months.
Market view
The long term market opportunities are attractive for F-Secure. The
growth in numbers of Internet users and devices connected to the Inter-
net will drive demand for security and content cloud services.
The number of Internet users is growing and has now passed 2 billion.
Global Internet penetration has kept growing and is now over 30%; in
Asia 24%, in Europe close to 60%, and in North America close to 80%
(source: Internet World Stats, U.S. Census Bureau, estimated in Mar. and
Dec.2011). The growth of smartphones and other Internet connected
devices is expected to accelerate to tens of billions during next 10 years
(source: gigaom/ Ericson).
The global security software market keeps growing. The global secu-
rity software revenue grew 12% in 2010 and the worldwide security soft-
ware revenue totaled $16.5 billion in 2010 (Gartner Jun.2011). Growth
across the security segments varied greatly. The security market is
undergoing rapid evolution in terms of both new delivery models with
Security as a Service showing increasing popularity and new technolo-
gies being introduced (source: Gartner July 2011).
The volume of user generated digital content is expected to continue
to increase rapidly during coming years, driven by digital photos and
music. The use of social media is increasing and people look for services
to share, store and control of their personal data. Parks Associates fore-
casts that operators providing security, storage and sharing value-added
services have a revenue opportunity of $1.03b 2012, increasing to $4.82b
during 2015.
Based on industry analyst estimates, the Software as a Service busi-
ness model is expected to continue growing strongly and to gain more
market share over traditional license sales. For Operators the Software as
a Service model is a natural expansion to their other service offerings.
The SaaS business offers Operators the opportunity to replace revenues
lost from the provision of commoditized services and to increase loyalty
in the face of competitive threats from over-the-top providers and third
parties.
Long-term objectives and strategy summary for 2012-2014
The Board of Directors approved F-Secure’s long-term objectives and
strategy for 2012-2014. According to the strategy, F-Secure’s first priority
is to drive growth and market expansion. F-Secure is a pioneer in Secu-
rity as a Service (SaaS) business with Operators. This channel has been
driving the Company’s revenue growth over 10 years. Based on the
company’s strong technology assets in security, cloud computing and
content cloud, F-Secure continues to create new innovative offerings to
augment traditional security services, especially in the content cloud
space.
F-Secure works together with Operators by providing security and
content cloud services with which Operators can compete with Internet
players. The Company’s large operator network covers over 200 opera-
tor partners in over 40 countries with an addressable market of over 250
million fixed and mobile broadband customers. In addition, F-Secure’s
close co-operation with major mobile phone vendors and mobile phone
operators provides good opportunities to benefit from the growth of
the mobile Internet.
F-Secure focuses on increasing the penetration within the current
operator base and continues to selectively seek partner expansion glob-
ally, especially in emerging markets. The penetration rates vary by oper-
ator; overall penetration levels are relatively low leaving substantial
opportunity for growth.
The Company has revised its strategy for the next three years. The
strategy forms solid ground for continuous growth and improving prof-
itability.
Operators, including Internet service providers, mobile operators and
cable operators, are the main channel for F-Secure services. F-Secure
provides, through Operators, security and content cloud services that
are easy and intuitive to use for mainstream consumers. This channel
utilizes the presence and brand of Operators to reach millions of con-
sumers in a cost efficient and scalable way.
Operators are competing with other Internet players and device man-
ufacturers for consumers’ share of mind. Operators’ advantage is their
ability to manage the continuously diverging multi-device, multi-OS
environment. Also, they are able to bring services to masses and are able
to support them.
The sources of F-Secure’s competitive advantage include the existing
operator and service provider network and relationships built over the
years. Key assets include security research, experience in service provi-
sioning in the Operator network environment and Operators’ growing
user base. Differentiation builds on top of the ability to combine security
into storage and the Operator channel at large. By helping operators to
establish local, secure and trustworthy Internet services the Company
enhances its position as Operators’ long-term partner.
During the strategy period the Company is aiming for double digit
revenue growth (CAGR), driven by the Operator channel. The growth is
expected to come from the western world and some emerging markets
like Latin America.
The Company will continue its investments in the content cloud busi-
ness and also in security services. In addition to mainstream operating
systems, such as Android, iOS and Windows, the Company is investing in
platform development. These investments ensure the scalability and
competiveness of the services and allow Operators to offer F-Secure ser-
vices, both PC and mobile, to a wide subscriber base. Profitability is
expected to develop towards the 25% level at the end of strategy period
due to improving scalability in content cloud business. F-Secure’s longer
term profitability level continues to be driven by revenue growth and
scalable operations.
Outlook for 2012
F-Secure’s Operator channel business (SaaS) is expected to continue
with healthy growth rates driven by good security sales and content
cloud projects with subscriber based revenues. The traditional license
business is expected to continue to decline slightly as in 2011.
As overall uncertainty in the global economy and financial markets is
expected to continue, this may have impact on Operators’ interest to
invest in new services, especially in new content cloud projects.
The management estimates annual revenue growth to be around
10%. The Company continues to prioritize growth over short term prof-
10 F-Secure

itability and plans to invest a majority of the improved earnings back to
growth opportunities in its core business.
Approximately 7 million of cost increase is arising from the end of
development activations of new platforms and increased depreciations.
The actual operational cost increases are fairly limited and are targeted
to drive product portfolio competitiveness, build the scalability of the
content cloud services and geographical expansion.
Annual profitability is expected to be around 15% of revenues and is
expected to follow the usual seasonality with a better second half. The
revenue estimate is based on the sales pipeline at the time of publishing,
existing subscriptions and support contracts as well as current exchange
rates.
Events after the period-end
No material changes regarding the Group’s business or financial posi-
tion have materialized after the end of December 2011.
Proposal for dividend distribution
The Board of Directors is proposing to the Annual General Meeting 2011,
to be held on Tuesday, April 3, 2012, that a dividend of EUR 0.06 per share
is to be paid from the distributable shareholders’ equity. The suggested
dividend record date is April 10, 2012 and the payment date April 17, 2012.
The dividend payout ratio is 57%.
On December 31, 2011, the parent company distributable equity
totaled EUR 36.0 million. No material changes have taken place in the
company’s financial position after the balance sheet date and the pro-
posed dividend does not compromise the company’s financial standing.
Helsinki, February 16, 2012
F-Secure Corporation
Board of Directors
Risto Siilasmaa
Jussi Arovaara
Sari Baldauf
Pertti Ervi
Juho Malmberg
Anu Nissinen
President and CEO
Christian Fredrikson
financial statements 2011 11
board of directors’ report
CONTENTS
FINANCIAL STATEMENTS F-SECURE CONSOLIDATED STATEMENT OF COMPREHENSIVE INCOME 14STATEMENT OF FINANCIAL POSITION 15STATEMENT OF CASH FLOWS 16STATEMENT OF CHANGES SHAREHOLDERS’ EQUITY 17NOTES TO THE FINANCIAL STATEMENTS 18
F-SECURE CORPORATION INCOME STATEMENT 38BALANCE SHEET 38CASH FLOW STATEMENT 39NOTES TO THE FINANCIAL STATEMENTS 40
AUDITORS’ REPORT 48
coNteNts
f-secure’sfinancialstatements2011
12 f-secure
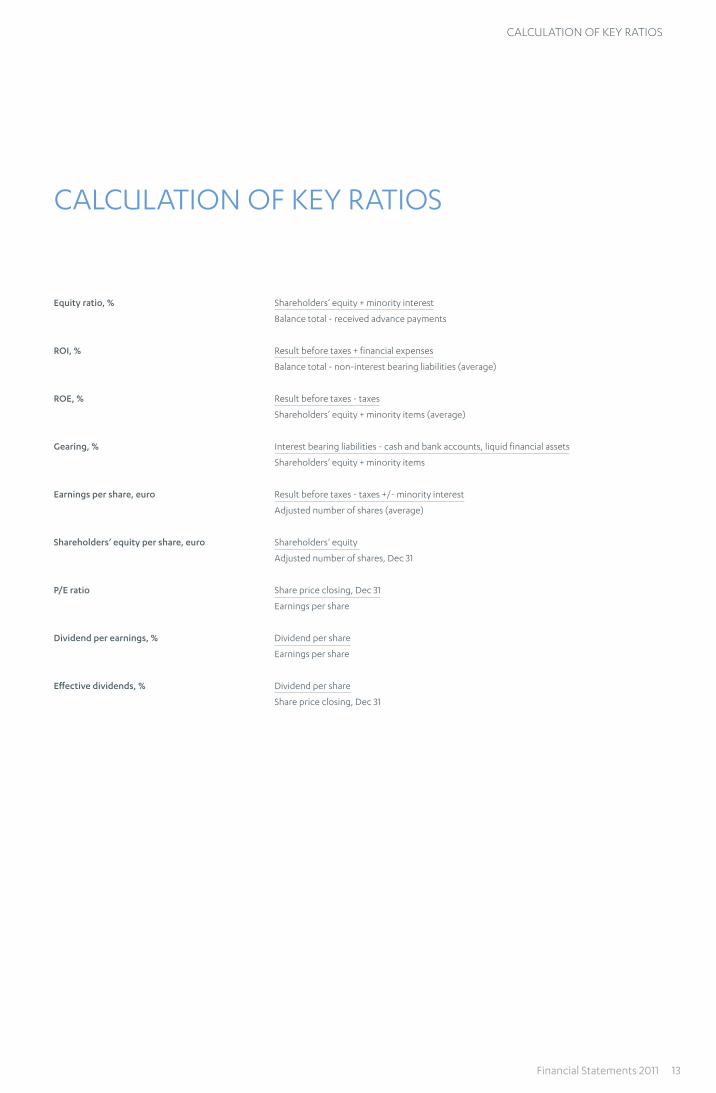
Equity ratio, % Shareholders’ equity + minority interest
Balance total - received advance payments
ROI, % Result before taxes + financial expenses
Balance total - non-interest bearing liabilities (average)
ROE, % Result before taxes - taxes
Shareholders’ equity + minority items (average)
Gearing, % Interest bearing liabilities - cash and bank accounts, liquid financial assets
Shareholders’ equity + minority items
Earnings per share, euro Result before taxes - taxes +/- minority interest
Adjusted number of shares (average)
Shareholders’ equity per share, euro Shareholders’ equity
Adjusted number of shares, Dec 31
P/E ratio Share price closing, Dec 31
Earnings per share
Dividend per earnings, % Dividend per share
Earnings per share
Effective dividends, % Dividend per share
Share price closing, Dec 31
CALCULATION OF KEY RATIOS
calculatioN of key ratios
Financial Statements 2011 13
coNsolidated fiNaNcial stateMeNts, ifrs
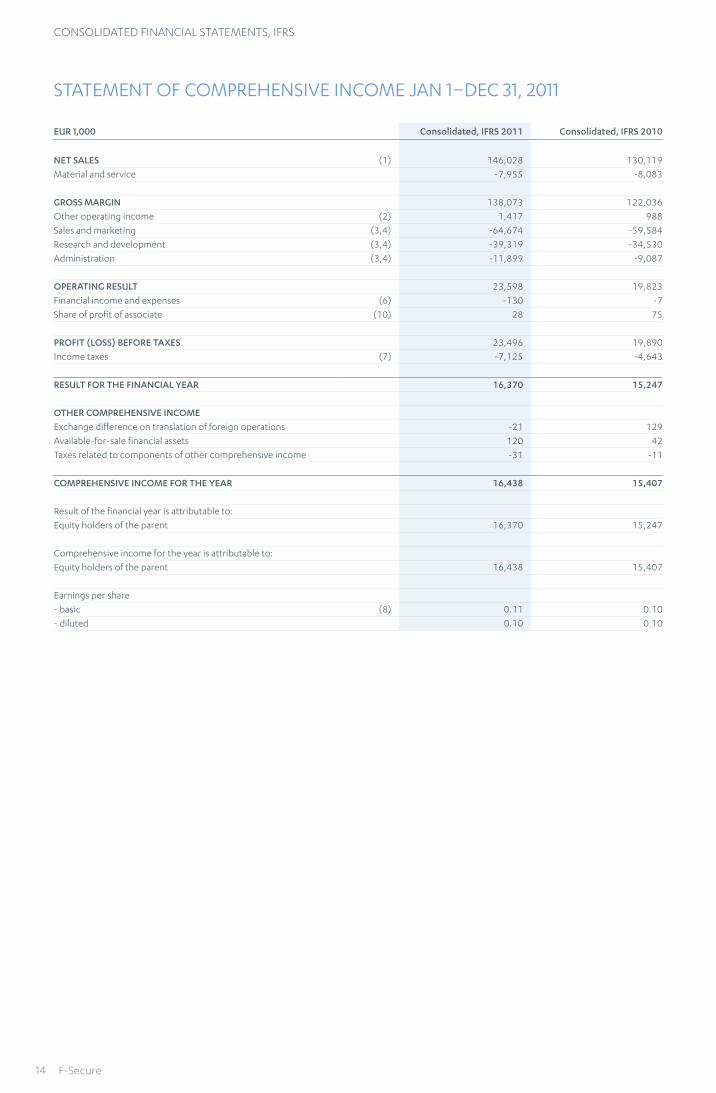
STATEMENT OF COMPREHENSIVE INCOME JAN 1–DEC 31, 2011
EUR 1,000 Consolidated, IFRS 2011 Consolidated, IFRS 2010
NET SALES (1) 146,028 130,119
Material and service -7,955 -8,083
GROSS MARGIN 138,073 122,036
Other operating income (2) 1,417 988
Sales and marketing (3,4) -64,674 -59,584
Research and development (3,4) -39,319 -34,530
Administration (3,4) -11,899 -9,087
OPERATING RESULT 23,598 19,823
Financial income and expenses (6) -130 -7
Share of profit of associate (10) 28 75
PROFIT (LOSS) BEFORE TAXES 23,496 19,890
Income taxes (7) -7,125 -4,643
RESULT FOR THE FINANCIAL YEAR 16,370 15,247
OTHER COMPREHENSIVE INCOME
Exchange difference on translation of foreign operations -21 129
Available-for-sale financial assets 120 42
Taxes related to components of other comprehensive income -31 -11
COMPREHENSIVE INCOME FOR THE YEAR 16,438 15,407
Result of the financial year is attributable to:
Equity holders of the parent 16,370 15,247
Comprehensive income for the year is attributable to:
Equity holders of the parent 16,438 15,407
Earnings per share
- basic (8) 0.11 0.10
- diluted 0.10 0.10
14 F-Secure
coNsolidated fiNaNcial stateMeNts, ifrs
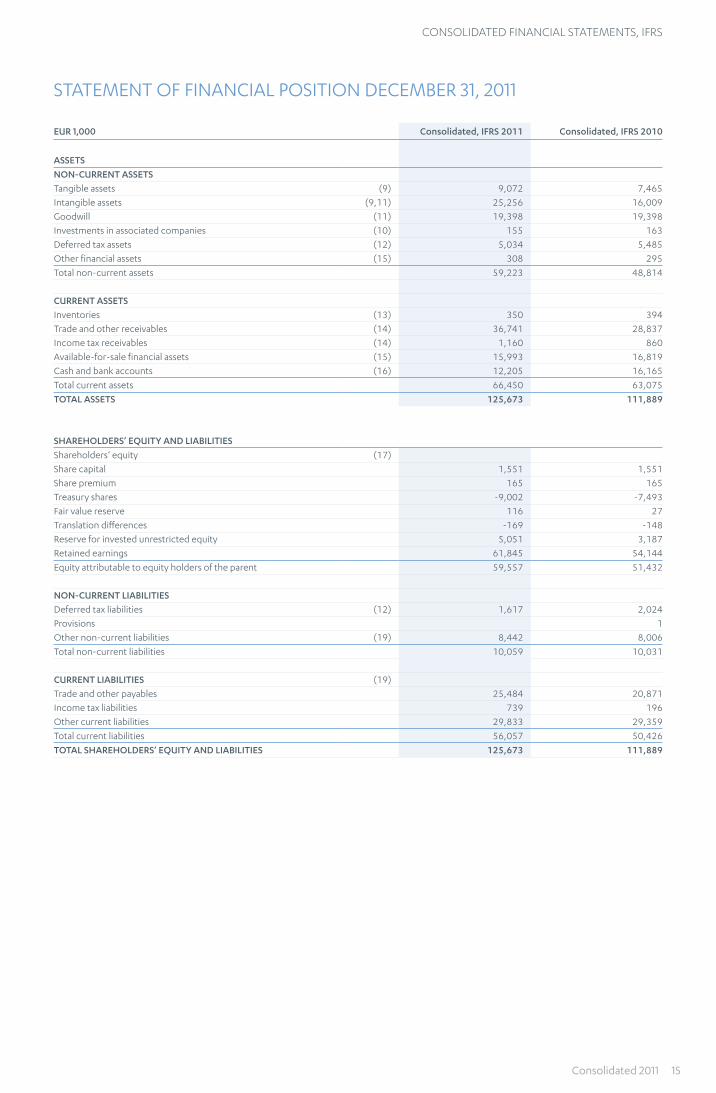
STATEMENT OF FINANCIAL POSITION DECEMBER 31, 2011
EUR 1,000 Consolidated, IFRS 2011 Consolidated, IFRS 2010
ASSETS
NON-CURRENT ASSETS
Tangible assets (9) 9,072 7,465
Intangible assets (9,11) 25,256 16,009
Goodwill (11) 19,398 19,398
Investments in associated companies (10) 155 163
Deferred tax assets (12) 5,034 5,485
Other financial assets (15) 308 295
Total non-current assets 59,223 48,814
CURRENT ASSETS
Inventories (13) 350 394
Trade and other receivables (14) 36,741 28,837
Income tax receivables (14) 1,160 860
Available-for-sale financial assets (15) 15,993 16,819
Cash and bank accounts (16) 12,205 16,165
Total current assets 66,450 63,075
TOTAL ASSETS 125,673 111,889
SHAREHOLDERS’ EQUITY AND LIABILITIES
Shareholders’ equity (17)
Share capital 1,551 1,551
Share premium 165 165
Treasury shares -9,002 -7,493
Fair value reserve 116 27
Translation differences -169 -148
Reserve for invested unrestricted equity 5,051 3,187
Retained earnings 61,845 54,144
Equity attributable to equity holders of the parent 59,557 51,432
NON-CURRENT LIABILITIES
Deferred tax liabilities (12) 1,617 2,024
Provisions 1
Other non-current liabilities (19) 8,442 8,006
Total non-current liabilities 10,059 10,031
CURRENT LIABILITIES (19)
Trade and other payables 25,484 20,871
Income tax liabilities 739 196
Other current liabilities 29,833 29,359
Total current liabilities 56,057 50,426
TOTAL SHAREHOLDERS’ EQUITY AND LIABILITIES 125,673 111,889
Consolidated 2011 15

coNsolidated fiNaNcial stateMeNts, ifrs
STATEMENT OF CASH FLOWS DECEMBER 31, 2011
EUR 1,000 Consolidated, IFRS 2011 Consolidated, IFRS 2010
CASH FLOW FROM OPERATIONS
Result for the financial year 16,370 15,247
Adjustments (22) 16,491 11,287
Cash flow from operations before change in working capital 32,861 26,534
CHANGE IN NET WORKING CAPITAL
Current receivables, increase (-), decrease (+) -7,586 3,003
Inventories, increase (-), decrease (+) 43 31
Non-interest bearing debt, increase (+), decrease (-) 2,389 2,491
Provisions, increase (+), decrease (-) -1
Cash flow from operations before financial items and taxes 27,707 32,059
Interest expenses paid -8 -8
Interest income received 42 17
Other financial income and expenses -69 -437
Income taxes paid -6,874 -8,441
Cash flow from operations 20,798 23,189
CASH FLOW FROM INVESTMENTS
Investments in intangible and tangible assets -16,686 -10,403
Investments in subsidiary shares, net of cash acquired -1,055
Other investments 4
Proceeds from sale of intangible and tangible assets 1 2
Proceeds from sale of other investments 5
Cash flow from investments -16,680 -11,453
CASH FLOW FROM FINANCING ACTIVITIES
Increase in share capital 1,864 108
Treasury shares -1,509 -4,004
Dividends paid -9,254 -9,310
Decrease in short term liabilities -200
Cash flow from financing activities -9,099 -13,207
Change in cash -4,981 -1,471
Translation difference 81 668
Cash and bank at the beginning of the period 32,831 33,591
Cash and bank at period end 27,931 32,788
Change in net fair value of current available-for-sale assets 120 42
Cash and bank at period end 28,051 32,831
16 F-Secure
coNsolidated fiNaNcial stateMeNts, ifrs
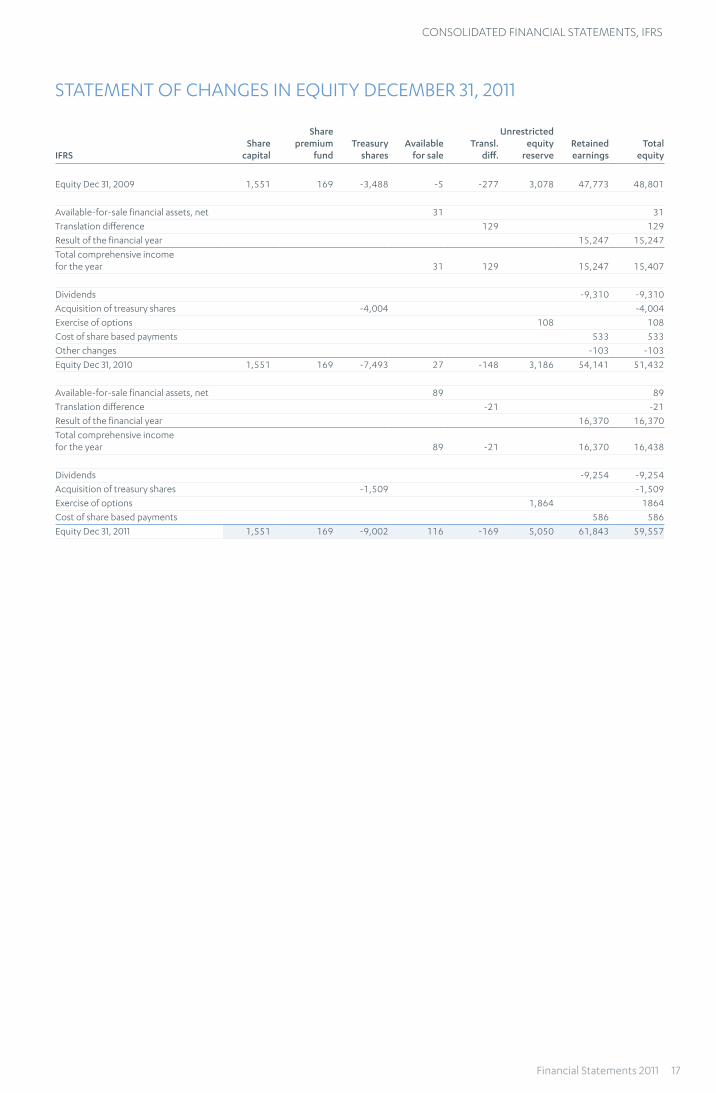
STATEMENT OF CHANGES IN EQUITY DECEMBER 31, 2011
IFRSShare
capital
Share premium
fundTreasury
sharesAvailable
for saleTransl.
diff.
Unrestricted equity
reserveRetained earnings
Total equity
Equity Dec 31, 2009 1,551 169 -3,488 -5 -277 3,078 47,773 48,801
Available-for-sale financial assets, net 31 31
Translation difference 129 129
Result of the financial year 15,247 15,247
Total comprehensive income for the year 31 129 15,247 15,407
Dividends -9,310 -9,310
Acquisition of treasury shares -4,004 -4,004
Exercise of options 108 108
Cost of share based payments 533 533
Other changes -103 -103
Equity Dec 31, 2010 1,551 169 -7,493 27 -148 3,186 54,141 51,432
Available-for-sale financial assets, net 89 89
Translation difference -21 -21
Result of the financial year 16,370 16,370
Total comprehensive income for the year 89 -21 16,370 16,438
Dividends -9,254 -9,254
Acquisition of treasury shares -1,509 -1,509
Exercise of options 1,864 1864
Cost of share based payments 586 586
Equity Dec 31, 2011 1,551 169 -9,002 116 -169 5,050 61,843 59,557
Financial Statements 2011 17

Notes to tHe coNsolidated fiNaNcial stateMeNts
Group information
F-Secure produces software protection and Internet security services
for consumers and businesses against computer viruses and other
threats coming through the Internet or mobile networks, as well as
online backup services preventing loss of valuable content and ena-
bling sharing of important files.
The parent company of the Group is F-Secure Corporation incorpo-
rated in Finland and domiciled in Helsinki. Company’s registrant
address is Tammasaarenkatu 7, 00180 Helsinki. A copy of consolidated
financial statement can be received on the Internet address
www.f-secure.com or from the parent company’s registrant address.
In their meeting on 16 February 2012 the Board of Directors of
F-Secure Corporation have agreed to permit the publication of the
consolidated financial statements of F-Secure Corporation for the year
2011. According to the Finnish Companies Act, the Annual General
Meeting can confirm or reject the consolidated financial statement
after publication. The General Annual Meeting can also decide to
change the financial statement.
ACCOUNTING PRINCIPLES
Basis for presentation
The consolidated financial statements of F-Secure Corporation of 2011
have been prepared in accordance with International Financial Report-
ing Standards (IFRS) and IAS- and IFRS- standards as well as SIC- and
IFRIC- interpretations valid 31st of December 2011 has been followed as
adopted by the EU. The disclosures also conform to Finnish Account-
ing legislation.
The Group has adopted the following new or amended Standards
and Interpretations during the year.
Improvements to IFRSs (May 2010). There are separate transitional
provisions for 7 standards, but the adoption of the improvements had
no significant impact on the Group’s financial statements.
IAS 32 Amendment: Financial Instruments: Presentation: Classifica-
tion of Rights Issues. Amendment deals with classification of certain
instruments giving the right to acquire a fixed amount in any currency.
The adoption of the amended standard had no impact on the Group’s
financial statement.
IAS 24 Revised: Related party Disclosures. The revised standard clari-
fies the definition of a related party and simplifies the disclosure
requirements for government-related entities. The adoption of the
revised standard had no impact on the Group’s financial statement.
IFRIC 14 IAS19 Amendment: The Limit of a Defined Benefit Asset,
Minimum Funding Requirements and their Interaction. The amended
interpretation deal with situations when an entity with minimum
requirements makes a prepayment of contributions to cover those
requirements. The amendments permit the benefit of such prepay-
ment to be recognized as an asset. The adoption of the amended
standard had no impact on the Group’s financial statement.
IFRIC 19 Extinguishing Financial Liabilities with Equity Instruments: The
interpretation clarifies accounting instructions when a borrower may
enter into an agreement with a lender to issue equity instruments to the
lender in order to extinguish a financial liability owed to the lender. The
interpretation had no impact on the Group’s financial statement.
Management judgment and use of estimates
The preparation of financial statements in accordance with IFRS
requires the use of estimates and assumptions as well as use of judg-
ment when applying accounting principles that affect the reported
amount of assets and liabilities, the disclosure of contingent assets and
liabilities at the date of the financial statements, and the reported
amounts of revenues and expenses during reporting periods. Although
these estimates are based on the management’s best knowledge,
actual results may differ from those estimates. Possible changes in
estimates and assumptions are recognized in the period when they
occur.
The key judgments and assumptions concerning the future and
other key sources of estimation, that have a significant risk of causing
an adjustment to the carrying amounts of assets and liabilities, are fol-
lowing:
• The Group has entered into commercial agreement related to stor-
age services. The Group has determined, based on terms and condi-
tions of the agreement that project revenue should be recognize
using the percentage-of-completion method. Value of the multi-
year agreement is not disclosed, while significant to F-Secure.
• impairment of assets: The key assumption used to determine the
recoverable amount for goodwill, including sensitivity analysis, are
further explained in note 11;
• deferred tax assets: The Group has recognized tax losses as deferred
tax assets. Further details are disclosed in note 12;
• development expenditures carried forward: initial capitalization of
cost is based on management’s judgment on technological and
economical feasibility. Further details are disclosed in note 9.
• used arguments when recognizing share-based payment transac-
tions: the assumptions and models used for estimating fair value for
share-based payment transactions are disclosed in note 18.
Principles of consolidation
Subsidiaries in which F-Secure Corporation’s holding exceeds 50 per-
cent are consolidated in the financial statements. Subsidiaries are con-
solidated from the date on which control is transferred to the Group
and cease to be consolidated from the date on which control is trans-
ferred out of the Group. The Company’s holding in the associated
companies is also consolidated. The Group’s investment in its associate
is accounted for under the equity method of accounting. The income
statement reflects the share of the results of operations of the associ-
ate. Equity accounting is discontinued when the carrying amount of
the investment in an associated company reaches zero, unless the
Group has incurred or guaranteed obligations in respect of the associ-
ated company.
All intra-group transactions and balances, including unrealized prof-
its arising from intra-group transactions, have been eliminated on con-
solidation. Where necessary, the accounting policies of subsidiaries
have been adjusted to ensure consistency with the policies adopted by
the Group.
Segment reporting
The Group has one segment; data security. The segment is reported in
a manner consistent with the internal reporting provided with the chief
Notes to tHe fiNaNcial stateMeNts
18 F-Secure
Notes to tHe coNsolidated fiNaNcial stateMeNts
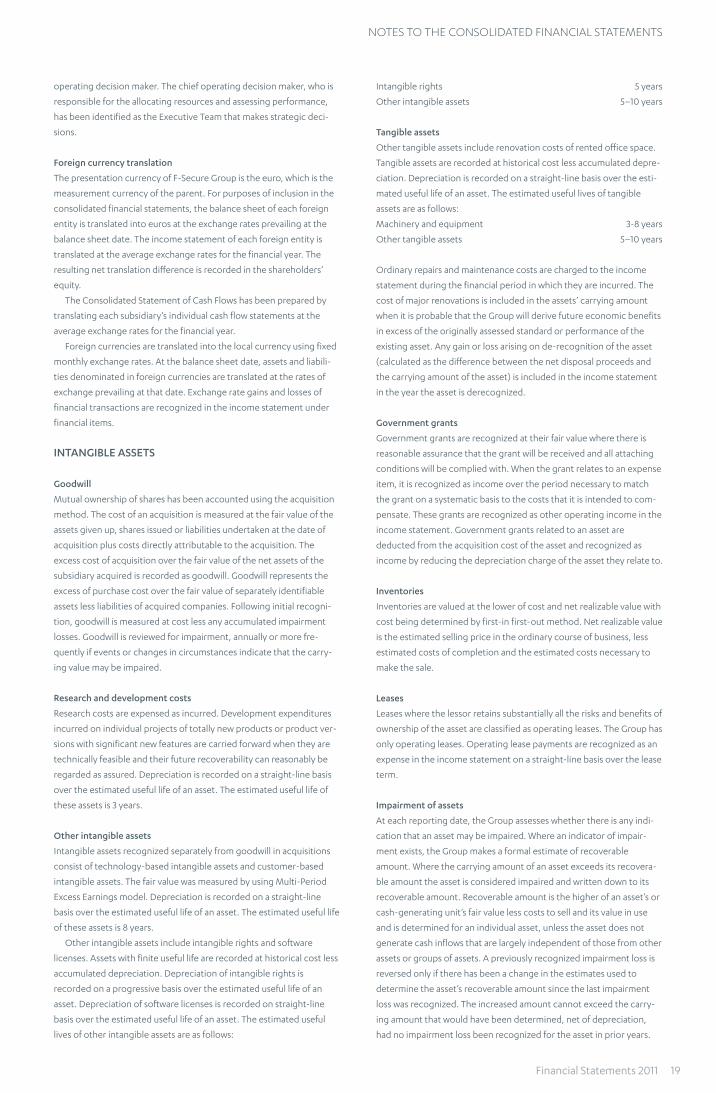
operating decision maker. The chief operating decision maker, who is
responsible for the allocating resources and assessing performance,
has been identified as the Executive Team that makes strategic deci-
sions.
Foreign currency translation
The presentation currency of F-Secure Group is the euro, which is the
measurement currency of the parent. For purposes of inclusion in the
consolidated financial statements, the balance sheet of each foreign
entity is translated into euros at the exchange rates prevailing at the
balance sheet date. The income statement of each foreign entity is
translated at the average exchange rates for the financial year. The
resulting net translation difference is recorded in the shareholders’
equity.
The Consolidated Statement of Cash Flows has been prepared by
translating each subsidiary’s individual cash flow statements at the
average exchange rates for the financial year.
Foreign currencies are translated into the local currency using fixed
monthly exchange rates. At the balance sheet date, assets and liabili-
ties denominated in foreign currencies are translated at the rates of
exchange prevailing at that date. Exchange rate gains and losses of
financial transactions are recognized in the income statement under
financial items.
INTANGIBLE ASSETS
Goodwill
Mutual ownership of shares has been accounted using the acquisition
method. The cost of an acquisition is measured at the fair value of the
assets given up, shares issued or liabilities undertaken at the date of
acquisition plus costs directly attributable to the acquisition. The
excess cost of acquisition over the fair value of the net assets of the
subsidiary acquired is recorded as goodwill. Goodwill represents the
excess of purchase cost over the fair value of separately identifiable
assets less liabilities of acquired companies. Following initial recogni-
tion, goodwill is measured at cost less any accumulated impairment
losses. Goodwill is reviewed for impairment, annually or more fre-
quently if events or changes in circumstances indicate that the carry-
ing value may be impaired.
Research and development costs
Research costs are expensed as incurred. Development expenditures
incurred on individual projects of totally new products or product ver-
sions with significant new features are carried forward when they are
technically feasible and their future recoverability can reasonably be
regarded as assured. Depreciation is recorded on a straight-line basis
over the estimated useful life of an asset. The estimated useful life of
these assets is 3 years.
Other intangible assets
Intangible assets recognized separately from goodwill in acquisitions
consist of technology-based intangible assets and customer-based
intangible assets. The fair value was measured by using Multi-Period
Excess Earnings model. Depreciation is recorded on a straight-line
basis over the estimated useful life of an asset. The estimated useful life
of these assets is 8 years.
Other intangible assets include intangible rights and software
licenses. Assets with finite useful life are recorded at historical cost less
accumulated depreciation. Depreciation of intangible rights is
recorded on a progressive basis over the estimated useful life of an
asset. Depreciation of software licenses is recorded on straight-line
basis over the estimated useful life of an asset. The estimated useful
lives of other intangible assets are as follows:
Intangible rights 5 years
Other intangible assets 5–10 years
Tangible assets
Other tangible assets include renovation costs of rented office space.
Tangible assets are recorded at historical cost less accumulated depre-
ciation. Depreciation is recorded on a straight-line basis over the esti-
mated useful life of an asset. The estimated useful lives of tangible
assets are as follows:
Machinery and equipment 3-8 years
Other tangible assets 5–10 years
Ordinary repairs and maintenance costs are charged to the income
statement during the financial period in which they are incurred. The
cost of major renovations is included in the assets’ carrying amount
when it is probable that the Group will derive future economic benefits
in excess of the originally assessed standard or performance of the
existing asset. Any gain or loss arising on de-recognition of the asset
(calculated as the difference between the net disposal proceeds and
the carrying amount of the asset) is included in the income statement
in the year the asset is derecognized.
Government grants
Government grants are recognized at their fair value where there is
reasonable assurance that the grant will be received and all attaching
conditions will be complied with. When the grant relates to an expense
item, it is recognized as income over the period necessary to match
the grant on a systematic basis to the costs that it is intended to com-
pensate. These grants are recognized as other operating income in the
income statement. Government grants related to an asset are
deducted from the acquisition cost of the asset and recognized as
income by reducing the depreciation charge of the asset they relate to.
Inventories
Inventories are valued at the lower of cost and net realizable value with
cost being determined by first-in first-out method. Net realizable value
is the estimated selling price in the ordinary course of business, less
estimated costs of completion and the estimated costs necessary to
make the sale.
Leases
Leases where the lessor retains substantially all the risks and benefits of
ownership of the asset are classified as operating leases. The Group has
only operating leases. Operating lease payments are recognized as an
expense in the income statement on a straight-line basis over the lease
term.
Impairment of assets
At each reporting date, the Group assesses whether there is any indi-
cation that an asset may be impaired. Where an indicator of impair-
ment exists, the Group makes a formal estimate of recoverable
amount. Where the carrying amount of an asset exceeds its recovera-
ble amount the asset is considered impaired and written down to its
recoverable amount. Recoverable amount is the higher of an asset’s or
cash-generating unit’s fair value less costs to sell and its value in use
and is determined for an individual asset, unless the asset does not
generate cash inflows that are largely independent of those from other
assets or groups of assets. A previously recognized impairment loss is
reversed only if there has been a change in the estimates used to
determine the asset’s recoverable amount since the last impairment
loss was recognized. The increased amount cannot exceed the carry-
ing amount that would have been determined, net of depreciation,
had no impairment loss been recognized for the asset in prior years.
Financial Statements 2011 19

Notes to tHe coNsolidated fiNaNcial stateMeNts
Impairment losses relating to Goodwill cannot be reversed in future
periods.
Pensions
All of F-Secure Group’s pension arrangements are in accordance with
local statutory arrangements and defined contribution plans. Contri-
butions to defined contribution plans are recognized in the income
statement in the period to which the contributions relate. The Group
recognizes disability commitment of Finnish TYEL pension plan when
disability appears.
Share-based payment transactions
In the Company’s industry it is common practice internationally that
incentives are provided to employees in the form of equity-settled
share-based instruments. Company has three kinds of incentive pro-
grams; warrant-based program, synthetic warrant-based program and
a share-based program.
The Company’s warrant programs cover key personnel. The warrant
program reward is settled as equity-settled payment and synthetic
warrant-based program as cash-settled payment. The cost of equity-
settled transactions with employees is measured by reference to the
fair value at the date on which they are granted. The cost of cash-set-
tled transactions with employees is measured by reference to the fair
value at the date of balance sheet. The fair value is determined by
using the Binomial model. The cost of transactions is recognized,
together with a corresponding entry in equity and liability, over the
period in which the performance conditions are fulfilled, ending on
the date on which the relevant employees become fully entitled to the
award (vesting date). If the holder of the warrant leaves company
before vesting the warrant is forfeited. The cumulative expense recog-
nized for transactions at each reporting date until the vesting date
reflects the extent to which the vesting period has expired and the
number of awards that, in the opinion of the directors of the Group at
that date, based on the best available estimate of the number of equity
instruments that will ultimately vest.
The share-based incentive program has been established as part of
the key employee incentive and retention system inside F-Secure
Group. Reward will be settled in two phases so that one part is settled
as equity-settled payment and one part as cash-settled payment. Cost
of equity-settled transactions is measured by reference to the fair
value by using market price of F-Secure Corporation share at the date
on which they are granted and cost of cash-settled by using market
price of F-Secure Corporation on the date of balance sheet. The cost is
recognized over the period in which the performance conditions are
fulfilled, ending on the date on which the relevant employees become
fully entitled to the reward (end of lock-up period). The cost of
equity-settle corresponding entry is recognized in equity and cost of
cash-settle in liabilities. If relevant employee leaves company before
fully entitled to the reward, the reward is forfeited. The cumulative
expense recognized for share-based incentive program transactions at
each reporting date is based on the best available estimate of the num-
ber of equity instruments that will ultimately fulfill.
Provisions
Provisions are recognized when the Group has a present obligation
(legal or constructive) as a result of a past event, it is probable that an
outflow of resources embodying economic benefits will be required to
settle the obligation and a reliable estimate can be made of the
amount of the obligation. The Group has no provisions.
Income taxes
Direct current taxes are calculated on the results of all Group compa-
nies in accordance with the local tax and accounting rules in each
country. Deferred taxes, resulting from temporary differences
between the financial statement and the income tax basis of assets and
liabilities, use the enacted tax rates in effect in the years in which the
differences are expected to reverse. Deferred tax assets are recognized
to the extent that it is probable that future taxable profit will be availa-
ble.
Revenue recognition
Revenue is primarily derived from monthly software as a service sale,
software license agreement sales and operator’s system integration
and maintenance sales. License agreements consist of initial license
agreements and periodic maintenance agreements covering product
updates and customer support. The revenue recognition policy of
F-Secure Group recognizes the service revenue at the time of delivery,
the license agreement’s license fee revenues as the product is deliv-
ered, the license agreement’s maintenance revenues are recognized
over the maintenance period, and service based project deliveries are
recognized with the percentage of completion method, when the out-
come can be reliably estimated. The degree of completion is deter-
mined by relation of project costs incurred for work performed to date
bear the estimated total project costs. If total project costs will exceed
total project revenue, the expected loss is recognized as an expense
immediately. Indirect taxes, discounts granted and exchange rate dif-
ferences are excluded from net sales.
Other operating income
Other operating income includes profits from the sales of fixed assets,
rental revenue, and government grants received for research and
development projects.
Presentation of expenses
Classification of the functionally presented expenses has been made as
follows: various types of expenses in different geographical locations
have been allocated to the various functions by allocating to directly
allocable expenses to the respective function, and other operating
expenses have been allocated to functions on the basis of average
headcount in each location.
Treasury shares
Parent company has acquired treasury shares. The cost of acquisition is
recognized as a deduction in the shareholders’ equity.
Financial assets
According to IAS 39 standard, financial assets have been classified into
financial assets at fair value through profit or loss, held-to-maturity,
loans and receivables originated by the enterprise and available-for-
sale financial assets. The classification is dependent on the purpose for
which the assets were acquired. Purchases and sales of financial assets
are recognized on the trade date i.e. the date that the Group commits
to purchase the asset. The cost of purchase includes transaction costs.
Financial assets are currently classified as loans and receivables and
available-for-sale financial asset.
Loans and receivables originated by the enterprise are measured at
amortized cost. Trade receivables are carried at the original invoice
amount to customers less an estimate made for doubtful receivables.
Outstanding receivables are reviewed periodically and bad debts are
written off when identified.
Available-for-sale financial assets consist of interest-bearing debt
securities and shares in mutual funds invested in similar instruments.
For assets that are actively traded in organized financial markets, fair
value is determined by reference to Stock Exchange quoted market bid
prices at the close of business on the balance sheet date. Assets, the
fair value of which cannot be measured reliably, are recognized at cost
20 F-Secure
Notes to tHe coNsolidated fiNaNcial stateMeNts
less impairment. The fair value changes of available-for-sale financial
assets are recognized in shareholders’ equity under fair value reserve.
When financial assets recognized as available-for-sale is sold, the accu-
mulated fair value changes are released from equity and recognized in
the income statement.
Cash and cash equivalents in the Consolidated Statement of Finan-
cial position comprise cash at bank and in hand and other highly liquid
short-term investments.
For the purpose of the Consolidated Statement of Cash Flows, cash
and cash equivalents consist of cash and cash equivalents as defined
above.
Derivative financial instruments and hedging
The Group uses derivative financial instruments such as forward cur-
rency contracts to hedge its risks associated with foreign currency
fluctuations. Such derivative financial instruments are initially recog-
nized at fair value on the date on which a derivative contract is entered
into and are subsequently recognized at fair value. Any gains and
losses arising from changes in fair value on derivatives that do not
qualify for hedge accounting are taken directly to net profit or loss for
the year. The fair value of forward currency contracts is calculated by
reference to current forward exchange rates for contracts with similar
maturity profiles.
Adoption of new and revised standards
The Group has not applied the following new or revised Standards and
Interpretations that have been issued, but are not yet effective. The
changes have not been adopted by EU.
Amendment to IFRS 7 Disclosures-Offsetting Financial Assets Finan-
cial Liabilities: The Group expects that the adoption of the revised
standard might have an impact on the Group’s financial statements in
the period of initial adoption. Amended standard becomes effective
for financial years beginning on or after 1 July 2011.
Revised IFRS 1 First Time Adoption of IFRS: The Group expects that
the adoption of the revised standard will have no impact on the
Group’s financial statements in the period of initial adoption. The
revised standard becomes effective for financial years beginning on or
after 1 July 2011.
Amendment to IAS 12 Deferred tax: Recovery of Underlying Assets:
The Group expects that the adoption of the revised standard will have
no impact on the Group’s financial statements in the period of initial
adoption. The amended standard becomes effective for financial years
beginning on or after 1 January 2012.
Amendment to IAS 1 Presentation of Items of Other Comprehensive
Income: The Group expects that the revised standard will have impact
on the Group’s financial statements in the period of initial application.
Amended standard becomes effective for financial years beginning on
or after 1 July 2012.
Amendment to IAS 19 Employee Benefits: The Group expects that
the adoption of the revised standard will have no impact on the
Group’s financial statements in the period of initial adoption. The
effective date of the amendment is still open.
IFRS 9 Financial Instruments: The Group expects that adoption of
the revised Standard will have an impact on the disclosures of Group’s
financial statements in the period of initial application. Amended
standard becomes effective for financial years beginning on or after
1 January 2013.
IFRS 10 Consolidated Financial Statements: The Group expects that
the adoption of the revised standard will have no impact on the
Group’s financial statements in the period of initial adoption. The
amended standard becomes effective for financial years beginning on
or after 1 January 2013.
IFRS 11 Joint Arrangements: The Group expects that the revised
standard might have an impact on the Group’s financial statements in
the period of initial application. The amended standard becomes
effective for financial years beginning on or after 1 January 2013.
IFRS 12 Disclosures of Interests of Other Entities: The Group expects
that the revised standard will have impact on the Group’s financial
statements in the period of initial application. The amended standard
becomes effective for financial years beginning on or after 1 January
2013.
IFRS 13 Fair Value Measurement: The Group expects that the revised
standard will have impact on the Group’s financial statements in the
period of initial application. The amended standard becomes effective
for financial years beginning on or after 1 January 2013.
IAS 27 Separate Financial Statements: The Group expects that the
adoption of the revised standard will have no impact on the Group’s
financial statements in the period of initial adoption. The amended
standard becomes effective for financial years beginning on or after
1 January 2013.
IAS 28 Investments in Associates and Joint Ventures: The Group
expects that the revised standard will have an impact on the Group’s
financial statements in the period of initial application. The amended
standard becomes effective for financial years beginning on or after
1 January 2013.
consolidated 2011 21
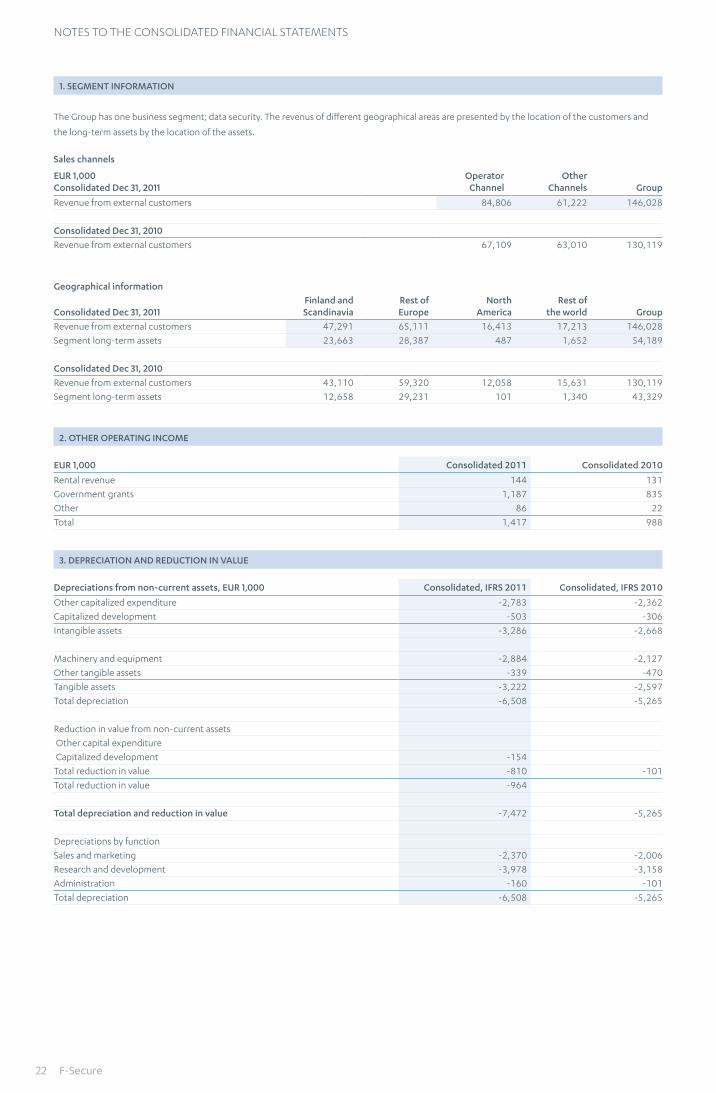
Notes to tHe coNsolidated fiNaNcial stateMeNts
1. SEGMENT INFORMATION
The Group has one business segment; data security. The revenus of different geographical areas are presented by the location of the customers and
the long-term assets by the location of the assets.
Sales channels
EUR 1,000 Consolidated Dec 31, 2011
Operator Channel
Other Channels Group
Revenue from external customers 84,806 61,222 146,028
Consolidated Dec 31, 2010
Revenue from external customers 67,109 63,010 130,119
Geographical information
Consolidated Dec 31, 2011Finland and Scandinavia
Rest of Europe
North America
Rest of the world Group
Revenue from external customers 47,291 65,111 16,413 17,213 146,028
Segment long-term assets 23,663 28,387 487 1,652 54,189
Consolidated Dec 31, 2010
Revenue from external customers 43,110 59,320 12,058 15,631 130,119
Segment long-term assets 12,658 29,231 101 1,340 43,329
2. OTHER OPERATING INCOME
EUR 1,000 Consolidated 2011 Consolidated 2010
Rental revenue 144 131
Government grants 1,187 835
Other 86 22
Total 1,417 988
3. DEPRECIATION AND REDUCTION IN VALUE
Depreciations from non-current assets, EUR 1,000 Consolidated, IFRS 2011 Consolidated, IFRS 2010
Other capitalized expenditure -2,783 -2,362
Capitalized development -503 -306
Intangible assets -3,286 -2,668
Machinery and equipment -2,884 -2,127
Other tangible assets -339 -470
Tangible assets -3,222 -2,597
Total depreciation -6,508 -5,265
Reduction in value from non-current assets
Other capital expenditure
Capitalized development -154
Total reduction in value -810 -101
Total reduction in value -964
Total depreciation and reduction in value -7,472 -5,265
Depreciations by function
Sales and marketing -2,370 -2,006
Research and development -3,978 -3,158
Administration -160 -101
Total depreciation -6,508 -5,265
22 F-Secure
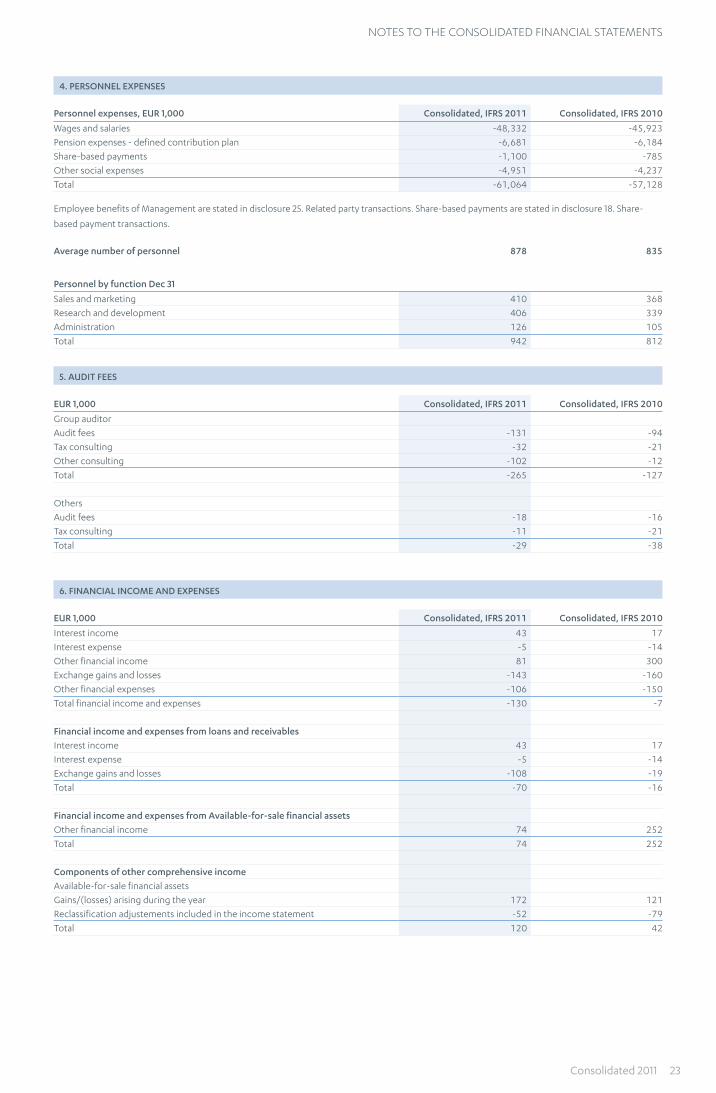
Notes to tHe coNsolidated fiNaNcial stateMeNts
4. PERSONNEL EXPENSES
Personnel expenses, EUR 1,000 Consolidated, IFRS 2011 Consolidated, IFRS 2010
Wages and salaries -48,332 -45,923
Pension expenses - defined contribution plan -6,681 -6,184
Share-based payments -1,100 -785
Other social expenses -4,951 -4,237
Total -61,064 -57,128
Employee benefits of Management are stated in disclosure 25. Related party transactions. Share-based payments are stated in disclosure 18. Share-
based payment transactions.
Average number of personnel 878 835
Personnel by function Dec 31
Sales and marketing 410 368
Research and development 406 339
Administration 126 105
Total 942 812
5. AUDIT FEES
EUR 1,000 Consolidated, IFRS 2011 Consolidated, IFRS 2010
Group auditor
Audit fees -131 -94
Tax consulting -32 -21
Other consulting -102 -12
Total -265 -127
Others
Audit fees -18 -16
Tax consulting -11 -21
Total -29 -38
6. FINANCIAL INCOME AND EXPENSES
EUR 1,000 Consolidated, IFRS 2011 Consolidated, IFRS 2010
Interest income 43 17
Interest expense -5 -14
Other financial income 81 300
Exchange gains and losses -143 -160
Other financial expenses -106 -150
Total financial income and expenses -130 -7
Financial income and expenses from loans and receivables
Interest income 43 17
Interest expense -5 -14
Exchange gains and losses -108 -19
Total -70 -16
Financial income and expenses from Available-for-sale financial assets
Other financial income 74 252
Total 74 252
Components of other comprehensive income
Available-for-sale financial assets
Gains/(losses) arising during the year 172 121
Reclassification adjustements included in the income statement -52 -79
Total 120 42
Consolidated 2011 23
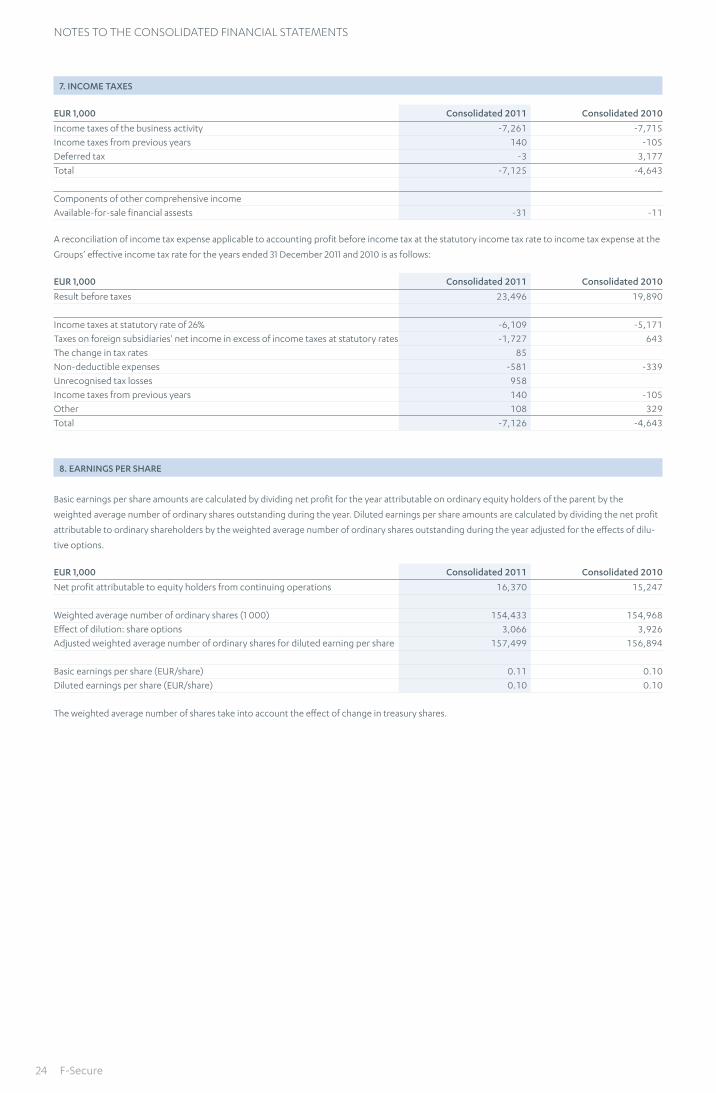
Notes to tHe coNsolidated fiNaNcial stateMeNts
7. INCOME TAXES
EUR 1,000 Consolidated 2011 Consolidated 2010
Income taxes of the business activity -7,261 -7,715
Income taxes from previous years 140 -105
Deferred tax -3 3,177
Total -7,125 -4,643
Components of other comprehensive income
Available-for-sale financial assests -31 -11
A reconciliation of income tax expense applicable to accounting profit before income tax at the statutory income tax rate to income tax expense at the
Groups’ effective income tax rate for the years ended 31 December 2011 and 2010 is as follows:
EUR 1,000 Consolidated 2011 Consolidated 2010
Result before taxes 23,496 19,890
Income taxes at statutory rate of 26% -6,109 -5,171
Taxes on foreign subsidiaries' net income in excess of income taxes at statutory rates -1,727 643
The change in tax rates 85
Non-deductible expenses -581 -339
Unrecognised tax losses 958
Income taxes from previous years 140 -105
Other 108 329
Total -7,126 -4,643
8. EARNINGS PER SHARE
Basic earnings per share amounts are calculated by dividing net profit for the year attributable on ordinary equity holders of the parent by the
weighted average number of ordinary shares outstanding during the year. Diluted earnings per share amounts are calculated by dividing the net profit
attributable to ordinary shareholders by the weighted average number of ordinary shares outstanding during the year adjusted for the effects of dilu-
tive options.
EUR 1,000 Consolidated 2011 Consolidated 2010
Net profit attributable to equity holders from continuing operations 16,370 15,247
Weighted average number of ordinary shares (1 000) 154,433 154,968
Effect of dilution: share options 3,066 3,926
Adjusted weighted average number of ordinary shares for diluted earning per share 157,499 156,894
Basic earnings per share (EUR/share) 0.11 0.10
Diluted earnings per share (EUR/share) 0.10 0.10
The weighted average number of shares take into account the effect of change in treasury shares.
24 F-Secure
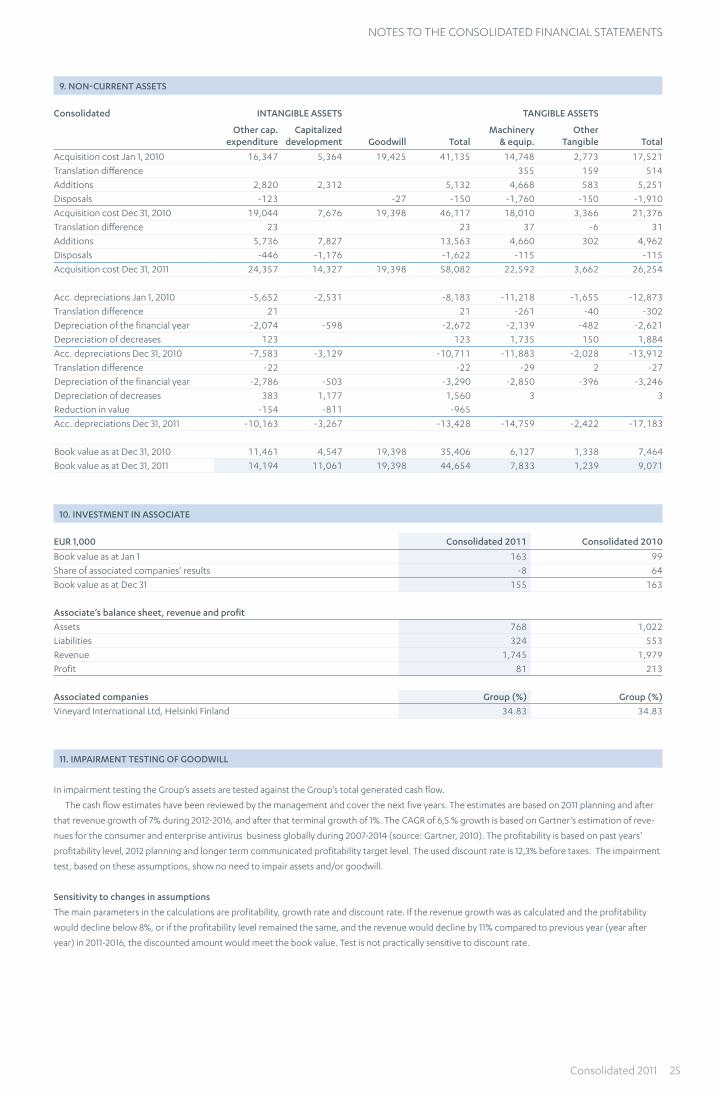
Notes to tHe coNsolidated fiNaNcial stateMeNts
9. NON-CURRENT ASSETS
Consolidated INTANGIBLE ASSETS TANGIBLE ASSETS
Other cap. expenditure
Capitalized development Goodwill Total
Machinery & equip.
Other Tangible Total
Acquisition cost Jan 1, 2010 16,347 5,364 19,425 41,135 14,748 2,773 17,521
Translation difference 355 159 514
Additions 2,820 2,312 5,132 4,668 583 5,251
Disposals -123 -27 -150 -1,760 -150 -1,910
Acquisition cost Dec 31, 2010 19,044 7,676 19,398 46,117 18,010 3,366 21,376
Translation difference 23 23 37 -6 31
Additions 5,736 7,827 13,563 4,660 302 4,962
Disposals -446 -1,176 -1,622 -115 -115
Acquisition cost Dec 31, 2011 24,357 14,327 19,398 58,082 22,592 3,662 26,254
Acc. depreciations Jan 1, 2010 -5,652 -2,531 -8,183 -11,218 -1,655 -12,873
Translation difference 21 21 -261 -40 -302
Depreciation of the financial year -2,074 -598 -2,672 -2,139 -482 -2,621
Depreciation of decreases 123 123 1,735 150 1,884
Acc. depreciations Dec 31, 2010 -7,583 -3,129 -10,711 -11,883 -2,028 -13,912
Translation difference -22 -22 -29 2 -27
Depreciation of the financial year -2,786 -503 -3,290 -2,850 -396 -3,246
Depreciation of decreases 383 1,177 1,560 3 3Reduction in value -154 -811 -965
Acc. depreciations Dec 31, 2011 -10,163 -3,267 -13,428 -14,759 -2,422 -17,183
Book value as at Dec 31, 2010 11,461 4,547 19,398 35,406 6,127 1,338 7,464
Book value as at Dec 31, 2011 14,194 11,061 19,398 44,654 7,833 1,239 9,071
10. INVESTMENT IN ASSOCIATE
EUR 1,000 Consolidated 2011 Consolidated 2010
Book value as at Jan 1 163 99
Share of associated companies' results -8 64
Book value as at Dec 31 155 163
Associate’s balance sheet, revenue and profit
Assets 768 1,022
Liabilities 324 553
Revenue 1,745 1,979
Profit 81 213
Associated companies Group (%) Group (%)
Vineyard International Ltd, Helsinki Finland 34.83 34.83
11. IMPAIRMENT TESTING OF GOODWILL
In impairment testing the Group’s assets are tested against the Group’s total generated cash flow.
The cash flow estimates have been reviewed by the management and cover the next five years. The estimates are based on 2011 planning and after
that revenue growth of 7% during 2012-2016, and after that terminal growth of 1%. The CAGR of 6,5 % growth is based on Gartner’s estimation of reve-
nues for the consumer and enterprise antivirus business globally during 2007-2014 (source: Gartner, 2010). The profitability is based on past years’
profitability level, 2012 planning and longer term communicated profitability target level. The used discount rate is 12,3% before taxes. The impairment
test, based on these assumptions, show no need to impair assets and/or goodwill.
Sensitivity to changes in assumptions
The main parameters in the calculations are profitability, growth rate and discount rate. If the revenue growth was as calculated and the profitability
would decline below 8%, or if the profitability level remained the same, and the revenue would decline by 11% compared to previous year (year after
year) in 2011-2016, the discounted amount would meet the book value. Test is not practically sensitive to discount rate.
Consolidated 2011 25
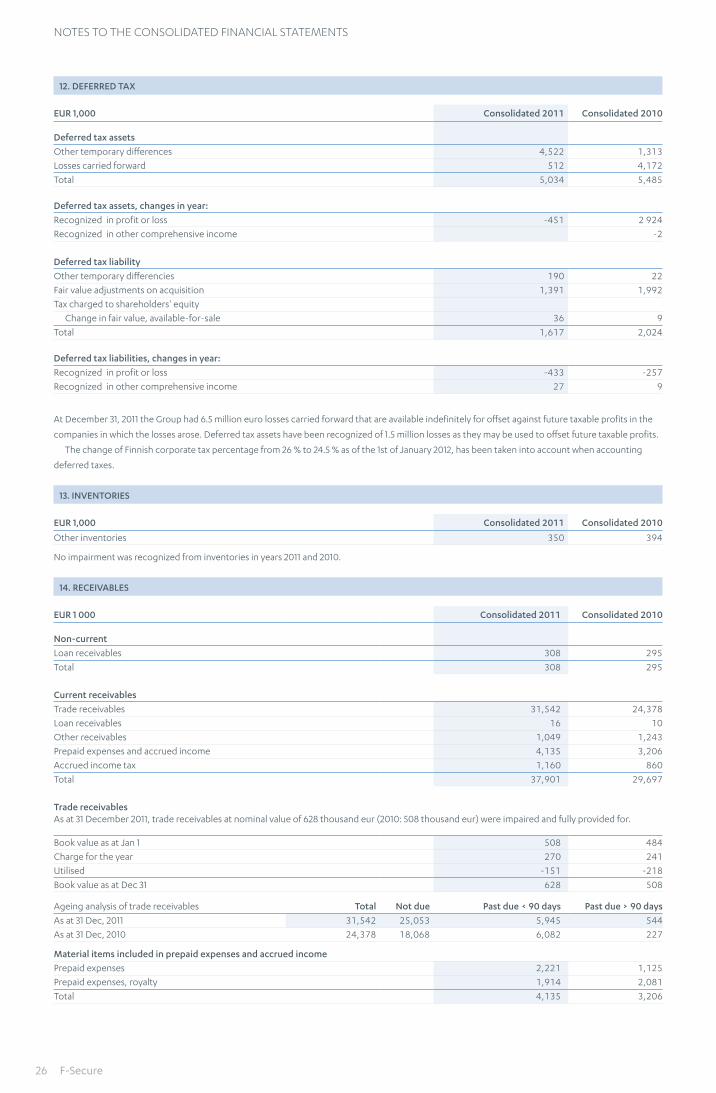
Notes to tHe coNsolidated fiNaNcial stateMeNts
12. DEFERRED TAX
EUR 1,000 Consolidated 2011 Consolidated 2010
Deferred tax assets
Other temporary differences 4,522 1,313
Losses carried forward 512 4,172
Total 5,034 5,485
Deferred tax assets, changes in year:
Recognized in profit or loss -451 2 924
Recognized in other comprehensive income -2
Deferred tax liability
Other temporary differencies 190 22
Fair value adjustments on acquisition 1,391 1,992
Tax charged to shareholders' equity
Change in fair value, available-for-sale 36 9
Total 1,617 2,024
Deferred tax liabilities, changes in year:
Recognized in profit or loss -433 -257
Recognized in other comprehensive income 27 9
At December 31, 2011 the Group had 6.5 million euro losses carried forward that are available indefinitely for offset against future taxable profits in the
companies in which the losses arose. Deferred tax assets have been recognized of 1.5 million losses as they may be used to offset future taxable profits.
The change of Finnish corporate tax percentage from 26 % to 24.5 % as of the 1st of January 2012, has been taken into account when accounting
deferred taxes.
13. INVENTORIES
EUR 1,000 Consolidated 2011 Consolidated 2010
Other inventories 350 394
No impairment was recognized from inventories in years 2011 and 2010.
14. RECEIVABLES
EUR 1 000 Consolidated 2011 Consolidated 2010
Non-current
Loan receivables 308 295
Total 308 295
Current receivables
Trade receivables 31,542 24,378
Loan receivables 16 10
Other receivables 1,049 1,243
Prepaid expenses and accrued income 4,135 3,206
Accrued income tax 1,160 860
Total 37,901 29,697
Trade receivablesAs at 31 December 2011, trade receivables at nominal value of 628 thousand eur (2010: 508 thousand eur) were impaired and fully provided for.
Book value as at Jan 1 508 484
Charge for the year 270 241
Utilised -151 -218
Book value as at Dec 31 628 508
Ageing analysis of trade receivables Total Not due Past due < 90 days Past due > 90 days
As at 31 Dec, 2011 31,542 25,053 5,945 544
As at 31 Dec, 2010 24,378 18,068 6,082 227
Material items included in prepaid expenses and accrued income
Prepaid expenses 2,221 1,125
Prepaid expenses, royalty 1,914 2,081
Total 4,135 3,206
26 F-Secure
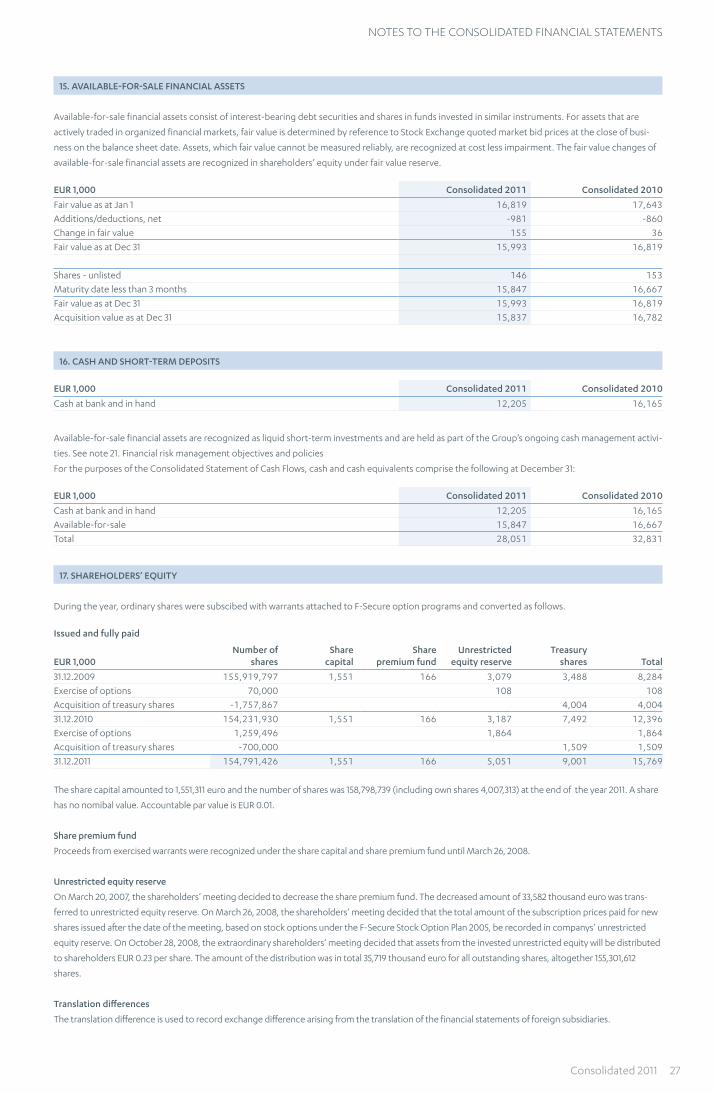
Notes to tHe coNsolidated fiNaNcial stateMeNts
15. AVAILABLE-FOR-SALE FINANCIAL ASSETS
Available-for-sale financial assets consist of interest-bearing debt securities and shares in funds invested in similar instruments. For assets that are
actively traded in organized financial markets, fair value is determined by reference to Stock Exchange quoted market bid prices at the close of busi-
ness on the balance sheet date. Assets, which fair value cannot be measured reliably, are recognized at cost less impairment. The fair value changes of
available-for-sale financial assets are recognized in shareholders’ equity under fair value reserve.
EUR 1,000 Consolidated 2011 Consolidated 2010
Fair value as at Jan 1 16,819 17,643
Additions/deductions, net -981 -860
Change in fair value 155 36
Fair value as at Dec 31 15,993 16,819
Shares - unlisted 146 153
Maturity date less than 3 months 15,847 16,667
Fair value as at Dec 31 15,993 16,819
Acquisition value as at Dec 31 15,837 16,782
16. CASH AND SHORT-TERM DEPOSITS
EUR 1,000 Consolidated 2011 Consolidated 2010
Cash at bank and in hand 12,205 16,165
Available-for-sale financial assets are recognized as liquid short-term investments and are held as part of the Group’s ongoing cash management activi-
ties. See note 21. Financial risk management objectives and policies
For the purposes of the Consolidated Statement of Cash Flows, cash and cash equivalents comprise the following at December 31:
EUR 1,000 Consolidated 2011 Consolidated 2010
Cash at bank and in hand 12,205 16,165
Available-for-sale 15,847 16,667
Total 28,051 32,831
17. SHAREHOLDERS’ EQUITY
During the year, ordinary shares were subscibed with warrants attached to F-Secure option programs and converted as follows.
Issued and fully paid
EUR 1,000Number of
sharesShare
capitalShare
premium fundUnrestricted
equity reserveTreasury
shares Total
31.12.2009 155,919,797 1,551 166 3,079 3,488 8,284
Exercise of options 70,000 108 108
Acquisition of treasury shares -1,757,867 4,004 4,004
31.12.2010 154,231,930 1,551 166 3,187 7,492 12,396
Exercise of options 1,259,496 1,864 1,864
Acquisition of treasury shares -700,000 1,509 1,509
31.12.2011 154,791,426 1,551 166 5,051 9,001 15,769
The share capital amounted to 1,551,311 euro and the number of shares was 158,798,739 (including own shares 4,007,313) at the end of the year 2011. A share
has no nomibal value. Accountable par value is EUR 0.01.
Share premium fund
Proceeds from exercised warrants were recognized under the share capital and share premium fund until March 26, 2008.
Unrestricted equity reserve
On March 20, 2007, the shareholders’ meeting decided to decrease the share premium fund. The decreased amount of 33,582 thousand euro was trans-
ferred to unrestricted equity reserve. On March 26, 2008, the shareholders’ meeting decided that the total amount of the subscription prices paid for new
shares issued after the date of the meeting, based on stock options under the F-Secure Stock Option Plan 2005, be recorded in companys’ unrestricted
equity reserve. On October 28, 2008, the extraordinary shareholders’ meeting decided that assets from the invested unrestricted equity will be distributed
to shareholders EUR 0.23 per share. The amount of the distribution was in total 35,719 thousand euro for all outstanding shares, altogether 155,301,612
shares.
Translation differences
The translation difference is used to record exchange difference arising from the translation of the financial statements of foreign subsidiaries.
Consolidated 2011 27
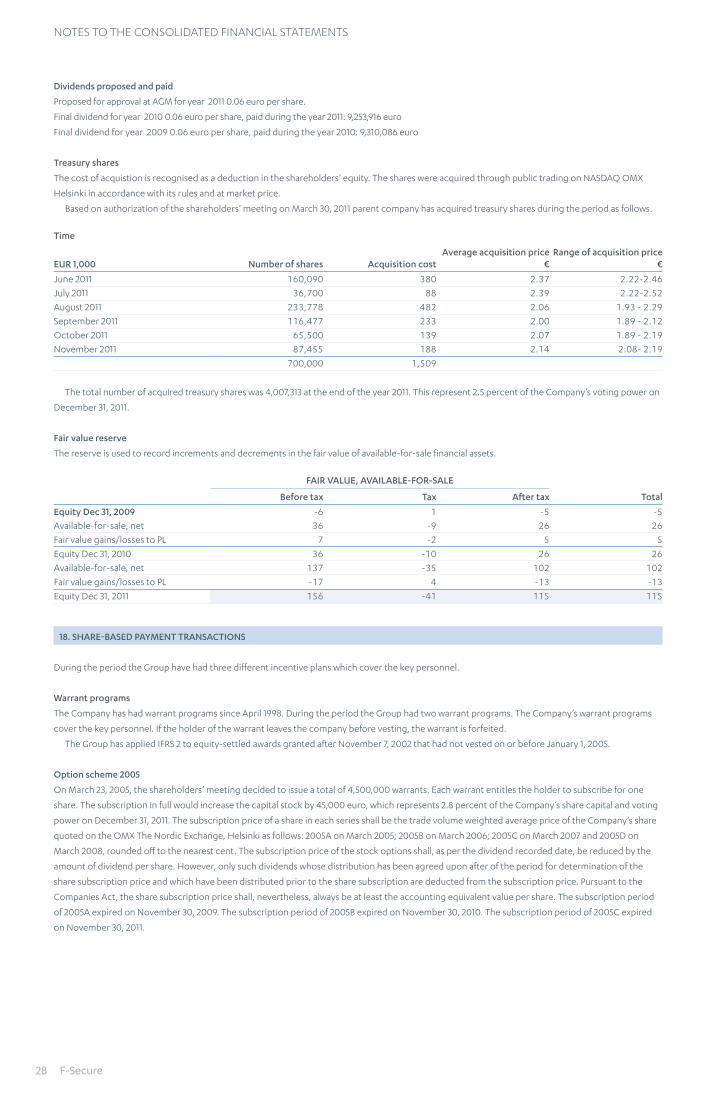
Notes to tHe coNsolidated fiNaNcial stateMeNts
Dividends proposed and paid
Proposed for approval at AGM for year 2011 0.06 euro per share.
Final dividend for year 2010 0.06 euro per share, paid during the year 2011: 9,253,916 euro
Final dividend for year 2009 0.06 euro per share, paid during the year 2010: 9,310,086 euro
Treasury shares
The cost of acquistion is recognised as a deduction in the shareholders’ equity. The shares were acquired through public trading on NASDAQ OMX
Helsinki in accordance with its rules and at market price.
Based on authorization of the shareholders’ meeting on March 30, 2011 parent company has acquired treasury shares during the period as follows.
Time
EUR 1,000 Number of shares Acquisition costAverage acquisition price
€Range of acquisition price
€
June 2011 160,090 380 2.37 2.22-2.46
July 2011 36,700 88 2.39 2.22-2.52
August 2011 233,778 482 2.06 1.93 - 2.29
September 2011 116,477 233 2.00 1.89 - 2.12
October 2011 65,500 139 2.07 1.89 - 2.19
November 2011 87,455 188 2.14 2.08- 2.19
700,000 1,509
The total number of acquired treasury shares was 4,007,313 at the end of the year 2011. This represent 2.5 percent of the Company’s voting power on
December 31, 2011.
Fair value reserve
The reserve is used to record increments and decrements in the fair value of available-for-sale financial assets.
FAIR VALUE, AVAILABLE-FOR-SALE
Before tax Tax After tax Total
Equity Dec 31, 2009 -6 1 -5 -5Available-for-sale, net 36 -9 26 26
Fair value gains/losses to PL 7 -2 5 5
Equity Dec 31, 2010 36 -10 26 26
Available-for-sale, net 137 -35 102 102
Fair value gains/losses to PL -17 4 -13 -13
Equity Dec 31, 2011 156 -41 115 115
18. SHARE-BASED PAYMENT TRANSACTIONS
During the period the Group have had three different incentive plans which cover the key personnel.
Warrant programs
The Company has had warrant programs since April 1998. During the period the Group had two warrant programs. The Company’s warrant programs
cover the key personnel. If the holder of the warrant leaves the company before vesting, the warrant is forfeited.
The Group has applied IFRS 2 to equity-settled awards granted after November 7, 2002 that had not vested on or before January 1, 2005.
Option scheme 2005
On March 23, 2005, the shareholders’ meeting decided to issue a total of 4,500,000 warrants. Each warrant entitles the holder to subscribe for one
share. The subscription in full would increase the capital stock by 45,000 euro, which represents 2.8 percent of the Company’s share capital and voting
power on December 31, 2011. The subscription price of a share in each series shall be the trade volume weighted average price of the Company’s share
quoted on the OMX The Nordic Exchange, Helsinki as follows: 2005A on March 2005; 2005B on March 2006; 2005C on March 2007 and 2005D on
March 2008, rounded off to the nearest cent. The subscription price of the stock options shall, as per the dividend recorded date, be reduced by the
amount of dividend per share. However, only such dividends whose distribution has been agreed upon after of the period for determination of the
share subscription price and which have been distributed prior to the share subscription are deducted from the subscription price. Pursuant to the
Companies Act, the share subscription price shall, nevertheless, always be at least the accounting equivalent value per share. The subscription period
of 2005A expired on November 30, 2009. The subscription period of 2005B expired on November 30, 2010. The subscription period of 2005C expired
on November 30, 2011.
28 F-Secure
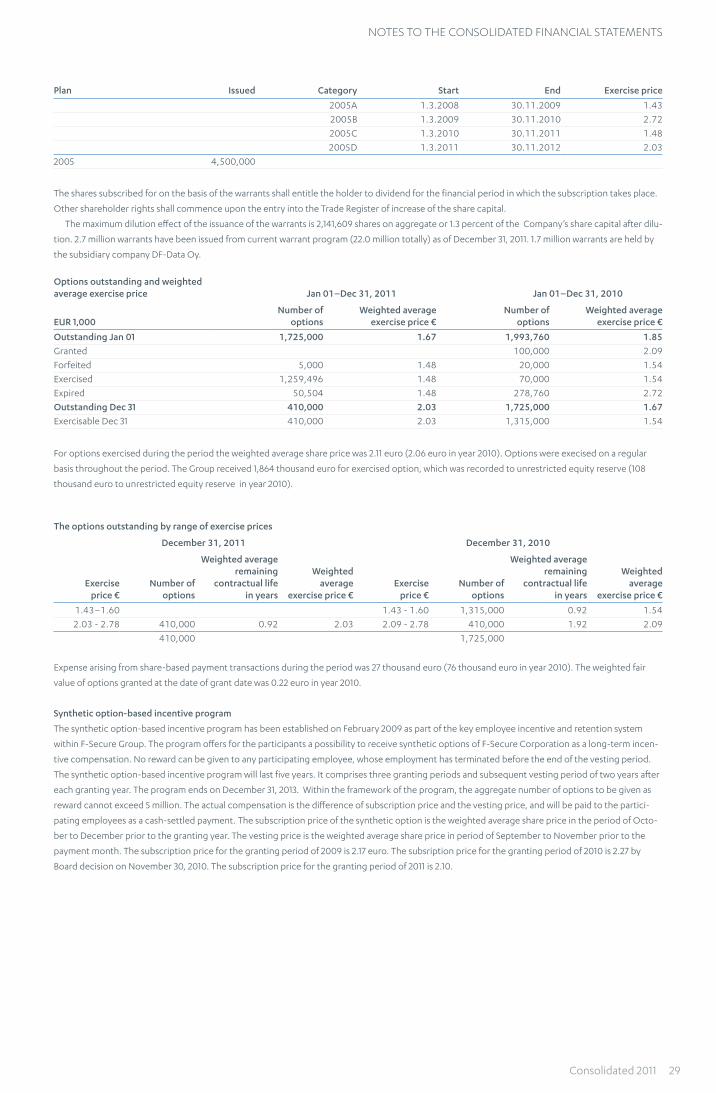
Notes to tHe coNsolidated fiNaNcial stateMeNts
Plan Issued Category Start End Exercise price
2005A 1.3.2008 30.11.2009 1.43
2005B 1.3.2009 30.11.2010 2.72
2005C 1.3.2010 30.11.2011 1.48
2005D 1.3.2011 30.11.2012 2.03
2005 4,500,000
The shares subscribed for on the basis of the warrants shall entitle the holder to dividend for the financial period in which the subscription takes place.
Other shareholder rights shall commence upon the entry into the Trade Register of increase of the share capital.
The maximum dilution effect of the issuance of the warrants is 2,141,609 shares on aggregate or 1.3 percent of the Company’s share capital after dilu-
tion. 2.7 million warrants have been issued from current warrant program (22.0 million totally) as of December 31, 2011. 1.7 million warrants are held by
the subsidiary company DF-Data Oy.
Options outstanding and weighted average exercise price Jan 01–Dec 31, 2011 Jan 01–Dec 31, 2010
EUR 1,000Number of
options Weighted average
exercise price €Number of
options Weighted average
exercise price €
Outstanding Jan 01 1,725,000 1.67 1,993,760 1.85
Granted 100,000 2.09
Forfeited 5,000 1.48 20,000 1.54
Exercised 1,259,496 1.48 70,000 1.54
Expired 50,504 1.48 278,760 2.72
Outstanding Dec 31 410,000 2.03 1,725,000 1.67
Exercisable Dec 31 410,000 2.03 1,315,000 1.54
For options exercised during the period the weighted average share price was 2.11 euro (2.06 euro in year 2010). Options were execised on a regular
basis throughout the period. The Group received 1,864 thousand euro for exercised option, which was recorded to unrestricted equity reserve (108
thousand euro to unrestricted equity reserve in year 2010).
The options outstanding by range of exercise prices
December 31, 2011 December 31, 2010
Exercise price €
Number of options
Weighted average remaining
contractual life in years
Weighted average
exercise price €Exercise
price €Number of
options
Weighted average remaining
contractual life in years
Weighted average
exercise price €
1.43–1.60 1.43 - 1.60 1,315,000 0.92 1.54
2.03 - 2.78 410,000 0.92 2.03 2.09 - 2.78 410,000 1.92 2.09
410,000 1,725,000
Expense arising from share-based payment transactions during the period was 27 thousand euro (76 thousand euro in year 2010). The weighted fair
value of options granted at the date of grant date was 0.22 euro in year 2010.
Synthetic option-based incentive program
The synthetic option-based incentive program has been established on February 2009 as part of the key employee incentive and retention system
within F-Secure Group. The program offers for the participants a possibility to receive synthetic options of F-Secure Corporation as a long-term incen-
tive compensation. No reward can be given to any participating employee, whose employment has terminated before the end of the vesting period.
The synthetic option-based incentive program will last five years. It comprises three granting periods and subsequent vesting period of two years after
each granting year. The program ends on December 31, 2013. Within the framework of the program, the aggregate number of options to be given as
reward cannot exceed 5 million. The actual compensation is the difference of subscription price and the vesting price, and will be paid to the partici-
pating employees as a cash-settled payment. The subscription price of the synthetic option is the weighted average share price in the period of Octo-
ber to December prior to the granting year. The vesting price is the weighted average share price in period of September to November prior to the
payment month. The subscription price for the granting period of 2009 is 2.17 euro. The subsription price for the granting period of 2010 is 2.27 by
Board decision on November 30, 2010. The subscription price for the granting period of 2011 is 2.10.
Consolidated 2011 29
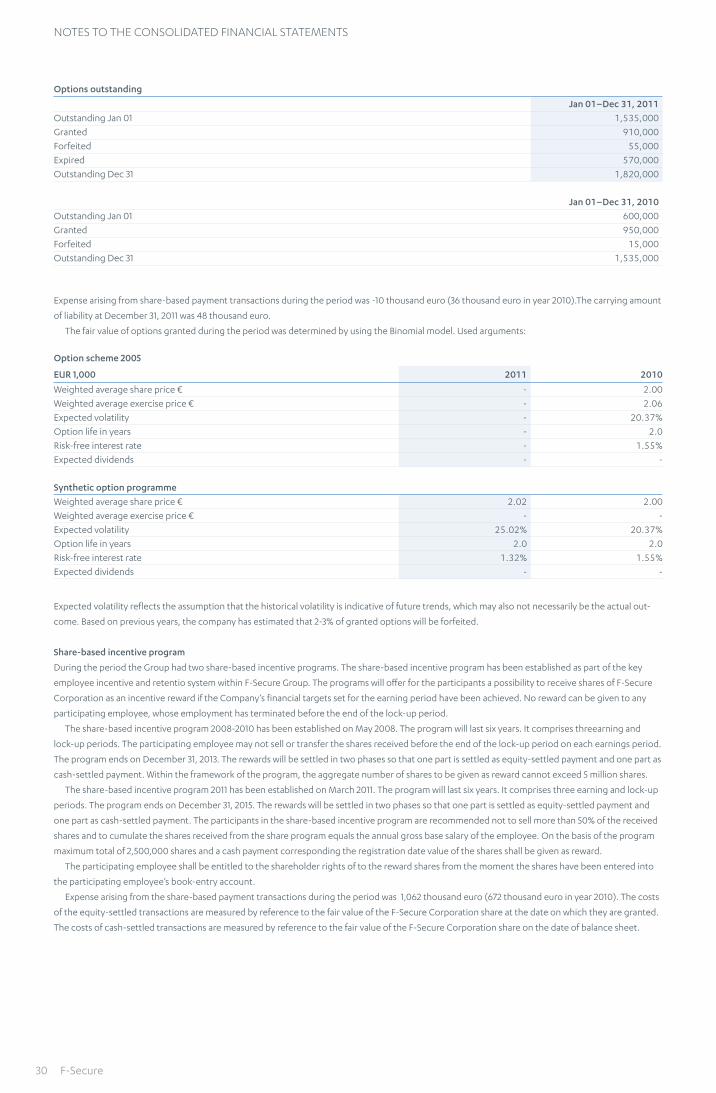
Notes to tHe coNsolidated fiNaNcial stateMeNts
Options outstanding
Jan 01–Dec 31, 2011
Outstanding Jan 01 1,535,000
Granted 910,000
Forfeited 55,000
Expired 570,000
Outstanding Dec 31 1,820,000
Jan 01–Dec 31, 2010
Outstanding Jan 01 600,000
Granted 950,000
Forfeited 15,000
Outstanding Dec 31 1,535,000
Expense arising from share-based payment transactions during the period was -10 thousand euro (36 thousand euro in year 2010).The carrying amount
of liability at December 31, 2011 was 48 thousand euro.
The fair value of options granted during the period was determined by using the Binomial model. Used arguments:
Option scheme 2005
EUR 1,000 2011 2010
Weighted average share price € - 2.00
Weighted average exercise price € - 2.06
Expected volatility - 20.37%
Option life in years - 2.0
Risk-free interest rate - 1.55%
Expected dividends - -
Synthetic option programme
Weighted average share price € 2.02 2.00
Weighted average exercise price € - -
Expected volatility 25.02% 20.37%
Option life in years 2.0 2.0
Risk-free interest rate 1.32% 1.55%
Expected dividends - -
Expected volatility reflects the assumption that the historical volatility is indicative of future trends, which may also not necessarily be the actual out-
come. Based on previous years, the company has estimated that 2-3% of granted options will be forfeited.
Share-based incentive program
During the period the Group had two share-based incentive programs. The share-based incentive program has been established as part of the key
employee incentive and retentio system within F-Secure Group. The programs will offer for the participants a possibility to receive shares of F-Secure
Corporation as an incentive reward if the Company’s financial targets set for the earning period have been achieved. No reward can be given to any
participating employee, whose employment has terminated before the end of the lock-up period.
The share-based incentive program 2008-2010 has been established on May 2008. The program will last six years. It comprises threearning and
lock-up periods. The participating employee may not sell or transfer the shares received before the end of the lock-up period on each earnings period.
The program ends on December 31, 2013. The rewards will be settled in two phases so that one part is settled as equity-settled payment and one part as
cash-settled payment. Within the framework of the program, the aggregate number of shares to be given as reward cannot exceed 5 million shares.
The share-based incentive program 2011 has been established on March 2011. The program will last six years. It comprises three earning and lock-up
periods. The program ends on December 31, 2015. The rewards will be settled in two phases so that one part is settled as equity-settled payment and
one part as cash-settled payment. The participants in the share-based incentive program are recommended not to sell more than 50% of the received
shares and to cumulate the shares received from the share program equals the annual gross base salary of the employee. On the basis of the program
maximum total of 2,500,000 shares and a cash payment corresponding the registration date value of the shares shall be given as reward.
The participating employee shall be entitled to the shareholder rights of to the reward shares from the moment the shares have been entered into
the participating employee’s book-entry account.
Expense arising from the share-based payment transactions during the period was 1,062 thousand euro (672 thousand euro in year 2010). The costs
of the equity-settled transactions are measured by reference to the fair value of the F-Secure Corporation share at the date on which they are granted.
The costs of cash-settled transactions are measured by reference to the fair value of the F-Secure Corporation share on the date of balance sheet.
30 F-Secure
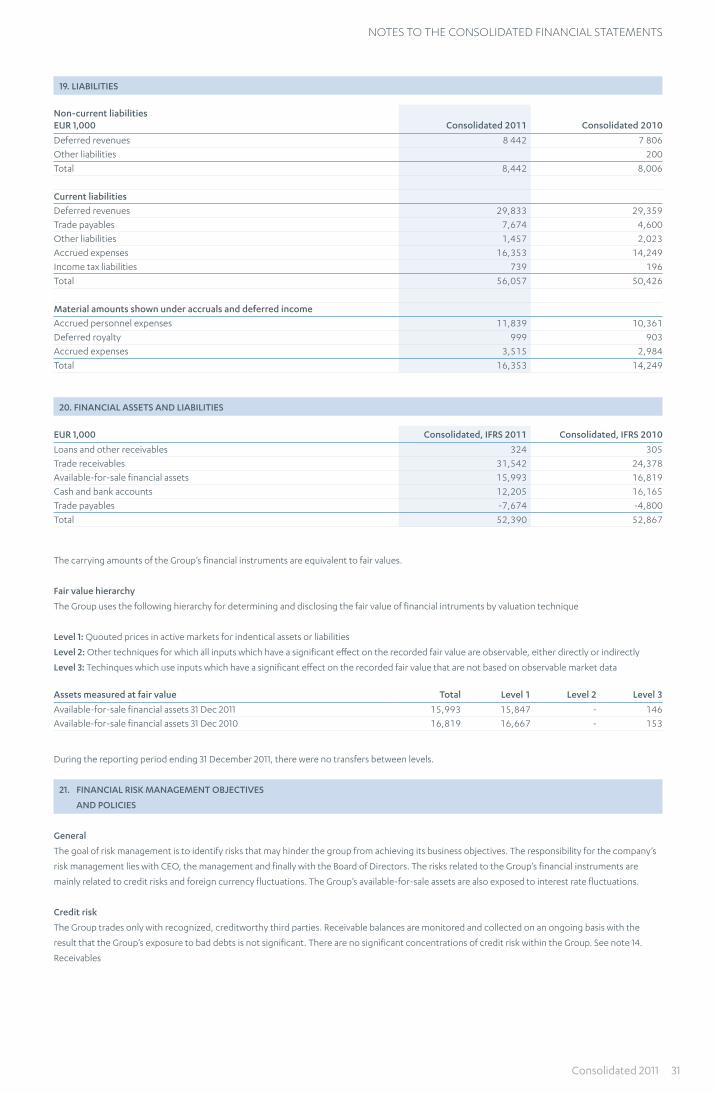
Notes to tHe coNsolidated fiNaNcial stateMeNts
19. LIABILITIES
Non-current liabilities EUR 1,000 Consolidated 2011 Consolidated 2010
Deferred revenues 8 442 7 806
Other liabilities 200
Total 8,442 8,006
Current liabilities
Deferred revenues 29,833 29,359
Trade payables 7,674 4,600
Other liabilities 1,457 2,023
Accrued expenses 16,353 14,249
Income tax liabilities 739 196
Total 56,057 50,426
Material amounts shown under accruals and deferred income
Accrued personnel expenses 11,839 10,361
Deferred royalty 999 903
Accrued expenses 3,515 2,984
Total 16,353 14,249
20. FINANCIAL ASSETS AND LIABILITIES
EUR 1,000 Consolidated, IFRS 2011 Consolidated, IFRS 2010
Loans and other receivables 324 305
Trade receivables 31,542 24,378
Available-for-sale financial assets 15,993 16,819
Cash and bank accounts 12,205 16,165
Trade payables -7,674 -4,800
Total 52,390 52,867
The carrying amounts of the Group’s financial instruments are equivalent to fair values.
Fair value hierarchy
The Group uses the following hierarchy for determining and disclosing the fair value of financial intruments by valuation technique
Level 1: Quouted prices in active markets for indentical assets or liabilities
Level 2: Other techniques for which all inputs which have a significant effect on the recorded fair value are observable, either directly or indirectly
Level 3: Techinques which use inputs which have a significant effect on the recorded fair value that are not based on observable market data
Assets measured at fair value Total Level 1 Level 2 Level 3
Available-for-sale financial assets 31 Dec 2011 15,993 15,847 - 146
Available-for-sale financial assets 31 Dec 2010 16,819 16,667 - 153
During the reporting period ending 31 December 2011, there were no transfers between levels.
21. FINANCIAL RISK MANAGEMENT OBJECTIVES
AND POLICIES
General
The goal of risk management is to identify risks that may hinder the group from achieving its business objectives. The responsibility for the company’s
risk management lies with CEO, the management and finally with the Board of Directors. The risks related to the Group’s financial instruments are
mainly related to credit risks and foreign currency fluctuations. The Group’s available-for-sale assets are also exposed to interest rate fluctuations.
Credit risk
The Group trades only with recognized, creditworthy third parties. Receivable balances are monitored and collected on an ongoing basis with the
result that the Group’s exposure to bad debts is not significant. There are no significant concentrations of credit risk within the Group. See note 14.
Receivables
Consolidated 2011 31
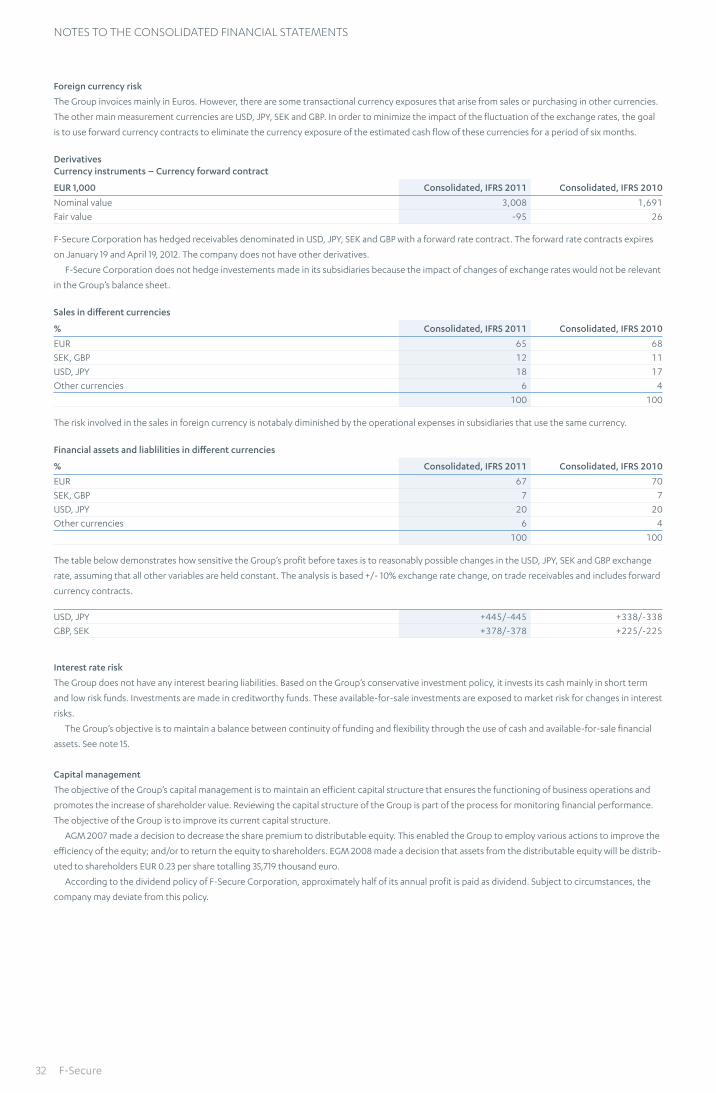
Notes to tHe coNsolidated fiNaNcial stateMeNts
Foreign currency risk
The Group invoices mainly in Euros. However, there are some transactional currency exposures that arise from sales or purchasing in other currencies.
The other main measurement currencies are USD, JPY, SEK and GBP. In order to minimize the impact of the fluctuation of the exchange rates, the goal
is to use forward currency contracts to eliminate the currency exposure of the estimated cash flow of these currencies for a period of six months.
DerivativesCurrency instruments – Currency forward contract
EUR 1,000 Consolidated, IFRS 2011 Consolidated, IFRS 2010
Nominal value 3,008 1,691
Fair value -95 26
F-Secure Corporation has hedged receivables denominated in USD, JPY, SEK and GBP with a forward rate contract. The forward rate contracts expires
on January 19 and April 19, 2012. The company does not have other derivatives.
F-Secure Corporation does not hedge investements made in its subsidiaries because the impact of changes of exchange rates would not be relevant
in the Group’s balance sheet.
Sales in different currencies
% Consolidated, IFRS 2011 Consolidated, IFRS 2010
EUR 65 68
SEK, GBP 12 11
USD, JPY 18 17
Other currencies 6 4
100 100
The risk involved in the sales in foreign currency is notabaly diminished by the operational expenses in subsidiaries that use the same currency.
Financial assets and liablilities in different currencies
% Consolidated, IFRS 2011 Consolidated, IFRS 2010
EUR 67 70
SEK, GBP 7 7
USD, JPY 20 20
Other currencies 6 4
100 100
The table below demonstrates how sensitive the Group’s profit before taxes is to reasonably possible changes in the USD, JPY, SEK and GBP exchange
rate, assuming that all other variables are held constant. The analysis is based +/- 10% exchange rate change, on trade receivables and includes forward
currency contracts.
USD, JPY +445/-445 +338/-338
GBP, SEK +378/-378 +225/-225
Interest rate risk
The Group does not have any interest bearing liabilities. Based on the Group’s conservative investment policy, it invests its cash mainly in short term
and low risk funds. Investments are made in creditworthy funds. These available-for-sale investments are exposed to market risk for changes in interest
risks.
The Group’s objective is to maintain a balance between continuity of funding and flexibility through the use of cash and available-for-sale financial
assets. See note 15.
Capital management
The objective of the Group’s capital management is to maintain an efficient capital structure that ensures the functioning of business operations and
promotes the increase of shareholder value. Reviewing the capital structure of the Group is part of the process for monitoring financial performance.
The objective of the Group is to improve its current capital structure.
AGM 2007 made a decision to decrease the share premium to distributable equity. This enabled the Group to employ various actions to improve the
efficiency of the equity; and/or to return the equity to shareholders. EGM 2008 made a decision that assets from the distributable equity will be distrib-
uted to shareholders EUR 0.23 per share totalling 35,719 thousand euro.
According to the dividend policy of F-Secure Corporation, approximately half of its annual profit is paid as dividend. Subject to circumstances, the
company may deviate from this policy.
32 F-Secure
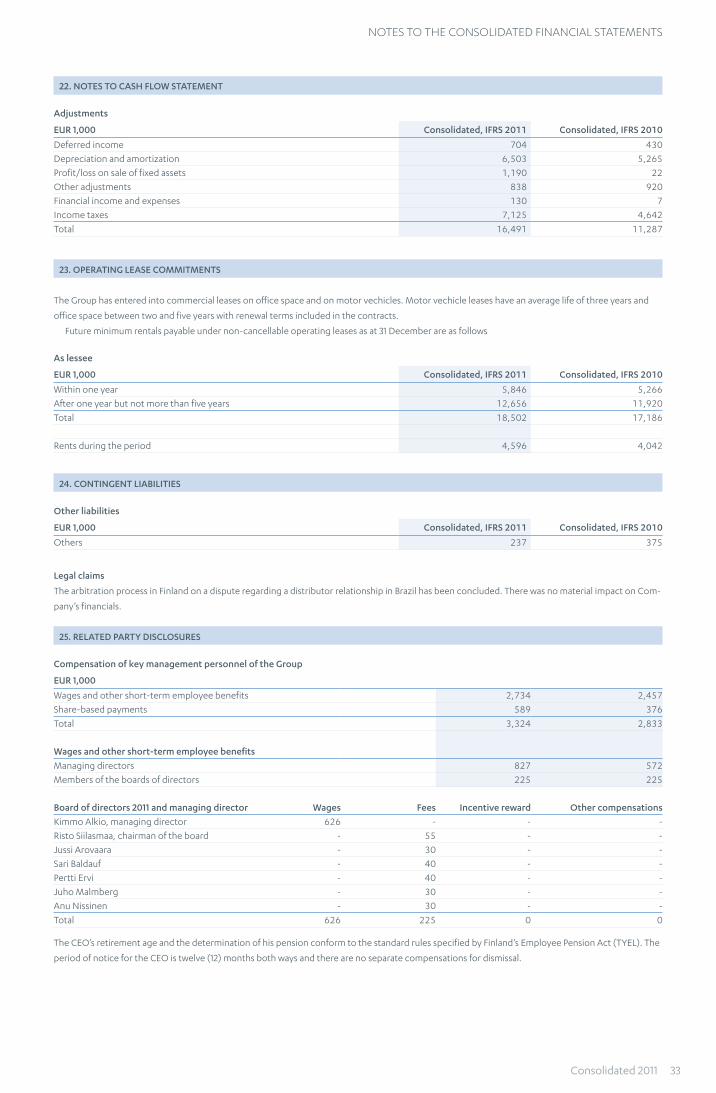
NOTES TO THE CONSOLIDATED FINANCIAL STATEMENTS
22. Notes to cash flow statemeNt
adjustments
eUR 1,000 consolidated, IfRs 2011 consolidated, IfRs 2010
Deferred income 704 430
Depreciation and amortization 6,503 5,265
Profit/loss on sale of fixed assets 1,190 22
Other adjustments 838 920
Financial income and expenses 130 7
Income taxes 7,125 4,642
Total 16,491 11,287
23. opeRatINg lease commItmeNts
The Group has entered into commercial leases on office space and on motor vechicles. Motor vechicle leases have an average life of three years and
office space between two and five years with renewal terms included in the contracts.
Future minimum rentals payable under non-cancellable operating leases as at 31 December are as follows
as lessee
eUR 1,000 consolidated, IfRs 2011 consolidated, IfRs 2010
Within one year 5,846 5,266
After one year but not more than five years 12,656 11,920
Total 18,502 17,186
Rents during the period 4,596 4,042
24. coNtINgeNt lIabIlItIes
other liabilities
eUR 1,000 consolidated, IfRs 2011 consolidated, IfRs 2010
Others 237 375
legal claims
The arbitration process in Finland on a dispute regarding a distributor relationship in Brazil has been concluded. There was no material impact on Com-
pany’s financials.
25. Related paRty dIsclosURes
compensation of key management personnel of the group
eUR 1,000
Wages and other short-term employee benefits 2,734 2,457
Share-based payments 589 376
Total 3,324 2,833
wages and other short-term employee benefits
Managing directors 827 572
Members of the boards of directors 225 225
board of directors 2011 and managing director wages fees Incentive reward other compensations
Kimmo Alkio, managing director 626 - - -
Risto Siilasmaa, chairman of the board - 55 - -
Jussi Arovaara - 30 - -
Sari Baldauf - 40 - -
Pertti Ervi - 40 - -
Juho Malmberg - 30 - -
Anu Nissinen - 30 - -
Total 626 225 0 0
The CEO’s retirement age and the determination of his pension conform to the standard rules specified by Finland’s Employee Pension Act (TYEL). The
period of notice for the CEO is twelve (12) months both ways and there are no separate compensations for dismissal.
Consolidated 2011 33
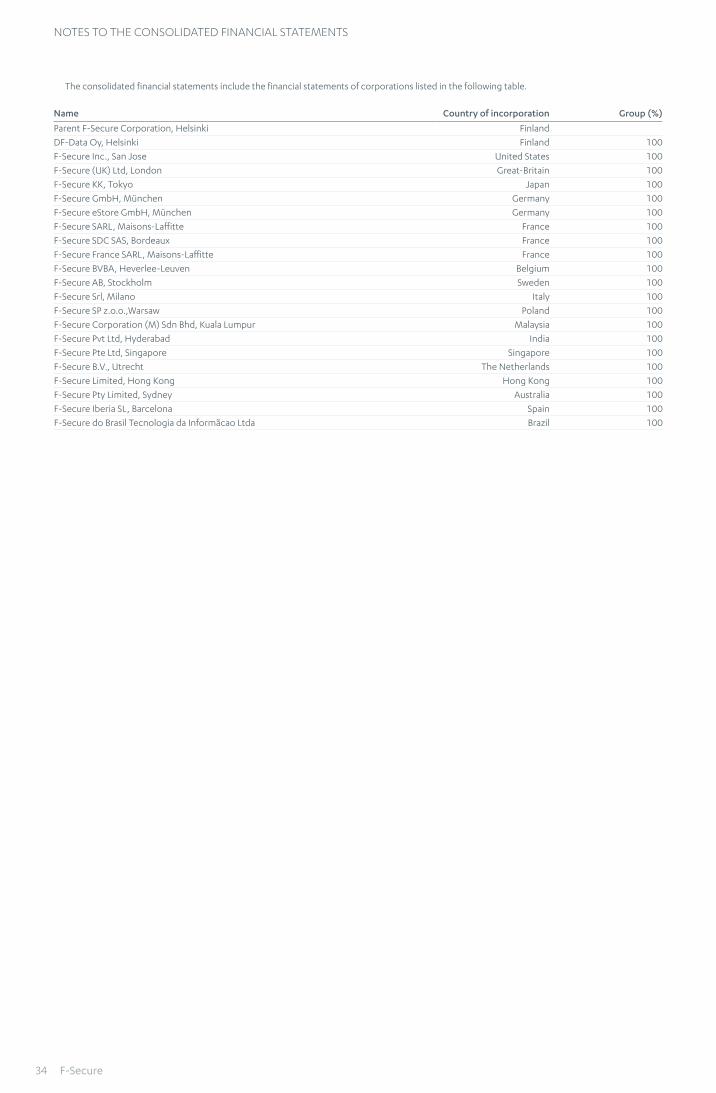
NOTES TO THE CONSOLIDATED FINANCIAL STATEMENTS
The consolidated financial statements include the financial statements of corporations listed in the following table.
Name country of incorporation group (%)
Parent F-Secure Corporation, Helsinki Finland
DF-Data Oy, Helsinki Finland 100
F-Secure Inc., San Jose United States 100
F-Secure (UK) Ltd, London Great-Britain 100
F-Secure KK, Tokyo Japan 100
F-Secure GmbH, München Germany 100
F-Secure eStore GmbH, München Germany 100
F-Secure SARL, Maisons-Laffitte France 100
F-Secure SDC SAS, Bordeaux France 100
F-Secure France SARL, Maisons-Laffitte France 100
F-Secure BVBA, Heverlee-Leuven Belgium 100
F-Secure AB, Stockholm Sweden 100
F-Secure Srl, Milano Italy 100
F-Secure SP z.o.o.,Warsaw Poland 100
F-Secure Corporation (M) Sdn Bhd, Kuala Lumpur Malaysia 100
F-Secure Pvt Ltd, Hyderabad India 100
F-Secure Pte Ltd, Singapore Singapore 100
F-Secure B.V., Utrecht The Netherlands 100
F-Secure Limited, Hong Kong Hong Kong 100
F-Secure Pty Limited, Sydney Australia 100
F-Secure Iberia SL, Barcelona Spain 100
F-Secure do Brasil Tecnologia da Informãcao Ltda Brazil 100
34 F-Secure
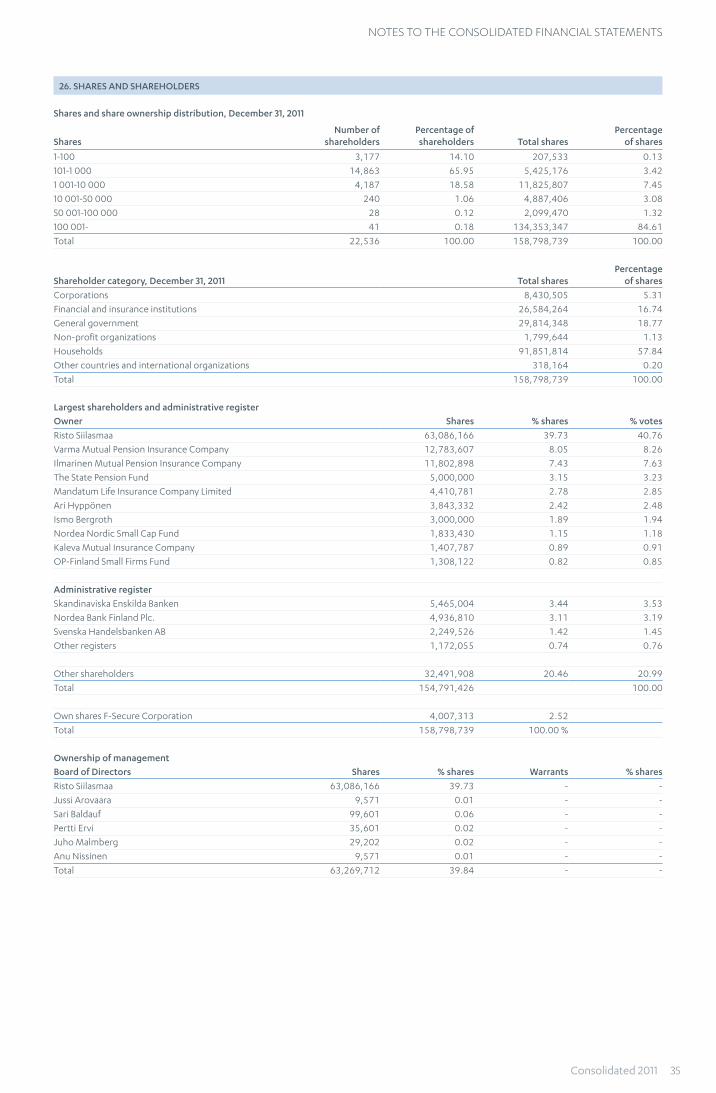
Notes to tHe coNsolidated fiNaNcial stateMeNts
26. SHARES AND SHAREHOLDERS
Shares and share ownership distribution, December 31, 2011
SharesNumber of
shareholdersPercentage of shareholders Total shares
Percentage of shares
1-100 3,177 14.10 207,533 0.13
101-1 000 14,863 65.95 5,425,176 3.42
1 001-10 000 4,187 18.58 11,825,807 7.45
10 001-50 000 240 1.06 4,887,406 3.08
50 001-100 000 28 0.12 2,099,470 1.32
100 001- 41 0.18 134,353,347 84.61
Total 22,536 100.00 158,798,739 100.00
Shareholder category, December 31, 2011 Total sharesPercentage
of shares
Corporations 8,430,505 5.31
Financial and insurance institutions 26,584,264 16.74
General government 29,814,348 18.77
Non-profit organizations 1,799,644 1.13
Households 91,851,814 57.84
Other countries and international organizations 318,164 0.20
Total 158,798,739 100.00
Largest shareholders and administrative registerOwner Shares % shares % votes
Risto Siilasmaa 63,086,166 39.73 40.76
Varma Mutual Pension Insurance Company 12,783,607 8.05 8.26
Ilmarinen Mutual Pension Insurance Company 11,802,898 7.43 7.63
The State Pension Fund 5,000,000 3.15 3.23
Mandatum Life Insurance Company Limited 4,410,781 2.78 2.85
Ari Hyppönen 3,843,332 2.42 2.48
Ismo Bergroth 3,000,000 1.89 1.94
Nordea Nordic Small Cap Fund 1,833,430 1.15 1.18
Kaleva Mutual Insurance Company 1,407,787 0.89 0.91
OP-Finland Small Firms Fund 1,308,122 0.82 0.85
Administrative register
Skandinaviska Enskilda Banken 5,465,004 3.44 3.53
Nordea Bank Finland Plc. 4,936,810 3.11 3.19
Svenska Handelsbanken AB 2,249,526 1.42 1.45
Other registers 1,172,055 0.74 0.76
Other shareholders 32,491,908 20.46 20.99
Total 154,791,426 100.00
Own shares F-Secure Corporation 4,007,313 2.52
Total 158,798,739 100.00 %
Ownership of managementBoard of Directors Shares % shares Warrants % shares
Risto Siilasmaa 63,086,166 39.73 - -
Jussi Arovaara 9,571 0.01 - -
Sari Baldauf 99,601 0.06 - -
Pertti Ervi 35,601 0.02 - -
Juho Malmberg 29,202 0.02 - -
Anu Nissinen 9,571 0.01 - -
Total 63,269,712 39.84 - -
Consolidated 2011 35

Notes to tHe coNsolidated fiNaNcial stateMeNts
Executive team Shares % shares Warrants % shares
Pirkka Palomäki 1,964 - 60,000 0.04
Ari Alakiuttu - - 40,000 0.03
Tuomas Hyyryläinen - - 100,000 0.06
Samu Konttinen - - 20,000 0.01
Maria Nordgren - - - -
Kari Penttilä 50 - - -
Antti Reijonen 35,000 0.02 - -
Patrik Sallner - - - -
Taneli Virtanen 15,000 0.01 15,000 0.01
Total 52,014 0.03 235,000 0.15
Ownership of management
The Board of Directors and CEO owned a total of 63.271.676 shares on December 31, 2011. This represents 39.8 percent of the Company’s shares and
40.9 percent of votes. In addition, the warrants of the management accounted for 0.2 percent of the total amount of F-Secure shares. With these stock
options 235,000 new shares can be issued.
36 F-Secure

Notes to tHe coNsolidated fiNaNcial stateMeNts
27. KEY RATIOS
Economic indicators IFRS 2011 IFRS 2010 IFRS 2009 IFRS 2008 IFRS 2007
Net sales (MEUR) 146.0 130.1 125.1 113.0 96.8
Net sales growth % 12 4 11 17 20
Operating result (MEUR) 23.6 19.8 24.0 24.3 19.5
% of net sales 16.2 15.2 19.2 21.5 20.1
Result before taxes 23.5 19.9 25.2 26.4 21.4
% of net sales 16.1 15.3 20.1 23.4 22.1
ROE (%) 29.5 30.3 32.2 36.0 25.4
ROI (%) 44.3 42.5 45.0 51.5 36.3
Equity ratio (%) 68.1 69.1 69.8 71.3 81.6
Investments (MEUR) 18.7 10.4 37.2 3.1 2.2
% of net sales 12.8 8.0 29.7 2.7 2.3
R&D costs (MEUR) 39.3 34.5 28.0 25.5 21.2
% of net sales 26.9 26.5 22.4 22.6 21.9
Capitalized development (MEUR) 7.8 2.3 1.7 0.5 0.1
Gearing % -47.1 -63.2 -68.5 -148.5 -124.6
Wages and salaries (MEUR) 48.3 45.9 39.7 35.8 29.9
Personnel on average 878 835 770 652 528
Personnel on Dec 31 942 812 826 718 566
Key ratios
Earnings / share (EUR) 0.11 0.10 0.12 0.13 0.10
Earnings / share diluted 0.10 0.10 0.12 0.12 0.10
Shareholders' equity per share 0.38 0.33 0.31 0.26 0.44
Dividend per share *) 0.06 0.06 0.06 0.07 0.07
Dividend per earnings (%) 54.5 60.0 50.0 53.8 70.0
Effective dividends (%) 3.0 3.0 2.2 3.7 2.9
P/E ratio 19.0 23.1 22.8 14.9 24.6
Share price, lowest (EUR) 1.88 1.97 1.86 1.73 1.83
Share price, highest (EUR) 2.66 2.93 3.14 3.05 2.79
Mean share price (EUR) 2.26 2.27 2.43 2.39 2.32
Share price Dec 31 2.01 2.00 2.74 1.88 2.45
Market capitalization (MEUR) 319.2 315.1 431.5 293.4 379.9
Trading volume (millions) 42.6 65.9 55.5 64.5 80.3
Trading volume (%) 27.6 42.5 35.6 41.5 51.8
Adjusted number of shares
average during the period 154,432,955 154,967,615 155,770,113 155,301,688 155,040,771
average during the period, diluted 157,499,090 158,893,701 160,248,717 161,464,443 161,464,443
Dec 31 158,798,739 157,539,243 157,469,243 156,077,161 155,056,338
Dec 31, diluted 160,940,348 160,990,852 161,269,612 161,270,407 161,464,443
*) Board proposal
0
5
10
15
20
0.0
0.5
1.0
1.5
2.0
2.5
3.0
Share trading volume and average price per month
Trading volume € Average Price
1/11 2/11 3/11 4/11 5/11 6/11 7/11 8/11 9/11 10/11 11/11 12/11
m €
Consolidated 2011 37

fiNaNcial stateMeNts
INCOME STATEMENT JAN 1–DEC 31, 2011
EUR 1,000 FAS 2011 FAS 2010
NET SALES (1) 128,694 117,891
Material and service -8,565 -8,765
Gross margin 120,128 109,126
Other operating income (2) 2,368 2,171
Sales and marketing (3,4) -55,466 -46,209
Research and development (3,4) -31,685 -28,828
Administration (3,4) -34,266 -8,214
Operating result 1,080 28,046
Financial income and expenses (6) -183 101
Profit (loss) before appropriations and taxes 897 28,147
Change in depreciation reserve -729
Income taxes (7) -6,390 -7,564
Result for the financial year -6,222 20,582
BALANCE SHEET DECEMBER 31, 2011
EUR 1,000 FAS 2011 FAS 2010
ASSETS
Non-current assets
Intangible assets (8) 30,986 8,648
Tangible assets (8) 4,173 3,789
Investments in associated companies (9) 42 42
Investments in group companies (9) 10,244 34,244
Total non-current assets 45,444 46,723
Current assets
Inventories (11) 350 394
Long-term receivables (12) 719 715
Short-term receivables (12) 34,772 35,664
Short-term investments (13) 14,674 16,817
Cash and bank accounts (14) 6,598 7,630
Total current assets 57,113 61,220
Total assets 102,558 107,943
SHAREHOLDERS’ EQUITY AND LIABILITIES
Shareholders’ equity (15,16)
Share capital 1,551 1,551
Share premium 165 165
Treasury shares -9,002 -7,493
Fair value reserve 101 27
Reserve for invested unrestricted equity 5,051 3,187
Retained earnings 46,157 34,828
Profit for the financial year -6,222 20,582
Total shareholders' equity 37,801 52,847
Appropriations
Depreciation reserve 729
Liabilities
Deferred tax liabilities (18) 36 9
Long-term liabilities (18) 6,641 6,592
Short-term liabilities (18) 57,351 48,494
Total liabilities 64,028 55,096
Total shareholders’ equity and liabilities 102,558 107,943
38 F-Secure

fiNaNcial stateMeNts
CASH FLOW STATEMENT DECEMBER 31, 2011
EUR 1,000 FAS 2011 FAS 2010
CASH FLOW FROM OPERATIONS
Result for the financial year -6,222 20,582
Adjustments 37,908 11,270
Cash flow from operations before change in working capital 31,686 31,852
Change in net working capital
Current receivables, increase (-), decrease (+) 1,173 -6,710
Inventories, increase (-), decrease (+) 43 29
Non-interest bearing debt, increase (+), decrease (-) 5,642 3,233
Cash flow from operations before financial items and taxes 38,545 28,404
Interest expenses paid -2 -1
Interest income received 94 21
Other financial income and expenses 61 -342
Income taxes paid -6,610 -7,944
Cash flow from operations 32,088 20,137
CASH FLOW FROM INVESTMENTS
Investments in intangible and tangible assets -26,505 -8,106
Investments in subsidiary shares -3
Other investments 6 2
Proceeds from sale of intangible and tangible assets 1 2
Dividends received 38 12
Cash flow from investments -26,460 -8,093
CASH FLOW FROM FINANCING ACTIVITIES
Increase in share capital 1,864 108
Treasury shares -1,509 -4,004
Dividends paid -9,254 -9,310
Cash flow from financing activities -8,899 -13,207
Change in cash -3,270 -1,163
Cash and bank at the beginning of the period 24,295 25,415
Cash and bank at period end 21,025 24,253
Change in net fair value of current available-for-sale assets 101 42
Cash and bank at period end 21,126 24,295
Corporation 2011 39
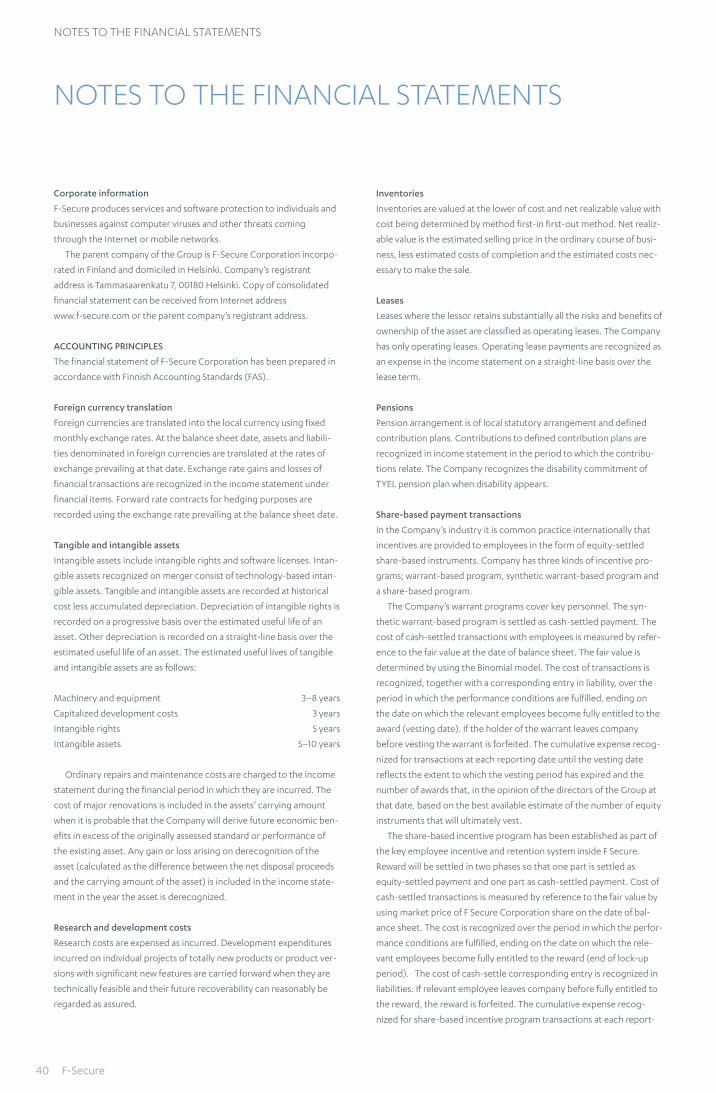
Notes to tHe fiNaNcial stateMeNts
Notes to tHe fiNaNcial stateMeNts
Corporate information
F-Secure produces services and software protection to individuals and
businesses against computer viruses and other threats coming
through the Internet or mobile networks.
The parent company of the Group is F-Secure Corporation incorpo-
rated in Finland and domiciled in Helsinki. Company’s registrant
address is Tammasaarenkatu 7, 00180 Helsinki. Copy of consolidated
financial statement can be received from Internet address
www.f-secure.com or the parent company’s registrant address.
ACCOUNTING PRINCIPLES
The financial statement of F-Secure Corporation has been prepared in
accordance with Finnish Accounting Standards (FAS).
Foreign currency translation
Foreign currencies are translated into the local currency using fixed
monthly exchange rates. At the balance sheet date, assets and liabili-
ties denominated in foreign currencies are translated at the rates of
exchange prevailing at that date. Exchange rate gains and losses of
financial transactions are recognized in the income statement under
financial items. Forward rate contracts for hedging purposes are
recorded using the exchange rate prevailing at the balance sheet date.
Tangible and intangible assets
Intangible assets include intangible rights and software licenses. Intan-
gible assets recognized on merger consist of technology-based intan-
gible assets. Tangible and intangible assets are recorded at historical
cost less accumulated depreciation. Depreciation of intangible rights is
recorded on a progressive basis over the estimated useful life of an
asset. Other depreciation is recorded on a straight-line basis over the
estimated useful life of an asset. The estimated useful lives of tangible
and intangible assets are as follows:
Machinery and equipment 3–8 years
Capitalized development costs 3 years
Intangible rights 5 years
Intangible assets 5–10 years
Ordinary repairs and maintenance costs are charged to the income
statement during the financial period in which they are incurred. The
cost of major renovations is included in the assets’ carrying amount
when it is probable that the Company will derive future economic ben-
efits in excess of the originally assessed standard or performance of
the existing asset. Any gain or loss arising on derecognition of the
asset (calculated as the difference between the net disposal proceeds
and the carrying amount of the asset) is included in the income state-
ment in the year the asset is derecognized.
Research and development costs
Research costs are expensed as incurred. Development expenditures
incurred on individual projects of totally new products or product ver-
sions with significant new features are carried forward when they are
technically feasible and their future recoverability can reasonably be
regarded as assured.
Inventories
Inventories are valued at the lower of cost and net realizable value with
cost being determined by method first-in first-out method. Net realiz-
able value is the estimated selling price in the ordinary course of busi-
ness, less estimated costs of completion and the estimated costs nec-
essary to make the sale.
Leases
Leases where the lessor retains substantially all the risks and benefits of
ownership of the asset are classified as operating leases. The Company
has only operating leases. Operating lease payments are recognized as
an expense in the income statement on a straight-line basis over the
lease term.
Pensions
Pension arrangement is of local statutory arrangement and defined
contribution plans. Contributions to defined contribution plans are
recognized in income statement in the period to which the contribu-
tions relate. The Company recognizes the disability commitment of
TYEL pension plan when disability appears.
Share-based payment transactions
In the Company’s industry it is common practice internationally that
incentives are provided to employees in the form of equity-settled
share-based instruments. Company has three kinds of incentive pro-
grams; warrant-based program, synthetic warrant-based program and
a share-based program.
The Company’s warrant programs cover key personnel. The syn-
thetic warrant-based program is settled as cash-settled payment. The
cost of cash-settled transactions with employees is measured by refer-
ence to the fair value at the date of balance sheet. The fair value is
determined by using the Binomial model. The cost of transactions is
recognized, together with a corresponding entry in liability, over the
period in which the performance conditions are fulfilled, ending on
the date on which the relevant employees become fully entitled to the
award (vesting date). If the holder of the warrant leaves company
before vesting the warrant is forfeited. The cumulative expense recog-
nized for transactions at each reporting date until the vesting date
reflects the extent to which the vesting period has expired and the
number of awards that, in the opinion of the directors of the Group at
that date, based on the best available estimate of the number of equity
instruments that will ultimately vest.
The share-based incentive program has been established as part of
the key employee incentive and retention system inside F Secure.
Reward will be settled in two phases so that one part is settled as
equity-settled payment and one part as cash-settled payment. Cost of
cash-settled transactions is measured by reference to the fair value by
using market price of F Secure Corporation share on the date of bal-
ance sheet. The cost is recognized over the period in which the perfor-
mance conditions are fulfilled, ending on the date on which the rele-
vant employees become fully entitled to the reward (end of lock-up
period). The cost of cash-settle corresponding entry is recognized in
liabilities. If relevant employee leaves company before fully entitled to
the reward, the reward is forfeited. The cumulative expense recog-
nized for share-based incentive program transactions at each report-
40 F-Secure

Notes to tHe fiNaNcial stateMeNts
ing date is based on the best available estimate of the number of
equity instruments that will ultimately fulfill.
Income taxes
Direct current taxes are calculated in accordance with the local tax and
accounting rules. Deferred taxes, resulting from temporary differences
between the financial statement and the income tax basis of assets and
liabilities, use the enacted tax rates in effect in the years in which the
differences are expected to reverse. Deferred tax assets are recog-
nized to the extent that it is probable that future taxable profit will be
available.
Revenue recognition
Revenue is primarily derived from monthly software as a service sale,
software license agreement sales and operator’s system integration
and maintenance sales. License agreements consist of initial license
agreements and periodic maintenance agreements covering product
updates and customer support. The revenue recognition policy of
F-Secure Group recognizes the service revenue at the time of delivery,
the license agreement’s license fee revenues as the product is deliv-
ered, the license agreement’s maintenance revenues are recognized
over the maintenance period, and service based project deliveries are
recognized with the percentage of completion method, when the out-
come can be reliably estimated. The degree of completion is deter-
mined by relation of project costs incurred for work performed to date
bear the estimated total project costs. If total project costs will exceed
total project revenue, the expected loss is recognized as an expense
immediately. Indirect taxes, discounts granted and exchange rate dif-
ferences are excluded from net sales.
Other operating income
Other operating income includes profits from the sales of fixed assets,
rental revenue, and government grants received for research and
development projects.
Presentation of expenses
Classification of the functionally presented expenses has been made as
follows: various types of expenses in different geographical locations
have been allocated to the various functions by allocating directly to
allocable expenses to the respective function, and other operating
expenses have been allocated to functions on the basis of average
headcount in each location.
Treasury shares
Company has acquired treasury shares. The cost of acquisition is rec-
ognized as a deduction in the shareholders’ equity.
Financial assets
Short-term investments are measured at fair value. Short-term invest-
ments consist of interest-bearing debt securities and shares in mutual
funds invested in similar instruments. For assets that are actively traded
in organized financial markets, fair value is determined by reference to
Stock Exchange quoted market bid prices at the close of business on
the balance sheet date. Assets, the fair value of which cannot be meas-
ured reliably, are recognized at cost less impairment. The fair value
changes of short-term investments are recognized in shareholders’
equity under fair value reserve. When financial assets recognized as
available-for-sale are sold, the accumulated fair value changes are
released from equity and recognized in the income statement.
Cash and cash equivalents in the balance sheet comprise cash at
bank and in hand and other highly liquid short-term investments.
Corporation 2011 41
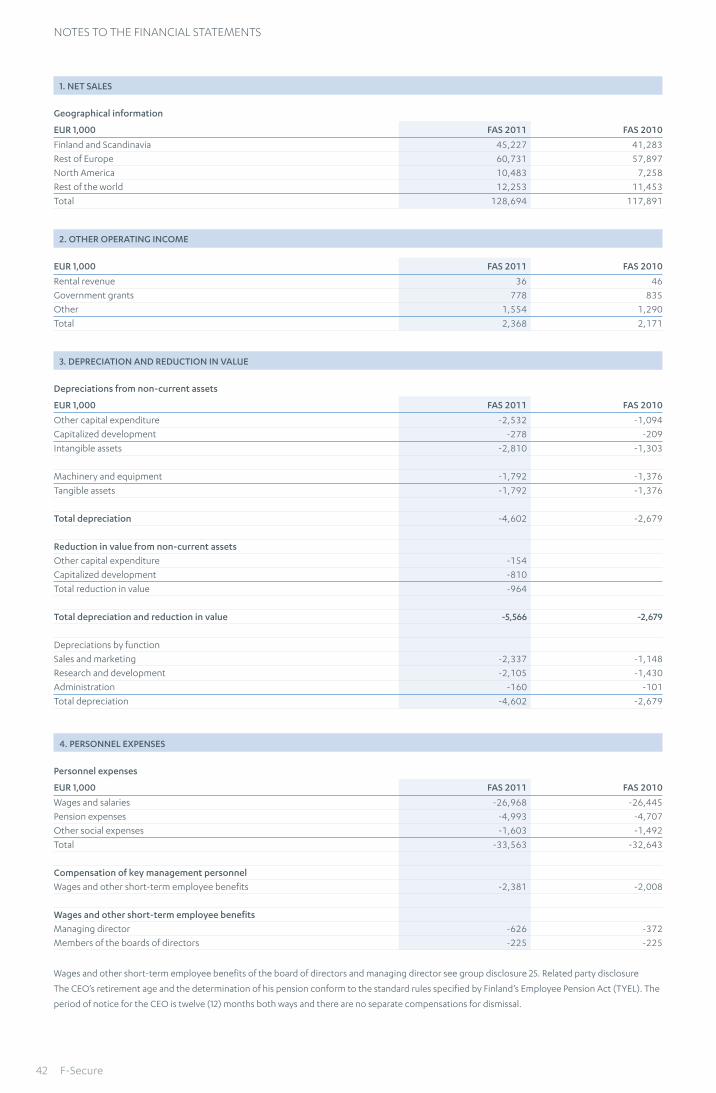
Notes to tHe fiNaNcial stateMeNts
1. NET SALES
Geographical information
EUR 1,000 FAS 2011 FAS 2010
Finland and Scandinavia 45,227 41,283
Rest of Europe 60,731 57,897
North America 10,483 7,258
Rest of the world 12,253 11,453
Total 128,694 117,891
2. OTHER OPERATING INCOME
EUR 1,000 FAS 2011 FAS 2010
Rental revenue 36 46
Government grants 778 835
Other 1,554 1,290
Total 2,368 2,171
3. DEPRECIATION AND REDUCTION IN VALUE
Depreciations from non-current assets
EUR 1,000 FAS 2011 FAS 2010
Other capital expenditure -2,532 -1,094
Capitalized development -278 -209
Intangible assets -2,810 -1,303
Machinery and equipment -1,792 -1,376
Tangible assets -1,792 -1,376
Total depreciation -4,602 -2,679
Reduction in value from non-current assets
Other capital expenditure -154
Capitalized development -810
Total reduction in value -964
Total depreciation and reduction in value -5,566 -2,679
Depreciations by function
Sales and marketing -2,337 -1,148
Research and development -2,105 -1,430
Administration -160 -101
Total depreciation -4,602 -2,679
4. PERSONNEL EXPENSES
Personnel expenses
EUR 1,000 FAS 2011 FAS 2010
Wages and salaries -26,968 -26,445
Pension expenses -4,993 -4,707
Other social expenses -1,603 -1,492
Total -33,563 -32,643
Compensation of key management personnel
Wages and other short-term employee benefits -2,381 -2,008
Wages and other short-term employee benefits
Managing director -626 -372
Members of the boards of directors -225 -225
Wages and other short-term employee benefits of the board of directors and managing director see group disclosure 25. Related party disclosure
The CEO’s retirement age and the determination of his pension conform to the standard rules specified by Finland’s Employee Pension Act (TYEL). The
period of notice for the CEO is twelve (12) months both ways and there are no separate compensations for dismissal.
42 F-Secure
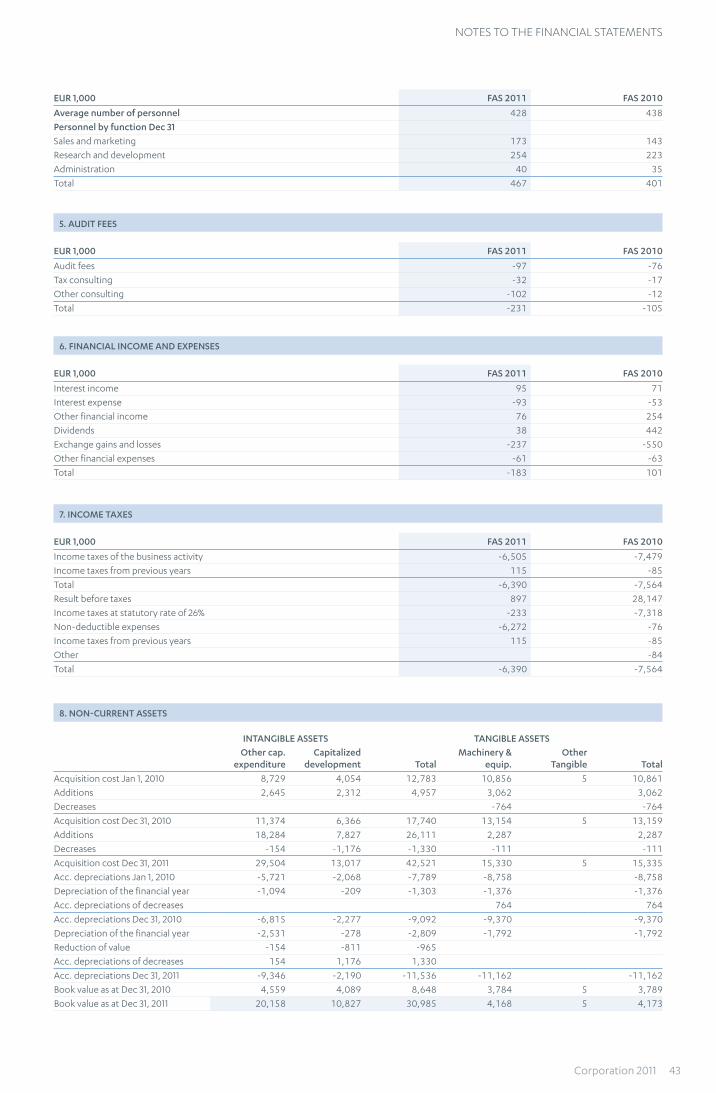
Notes to tHe fiNaNcial stateMeNts
EUR 1,000 FAS 2011 FAS 2010
Average number of personnel 428 438
Personnel by function Dec 31
Sales and marketing 173 143
Research and development 254 223
Administration 40 35
Total 467 401
5. AUDIT FEES
EUR 1,000 FAS 2011 FAS 2010
Audit fees -97 -76
Tax consulting -32 -17
Other consulting -102 -12
Total -231 -105
6. FINANCIAL INCOME AND EXPENSES
EUR 1,000 FAS 2011 FAS 2010
Interest income 95 71
Interest expense -93 -53
Other financial income 76 254
Dividends 38 442
Exchange gains and losses -237 -550
Other financial expenses -61 -63
Total -183 101
7. INCOME TAXES
EUR 1,000 FAS 2011 FAS 2010
Income taxes of the business activity -6,505 -7,479
Income taxes from previous years 115 -85
Total -6,390 -7,564
Result before taxes 897 28,147
Income taxes at statutory rate of 26% -233 -7,318
Non-deductible expenses -6,272 -76
Income taxes from previous years 115 -85
Other -84
Total -6,390 -7,564
8. NON-CURRENT ASSETS
INTANGIBLE ASSETS TANGIBLE ASSETSOther cap.
expenditureCapitalized
development TotalMachinery &
equip.Other
Tangible Total
Acquisition cost Jan 1, 2010 8,729 4,054 12,783 10,856 5 10,861
Additions 2,645 2,312 4,957 3,062 3,062
Decreases -764 -764
Acquisition cost Dec 31, 2010 11,374 6,366 17,740 13,154 5 13,159
Additions 18,284 7,827 26,111 2,287 2,287
Decreases -154 -1,176 -1,330 -111 -111
Acquisition cost Dec 31, 2011 29,504 13,017 42,521 15,330 5 15,335
Acc. depreciations Jan 1, 2010 -5,721 -2,068 -7,789 -8,758 -8,758
Depreciation of the financial year -1,094 -209 -1,303 -1,376 -1,376
Acc. depreciations of decreases 764 764
Acc. depreciations Dec 31, 2010 -6,815 -2,277 -9,092 -9,370 -9,370
Depreciation of the financial year -2,531 -278 -2,809 -1,792 -1,792
Reduction of value -154 -811 -965
Acc. depreciations of decreases 154 1,176 1,330
Acc. depreciations Dec 31, 2011 -9,346 -2,190 -11,536 -11,162 -11,162
Book value as at Dec 31, 2010 4,559 4,089 8,648 3,784 5 3,789
Book value as at Dec 31, 2011 20,158 10,827 30,985 4,168 5 4,173
Corporation 2011 43

Notes to tHe fiNaNcial stateMeNts
9. INVESTMENTS
EUR 1,000 Group comp. shares Associated comp. shares Total
Book value as at Jan 1 34,244 42 34,286
Disposals -24,000 -24,000
Book value as at Dec 31 10,244 42 10,286
Name Country of incorporation Share of ownership (%)
Parent F-Secure Corporation, Helsinki Finland
DF-Data Oy, Helsinki Finland 100
F-Secure Inc., San Jose United States 100
F-Secure (UK) Ltd, London Great-Britain 100
F-Secure KK, Tokyo Japan 100
F-Secure GmbH, München Germany 100
F-Secure eStore GmbH, München Germany 100
F-Secure SARL, Maisons-Laffitte France 98
F-Secure France SARL, Maisons-Laffitte France 100
F-Secure BVBA, Heverlee-Leuven Belgium 100
F-Secure AB, Stockholm Sweden 100
F-Secure Srl, Milano Italy 100
F-Secure SP z.o.o., Warsaw Poland 100
F-Secure Corporation (M) Sdn Bhd, Kuala Lumpur Malaysia 100
F-Secure Pvt Ltd, Hyderabad India 100
F-Secure Pte Ltd, Singapore Singapore 100
F-Secure B.V., Utrecht The Netherlands 100
F-Secure Limited, Hong Kong Hong Kong 100
F-Secure Pty Limited, Sydney Australia 100
F-Secure Iberia SL, Barcelona Spain 100
Associated companies Share of ownership (%)
Vineyard International Ltd, Helsinki Finland 34,8
44 F-Secure

Notes to tHe fiNaNcial stateMeNts
10. DEFERRED TAX
EUR 1,000 FAS 2011 FAS 2010
Deferred tax liability
Tax charged to shareholders' equity
Change in fair value, available-for-sale 36 9
Total 36 9
11. INVENTORIES
EUR 1,000 FAS 2011 FAS 2010
Other inventories 350 394
12. RECEIVABLES
EUR 1,000 FAS 2011 FAS 2010
Non-current
Receivables from group companies
Other receivables 719 715
Total 719 715
Current receivables
Trade receivables 23,477 19,081
Loan receivables 16 10
Other receivables 41 23
Prepaid expenses and accrued income 4,186 3,342
Total 27,720 22,457
Receivables from group companies
Trade receivables 7,047 7,243
Other receivables 5 5,964
Total 7,052 13,207
Current receivables total 34,772 35,664
Material items included in prepaid expenses and accrued income
Prepaid expenses 1,698 908
Prepaid expenses, royalty 1,914 2,081
Accrued interest 1 1
Accrued tax 573 353
Total 4,186 3,342
13. SHORT-TERM INVESTMENTS
Short-term investments consist of interest-bearing debt securities and shares in funds invested in similar instruments. For assets that are actively
traded in organized financial markets, fair value is determined by reference to Stock Exchange quoted market bid prices at the close of business on the
balance sheet date. Assets, which fair value cannot be measured reliably, are recognized at cost less impairment. The fair value changes of short-term
investments are recognized in shareholders’ equity under fair value reserve.
EUR 1,000 FAS 2011 FAS 2010
Fair value as at Jan 1 16,817 17,550
Additions/deductions, net -2,280 -769
Change in fair value 137 36
Fair value as at Dec 31 14,674 16,817
Shares - unlisted 146 152
Maturity date less than 3 months 14,528 16,665
Fair value as at Dec 31 14,674 16,817
Book value as at Dec 31 14,537 16,781
Corporation 2011 45

Notes to tHe fiNaNcial stateMeNts
14. CASH AND SHORT-TERM DEPOSITS
For the purposes of the cash flow statement, cash and cash equivalents comprise the following at December 31:
EUR 1,000 FAS 2011 FAS 2010
Cash at bank and in hand 6,598 7 630
Available-for-sale 14,528 16 665
Total 21,126 24 295
15. STATEMENT OF CHANGES IN SHAREHOLDERS’ EQUITY
Parent Company, FAS Share capital
Share premium
fundTreasury
sharesFair value
reserveUnrestricted
equity reserveRetained earnings
Total equity
Equity Dec 31, 2009 1,551 165 -3,488 -4 3,079 44,239 45,540
Available-for-sale financial assets, net 31 31
Result of the financial year 20,582 20,582
Dividend -9,310 -9,310
Acquisition of treasury shares -4,004 -4,004
Exercise of options 108 108
Other change -100 -100
Equity Dec 31, 2010 1,551 165 -7,493 27 3,187 55,411 52,847
Available-for-sale financial assets, net 75 75
Result of the financial year -6,222 -6,222
Dividend -9,254 -9,254
Acquisition of treasury shares -1,509 -1,509
Exercise of options 1,864 1,864
Equity Dec 31, 2011 1,551 165 -9,002 102 5,051 39,935 37,801
16. SHAREHOLDERS’ EQUITY
During the year, 1,259,496 ordinary shares were subscibed with warrants attached to F-Secure option programs.
The Company’s share capital amounted to 1,551,311 euro and the number of shares was 158,798,739 at the end of the year 2011. See group disclosure
17. Shareholders’ Equity
Treasury shares
See group disclosure 17. Shareholders’ Equity.
Distributable shareholders’ equity on December 31, 2011
EUR 1,000
Unrestricted equity reserve 5,051
Retained earnings 37,155
Result of the financial year -6,222
Distributable shareholders' equity on December 31, 2011 35,984
17. SHARE-BASED PAYMENT TRANSACTIONS
See group disclosure 18. Share-based payment transactions.
18. LIABILITIES
EUR 1,000 FAS 2011 FAS 2010
Non-current liabilities
Deferred revenues 6,641 6,592
Deferred tax liabilites 36 9
Total other non-current liabilities 6,676 6,601
Current liabilities
Deferred revenues 23,942 23,549
Trade payables 6,524 3,268
Other liabilities 779 1,002
Accrued expenses 11,987 10,026
Total 43,233 37,845
46 F-Secure
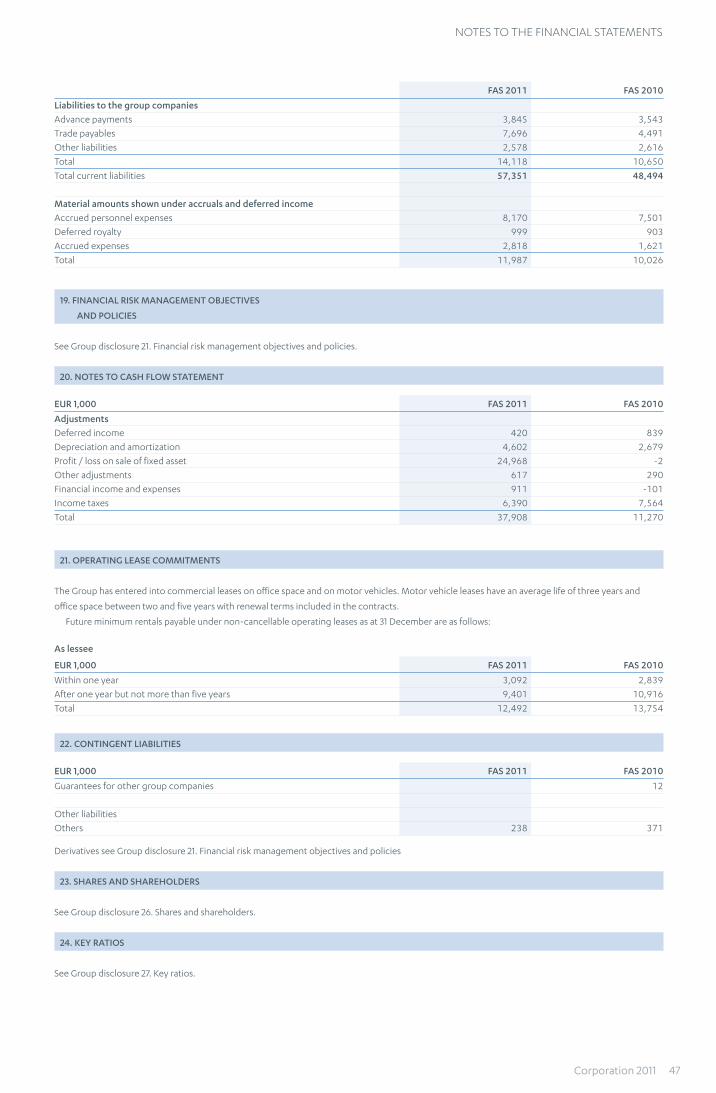
Notes to tHe fiNaNcial stateMeNts
FAS 2011 FAS 2010
Liabilities to the group companies
Advance payments 3,845 3,543
Trade payables 7,696 4,491
Other liabilities 2,578 2,616
Total 14,118 10,650
Total current liabilities 57,351 48,494
Material amounts shown under accruals and deferred income
Accrued personnel expenses 8,170 7,501
Deferred royalty 999 903
Accrued expenses 2,818 1,621
Total 11,987 10,026
19. FINANCIAL RISK MANAGEMENT OBJECTIVES
AND POLICIES
See Group disclosure 21. Financial risk management objectives and policies.
20. NOTES TO CASH FLOW STATEMENT
EUR 1,000 FAS 2011 FAS 2010
Adjustments
Deferred income 420 839
Depreciation and amortization 4,602 2,679
Profit / loss on sale of fixed asset 24,968 -2
Other adjustments 617 290
Financial income and expenses 911 -101
Income taxes 6,390 7,564
Total 37,908 11,270
21. OPERATING LEASE COMMITMENTS
The Group has entered into commercial leases on office space and on motor vehicles. Motor vehicle leases have an average life of three years and
office space between two and five years with renewal terms included in the contracts.
Future minimum rentals payable under non-cancellable operating leases as at 31 December are as follows:
As lessee
EUR 1,000 FAS 2011 FAS 2010
Within one year 3,092 2,839
After one year but not more than five years 9,401 10,916
Total 12,492 13,754
22. CONTINGENT LIABILITIES
EUR 1,000 FAS 2011 FAS 2010
Guarantees for other group companies 12
Other liabilities
Others 238 371
Derivatives see Group disclosure 21. Financial risk management objectives and policies
23. SHARES AND SHAREHOLDERS
See Group disclosure 26. Shares and shareholders.
24. KEY RATIOS
See Group disclosure 27. Key ratios.
Corporation 2011 47
auditor’s report
auditor’s report
To the Annual General Meeting of F-Secure Corporation
We have audited the accounting records, the financial statements, the
report of the Board of Directors, and the administration of F-Secure
Corporation for the financial period 1.1. - 31.12.2011. The financial state-
ments comprise the consolidated statement of financial position,
statement of comprehensive income, statement of changes in equity
and statement of cash flows, and notes to the consolidated financial
statements, as well as the parent company’s balance sheet, income
statement, cash flow statement and notes to the financial statements.
Responsibility of the Board of Directors and the Managing Director
The Board of Directors and the Managing Director are responsible for
the preparation of consolidated financial statements that give a true
and fair view in accordance with International Financial Reporting
Standards (IFRS) as adopted by the EU, as well as for the preparation of
financial statements and the report of the Board of Directors that give
a true and fair view in accordance with the laws and regulations gov-
erning the preparation of the financial statements and the report of
the Board of Directors in Finland. The Board of Directors is responsible
for the appropriate arrangement of the control of the company’s
accounts and finances, and the Managing Director shall see to it that
the accounts of the company are in compliance with the law and that
its financial affairs have been arranged in a reliable manner.
Auditor’s Responsibility
Our responsibility is to express an opinion on the financial state-
ments, on the consolidated financial statements and on the report of
the Board of Directors based on our audit. The Auditing Act requires
that we comply with the requirements of professional ethics. We con-
ducted our audit in accordance with good auditing practice in Finland.
Good auditing practice requires that we plan and perform the audit to
obtain reasonable assurance about whether the financial statements
and the report of the Board of Directors are free from material mis-
statement, and whether the members of the Board of Directors of the
parent company or the Managing Director are guilty of an act or negli-
gence which may result in liability in damages towards the company or
have violated the Limited Liability Companies Act or the articles of
association of the company.
An audit involves performing procedures to obtain audit evidence
about the amounts and disclosures in the financial statements and the
report of the Board of Directors. The procedures selected depend on
the auditor’s judgment, including the assessment of the risks of mate-
rial misstatement, whether due to fraud or error. In making those risk
assessments, the auditor considers internal control relevant to the
entity’s preparation of financial statements and report of the Board of
Directors that give a true and fair view in order to design audit proce-
dures that are appropriate in the circumstances, but not for the pur-
pose of expressing an opinion on the effectiveness of the company’s
internal control. An audit also includes evaluating the appropriateness
of accounting policies used and the reasonableness of accounting esti-
mates made by management, as well as evaluating the overall presen-
tation of the financial statements and the report of the Board of Direc-
tors.
We believe that the audit evidence we have obtained is sufficient
and appropriate to provide a basis for our audit opinion.
Opinion on the consolidated financial statements
In our opinion, the consolidated financial statements give a true and
fair view of the financial position, financial performance, and cash
flows of the group in accordance with International Financial Reporting
Standards (IFRS) as adopted by the EU.
Opinion on the company’s financial statements and the report of the
Board of Directors
In our opinion, the financial statements and the report of the Board of
Directors give a true and fair view of both the consolidated and the
parent company’s financial performance and financial position in
accordance with the laws and regulations governing the preparation of
the financial statements and the report of the Board of Directors in
Finland. The information in the report of the Board of Directors is con-
sistent with the information in the financial statements.
Helsinki, February 16, 2012
Ernst & Young Oy
Authorized Public Accountant Firm
Erkka Talvinko
Authorized Public Accountant
48 F-Secure
corporate GoVerNaNce stateMeNt 2011
corporate GoVerNaNce stateMeNt 2011
General principles
F-Secure Corporation applies principles of corporate governance and
follows high ethical standards, complying with the Finnish Companies
Act, Securities Market Act, the rules and regulation of NASDAQ OMX
Helsinki Ltd, and other regulations on the administration of public
companies issued by the authorities.
The company complies with the Corporate Governance Code for
listed companies, updated in June 2011, as explained below and on the
web pages of F-Secure Corporation. The code has been published by
the Securities Market Association, a body established by the Confeder-
ation of Finnish Industries EK, the Central Chamber of Commerce, and
NASDAQ OMX Helsinki Ltd. The code is publicly available at
www.cgfinland.com.
The key elements of the Corporate Governance practices of
F-Secure Corporation are described briefly below. In addition to this,
the most essential tasks and responsibilities of the Board of Directors,
Board Committees and the other main governing bodies are
described. This statement also includes the description of the main
features of internal control and risk management pertaining to the
financial reporting process. More information on governance prac-
tices of the company is available on F-Secure Corporation’s website.
Tasks and responsibilities of governing bodies
The tasks of the Board of Directors are governed by the Finnish Com-
panies Act, the Articles of Association of the Company, decisions of
the General Meetings of Shareholders, legislation regarding account-
ing rules and IFRS as well as the Securities Market, and the rules of the
NASDAQ OMX Helsinki Ltd., and other regulations.
Annual General Meeting of Shareholders (AGM)
The highest governing body of the corporation is the General Meeting
of Shareholders. The AGM’s tasks are defined in detail by the Finnish
Companies Act, Articles of Association of F-Secure Corporation and
other regulations. The AGM shall decide on the number of members of
the Board of Directors, confirm remunerations to the Board members
and auditors, appoint Board members, approve financial statements,
determines dividends and select auditor and other duties defined by
the Articles of Association and the Finnish Companies Act. The AGM
shall be held after the end of the financial year within a period deter-
mined by the Board of Directors and as defined by the Companies Act.
F-Secure Corporation has only one class of shares and thus all shares
have equal voting power at the General Meetings of Shareholders.
In 2011, the Annual General Meeting was held in Helsinki, HTC Ruo-
holahti on March 30, 2011. The decisions made by the AGM 2011 are
presented in detail in the Board of Directors’ report for 2011.
Board of Directors
The main tasks of the Board of Directors
The objective of the Board of Directors is to direct the company with
the aim of achieving the best possible return on invested capital for
shareholders in the long term. The Board of Directors represents all
shareholders. The Board of Directors shall always work to the best
advantage of the company and all of its shareholders.
The Board of Directors is responsible for making sure that supervi-
sion of the company’s accounting and financial management is duly
organized. The meetings of the Board shall regularly discuss reports
presented by the CEO of the Company on the financial status and
operations of the company. Furthermore, it is the duty of the Board to
prepare matters to be handled by the shareholders’ meeting, to decide
on the convening of the shareholders’ meeting and to make sure that
the decisions made at the shareholders’ meeting are executed.
Any matters that are significant or far-reaching from the company’s
point of view shall be dealt with by the Board. These include strategic
outlines, approval of budgets and operating plans and supervision of
how these are put into effect, acquisitions and corporate structure,
any major investments with regard to the operation of the company,
organization of the supervision of accounting and financial manage-
ment, internal monitoring systems and risk management as well as
personnel policies and reward systems.
The duties and responsibilities of the Board are more thoroughly
defined in the Articles of Association of the company, the Finnish
Companies Act and other applicable laws and regulations. The Articles
of Association and the charter of the Board, including a more com-
plete list of its main duties and tasks and its committees, are presented
in detail on the company’s Investor web pages.
According to the Articles of Association, the Board shall have a min-
imum of three and maximum of seven ordinary members, whose term
ends at the end of the next AGM following the election of members.
The Annual General Meeting of Shareholders shall decide the number
of Board members and elect the Board members. The Board shall elect
the Chairman of the Board from among its members. The Board shall
also elect a secretary, who may be a non-member of the Board. The
term of each Board member is one year. The majority of the Board
members shall be independent of the company. More detailed infor-
mation about e.g. other terms of Board membership can be found in
the Articles of Association.
The Board of Directors shall convene at least five times during its
term. The Board shall conduct an annual self-assessment of its opera-
tions
Board of Directors in 2011
According to the decision of the Annual General Meeting 2011, the
Board has six (6) members. The members of the Board are Risto Siilas-
maa (Chairman), Jussi Arovaara, Sari Baldauf, Pertti Ervi, Juho Malm-
berg and Anu Nissinen. All members were re-elected. Risto Siilasmaa
continued as a Chairman of the Board.
The majority of F-Secure Corporation’s Board of Directors, Pertti
Ervi, Sari Baldauf, Juho Malmberg, Anu Nissinen and Jussi Arovaara,
have no dependence neither on the company nor the significant
shareholders. The Chairman of the Board, Mr. Siilasmaa, is a major
shareholder of the company.
During 2011, the Board held 11 meetings and the attendance was
close to 100%. The members of the Board of Directors are presented
later in this report.
During 2011, the Board of Directors focused, besides their ongoing
duties, especially on approval of the Company’s renewed growth strat-
egy and recruiting process for new CEO. According to the strategy,
F-Secure’s first priority is to drive growth and market expansion by
continuing to create new innovative offerings to augment traditional
security services, especially in the content cloud space. Operators,
including Internet service providers, mobile operators and cable oper-
Corporation Governance Statement 2011 49
corporate GoVerNaNce stateMeNt 2011
ators, are the main channel for F-Secure services. The Company’s strat-
egy is described in more detail in the Board of Director’s report for
2011.
Another focus area of the Board for 2011 was the recruiting process
for a new CEO. The Board commenced an extensive recruiting process
already in the summer, immediately after being informed about the
former CEO Kimmo Alkio’s resignation as of October 30, 2011. The
Board also established a dedicated team in order to drive the process.
The team included Risto Siilasmaa, Sari Baldauf and Pertti Ervi. The
Board nominated CTO Pirkka Palomäki as interim CEO as of November
1, 2011. After the extensive recruiting process, the Board appointed
Christian Fredrikson as President and CEO as of January 16, 2012. In the
process, the Board valued strong experience in the operator business
and leadership experience in international business.
Other significant tasks and responsibilities of the Board comprised a
general overview of the company’s financials, budget approval, setting
the target levels for executive level, deciding on the incentive program
for the Executive team and deciding on the continuation of the share
buy-back program according to the authorization of the AGM 2011.
Board Committees
The Board has two committees; Audit Committee and Executive Com-
mittee (nomination and remuneration issues). The Chairman of the
Audit Committee is Pertti Ervi and the members are Jussi Arovaara and
Juho Malmberg. The Chairman of the Executive Committee is Sari Bal-
dauf and the members are Risto Siilasmaa and Anu Nissinen.
The charters of the both Committees are available on the Compa-
ny’s web pages under Investors, Governance.
Audit Committee
The Audit Committee prepares, instructs and evaluates the Corpora-
tion’s risk management, internal supervision systems, IT strategy and
practices, financial reporting, external auditing of the accounts and
internal control. During 2011, the Audit Committee held 5 meetings
and the attendance was close to 100%.
In 2011, the Audit Committee focused mainly on general supervision
of company’s financials. The Audit Committee discussed i.e. project
revenue models, handled the IT Review and IT Hosting services and
investments of the Company’s liquid funds. Furthermore, the Commit-
tee assessed efficiency of internal control systems and risk manage-
ment process and practices including financial and juridical risks. The
Committee also reviewed the interim reports and all other relevant
stock exchange releases before their publication.
Executive Committee
The Executive Committee prepares material and provides instructions
on issues related to the composition and compensation of the Board of
Directors and remuneration of the other members of the executive
management. The Executive Committee held 7 meetings in 2011 and
the attendance was close to 100%.
In 2011, the Executive Committee focused especially on the recruit-
ing process for a new CEO. Other tasks comprised e.g. long and short-
term incentive programs for the top management and other key per-
sonnel, discussion on employee satisfaction surveys, and follow-up of
improvement actions. The Committee also prepared proposals for the
Board composition and remuneration for the Annual General Meeting
of Shareholders.
President and CEO
The President and CEO is in charge of the day-to-day management of
the company. The CEO’s duties include managing the business accord-
ing to the instructions issued by the Board of Directors, presenting the
matters to be dealt with in the Board of Directors’ meeting, imple-
menting the matters resolved by the Board of Directors and other
issues determined in the Companies Act. The Board of Directors shall
appoint the CEO and decide upon his/her remuneration and other
benefits.
The President and CEO of the Company was Kimmo Alkio until
October 31, 2011. Interim CEO was Pirkka Palomäki during November
1-January 15, 2012. Christian Fredrikson started as President and CEO
as of January 16, 2012.
Executive Team
The Executive Team supports the CEO in daily operative management
and development of the Company. The CEO appoints the Executive
Team members and decides upon the terms and conditions of their
employment. The Board of Directors approves the compensation for
the Executive Team. The bonuses and granting of stock options are
based on the performance of the Company and the individual. The
Executive Team assembles regularly once a month and separately as
needed.
The Executive Team currently consists of the following persons:
Christian Fredrikson (President and CEO), Ari Alakiuttu (Vice Presi-
dent, Human Resources), Tuomas Hyyryläinen (Vice President, Strat-
egy and M&A), Samu Konttinen (Vice President, Sales and Geographi-
cal Operations), Maria Nordgren (Vice President, Channels), Pirkka
Palomäki (Chief Technology Officer), Kari Penttilä (Vice President,
R&D), Patrik Sallner (Vice President, Professional Services) and Taneli
Virtanen (Chief Financial Officer).
Remuneration
The remuneration paid to the Board of Directors and the Executive
Team as well as their holdings of F-Secure shares and options are
described in notes 25 and 26 to the financial statements. The general
principles of remuneration of the President and CEO are described in
note 25 to the financial statements. More details on the remuneration
and option programs are also available in the Remuneration Statement
published on the Company’s investor web pages under Corporate
Governance.
Auditors
The auditor is elected by the Annual General Meeting for one year’s
term of service. The auditor is responsible for auditing the consoli-
dated and parent company’s financial statements and accounting. The
auditor will report to the Board of Directors at least once a year.
For 2011, F-Secure Corporation’s auditor was Ernst & Young Oy, an
auditing firm of Authorized Public Accountant authorized by the Cen-
tral Chamber of Commerce. APA Erkka Talvinko acts as responsible
partner for the direction and coordination of the audit work. During
2011, the Company paid a total of EUR 130 810 for auditing services
(2010: EUR 94 281) and EUR 133 956 (2010: EUR 32 927) for other ser-
vices. Ernst & Young has been F-Secure Corporation’s auditor since
1999.
Description of the main features of internal control and risk
management pertaining to the financial reporting process
Internal Control
The Executive Team of F-Secure, Financial Management and Risk Man-
agement are responsible for internal control and risk management.
Regular audits will be performed in the business units as well as in the
subsidiaries. The purpose is to ensure compliance with consistent
administration, accounting practices and information security in the
company.
Internal control covers all the guidelines, policies, processes and
organizational structure that help ensure that the business conduct is
50 F-Secure
corporate GoVerNaNce stateMeNt 2011
in compliance with all applicable regulations, and that all financial
reporting is correct. The guidelines and instructions are made to
ensure that accounting and financial information is a true and accurate
reflection of the activities and financial situation of the company.
Actual performance against sales and cost targets and comparison
period is constantly followed up by operative reporting systems on a
daily, weekly or monthly basis.
The company constantly monitors its cost efficiency and profitabil-
ity as well as incoming and outgoing payment transactions. If any
inconsistencies appear, the issues are handled without delay. The com-
pany’s controlling function works in close cooperation with CFO and
business units, providing relevant data for business planning purposes
and sales estimates. Estimates and revenue recognition are constantly
monitored with follow-up methods. The Company’s controlling team
is responsible for consistency and reliability of internal control meth-
ods. The controlling team meets business management and key per-
sonnel in order to assess the reliability of estimates on continuous
basis.
During 2011, the controlling team focused especially on the financial
management of Professional Services function that has been growing
strongly during the year. Another focus area was financial support for
the storage business, because in the storage business, the manage-
ment of large project deliveries, large proportion of hosting services
and investments play a significant role. Furthermore, other important
focus areas were financial monitoring of market expansion to Latin
America as well as capitalization and write-off occurrence of R&D pro-
jects.
Internal audit
The principles of internal audit are embedded in written guidelines and
policies concerning accounting, risk management and controlling, and
operations at all units in F-Secure are coordinated by the company’s
Finance department. The company guidelines cover accounting,
reporting, documentation, authorization as well as other relevant
issues. F-Secure has no separate internal audit function, and therefore
this has been taken into account when defining the scope of external
audit. The financial management team meets with the auditors several
times a year.
Risk Management
The goal of risk management is to identify risks that may hinder the
company from achieving its business objectives. A risk can be defined
as any uncertainty that affects F-Secure’s business objectives and the
ability to reach its results.
The risks can be defined into strategic, operative and financial risks.
Strategic risks comprise e.g. risks related to changes in industry, mar-
kets or competition, intellectual capital, operator or subcontracting
agreements, or acquisitions. Operative risks include risks related to
production, processes and quality. Financial risks include all risks con-
cerning financial activities, such as currency risks.
According to the risk management policy the Company may take
business risks that enable long-term increase in shareholder value,
competitiveness and Company’s profitable growth. The Company may
not take business risks that could compromise the Company’s business
or may lead to violation of regulation.
The responsibility for the company’s risk management lies with the
CEO and the Executive Team. The Board of Directors is responsible for
defining the company’s overall level of risk tolerance. The Board of
Directors and its committees approve and monitor the reporting pro-
cedures, as well as the adequacy, appropriateness and effectiveness of
the company’s business and administrative processes.
F-Secure’s risk management team is regularly monitoring and coor-
dinating the Company’s risk profile and activities to mitigate threats.
As part of the ongoing target planning and coordinating work twice a
year, the Company-wide risk portfolio and risk-related management
plans are updated. The most important risks detected in the risk man-
agement plans are reported to the Audit Committee once a year.
Weekly and monthly financial reporting that covers the entire com-
pany is used to monitor how well financial targets are being met. The
reports include actual figures, plans and up-to-date forecasts. The
company has sought to manage the risks relating to its business opera-
tions by developing its operating processes and control systems. The
Board has set certain appropriate authorization limits to the manage-
ment, and if these limits are exceeded, the decisions shall be handled
by the Board of Directors.
The invoicing is mainly in euros. In order to minimize the impact of
the fluctuation of the exchange rates, the goal is to hedge the esti-
mated cash flow of affected currencies. The Company does not pro-
vide financing outside the industry standard payment terms. The
investment policy of the company for cash reserves is conservative.
Cash and cash equivalent are mainly invested in short-term funds and
other low-risk investments.
During 2011, the most significant risks were related to, among other
things, the competitiveness of F-Secure’s product portfolio in the
changing market situation, the ability to protect the intellectual prop-
erty (IPR) in F-Secure’s solutions, risk exposure from increasing con-
tractual liability requirements, regional development in new growth
markets, sustainability of partner relationships, forming of the new
business areas, continuous change in the storage and content cloud
services markets, and potential security threats targeted to these ser-
vices.
Other governance issues
Management of insider issues
The company follows the insider regulations of the NASDAQ OMX Hel-
sinki Ltd. Insiders are divided into three categories: (1) permanent pub-
lic insiders including the members of the Board, the auditors, and the
Group’s executive team, (2) permanent company-specific non-public
insiders including persons who by virtue of their position or tasks learn
inside information on a regular basis, and (3) project-based insiders.
The trading of F-Secure shares and options of permanent public insid-
ers is public.
Permanent public insiders and permanent company-specific insid-
ers are not entitled to trade shares, options or other securities 21 days
prior to publication of interim financial statements or company
accounts. Up-to-date information on the holdings of F-Secure’s per-
manent insiders with a duty to declare can be found on the company’s
website.
Silent Period
The company observes a silent period of 21 days before each quarterly
report announcement. During the silent period, the company will
arrange neither meetings nor conference calls with the investor com-
munity.
Communications
The aim of the company’s communications is to support the correct
valuation of the company by providing the markets with sufficient
information on F-Secure’s financial position, strategy and objectives.
The Board of Directors has approved the disclosure policy that defines
the guidelines in communications to financial markets and investors
and other parties. The F-Secure web site contains all information made
public according to the disclosure requirements for listed companies.
The members of the Board of Directors and the Executive Team are
presented below.
Corporation Governance Statement 2011 51
board of directors
board of directors
Risto Siilasmaa
Chairman of the Board of Directors since 2006,
Board member since 1988
b. 1966, M.Sc. (Engineering)
• Main employment history: Founder of the F-Secure Corporation.
Worked as a President and CEO of the company until November
2006 and since then held the position of Chairman of the Board.
• Main Board Memberships and public duties currently undertaken:
Chairman of the Board of Directors of Elisa and Fruugo Ltd. Member
of the Board of Directors of Nokia Corporation, Blyk Ltd, Efecte
Corporation, Mendor Oy and Federation of Finnish Technology
Industries
Holdings: number of shares 63.086.166, holding 39.73%
Jussi Arovaara
Board member since 2010
b. 1966
• Main employment history: Currently works as a Vice President,
Global Sales Operations in Corel Corporation (UK) and has served in
several international sales, marketing and business development
positions in Corel Corporation in the UK, Canada and Finland since
1996. In his earlier career before 1996 worked in several sales and
marketing positions in computer wholesale.
Holdings: number of shares 9.571
Sari Baldauf
Board member since 2005, Chairman of the Executive Committee
b. 1955, M.Sc. (Business Administration)
• Main employment history: Worked for more than twenty years at
Nokia Corporation. During the years served as Executive Vice Presi-
dent and General Manager of Nokia Networks 1998–2005 and
a member of the Group Executive Board 1994–2005. Prior to 1998
served as Executive Vice President of Nokia APAC and President of
Nokia Telecommunications, Cellular Systems.
• Main Board Memberships and public duties currently undertaken:
Chairman of the Board of Directors of Fortum Corporation, Member
of the Board of Directors of Hewlett-Packard Company. Member of
Supervisory Board of Daimler AG. Chairman of the Board of Directors
of Savonlinna Opera Festival Ltd. Serves also on Boards of Finnish
Business and Policy Forum EVA and John Nurminen Foundation.
Holdings: number of shares 99.601
Pertti Ervi
Board member since 2003, Chairman of The Audit Committee
b. 1957, B.Sc. (Electronics)
• Main employment history: Currently works as an independent man-
agement consultant. Co-founder of the Computer 2000 Finland Oy
in which served as an MD until 1995. After that worked until 2000 as
a Co-President for Computer 2000 AG international headquarters in
Germany. Has worked with international managment level with
major IT vendors such as Cisco, IBM, Intel, HP and Microsoft.
• Main Board Memberships and public duties currently undertaken:
Chairman of the Board of Directors of Inventure Oy, Nevtor Oy and
Efecte Corporation. Chairman of the Board of Directors of Ixonos
Plc and Member of the Board of Directors of Teleste Corporation.
Holdings: number of shares 35.601
Juho Malmberg
Board member since 2008
b. 1962, M.Sc. (Computer Science)
• Main employment history: Member of Executive Board of KONE
Corporation since 2006.
• Currently, since November 2010, serves as an Executive Vice Presi-
dent, Customer Experience and prior to his current position worked
as an Executive Vice President for Global Development. Prior to
KONE Corporation worked in Accenture as Managing Director of
Accenture Finland 2002-2005, Director of Nordic Outsourcing Busi-
ness in 2005, Deputy Managing Director 1999–2002 and Technology
Director 1992– 1999.
• Main Board Memberships and public duties currently undertaken
Member of the Board in Kuntien Tiera Oy.
Holdings: number of shares 29.202
Anu Nissinen
Board member since 2010
b. 1963, M.Sc. (Economics)
• Main employment history: Currently serves as CEO of Sanoma
Media Finland Oy and as Member of Executive Board of Sanoma
Corporation. Prior to this position worked as President of Sanoma
Entertainment Oy. President of SW Television Oy / Welho, Market-
ing Director of Helsinki Televisio Oy and Marketing Manager of
Oy Sinebrychoff Ab.
• Main Board Memberships and public duties currently undertaken:
Member of the Board of Directors of DNA Ltd.
Holdings: number of shares 9.571
52 F-Secure
eXecutiVe coMMittee
eXecutiVe teaM
Christian Fredrikson
President and CEO (as of January 16, 2012)
b.1964, M.Sc. (Engineering)
• Main employment history: Joined F-Secure in 2012. Previously was
responsible for global sales for Network Systems business unit at
Nokia Siemens Networks. Furthermore, past positions include Head
of Asia Pacific Region at Nokia Siemens Networks and Head of OBS
Business Unit (Operations and Business Software), including R&D
and sales. Joined Nokia in 1994, and has held several executive level
positions in the company.
Holdings: -
Pirkka Palomäki
Chief Technology Officer
President and CEO (November 2011-January 2012)
b. 1970, M.Sc. (Engineering/Industrial Management)
• Main employment history: Joined F-Secure in 1997 and has previ-
ously headed Product Management, Marketing and R&D in
F-Secure. Prior to F-Secure worked for Telecom Finland (currently
TeliaSonera) in the field of marketing, business development and
development management for data communication services.
• Main Board Memberships and public duties currently undertaken:
Member of the Board of Directors of Tivit Oy since 2010. Member
of VTT Technical Research Centre of Finland’s Advisory Board for
“ICT and Electronics” since 2010.
Holdings: number of shares 28.918, 2005 D options 60.000
Ari Alakiuttu
Vice President, Human Resources
b. 1967, M.Sc. (Engineering)
• Main employment history: Joined F-Secure in 2000 and served as
Vice President, Products & Services and held positions in Product
Management, Product Marketing and Channel Development until
2008. Prior joining F-Secure worked for Tellabs and for Nokia in the
fields of product management and product development.
Holdings: number of shares 16.954, 2005 D options 40.000
Tuomas Hyyryläinen
Vice President, Strategy and M&A
b. 1977, M.Sc. (Economics)
• Main employment history: Prior joining F-Secure 2010, headed
strategy for Nokia Devices at Nokia Corporation. In his earlier career,
worked for Nokia Mobile Phones as Head of Strategy Development
and has held various strategy and business development related
positions at Nokia Technology Platforms and VDSL Systems, a Finnish
technology start-up company.
Holdings: 2005 D options 100.000
Samu Konttinen
Vice President, Sales and Marketing
b. 1973
• Main employment history: joined the company in 2005 and has held
several sales and channel management roles, including a position of
Director of Regional Operations, covering F-Secure operations in
+20 countries in EMEA. Prior to his current position worked as a Vice
President of Mobile Business Unit. Before joining F-Secure he held
a Vice President position at Valimo Wireless Ltd 2001-2005.
• Main Board Memberships taken: Member of the Board in Ixonos Plc.
Holdings: number of shares 16.954,2005 D options 20.000
Maria Nordgren
Vice President, Channels
b. 1964, M.Sc.
• Main employment history: Executive Team since 2010. Joined
F-Secure in 2005 and has held several international sales and chan-
nel management roles, as well as well as the position of Vice Presi-
dent of the Corporate Business Unit. Prior joining F-Secure she has
held management positions in smaller Finnish software companies
such as DeskArtes, which she co-founded and later headed.
Holdings: number of shares 8.476
Kari Penttilä
Vice President, Research & Development
b. 1963
• Main employment history: Before joining F-Secure in 2010, worked
as a Development Director at FreeDropInnovations Oy. Earlier on in
his career he has been working in business, technology and product
development management positions in Internet and telecom
business areas for Iobox Oy, Oplayo Oy, Tecnomen Oy and Blyk Ltd.
Holdings: -
Antti Reijonen (until January 31, 2012)
Vice President, Portfolio & Solution Management
b. 1974, M.Sc. (Engineering), MBA
• Main employment history: Joined F-Secure in 2007 and before his
current position served as a VP, Strategy and VP, Consumer Business
and Marketing. Previously worked for Nokia Networks Services as
Director of Strategy and Portfolio in Consulting & Integration service
business.Prior to Nokia served as Engagement Manager with McKin-
sey & Company.
Holdings: number of shares 51.954
Patrik Sallner
Vice President, Professional Services
b. 1970, M.Sc. (Technology Management), MBA,
M.A. (International Studies)
• Main employment history: Joined F-Secure in January 2010 and was
prior to his current position Vice President, Mobile and Storage
business units. Before joining F-Secure, he built up and led the
Hosting Line of Business in Nokia Siemens Networks. Worked for
several years at Nokia in various management positions in mobile
phone product development and strategy and innovation, including
running a cross-functional Corporate Strategy unit called Insight &
Foresight. Previous experience in management consulting at
McKinsey & Company in France and Finland.
Holdings: -
Taneli Virtanen
Chief Financial Officer
b. 1965, M.Sc. (Economics)
• Main employment history: Prior to joining F Secure in 1999,
Mr. Virtanen worked for Santasalo-JOT Group as Group Controller.
Holdings: number of shares 31.954, 2005 D options 15.000
Kimmo Alkio was President and CEO of F-Secure until October 2011.
Corporation Governance Statement 2011 53
suMMary of stock eXcHaNGe releases
07.12.2011 Subscription of F-Secure shares with F-Secure 2005
warrants
01.12.2011 F-Secure’s financial calendar for 2012
15.11.2011 F-Secure appoints Christian Fredrikson as
President and CEO
26.10.2011 F-Secure Corporation - Interim Report
January 1 - September 30, 2011
19.10.2011 F-Secure Corporation to publish its interim report for
January-September 2011 on Wednesday 26 October
06.10.2011 Pirkka Palomäki appointed as acting CEO of F-Secure
Corporation
06.09.2011 Subscription of F-Secure shares with F-Secure 2005
warrants
27.07.2011 F-Secure Corporation - Interim Report
January 1 - June 30, 2011
26.07.2011 F-Secure CEO Kimmo Alkio has resigned to pursue a new
career opportunity
31.05.2011 F-Secure to continue buy-back of own shares
24.05.2011 Subscription of F-Secure shares with F-Secure 2005
warrants
27.04.2011 F-Secure Corporation - Interim Report,
January 1 - March 31, 2011
26.04.2011 Announcement pursuant to Securities Act Chapter 2,
Section 10
12.04.2011 Subscription of F-Secure shares with F-Secure 2005
warrants
30.03.2011 Resolutions of the Annual General Meeting
of F-Secure Corporation
08.03.2011 F-Secure’s Annual Report 2010 published
04.03.2011 F-Secure Corporation: Notice to the Annual General
Meeting
17.02.2011 2005 D-warrants of F-Secure Corporation listed on
March 1, 2011
16.02.2011 F-Secure Corporation’s financial statements 2010 and the
Board of Directors’ proposals to the Annual General
Meeting
04.02.2011 Correction: F-Secure Corporation interim report;
key ratios table
02.02.2011 F-Secure Corporation - Interim report
January 1 - December 31, 2010
The stock exchange releases are fully available on the company web-
site www.f-secure.com, About F-Secure, Investors. Some of the infor-
mation in the releases may be outdated.
54 F-Secure
iNforMatioN for sHareHolders
iNforMatioN for sHareHolders
The main goal of F-Secure’s investor communications is to make
available correct, up-to-date information about F-Secure and its oper-
ations – impartially and simultaneously to all interest groups. All pub-
lished investor information including annual reports, interim reports,
as well as stock exchange and press releases are available on the
Group’s website www.f-secure.com, About F-Secure, Investors. All
investor information is published in English and in Finnish. Subscrip-
tions for the emailing list for stock exchange releases can be made by
sending your contact details to [email protected].
F-Secure publishes a financial statement bulletin and three interim
reports during 2012, and arranges news conferences for media and
analysts at the time of publishing the quarterly reports. F-Secure
observes a three-week silent period before the publishing of each
quarterly report. During this time, F-Secure does neither arrange
meetings nor phone conferences with investors or analysts.
Annual General Meeting
The Annual General Meeting of F-Secure Corporation is scheduled to
be held on Tuesday, April 3, 2012 at 3.30 p.m. (Finnish time) at F-Secure
Corporation, Tammasaarenkatu 7, 00180 Helsinki.
More information on how to attend as well as the documents
for the meeting are available on the Group’s webpage
www.f-secure.com, About F-Secure, Investors.
Financial calendar for 2012
Financial Statements Bulletin February 1
Annual Report Latest week 11 in March
Q1 Interim Report April 27
Q2 Interim Report July 25
Q3 Interim Report October 25
F-Secure share facts
Listing since 1999 NASDAQ OMX
Helsinki Ltd.
Trading symbol FSC 1V
Number of shares 158.798.739
IR Contacts
For any inquiries on F-Secure as an investment target, please contact:
information for shareholders 55
EUROPECORPORATE HEADQUARTERS & FINLANDF-Secure CorporationTammasaarenkatu 7PL 2400181 HelsinkiFinlandTel. +358 9 2520 0700Fax +358 9 2520 5001E-mail: [email protected]
F-Secure CorporationElektroniikkatie 390570 OuluFinlandTel. +358 9 2520 0700Fax +358 8 551 3701
BELGIUMF-Secure BVBAInterleuvenlaan 62, Zone 2, Bus 563001 Heverlee - LeuvenBelgiumTel. +32 16 39 47 35Fax +32 16 39 47 37www.f-secure.be
DENMARKF-Secure CorporationInternational HouseCenter Boulevard 5DK-2300 København STel. +45 32 47 33 47Mobile +45 26 29 88 47www.f-secure.com
FRANCEF-Secure SARLF-Secure SDC SAS, Paris38/44 rue Jean Mermoz78600 Maisons LaffitteFranceTel. +33 820 000 759Fax +33 820 025 508E-mail: [email protected]
F-Secure SDC SAS, Bordeaux9 rue Raymond Manaud33520 Bruges-BordeauxFranceTel. +33 557 924 720
GERMANYF-Secure GmbHF-Secure eStore GmbHZielstattstraße 4481379 MünchenGermanyTel. +49 89 787 467 0Fax +49 89 787467 99E-mail: [email protected]
ITALYF-Secure SrlVia Giorgio Stephenson, 43/A20157 MilanoItalyTel. +39 2 3900 0094Fax +39 2 3900 7212E-mail: [email protected]
THE NETHERLANDSF-Secure B.V.Einsteinbaan 143439 NJ NieuwegeinNederlandTel. +31 30 602 01 10Fax +31 30 602 01 11E-mail: [email protected]
NORWAYF-Secure CorporationFrysjaveien 40 Inng. 4B0884 OsloNorwayTel. +47 21 52 00 62Fax +47 21 52 00 10www.f-secure.com
POLANDF-Secure Sp.z.o.o.ul. Hrubieszowska 6a01-209 WarszawaPolandTel. +48 22 431 82 21Fax +48 22 431 82 20www.f-secure.pl
SPAINF-Secure Iberia SLAv. de Europa, 1428108 La Moraleja, MadridSpainTel. +34 617 310 113
SWEDENF-Secure ABBox 717 (postal address)16927 Solna, SwedenGårdsvägen 18 (visiting address)16970 SolnaSwedenTel. +46 8 507 440 00Fax +46 8 507 440 01E-mail: [email protected]
UNITED KINGDOMF-Secure (UK) LtdMercury ParkWycombe LaneWooburn GreenBuckinghamshireHP10 0HHUnited KingdomTel. +44 845 890 3300Fax +44 845 890 3301E-mail: [email protected]
NORTH AMERICAUSAF-Secure Inc.1735 Technology Drive, Suite 850San Jose, CA 95110Tel. +1 888 432 8233Fax +1 408 350 2339E-mail: [email protected]
LATIN AMERICABRASILF-Secure do Brasil Tecnologia da Informãcao LtdaAv. das Nações Unidas, 12.399 Conj. 94 B Brooklin, São Paulo 04578-000Brazil Tel. +55 11 3512-7307
ASIAMALAYSIAF-Secure Corporation (M) Sdn BhdTower 3A, Avenue 3Bangsar SouthNo. 8, Jalan Kerinchi59200 Kuala LumpurMalaysiaTel. +603 2264 0200Fax +603 2264 0299E-mail: [email protected]
AUSTRALIAF-Secure Pty LtdSuite 12, Level 6,100 Walker StreetNorth SydneyNSW 2060AustraliaTel. +61 2 8404 4192Fax +61 2 8404 4170E-mail: [email protected]
HONG KONGF-Secure LimitedFlat F, 30/F, Legend Tower,7 Shing Yip Street,Kwun Tong,KowloonHong KongTel. +852 2363 3160Fax +852 2363 3162E-mail: [email protected]
INDIAHyderabad (Main Office)F-Secure Pvt Ltd 212, 6-3-1192/1/1Block 2, 2nd Floor, White HouseKundan Bagh, BegumpetHyderabad-500016IndiaTel. +91 40 4013 3503/4/5Fax +91 40 4013 3506E-mail: [email protected]
MumbaiF-Secure Pvt Ltd302, Bhavya Plaza,5th Road,Off S.V Road,Khar (West),Mumbai 400052Tel. +91 22 2604 1082Tel. +91 22 4003 3018Fax +91 22 2604 0833
New DelhiF-Secure Pvt Ltd202/5F, 2nd FloorDDA Building #5,District Center,Janakpuri,New Delhi - 1100058Mobile: +91 98 1888 7664Tel.+91 11 4577 1144Fax +91 11 4577 1100E-mail: [email protected]
JAPANF-Secure KK6F, ATT New Tower 2-11-7 Akasaka,Minato-ku, Tokyo, 107-0052,JapanTel. +81 3 5545 8940Fax +81 3 5545 8945E-mail: [email protected]
SINGAPOREF-Secure Pte Ltd,37 Lorong 23 Geylang,#09-04Singapore 388371E-mail: [email protected]
coNtact iNforMatioN
56 F-Secure

F-Secure CorporationTammasaarenkatu 7P.O. Box 24FI-00181 HelsinkiFinland
Tel. +358 9 2520 [email protected] www.f-secure.com
It’s all about peace of mind