
Form Personalization - 7 - Form Personalization and CUSTOMpll
Upload
rohan-castelinoCategory
view
182download
0
LA Machine Learning Group September 15, 2014

About IRIS.TV
Leading in-player video recommendation engine designed to create continuous streams of personalized video SaaS based solution for publishers and video technology companies looking to increase views per viewing session. IRIS.TV enables publishers to:
– connect to their audience – increase video views – control their programming to maximize reach and revenue potential of every
viewer

How it Works
BEFORE IRIS.TV
User has to navigate back to menu or app to search for more content

How it Works
Powered by Adaptive StreamTM, IRIS.TV
• Adaptive machine learning
• Programmatic video delivery
• Personalizing experiences for audiences while enforcing editorial and business rules for publishers
• Improving content discovery in a manner that facilitates audience growth and interaction
• Re-inventing the way users consume video

How it Works
Viewers of IRIS.TV enabled video players
WATCH MORE, WATCH LONGER, WATCH OFTEN
AFTER IRIS.TV INTEGRATION
Video publishers are able to engage users for longer and serve more ads

Speakers
Tom Sullivan Chief Data Scientist
Joel Spitalnik VP Engineering
Agenda
Personalization Response Curve Definition of Terms Data Science Engineering Summary

Personalization-Value Relationship
Personalization
Value
No Response = Unemployment
Positive Correlation
Something else

Relationship Between Personalization and Engagement
Stable
Loss of value due to “creepiness” and loss of serendipity
Strict increase in value (not likely given constraints) Value
Personalization
Definitions
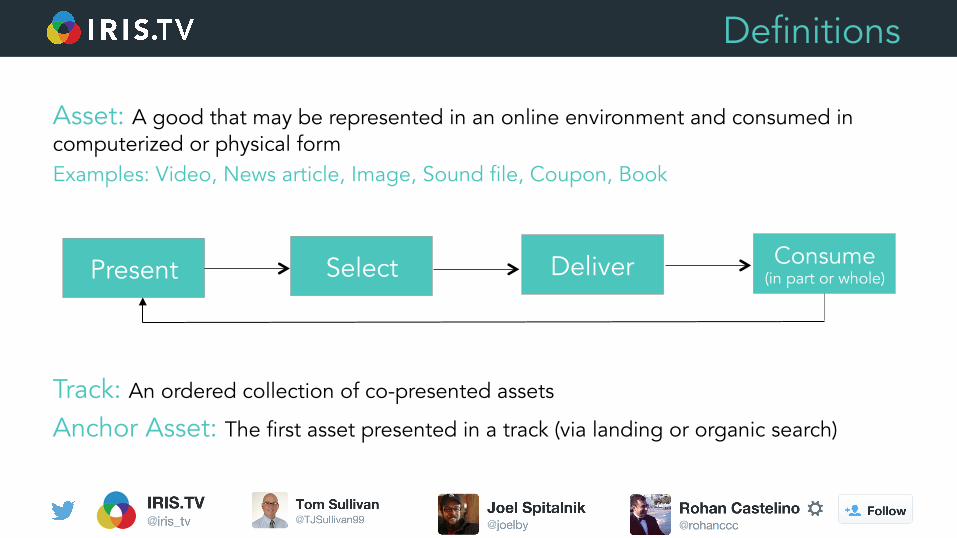
Asset: A good that may be represented in an online environment and consumed in computerized or physical form Examples: Video, News article, Image, Sound file, Coupon, Book
Track: An ordered collection of co-presented assets
Anchor Asset: The first asset presented in a track (via landing or organic search)
Present Deliver Consume (in part or whole) Select
Definitions
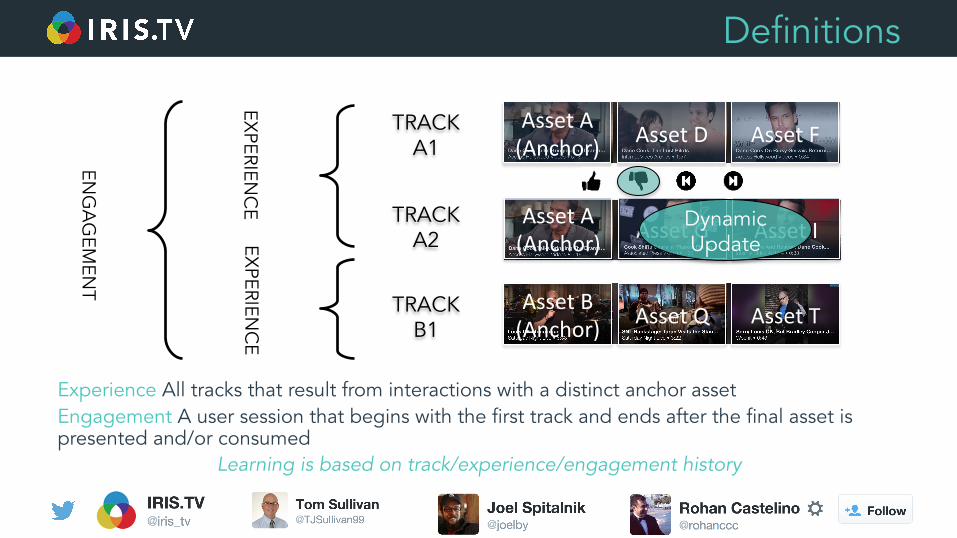
Experience All tracks that result from interactions with a distinct anchor asset Engagement A user session that begins with the first track and ends after the final asset is presented and/or consumed
Learning is based on track/experience/engagement history
Asset A (Anchor) Asset D Asset F
Asset A (Anchor) Asset G Asset I
Asset B (Anchor) Asset Q Asset T
Dynamic Update
TRACK A1
TRACK A2
TRACK B1
EXPERIEN
CE
EXPERIEN
CE
ENG
AG
EMEN
T

Hybrid (front/back end) Personalization
IRIS.TV Approach Value
Personalization P0 P1 P2 P3 P4 P5

The Constrained Optimization Problem
Provide personalized recommendations, P, that maximize the value of variable on the vertical axis of the response curve, V (value)
Subject to constraints (including estimation risk), : Λ
While remaining aware of residual benefits, R ● The data scientist's desire execute machine learning to improve accuracy of predictions (recommended
assets) ● The opportunity to generate residual value based business insights
That can be computed given the available resource environment and acceptable latency in updates to tracks, E
max (V + R) = f(P) s.t. Λ,Ε
“A sensible estimate is an interval estimate”
IRIS.TV uses the “Strategy first” approach rather than a “data first” approach
Building Personalized Tracks
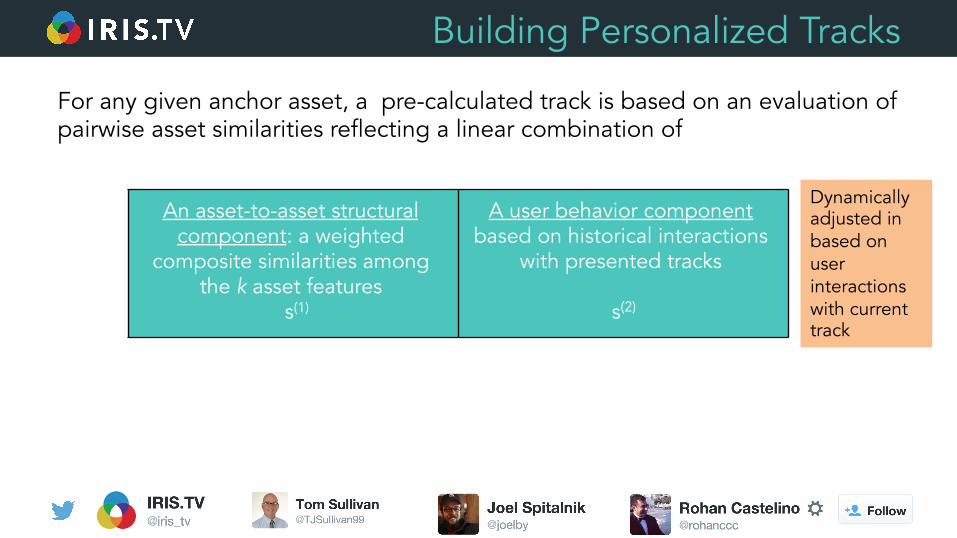
For any given anchor asset, a pre-calculated track is based on an evaluation of pairwise asset similarities reflecting a linear combination of
An asset-to-asset structural component: a weighted
composite similarities among the k asset features
s(1)
A user behavior component based on historical interactions
with presented tracks
s(2)
Dynamically adjusted in based on user interactions with current track

Track Construction is a Clustering Problem
Note: similarities may not necessarily be symmetric when using user behavior data
Asset j (in track)
Present Consume Like: Dislike
Skips Fully Consume
Similarity S(2)
2 10,345 95.1% 7.2 : 1 11.6% 77.3% S(2) 1,2
7 4,235 9.1% 1 : 27.9 54.3% 15.9% S(2) 1,7
Sample of Historical Data Related to Paired Asset Engagements for Anchor Asset 1

Temporal Observation Windows
Temporal user behavior data may perish over time
In our machine learning “sandbox”, there is little need to store and process data that has “aged” beyond some threshold The “optimal” temporal window may be inferred by using subject matter expertise and/or by ML We only consider the sufficient statistics, aggregated from the full log data and updated. This reduces the amount of data in the current environment and may improve computational efficiency, E
max (V + R) = f(P) s.t. Λ, Ε
Age
Obs weight
t*
1
0

Preparing the data for similarity calculations
API
Aggregation Queries
Summary observation data
in temporal window,
constraints, asset metadata
Raw Log Data

The Data Scientist at IRIS.TV
Skills and Experience ● Ability to program in R ● Understanding of MySQL ● Some familiarity with working with large, diverse data sets ● Can move data between Hive/MySQL/R
Differentiator ● Primary Strength is Statistics v. Data Management ● Understands dimension reduction and the pros/cons of using various
methods ● Choices are driven by objective function
max (V + R) = f(P) s.t. Λ,Ε Join us?: www.iris.tv Email: [email protected] [email protected]

Feature 1: Keyword Overlap
Feature 2: Asset Length
Tracks are Sensitive to Choice of Methods
Asset A (anchor)
Asset B Asset C
A B C
D
EAsset A (anchor)
Asset B Asset E
Asset A (anchor)
Asset B Asset D
Single-link
2NN
Complete
Complete method: • leads to possibly fewer computations
(when n is sufficiently large) • Can result more spherical clusters with
respect to anchor asset • Increases “track strength”

Increasing Personalization: Asset-to-Asset Feature Weighting
• Which features are more relevant in the user’s decision to consume assets? • Pairwise similarity, between two assets s(1)
i,j are a weighted sum of k separate feature-level similarities from asset metadata (e.g. length, keyword overlap, genre, publication date, mood, etc.)
• We use simulated annealing, simplex-marching, tree-based starting points, parsimony penalty, and
loss values driven by (E,R)
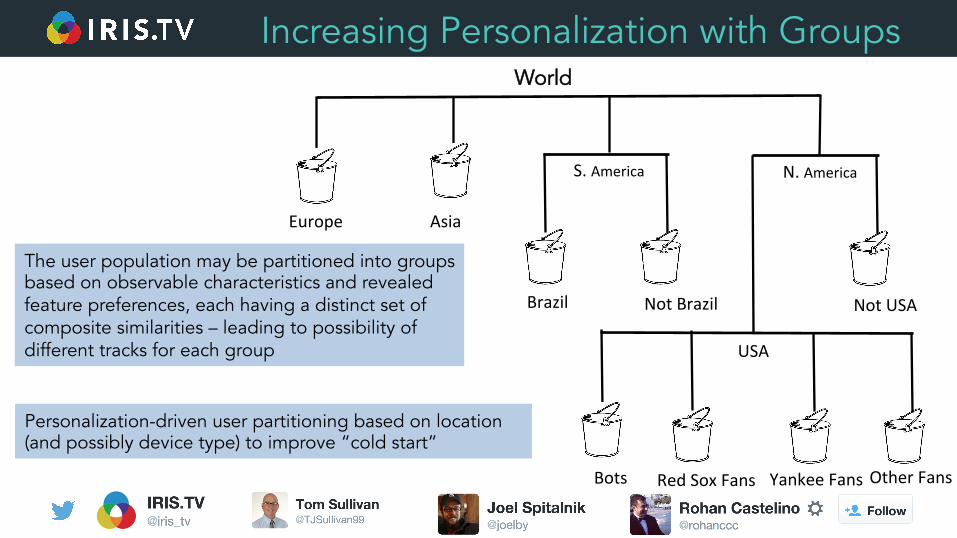
Increasing Personalization with Groups
The user population may be partitioned into groups based on observable characteristics and revealed feature preferences, each having a distinct set of composite similarities – leading to possibility of different tracks for each group
Personalization-driven user partitioning based on location (and possibly device type) to improve “cold start”
Other Fans
World
Asia Europe
S. America
Not Brazil
N. America
USA
Not USA
Red Sox Fans Yankee Fans Bots
Brazil

Bots and Bias • Not all user engagement data is useful – there are non-human
users whose influence we try to remove / downweight the user behavior component of similarity computation
• e.g. One user selected 1600 videos in 10 minutes • In polarizing topics such as sports, politics, etc., and quality
assessments there may be bias in the like /dislike actions
Braz
USA
Red Sox Fans Yankee Fans Other Fans Bots X

Bucket Re-Evaluation
Bucket assignment is a fuzzy classification problem and we assign a user to the bucket with the highest membership probability Periodically, we revisit the buckets and memberships • If every bucket has only one user, the backend has generated
personalization in its highest form (with respect to the IRIS.TV definition)
• As more data becomes available on a user based on their historical engagements, their bucket assignment may change

Hybrid (front/back-end) Personalization, so far
Value
Personalization P0 P1 P2 P3 P4 P5
Anchoring+similarity
+ Historical user data
+ buckets
+beVer buckets
+real-‐Xme feedback
Next up: Joel Spitalnik, to talk about the technology stack, NLP, and dynamic track adjustment

Front End
Origins of Recommendation System JukeboxTV Manual Curation Building Data Structures
Data Munging Natural Language Processing Mapping Keywords
Service Oriented Architecture Agile Development Minimizing Latency

Preparing the data for similarity calculations
Online Rec System
Aggregation Queries
Summary observation data
in temporal window,
constraints, asset metadata
Raw Log Data
API