Inglewood Unified School District » 401 S. Inglewood Ave ...
15
OUR TEACHERS OUR SCHOOL OUR MESSAGE Inglewood USD Kelso Elementary School 2014-15 School Accountability Report Card Published in 2015-16 Dr. Vincent Matthews, Superintendent • [email protected] • Phone: (310) 419-2700 Inglewood Unified School District • 401 South Inglewood Avenue Inglewood, CA 90301 • http://iusd.net Dr. Brian Coffey Principal [email protected] 809 East Kelso Street Inglewood, CA 90301-2809 Grades: TK-6 Phone: (310) 680-5480 www.kelso.iusd.net CDS Code: 19-64634-6014492 Para español, visita: http://iusd.net
Transcript of Inglewood Unified School District » 401 S. Inglewood Ave ...
our teachers
our school
our message
Inglewood USD
Kelso Elementary
School2014-15
School Accountability Report Card
Published in 2015-16
Dr. Vincent Matthews, Superintendent • [email protected] • Phone: (310) 419-2700
Inglewood Unified School District • 401 South Inglewood Avenue Inglewood, CA 90301 • http://iusd.net
Dr. Brian Coffey Principal
809 East Kelso Street Inglewood, CA 90301-2809
Grades: TK-6 Phone: (310) 680-5480
www.kelso.iusd.net
CDS Code: 19-64634-6014492
Para español, visita: http://iusd.net
2Kelso Elementary SchoolSARC
School Accountability Report Card
In accordance with state and federal requirements, the School
Accountability Report Card (SARC) is put forth annually by all public schools as a tool
for parents and interested parties to stay informed of the school’s
progress, test scores and achievements.
Principal’s Message“College and Career Begins at Kelso!” The foundations of instruction at Kelso are based upon a rigorous cur-riculum, high expectations for student achievement and evidence-based instructional practices. The culture of Kelso fosters a professional learning community in which highly qualified teachers engage in ongoing professional development and work collaboratively to analyze student data to develop student-centered, standards-based learning activities that promote critical thinking, collaboration, communication and creativity.
In 2014-15, Kelso’s School Site Council, Instructional Leader Team (ILT) and the Student Council voted to adopt Kelso PRIDE (Positive attitude, respect, integrity, diligence, excellence) as the school’s Core Values. These Core Values are the foundation for Kelso’s Positive Behavioral Interventions and Supports (PBIS) initiative for 2015-16 and set forth schoolwide expectations for conduct at Kelso that will enhance a climate of excellence in teaching and learning.
Kelso’s high expectations for instruction and student achievement have historically yielded consistently posi-tive results. Kelso was the first school in IUSD to earn an API score above 800, and Kelso received recogni-tion as a California Distinguished School in 2006 and 2012. Educators from urban schools across the country, along with textbook publishers and educational researchers, have visited Kelso and used the school as a model for best practices in urban education. A key to Kelso’s success is a shared vision by Kelso’s passionate staff, students and their families that promotes high standards for academic and personal growth that is care-fully monitored and analyzed to ensure the success of each student. College truly begins at Kelso!
District Mission StatementThe mission of the Inglewood Unified School District is to ensure that all our students are taught rigorous standards based curriculum supported by highly
qualified staff in an exemplary educational system characterized by high student
achievement, social development, safe schools, and effective partnerships with all
segments of the community.
District Vision StatementThe vision of the Inglewood Unified
School District is to provide a learning environment that empowers all students to acquire the academic and social skills
needed to become productive citizens and lifelong learners in a global economy.
Parental InvolvementKelso staff members recognize the importance of partnering with parents to educate a child and encourage parent involvement at school. Kelso convenes an annual meeting to inform parents of Title I students about Title I requirements and about the rights of parents to be involved in the Title I program. The conference is held every fall prior to Back-to-School Night in which presentations are made by the staff informing parents of their rights, school procedures and policies, how to assist their children, attendance policy, Williams case settlement policy, testing, and parent involvement committees which include School Site Council (SSC) and English Language Advisory Committee (ELAC).
The school provides parents of Title I students with timely information about Title I programs. Kelso commu-nicates with families through backpack flyers, recorded phone messages, email blasts, regular posts to the Kelso website and on the marquee in front of the school. All notices, newsletters, agendas, and telephone messages are in English and Spanish.
The school offers a flexible number of meetings for Title I parents in the morning and in the afternoon. Informal morning Coffee With the Principal meetings give parents the opportunity to give feedback and have open dialogue with the principal. More formal ELAC, SSC and School Advisory Council (SAC) meetings include elected parents, teachers, staff and community members. The school involves parents of Title I students in an organized, ongoing and timely way in the planning, review and improvement of the school’s Title I programs and the Title I parental involvement policy. Parents are encouraged to attend various parent meetings. At these meetings they collaborate in discussing, analyzing and updating school programs and policies. Their input is highly regarded as plans are put in place. We involve parents in an organized, ongoing and timely way to plan, review and improve programs such as the parental involvement policy, home-school compact and the school plan. Program revisions and improvements are made based on the needs assessment survey, budget, agendas, standardized testing results, minutes and sign in sheets from conferences and meetings. The school provides parents of Title I students with an explanation of the curriculum used at the school, their child’s grade-level standards, the assessments used to measure student progress, and the proficiency levels students are expected to meet. Standardized test and California English Language Development Test (CELDT) scores are sent home within two weeks of receipt by the school.
At Back-to-School Night, grade-level standards are distributed to all parents, and teachers explain the grade-level standards and curriculum. All students are expected to work toward mastery of the grade-level stan-dards. Kelso Elementary School also distributes a school-parent compact on Back-to-School Night or on Parent Conference Day. The compact, which has been jointly developed with parents using both annual needs assessment surveys and discussions at meetings, outlines how parents, the entire school staff and students will share the responsibility for improved student academic achievement. The home-school compact is reviewed and signed during Back-to-School Night or parent conference day and is included in the enroll-ment packet for new students who enter throughout the year. It is the main focus of our Parental Involvement Policy. It describes specific ways the school and families will partner to help children achieve the state’s high academic standards. It addresses the following legally required items, as well as other items suggested by parents of Title I students:
• The school’s responsibility to provide high-quality curriculum and instruction
• The ways parents will be responsible for supporting their children’s learning
• The ways students will be responsible for their learning
• The importance of ongoing communication between parents and teachers through, at a minimum, an-nual parent-teacher conferences; frequent reports on student progress; access to staff; opportunities for parents to volunteer and participate in their child’s class; and opportunities to observe classroom activities
Continued on page 3
3Kelso Elementary SchoolSARC
Parental InvolvementContinued from page 2
The school provides Title I parents with assistance in understanding the state’s academic content standards, assessments, and how to monitor and improve the achievement of their children at the annual Title I Confer-ence and during parent meetings throughout the school year.
Overall school performance is discussed during our Title I conference and throughout the year at ELAC, SSC and SAC meetings, and individual student performance is discussed during individual conferences. For struggling students, Student Success Team meetings are held to enact intervention and support. Parents play an important role in this process. The school provides Title I parents with materials and training to help them work with their children throughout the school year by providing Parent Institute brochures and pamphlets. These are displayed in the main office, and shared at meetings for helpful suggestions in academic and be-havioral areas. Throughout the year training is provided at meetings on helping children with reading, math, writing and science at home. Teachers work informally with parents throughout the year as need arises. With the assistance of Title I parents, the school educates staff members about the value of parent contributions and in how to work with parents as equal partners.
The school coordinates and integrates the Title I parental involvement program with other programs and conducts other activities, such as International Day, Open House and the Health Fair Fun Run. Parents are invited to attend trimester awards assemblies, the Halloween Costume Parade and Winter Holiday Program.
Kelso provides opportunities for the participation of all Title I parents, including parents with limited English proficiency, parents with disabilities and parents of migratory students. The school distributes information re-lated to school and parent programs, meetings and other activities to Title I parents in a format and language that the parents understand. Staff is available to answer questions about all information sent home in English or Spanish.
For more information on how to become involved, please contact Principal Dr. Brian Coffey or School Site Council President Samuel Napier at (310) 680-5480.
Professional DevelopmentKelso Elementary uses data from frequent formative assessments and benchmarks to inform Grade Level Cohort Professional Learning Communities (PLCs) meet twice per month. Grade-level PLCs have release time from 1 p.m. to 2 p.m. every seven instructional days to collaborate. Instructional leaders are elected to lead Grade Level Cohorts. This team meets with the principal twice per month.
Kelso’s ILT and SSC identified English language development (ELD) as an instructional focus for the 2015-16 school year, along with implementation of a Positive Behavioral Interventions and Supports initiative. These programs are monitored through regular administrative walk-throughs and periodic Instructional Rounds.
School SafetyThe safety of students and staff at Kelso is a primary objective, and the school adheres to a strict safety plan. The plan includes monthly fire drills, quarterly earthquake drills and biannual shelter-in-place drills. The plan is regularly modified to meet the changing needs of the school. All staff members are provided copies of the plan and receive annual training specific to safety procedures. The school safety plan was most recently reviewed and updated in August 2015. For the safety of students and staff, Kelso is a closed campus. All visitors must check in with the main office.
“College and Career Begins at Kelso!”School Mission StatementThe mission of Kelso Elementary School is to ensure that our students develop strong academic achievement through an enriched, diverse and rigorous curriculum, which utilizes the latest technology in a safe, supportive and student-centered environment that nurtures positive cultural and social values.
Public Internet AccessInternet access is available at public libraries and other locations that are publicly accessible (e.g., the Califor-nia State Library). Access to the Internet at libraries and public locations is generally provided on a first-come, first-serve basis. Other use restrictions include the hours of operation, the length of time that a workstation may be used (depending on availability), the types of software programs available at a workstation, and the ability to print documents.
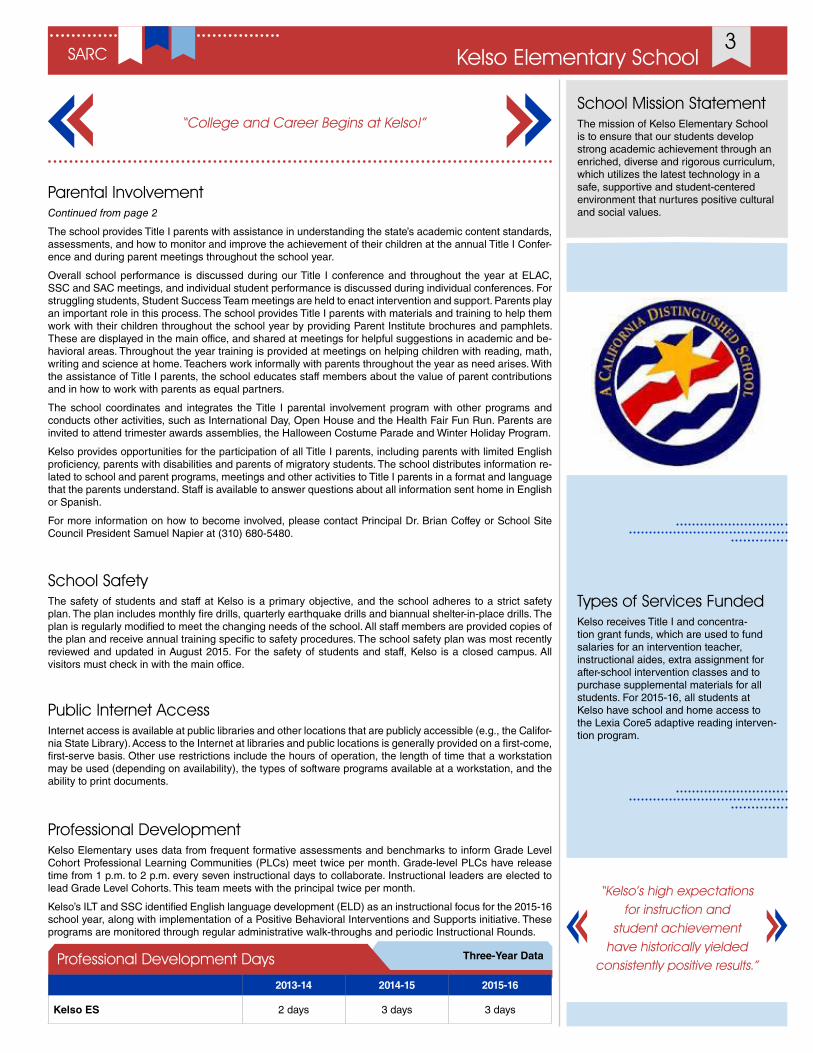
Three-Year DataProfessional Development Days
2013-14 2014-15 2015-16
Kelso ES 2 days 3 days 3 days
Types of Services FundedKelso receives Title I and concentra-tion grant funds, which are used to fund salaries for an intervention teacher, instructional aides, extra assignment for after-school intervention classes and to purchase supplemental materials for all students. For 2015-16, all students at Kelso have school and home access to the Lexia Core5 adaptive reading interven-tion program.
“Kelso’s high expectations for instruction and
student achievement have historically yielded
consistently positive results.”

4Kelso Elementary SchoolSARC
Enrollment by GradeThe bar graph displays the total number of students enrolled in each grade for the 2014-15 school year.
2014-15 Enrollment by Grade
Enrollment by Student GroupThe total enrollment at the school was 650 students for the 2014-15 school year. The pie chart displays the percentage of students enrolled in each group.
2014-15 School YearDemographics
Socioeconomically disadvantaged
84.3%English
learners30.9%
Students with disabilities
4.6%Foster Youth
0.8%
Class Size DistributionThe bar graph displays the three-year data for average class size and the table displays the three-year data for the number of classrooms by size.
Three-Year DataAverage Class Size
13-1412-13 14-15
Suspensions and ExpulsionsThis table shows the school, district, and state suspension and expulsion rates for the most recent three-year period. Note: Students are only counted one time, regardless of the number of suspensions.
Suspension and Expulsion Rates
Kelso ES
12-13 13-14 14-15
Suspension rates 5.8% 3.6% 2.3%
Expulsion rates 0.0% 0.0% 0.0%
Inglewood USD
12-13 13-14 14-15
Suspension rates 9.1% 6.2% 3.9%
Expulsion rates 0.0% 0.1% 0.1%
California
12-13 13-14 14-15
Suspension rates 5.1% 4.4% 3.8%
Expulsion rates 0.1% 0.1% 0.1%
Three-Year DataNumber of Classrooms by Size
2012-13 2013-14 2014-15
GradeNumber of Students
1-20 21-32 33+ 1-20 21-32 33+ 1-20 21-32 33+
K 2 1 2 3 1 3
1 3 1 4
2 3 3 3
3 3 3 3
4 1 4 2 1 3
5 1 2 3 3
6 1 2 1 3 2
K 1 2 3 4 5 6
32 32 32 32
23
33
28
23
32 32 32 3234
2424 23
2830
2629
31
K
1
2
3
4
5
6
105
91
96
91
97
87
83
Hispanic or Latino56.6%
American Indian or Alaska Native
1.1%
Asian0.6%
Native Hawaiian or Pacific Islander
0.2%
Filipino0.3%
Black or African-American
39.7%
White0.9%
Two or More Races0.3%
No Response 0.3%
5Kelso Elementary SchoolSARC
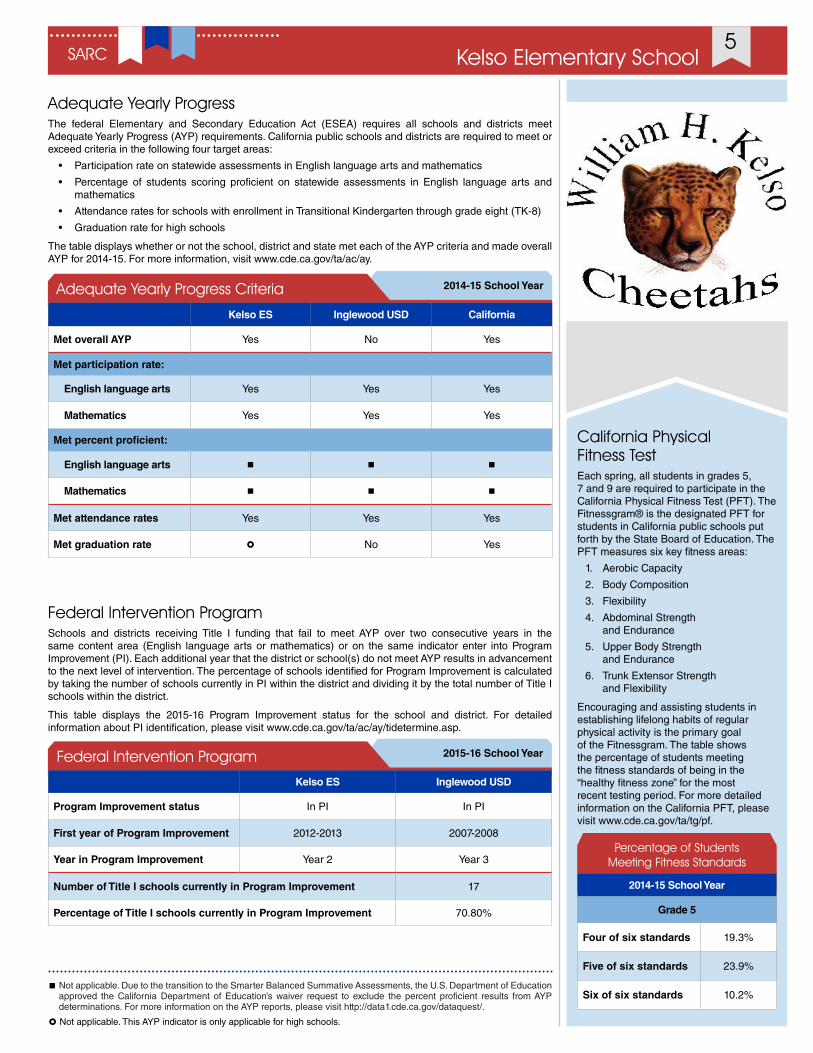
Federal Intervention ProgramSchools and districts receiving Title I funding that fail to meet AYP over two consecutive years in the same content area (English language arts or mathematics) or on the same indicator enter into Program Improvement (PI). Each additional year that the district or school(s) do not meet AYP results in advancement to the next level of intervention. The percentage of schools identified for Program Improvement is calculated by taking the number of schools currently in PI within the district and dividing it by the total number of Title I schools within the district.
This table displays the 2015-16 Program Improvement status for the school and district. For detailed information about PI identification, please visit www.cde.ca.gov/ta/ac/ay/tidetermine.asp.
2015-16 School YearFederal Intervention Program
Kelso ES Inglewood USD
Program Improvement status In PI In PI
First year of Program Improvement 2012-2013 2007-2008
Year in Program Improvement Year 2 Year 3
Number of Title I schools currently in Program Improvement 17
Percentage of Title I schools currently in Program Improvement 70.80%
California Physical Fitness TestEach spring, all students in grades 5, 7 and 9 are required to participate in the California Physical Fitness Test (PFT). The Fitnessgram® is the designated PFT for students in California public schools put forth by the State Board of Education. The PFT measures six key fitness areas:
1. Aerobic Capacity
2. Body Composition
3. Flexibility
4. Abdominal Strength and Endurance
5. Upper Body Strength and Endurance
6. Trunk Extensor Strength and Flexibility
Encouraging and assisting students in establishing lifelong habits of regular physical activity is the primary goal of the Fitnessgram. The table shows the percentage of students meeting the fitness standards of being in the “healthy fitness zone” for the most recent testing period. For more detailed information on the California PFT, please visit www.cde.ca.gov/ta/tg/pf.
Percentage of Students Meeting Fitness Standards
2014-15 School Year
Grade 5
Four of six standards 19.3%
Five of six standards 23.9%
Six of six standards 10.2%
Adequate Yearly ProgressThe federal Elementary and Secondary Education Act (ESEA) requires all schools and districts meet Adequate Yearly Progress (AYP) requirements. California public schools and districts are required to meet or exceed criteria in the following four target areas:
• Participation rate on statewide assessments in English language arts and mathematics
• Percentage of students scoring proficient on statewide assessments in English language arts and mathematics
• Attendance rates for schools with enrollment in Transitional Kindergarten through grade eight (TK-8)
• Graduation rate for high schools
The table displays whether or not the school, district and state met each of the AYP criteria and made overall AYP for 2014-15. For more information, visit www.cde.ca.gov/ta/ac/ay.
2014-15 School YearAdequate Yearly Progress Criteria
Kelso ES Inglewood USD California
Met overall AYP Yes No Yes
Met participation rate:
English language arts Yes Yes Yes
Mathematics Yes Yes Yes
Met percent proficient:
English language arts n n n
Mathematics n n n
Met attendance rates Yes Yes Yes
Met graduation rate � No Yes
� Not applicable. This AYP indicator is only applicable for high schools.
Not applicable. Due to the transition to the Smarter Balanced Summative Assessments, the U.S. Department of Education approved the California Department of Education’s waiver request to exclude the percent proficient results from AYP determinations. For more information on the AYP reports, please visit http://data1.cde.ca.gov/dataquest/.
n
6Kelso Elementary SchoolSARC
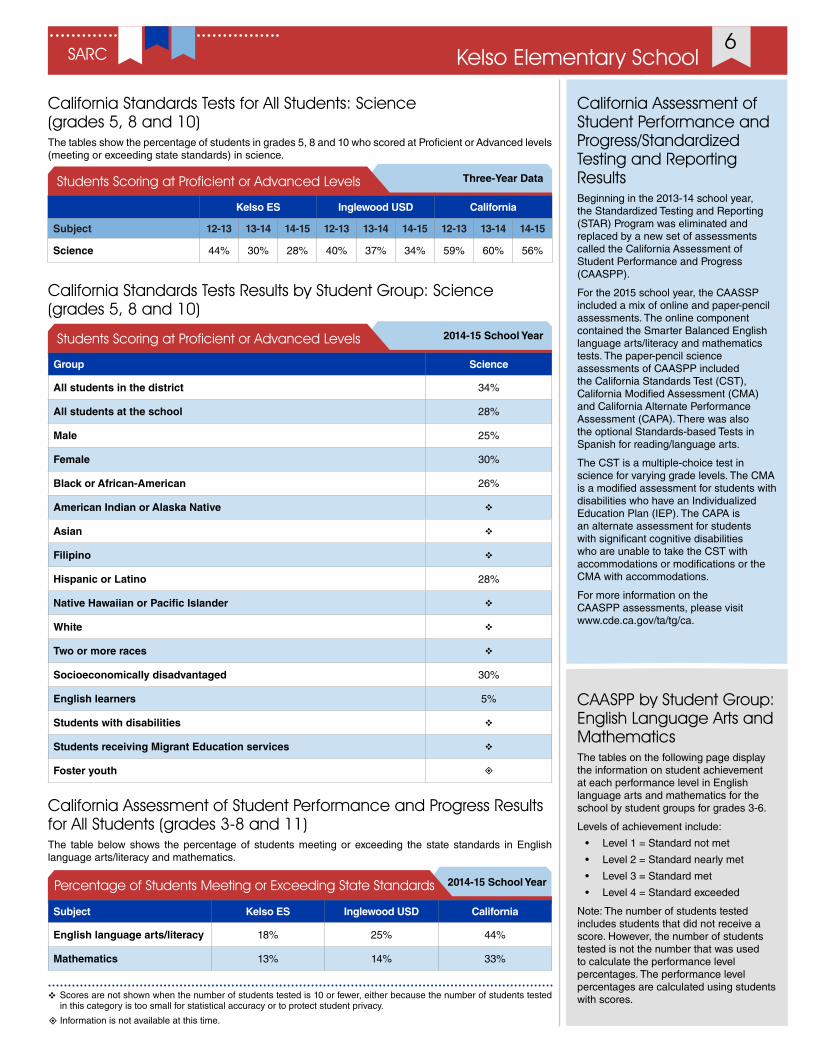
California Standards Tests for All Students: Science (grades 5, 8 and 10)The tables show the percentage of students in grades 5, 8 and 10 who scored at Proficient or Advanced levels (meeting or exceeding state standards) in science.
Three-Year DataStudents Scoring at Proficient or Advanced Levels
Kelso ES Inglewood USD California
Subject 12-13 13-14 14-15 12-13 13-14 14-15 12-13 13-14 14-15
Science 44% 30% 28% 40% 37% 34% 59% 60% 56%
California Standards Tests Results by Student Group: Science (grades 5, 8 and 10)
2014-15 School YearStudents Scoring at Proficient or Advanced Levels
Group Science
All students in the district 34%
All students at the school 28%
Male 25%
Female 30%
Black or African-American 26%
American Indian or Alaska Native v
Asian v
Filipino v
Hispanic or Latino 28%
Native Hawaiian or Pacific Islander v
White v
Two or more races v
Socioeconomically disadvantaged 30%
English learners 5%
Students with disabilities v
Students receiving Migrant Education services v
Foster youth ±
California Assessment of Student Performance and Progress/Standardized Testing and Reporting Results Beginning in the 2013-14 school year, the Standardized Testing and Reporting (STAR) Program was eliminated and replaced by a new set of assessments called the California Assessment of Student Performance and Progress (CAASPP).
For the 2015 school year, the CAASSP included a mix of online and paper-pencil assessments. The online component contained the Smarter Balanced English language arts/literacy and mathematics tests. The paper-pencil science assessments of CAASPP included the California Standards Test (CST), California Modified Assessment (CMA) and California Alternate Performance Assessment (CAPA). There was also the optional Standards-based Tests in Spanish for reading/language arts.
The CST is a multiple-choice test in science for varying grade levels. The CMA is a modified assessment for students with disabilities who have an Individualized Education Plan (IEP). The CAPA is an alternate assessment for students with significant cognitive disabilities who are unable to take the CST with accommodations or modifications or the CMA with accommodations.
For more information on the CAASPP assessments, please visit www.cde.ca.gov/ta/tg/ca.
CAASPP by Student Group: English Language Arts and MathematicsThe tables on the following page display the information on student achievement at each performance level in English language arts and mathematics for the school by student groups for grades 3-6.
Levels of achievement include:
• Level 1 = Standard not met
• Level 2 = Standard nearly met
• Level 3 = Standard met
• Level 4 = Standard exceeded
Note: The number of students tested includes students that did not receive a score. However, the number of students tested is not the number that was used to calculate the performance level percentages. The performance level percentages are calculated using students with scores.v Scores are not shown when the number of students tested is 10 or fewer, either because the number of students tested
in this category is too small for statistical accuracy or to protect student privacy.
± Information is not available at this time.
California Assessment of Student Performance and Progress Results for All Students (grades 3-8 and 11)The table below shows the percentage of students meeting or exceeding the state standards in English language arts/literacy and mathematics.
2014-15 School YearPercentage of Students Meeting or Exceeding State Standards
Subject Kelso ES Inglewood USD California
English language arts/literacy 18% 25% 44%
Mathematics 13% 14% 33%
7Kelso Elementary SchoolSARC
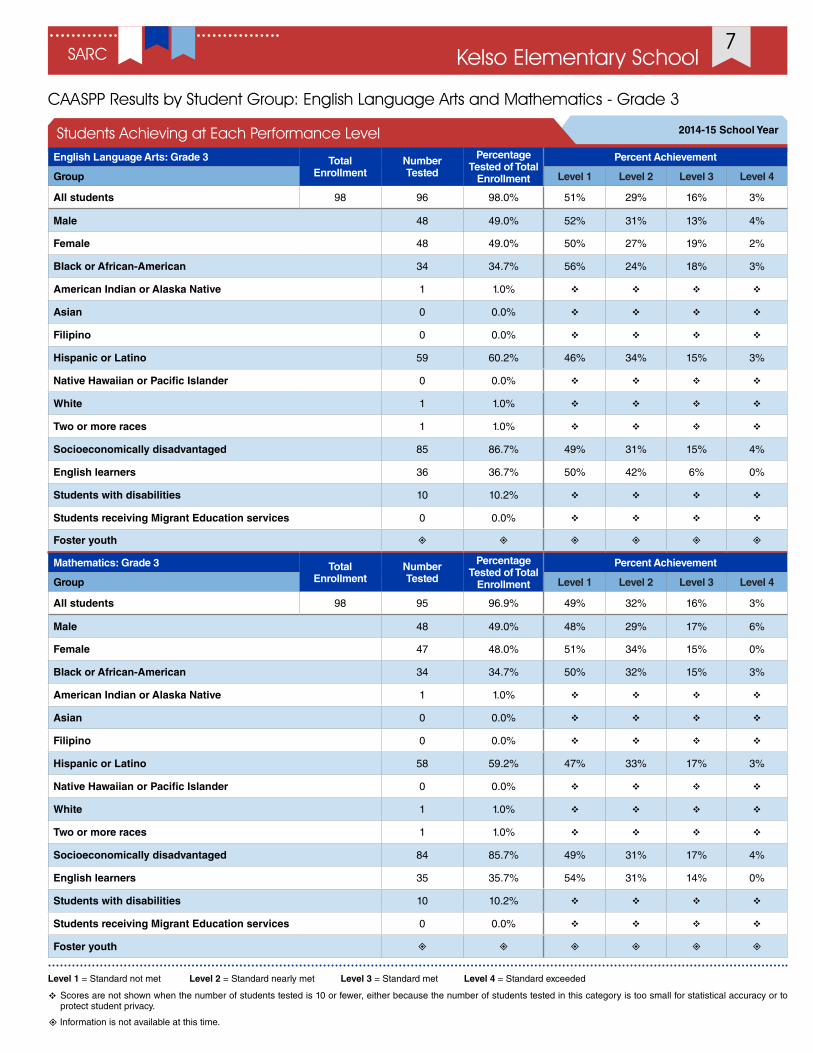
CAASPP Results by Student Group: English Language Arts and Mathematics - Grade 3
Level 1 = Standard not met Level 2 = Standard nearly met Level 3 = Standard met Level 4 = Standard exceeded
v Scores are not shown when the number of students tested is 10 or fewer, either because the number of students tested in this category is too small for statistical accuracy or to protect student privacy.
2014-15 School YearStudents Achieving at Each Performance LevelEnglish Language Arts: Grade 3 Total
EnrollmentNumber Tested
Percentage Tested of Total
Enrollment
Percent Achievement
Group Level 1 Level 2 Level 3 Level 4
All students 98 96 98.0% 51% 29% 16% 3%
Male 48 49.0% 52% 31% 13% 4%
Female 48 49.0% 50% 27% 19% 2%
Black or African-American 34 34.7% 56% 24% 18% 3%
American Indian or Alaska Native 1 1.0% v v v v
Asian 0 0.0% v v v v
Filipino 0 0.0% v v v v
Hispanic or Latino 59 60.2% 46% 34% 15% 3%
Native Hawaiian or Pacific Islander 0 0.0% v v v v
White 1 1.0% v v v v
Two or more races 1 1.0% v v v v
Socioeconomically disadvantaged 85 86.7% 49% 31% 15% 4%
English learners 36 36.7% 50% 42% 6% 0%
Students with disabilities 10 10.2% v v v v
Students receiving Migrant Education services 0 0.0% v v v v
Foster youth ± ± ± ± ± ±
Mathematics: Grade 3 Total Enrollment
Number Tested
Percentage Tested of Total
Enrollment
Percent Achievement
Group Level 1 Level 2 Level 3 Level 4
All students 98 95 96.9% 49% 32% 16% 3%
Male 48 49.0% 48% 29% 17% 6%
Female 47 48.0% 51% 34% 15% 0%
Black or African-American 34 34.7% 50% 32% 15% 3%
American Indian or Alaska Native 1 1.0% v v v v
Asian 0 0.0% v v v v
Filipino 0 0.0% v v v v
Hispanic or Latino 58 59.2% 47% 33% 17% 3%
Native Hawaiian or Pacific Islander 0 0.0% v v v v
White 1 1.0% v v v v
Two or more races 1 1.0% v v v v
Socioeconomically disadvantaged 84 85.7% 49% 31% 17% 4%
English learners 35 35.7% 54% 31% 14% 0%
Students with disabilities 10 10.2% v v v v
Students receiving Migrant Education services 0 0.0% v v v v
Foster youth ± ± ± ± ± ±
± Information is not available at this time.

8Kelso Elementary SchoolSARC
CAASPP Results by Student Group: English Language Arts and Mathematics - Grade 4
Level 1 = Standard not met Level 2 = Standard nearly met Level 3 = Standard met Level 4 = Standard exceeded
v Scores are not shown when the number of students tested is 10 or fewer, either because the number of students tested in this category is too small for statistical accuracy or to protect student privacy.
2014-15 School YearStudents Achieving at Each Performance LevelEnglish Language Arts: Grade 4 Total
EnrollmentNumber Tested
Percentage Tested of Total
Enrollment
Percent Achievement
Group Level 1 Level 2 Level 3 Level 4
All students 102 100 98.0% 65% 21% 11% 3%
Male 48 47.1% 69% 17% 10% 4%
Female 52 51.0% 62% 25% 12% 2%
Black or African-American 41 40.2% 68% 20% 7% 5%
American Indian or Alaska Native 0 0.0% v v v v
Asian 1 1.0% v v v v
Filipino 0 0.0% v v v v
Hispanic or Latino 58 56.9% 62% 22% 14% 2%
Native Hawaiian or Pacific Islander 0 0.0% v v v v
White 0 0.0% v v v v
Two or more races 0 0.0% v v v v
Socioeconomically disadvantaged 88 86.3% 66% 22% 9% 3%
English learners 37 36.3% 70% 22% 8% 0%
Students with disabilities 13 12.7% 100% 0% 0% 0%
Students receiving Migrant Education services 0 0.0% v v v v
Foster youth ± ± ± ± ± ±
Mathematics: Grade 4 Total Enrollment
Number Tested
Percentage Tested of Total
Enrollment
Percent Achievement
Group Level 1 Level 2 Level 3 Level 4
All students 102 101 99.0% 41% 45% 11% 3%
Male 49 48.0% 35% 43% 18% 2%
Female 52 51.0% 46% 46% 4% 4%
Black or African-American 41 40.2% 44% 37% 15% 2%
American Indian or Alaska Native 0 0.0% v v v v
Asian 1 1.0% v v v v
Filipino 0 0.0% v v v v
Hispanic or Latino 59 57.8% 37% 51% 8% 3%
Native Hawaiian or Pacific Islander 0 0.0% v v v v
White 0 0.0% v v v v
Two or more races 0 0.0% v v v v
Socioeconomically disadvantaged 88 86.3% 44% 44% 7% 3%
English learners 37 36.3% 41% 51% 5% 3%
Students with disabilities 13 12.7% 85% 8% 0% 0%
Students receiving Migrant Education services 0 0.0% v v v v
Foster youth ± ± ± ± ± ±
± Information is not available at this time.
9Kelso Elementary SchoolSARC
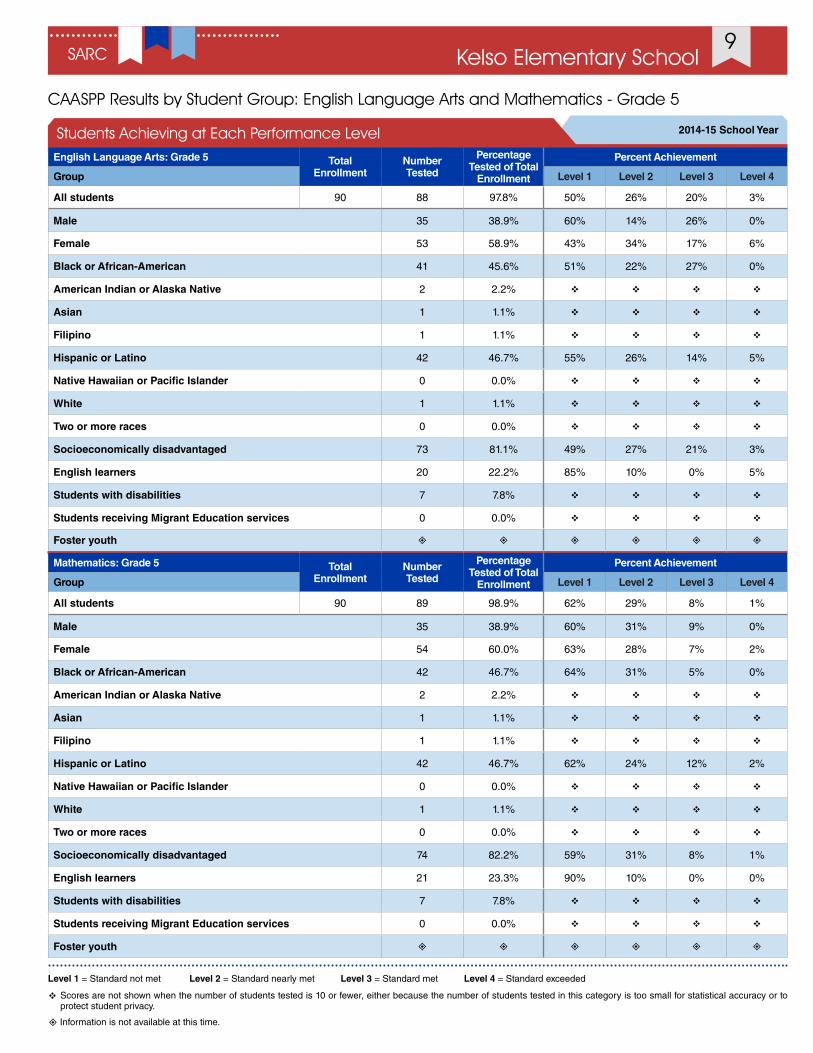
CAASPP Results by Student Group: English Language Arts and Mathematics - Grade 5
Level 1 = Standard not met Level 2 = Standard nearly met Level 3 = Standard met Level 4 = Standard exceeded
v Scores are not shown when the number of students tested is 10 or fewer, either because the number of students tested in this category is too small for statistical accuracy or to protect student privacy.
2014-15 School YearStudents Achieving at Each Performance LevelEnglish Language Arts: Grade 5 Total
EnrollmentNumber Tested
Percentage Tested of Total
Enrollment
Percent Achievement
Group Level 1 Level 2 Level 3 Level 4
All students 90 88 97.8% 50% 26% 20% 3%
Male 35 38.9% 60% 14% 26% 0%
Female 53 58.9% 43% 34% 17% 6%
Black or African-American 41 45.6% 51% 22% 27% 0%
American Indian or Alaska Native 2 2.2% v v v v
Asian 1 1.1% v v v v
Filipino 1 1.1% v v v v
Hispanic or Latino 42 46.7% 55% 26% 14% 5%
Native Hawaiian or Pacific Islander 0 0.0% v v v v
White 1 1.1% v v v v
Two or more races 0 0.0% v v v v
Socioeconomically disadvantaged 73 81.1% 49% 27% 21% 3%
English learners 20 22.2% 85% 10% 0% 5%
Students with disabilities 7 7.8% v v v v
Students receiving Migrant Education services 0 0.0% v v v v
Foster youth ± ± ± ± ± ±
Mathematics: Grade 5 Total Enrollment
Number Tested
Percentage Tested of Total
Enrollment
Percent Achievement
Group Level 1 Level 2 Level 3 Level 4
All students 90 89 98.9% 62% 29% 8% 1%
Male 35 38.9% 60% 31% 9% 0%
Female 54 60.0% 63% 28% 7% 2%
Black or African-American 42 46.7% 64% 31% 5% 0%
American Indian or Alaska Native 2 2.2% v v v v
Asian 1 1.1% v v v v
Filipino 1 1.1% v v v v
Hispanic or Latino 42 46.7% 62% 24% 12% 2%
Native Hawaiian or Pacific Islander 0 0.0% v v v v
White 1 1.1% v v v v
Two or more races 0 0.0% v v v v
Socioeconomically disadvantaged 74 82.2% 59% 31% 8% 1%
English learners 21 23.3% 90% 10% 0% 0%
Students with disabilities 7 7.8% v v v v
Students receiving Migrant Education services 0 0.0% v v v v
Foster youth ± ± ± ± ± ±
± Information is not available at this time.

10Kelso Elementary SchoolSARC
CAASPP Results by Student Group: English Language Arts and Mathematics - Grade 6
Level 1 = Standard not met Level 2 = Standard nearly met Level 3 = Standard met Level 4 = Standard exceeded
v Scores are not shown when the number of students tested is 10 or fewer, either because the number of students tested in this category is too small for statistical accuracy or to protect student privacy.
2014-15 School YearStudents Achieving at Each Performance LevelEnglish Language Arts: Grade 6 Total
EnrollmentNumber Tested
Percentage Tested of Total
Enrollment
Percent Achievement
Group Level 1 Level 2 Level 3 Level 4
All students 91 87 95.6% 46% 37% 17% 0%
Male 44 48.4% 50% 36% 14% 0%
Female 43 47.3% 42% 37% 21% 0%
Black or African-American 40 44.0% 50% 33% 18% 0%
American Indian or Alaska Native 0 0.0% v v v v
Asian 2 2.2% v v v v
Filipino 0 0.0% v v v v
Hispanic or Latino 45 49.5% 44% 38% 18% 0%
Native Hawaiian or Pacific Islander 0 0.0% v v v v
White 0 0.0% v v v v
Two or more races 0 0.0% v v v v
Socioeconomically disadvantaged 73 80.2% 44% 40% 16% 0%
English learners 11 12.1% 64% 36% 0% 0%
Students with disabilities 16 17.6% 81% 19% 0% 0%
Students receiving Migrant Education services 0 0.0% v v v v
Foster youth ± ± ± ± ± ±
Mathematics: Grade 6 Total Enrollment
Number Tested
Percentage Tested of Total
Enrollment
Percent Achievement
Group Level 1 Level 2 Level 3 Level 4
All students 91 87 95.6% 59% 32% 8% 1%
Male 44 48.4% 59% 30% 9% 2%
Female 43 47.3% 58% 35% 7% 0%
Black or African-American 40 44.0% 60% 33% 5% 3%
American Indian or Alaska Native 0 0.0% v v v v
Asian 2 2.2% v v v v
Filipino 0 0.0% v v v v
Hispanic or Latino 45 49.5% 60% 31% 9% 0%
Native Hawaiian or Pacific Islander 0 0.0% v v v v
White 0 0.0% v v v v
Two or more races 0 0.0% v v v v
Socioeconomically disadvantaged 73 80.2% 60% 30% 8% 1%
English learners 11 12.1% 91% 9% 0% 0%
Students with disabilities 16 17.6% 81% 19% 0% 0%
Students receiving Migrant Education services 0 0.0% v v v v
Foster youth ± ± ± ± ± ±
± Information is not available at this time.
11Kelso Elementary SchoolSARC
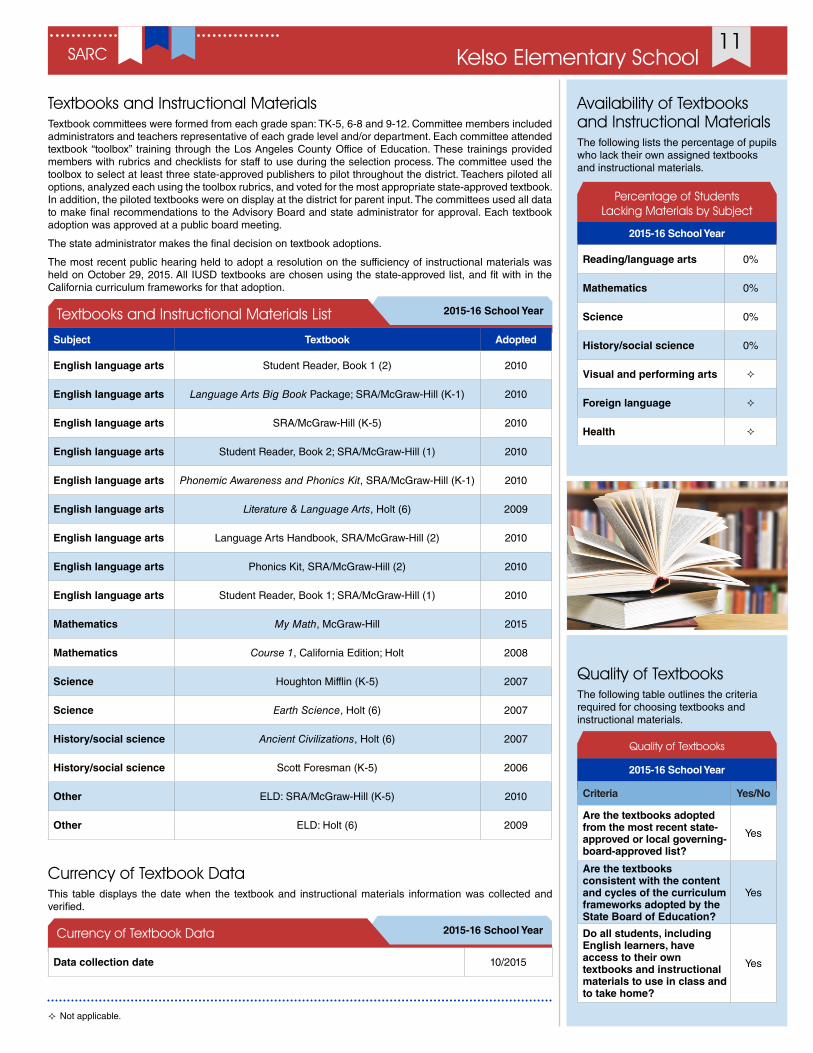
Textbooks and Instructional MaterialsTextbook committees were formed from each grade span: TK-5, 6-8 and 9-12. Committee members included administrators and teachers representative of each grade level and/or department. Each committee attended textbook “toolbox” training through the Los Angeles County Office of Education. These trainings provided members with rubrics and checklists for staff to use during the selection process. The committee used the toolbox to select at least three state-approved publishers to pilot throughout the district. Teachers piloted all options, analyzed each using the toolbox rubrics, and voted for the most appropriate state-approved textbook. In addition, the piloted textbooks were on display at the district for parent input. The committees used all data to make final recommendations to the Advisory Board and state administrator for approval. Each textbook adoption was approved at a public board meeting.
The state administrator makes the final decision on textbook adoptions.
The most recent public hearing held to adopt a resolution on the sufficiency of instructional materials was held on October 29, 2015. All IUSD textbooks are chosen using the state-approved list, and fit with in the California curriculum frameworks for that adoption.
2015-16 School YearTextbooks and Instructional Materials List
Subject Textbook Adopted
English language arts Student Reader, Book 1 (2) 2010
English language arts Language Arts Big Book Package; SRA/McGraw-Hill (K-1) 2010
English language arts SRA/McGraw-Hill (K-5) 2010
English language arts Student Reader, Book 2; SRA/McGraw-Hill (1) 2010
English language arts Phonemic Awareness and Phonics Kit, SRA/McGraw-Hill (K-1) 2010
English language arts Literature & Language Arts, Holt (6) 2009
English language arts Language Arts Handbook, SRA/McGraw-Hill (2) 2010
English language arts Phonics Kit, SRA/McGraw-Hill (2) 2010
English language arts Student Reader, Book 1; SRA/McGraw-Hill (1) 2010
Mathematics My Math, McGraw-Hill 2015
Mathematics Course 1, California Edition; Holt 2008
Science Houghton Mifflin (K-5) 2007
Science Earth Science, Holt (6) 2007
History/social science Ancient Civilizations, Holt (6) 2007
History/social science Scott Foresman (K-5) 2006
Other ELD: SRA/McGraw-Hill (K-5) 2010
Other ELD: Holt (6) 2009
Availability of Textbooks and Instructional MaterialsThe following lists the percentage of pupils who lack their own assigned textbooks and instructional materials.
Percentage of Students Lacking Materials by Subject
2015-16 School Year
Reading/language arts 0%
Mathematics 0%
Science 0%
History/social science 0%
Visual and performing arts ²
Foreign language ²
Health ²
Quality of TextbooksThe following table outlines the criteria required for choosing textbooks and instructional materials.
Quality of Textbooks
2015-16 School Year
Criteria Yes/No
Are the textbooks adopted from the most recent state-approved or local governing-board-approved list?
Yes
Are the textbooks consistent with the content and cycles of the curriculum frameworks adopted by the State Board of Education?
Yes
Do all students, including English learners, have access to their own textbooks and instructional materials to use in class and to take home?
Yes
Currency of Textbook DataThis table displays the date when the textbook and instructional materials information was collected and verified.
2015-16 School YearCurrency of Textbook Data
Data collection date 10/2015
² Not applicable.

12Kelso Elementary SchoolSARC
• Systems: Gas systems and pipes, sewer, mechanical systems (heating, ventilation and air-conditioning)
• Interior: Interior surfaces (floors, ceilings, walls and window casings)
• Cleanliness: Pest/vermin control, overall cleanliness (school grounds, buildings, rooms and common areas)
• Electrical: Electrical systems (interior and exterior)
• Restrooms/fountains: Restrooms, sinks and drinking fountains (interior and exterior)
• Safety: Fire-safety equipment, emergency systems, hazardous materials (interior and exterior)
• Structural: Structural condition, roofs
• External: Windows/doors/gates/fences, playgrounds/school grounds
School Facility Items Inspected The tables show the results of the school’s most recent inspection using the Facility Inspection Tool (FIT) or equivalent school form. The following is a list of items inspected.
School FacilitiesKelso Elementary School is located in Inglewood, California, across the street from the MSG Forum and Hollywood Park Casino. The main building was built in 1925 and consists of the administra-tive offices, a library and 10 classrooms. Sixteen portables on the campus serve as classrooms and resource rooms.
Kelso’s playground is in the center of the campus and includes a play structure, swing set and slide. A teaching garden is located in the northeastern corner of the campus and includes ten planter boxes.
Kelso has one day and one night custodi-an to keep the campus clean and in good repair. Work orders are submitted to the Maintenance Department when repairs beyond the scope of general custodial duties arise.
Students are supervised in the morning by staff posted at the entrance gate, in the cafeteria and on the playground. During recess and lunchtime, three noon-duty aides and two or more staff from the CF Fitness program organize and supervise structured play activities for students.
In 2015, IUSD refurbished the stage in Kelso’s multipurpose room. This project involved removal of the accordion doors, stripping, sanding and staining of the stage’s original wood floors.
Deficiencies and RepairsThe table lists the repairs required for all deficiencies found during the site inspection. Regardless of each item’s repair status, all deficiencies are listed.
For all items inspected that were found to not be in “good repair,” a work-order has been created and main-tenance will be done before the end of the 2015-16 school year. Maintenance items will be prioritized so that student safety is not compromised.
2015-16 School YearDeficiencies and Repairs
Items Inspected Deficiencies, Action Taken or Planned, and Date of Action
Systems HVAC, Gas, plumbing, boilers, heaters, irrigation
Interior Paint, ceilings, windows, flooring, Security
CleanlinessAddress organizational structure deficiencies, provide tools and training to staff, adopt Custodial Cost Analysist Program (CCAP-Hillyard)
Electrical Lighting, power, P/A systems, clock/bell systems
Restrooms/fountains Clean, renovate, update, replace
SafetyPhysical Security & Crime Prevention Program, Fire Life Safety integration and consolidation, Hazardous Materials, Emergency/Contingency Planning
Structural Roofs, windows, doors
External Paint, landscaping, paving, gates/fencing, Security, athletic fields
School Facility Good Repair Status This inspection determines the school facility’s good repair status using ratings of good condition, fair condition or poor condition. The overall summary of facility conditions uses ratings of exemplary, good, fair or poor.
2015-16 School YearSchool Facility Good Repair Status
Items Inspected Repair Status Items Inspected Repair Status
Systems Poor Restrooms/fountains Poor
Interior Fair Safety Fair
Cleanliness Poor Structural Poor
Electrical Fair External Poor
Overall summary of facility conditions Poor
Date of the most recent school site inspection 7/12/2015
Date of the most recent completion of the inspection form 7/12/2015
“Kelso PRIDE (Positive attitude, respect, integrity, diligence, excellence).”
13Kelso Elementary SchoolSARC
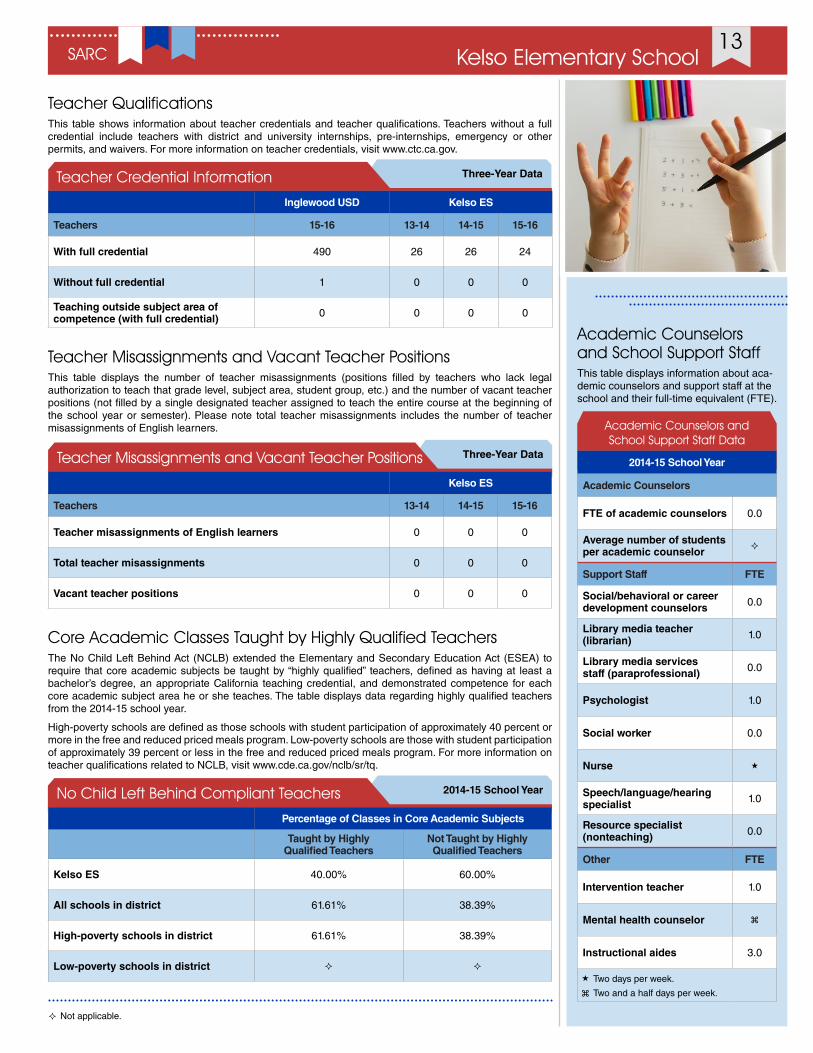
Academic Counselors and School Support StaffThis table displays information about aca-demic counselors and support staff at the school and their full-time equivalent (FTE).
Academic Counselors and School Support Staff Data
2014-15 School Year
Academic Counselors
FTE of academic counselors 0.0
Average number of students per academic counselor ²
Support Staff FTE
Social/behavioral or career development counselors 0.0
Library media teacher (librarian) 1.0
Library media services staff (paraprofessional) 0.0
Psychologist 1.0
Social worker 0.0
Nurse «
Speech/language/hearing specialist 1.0
Resource specialist (nonteaching) 0.0
Other FTE
Intervention teacher 1.0
Mental health counselor
Instructional aides 3.0
Teacher QualificationsThis table shows information about teacher credentials and teacher qualifications. Teachers without a full credential include teachers with district and university internships, pre-internships, emergency or other permits, and waivers. For more information on teacher credentials, visit www.ctc.ca.gov.
Three-Year DataTeacher Credential Information
Inglewood USD Kelso ES
Teachers 15-16 13-14 14-15 15-16
With full credential 490 26 26 24
Without full credential 1 0 0 0
Teaching outside subject area of competence (with full credential) 0 0 0 0
Teacher Misassignments and Vacant Teacher PositionsThis table displays the number of teacher misassignments (positions filled by teachers who lack legal authorization to teach that grade level, subject area, student group, etc.) and the number of vacant teacher positions (not filled by a single designated teacher assigned to teach the entire course at the beginning of the school year or semester). Please note total teacher misassignments includes the number of teacher misassignments of English learners.
Three-Year DataTeacher Misassignments and Vacant Teacher Positions
Kelso ES
Teachers 13-14 14-15 15-16
Teacher misassignments of English learners 0 0 0
Total teacher misassignments 0 0 0
Vacant teacher positions 0 0 0
Core Academic Classes Taught by Highly Qualified TeachersThe No Child Left Behind Act (NCLB) extended the Elementary and Secondary Education Act (ESEA) to require that core academic subjects be taught by “highly qualified” teachers, defined as having at least a bachelor’s degree, an appropriate California teaching credential, and demonstrated competence for each core academic subject area he or she teaches. The table displays data regarding highly qualified teachers from the 2014-15 school year.
High-poverty schools are defined as those schools with student participation of approximately 40 percent or more in the free and reduced priced meals program. Low-poverty schools are those with student participation of approximately 39 percent or less in the free and reduced priced meals program. For more information on teacher qualifications related to NCLB, visit www.cde.ca.gov/nclb/sr/tq.
2014-15 School YearNo Child Left Behind Compliant Teachers
Percentage of Classes in Core Academic Subjects
Taught by Highly Qualified Teachers
Not Taught by Highly Qualified Teachers
Kelso ES 40.00% 60.00%
All schools in district 61.61% 38.39%
High-poverty schools in district 61.61% 38.39%
Low-poverty schools in district ² ²
² Not applicable.
« Two days per week.
Two and a half days per week.
2013-14 School Accountability Report Card
14Kelso Elementary School
Data for this year’s SARC was provided by the California Department of Education (CDE), school and district offices. For additional information on California schools and districts and comparisons of the school to the district, the county and the state, please visit DataQuest at http://data1.cde.ca.gov/dataquest. DataQuest is an online resource that provides reports for accountability, test data, enrollment, graduates, dropouts, course enrollments, staffing and data regarding English learners. Per Education Code Section 35256, each school district shall make hard copies of its annually updated report card available, upon request, on or before February 1 of each year.
All data accurate as of December 2015.
School Accountability Report Card
Published by:
www.sia-us.com | 800.487.9234
SARC
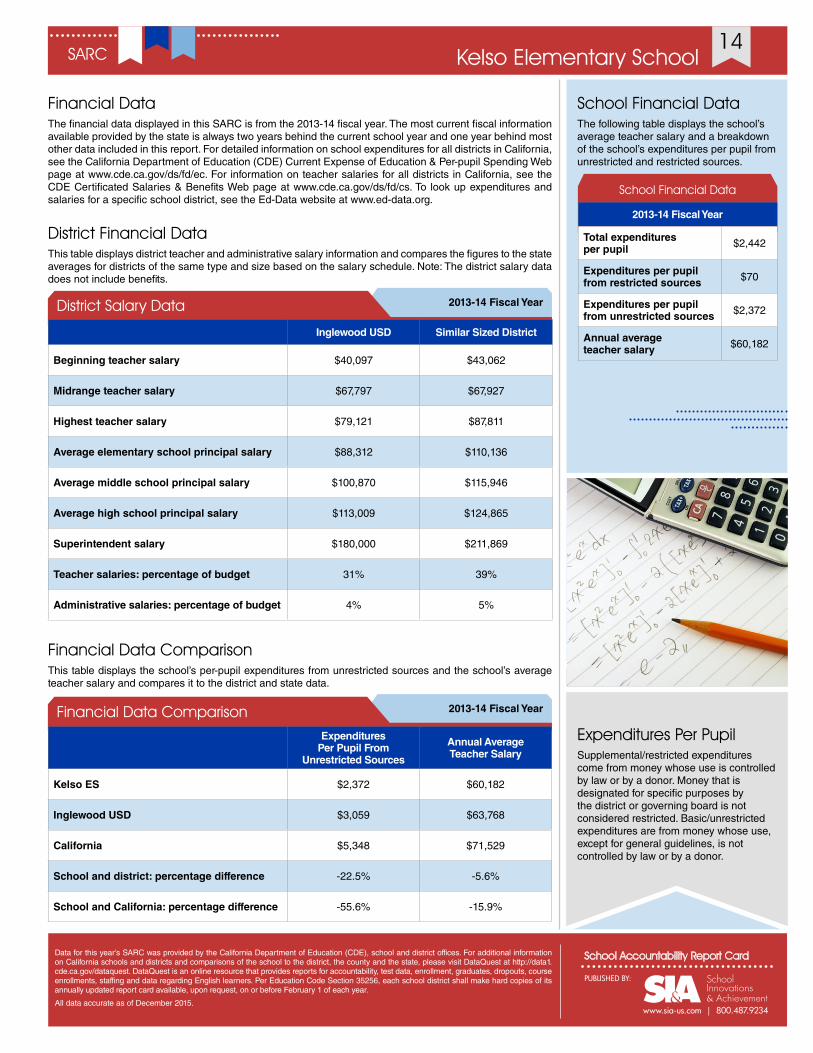
School Financial Data
2013-14 Fiscal Year
Total expenditures per pupil $2,442
Expenditures per pupil from restricted sources $70
Expenditures per pupil from unrestricted sources $2,372
Annual average teacher salary $60,182
School Financial DataThe following table displays the school’s average teacher salary and a breakdown of the school’s expenditures per pupil from unrestricted and restricted sources.
Expenditures Per PupilSupplemental/restricted expenditures come from money whose use is controlled by law or by a donor. Money that is designated for specific purposes by the district or governing board is not considered restricted. Basic/unrestricted expenditures are from money whose use, except for general guidelines, is not controlled by law or by a donor.
Financial Data The financial data displayed in this SARC is from the 2013-14 fiscal year. The most current fiscal information available provided by the state is always two years behind the current school year and one year behind most other data included in this report. For detailed information on school expenditures for all districts in California, see the California Department of Education (CDE) Current Expense of Education & Per-pupil Spending Web page at www.cde.ca.gov/ds/fd/ec. For information on teacher salaries for all districts in California, see the CDE Certificated Salaries & Benefits Web page at www.cde.ca.gov/ds/fd/cs. To look up expenditures and salaries for a specific school district, see the Ed-Data website at www.ed-data.org.
District Financial DataThis table displays district teacher and administrative salary information and compares the figures to the state averages for districts of the same type and size based on the salary schedule. Note: The district salary data does not include benefits.
2013-14 Fiscal YearDistrict Salary Data
Inglewood USD Similar Sized District
Beginning teacher salary $40,097 $43,062
Midrange teacher salary $67,797 $67,927
Highest teacher salary $79,121 $87,811
Average elementary school principal salary $88,312 $110,136
Average middle school principal salary $100,870 $115,946
Average high school principal salary $113,009 $124,865
Superintendent salary $180,000 $211,869
Teacher salaries: percentage of budget 31% 39%
Administrative salaries: percentage of budget 4% 5%
Financial Data ComparisonThis table displays the school’s per-pupil expenditures from unrestricted sources and the school’s average teacher salary and compares it to the district and state data.
2013-14 Fiscal YearFinancial Data ComparisonExpenditures
Per Pupil From Unrestricted Sources
Annual Average Teacher Salary
Kelso ES $2,372 $60,182
Inglewood USD $3,059 $63,768
California $5,348 $71,529
School and district: percentage difference -22.5% -5.6%
School and California: percentage difference -55.6% -15.9%
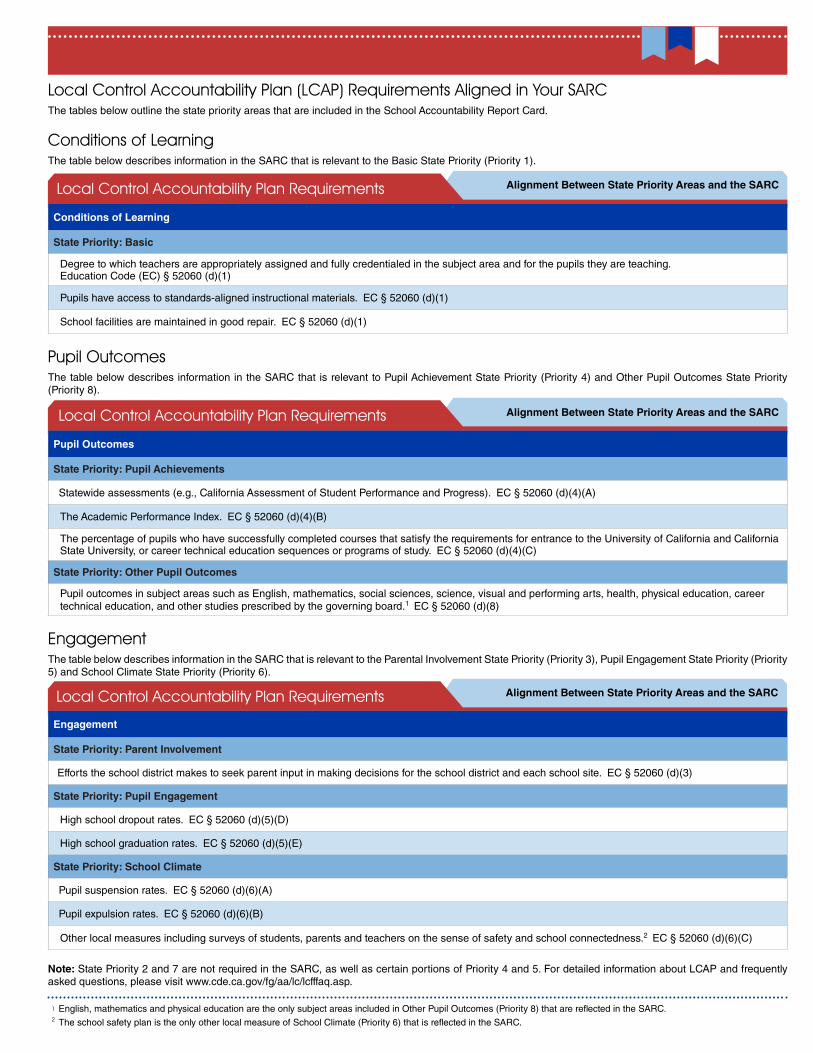
Local Control Accountability Plan (LCAP) Requirements Aligned in Your SARCThe tables below outline the state priority areas that are included in the School Accountability Report Card.
Note: State Priority 2 and 7 are not required in the SARC, as well as certain portions of Priority 4 and 5. For detailed information about LCAP and frequently asked questions, please visit www.cde.ca.gov/fg/aa/lc/lcfffaq.asp.
Conditions of LearningThe table below describes information in the SARC that is relevant to the Basic State Priority (Priority 1).
Alignment Between State Priority Areas and the SARCLocal Control Accountability Plan Requirements
Conditions of Learning
State Priority: Basic
Degree to which teachers are appropriately assigned and fully credentialed in the subject area and for the pupils they are teaching. Education Code (EC) § 52060 (d)(1)
Pupils have access to standards-aligned instructional materials. EC § 52060 (d)(1)
School facilities are maintained in good repair. EC § 52060 (d)(1)
Pupil OutcomesThe table below describes information in the SARC that is relevant to Pupil Achievement State Priority (Priority 4) and Other Pupil Outcomes State Priority (Priority 8).
Local Control Accountability Plan Requirements
Pupil Outcomes
State Priority: Pupil Achievements
Statewide assessments (e.g., California Assessment of Student Performance and Progress). EC § 52060 (d)(4)(A)
The Academic Performance Index. EC § 52060 (d)(4)(B)
The percentage of pupils who have successfully completed courses that satisfy the requirements for entrance to the University of California and California State University, or career technical education sequences or programs of study. EC § 52060 (d)(4)(C)
State Priority: Other Pupil Outcomes
Pupil outcomes in subject areas such as English, mathematics, social sciences, science, visual and performing arts, health, physical education, career technical education, and other studies prescribed by the governing board.1 EC § 52060 (d)(8)
English, mathematics and physical education are the only subject areas included in Other Pupil Outcomes (Priority 8) that are reflected in the SARC. 1
The school safety plan is the only other local measure of School Climate (Priority 6) that is reflected in the SARC.2
EngagementThe table below describes information in the SARC that is relevant to the Parental Involvement State Priority (Priority 3), Pupil Engagement State Priority (Priority 5) and School Climate State Priority (Priority 6).
Alignment Between State Priority Areas and the SARCLocal Control Accountability Plan Requirements
Engagement
State Priority: Parent Involvement
Efforts the school district makes to seek parent input in making decisions for the school district and each school site. EC § 52060 (d)(3)
State Priority: Pupil Engagement
High school dropout rates. EC § 52060 (d)(5)(D)
High school graduation rates. EC § 52060 (d)(5)(E)
State Priority: School Climate
Pupil suspension rates. EC § 52060 (d)(6)(A)
Pupil expulsion rates. EC § 52060 (d)(6)(B)
Other local measures including surveys of students, parents and teachers on the sense of safety and school connectedness.2 EC § 52060 (d)(6)(C)
Alignment Between State Priority Areas and the SARC